
Bioavailability of D-methionine relative to L-methionine for nursery pigs using the slope-ratio assay
- Published
- Accepted
- Received
- Academic Editor
- Matthew Barnett
- Subject Areas
- Agricultural Science, Animal Behavior, Veterinary Medicine, Zoology, Nutrition
- Keywords
- Pigs, Methionine isomers, Relative bioavailability, Slope-ratio assay, Nitrogen balance
- Copyright
- © 2016 Kong et al.
- Licence
- This is an open access article distributed under the terms of the Creative Commons Attribution License, which permits unrestricted use, distribution, reproduction and adaptation in any medium and for any purpose provided that it is properly attributed. For attribution, the original author(s), title, publication source (PeerJ) and either DOI or URL of the article must be cited.
- Cite this article
- 2016. Bioavailability of D-methionine relative to L-methionine for nursery pigs using the slope-ratio assay. PeerJ 4:e2368 https://doi.org/10.7717/peerj.2368
Abstract
This experiment was conducted to determine the bioavailability of D-methionine (Met) relative to L-Met for nursery pigs using the slope-ratio assay. A total of 50 crossbred barrows with an initial BW of 13.5 kg (SD = 1.0) were used in an N balance study. A Met-deficient basal diet (BD) was formulated to contain an adequate amount of all amino acids (AA) for 10–20 kg pigs except for Met. The two reference diets were prepared by supplementing the BD with 0.4 or 0.8 g L-Met/kg at the expense of corn starch, and an equivalent concentration of D-Met was added to the BD for the two test diets. The pigs were adapted to the experimental diets for 5 d and then total but separated collection of feces and urine was conducted for 4 d according to the marker-to-marker procedure. Nitrogen intakes were similar across the treatments. Fecal N output was not affected by Met supplementation regardless of source and consequently apparent N digestibility did not change. Conversely, there was a negative linear response (P < 0.01) to Met supplementation with both Met isomers in urinary N output, which resulted in increased retained N (g/4 d) and N retention (% of intake). No quadratic response was observed in any of the N balance criteria. The estimated bioavailability of D-Met relative to L-Met from urinary N output (g/4 d) and N retention (% of intake) as dependent variables using supplemental Met intake (g/4 d) as an independent variable were 87.6% and 89.6%, respectively; however, approximately 95% of the fiducial limits for the relative bioavailability estimates included 100%. In conclusion, with an absence of statistical significance, the present study indicated that the mean relative bioequivalence of D- to L-Met was 87.6% based on urinary N output or 89.6% based on N retention.
Introduction
Crystalline amino acids (AA) are commonly used to provide indispensable AA (also known as essential AA), which limit growth of pigs when protein sources are marginally used to reduce feed cost as well as N excretion. Methionine is essential for protein synthesis and is one of the most limiting AA for the growth of nursery pigs fed diets containing dried blood products (plasma and cells) and dried whey (Cromwell, 2004). Methionine is often supplemented as a racemic mixture of D- and L-Met which is produced through chemical synthesis (Hoehler, Rademacher & Mosenthin, 2005), but only L-Met can be directly used for protein synthesis. Therefore, the conversion of D- to L-Met is indispensible for the utilization of D-Met for protein synthesis in pigs (Dibner & Knight, 1984). Thus, it has been questioned whether the bioefficacy of D- and L-Met for pigs is equal or not. Little research has been conducted to compare the bioefficacy of both Met isomers for pigs and the results have been inconsistent when the growth performances were employed as major measurements (Reifsnyder, Young & Jones, 1984; Chung & Baker, 1992; Shen, Weaver & Kim, 2014). The classical N balance technique measures a N retention rate as an index of protein metabolism (Haymond, 1999) and is more sensitive and more powerful than growth assays. Recently, the bioefficacy of DL-Met relative to L-Met based on N balance was reported (Kong et al., 2016) to the authors’ knowledge, there have been no published reports on the bioavailability of D-Met for pigs using N balance technique. Therefore, it was hypothesized that supplementation of L-Met would have better effects on N balance of pigs compared with D-Met and the present study was conducted to determine the relative bioavailability of D- to L-Met in nursery pigs using the slope-ratio assay.
Materials and Methods
The Institutional Animal Care and Use Committee of Konkuk University reviewed and approved all protocols (KU13188) used in the present study.
Animals and experimental design
A total of 50 crossbred ((Landrace × Yorkshire × Duroc) × Duroc) nursery barrows at 35 ± 3 d of age were selected based on BW which was similar across the pigs. For adaptation to metabolism cages, the pigs were individually placed in the cages for five days. After adaptation, the pigs (13.5 ± 1.0 kg) were used to estimate the relative bioavailability of D- to L-Met during five consecutive periods. In each 9-d period, 10 pigs were allotted to five dietary treatments with two replicates per treatment in a randomized complete block design based on the initial BW.
Diets
A Met-deficient basal diet (BD) was formulated to meet or exceed the estimated requirements of all nutrients except for Met. The BD contained total Met at 18.1 g/kg which was about 66% of the Met requirement for 10–20 kg pigs (NRC, 1998; Table 1). Two reference diets were prepared by supplementing the BD with 0.4 or 0.8 g L-Met/kg at the expense of corn starch, and an equivalent concentration of D-Met was added to the BD for two test diets. To avoid any possible variation in the experimental diets caused by feed ingredients, the experimental diets were made of the same batch of ingredients, mixed at the same time and at the same location. To minimize orts, daily feed allowance was calculated as 3.5% of the BW of each animal at the beginning of each period. The feed was divided into two equal meals and fed to the pigs at 900 and 1,700 h. The pigs were provided ad libitum access to water.
| Item† | Basal diet | Supplemental L-Met, % | Supplemental D-Met, % | ||
|---|---|---|---|---|---|
| 0.04 | 0.08 | 0.04 | 0.08 | ||
| Ingredient composition, % | |||||
| Ground corn | 55.00 | 55.00 | 55.00 | 55.00 | 55.00 |
| Dried whey | 10.00 | 10.00 | 10.00 | 10.00 | 10.00 |
| Spray dried animal plasma | 10.00 | 10.00 | 10.00 | 10.00 | 10.00 |
| Corn starch | 19.92 | 19.88 | 19.84 | 19.88 | 19.84 |
| Soybean oil | 2.00 | 2.00 | 2.00 | 2.00 | 2.00 |
| L-Met | – | 0.04 | 0.08 | – | – |
| D-Met | – | – | – | 0.04 | 0.08 |
| L-Lys·HCl | 0.32 | 0.32 | 0.32 | 0.32 | 0.32 |
| L-Thr | 0.04 | 0.04 | 0.04 | 0.04 | 0.04 |
| L-Trp | 0.03 | 0.03 | 0.03 | 0.03 | 0.03 |
| L-Ile | 0.14 | 0.14 | 0.14 | 0.14 | 0.14 |
| Dicalcium phosphate | 0.67 | 0.67 | 0.67 | 0.67 | 0.67 |
| Ground limestone | 1.18 | 1.18 | 1.18 | 1.18 | 1.18 |
| Salt | 0.20 | 0.20 | 0.20 | 0.20 | 0.20 |
| Vitamin-mineral premix‡ | 0.50 | 0.50 | 0.50 | 0.50 | 0.50 |
| Calculated composition | |||||
| Metabolizable energy, kcal/kg | 3,552 | 3,551 | 3,549 | 3,551 | 3,549 |
| CP, % | 14.08 | 14.10 | 14.13 | 14.10 | 14.13 |
| Ether extract, % | 4.48 | 4.48 | 4.48 | 4.48 | 4.48 |
| Met, % | 0.18 | 0.22 | 0.26 | 0.22 | 0.26 |
| Cys, % | 0.41 | 0.41 | 0.41 | 0.41 | 0.41 |
| Choline, % | 0.32 | 0.32 | 0.32 | 0.32 | 0.32 |
| Ca, % | 0.72 | 0.72 | 0.72 | 0.72 | 0.72 |
| Available P, % | 0.34 | 0.34 | 0.34 | 0.34 | 0.34 |
Notes:
Sample collection
For the N-balance study, the pigs were adapted to the experimental diets for 5 d and then total but separated collection of feces and urine was conducted for 4 d according to the marker-to-marker procedure (Kong & Adeola, 2014). The collected feces and urine were immediately stored in a freezer at −20 °C prior to further analyses.
Chemical analysis
At the completion of the study, the frozen fecal samples were dried in a forced-air oven at 55 °C and finely ground prior to chemical analyses. The experimental diets, fecal and urine samples were determined for crude protein (CP) content (N × 6.25) by the Kjeldahl method (Kjeltec 1035; Foss, Hillerod, Denmark).
Calculations and statistical analysis
Apparent total tract N digestibility and retention were calculated using the following equations: where: NI is the amount of N ingested (g); NF and NU are the amount of N voided via the feces (g) and urine (g), respectively.
Experimental data were analyzed using the MIXED procedures of SAS (SAS Institute Inc., Cary, NC, USA). The independent variables in the model included diet as a fixed effect and period and block nested within period as random effects. The orthogonal polynomial contrast was used to examine the relationship between N balance response criteria and graded concentrations of Met isomers. The relative bioavailability of D-Met to L-Met was estimated using a multiple regression model and the slope-ratio analysis described by Littell et al. (1997). The statistical model used in the analysis as follows: in which y is response criterion; a is intercept; e is random error; bs and bt are the slopes for L- and D-Met, respectively; xs and xt are the concentrations of L- and D-Met intake, respectively. An individual pig served as the experimental unit and statistical significance was determined at P < 0.05.
Results
The effects of supplemental L- or D-Met on N balance are shown in Table 2. Nitrogen intakes were similar across the treatments due to the restricted feeding based on the initial BW of pigs. Fecal N output was not affected by Met supplementation regardless of source and consequently apparent N digestibility did not change. In contrast, there was a linear response (P < 0.05) to Met supplementation from L- or D-Met in urinary N output, which resulted in increased (P < 0.01) retained N and N retention. No quadratic response was observed in any of the N-balance criteria. The estimated bioavailability of D-Met relative to L-Met from urinary N output (g/4 d) and N retention (% of intake) as dependent variables using supplemental Met intake (g/4 d) as an independent variable were 87.6 and 89.6%, respectively (Figs. 1 and 2), but approximate 95% fiducial limits for the relative bioavailability estimates for both dependent variables included 100%.
| Item | Basal diet | Supplemental L-Met, % | Supplemental D-Met, % | SEM | P-values for contrast | |||||
|---|---|---|---|---|---|---|---|---|---|---|
| Linear | Quadratic | |||||||||
| 0.04 | 0.08 | 0.04 | 0.08 | L-Met | D-Met | L-Met | D-Met | |||
| BW, kg | ||||||||||
| Initial | 13.9 | 14.0 | 14.4 | 14.0 | 14.3 | 0.3 | 0.116 | 0.243 | 0.443 | 0.733 |
| Final | 15.1 | 15.1 | 15.6 | 15.4 | 15.3 | 0.4 | 0.142 | 0.537 | 0.277 | 0.548 |
| Collection period (4 d) | ||||||||||
| Feed intake, g | 1,973 | 1,973 | 1,973 | 1,955 | 1,973 | 40 | 0.974 | 0.974 | 0.985 | 0.081 |
| N intake, g | 44.5 | 44.5 | 44.6 | 44.1 | 44.6 | 0.9 | 0.607 | 0.607 | 0.983 | 0.080 |
| Fecal N output, g | 8.33 | 7.85 | 8.07 | 8.24 | 7.70 | 0.43 | 0.630 | 0.243 | 0.450 | 0.612 |
| N digestibility, % | 81.3 | 82.4 | 82.0 | 81.4 | 82.7 | 0.8 | 0.537 | 0.234 | 0.480 | 0.555 |
| Urinary N output, g | 14.6 | 14.3 | 11.1 | 13.5 | 12.1 | 0.6 | < 0.001 | 0.014 | 0.086 | 0.862 |
| Retained N, g | 21.4 | 22.4 | 25.4 | 22.4 | 24.8 | 0.7 | < 0.001 | < 0.001 | 0.170 | 0.337 |
| N retention, % of intake | 48.5 | 50.4 | 57.0 | 50.8 | 55.4 | 1.2 | < 0.001 | < 0.001 | 0.132 | 0.465 |
Note:

Figure 1: Slope-ratio comparison based on the urinary nitrogen output (g/4 d) of nursery pigs fed diets with graded levels of D-methionine (D-Met) or L-Met.
Each data point represents least squares mean of 10 observations except the basal diet (nine observations).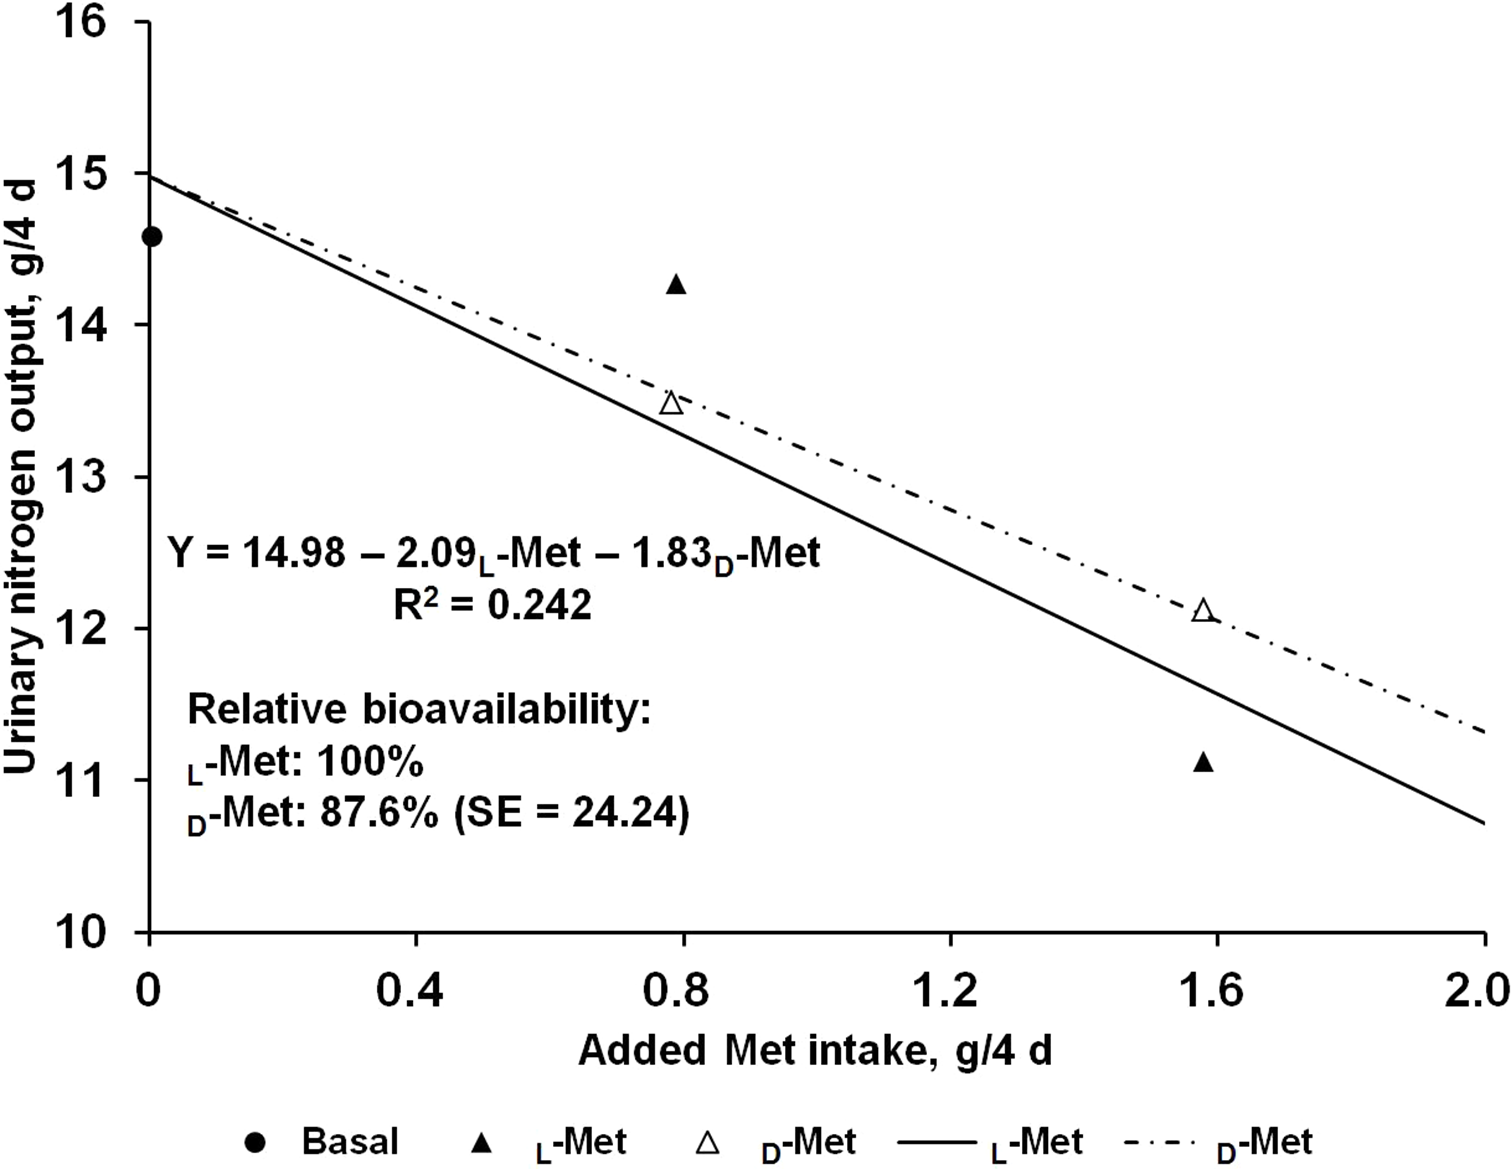

Figure 2: Slope-ratio comparison based on the nitrogen retention (%) of nursery pigs fed diets with graded levels of D-methionine (D-Met) or L-Met.
Each data point represents least squares mean of 10 observations except the basal diet (nine observations).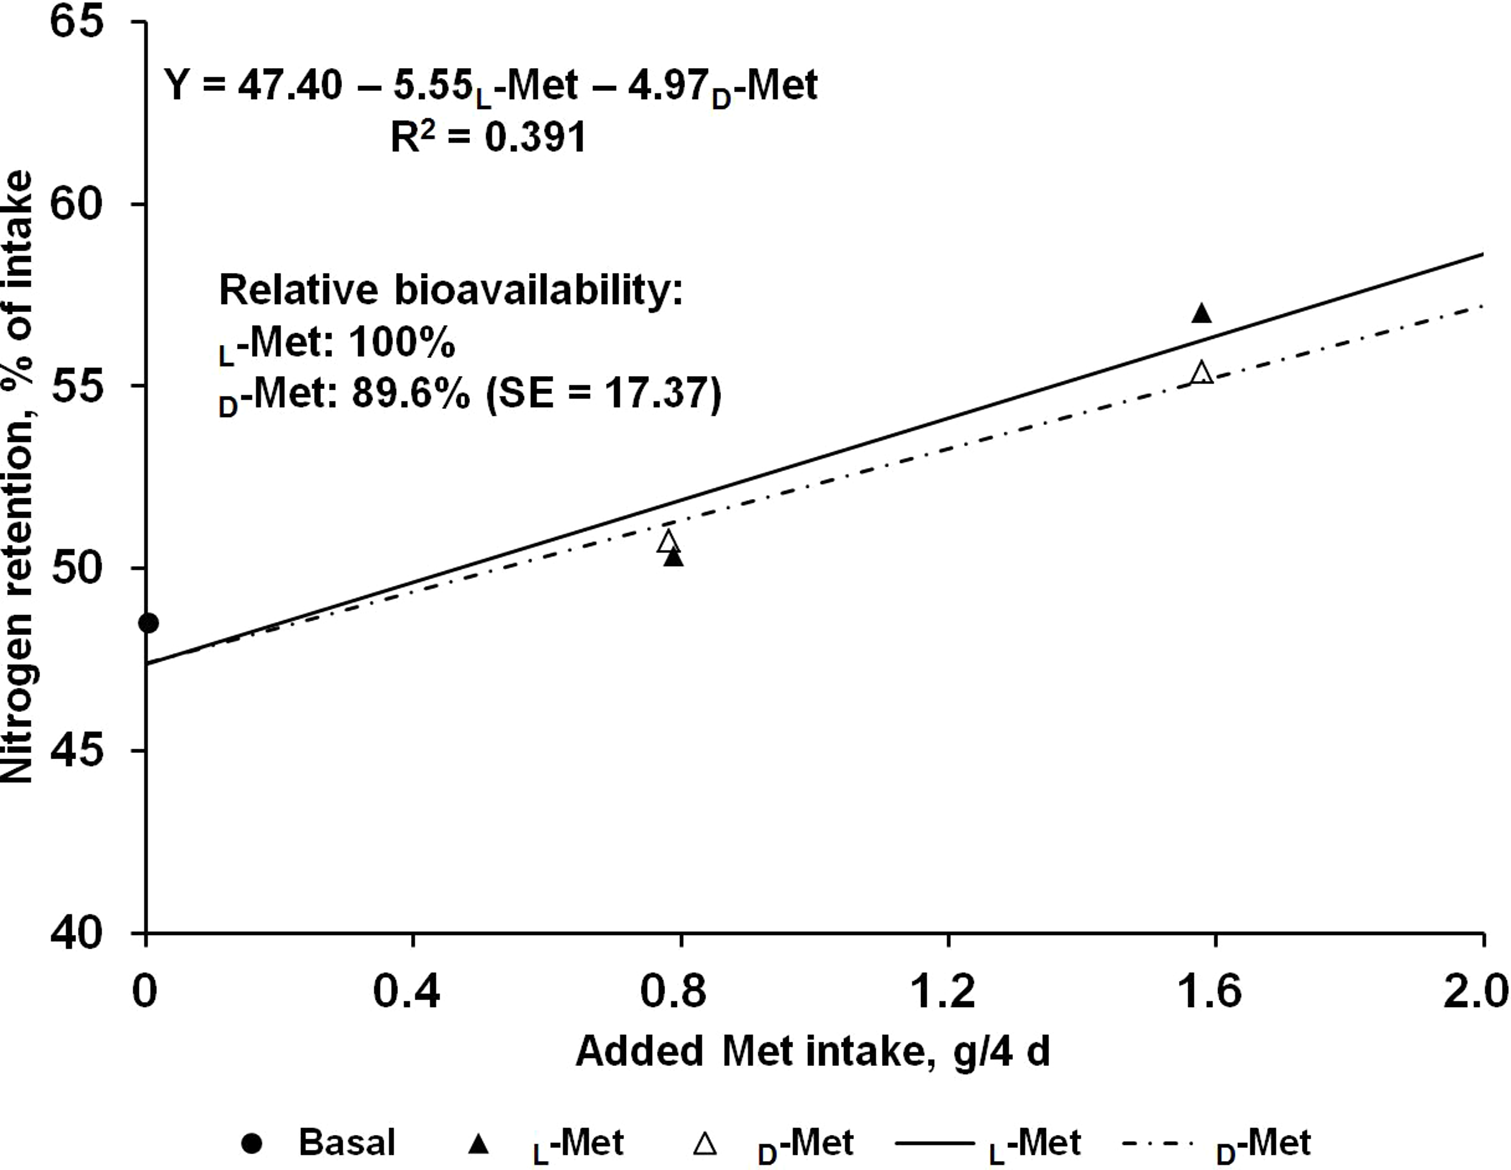
Discussion
Nutrient bioavailability assay provides relative information on the capacity of feed ingredients to supply a nutrient capable of being digested, absorbed and available for use or storage (Gabert, Jorgensen & Nyachoti, 2001; Adeola, 2009). Growth performance has generally been used as response criteria for AA bioavailability assay (Chung & Baker, 1992; Adeola, 2009; Shen, Weaver & Kim, 2014). However, in the present study, growth responses to the supplemental Met were not significant among dietary treatments while N balance responses were affected by the supplemental Met. This may be attributed to the relatively greater sensitivity of N balance responses to AA adequacy compared to growth responses in a short-term experiment (Figueroa et al., 2001).
The results from the present study suggest that the relative bioavailability of D- to L-Met, using urinary N output (g/4 d) and N retention (% intake) as dependent variables, are 87.6% and 89.6%, respectively, and the 95% fiducial limits included 100%. To obtain accurate values from bioavailability assays, the assumptions for slope-ratio assay should be validated (Littell et al., 1997). This tested for linearity of the slopes and lack of curvature, and for intersection of responses to reference and test diets at the response to BD. For urinary N output (g/4 d) and N retention (% intake) in the present study, validity tests were performed and all assumptions were valid.
Due to the lack of D-transaminase, pigs are not able to directly utilize D-Met for protein synthesis and S-adenosylmethionine formation. To become bioavailable, D-Met has to be converted to α-keto-γ-methiolbutyrate in a process catalyzed by D-Met oxidase, with subsequent transamination to L-Met (Lewis, 2003). However, the efficiency of these additional enzymatic processes has not been so clear and little information is available on the relative bioefficacy of D- to L-Met. Using phenylalanine as an indicator AA, the relative bioefficacy of D- to L-Met was only 50% when 10 to 14-day-old pigs were used in an indicator AA oxidation study (Kim & Bayley, 1983). Recently, Shen, Weaver & Kim (2014) conducted a relative bioavailability study for a period of 20 d using growth performance as response criteria and reported that the bioavailability of DL- to L-Met was calculated as 69.4 and 81.3% for the average daily gain and gain:feed of nursery pigs, respectively. However, several other studies showed no differences in bioefficacy between D- and L-Met. In the present study, the bioavailability of D-Met was comparable with L-Met in nursery pigs when urinary N output (g/4 d) was used as the response criterion. This was in agreement with Cho et al. (1980) who determined the urinary Met excretion in six-week-old miniature pigs infused with solutions containing L- or DL-Met and reported no difference in utilization between Met isomers. Furthermore, no differences in BW gain or plasma urea levels were observed when three-week-old pigs received low-protein-liquid diets containing either DL- or L-Met (0.51%) for seven days (Reifsnyder, Young & Jones, 1984) and Chung & Baker (1992) reported that D-Met was biologically equivalent to L-Met when the growth performance of pigs averaging 9.6 kg was used as response. It is difficult to explain the reason for discrepancy in the bioefficacy of Met isomers among studies but it may be due in part to the growth stage of animals (Chung & Baker, 1992). The activity of D-Met oxidase, the key enzyme that converts D- to L-Met, was determined to be greater in older animals than in younger animals (D’Aniello et al., 1993). In addition, the methods for measuring bioavailability also affect inconsistent results. As N retention is one of the most sensitive indices for AA utilization (Kim et al., 2006), the N balance technique was employed to determine the relative bioefficacy of D- to L-Met in the present work. In the study conducted by Shen, Weaver & Kim (2014), the bioavailability of DL-Met was less than that of L-Met based on average daily gain and gain:feed, whereas the relative bioavailability of 100.9% was observed for plasma urea N, indicating that the contrary results may be attributed to the use of different response criteria for the estimates of relative bioavailability.
In conclusion, the relative bioavailability values for D- to L-Met in nursery pigs averaging 13.5 kg with the slope-ratio comparison of urinary N output (g/4 d) and N retention (% of intake) were 87.6% and 89.6%, respectively; but 95% fiducial limits for the relative bioavailability estimates included 100%.