
Analysis of combining ability and stability of yield characteristics of upland cotton in two years
- Published
- Accepted
- Received
- Academic Editor
- Fernando Mata
- Subject Areas
- Agricultural Science, Plant Science
- Keywords
- Land cotton, Complete biallelic hybridisation, Cooperativeness, Stability
- Copyright
- © 2025 Ma et al.
- Licence
- This is an open access article distributed under the terms of the Creative Commons Attribution License, which permits unrestricted use, distribution, reproduction and adaptation in any medium and for any purpose provided that it is properly attributed. For attribution, the original author(s), title, publication source (PeerJ) and either DOI or URL of the article must be cited.
- Cite this article
- 2025. Analysis of combining ability and stability of yield characteristics of upland cotton in two years. PeerJ 13:e19716 https://doi.org/10.7717/peerj.19716
Abstract
Objective
Combining ability analysis forms the basis for selecting suitable parents and hybrid combinations. The performance of combining ability is influenced significantly by environmental conditions. Therefore, it is essential to comprehensively evaluate advantageous parents and hybrid combinations through multi-year experiments.
Methods
In this study, seven parental lines were crossed using a complete diallel design [p(p−1)/2], producing 21 combinations. Yield-related traits, including boll number per plant, seed cotton per plant, lint cotton per plant, boll weight, lint percentage, and seed index, were measured in the parental lines and their hybrid F1 generations over two consecutive years. Combining ability and interannual stability were subsequently analysed.
Results
Cotton yield traits were significantly influenced by environmental factors such as weather, temperature, and soil conditions. Interannual variation and genotype-year interactions contributed substantially to variation in yield traits. The interactions between year and both general combining ability (GCA) and specific combining ability (SCA) were significant or highly significant, with GCA stability being relatively low. Yield traits were governed by both additive and dominance genetic effects, with additive effects being predominant. The comparison coefficients for stability of GCA for lint cotton per plant and seed cotton per plant across years were relatively high (51.372% and 55.187%, respectively), whereas SCA stability coefficients for lint percentage and boll weight were comparatively lower (44.986% and 48.645%, respectively). Parent Xinluzao62 (Parent 7) exhibited both high and stable GCA and can therefore be recommended as a backbone parent for yield improvement. Additionally, eight hybrid F1 combinations showing excellent and stable SCA were identified, suitable for use as dominant combinations.
Conclusion
The GCA and SCA for yield traits in upland cotton are notably influenced by environmental factors such as climate and soil. Yield performance varies considerably across different years and locations. Therefore, selections based on multi-year and multi-location trials provide more reliable results, offering a solid theoretical basis for developing high-yield cotton varieties.
Introduction
Xinjiang possesses significant advantages for cotton cultivation owing to its distinctive climate and geographical conditions. It is currently China’s largest cotton production base (Luo, 2021; Zhang, Chen & Zhao, 2023). Crossbreeding remains a primary method in cotton breeding, with combining ability analysis being an essential approach for selecting suitable hybrid parents and combinations (Amein et al., 2013; Al-Hibbiny, 2015). Combining ability analysis is extensively employed in diverse crops, including maize (Mishra et al., 2024; Subba et al., 2022), chili (Siddappa, Ravindra & Shashikanth, 2019; Savitha, Pugalendhi & Natarajan, 2013), beans (Yang et al., 2023; Saba et al., 2020; Han et al., 2018), rice (Sujeet Kumar & Singh, 2018; Deshmukh, Koshta & Sharma, 2016), and cotton (Li et al., 2024; Patil et al., 2012). Such analysis plays a pivotal role in hybrid breeding and exploiting heterosis. Additionally, GGE biplots—a graphical method that helps elucidate genotype-environment interactions—are widely utilised in various crops to evaluate the stability of yield-related traits (Iqbal et al., 2022; Sadabadi et al., 2018; Ma, Liu & Ye, 2024; Li et al., 2023; Chandra et al., 2022; Mullualem et al., 2024). Environmental conditions, such as drought and salinity, significantly influence cotton yield by decreasing its productivity (Bista et al., 2024).
Most previous studies analyzed data from a single year. However, crop trait compatibility mainly depends on trait phenotypes, which can vary considerably under different environmental conditions, potentially altering combining ability and stability across years. Thus, exploring the interaction between combining ability and annual variations holds substantial importance for future cotton breeding programmes.
Askander (2020) investigated combining ability and stability of wheat using incomplete diallel crosses, reporting significant environmental and hybrid differences. Bhandari et al. (2021) analysed tomato combining abilities under varying environments, concluding that the environment substantially influences all trait-related combining abilities. Tang et al. (2021) performed trials across three locations within one year, highlighting the significant reference value of combining ability and heritability in differing environments. Similarly, Iqbal et al. (2012) examined combining abilities for vegetable beans across three locations within one year, indicating that both general combining ability (GCA) and specific combining ability (SCA) were environmentally influenced. Hao et al. (2005) conducted complete diallel crosses under diverse environments within one year, also concluding that combining ability–environment interactions were prevalent. Habib et al. (2012) analysed yield-trait combining abilities in rice using incomplete diallel crosses and emphasised the importance of both GCA and SCA in trait inheritance.
Trait stability across different environments is also crucial. Typically, additive main effects and multiplicative interaction (AMMI) and GGE biplot methods are employed to analyse genotype–environment interactions. AMMI is a statistical method applied to multi-environment trial data, while GGE biplot provides a graphical statistical analysis of these interactions. Guo et al. (2023) assessed two-year yield data using incomplete diallel crosses, demonstrating the significance of combining ability stability across environments. Rao & Chaturvedi (2024) utilised GGE biplots for stability analysis, identifying high-yield and stable grain genotypes and optimal environments. Premika et al. (2024) suggested that AMMI and GGE biplots effectively assess genotype stability and adaptability across environments. Farwan, Devi & Dhillon (2024) indicated that GGE biplots reveal genotype–environment relationships clearly. Kona et al. (2024) applied both AMMI and GGE biplots to evaluate stability among peanut genotypes. Similarly, Dang et al. (2024) and Wang et al. (2023) demonstrated the efficacy of AMMI and GGE biplots in determining genotype stability and environmental adaptability in sugar beet and other crops, respectively. Nevertheless, these studies primarily used incomplete or complete diallel hybrid combinations across different environments within a single year for various crops. Comprehensive analyses combining variance and stability for complete diallel hybrid combinations across different years in cotton have not yet been reported.
In this study, seven upland cotton varieties (lines) were crossed using a complete diallel method, generating 21 hybrid combinations. Their yield traits, including boll number per plant, seed cotton per plant, leather cotton per plant, boll weight, cotton lint percentage, and seed index, were analysed across two consecutive years. The study aims to identify superior parents and hybrid combinations, providing a theoretical foundation for future breeding and selection of high-yield cotton cultivars.
Materials & Methods
Study area overview
The experimental site is located in the southern Tianshan Mountains, Xinjiang Uygur Autonomous Region, China. It is situated at the northern edge of the Taklamakan Desert and the upper reaches of the Tarim River in the 12th Regiment, Alar City, First Division. The site represents a typical artificially developed arid oasis (longitude 80°30′–81°58′E, latitude 40°22′–40°57′N) with a total area of 3,924.32 km2 and altitude between 997 and 1,340 m. The climate of the area is classified as warm-temperate continental desert. The soil at the experimental site is sandy loam. The experimental plot length was 10 m, row spacing configuration was (10 cm + 66 cm + 10 cm + 66 cm + 10 cm), and plant spacing was 10.5 cm. Planting was performed using manual broadcasting.
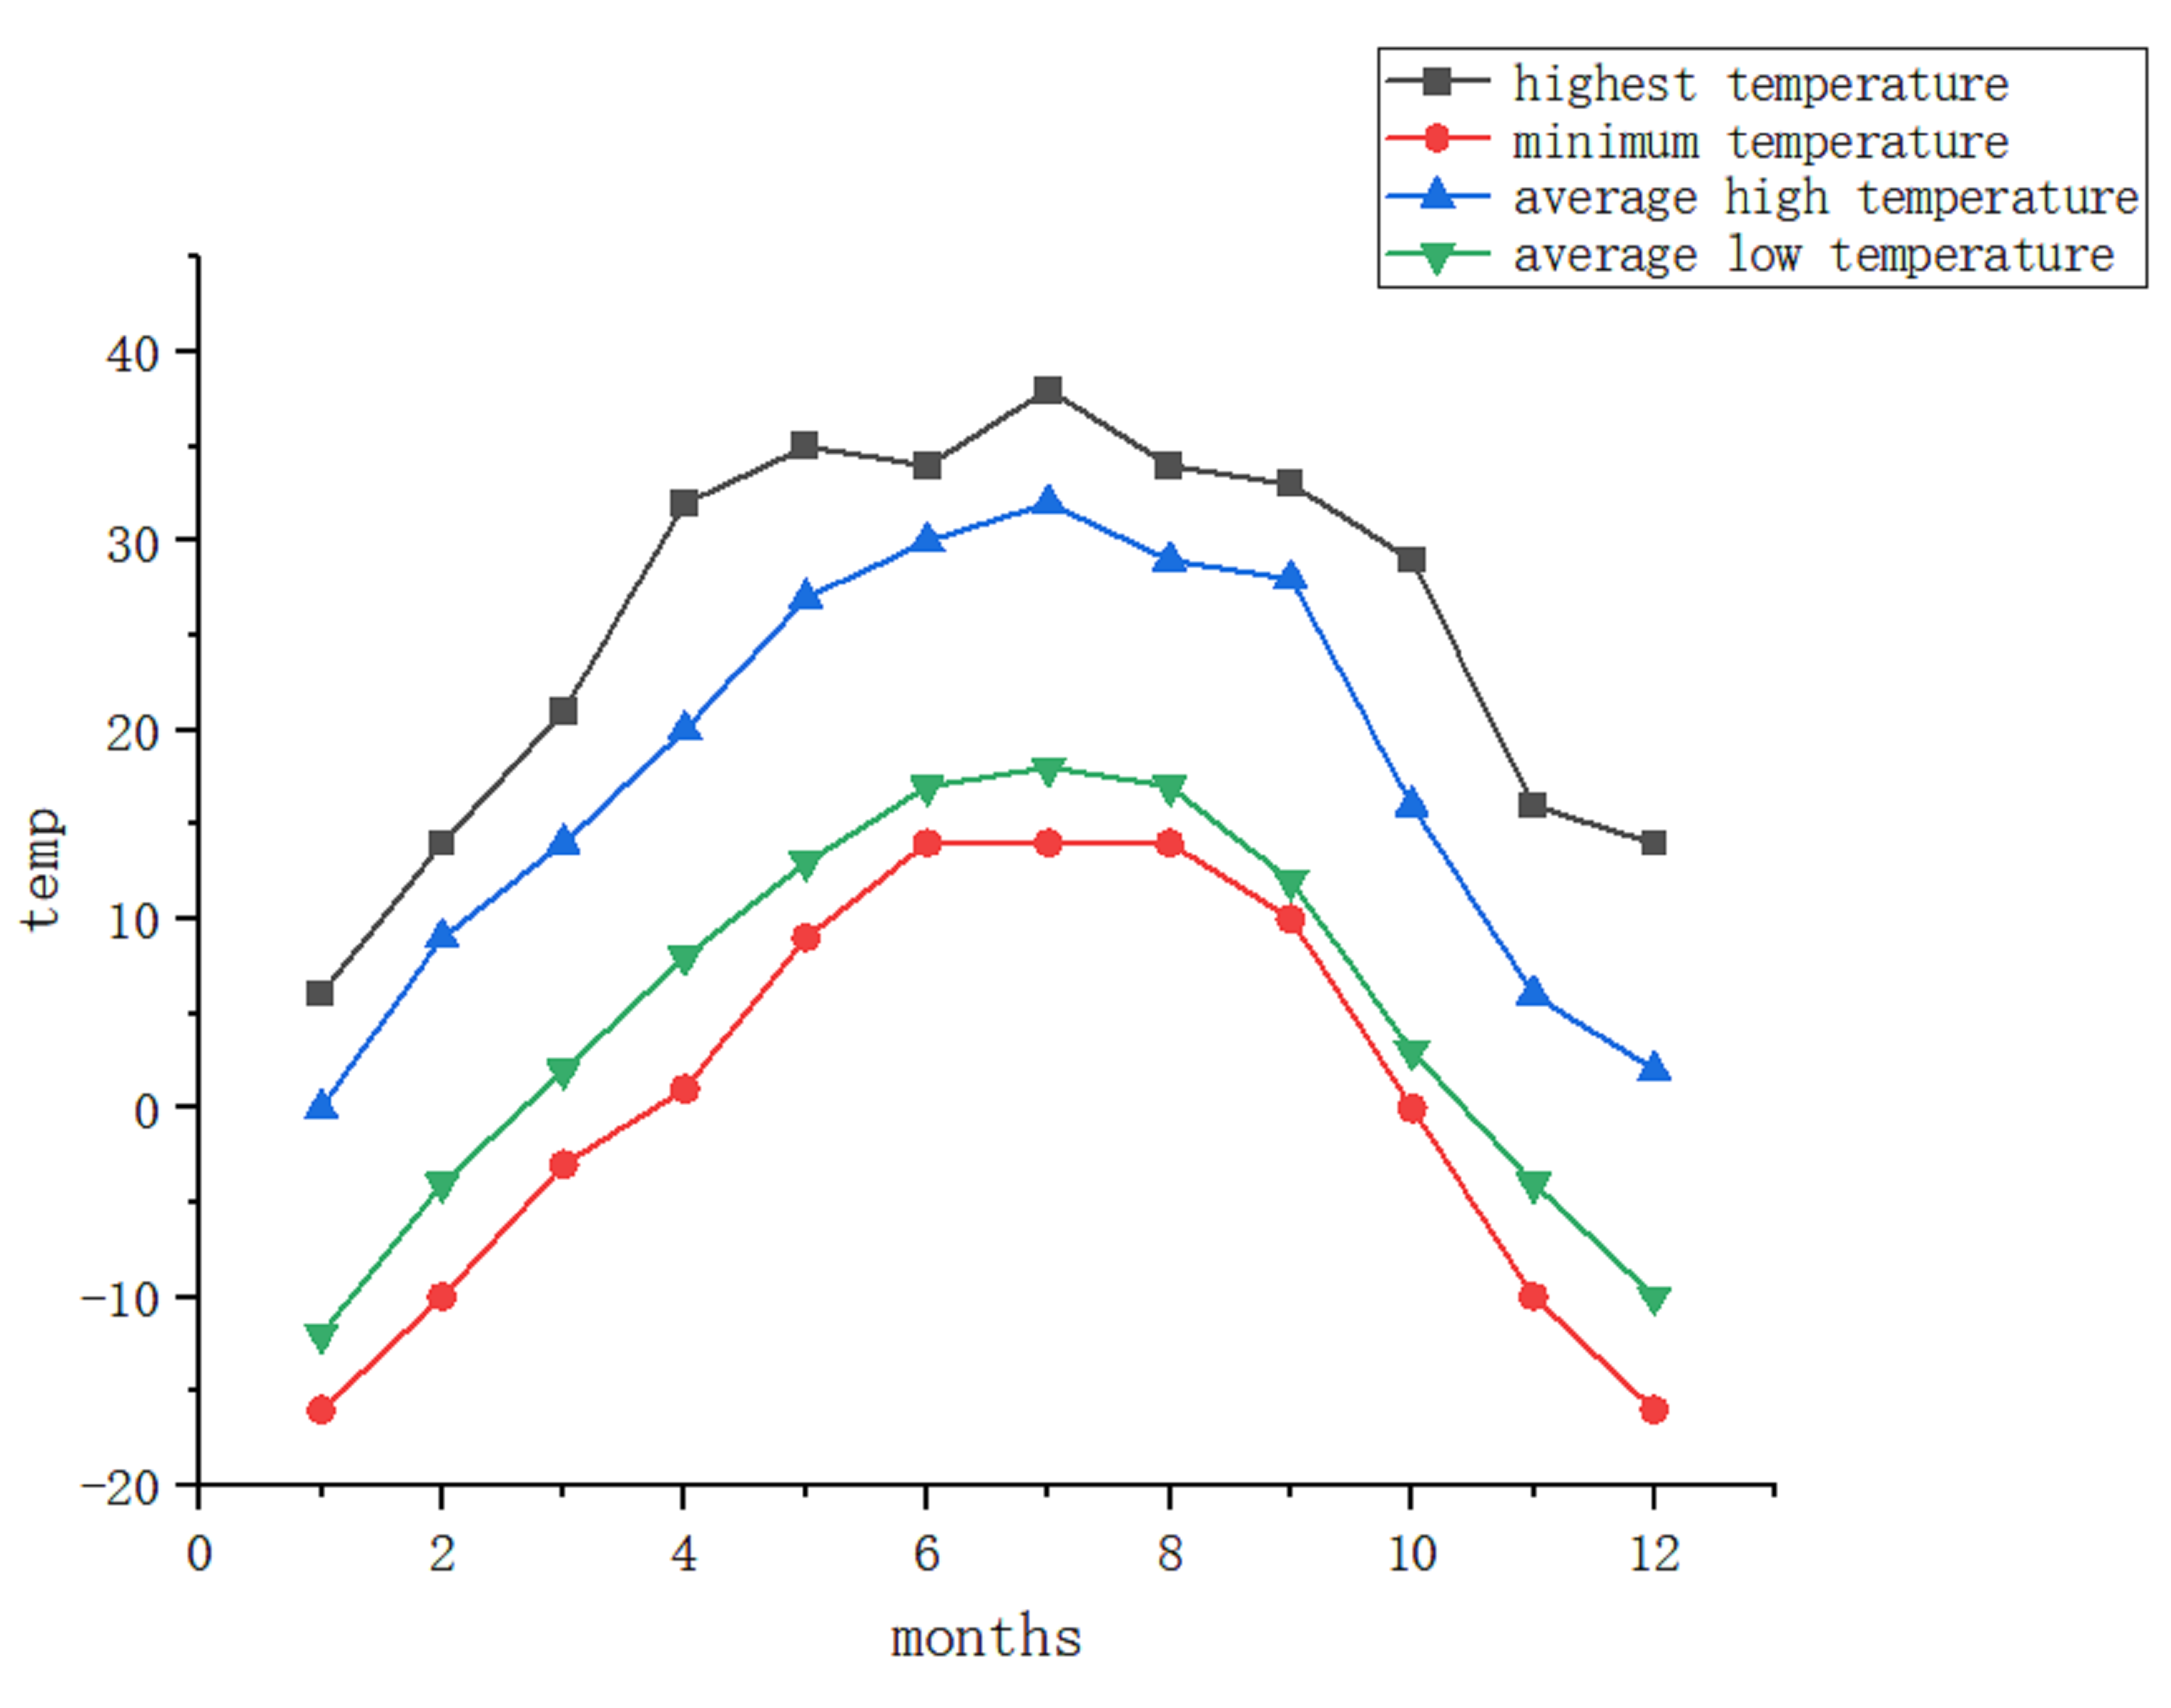
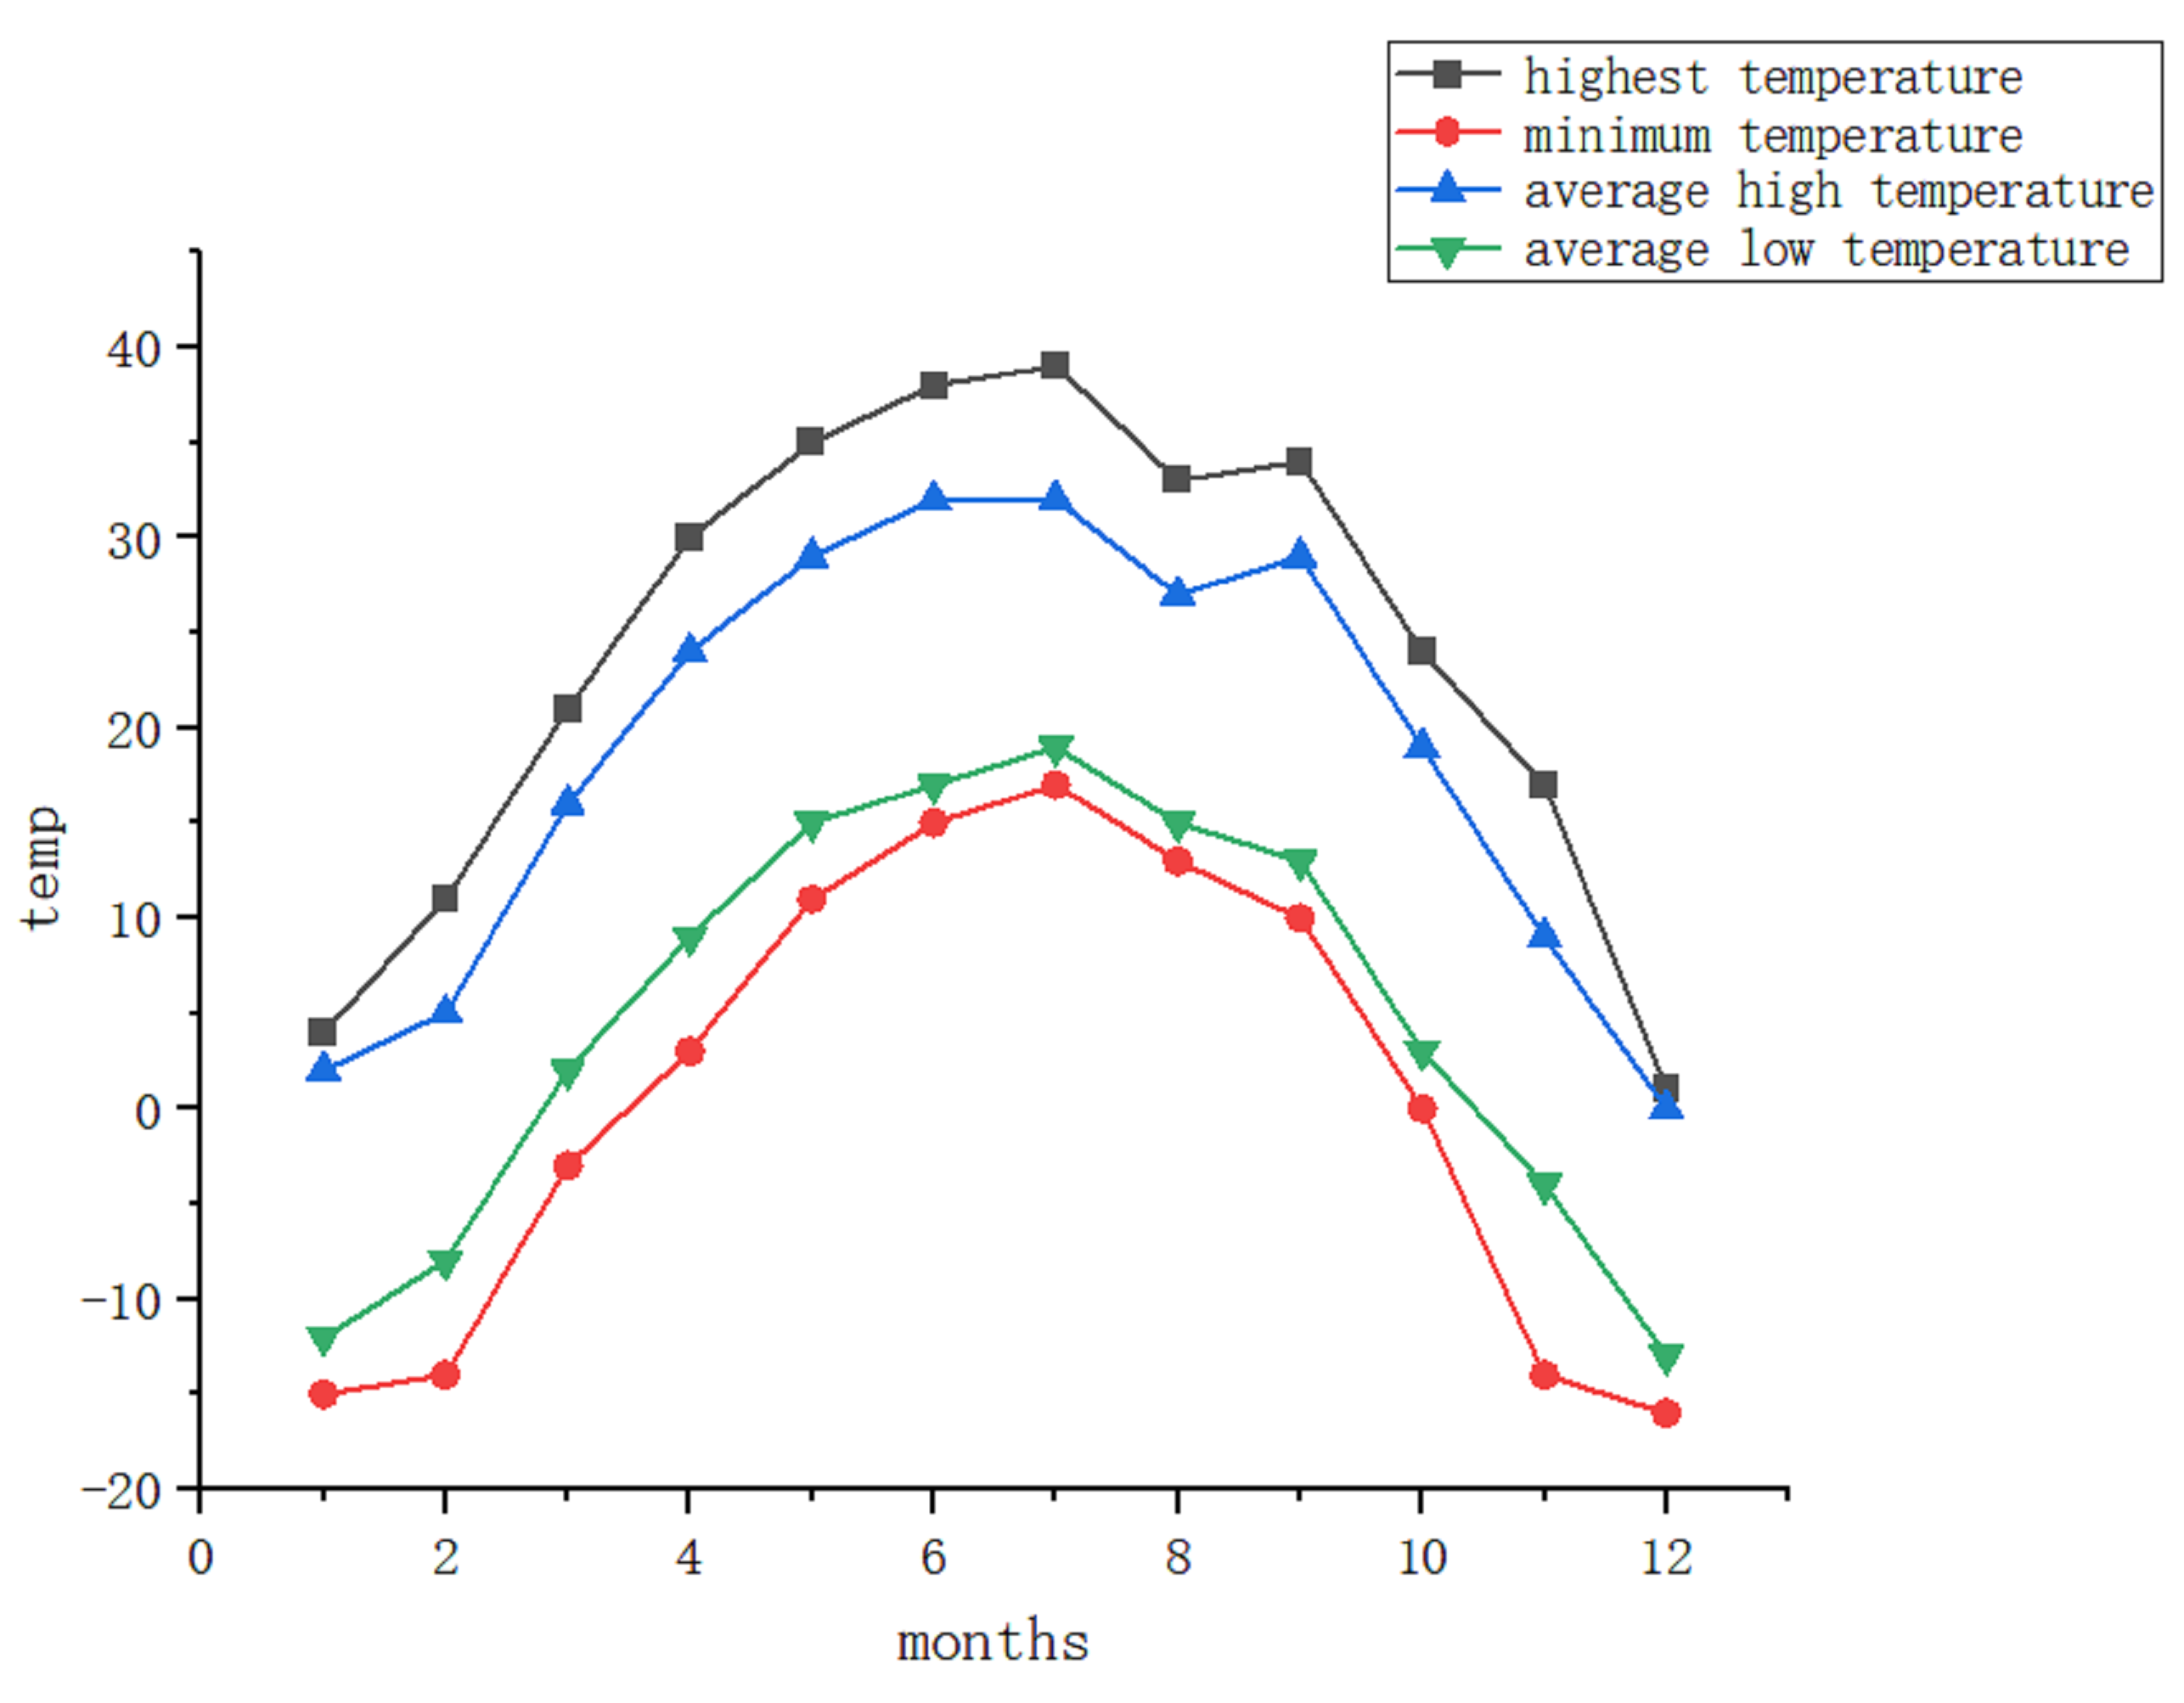
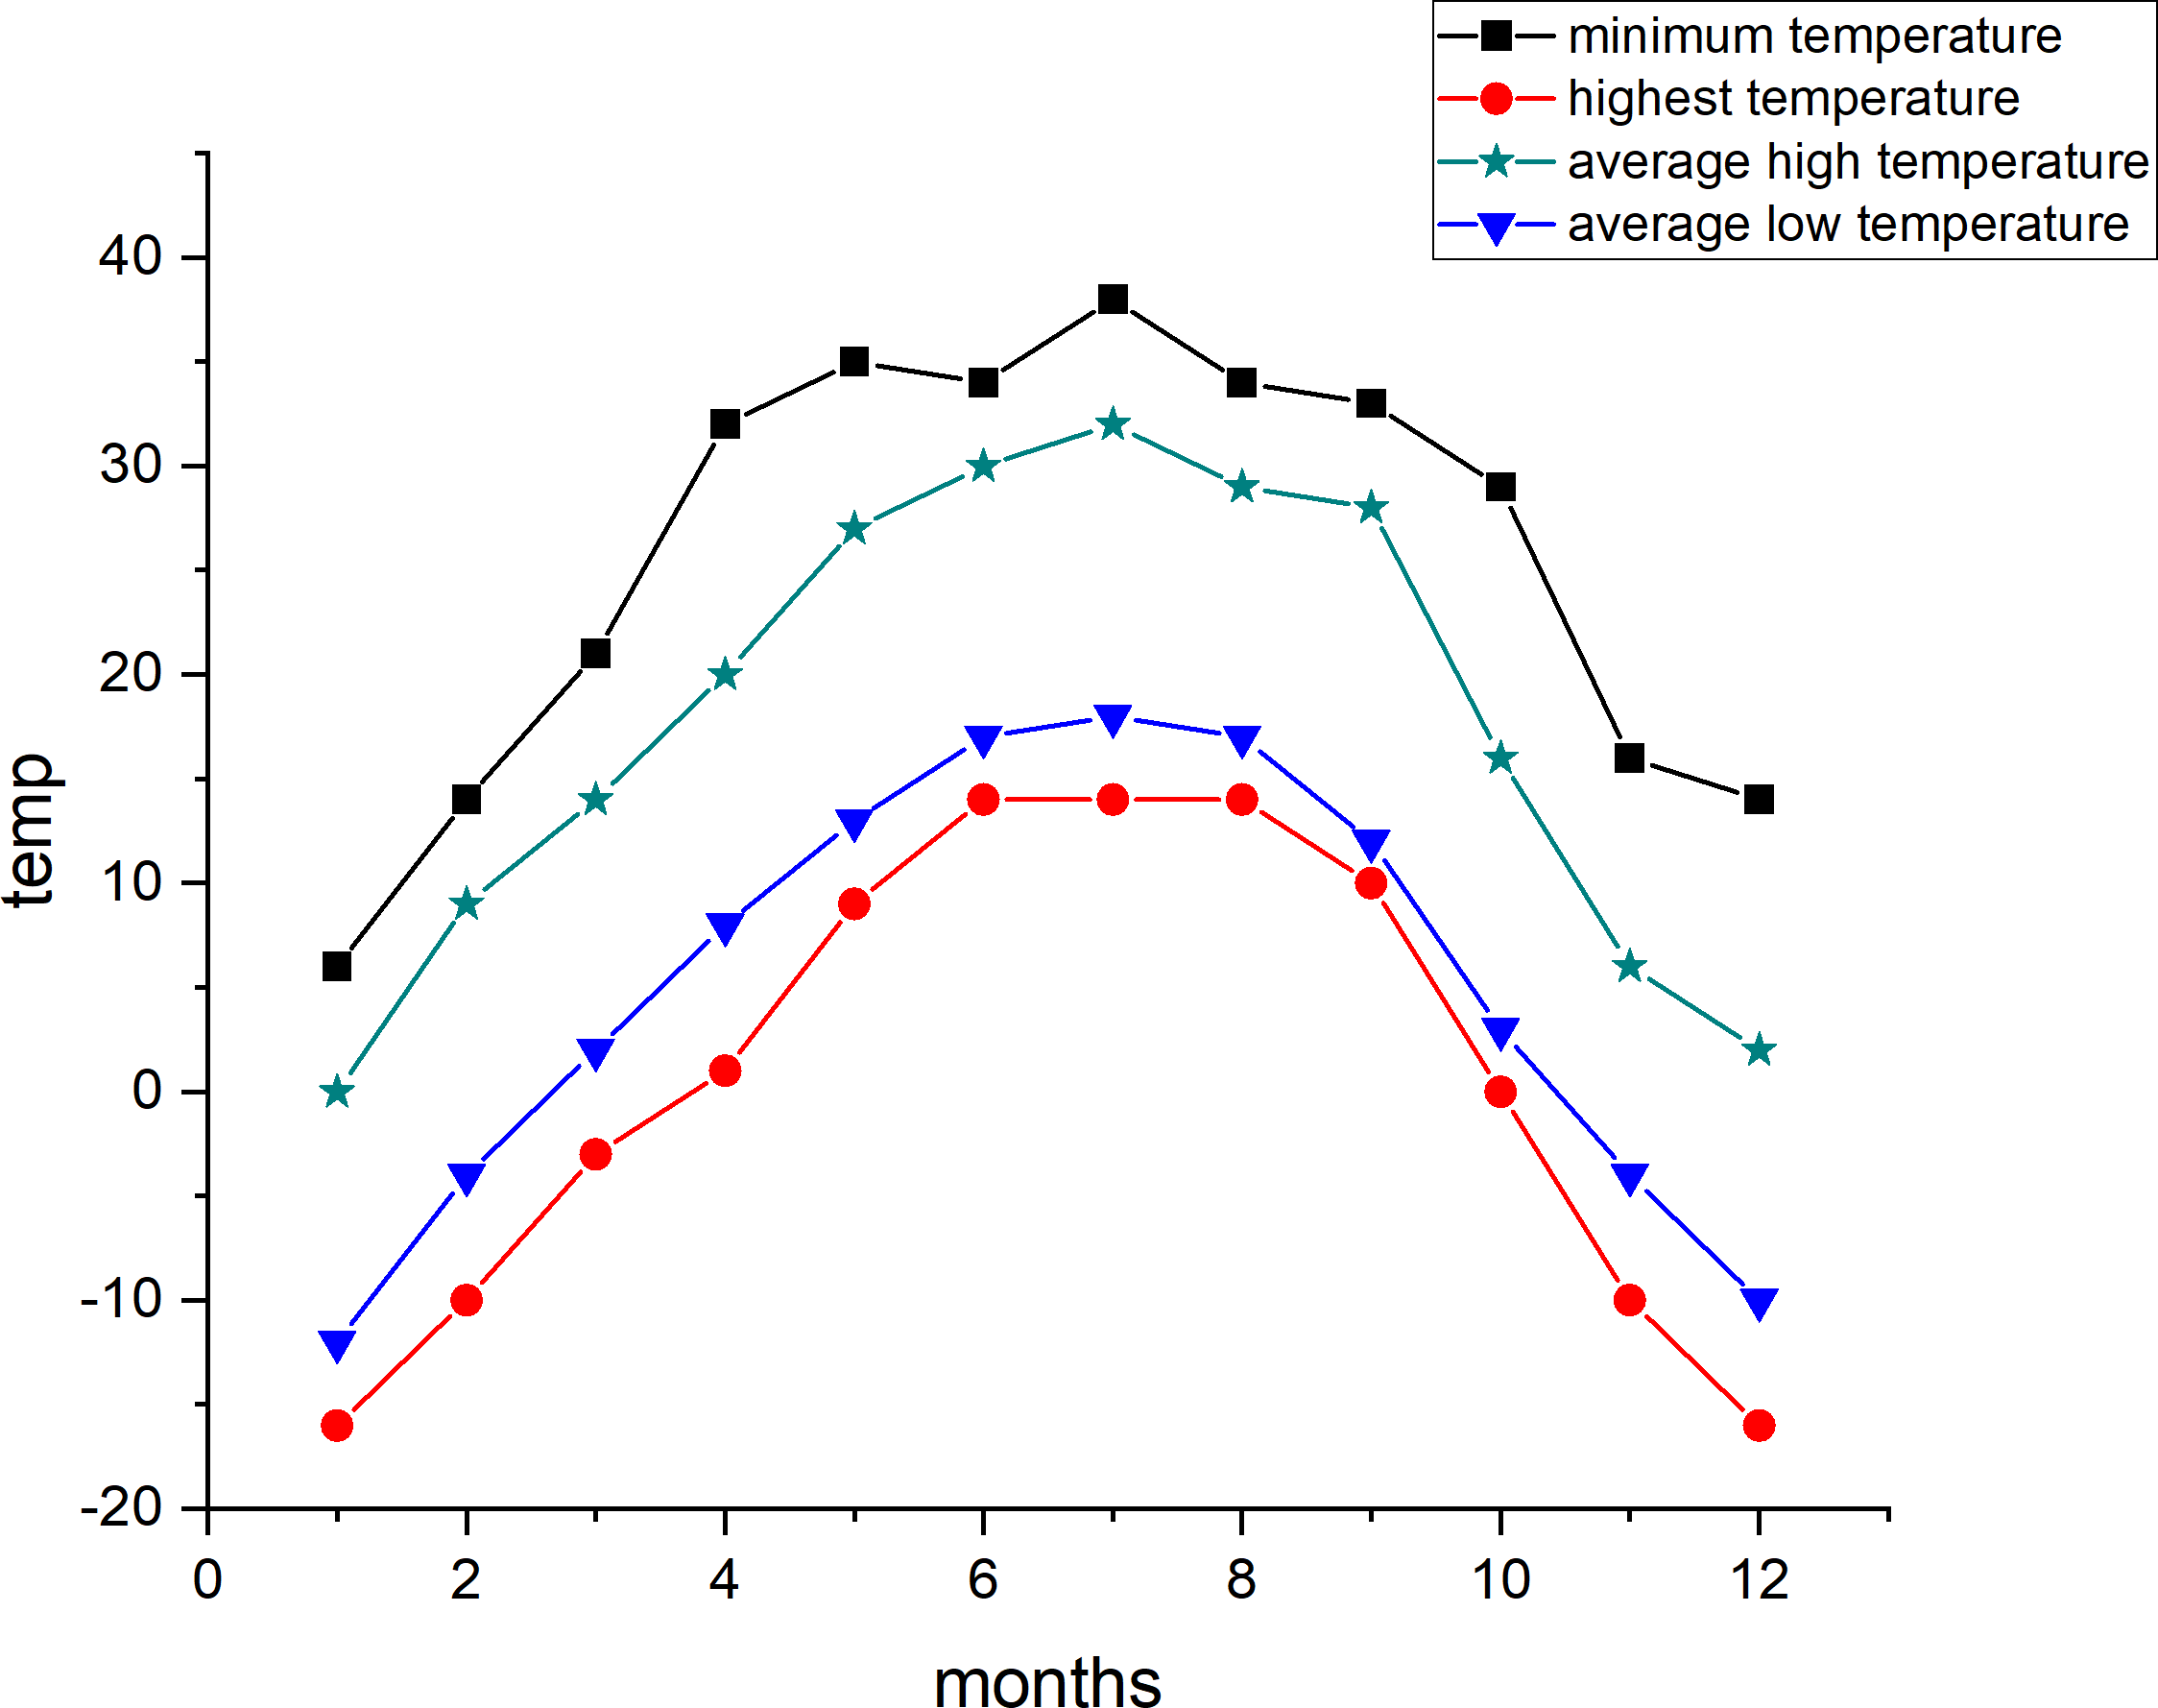
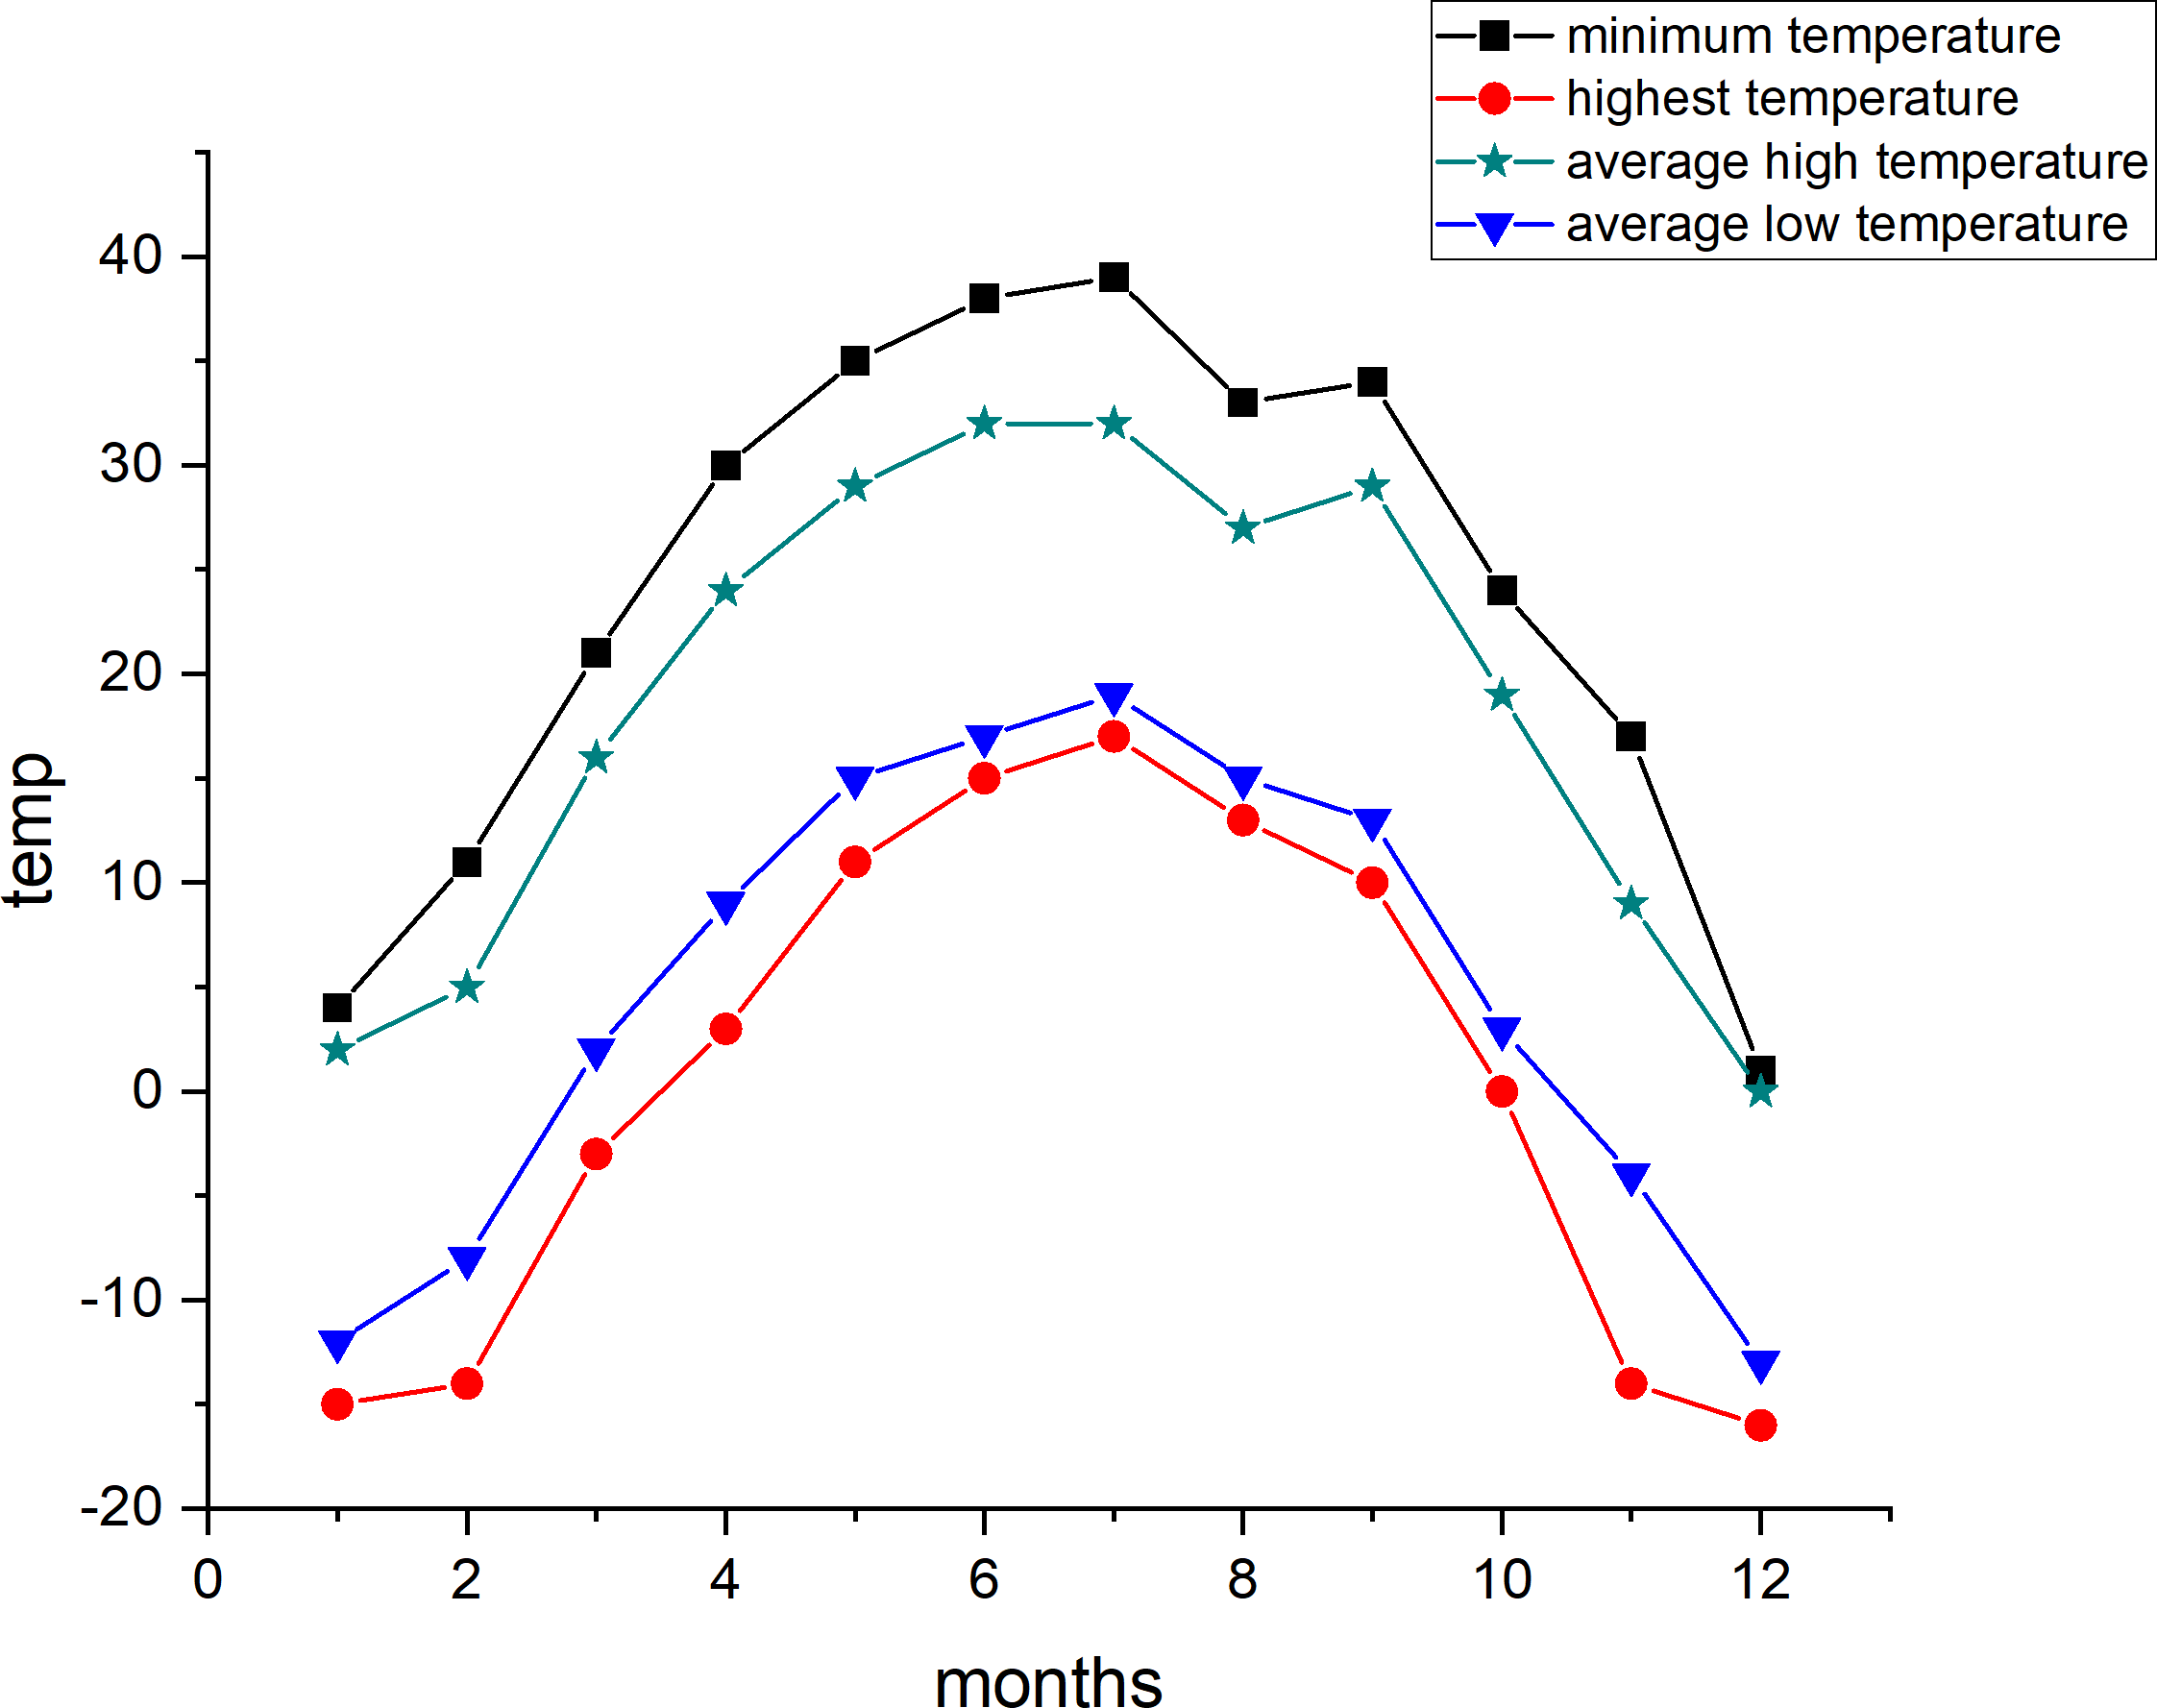
Compared to other regions in Xinjiang Uygur Autonomous Region, Alar City has less snowfall in winter, abundant sunlight and heat resources, significant temperature variations between day and night, and frequent dusty conditions during spring. The average annual temperature is 10.7 °C, with a frost-free period of up to 220 days, making it suitable for cultivating long-staple and fine-staple cotton. Temperature trends for 2021 and 2022 are presented in Figs. 1 and 2, respectively (data sourced from Weather Forecast: https://lishi.tianqi.com/).
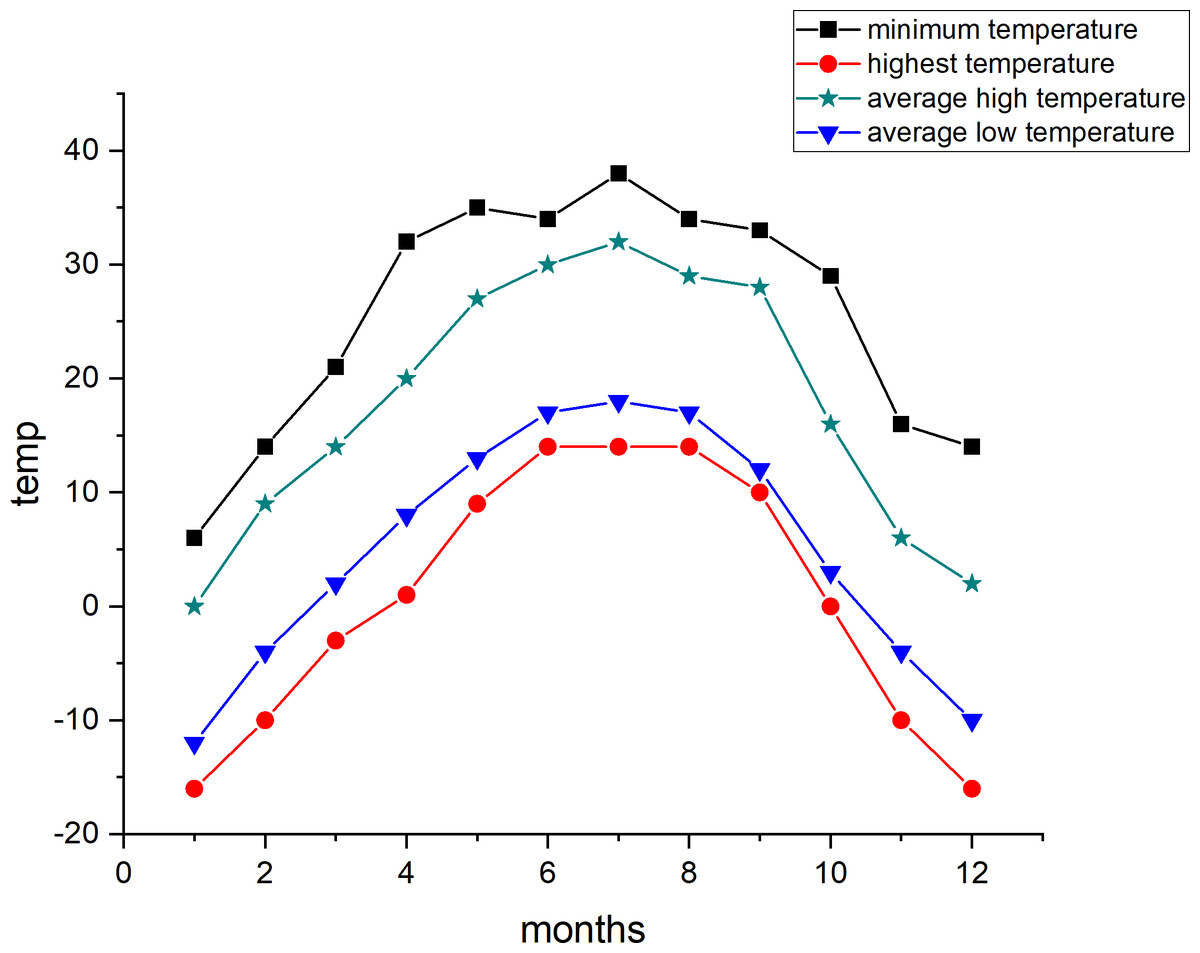
Figure 1: 2021 annual climate map.
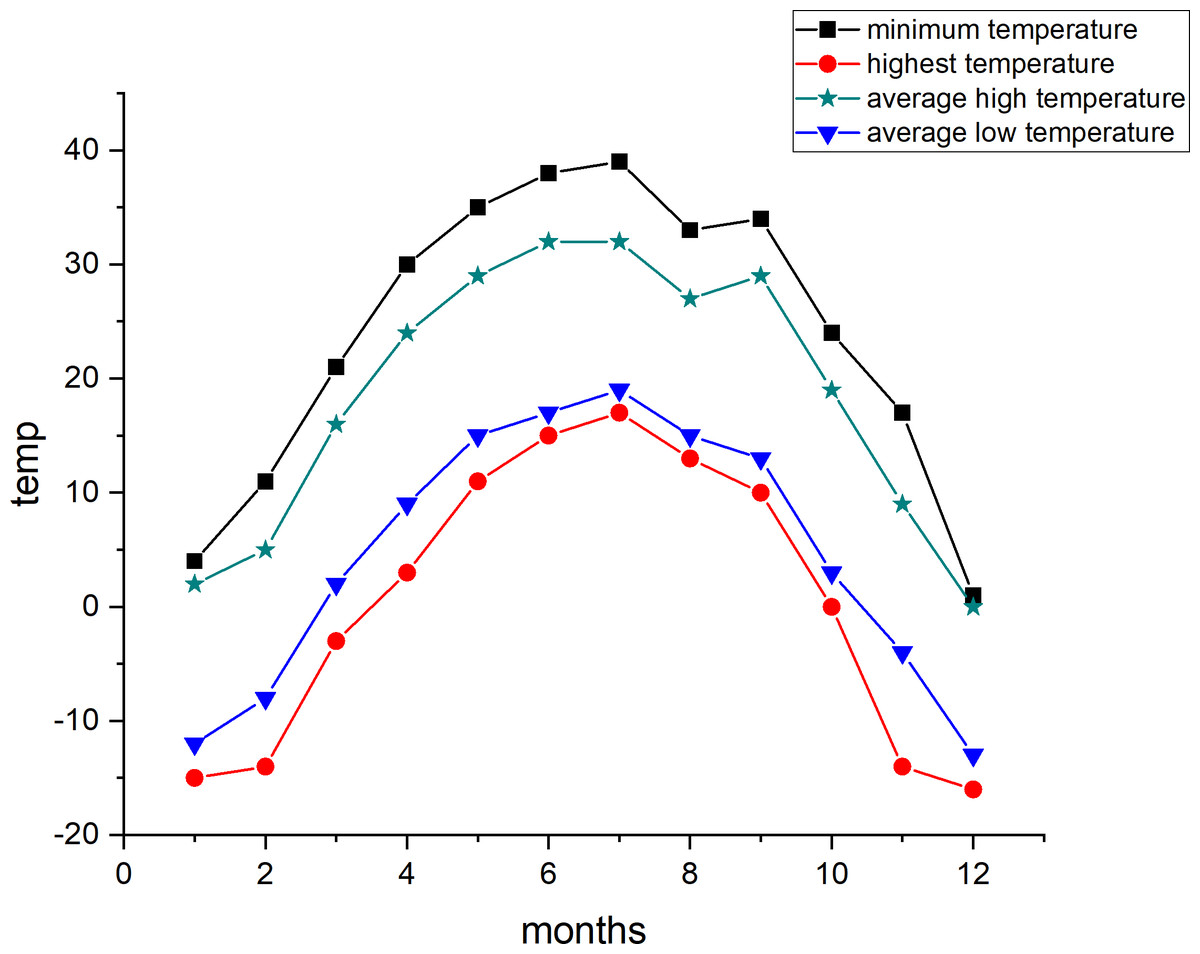
Figure 2: Climate diagram for 2022.
Experimental materials
Seven parental lines—cm3, a115-11, Xinluzhong53, Xinluzhong38, Xinluzhong59, Lu917, and XinLuzao62 (numbered sequentially from 1 to 7)—and their 21 hybrid combinations were used in this study. Hybrid combinations were derived through complete diallel crossing [p(p−1)/2], as detailed in Table 1, provided by the College of Plant Sciences, Tarim University.
| Serial number | Hybrid combination | Serial number | Hybrid combination | Serial number | Hybrid combination |
|---|---|---|---|---|---|
| 12 | cm3 × a115-11 | 24 | a115-11 × Xinluzhong38 | 37 | Xinluzhong 53 × Xinluzao62 |
| 13 | cm3 × Xinluzhong53 | 25 | a115-11 × Xinluzhong59 | 45 | Xinluzhong 38 × Xinluzhong 59 |
| 14 | cm3 × Xinluzhong38 | 26 | a115-11 × Lu917 | 46 | Xinluzhong 38 × Lu917 |
| 15 | cm3 × Xinluzhong59 | 27 | a115-11 × Xinluzao62 | 47 | Xinluzhong 38 × Xinluzao62 |
| 16 | cm3 × Lu917 | 34 | Xinluzhong53 × Xinluzhong38 | 56 | Xinluzhong 59 × Lu917 |
| 17 | cm3 × Xinluzao62 | 35 | Xinluzhong53 × Xinluzhong59 | 57 | Xinluzhong 59 × Xinluzao62 |
| 23 | a115-11 × Xinluzhong53 | 36 | Xinluzhong53 × Lu917 | 67 | Lu917 × Xinluzao62 |
The seven parental lines and their 21 hybrid combinations were cultivated at the experimental field of the Twelfth Regiment in Aral City in 2021 and 2022. A randomized block design with two replications was employed, using wide-film planting (10 cm + 66 cm + 10 cm), plant spacing of 10.5 cm, and row length of 3 m. Sowing was conducted using mechanical film perforation combined with manual spot sowing, while standard field management practices were uniformly applied.
During the shedding period (mid-October) in both 2021 and 2022, 10 uniformly grown cotton plants from the middle of each plot were selected. Harvested cotton bolls were evaluated in the laboratory for the following traits: boll number per plant (average number of bolls per 10 plants), boll weight (total weight of harvested seed cotton divided by total boll count from 10 plants), seed cotton per plant (total seed cotton harvested divided by 10), leather cotton per plant (average lint cotton after ginning the harvested seed cotton from 10 plants), and seed index (weight of randomly selected 100 cotton seeds).
Trait determination
1. Plant selection: Ten cotton plants with uniform growth from the centre of each plot were selected to minimize edge effects. Plants with consistent plant height, leaf number, and branch number were ensured.
2. Plant marking: The selected plants were tagged or marked for subsequent identification.
3. Information recording: Each plot’s number and the exact locations of selected plants were documented to guarantee data traceability.
4. Measurement of yield-related traits:
Boll number per plant: Total number of bolls per plant was counted, and the average of ten plants was calculated.
Boll weight: The weight of each cotton boll was measured, and the average boll weight per plant was calculated.
Seed cotton per plant: The total seed cotton weight per plant was calculated (boll number per plant multiplied by boll weight), and the average seed cotton weight per plant for ten plants was determined.
Leather cotton per plant: Lint cotton was obtained by ginning seed cotton using a serrated gin, weighed using an electronic balance, and the average lint cotton per plant for ten plants was calculated.
Seed index: One hundred cotton seeds were randomly selected and weighed to obtain the seed index.
Cotton lint percentage: Calculated as the ratio of leather cotton per plant to seed cotton per plant (cotton lint percentage = leather cotton per plant/seed cotton per plant).
Data analysis
Joint analysis of variance
Joint analysis of variance was employed to analyze repeated experimental data across different years or environmental conditions. Considering multiple factors simultaneously provided a comprehensive analytical perspective.
In this study, data from two years were initially tested for independence (Chi-square test), normality (Shapiro–Wilk test), and homogeneity of variance (Levene test). The PROC GLM program in SAS software was used for joint variance analysis to assess the significance of genotype (G), year (E), and genotype-by-year interactions (G × E). Due to the relatively stable genetic effects of each genotype within the population, sampling was assumed as a fixed model, with year serving as a key variable in the experimental design. Year was set as a fixed effect when evaluating interactions between year and treatment, while grouping within years was typically considered a random effect. Therefore, the mixed-effects model for joint variance analysis was as follows (Guo et al., 2023):
where Yger represents the observed value of the g-th genotype, r-th replicate, in the e-th year; µ is the overall experimental mean; Ee is the year effect; Gg is the genotype effect; (E × G)eg is the genotype-year interaction effect; Er(e) is the random block effect within the e-th year; ɛger is the error term, which follows a normal distribution ).
Combining ability analysis
Combining ability (GCA and SCA) served as a crucial indicator to evaluate parental and hybrid performance in breeding. The statistical model for observational means obtained from method 2 of diallel hybridization within each environment or year was:
The variety effect is vij = gi + gj + sij, and there is sij = sji, which means the positive and negative crossing effects are the same. ∑gi = 0, for each j, ∑Sij = 0. In the formula, i, j = 1, 2, 3⋯p; when i = j (parental self crossing): Yij = μ + 2gi + ɛij; when i < j (orthogonal combination): Yij = μ + gi + gj + sij + ɛij.
μ is the overall average; ɛij for the error term; it follows the distribution of ).
The combining ability model was defined as follows: Yij = μ + GCAi + GCAj + SCAij + ɛij.
where µ denotes the overall experimental mean; GCAi and GCAj are the GCA effects for parents i and j, respectively; SCAij is the SCA effect between parents i and j; and ɛij is the error term.
The expression of combining ability was influenced by genotype (parent) as well as environmental factors, such as year, location, and climatic conditions. In this study, DPS19 software (http://www.dpsw.cn/) was used to determine combining abilities. A fixed-effects model was employed to estimate combining ability effects for each trait across the two-year data. Joint variance analysis of GCA and SCA was conducted across years based on the principle of additivity of sums of squares to evaluate the significance and stability of combining abilities across environments.
Genetic effects analysis
Using the PROC VARCOMP procedure in SAS software, generalized heritability was calculated via a mixed linear model (with year as a fixed factor and genotype as a random factor):
where is the genotype variance; is the genotype-year interaction variance; is the error variance; n is the number of years; and r is the number of repetitions.
Correlation and stability analysis of combining ability
Correlations between the combining abilities of various traits across years were calculated to identify traits and combinations less affected by environmental variability. Stability comparison coefficients were calculated separately for each trait. By comparing stability coefficients Cg and Cs, parents and hybrids with superior stability were selected to improve breeding efficiency:
where Cg and Cs represent the stability coefficients for GCA and SCA, respectively; and are the variances of general and specific combining abilities; and are the variances of interactions between combining ability and environment.
Stability analysis of hybrid performance
The AMMI genotype-environment interaction model was applied to evaluate hybrid combinations. GGE biplots displayed performance and stability of combining abilities for each trait across years (Zhao et al., 2024). The AMMI model was defined as follows:
where Yger is the observed value for the g-th genotype in the e-th environment with r replicates; μ is the overall mean; αg and βe denote genotype and environment main effects, respectively; λn is the eigenvalue of the n-th principal component; γgn and δen are genotype and environment scores on the n-th principal component; ρg is the residual; ɛger is the experimental error.
Genstat21 software was used for GGE biplot analysis to evaluate combining ability stability and adaptability of parents and hybrid combinations across years.
Results
Normality test of residuals for yield traits across years
The residuals of yield traits underwent normality testing (Table 2). Kolmogorov–Smirnov tests indicated Sig. ≥ 0.05, confirming that the experimental data for both years followed a normal distribution.
| Trait | Year | Kolmogorov–Smirnova | ||
|---|---|---|---|---|
| Statistic | df | Sig. | ||
| Boll number per plant | 1 | 0.085 | 56 | 0.200 |
| 2 | 0.117 | 56 | 0.053 | |
| Seed cotton per plant | 1 | 0.115 | 56 | 0.065 |
| 2 | 0.093 | 56 | 0.200 | |
| Leather cotton per plant | 1 | 0.1 | 56 | 0.200 |
| 2 | 0.097 | 56 | 0.200 | |
| Boll weight | 1 | 0.101 | 56 | 0.200 |
| 2 | 0.092 | 56 | 0.200 | |
| Cotton lint percentage | 1 | 0.095 | 56 | 0.200 |
| 2 | 0.117 | 56 | 0.053 | |
| Seed index | 1 | 0.079 | 56 | 0.200 |
| 2 | 0.094 | 56 | 0.200 | |
Joint analysis of variance of yield traits across years
Joint analysis of variance (ANOVA) results (Table 3) revealed no significant differences in seed index and boll weight among blocks within years, while all other traits showed significant or highly significant differences. Yield traits differed significantly or highly significantly across years, except for seed index, suggesting that yields are considerably influenced by environmental factors. Additionally, all yield traits displayed significant or highly significant differences across genotypes (hybrid combinations) and genotype-year interactions. The pervasive significant interactions between genotype and year indicate substantial environmental influences on yield traits.
| Nature (i.e., properties of sth) | Group of districts within year | Vintages | Genotypes (hybrid combinations) | Genotype × year | Inaccuracies |
|---|---|---|---|---|---|
| Degree of freedom | 1 | 1 | 27 | 27 | 55 |
| Seed index | 0.459 | 0.315 | 1.377** | 1.012** | 0.252 |
| Cotton lint percentage | 1.168 | 527.342** | 10.929** | 3.099** | 0.414** |
| Boll weight | 0.224 | 3.076** | 0.389** | 0.194* | 0.114 |
| Leather cotton per plant | 257.685** | 35.054* | 42.290** | 25.203** | 7.905 |
| Seed cotton per plant | 1,220.353** | 905.620** | 220.025** | 114.480** | 40.851 |
| Boll number per plant | 39.406** | 14.538** | 7.186** | 4.024** | 1.25 |
Joint ANOVA of combining ability for yield traits across years
ANOVA results for combining ability (Table 4) indicated no significant differences between years for all yield traits. GCA differences among parents were significant or highly significant for all yield traits except cotton lint percentage and boll weight. SCA differences among combinations were highly significant for leather cotton per plant, seed cotton per plant, and boll number per plant. The interaction between year and parental GCA was significant or highly significant for all yield traits, and the interaction between year and SCA of combinations was significant for leather cotton per plant, seed cotton per plant, and boll number per plant.
| Nature (i.e., properties of sth) | Vintages | Parentage GCA | Combined SCA | Year × parent GCA | Year × combination SCA | Inaccuracies |
|---|---|---|---|---|---|---|
| Seed index | 0.223 | 4.800* | 1.685 | 6.216** | 1.358 | 1.755 |
| Cotton lint percentage | 1.950 | 61.221 | 13.845 | 65.753* | 16.931 | 28.940 |
| Boll weight | 0.028 | 1.010 | 0.397 | 1.460* | 0.419 | 0.540 |
| Leather cotton per plant | 29.852 | 43.070** | 26.487** | 40.769** | 20.776* | 10.008 |
| Seed cotton per plant | 111.789 | 206.181** | 133.810** | 167.421** | 94.624* | 51.473 |
| Boll number per plant | 2.428 | 5.824** | 3.574** | 6.724** | 3.389* | 1.617 |
Analysis of genetic effects on yield traits in upland cotton
Combining ability analysis for yield traits across two years (Table 5) showed that all six yield traits were controlled by both additive and dominant genes. Given that the variance of GCA exceeded that of SCA for all six traits, it can be concluded that additive genetic effects predominantly controlled these traits, complemented by dominance effects. The genotype-environment interaction variance was substantial for all yield traits, indicating strong environmental influences. The highest broad-sense heritability was 70.263% for seed cotton per plant, and the lowest was 56.702% for boll weight.
| Nature (i.e., properties of sth) | Vg | Vs | Vge | Broad-sense heritability H2 (%) |
|---|---|---|---|---|
| Seed index | 4.800 | 1.685 | 7.574 | 60.546 |
| Cotton lint percentage | 61.221 | 13.845 | 82.684 | 60.712 |
| Boll weight | 1.010 | 0.397 | 1.880 | 56.702 |
| Leather cotton per plant | 43.070 | 26.487 | 61.544 | 67.642 |
| Seed cotton per plant | 206.181 | 133.810 | 262.045 | 70.263 |
| Boll number per plant | 5.824 | 3.574 | 10.114 | 63.250 |
Correlation and stability analysis of GCA and SCA across years
Pearson correlation coefficients and stability analyses for parental GCA and SCA over two years (Table 6) showed no significant correlations between years for most yield traits except cotton lint percentage, suggesting inconsistent combining ability across years. Stability comparison coefficients for GCA of leather cotton per plant and seed cotton per plant were 51.372% and 55.187%, respectively. Stability coefficients for other traits ranged between 40% and 50%. Stability coefficients for SCA were relatively lower for cotton lint percentage (44.986%) and boll weight (48.645%), whereas coefficients for other traits ranged between 50% and 60%. Except for cotton lint percentage, whose SCA stability coefficient was lower than that of GCA, stability coefficients of SCA were generally higher than those of GCA, indicating that SCA exhibited greater stability than GCA for most traits across different years.
| Nature (i.e., properties of sth) | GCA correlation coefficient Rg | SCA correlation coefficient Rs | GCA stability comparison coefficient Cg (%) | SCA stability comparison coefficient Cs (%) |
|---|---|---|---|---|
| Seed index | 0.290 | 0.060 | 43.571 | 55.380 |
| Cotton lint percentage | 0.780 * | 0.330 | 48.215 | 44.986 |
| Boll weight | 0.400 | 0.230 | 40.892 | 48.645 |
| Leather cotton per plant | 0.060 | 0.300 | 51.372 | 56.042 |
| Seed cotton per plant | 0.280 | 0.360 | 55.187 | 58.577 |
| Boll number per plant | 0.370 | 0.290 | 46.413 | 51.330 |
Notes:
GCA analysis of yield traits for each parent across different years
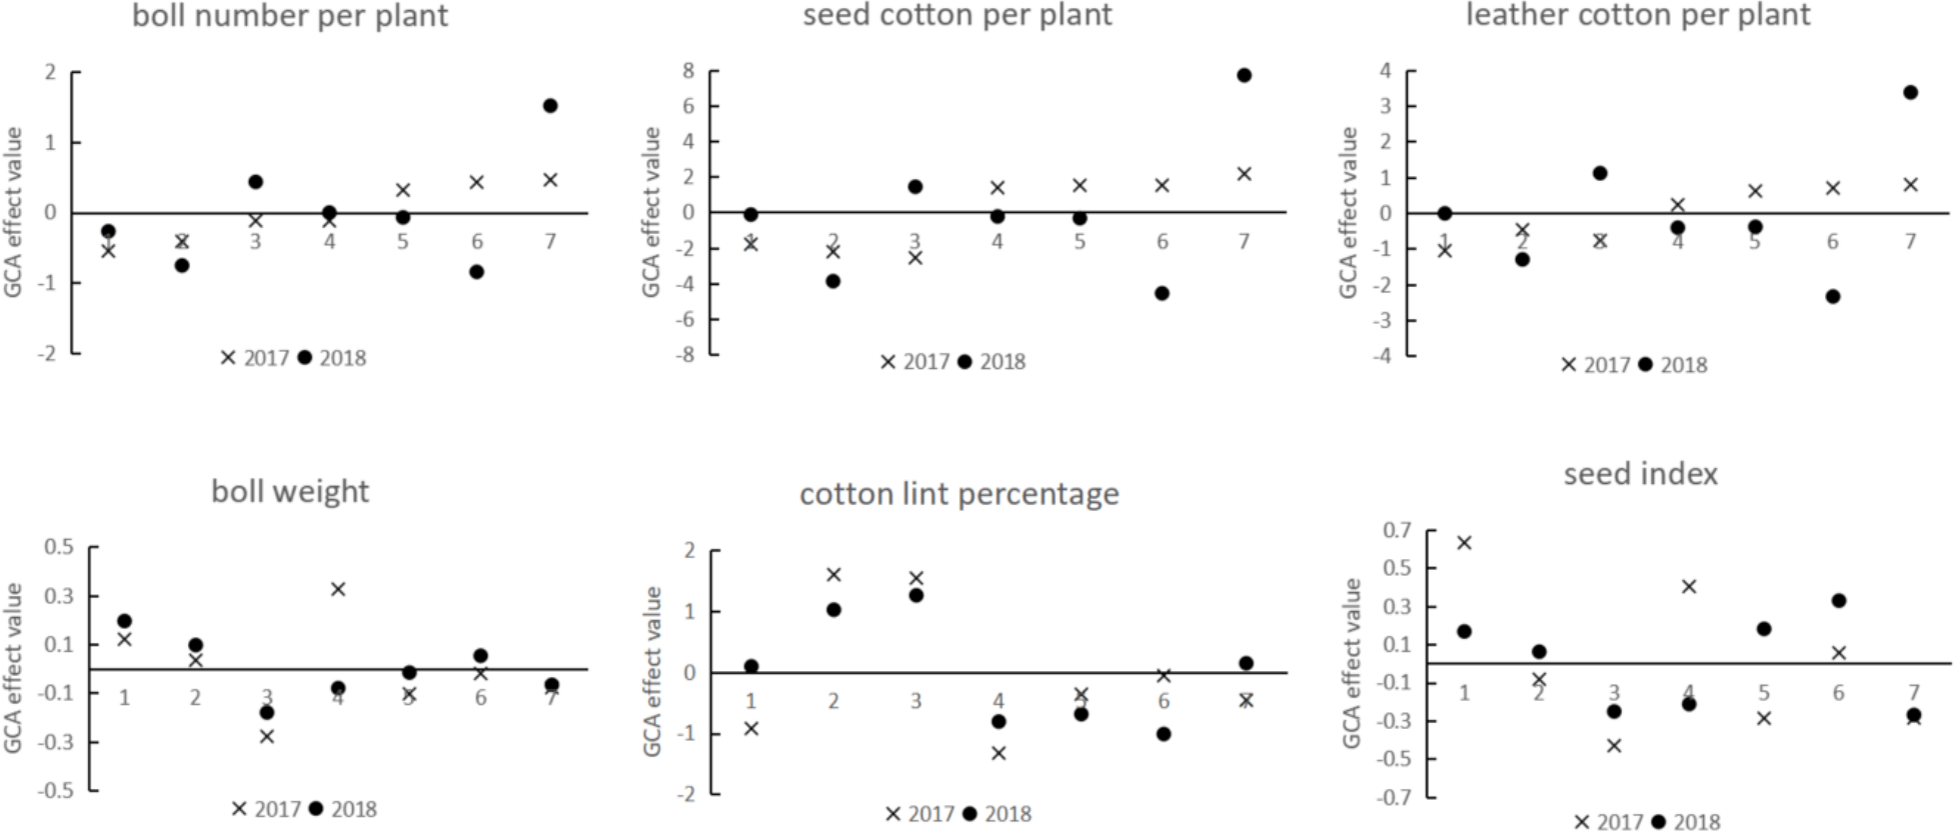
The GCA of seven upland cotton parents over two years was analysed. Results (Fig. 3) indicated that parents 1, 2, and 4 showed negative GCA effects for boll number per plant in both years, whereas parent 7 exhibited positive effects consistently. The other parents demonstrated inconsistent effects across the two years. For seed cotton per plant, parents 1 and 2 had consistently negative effects, parent 7 consistently showed a positive effect, and the remaining parents exhibited inconsistent effects. Similarly, for leather cotton per plant, parents 1 and 2 consistently displayed negative effects, parent 7 consistently showed a positive effect, and other parents had varying effects. Regarding boll weight, parents 1 and 2 demonstrated consistent positive effects, while parents 3, 5, and 7 showed consistent negative effects. For cotton lint percentage, parents 2 and 3 had consistently positive effects, parents 4, 5, and 6 had consistently negative effects, and others were inconsistent. Finally, for seed index, parents 1 and 6 consistently showed positive effects, parents 3 and 7 consistently had negative effects, and the remaining parents displayed varying effects.
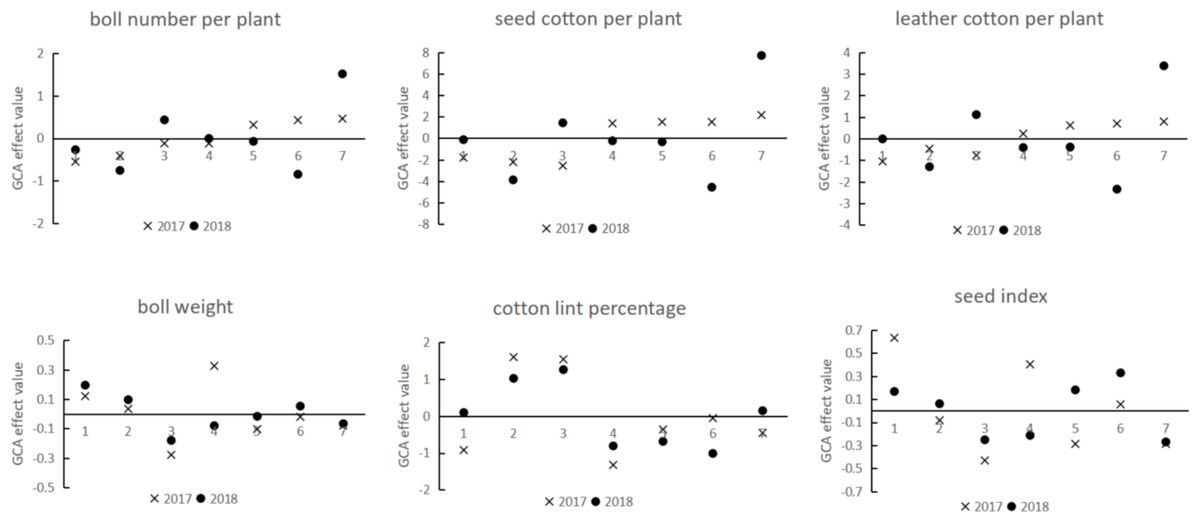
Figure 3: GCA effect values of parental yield traits in different years.
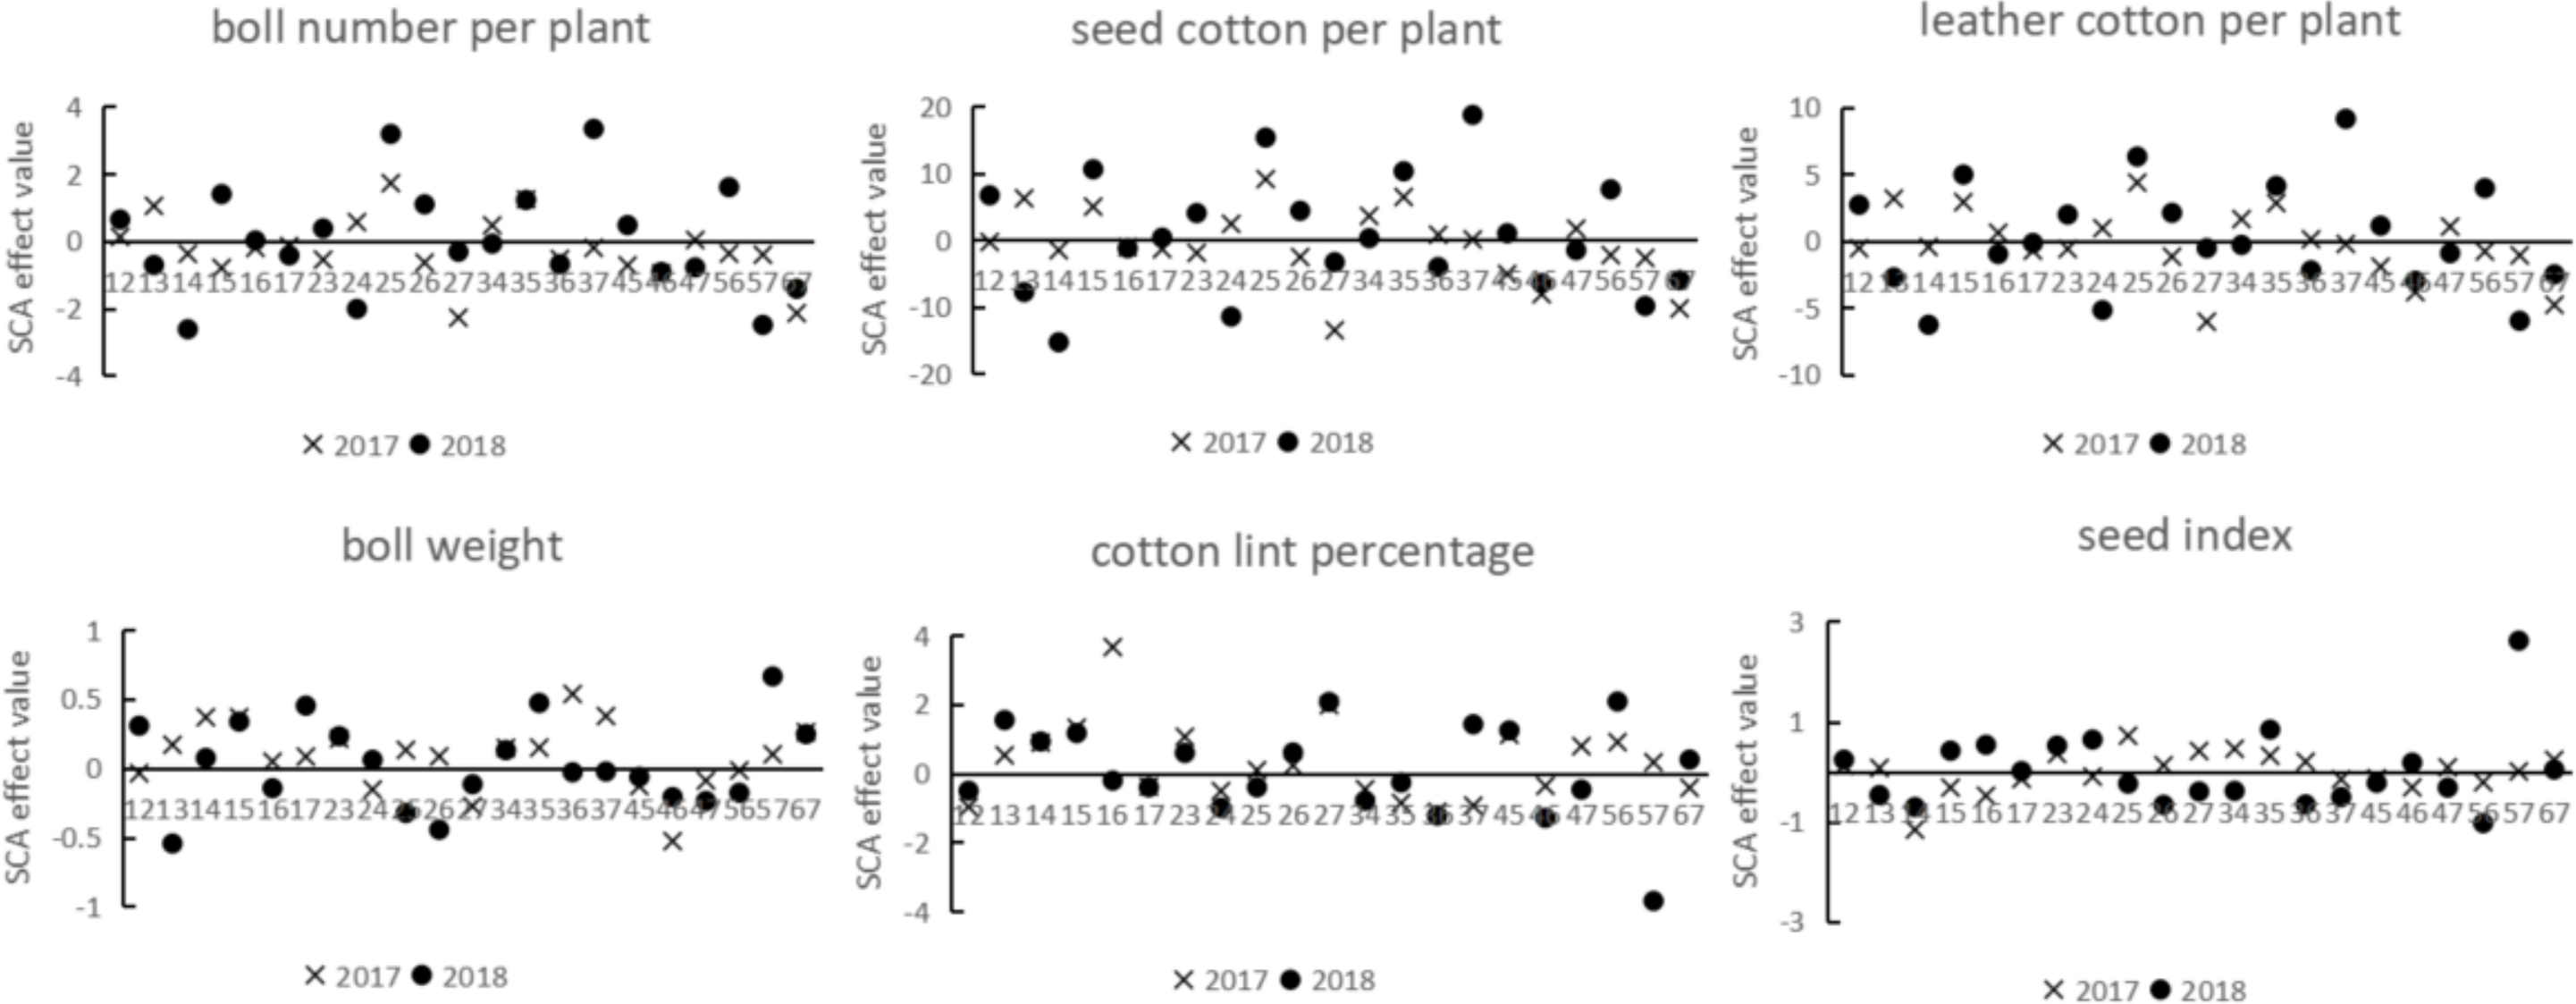
SCA analysis of yield traits for each hybrid combination across different years
SCA of 21 combinations over two years (Fig. 4) revealed consistent positive effects for boll number per plant in combinations 12, 25, and 35, whereas combinations 14, 17, 27, 36, 46, 57, and 67 consistently showed negative effects. For seed cotton per plant, combinations 15, 25, 34, 35, and 37 consistently showed positive effects, whereas combinations 14, 16, 27, 46, 57, and 67 consistently exhibited negative effects. For leather cotton per plant, combinations 15, 25, and 35 consistently demonstrated positive effects, while combinations 14, 17, 27, 46, 57, and 67 showed consistent negative effects. For boll weight, combinations 14, 15, 17, 23, 34, 35, 57, and 67 consistently had positive effects, whereas combinations 27, 45, 46, 47, and 56 consistently exhibited negative effects. In terms of cotton lint percentage, combinations 13, 14, 15, 23, 26, 27, 45, and 56 consistently displayed positive effects, whereas combinations 12, 17, 24, 34, 35, 36, and 46 consistently exhibited negative effects. For seed index, combinations 12, 23, 35, and 67 consistently showed positive effects, while combinations 14, 17, 37, 45, and 56 consistently had negative effects. The remaining combinations demonstrated inconsistent effects across the two years.
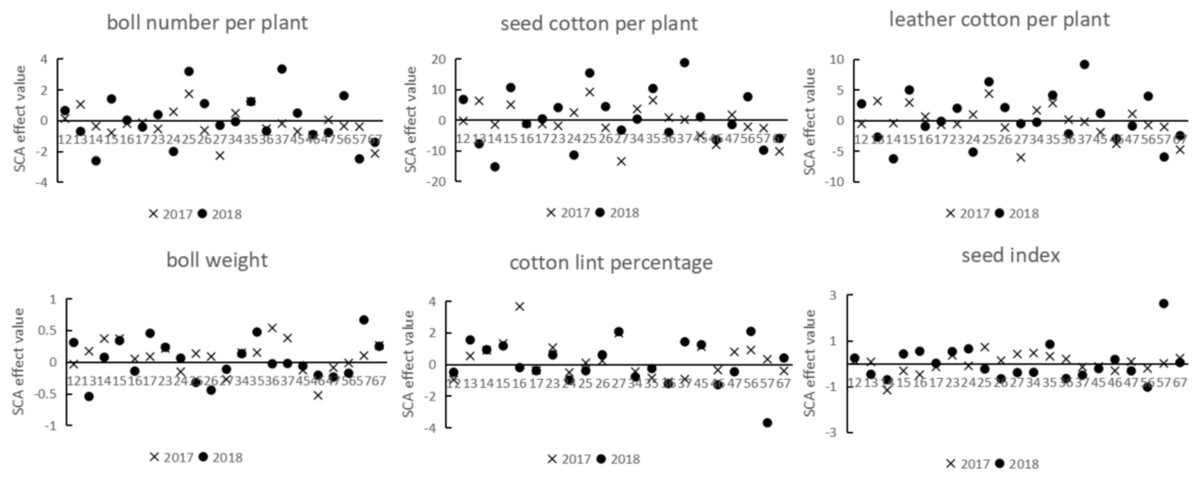
Figure 4: SCA effect values for combinations of yield traits in different years.
Stability analysis of combining ability for yield traits in parents and combinations across years
Stability analysis of GCA
The stability of GCA for seven parents over two years (2017 and 2018) was analysed using GGE biplots (Fig. 5). Parents positioned right of the vertical axis performed above the overall mean, whereas those to the left performed below average. Parents positioned closer to the horizontal axis showed greater stability, while those further away exhibited instability.
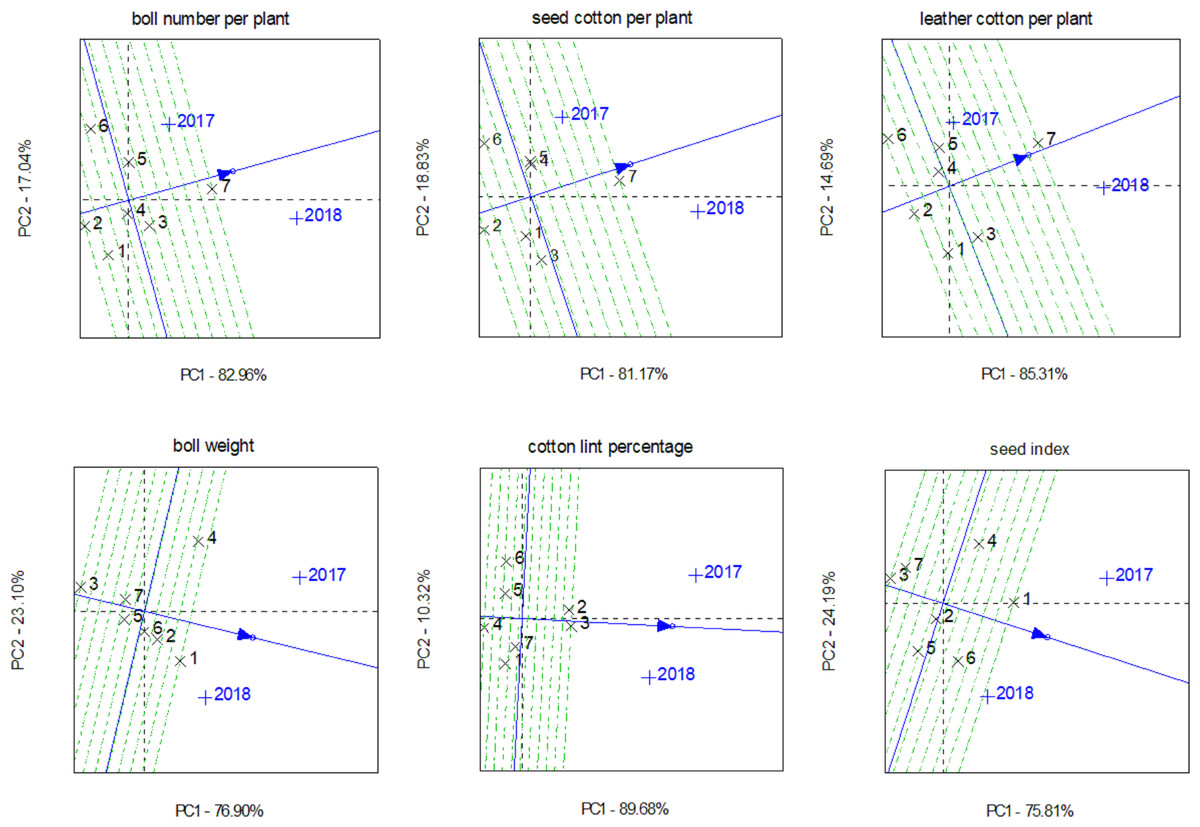
Figure 5: Analysis of GCA stability of parental yield traits in different years.
Parents 3, 5, and 7 had superior GCA for boll number per plant, with parent 7 being most stable and parents 3 and 5 less stable. For seed cotton per plant, parents 4, 5, and 7 exhibited higher GCA; parent 7 was again most stable, whereas parents 4 and 5 were comparatively unstable. Regarding leather cotton per plant, parents 3, 5, and 7 showed better GCA, with parent 7 displaying the highest stability. For boll weight, parents 1, 2, 4, and 6 had higher GCA; parents 2 and 6 showed greater stability, while parent 4 was the least stable. Parents 2 and 3 had better and stable GCA for cotton lint percentage. Parents 1, 4, and 6 exhibited better GCA for seed index, with parent 1 being most stable and parent 4 least stable.
Stability analysis of SCA
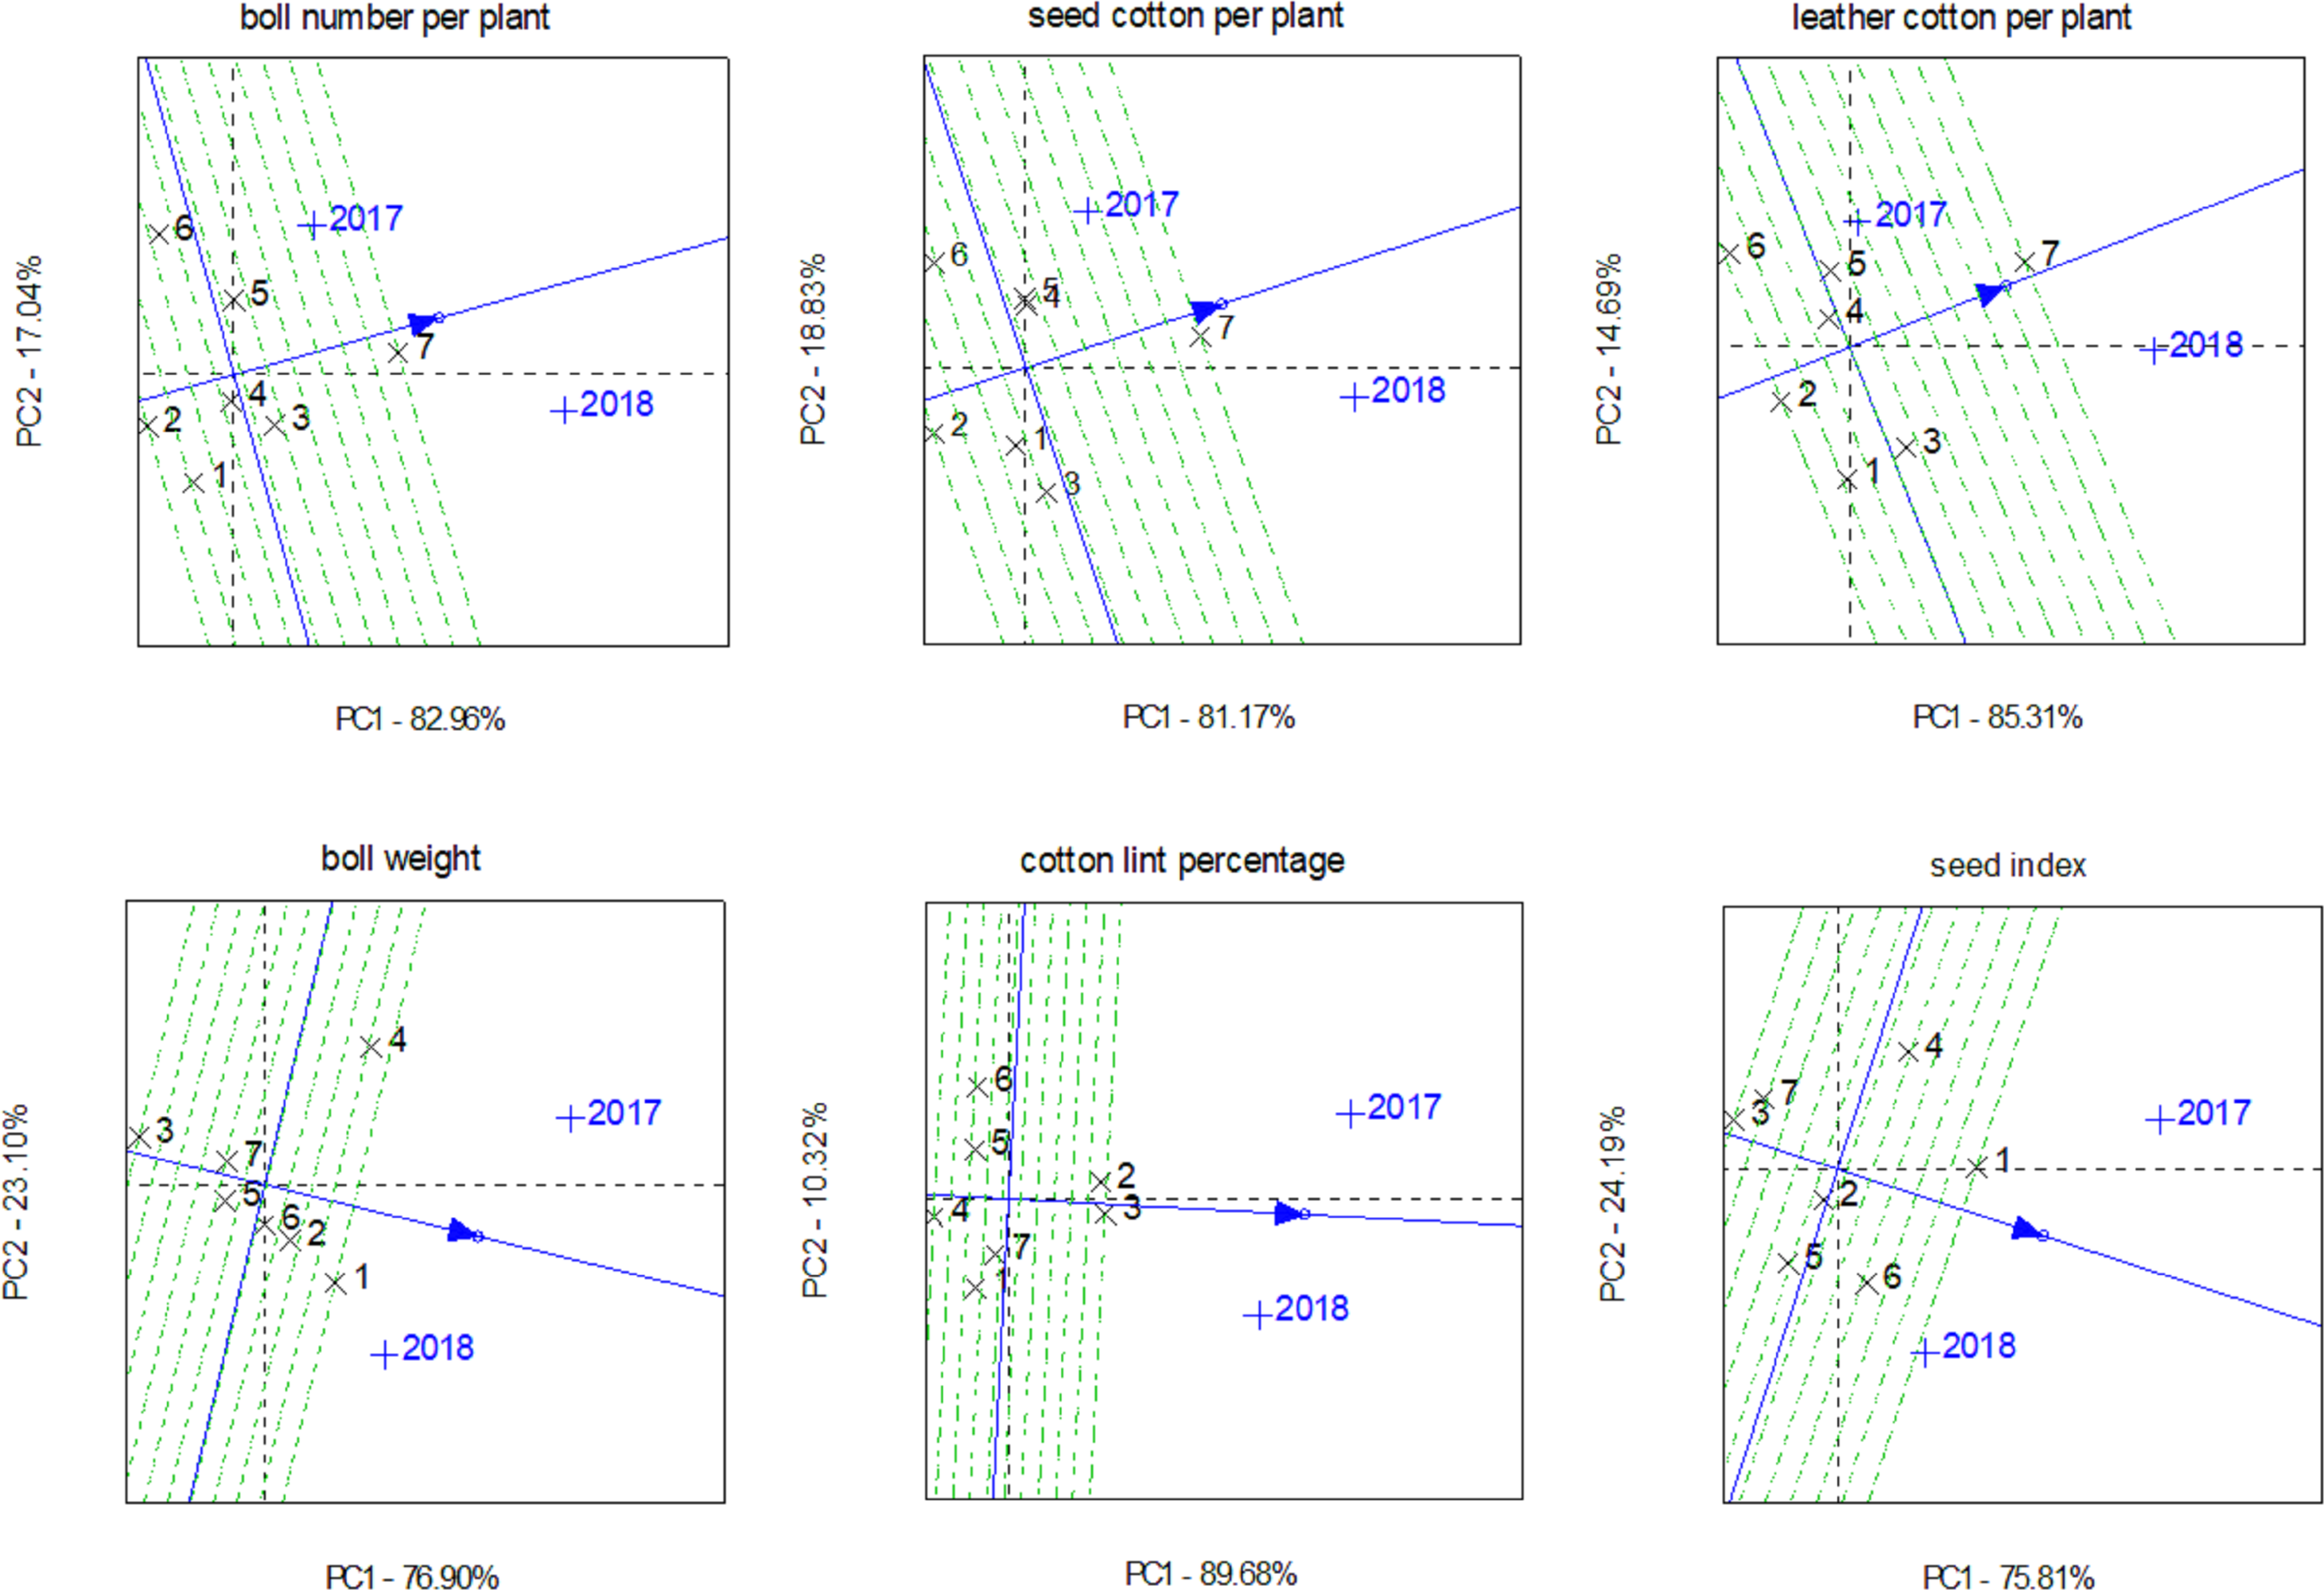
The stability of SCA for 21 combinations in both years was evaluated using GGE biplots (Fig. 6). Combinations on the right side of the vertical axis performed above the overall mean, while those on the left performed below average. Combinations nearer the horizontal axis were more stable; those further away showed less stability.
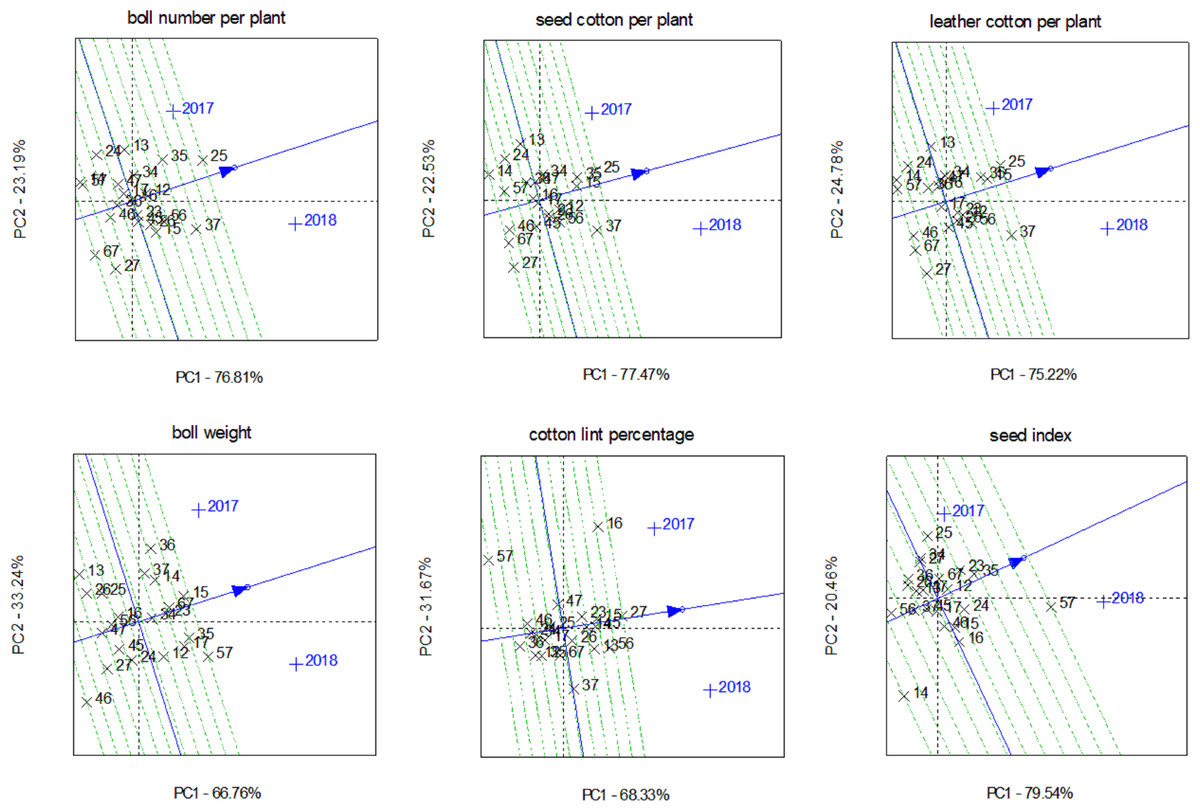
Figure 6: SCA stability analysis of yield traits of combinations in different years.
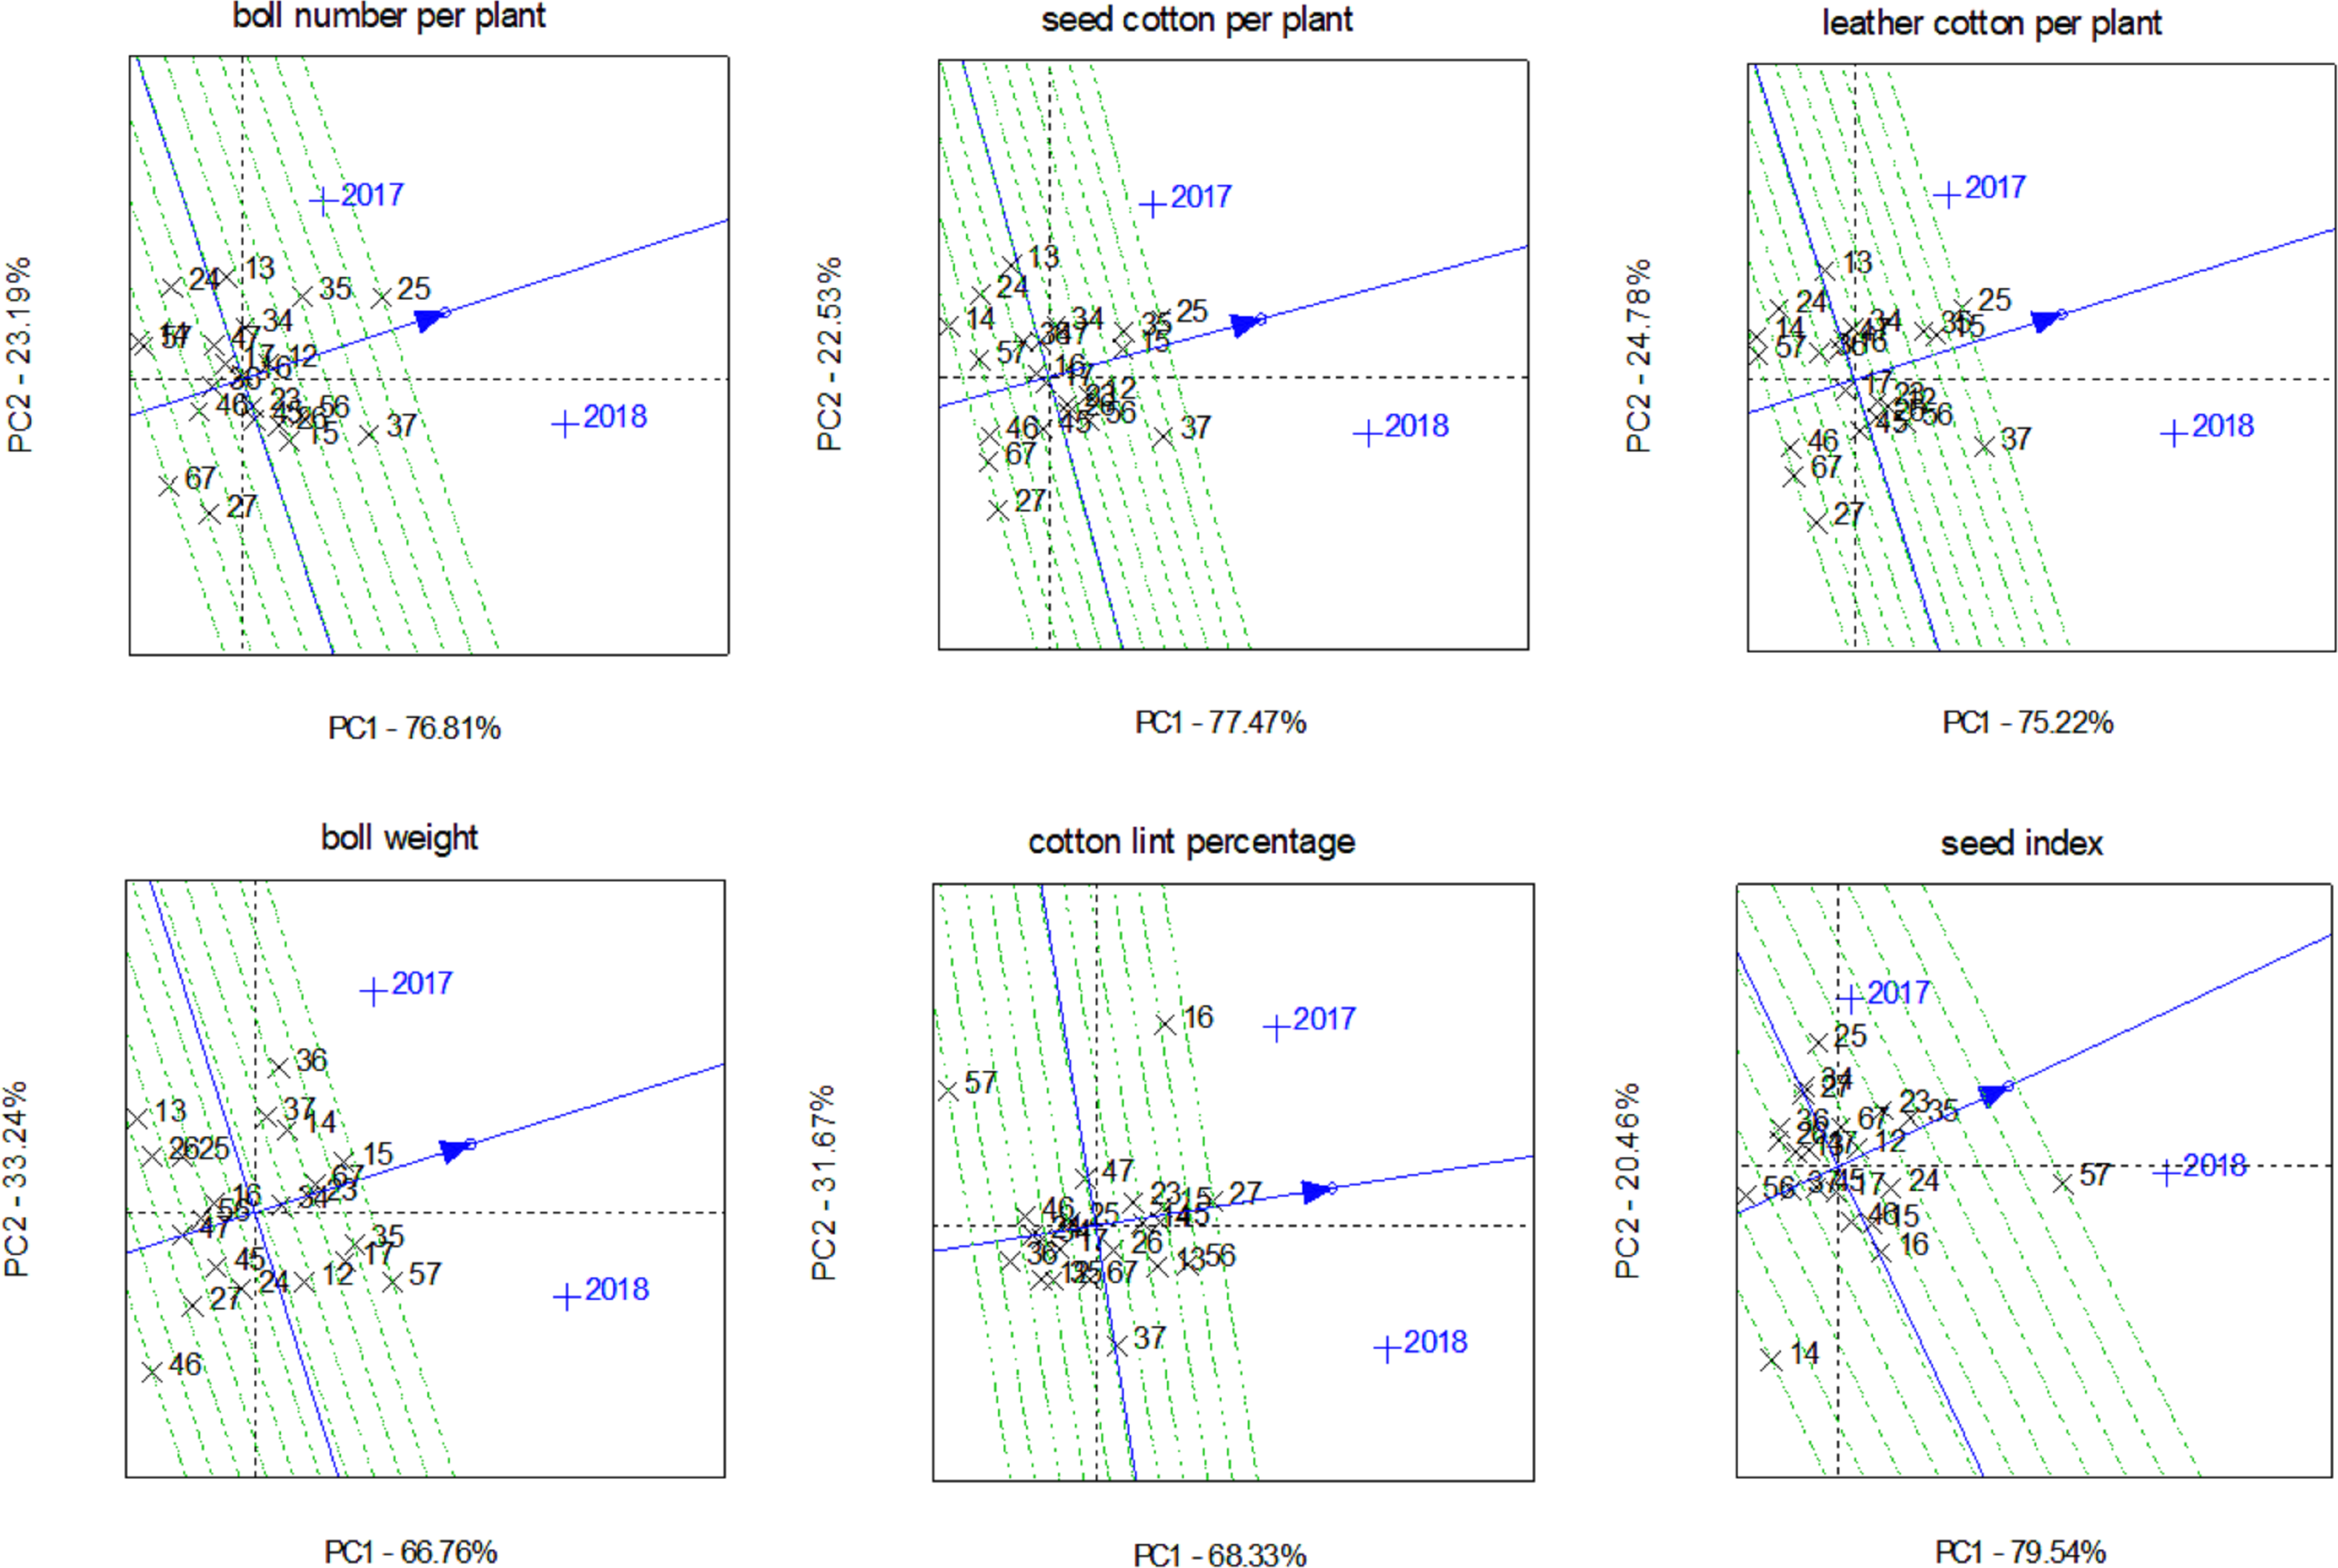
For boll number per plant, combinations 12, 13, 15, 25, 26, 34, 35, 37, and 56 exhibited higher SCA; combination 12 had the best stability, while combinations 25, 26, 34, and 56 were relatively stable. For seed cotton per plant, combinations 12, 15, 23, 25, 26, 34, 35, 37, and 56 displayed better SCA; combination 15 was most stable, and combinations 12, 23, 25, and 35 showed relatively high stability. Regarding leather cotton per plant, combinations 12, 13, 15, 23, 25, 26, 34, 35, 37, and 56 had superior SCA, with combination 15 being most stable, followed by combinations 12, 23, 25, and 35. For boll weight, combinations 12, 14, 15, 17, 23, 34, 35, 36, 37, 57, and 67 demonstrated higher SCA; combinations 23 and 34 were most stable, while combinations 15 and 67 showed moderate stability. Combinations 13, 14, 15, 16, 23, 26, 27, 45, and 56 had better SCA for cotton lint percentage; combinations 14, 15, 27, and 45 were the most stable, followed by combinations 23 and 26. For seed index, combinations 12, 15, 23, 24, 25, 35, 57, and 67 showed higher SCA; combinations 12 and 35 had the highest stability, whereas combinations 23, 24, and 67 exhibited moderate stability.
Discussion
Genotype and environmental analysis of upland cotton yield traits
Cotton yield is influenced by multiple factors. Studies by Elsamman et al. (2024) and Galdi et al. (2022) indicated that the environment is a major determinant of cotton yield. In the present study, significant or highly significant yearly differences were found in all traits except seed index, supporting previous findings. Additionally, significant or highly significant differences appeared among genotypes and in genotype-year interactions for all traits. This indicates substantial genotype effects and genotype-by-environment interactions influencing yield traits, aligning with findings by Yehia (2022) and Askander (2020).
Analysis of combining ability, correlation, and stability for yield traits across years
Environmental factors impacted traits across all parental lines, consistent with conclusions by Bhandari et al. (2021). For cotton combining ability, leather cotton per plant, seed cotton per plant, and boll number per plant exhibited significant or highly significant effects in parental GCA, hybrid SCA, and interactions involving year × parental GCA and year × hybrid SCA. In this study, correlations of SCA for six yield traits across years were generally weak. SCA showed greater stability across years compared with GCA. Traits such as leather cotton per plant, seed cotton per plant, and boll number per plant can thus serve as selection criteria for identifying superior hybrids.
Cotton yield traits were influenced by additive and dominant genetic effects. This finding is consistent with conclusions by Feng et al. (2022), Subalakhshmi et al. (2022), and Abdel-Aty et al. (2023), who reported yield traits predominantly controlled by additive effects, complemented by dominant effects. The current analysis also demonstrated significant environmental influence on all traits. Generalized heritability was highest for seed cotton per plant (70.263%) and lowest for boll weight (56.702%). These results can inform breeding programs aiming at improved cotton varieties.
Selection of superior parents and hybrid combinations
Based on GGE biplot analysis, parent 7 (Xinluzao62) demonstrated the best overall GCA performance and stability among seven parents, making it suitable for future breeding programs. Among 21 hybrid combinations, combinations 12 (cm3 × a115-11), 15 (cm3 × Xinluzhong59), 23 (a115-11 ×Xinluzhong53), 25 (a115-11 ×Xinluzhong59), 26 (a115-11 ×Lu917), 34 (Xinluzhong53 ×Xinluzhong38), 35 (Xinluzhong53 ×Xinluzhong59), and 67 (Lu917 ×Xinluzao62) exhibited superior SCA performance and stability. These combinations can undergo further regional field evaluations. If future trials confirm the findings of this study, these hybrids can be recommended for broader regional adoption.
Conclusions
Cotton yield traits differed significantly or highly significantly between years, except for the seed index, indicating a strong environmental influence. Significant or highly significant interactions occurred between genotype and genotype × year for all yield traits, suggesting substantial genotype differences and genotype-environment interactions. These findings align with those of Sharma et al. (2018). Cotton yield traits are primarily controlled by additive genetic effects, supplemented by dominant effects. Among these traits, the highest broad-sense heritability was observed for seed cotton per plant, and the lowest for boll weight. Traits including leather cotton per plant, seed cotton per plant, and boll number per plant were significant or highly significant in most hybrid combinations. Hybrid combinations exhibited greater stability in combining ability compared to parental lines across different years. In cotton breeding, seed cotton per plant could serve as the primary selection criterion, supported by leather cotton per plant and boll number per plant as auxiliary traits for selecting superior combinations. Eight combinations were identified using GGE biplots and combined analytical results: combinations 12 (cm3 × a115-11), 15 (cm3 × Xinluzhong59), 23 (a115-11 × Xinluzhong53), 25 (a115-11 × Xinluzhong59), 26 (a115-11 × Lu 917), 34 (Xinluzhong53 × Xinluzhong38), 35 (Xinluzhong53 × Xinluzhong59), and 67 (Lu917 × Xinluzao62). These combinations demonstrated stable yield traits and strong adaptability across environments. They can thus be utilized in breeding programs in different regions.
Future research should further examine the effects of additional environmental factors on cotton yield traits. Similar analytical methods can be applied to other crop species. Long-term regional trials on these eight combinations are required to confirm their broader applicability and to investigate underlying molecular mechanisms.