
Effects of land use change on ecosystem services in freshwater wetlands in Bacalar, Mexico
- Published
- Accepted
- Received
- Academic Editor
- Javier Manjarrez
- Subject Areas
- Ecology, Ecosystem Science, Environmental Impacts, Spatial and Geographic Information Science
- Keywords
- Land use change, Ecosystem services valuation, Inland wetlands, Mangroves, Bacalar Lagoon
- Copyright
- © 2025 Palafox-Juárez et al.
- Licence
- This is an open access article distributed under the terms of the Creative Commons Attribution License, which permits unrestricted use, distribution, reproduction and adaptation in any medium and for any purpose provided that it is properly attributed. For attribution, the original author(s), title, publication source (PeerJ) and either DOI or URL of the article must be cited.
- Cite this article
- 2025. Effects of land use change on ecosystem services in freshwater wetlands in Bacalar, Mexico. PeerJ 13:e18954 https://doi.org/10.7717/peerj.18954
Abstract
Wetlands, such as those in Laguna Bacalar, Mexico, are highly productive and biodiverse ecosystems that provide a wide range of invaluable ecosystem services (ES). Despite their importance, these ecosystems are under significant threat from disturbances such as land-use changes, making them among the most endangered ecosystems worldwide. This study aimed to (1) assess the spatio-temporal variation of ecosystem services in Laguna Bacalar, Mexico, between 1999 and 2021 using medium-resolution satellite imagery from the Landsat sensor; and (2) estimate the monetary value of ES losses attributable to land-use changes by applying a unit value transfer method with global value coefficients based on data from Brander et al. (2024). Twenty-two key ESs were identified and associated with mangroves, inland wetlands, and the hydrological system. A total of 277 hectares of natural ecosystems were lost, leading to a reduction in the total value flow of ecosystem services (ES), which was estimated at 10,411,098 Int$/year over the study period. The loss of inland wetlands is particularly alarming due to their critical role in filtering agrochemicals and organic matter from the watershed. Increasing pressures from human activities, including urbanization and tourism, significantly contribute to the degradation of these ecosystems. This highlights the urgent need for responsible environmental management and the implementation of conservation strategies to protect their functionality and the invaluable ecosystem services they provide to local communities.
Introduction
Ecosystem services (ES) are the features, functions, and processes of ecosystems that support and sustain human well-being (Costanza, 2020). They are defined as the direct and indirect benefits that people derive from ecosystems and are categorized into four main types: supporting, provisioning, regulating, and cultural services (MEA, 2005). In the context of the civilizational crisis and climate change, the valuation of ES has garnered significant attention in recent decades (Bateman et al., 2013) and their quantitative assessment serves as an effective tool for informing public policies aimed at ensuring their conservation (de Groot et al., 2012; Sannigrahi et al., 2019). The decline in the quality and quantity of ES is closely correlated with the type and frequency of anthropogenic activities, including deforestation, urbanization, and intensive agricultural practices, which disrupt ecosystem processes and diminish biodiversity (Costanza et al., 2014). Severely impacting ecosystem health and food production (Kovács-Hostyánszki et al., 2017; Porto et al., 2020), severely affecting ecosystem health and food production (Vanbergen & Insect Pollinators Initiative, 2013). Additionally, the reduction in vegetation cover has been shown to decrease carbon sequestration (Swangjang & Panishkan, 2021), increase erosion (Fernández-Díaz et al., 2022), and decrease biodiversity (Barbier, 2016; Shepard, Crain & Beck, 2011). These changes negatively impact the global economy and diminish the quality of life for human populations. Therefore, understanding the spatiotemporal variations of ES is crucial for identifying areas at greatest risk, prioritizing conservation efforts, and developing targeted public policies.
The concept of ecosystem services is inherently anthropocentric, with their value linked to the utility derived by humans from their consumption. In this context, it is important to distinguish between the total capacity an ecosystem service can provide, referred to as potential ecosystem services, and the portion of this capacity that is utilized, known as realized ecosystem services (Haines-Young & Potschin, 2010; Goldenberg et al., 2017). Studies that explicitly distinguish between potential and realized ecosystem services for mapping and valuation are limited in existing literature. In this context, our study focuses on potential ecosystem services, emphasizing the importance of conserving ecosystem processes beyond the realized services to ensure long-term benefits for humanity.
Wetlands are highly productive and biodiverse ecosystems, providing a wide range of ES including the regulation of biogeochemical cycles (e.g., carbon cycling), aquifer recharge, flood and drought regulation, and filtration of river runoff. Additionally, they serve as important sites for recreation and tourism (Gopal, 2013; Russi et al., 2013; Velázquez-Salazar et al., 2021). The ES provided by wetlands are valued at approximately USD 50.7 billion per year (Costanza et al., 2014); however, wetlands are fragile ecosystems that respond rapidly to disturbances, whether natural (e.g., hurricanes), or anthropogenic (e.g., land use change), which significantly affect their structure and function (Lomnicky, Herlihy & Kaufmann, 2019) and increasing their vulnerability (Bhowmik, 2019). Globally, wetlands are among the most threatened ecosystems, with an estimated 87% having undergone land-use changes or been dredged or filled to support agriculture, urban expansion, and tourism (Clarkson, Ausseil & Gerbeaux, 2013; Davidson, 2014; Yan et al., 2023).
The situation of wetlands in Mexico is worrying. Despite being one of the countries with the largest wetland coverage globally—accounting for 6.7% of the world’s mangrove coverage—and having robust conservation legislation, these ecosystems continue to be degraded by anthropogenic activities (Clarkson, Ausseil & Gerbeaux, 2013; Davidson & Finlayson, 2019; Russi et al., 2013). The state of Quintana Roo, located in the Mexican Caribbean, is one of the world’s leading tourist destinations. Since the 1970s, this status has driven the development of large-scale infrastructure projects, such as Cancun and the Riviera Maya (Espinosa Coria, 2013; Gómez Pech, Barrasa García & García de Fuentes, 2018). Tourism driven by Quintana Roo’s natural attractions is among the most economically impactful activities in Mexico, contributing 23% to the national tourism gross domestic product (GDP) in 2022 (INEGI, 2023). However, the transformation of natural ecosystems through land use change has resulted in the decline and loss of ES associated with coastal dunes, wetlands, forests, and biodiversity (Ellis, Romero Montero & Hernández Gómez, 2017; Huchin Ochoa et al., 2022; Teutli-Hernández et al., 2024). In 2006, a campaign was initiated to promote tourism in southern Quintana Roo, centered around Bacalar Lagoon, also known as the ‘Lagoon of the Seven Colours’ (Gómez Pech, Barrasa García & García de Fuentes, 2018; Secretary of Tourism of the Government of Mexico (SECTUR), 2014). However, it was not until 2015, with the massive arrival of sargassum to the coasts of Quintana Roo (Uribe-Martínez et al., 2022), that Laguna Bacalar emerged as a viable option to diversify tourism and attract investment in the region. This development resulted in a remarkable surge in visitor numbers, increasing by up to 750% compared to previous years (INEGI, 2023). This surge in visitor numbers led to the development of infrastructure to meet the growing demand for tourism services and support the local population, jeopardizing the natural landscapes and the ecological integrity of Bacalar Lagoon (Gómez Pech, Barrasa García & García de Fuentes, 2018; Secretary of Tourism of the Government of Mexico (SECTUR), 2005, 2014).
Bacalar Lagoon, renowned for its vibrant colors, experienced a mesotrophic process in the mid-2020s due to excessive nutrients and pollutants inputs from adjacent agricultural areas, triggered by an extreme rainfall event (Álvarez-Legorreta, 2025). These impacts have far-reaching implications, including a significant mortality event in the populations of Pomacea flagellata snail (De Jesús-Navarrete et al., 2019; De Jesús-Navarrete, 2025). Additionally, the loss of Bacalar Lagoon’s distinctive colors could adversely affect tourism activities, thereby impacting the region’s economy (Torrescano-Valle et al., 2025). This suggests that processes occurring in the upper watershed, such as land use change for agriculture and deforestation (Ellis et al., 2020; Huchin Ochoa et al., 2022), as well as the development of urban and tourism infrastructure along the lagoon coast (Palafox-Juárez et al., 2022) significantly impact lagoon ecosystems, highlighting their high connectivity and fragility. Economic valuation studies for the region are scarce and primarily focus on the cultural ES perceived in ecosystems of tourist interest. Notable examples include the reefs of the Mesoamerican Reef System (Ruiz de Gauna et al., 2021), mangroves and reefs in the north of the state (Cortés-Gómez, Cervantes-Martínez & Arce-Ibarra, 2023; Sánchez-Quinto et al., 2020) Mayan jungle landscape (Alpuche-Álvarez et al., 2019) and sinkholes (May-Arias, Arroyo Arcos & Hernández Aguilar, 2024). However, no estimates of ES valuation exist for the Bacalar region, despite their critical importance for developing management and conservation strategies for fragile ecosystems like the wetlands of Laguna Bacalar.
In recent decades, advancements in satellite information accessibility and computational resources have positioned remote sensing as a powerful tool for assessing ES (Davidson & Finlayson, 2018; Long et al., 2022). Currently, a wealth of historical satellite data is available at different spatial, spectral, and temporal resolutions, enabling the mapping and monitoring of ES supply and demand (Burkhard et al., 2009; Fu et al., 2014; Long et al., 2022), especially in regions with limited funding for ES evaluation (Johnston & Wainger, 2015). In this context, various approaches have been developed to assign monetary values to ES using satellite imagery, further supporting the argument that biodiversity conservation generates significant benefits (Brander, 2013; Richardson et al., 2015; Wong et al., 2015). In this case, remote sensing combined with the benefit transfer method, also known as the value transfer method, has been extensively employed to assess ES across various locations and scales. This facilitates the transfer of results from existing valuation studies to other areas with comparable ecosystems and beneficiaries, significantly reducing both time and costs (Plummer, 2009; Mendoza-González et al., 2012; Wong et al., 2015; Fernández-Díaz et al., 2022).
In this context, this study aimed to: (1) compare the spatiotemporal variation of potential ecosystem services in Laguna Bacalar, Mexico, for 2 years (1999 and 2021), using medium-resolution satellite imagery from the Landsat sensor; and (2) estimate the economic value of ecosystem services lost due to land-use changes through a unit value transfer analysis, incorporating The Economics of Ecosystems & Biodiversity (2010) methodologies and the monetary estimates proposed by Brander et al. (2024).
Materials and Methods
Study area
The “Bahía de Chetumal y otras” watershed covered an area of 757,465 hectares and extended across the states of Campeche and Quintana Roo. This exoreic basin, with elevations ranging from 0 to 190 m above sea level (INEGI, 2010), is characterized by Rendzina, Litosol, and Gleysol soil, which rested on a limestone plateau composed of calcite, dolomite, and gypsum. The highly permeable subsurface facilitated substantial groundwater flow, which supported the formation of cenotes and freshwater lakes (Bautista et al., 2011).
The predominant vegetation consisted of medium and low tropical forests, grasslands, and agricultural lands. However, land-use changes driven by urbanization, agriculture, and livestock farming resulted in significant ecosystem loss. In the municipality of Bacalar alone, an estimated 76,000 hectares of forests and wetlands were lost over the past 27 years, primarily due to agricultural, livestock, and tourism expansion (Miranda, 1958; Comisión Nacional Forestal (CONAFOR), 2018; INEGI, 2023; Huchin Ochoa et al., 2022).
The lagoon system in southern Quintana Roo originated from a series of geological fractures that shaped the region’s hydrology. This system included the Río Hondo, which forms the border with Belize, and six interconnected freshwater lagoons: San Felipe, Guerrero, Chile Verde, Milagros, Bacalar, and the Bahía de Chetumal. These water bodies are interconnected through surface and subterranean flows via channels and runoff, ultimately discharging into the Caribbean Sea (Rebolledo-Vieyra, 2009; Hernández-Arana et al., 2015; Torrescano-Valle et al., 2025).
Bacalar Lagoon, situated in the central part of this watershed, is the largest freshwater body of the Yucatan Peninsula and hosts one of the world’s most significant regions of stromatolites (microbial reefs formed by cyanobacterial activity) (Yanez-Montalvo et al., 2020). Additionally, several types of wetlands are distributed along its coastline (Hernández-Arana et al., 2015; Palafox-Juárez et al., 2022). The lagoon featured a main body of water, interconnected channels, and dolines. It was characterized by a narrow, elongated shape, extending to 53 km in length, with a variable width ranging from 20 m and 2 km, and an average depth of the lagoon was 9 m, with dolines reaching a maximum depth of 60 m (Carrillo et al., 2024) (Fig. 1).
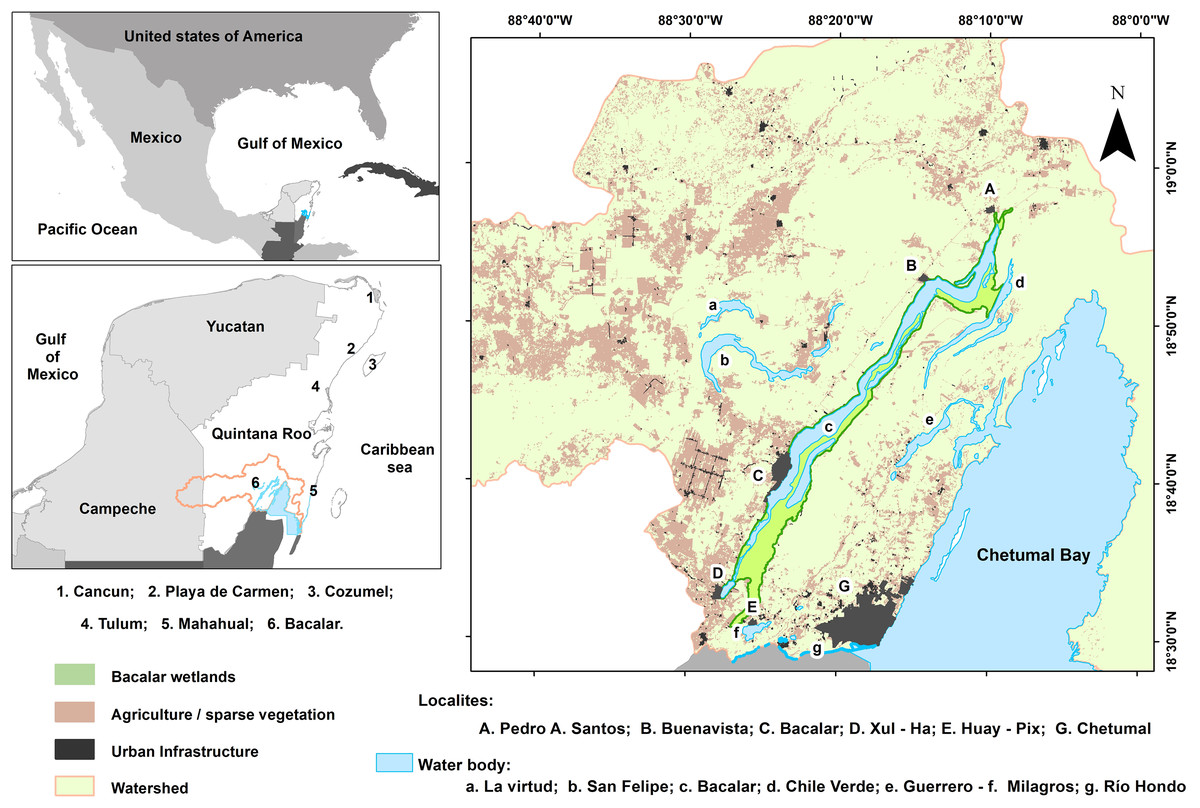
Figure 1: Study area location.
Numbers represent the leading tourist destination on Quintana Roo. The distribution of the Bacalar wetlands is shown in green. Capital letters correspond to the main human settlements, and lowercase letters list the water bodies associated with the Bacalar Lagoon.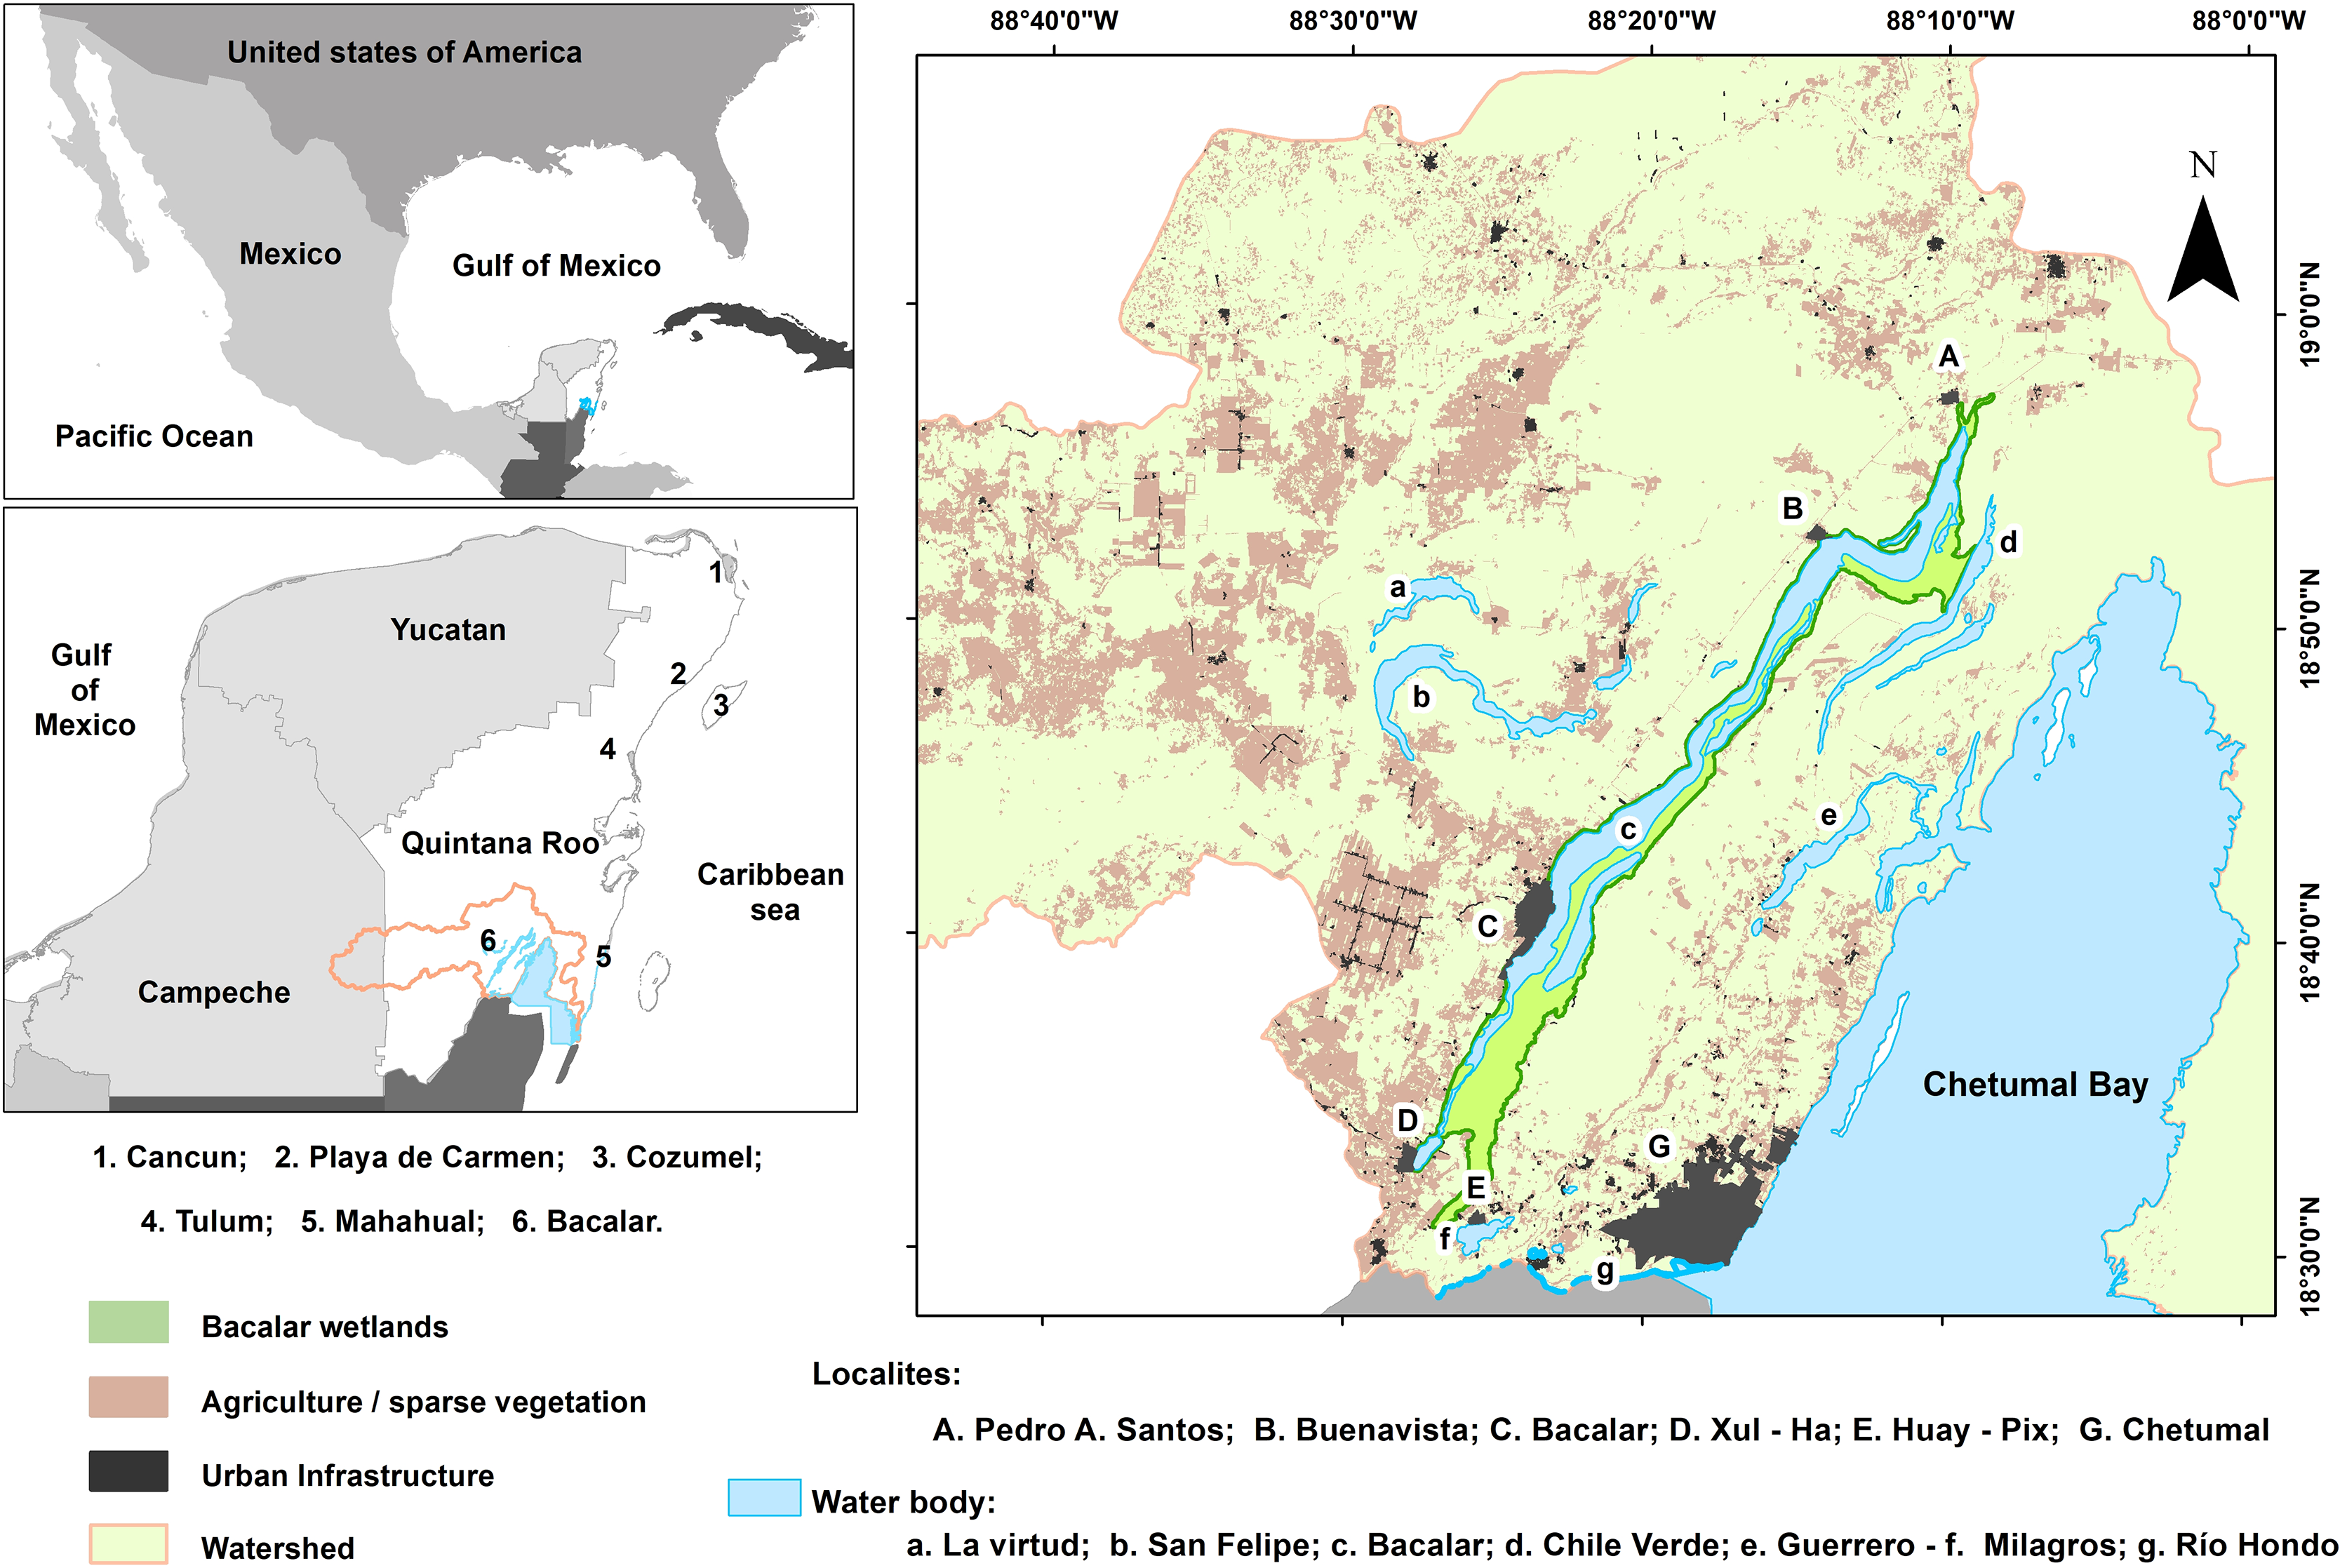
Characterization of the ecosystems of Bacalar Lagoon
The ecosystems of Laguna Bacalar, as detailed by Palafox-Juárez et al. (2022) were classified categorized following the approach of The Economics of Ecosystems & Biodiversity (2010) and Brander et al. (2024), which are described as: (1) Mangrove vegetation in flood zones with silty-sandy soil enriched with organic material residues. The dominant vegetation consists of dwarf red mangrove (Rhizophora mangle), accompanied by smaller proportion of species such as Conocarpus erectus, Morella cerifera, and Bonellia macrocarpa sp., as well as Carex sp. (2) Inland wetlands, mainly distributed along the lagoon’s western shore, are characterized by rocky soil with slopes of lees than <45°, and surface water inputs. The characteristic vegetation includes species such as Bucida buceras, Ficus sp., Coccoloba uvifera, R. mangle, C. erectus, Metopium brownei, Cordia dodecandra, Lysiloma latisiliquum, Thrinax radiata, and Acoelorraphe wrightii. (3) Water (Lakes and rivers) forms the matrix that connects the surrounding ecosystems through complex hydrodynamic processes.
Image acquisition and pre-processing
Ortho-rectified images were acquired from Landsat 5 TM and 9 OLI-2; TIRS-2 sensors (USGS; https://earthexplorer.usgs.gov) (Table 1). The spectral and spatial resolution of the images varied between sensors. Landsat 5 TM provided seven bands with a spatial resolution of 30 m, including one thermal band with 120 m resolution, whereas Landsat 9 offered bands with 30 m spatial resolution (OLI-2), two thermal bands with 100 m (TIRS-2), and one panchromatic band with 15 m resolution (Table 2). Images from February 1999 and October 2021 were selected due to their minimal cloudy cover and the presence of sufficiently green vegetation.
| ID | Image name | Path | Row | Year | Month | Day |
|---|---|---|---|---|---|---|
| 1 | LT05_L2SP_019047_19990222_20240112_02_T1 | 19 | 47 | 1999 | 2 | 22 |
| 2 | LC09_L2SP_019047_20211031_20230507_02_T1 | 19 | 47 | 2021 | 10 | 31 |
| Sensor | Band | Name | Resolution (m) | Wavelength (nm) |
|---|---|---|---|---|
| Landsat 5 TM | B01 | Blue | 30 | 0.45–0.52 |
| B02 | Green | 30 | 520–600 | |
| B03 | Red | 30 | 630–690 | |
| B04 | NIR | 30 | 760–900 | |
| B05 | SWIR 1 | 30 | 1,550–1,750 | |
| B06 | Thermal | 120 | 10.40–12.50 | |
| B07 | Mid-Infrared | 30 | 2.80–2.35 | |
| Landsat 9 OLI-2; TIRS-2 | B01 | Costal/Aerosol | 30 | 433–453 |
| B02 | Blue | 30 | 450–515 | |
| B03 | Green | 30 | 525–600 | |
| B04 | Red | 30 | 630–680 | |
| B05 | NIR | 30 | 845–885 | |
| B06 | SWIR 1 | 30 | 1,560–1,660 | |
| B07 | SWIR 2 | 30 | 2,100–2,300 | |
| B08 | PAN | 15 | 500–680 | |
| B09 | Cirrus | 30 | 1,360–1,390 | |
| B10 | TIRS 1 | 100 | 10,300–11,300 | |
| B11 | TIRS 2 | 100 | 11,500–12,500 |
Supervised classification was conducted using the blue, green, red, NIR, and SWIR 1 bands from Landsat 5, as well as the SWIR 2 band from Landsat 9. All selected bands had a uniform spatial resolution. To mitigate atmospheric scattering effects, each image underwent radiometric and atmospheric correction following the methodology of Chuvieco & Huete (2009), using the Fast Line of Sight Atmospheric Analysis of Spectral Hypercubes (FLAASH) in ENVI 5.4 software (Harris Geospatial Solutions, 2016).
Data field of regions of interest and supervised classification of Bacalar Lagoon
Based on the ecosystems identified in Laguna Bacalar, regions of interest (ROIs) were delineated using the following approaches: (i) field visits, supplemented by the empirical knowledge of local inhabitants to identify inland wetland zones, and (ii) analysis of imagery from the Google Earth satellite viewer. Finally, a total of 312 regions of interest (ROIs) were established and distributed as follows: mangrove vegetation (139), inland wetlands (49), and water (91). Additionally, to assess the expansion of human activities, ROIs were assigned to a fourth category termed ‘human-modified’ (34). Each training site was georeferenced using a Garmin 62S global positioning system (GPS) with a positional error of approximately 1 m. Supervised classifications were conducted on Landsat 5 TM (1999) and Landsat 9 OLI-2/TIRS-2 (2021) images using the maximum likelihood algorithm, which assigns pixels to classes based on the highest probability of association (Chuvieco & Huete, 2009; Taylor, Kumar & Reid, 2011). The analyses were performed in R software (R Core Team, 2021).
To assess map uncertainty, a cross-validation was conducted following the methodology proposed by Olofsson et al. (2014). This involved utilizing a high-resolution Sentinel-2 image and generating 140 points through stratified random sampling
Monetary estimation of the ecosystem services of Laguna Bacalar
To estimate the changes in the value of ES provided by Bacalar’s ecosystems from 1999 and 2021, a Unit Value Transfer analysis was conducted, using Eq. (1) (Troy & Wilson, 2006). The monetary estimates proposed by Brander et al. (2024) for mangroves, inland wetlands, and lakes and rivers, were employed as baseline reference values. These values were subsequently multiplied by the surface area (ha) of each ecosystem type identified in Laguna Bacalar for 1999 and 2021.
(1) where A(LUi) = area of wetland type (i) and V(ESki) = annual value per unit area for the type of ecosystem service (k) generated by wetland type (i).
Results
Image classification and validation of cover class
Figure 2 illustrates the spatial distribution of the ecosystems analyzed, along with the human-modified class, for 1999 and 2021. The ecosystems with the highest spatial representation in Laguna Bacalar were observed to be the mangrove and water ecosystems, collectively accounting for approximately 95% of the total area studied, followed by inland wetlands and the human-modified class (Table 3). The supervised classification achieved an overall map accuracy of 92.2% when compared to the reference data. Furthermore, the ecosystem-specific validation based on the methodology of Olofsson et al. (2014) indicated that the mangrove ecosystem was the most accurately classified, whereas the human-modified class exhibited the lowest classification accuracy (Table 4).

Figure 2: Cover of mangroves, Inland wetlands, and Lakes & Rivers in Bacalar from 1999 and 2021.
| Land use/Land cover | User’s accuracy | Producer’s accuracy | Overall’s accuracy |
|---|---|---|---|
| Lakes & rivers | 86.11 (±0.0576) | 88.57 (±0.0538) | 92.186 (±0.0227) |
| Mangrove | 91.66 (±0.0461) | 94.28 (±0.0392) | |
| Inland wetlands | 80 (±0.0676) | 80 (±0.0676) | |
| Human-Modified | 78.787 (±0.0712) | 74.28 (±0.0739) |
| Land cover/Land use | 1999 | 2021 | Change | |||
|---|---|---|---|---|---|---|
| ha | % | ha | % | ha | % | |
| Lakes & rivers | 7,474.1 | 50.2 | 7,469.1 | 50.2 | −5.0 | −0.0 |
| Mangroves | 6,720.7 | 45.1 | 6,690.3 | 44.9 | −29.4 | −0.2 |
| Inland wetlands | 546.2 | 3.7 | 303.8 | 2.0 | −242.4 | −1.6 |
| Human-Modified | 147.7 | 1.0 | 424.6 | 2.9 | 276.9 | 1.9 |
| Total | 14,887.7 | 100 | 1487.7 | 100 | ||
Land cover changes (1999–2021)
From 1999 and 2021, 29 ha of mangrove and 242 ha of inland wetlands were lost, primarily corresponding to an increase of 277 ha modified for urban and tourist infrastructure along the west coast. Additionally, there was a reduction of 5 ha in lakes and rivers (Fig. 2).
Analysis of the spatiotemporal variation of ecosystem services
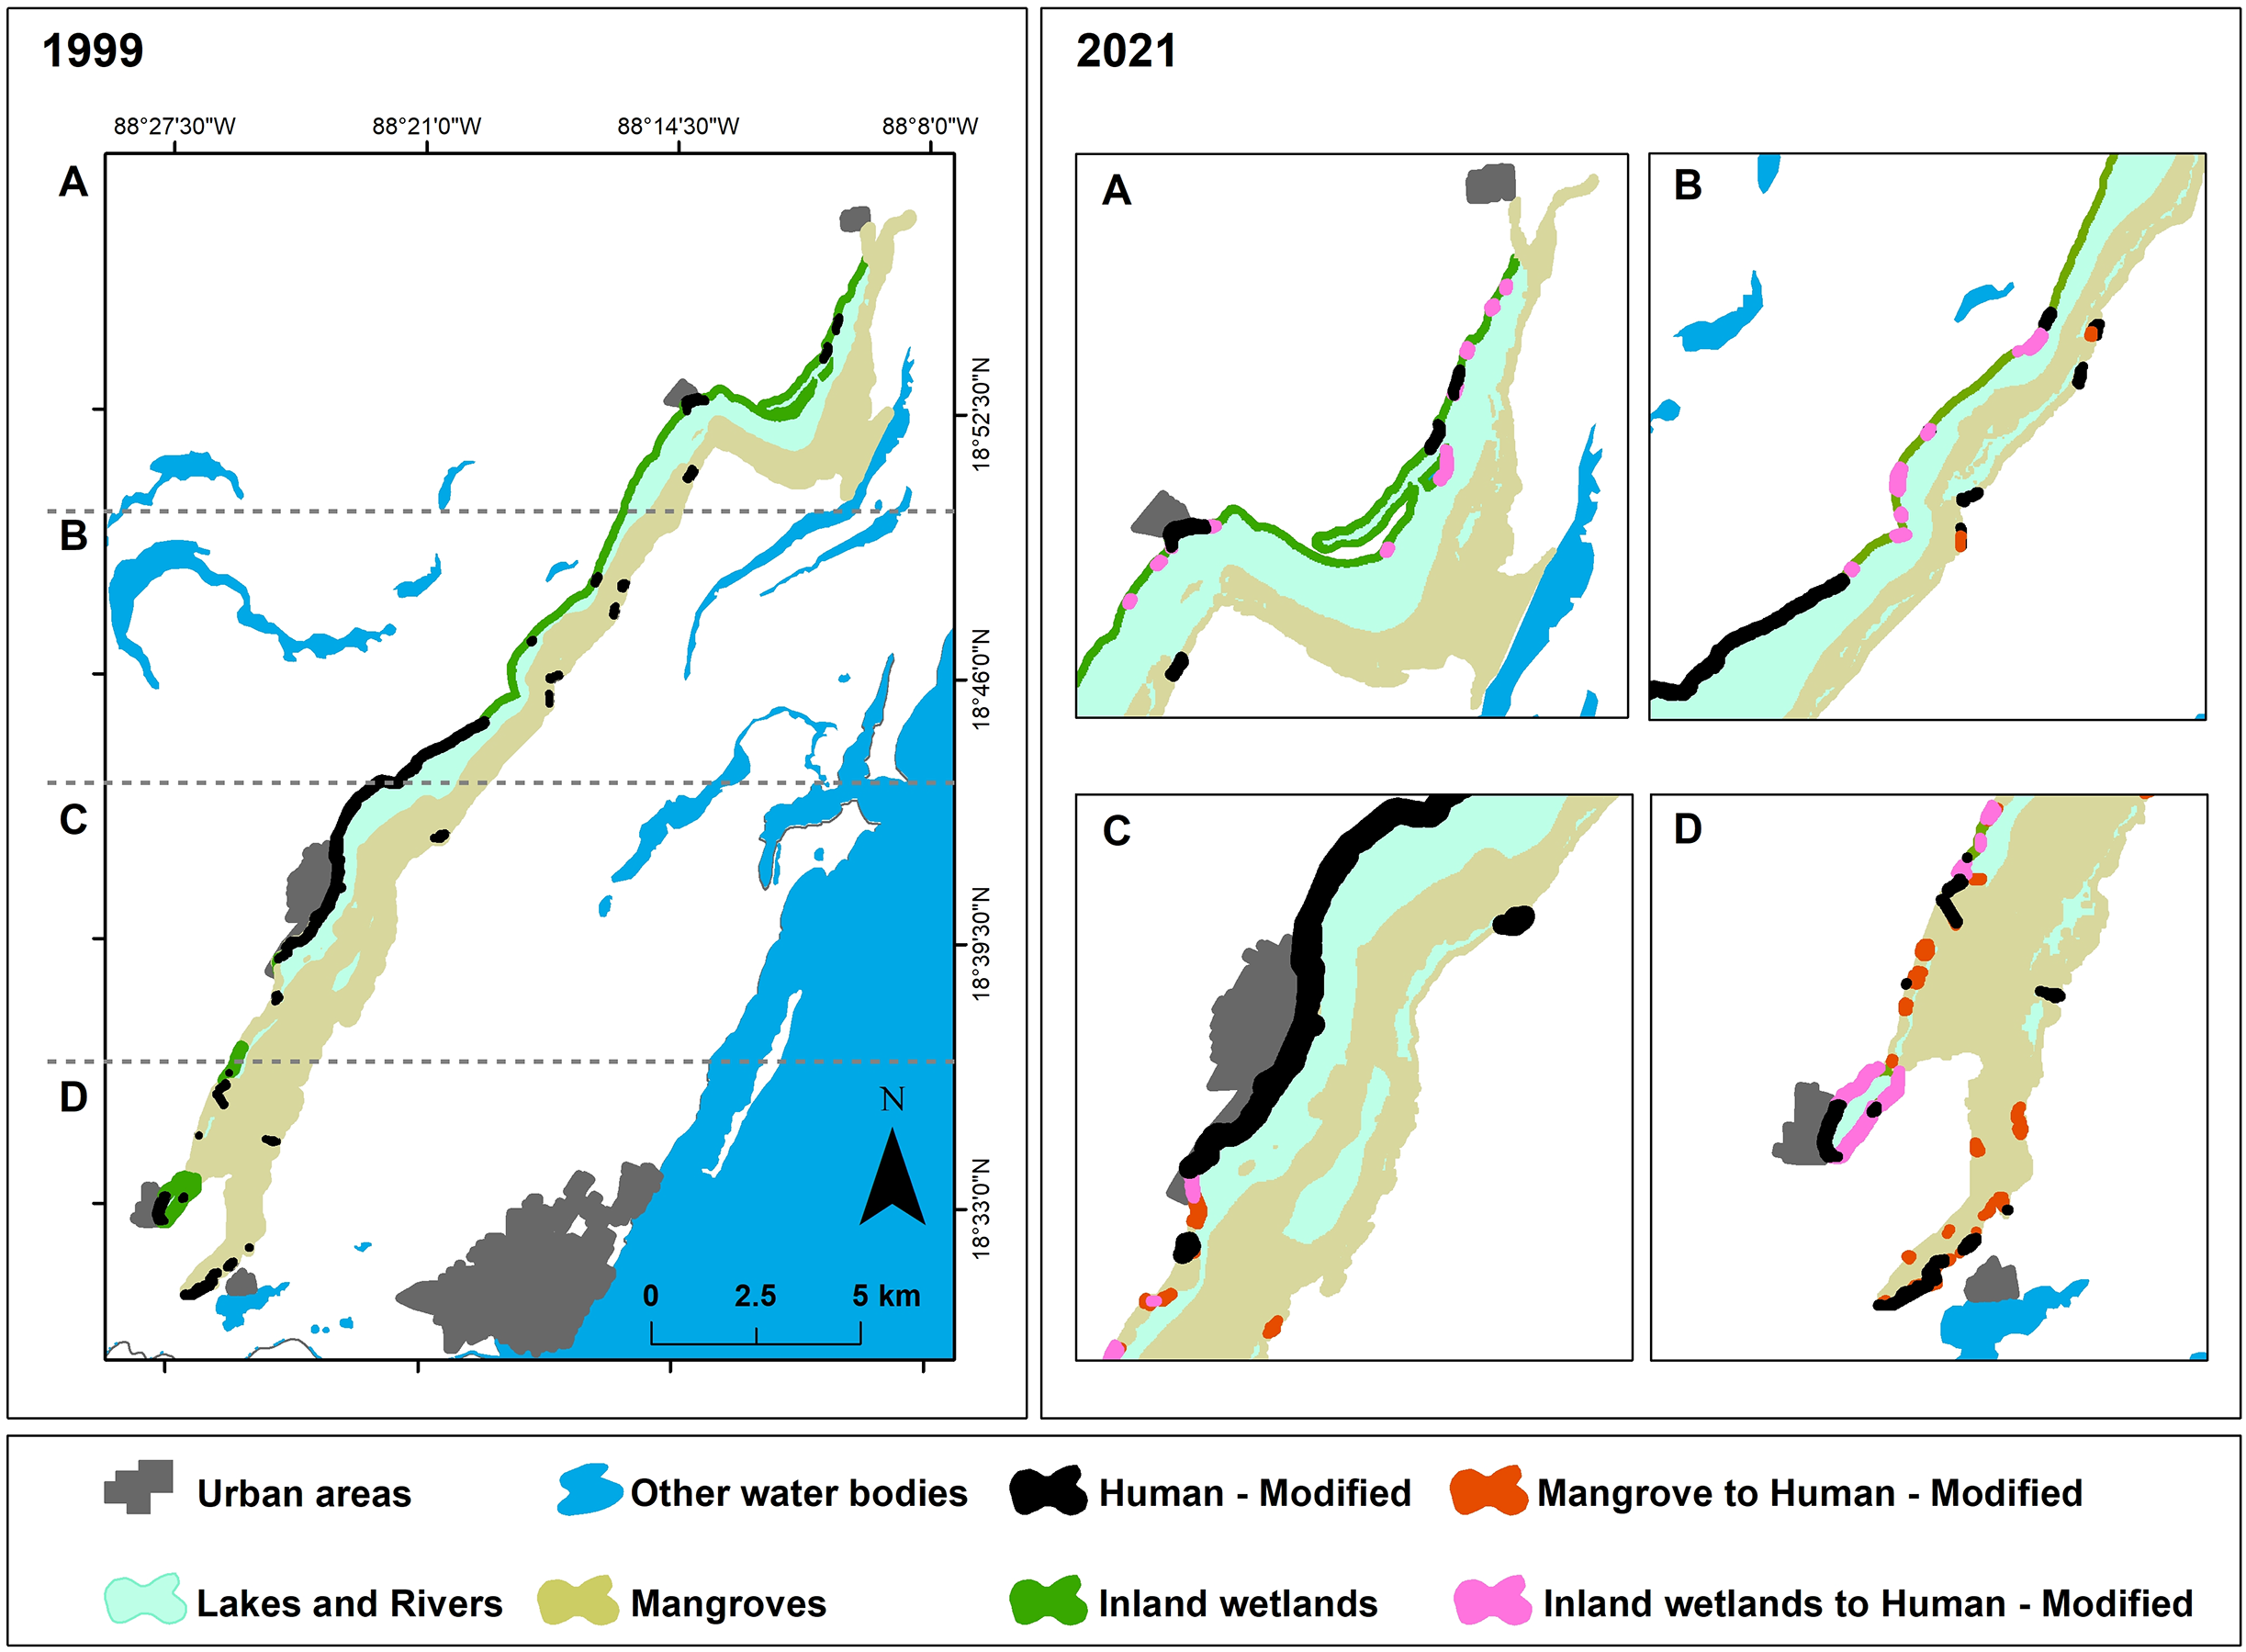
Of the 22 ecosystem services provided by ecosystems globally (The Economics of Ecosystems & Biodiversity, 2010; Brander et al., 2024), the mangroves, inland wetlands, and lakes and rivers in Bacalar provide four provisioning, seven regulating, two supporting, and six cultural ES (Fig. 3). Based on the results obtained, from 1999 to 2021, 277 ha of natural ecosystems were modified, resulting in an overall decrease in the value of ecosystem services amounting to 10,411,098 Int$/year (Fig. 4, Tables 5–7).
Figure 3: ES provided by Bacalar ecosystems based on The Economics of Ecosystems & Biodiversity (2010) and Brander et al. (2024).
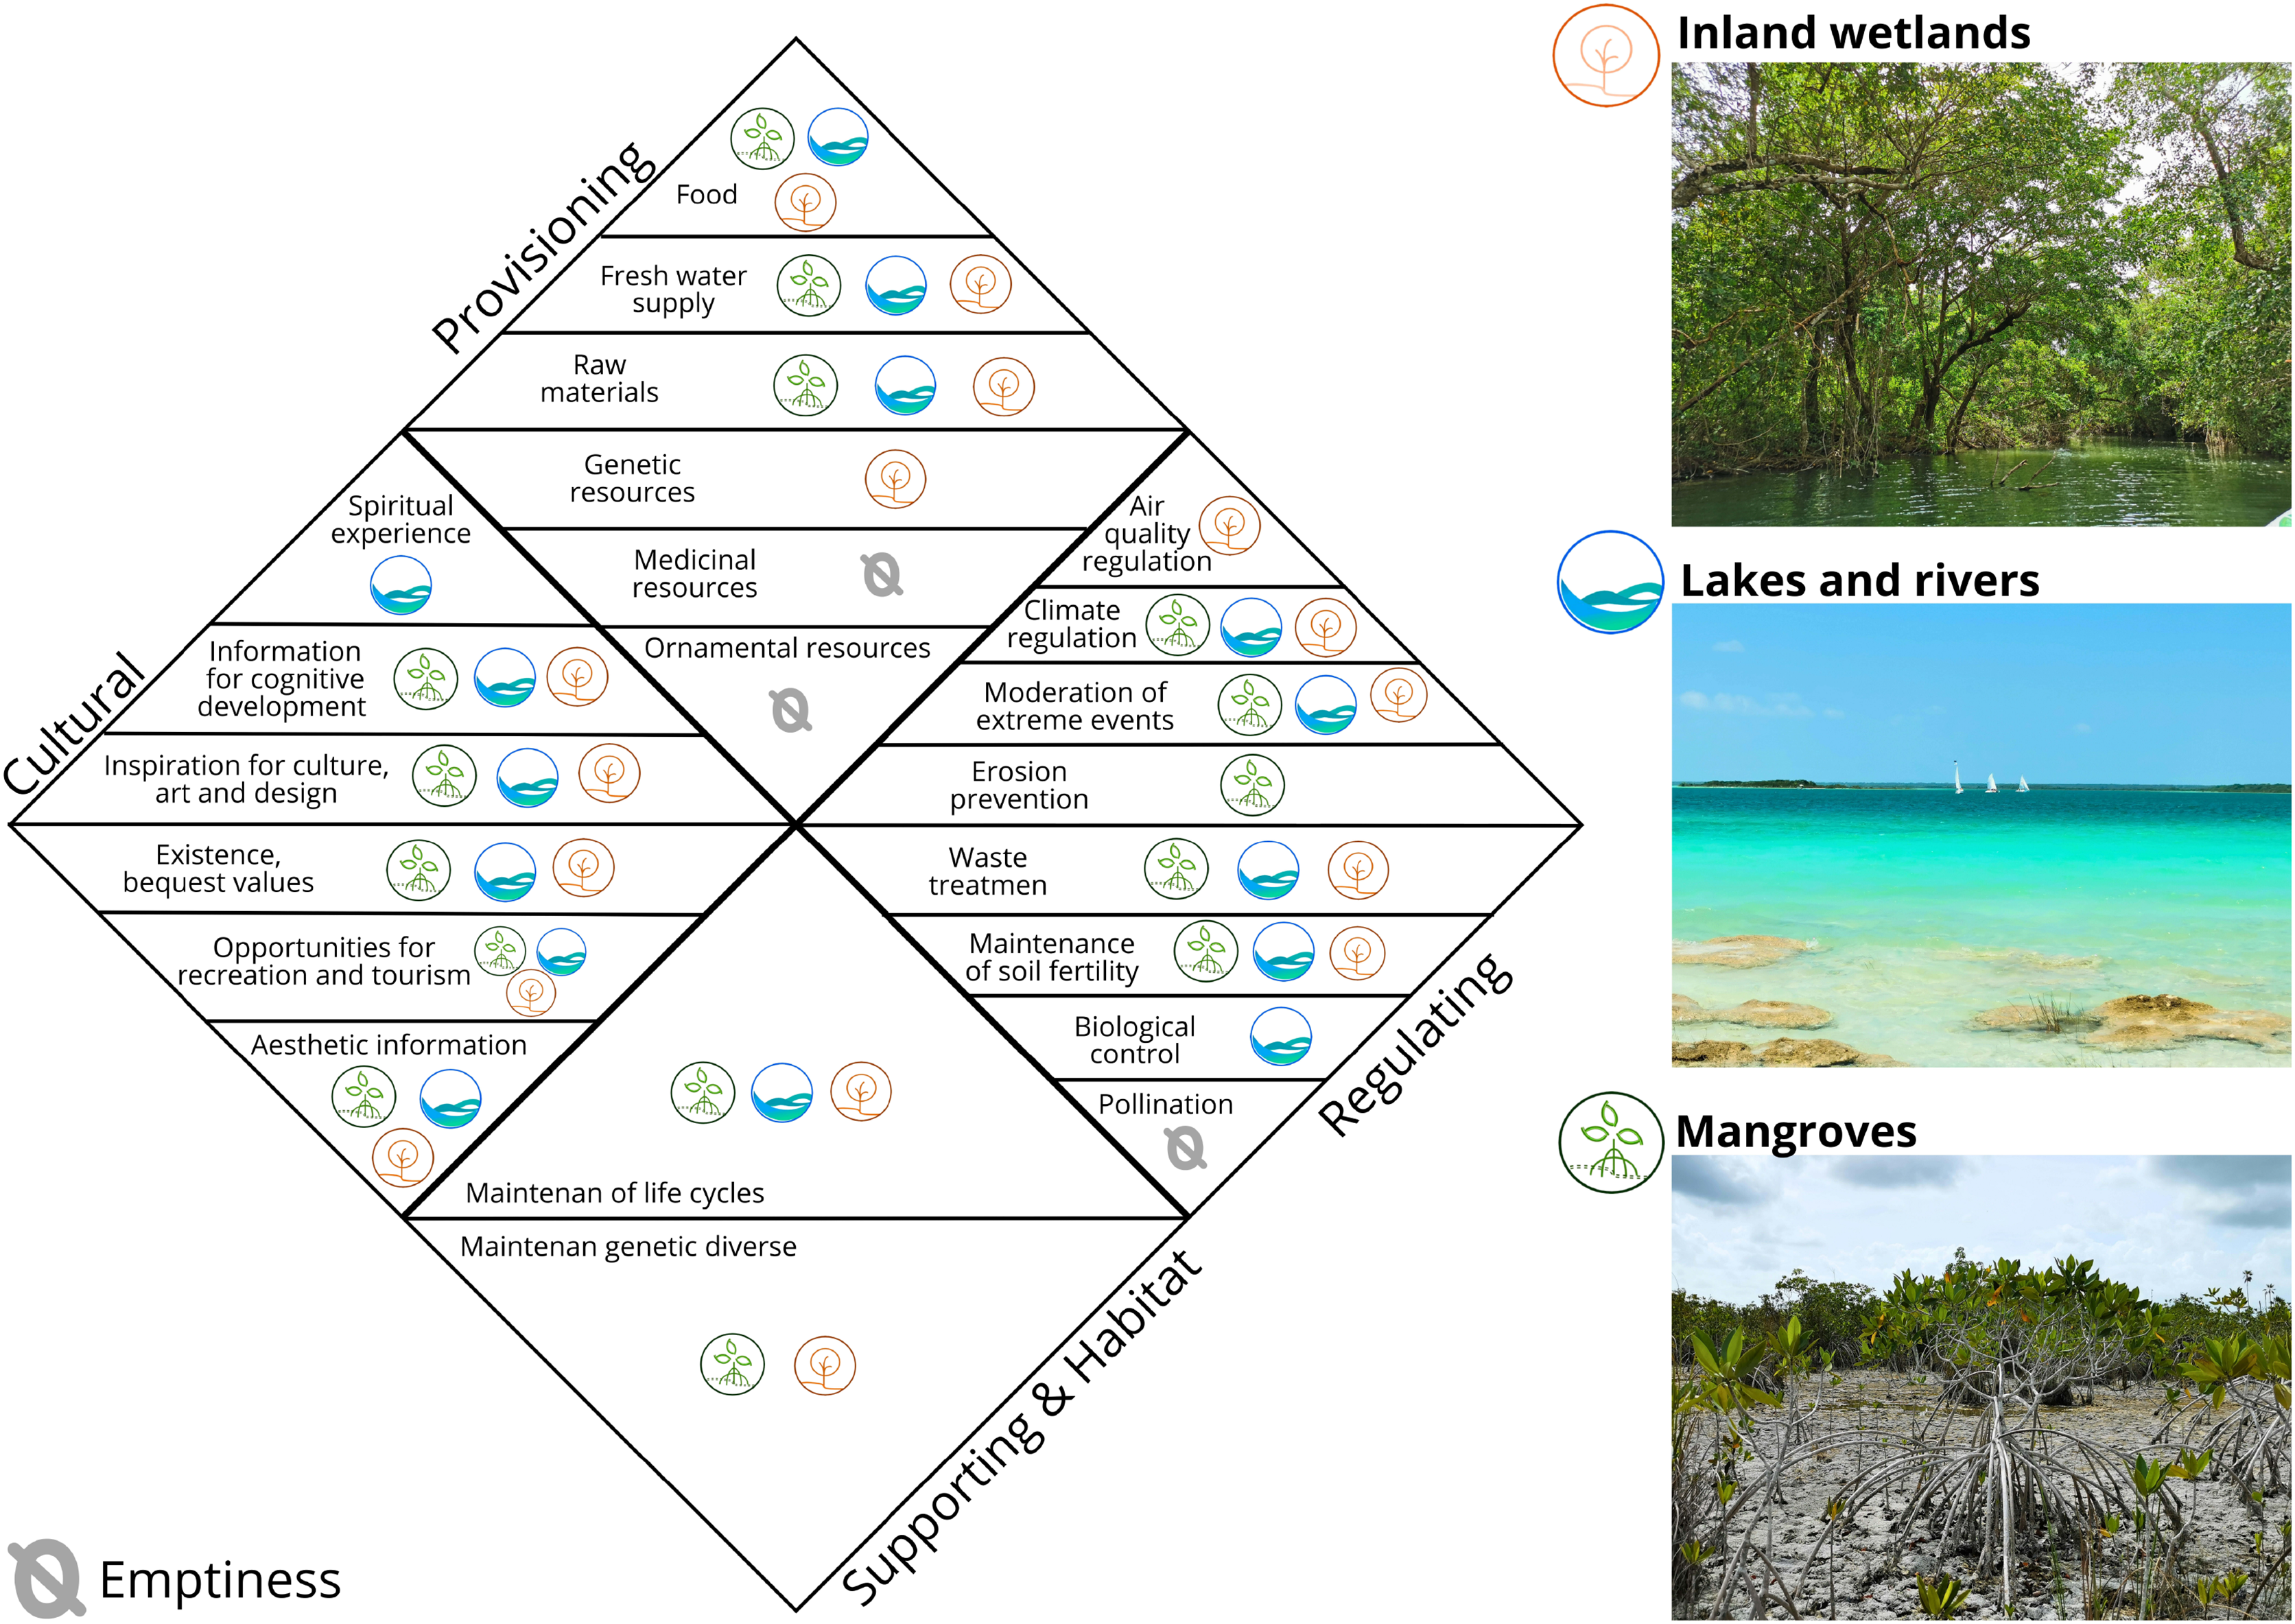
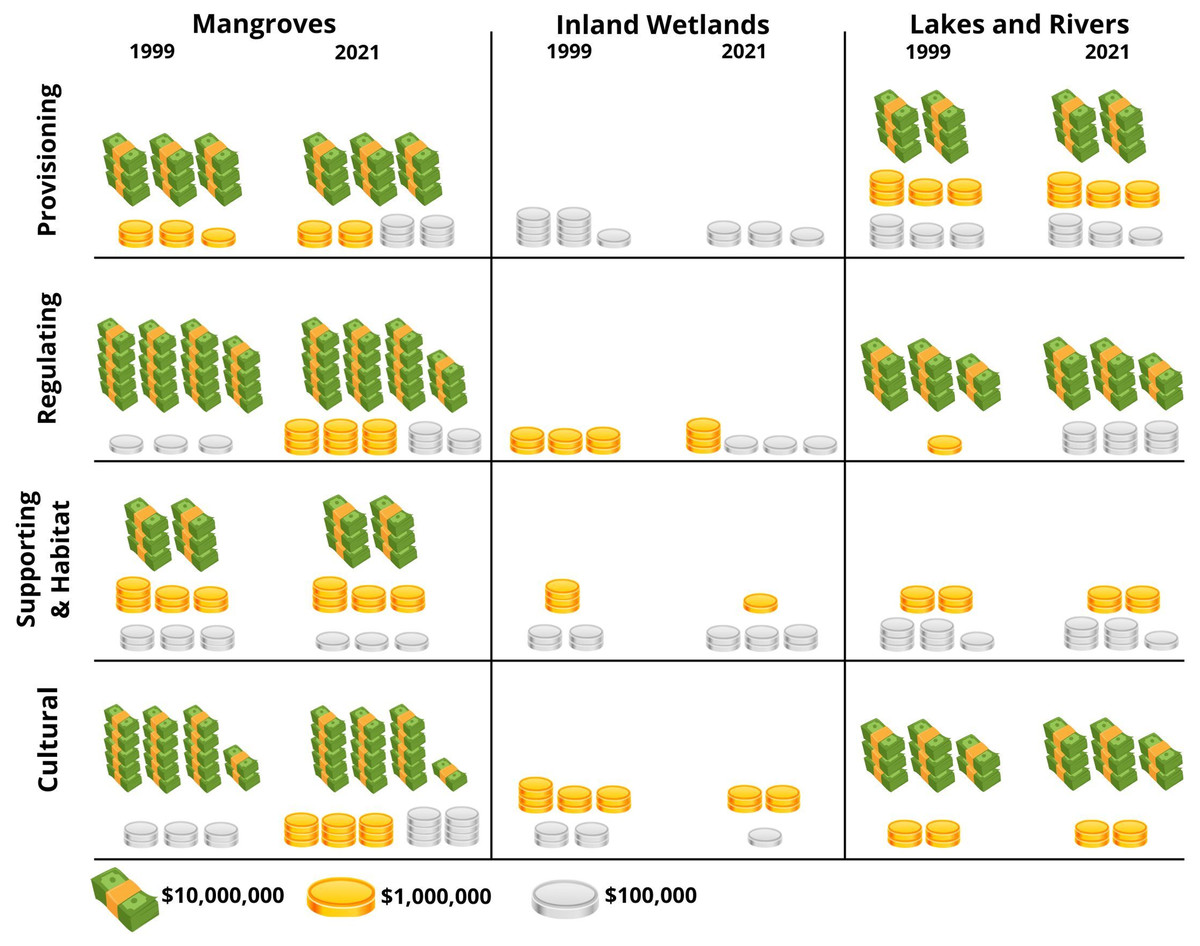
Figure 4: Changes in the value of ecosystem services provided by mangroves, inland wetlands, and lakes & rivers of Bacalar.
Values reported in Int$/year.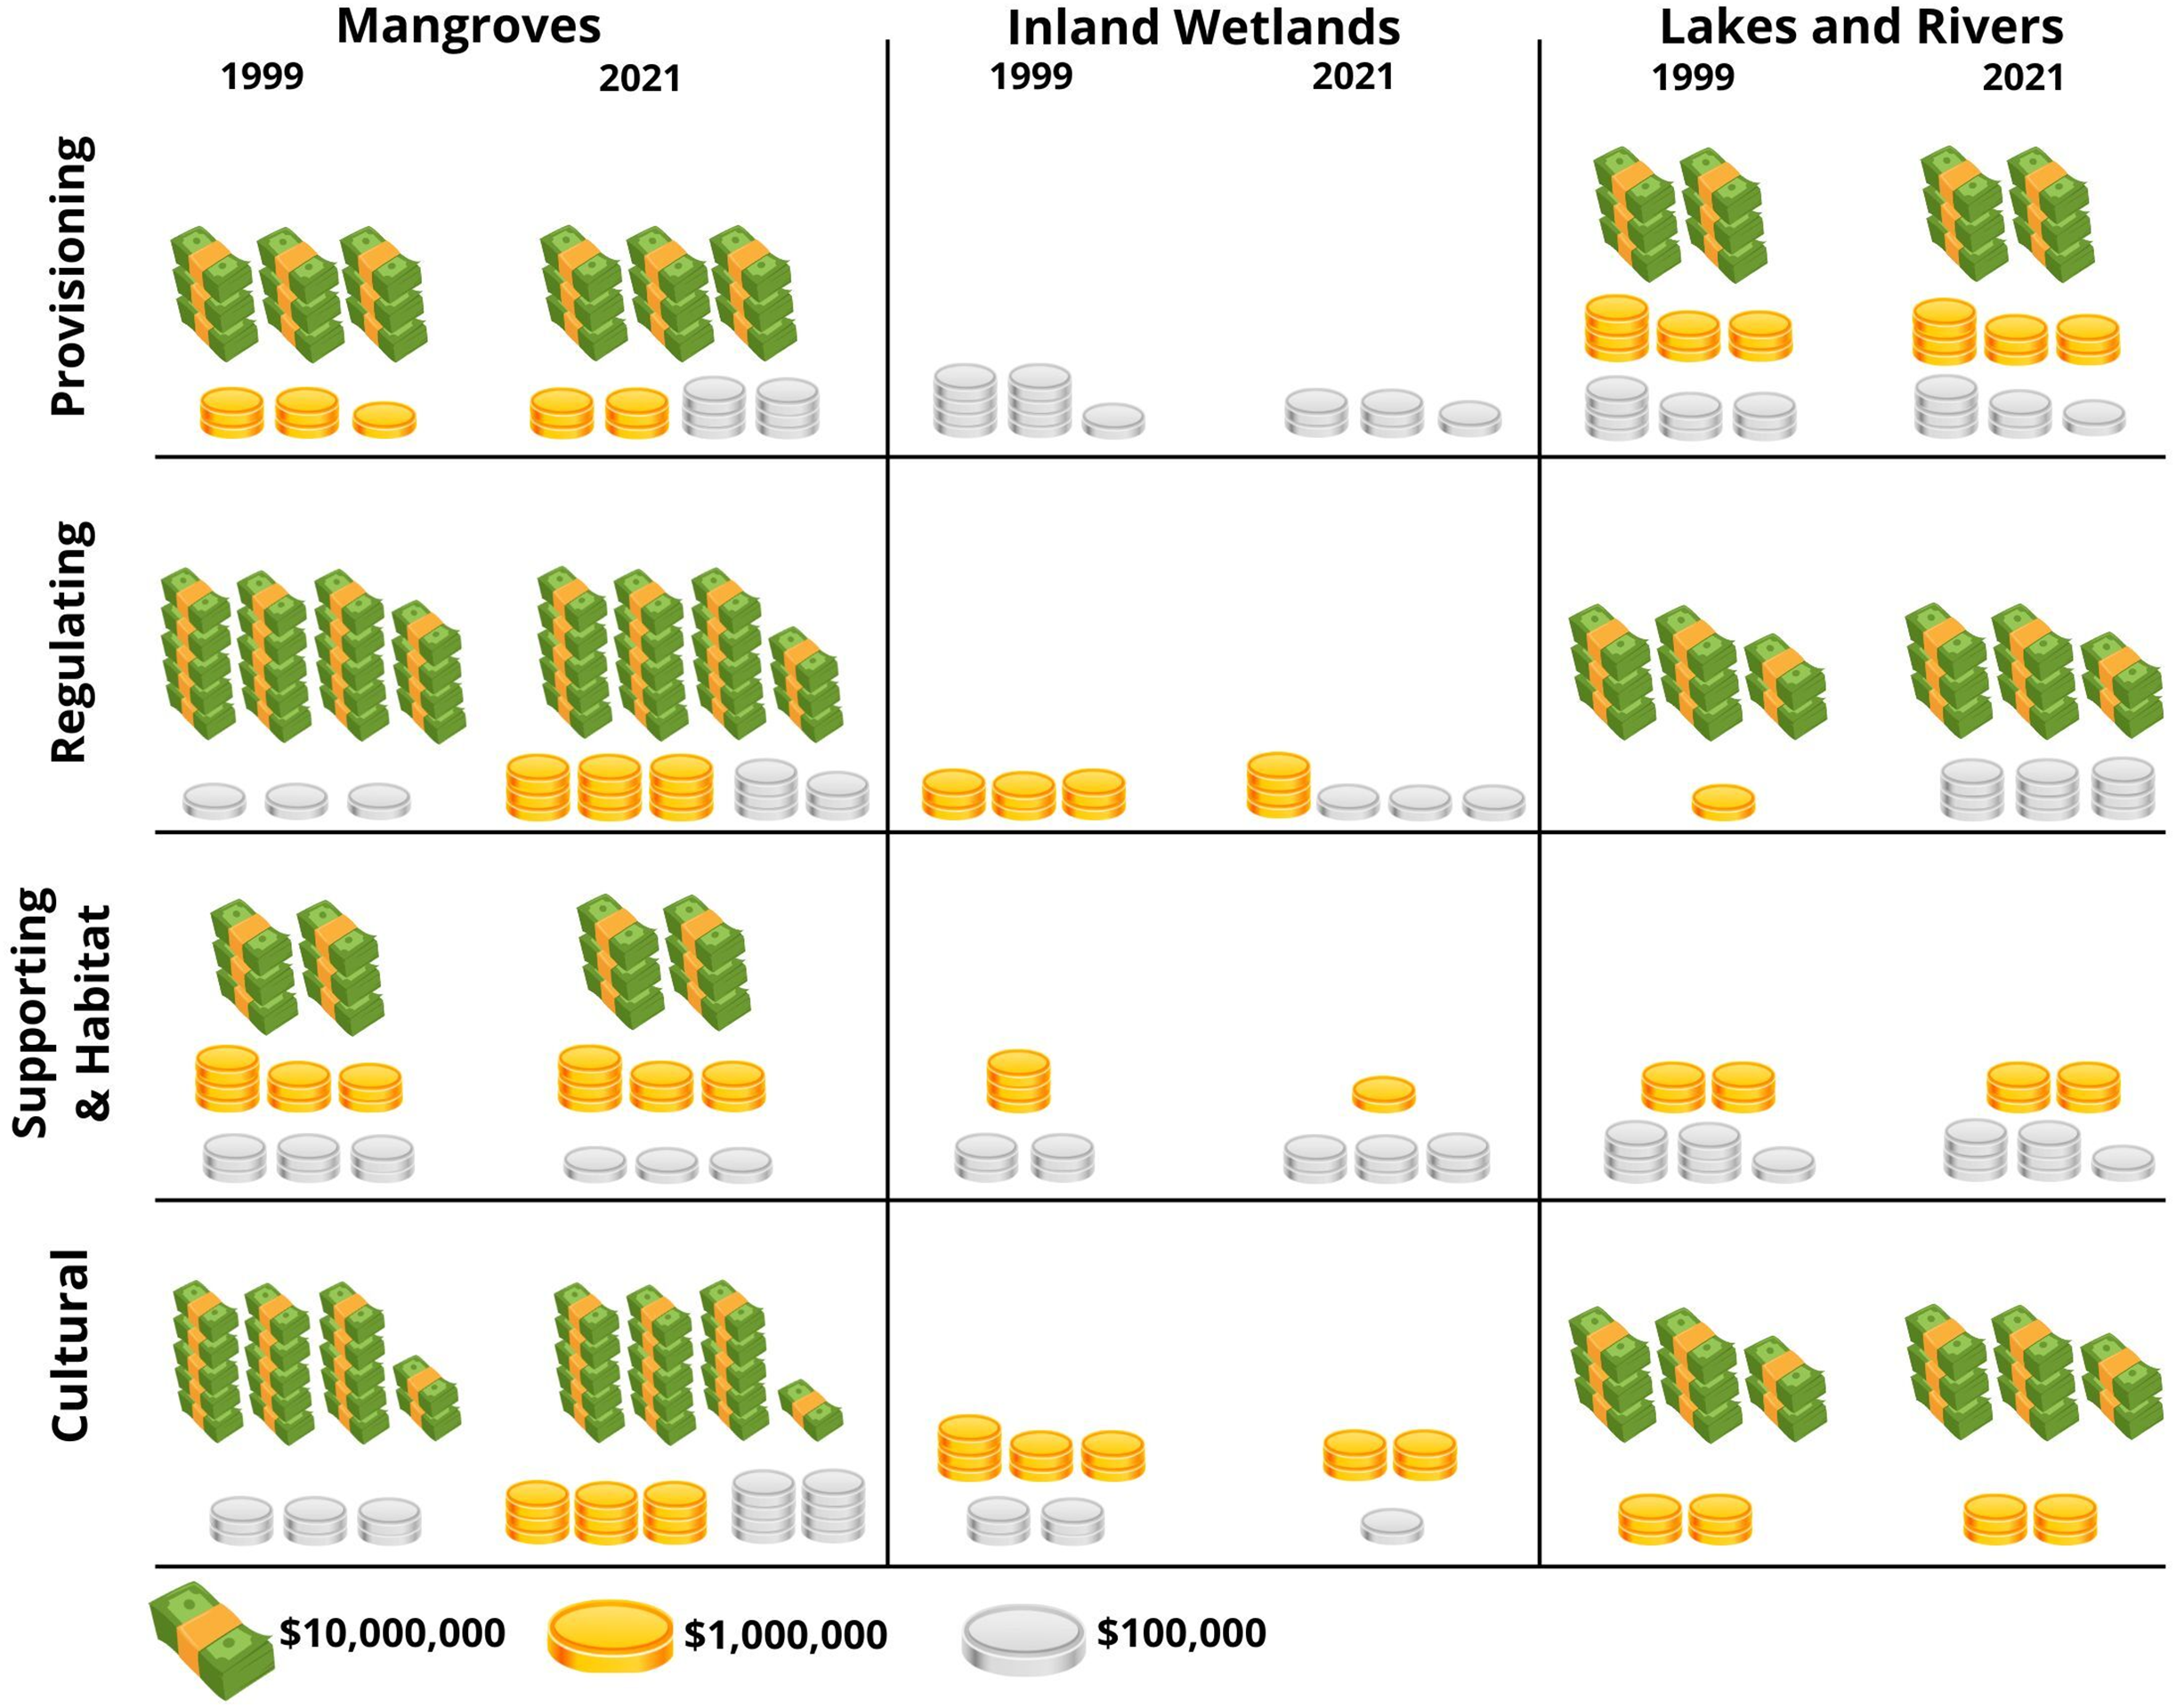
| Inland wetlands ecosystem services | Reference values (int$ 2020/ha/year) | Estimated to Bacalar | Chance | |
|---|---|---|---|---|
| 1999 | 2021 | −242 ha/$ | ||
| 546 ha | 304 ha | |||
| Provision | ||||
| Food | $612 | $334,152 | $186,048 | −$148,104 |
| Water | $873 | $476,658 | $265,392 | −$211,266 |
| Raw materials | $18 | $9,828 | $5,472 | −$4,356 |
| Genetic resources | $229 | $125,034 | $69,616 | −$55,418 |
| Subtotal | $945,672 | $526,528 | −$419,144 | |
| Regulation | ||||
| Air quality regulation | $2,485 | $1,356,810 | $755,440 | −$601,370 |
| Climate regulation | $185 | $101,010 | $56,240 | −$44,770 |
| Moderation of extreme events | $4,969 | $2,713,074 | $1,510,576 | −$1,202,498 |
| Waste treatment | $2,603 | $1,421,238 | $791,312 | −$629,926 |
| Maintenance of soil fertility | $812 | $443,352 | $246,848 | −$196,504 |
| Subtotal | $6,035,484 | $3,360,416 | −$2,675,068 | |
| Support | ||||
| Maintenance of life cycles | $4,759 | $2,598,414 | $1,446,736 | −$1,151,678 |
| Maintenance genetic diverse | $1,483 | $809,718 | $450,832 | −$358,886 |
| Subtotal | $3,408,132 | $1,897,568 | −$1,510,564 | |
| Cultural | ||||
| Aesthetic information | $493 | $269,178 | $149,872 | −$119,306 |
| Opportunities for recreation and tourism | $12,899 | $7,042,854 | $3,921,296 | −$3,121,558 |
| Existence, bequest values | $63 | $34,398 | $19,152 | −$15,246 |
| Inspiration for culture, art, and design | $101 | $55,146 | $30,704 | −$24,442 |
| Information for cognitive development | $120 | $65,520 | $36,480 | −$29,040 |
| Subtotal | $7,467,096 | $4,157,504 | −$3,309,592 | |
| Total | $17,856,384 | $9,942,016 | −$7,914,368 | |
| Mangroves ecosystem services | Reference values (int$ 2020/ha/year) |
Estimated to Bacalar | Chance | |
|---|---|---|---|---|
| 1999 | 2021 | −29 ha/$ | ||
| 6,720 ha | 6,690 ha | |||
| Provision | ||||
| Food | $6,791 | $45,635,520 | $45,431,790 | −$203,730 |
| Water | $1,623 | $10,906,560 | $10,857,870 | −$48,690 |
| Raw materials | $5,729 | $38,498,880 | $38,327,010 | −$171,870 |
| Subtotal | $95,040,960 | $94,616,670 | −$424,290 | |
| Regulation | ||||
| Air quality regulation | $1,323 | $8,890,560 | $8,850,870 | −$39,690 |
| Climate regulation | $1,375 | $9,240,000 | $9,198,750 | −$41,250 |
| Moderation of extreme events | $14,388 | $96,687,360 | $96,255,720 | −$431,640 |
| Waste treatment | $3,189 | $21,430,080 | $21,334,410 | −$95,670 |
| Erosion prevention | $7,030 | $47,241,600 | $47,030,700 | −$210,900 |
| Maintenance of soil fertility | $1,028 | $6,908,160 | $6,877,320 | −$30,840 |
| Subtotal | $190,397,760 | $189,547,770 | −$849,990 | |
| Support | ||||
| Maintenance of life cycles | $4,078 | $27,404,160 | $27,281,820 | −$122,340 |
| Maintenance genetic diverse | $5,982 | $40,199,040 | $40,019,580 | −$179,460 |
| Subtotal | $67,603,200 | $67,301,400 | −$301,800 | |
| Cultural | ||||
| Aesthetic information | $334 | $2,244,480 | $2,234,460 | −$10,020 |
| Opportunities for recreation and tourism | $6,118 | $41,112,960 | $40,929,420 | −$183,540 |
| Existence, bequest values | $14,299 | $96,089,280 | $95,660,310 | −$428,970 |
| Inspiration for culture, art, and design | $3,890 | $26,140,800 | $26,024,100 | −$116,700 |
| Information for cognitive development | $749 | $5,033,280 | $5,010,810 | −$22,470 |
| Subtotal | $170,620,800 | $169,859,100 | −$761,700 | |
| Total | $523,662,720 | $521,324,940 | −$2,337,780 | |
| Lakes & rivers ecosystem services | References values (int$ 2020/ha/year) | Estimated to Bacalar | Chance | |
|---|---|---|---|---|
| 1999 | 2021 | −5 ha/$ | ||
| 7,474 ha | 7,469 ha | |||
| Provision | ||||
| Food | $364 | $2,720,536 | $2,718,716 | −$1,820 |
| Water | $8,618 | $64,410,932 | $64,367,842 | −$43,090 |
| Raw materials | $88 | $657,712 | $657,272 | −$440 |
| Subtotal | $67,789,180 | $67,743,830 | −$45,350 | |
| Regulation | ||||
| Climate regulation | $236 | $1,763,864 | $1,762,684 | −$1,180 |
| Moderation of extreme events | $8,077 | $60,367,498 | $60,327,113 | −$40,385 |
| Waste treatment | $2,189 | $16,360,586 | $16,349,641 | −$10,945 |
| Maintenance of soil fertility | $23 | $171,902 | $171,787 | −$115 |
| Biological control | $314 | $2,346,836 | $2,345,266 | −$1,570 |
| Subtotal | $81,010,686 | $80,956,491 | −$54,195 | |
| Support | ||||
| Maintenance of life cycles | $631 | $4,716,094 | $4,712,939 | −$3,155 |
| Subtotal | $4,716,094 | $4,712,939 | −$3,155 | |
| Cultural | ||||
| Aesthetic information | $1,214 | $9,073,436 | $9,067,366 | −$6,070 |
| Opportunities for recreation and tourism | $2,347 | $17,541,478 | $17,529,743 | −$11,735 |
| Existence, bequest values | $3,420 | $25,561,080 | $25,543,980 | −$17,100 |
| Inspiration for culture, art, and design | $2,672 | $19,970,528 | $19,957,168 | −$13,360 |
| Spiritual experience | $80 | $597,920 | $597,520 | −$400 |
| Information for cognitive development | $1,517 | $11,338,058 | $11,330,473 | −$7,585 |
| Subtotal | $84,082,500 | $84,026,250 | −$56,250 | |
| Total | $31,790 | $237,598,460 | $237,439,510 | −$158,950 |
The most significant change was observed in inland wetlands, which decreased by 242.4 ha from 1999 to 2021. This reduction in area corresponds to a decline in the value of the ecosystem services they provide, amounting to 7,914,368 Int$/year (Fig. 4, Table 5). Regarding mangroves, they covered an area of 6,719.7 ha in 1999, with their ecosystem services valued at 523,662,720 Int$/year. However, the loss of 29 ha by 2021 resulted in a decrease in value of 2,337,780 Int$/year (Table 6). For lakes and rivers, the reduction of 5 ha from 1999 to 2021 corresponded to a decrease in the value of the ES provided by this ecosystem, amounting to 158,950 Int$/year (Table 7).
Discussion
The capacity of an ecosystem to provide a service refers to its inherent potential, determined by the ecological and biophysical characteristics of the system, whereas effective provision pertains to the quantity of services generated and utilized by human communities (Haines-Young & Potschin, 2010). This distinction is particularly significant in ecosystems such as wetlands, which are dynamic and highly sensitive to both natural and anthropogenic disturbances (Bhowmik, 2019; Clarkson, Ausseil & Gerbeaux, 2013). This study aimed to assess changes in the potential capacity of the Bacalar Lagoon ecosystems to provide ecosystem services over time through spatial data analysis and the transfer of monetary values. While this approach offers a valuable tool for understanding general trends in service loss, it is important to emphasize that the results do not directly quantify the effective provision of ES.
Laguna Bacalar is a complex aquatic system where the interaction of biotic and abiotic elements, geomorphological processes, and climatic events has given rise to valuable ecosystems highly connected and sensitive to disturbances. This study observed that Laguna Bacalar, like many lagoon systems, is increasingly subject to anthropogenic pressures that drive land-use change and result in the loss of ES (Airoldi, Balata & Beck, 2008; Tomscha et al., 2019). Aligned with the general objective, changes in land cover classes were detected, reaffirming the effectiveness of remote sensing as a tool for assessing ecosystems conditions and their associated ecosystem services (Fernández-Díaz et al., 2022; Mendoza-González et al., 2012; Wong et al., 2015).
The spatiotemporal analysis of Laguna Bacalar, conducted from 1999 to 2021 using satellite imagery, revealed significant changes in land cover and land use, with 277 hectares of natural ecosystems converted into human-modified areas. This transformation is closely associated with the rapid physical expansion of urban areas near the coastline of the lagoon over the past two decades. Although Bacalar town historically experienced low to moderate population growth, other urban areas have nearly doubled in size over the last decade, with overall increases ranging from 100% to 300%, significantly intensifying pressure on the region’s natural ecosystems (Agua Clara, 2021). This pattern of variation aligns with observations in numerous ecosystems where anthropogenic activities have modified natural conditions (Aguilar-Medrano, 2023; Laurila-Pant et al., 2015; Seydewitz et al., 2023; Sutton et al., 2016). In this sense, the loss of diverse land cover represents modifications in the structure and function of ecosystems, leading to a decline in ES and, consequently, a negative impact on human well-being (Ellis, Romero Montero & Hernández Gómez, 2017; Long et al., 2022; Tolessa, Senbeta & Abebe, 2017).
In Bacalar, as in other regions of the world, the location and distribution of different wetland types are closely linked to the structure, functioning, and processes of each wetland type and, consequently, to the ES they provide (Hernández-Arana et al., 2015; Barbier, 2018; Waltham et al., 2020). The results indicate that the physiographic characteristics of Laguna Bacalar favor the establishment of human settlements and the development of anthropic activities along the west coast of the lagoon, while such activities are limited on the east coast. This pattern explains why the spatiotemporal variations of the ecosystems of Laguna Bacalar are concentrated on the west coast, primarily driven by the increasing demand for tourism services and infrastructure development (Checa Artasu, 2009; Giri et al., 2011; Secretary of Tourism of the Government of Mexico (SECTUR), 2014; Gómez Pech, Barrasa García & García de Fuentes, 2018; Espinosa-Sanchez, 2019). In contrast, the east coast’s flood zones restrict human activities (Hernández-Arana et al., 2015; Palafox-Juárez et al., 2022).
The intensification of human and tourism activities in recent years in the Bacalar region has highlighted its ecological fragility (Casarin et al., 2012; Gómez Pech, Barrasa García & García de Fuentes, 2018) and have raised growing concern about the sustainability of their ecosystem services and the implications for human well-being. Although the unit value transfer method may not fully capture local conditions or the ecological and socio-economic particularities of sites, we consider it a valuable strategy for promoting sustainable management of inland wetlands, mangroves, and Bacalar Lagoon. This method has been successfully applied to emphasize the importance of the environmental benefits provided by diverse ecosystems (Costanza et al., 2017); support the conservation of coral reefs (Ruiz de Gauna et al., 2021) and wetlands (Davidson et al., 2019); estimate the environmental costs of coastal ecosystems loss due to sea-level rise (Fernández-Díaz et al., 2022), and assess the impact of climate change on wetlands, among other applications.
The analysis of land cover changes and their relationship with the variation in the value of ES provided by Bacalar’s ecosystems revealed that, from 1999 to 2021, 277 ha of mangroves, inland wetlands, and the lake were modified. This modification led to an overall reduction in the value of the ES provided by these ecosystems, estimated at 10,411,098 Int$/year. The most significant changes were observed for inland wetlands, which decreased from 546.2 ha in 1999 to 303.8 ha in 2021, leading to a reduction in the value of their ecosystem services of approximately 7,914,368 Int$/year. This decline is of particular concern, as inland wetlands have a restricted distribution along the littoral margin and serve as the first line of defense for filtration and purification of organic matter inputs from upper watershed tributaries (Aguilar-Medrano, 2023; Barbier & Enchelmeyer, 2014; Davidson & Finlayson, 2019; Van Zanten et al., 2021). This degradation may increase the ecosystem’s vulnerability to anthropogenic impacts and climate change, while also impairing its supporting and regulating capacities. For example, Fernández-Díaz et al. (2022) report that the degradation of coastal ecosystems increases the risk of erosion and flooding, resulting in significant economic costs and heightened perception of vulnerability among human populations (Rulleau & Rey-Valette, 2017). Similarly, the degradation of inland wetlands has been reported to reduce habitat quality for wetland species and modify natural hydrological regimes (McCauley et al., 2015).
In the case of mangroves, the most prominent ecosystem in the study area, the modification of 29 ha may appear to be of low magnitude; however, given the increasing tourism promotion and intensification of anthropogenic activities in the region, it is crucial to highlight that further degradation of mangroves could significantly impact key ES vital for ecosystem health. These include regulation and climate services, water purification (Xu et al., 2018; Davidson & Finlayson, 2019) mitigation of extreme event, and erosion prevention (Koh et al., 2018; Waltham et al., 2020; Zhang, He & Yang, 2021). Additionally, the connectivity with neighboring ecosystems (Hernández-Arana et al., 2015) and the scenic beauty of the Bacalar system could be compromised, leading to adverse effects on the regional economy and human well-being in the medium and long term (Russi et al., 2013).
The analysis of the lakes and rivers ecosystems showed that between 1999 and 2021, 5 hectares were lost, corresponding to an estimated reduction in ES value of approximately 158,950 Int$/year. Bacalar Lagoon is a water body influenced by climatic seasonality and rainfall patterns (Carrillo et al., 2024; Hernández-Arana et al., 2015) which may experience changes in its surface area due to natural variation rather than actual losses (Xu et al., 2018). However, it is important to emphasize that the degradation of this ecosystem could have medium-and long-term consequences for the ES it provides, such as the availability of water resources and the health of adjacent ecosystems (Davidson & Finlayson, 2019), as well as impact on the structure and function of mangroves and wetlands. Furthermore, it could affect the provision of fundamental services for human health and well-being, such as water regulation, availability, and quality (Russi et al., 2013; Mitsch, Bernal & Hernandez, 2015; Grizzetti et al., 2016).
Bacalar’s ecosystems collectively provide a unique and aesthetic valuable landscape, contributing to numerous ecosystem services, most notably tourism and recreation. Over the past 20 years, its scenic beauty has become a resource that generates significant income for riverside communities (Secretary of Tourism of the Government of Mexico (SECTUR), 2014; Gómez Pech, Barrasa García & García de Fuentes, 2018; Sosa Ferreira & Martinez, 2016) and represents significant contributions to the GDP (INEGI, 2023). However, this economic reliance has driven exponential growth in infrastructure projects (Hirales-Cota et al., 2010), including real estate developments, road construction, material extraction sites, and, more recently, the Mayan Train. These activities have intensified pressure on Bacalar’s ecosystems, contributing to the deterioration and overloading of its wetlands and lagoon, ultimately affecting its scenic beauty and landscape. This degradation has resulted in total depreciation of Cultural ES valued at 4,127,542 Int$/year between 1999 and 2021, due to the modification of 277 hectares of mangroves, inland wetlands, and lakes and rivers.
The capacity of mangroves and wetlands to provide ecosystem services is directly linked to their extent, conservation status, and connectivity. However, the modification of 277 hectares represents a significant reduction in their potential to offer ES. Laguna Bacalar is a system where mangroves, the lagoon, and inland wetlands are intricately interconnected (Perry et al., 2009; Hernández-Arana et al., 2015; Pérez-Ceballos et al., 2021). An example of these interdependencies is the change in the lagoon’s color in 2021, caused by the inflow of terrigenous material into the water body following extraordinary rainfall associated with Tropical Storm Cristobal (Comisión Nacional del Agua (CONAGUA), 2020). This color change highlights the impact of losing 242 ha of inland wetlands, which previously acted as a protective barrier. The runoff of rainwater through deforested areas, in the absence of these inland wetlands, increased the direct input of materials into the lagoon, modifying its color and transparency for nearly two years, with direct implications for oxygen and nutrient concentrations (UN Environment, 2017; Álvarez-Legorreta, 2025), mortality of fauna such as the Pomacea flagellata snail (De Jesús-Navarrete et al., 2019; De Jesús-Navarrete, 2025), and a noticeable decline in the lagoon’s scenic beauty, negatively impacting the local and regional economy as well as the well-being of communities dependent on the lagoon’s ecosystem services.
The case of the Bacalar wetlands underscores the interconnected stages of the Ecosystem Services Cascade framework (Haines-Young & Potschin, 2010)—functions, capacity, provision, benefits, and values—and demonstrates how disruptions at the initial stages (functions and capacity) can cascade into diminished perceived benefits and values. Although our findings primarily highlight the potential capacity of these ecosystems, observations during extreme events revealed that effective provision is substantially limited in degraded systems.
Reversing this trend requires implementing targeted strategies to restore wetland capacity and enhance the effective provision of ecosystem services. These strategies should include the rehabilitation of degraded wetlands, the establishment of vegetative barriers in critical runoff areas, and the strict regulation of agricultural and industrial activities within the watershed. Furthermore, integrating community participation and adopting Nature-Based Solutions (O’Leary et al., 2023; Teutli Hernández et al., 2020) are essential for bolstering the resilience of wetlands against future extreme events. Such actions, combined with prioritizing the conservation of remaining wetlands, have the potential to restore a significant portion of the lost ecosystem service value, thereby enhancing ecological sustainability and improving human well-being in the region.
Finally, this study applied the unit value transfer method, enabling an approximation of the ecosystems’ potential capacity by assigning monetary values based on prior studies conducted in similar contexts. However, we acknowledge the limitations of this method, including its inability to fully account for critical contextual factors such as local ecological degradation, socioeconomic dynamics, and restrictions on access to and use of ecosystem services. Thus, it is imperative to complement such analyses with detailed local assessments to effectively optimize conservation and management strategies.
Conclusions
Medium-resolution satellite imagery (Landsat 5 and Landsat 9) effectively assessed spatiotemporal changes in Laguna Bacalar’s ecosystem cover. It was also very helpful in valuing ecosystem services and in the environmental management of ecosystems in regions such as Bacalar.
The loss of 277 hectares of natural ecosystems between 1999 and 2021 has substantially diminished the capacity of wetlands to provide essential services, such as water regulation and purification. This underscores the urgent need for sustainable strategies that integrate conservation with tourism and urban development to mitigate further losses and ensure the long-term resilience of these ecosystems.
Our findings, derived from the unit value transfer method, highlight the monetary value of Bacalar’s wetlands in providing ecosystem services. While this approach is valuable, it has limitations, particularly in its inability to fully account for specific local dynamics or socioeconomic and ecological constraints. Complementing this method with primary assessments is essential to achieving more accurate and context-specific estimates.
Targeted assessments that incorporate local monitoring, community participation, and nature-based solutions are essential for enhancing the sustainability of these ecosystem services. These strategies should prioritize biodiversity conservation and the economic well-being of local communities, thereby promoting sustainable development. Highlighting the monetary value of these ecosystems can serve as a compelling message for decision-makers, reinforcing the need for their protection and responsible management.