
Integrated transcriptome and metabolome analyses reveal the differentially expressed metabolites and genes involved in lipid in olive fruits
- Published
- Accepted
- Received
- Academic Editor
- Diaa Abd El-Moneim
- Subject Areas
- Agricultural Science, Plant Science
- Keywords
- Differentially accumulated metabolite, Differentially expressed gene, Metabolic pathway, Lipid compund, Olea europaea
- Copyright
- © 2025 Qu et al.
- Licence
- This is an open access article distributed under the terms of the Creative Commons Attribution License, which permits using, remixing, and building upon the work non-commercially, as long as it is properly attributed. For attribution, the original author(s), title, publication source (PeerJ) and either DOI or URL of the article must be cited.
- Cite this article
- 2025. Integrated transcriptome and metabolome analyses reveal the differentially expressed metabolites and genes involved in lipid in olive fruits. PeerJ 13:e18941 https://doi.org/10.7717/peerj.18941
Abstract
Background
Olive (Olea europaea L.) oil is well-known commercial product worldwide for its nutritional and therapeutic properties. The molecular mechanisms underlying lipid variations in different olive cultivars remain unclear.
Methods
To investigate the molecular mechanism involved in lipid synthesis and metabolism, untargeted metabolome and RNA-Seq analyses were performed based on two varieties of olive fruits, i.e., Kalinjot (JZ) with low oil content and Coratina (KLD) with high oil content.
Results
Totally, 38 lipid compounds of 375 differentially accumulated metabolites (DAMs) were identified in JZ and KLD fruits, with 24 metabolites showing higher contents in KLD than those in JZ. Integrated transcriptome and metabolome analyses identified 48 differentially expressed genes (DEGs) associated with six lipid DAMs from JZ and KLD fruits. The contents of decanoic acid, sphinganine, and leukotriene D4 in KLD fruits were 2.33, 1.91, and 1.53 times greater than that of JZ fruits, respectively. In particular, two BCCP, one ACC, seven KAR, one EAR, one FATA and one SPT genes were observed involving to the content and quality of lipids in olive fruits. These DEGs were associated with the pathways of fatty acid biosynthesis, arachidonic acid metabolism, and limonene degradation. This study provides a strong theoretical and experimental foundation for further revealing the molecular mechanisms regulating lipid synthesis and metabolism in different olive cultivars.
Introduction
Olive oil is one of the most important ingredients of Mediterranean diet, and the main component of its fatty acid (FA) is oleic acid (Contreras et al., 2020; Qu et al., 2022). Oleic acid is the main monounsaturated FA in olive oil (Menendez et al., 2005). Previous studies have shown that frequent consumption of olive oil can reduce an overall risk of all-cause mortality by 11%, cardiovascular mortality by 12%, cardiovascular disorder by 9%, and stroke by 17% (Vazquez-Aguilar et al., 2023). The therapeutic effects of olive oil are mainly due to some specific substances, such as fatty acids (FAs), phenolic, and dietary flavonoids. Anti-inflammatory effects of olive oil are depended on FA content and antioxidant compounds (Kabaran, 2018). There are at least 30 different kinds of phenolic compounds in olive oil, which are considered strong antioxidants and radical scavengers (Bendini et al., 2007). In addition, a high intake of dietary flavonoids can (a) enhance metabolic and cardiovascular health, (b) enhance cognitive and vascular endothelial functions, (c) improve glycemic response in type 2 diabetes mellitus, and (d) a reduce risk of some cancer (Solnier, Chuck & Joseph, 2023). Because of its nutritional and therapeutic properties, olive oil plays a crucial role in preventing age-related illnesses (Kurtoğlu, Uzundumlu & Gövez, 2024). The world population of adults over 60 years of age grew from 9.10% in 1990 and 13.52% in 2020, with the population expected to rise to 21.91% by 2050 (Kurtoğlu, Uzundumlu & Gövez, 2024). The world population continues to age, and the consumption of olive oil is rapidly increasing worldwide (Qu et al., 2022). To meet the growing demand of olive oil in the market, researchers have adopted various strategies to increase the production of olive oil, such as cultivating olive varieties with high oil content, improving the olive oil extraction technology, and revealing molecular mechanisms of oil biosynthesis (Servili et al., 2011; Inarejos-García et al., 2009; Parvini et al., 2015). These studies provide valuable technologies to increase olive oil contents and further insights into understanding the biosynthesis and metabolic mechanisms of lipid in olive fruits.
To explore the biological processes in organisms, transcriptome and metabolic analyses have been widely performed to reveal metabolite variation and gene expression in various plants and animals (Wu et al., 2023; Wan et al., 2020; Liang et al., 2022). Previous studies have shown that olive oil mainly contains oleic acid, followed by palmitic acid, linoleic acid, stearic acid, palmitoleic acid, and linolenic acids (Contreras et al., 2020; Hernández et al., 2019; Lukić et al., 2019). These six FAs are associated with the synthesis of oil in olive fruits; the greater the FA content, the higher the oil biosynthesis (Liu et al., 2021). The total FA content increased significantly from 80 days after flowering, and reached a maximum value of about 130,000 µg/g at 140 days after flowering (Liu et al., 2021). Meanwhile, the composition and concentration of total FAs are important criterion for evaluating the quality of olive oil (Liu et al., 2021; Lukić et al., 2019), especially the content of oleic acid (Wang et al., 2019). The synthesis and metabolism of FAs in olive fruits involve several complex metabolic pathways (Niu et al., 2022), e.g., FA biosynthesis, FA degradation, FA metabolism, alpha-linolenic acid metabolism, linoleic acid metabolism, and sphingolipid metabolism. Among these metabolic pathways, genes and metabolites of the FA biosynthesis have been comprehensively analyzed. Acetyl-COA is the substrate of the FA biosynthesis, and catalyzed into malonyl-CoA by acetyl-CoA carboxylase (ACC) and biotin carboxyl carrier protein (BCCP) in FA biosynthesis (Unver et al., 2017). Several genes involved in oleic acid biosynthesis pathway were comprehensively characterized in oleaster (Unver et al., 2017), e.g., three genes encoding acetyl-CoA carboxylase (ACC) (Oeu028727.1, Oeu040801.1, and Oeu028778.1). Liu et al. (2021) reported that down-regulated expression of BCCP genes lead to reduction of FA content in olive cultivar Leccino. Three BCCP genes (OE6A092496, OE6A034317, and OE6A006214) were identified in olive fruits (Liu et al., 2021). Then, malonyl-CoA is converted to C16:0-ACP by β-ketoacyl-ACP synthase (KASI/III), Enoyl-ACP reductase (EAR), and β-ketoacyl-ACP reductase (KAR) (Zhou et al., 2024). Liu et al. (2020) reported two EAR and two ACC genes in olive cultivar Leccino, which were highly expressed in fruits than those in new and old leaves. Metabolitic analysis showd that few FAs changed in leaves (Liu et al., 2020). Up-regulated expression of the KAR and EAR genes increasing the oil content also have been observed in cottonseed and oil palm (Zhou et al., 2024). Additionally, a total of 15 and eight metabolic pathways related to FA and flavonoid metabolism, respectively, were identified in olive cultivars of Arbequina, Frantoio selection, and Nikitskii I with 44 and 32 transcripts tested based on GC-MS/LC-MS and transcriptome analyses (Niu, Hu & Ding, 2022), with a group of genes revealed encoding important enzymes involved in FA biosynthesis, such as ACC, KASI, KASII, and SAD. Specially, the expression level of KAS I and KAS III in Arbequina is much higher than that of Frantoio and Nikitskii I, which was consistent with the variation of C16:0 in three cultivars. Meanwhile, two DEGs (OE6A055531 and OE6A095422) were detected encoding ACCase (Niu, Hu & Ding, 2022). Subsequently, C16:0-ACP was converted to C18:0-ACP by KAS II (Unver et al., 2017), and fatty acyl-ACP thioesterase A/B (FATA/B) catalyze the ACP into free FA (Liu et al., 2021). Oleoyl-ACP (C18:1-ACP) was specifically catalyze into Oleic acid (C18:1) by FATA (Resetic et al., 2013). Previous studies showed that two up-regulation of FATA (OE6A018491 and OE6A059595) and two down-regulation of FATB (OE6A080663 and OE6A029754) caused high proportion of C18:1 in total FAs of olive cultivar Leccino fruits (Liu et al., 2021). On the contrary, the up-regulation of FATB and down-regulation of FATA in oil palm and date palm caused the accumulation of saturated palmitic acid (Huang et al., 2016). Though fatty acid is the main lipid in olive oil, other kind of lipid had been reported having effect on the synthesis of fatty acid. Inês et al. (2018) found that sphingolipids contributed to plant cell multiplication and enlargement, producing larger fruits. Thus, larger size fruit would benefit to the accumulation of lipids. These studies provide some useful information for understanding the mechanisms of lipid metabolism, but the molecular mechanisms of different lipids are still unclear. Qu et al. (2022) identified 170 DEGs related to oil biosynthesis of different olive cultivars between Kalinjot (JZ) and Coratina (KLD) based on RNA-seq (Niu et al., 2022). However, it was not clear how these DEGs participated in the synthesis or metabolism of lipids. To date, due to the varied components and content of lipid in different olive varieties, the molecular mechanism underlying lipid biosynthesis metabolism and content variation in olive remains unclear.
This study aimed to identify differentially accumulated metabolites (DAMs) and DEGs involved in lipid synthesis and metabolism between fruits of two olive varieties KLD and JZ at stage of maturity index 3 (MI-3) based on UHPLC-QTOF-MS untargeted metabolomics and integrated transcriptome and metabolome analysis, respectively, and to provide a strong theoretical and experimental foundation for further revealing the molecular mechanisms regulating lipid synthesis and metabolism in different olive cultivars.
Materials & Methods
Plant materials and transcriptome analysis
Two olive cultivars, JZ of low oil content and KLD of high oil content, were planted in the field of Liangshan Zhongze New Technology Development Co., Ltd. (Xichang, China). When the skin of fruits was reddish or light violet color (at MI-3 stage) (Hassan, El-Rahman & Attia, 2011), fresh fruits of JZ and KLD were randomly collected and stored in liquid nitrogen (−196 °C) with three biological repeats. Fruits were at the onset of ripening, and the size of KLD was almost twice as JZ at MI-3 stage. Then, the total RNA of fruit samples was extracted, and DNA was removed by RNase-free DNase (Qiagen, Hilden, Germany). Next, one µg RNA sample was used to construct the cDNA libraries, and a 14 cycles of PCR amplification was performed with LongAmp Tag (New England Biolabs, Ipswich, MA, USA). The PCR products were subjected to ONT adaptor ligation by the T4 DNA ligase (NEB). After purification, cDNA libraries were sequenced using the PromethION platform (Oxford Nanopore Technologies Ltd., Oxford, UK) at the Biomarker Technology Company (Qu et al., 2022). The transcriptomics data of olive fruits at MI-3 stage were downloaded from the Sequence Read Archive (SRA) database of the National Center for Biotechnology Information (NCBI, https://www.ncbi.nlm.nih.gov/sra/) with the accessions of SRR18361025, SRR18361026, SRR18361027, SRR18361032, SRR18361033, and SRR18361034 (Qu et al., 2022). The minimum average read quality score of seven and minimum read length of 500 bps were discarded using the in-house perl script from raw reads (Qu et al., 2022). The rRNA sequences and full-length non-chimeric transcripts were removed based on the rRNA database and primer sequences (Qu et al., 2022). The clean full-length non-chimeric transcripts were mapped onto the olive reference genome (Rao et al., 2021) using minimap2 (V2.16) (Li, 2018). The pinfish V0.1 (https://github.com/nanoporetech/pinfish accessed on 21 March 2022) was employed to identify the consensus isoforms. Subsequently, the cDNA_Cupcake package (https://github.com/Magdoll/cDNA_Cupcake accessed on 21 March 2022) was used to remove redundant full-length sequences (minimum coverage of 85% and minimum identity of 90%). The nonredundant full-length transcripts were aligned with the olive reference transcriptome sequences (Rao et al., 2021). Reads were further quantified, whose match quality value were greater than 5. The counts per million (CPM) was used to normalize the expression level of each gene. Finally, the DESeq2 R package were employed to identify DEGs between two samples based on |log2 (fold change)— ≥ 1 and false discovery rate (FDR) < 0.01 (Qu et al., 2022). Gene Ontology (GO) and Kyoto Encyclopedia of Genes and Genomes (KEGG) annotation of the DEGs were performed by the R package ClusterProfilerv4.0 (Qu et al., 2022).
Detection of untargeted metabolites
Fresh olive fruits of KLD and JZ at MI-3 stage were used to determine their untargeted global metabolites. A total of six biological replicates were performed for each cultivar. Porcelain beads and extraction solution (methanol:acetonitrile:water = 2:2:1) were added into each fruit sample. The mixture was crushed into pulp by the grinder (MM400, Retsch, Haan, Germany) at 45 Hz for 10 min, and then sonicated using ultrasonic instrument (XM-250ULF; Xiaomei Ultrasonic Instrument Company, Kunshan, Jiangsu, China) in ice-cold water (at 0 °C) for 10 min. After that, the samples were kept at −20 °C for 1 h. Subsequently, the samples were centrifuged at 4 °C and 16,099 g for 15 min in a Eppendorf 5430R (Eppendorf UK, Cambridge, UK) centrifuge. 100 µL of supernatant was collected and mixed with 500 µL of extraction solution (methanol:acetonitrile = 1:1), sonicated in ice-cold water (at 0 °C) for 10 min, and centrifuged at 4 °C and 16,099 g for 15 min. After centrifugation, a total of 100 µL of supernatant was collected. Each sample was extracted three times. Finally, 10 µL supernatant of each sample was collected and used for detection by UPLC-MS/MS system (Agilent technologies, Santa Clara, CA, USA), with the injection volume set at one µL of each sample. The L-2-chlorophenylalanine (20 ug/ml) was used as an internal standard. The raw data were acquainted by MassLynx V4.2 and processed by the Progenesis QI software (Wang et al., 2022). Peak extraction, peak alignment, and other data processing operations were performed by the Progenesis QI software. The data of untargeted metabolites was deposited in the OMIX, China National Center for Bioinformation/Beijing Institute of Genomics, Chinese Academy of Sciences (accession no. OMIX007455).
Data processing
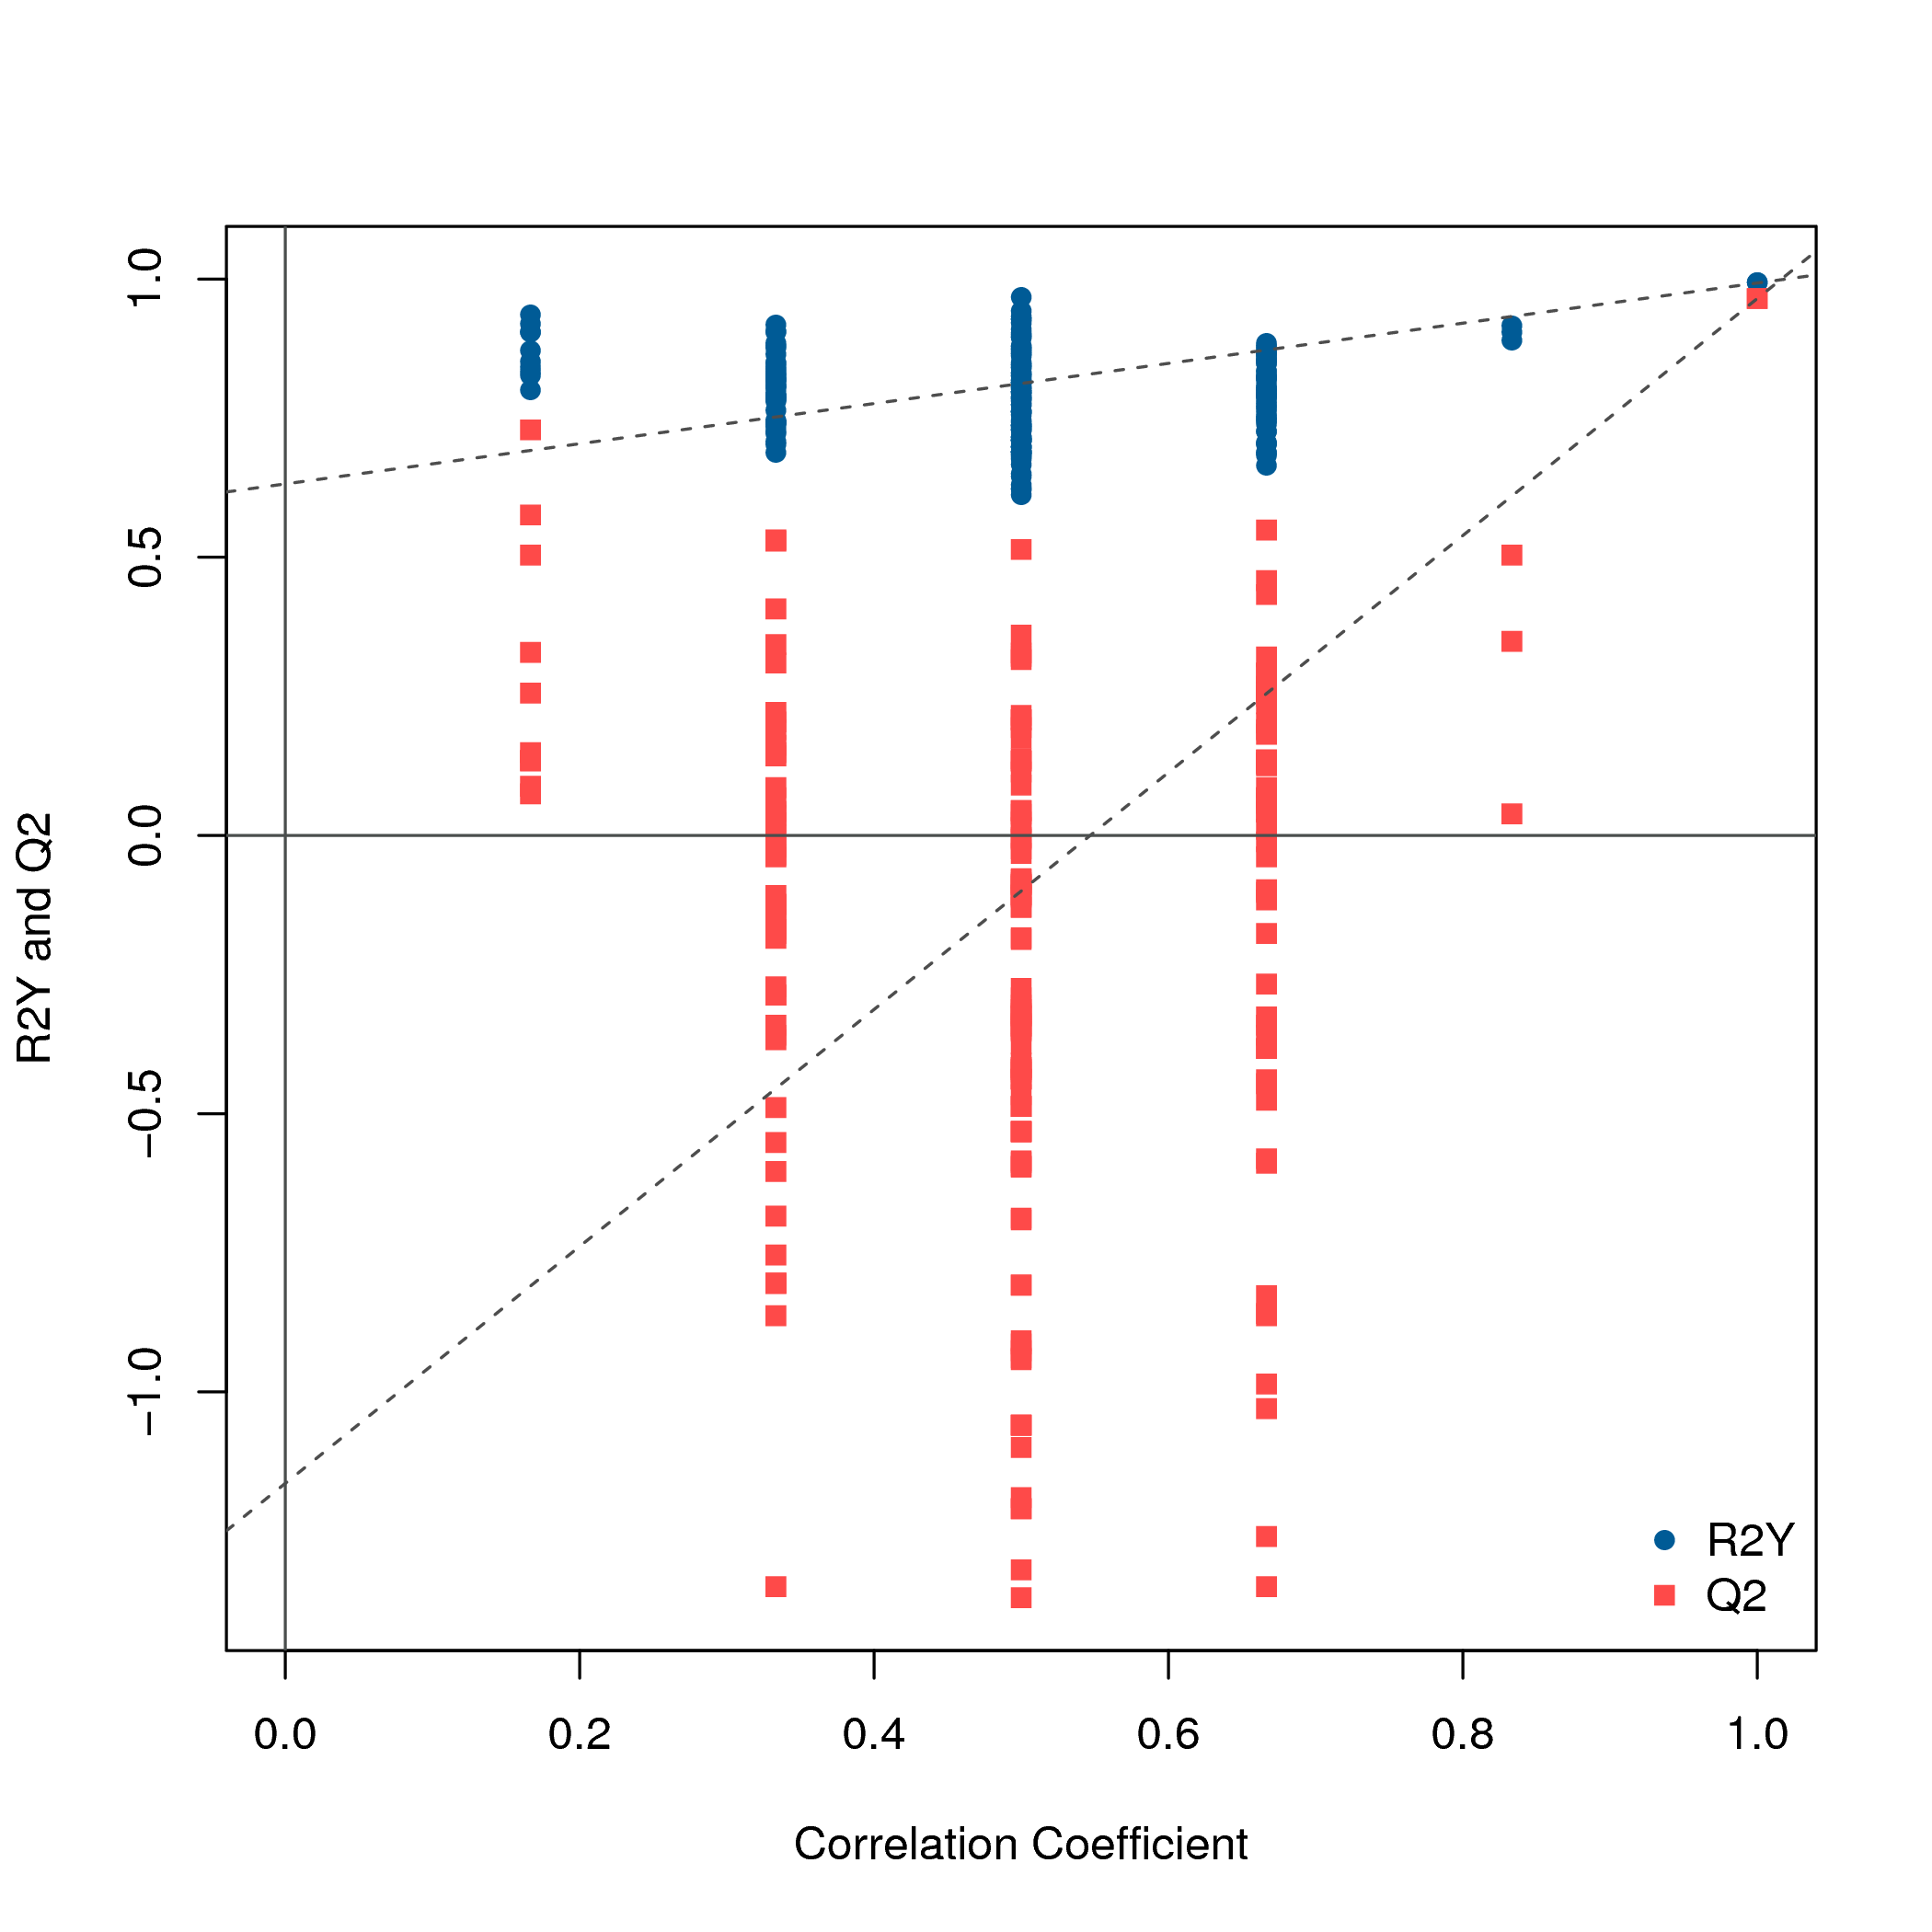
To evaluate the reliability of six biological replicates for JZ and KLD, intra-group differences of six biological replicates for JZ and KLD, were assessed by one-way analysis of variance (ANOVA) using the statistical software SPSS V.20 (IBM, Armonk, NY, USA). Levene test was used to assess homogeneity of variances. Prcomp function within R V3.3.2 (http://www.r-project.org) was utilized to do principal component analysis (PCA), and ggplot2 of R V3.3.2 was used for visualization. Cor function in R was used to calculated the Spearman’s rank correlation (SRC) coefficients between samples, and R package of pheatmap was performed to plot the heatmap. Ropls package (Yuan et al., 2023) of R V3.3.2 was employed to conduct the orthogonal partial least square-discriminant analysis (OPLS-DA), including score plots and permutation plots. The best-fitted OPLS-DA model was selected by a 200-step permutation test. Parameters R2Y and Q2 were used to evaluate the fitting validity and predictive ability of the selected OPLS-DA model. Variable importance in the projection (VIP) values were calculated from OPLS-DA. P-values of metabolites variances between JZ and KLD were obtained, and R V3.3.2 were employed to do a two-tailed Student’s t test. A significant difference between metabolites was considered when the fold change (FC) exceeded 1, P-value was less than 0.05, and the VIP score was greater than 1. The non-parametric Mann–Whitney–Wilcoxon test was used to validate the metabolites variations of selected DAMs between JZ and KLD. The metabolites identified were further annotated based on HMDB (http://www.hmdb.ca/), PubChem (https://pubchem.ncbi.nlm.nih.gov/), and KEGG (https://www.genome.jp/kegg/) databases. To establish the correlations between DEGs and DAMs, we used two-way orthogonal PLS (O2PLS) model. Their correlations were calculated by OmicsPLS R package (Bouhaddani et al., 2018) with the absolute value of Pearson correlation was greater than 0.8, and P-value was less than 0.05. Furthermore, the similarities of DEGs involving to lipids were aligned by BLAST against sequences in previous studies mention above.
Results
UPLC-MS/MS was used to investigate the variations in the contents of metabolites in fruits of JZ and KLD at MI-3 stages. A total of 725 metabolites in 47 classes were detected in olive fruits (Fig. 1A). The details of 725 metabolites were showed in Table S1. The top 10 classes of metabolites included carboxylic acids and their derivatives (27 metabolites), fatty acyls (26 metabolites), organooxygen compounds (25 metabolites), prenol lipids (23 metabolites), benzene and substituted derivatives (22 metabolites), phenols (13 metabolites), polyketides (13 metabolites), steroids and steroid derivatives (six metabolites), organonitrogen compounds (five metabolites), coumarins and derivatives (five metabolites), and glycerophospholipids (five metabolites). Among the 725 detected metabolites, 79 (10.9%) were lipid compounds, showcasing a diverse lipidome that encompasses fatty acyls, prenol lipids, and sphingolipids. These 79 lipid compounds were 26 fatty acyls, 23 prenol lipids, 13 polyketides, six steroids and their derivatives, five glycerophospholipids, three glycerolipids, and three Sphingolipids (Fig. S1). The intra-group differences of JZ and KLD replicates by ANOVA were displayed in Table S2. The P-value from Levene test of JZ and KLD were 0.999, and P-value of ANOVA was 1.000. These results of ANOVA indicated that there was no significance among six biological replicates for JZ and KLD, because P-values of homogeneity and ANOVA were greater than 0.05 (Table S2). The correlation analysis results were deposited in Table S3. Figure 1B displayed the correlation coefficients of different biological replicates. The SRC coefficients among KLD fruits ranged from 0.84 to 1.0. All SRC coefficients for JZ samples were greater than 0.8, except that of JZ_b and JZ_c. The SRC coefficients was 0.78 for JZ_b and JZ_c (Fig. 1B). The PCA results were listed in Table S4. Figure 1C showed the results of PCA. The first principal component (PC1) and the second principal component (PC2) could explain 59.18% and 18.82% of the total variation, respectively, accumulating for 78% of the total variation (Fig. 1C). The score plot of OPLS-DA showed the clear differentiation of JZ and KLD: R2X was 0.575 and R2Y was 0.993 (Fig. 1D). Figure S2 showed the result of permutation test, which was used to evaluate the validity and predictability of OPLS-DA model. Q2 value obtained by permutation test was 0.965 (Fig. S2).
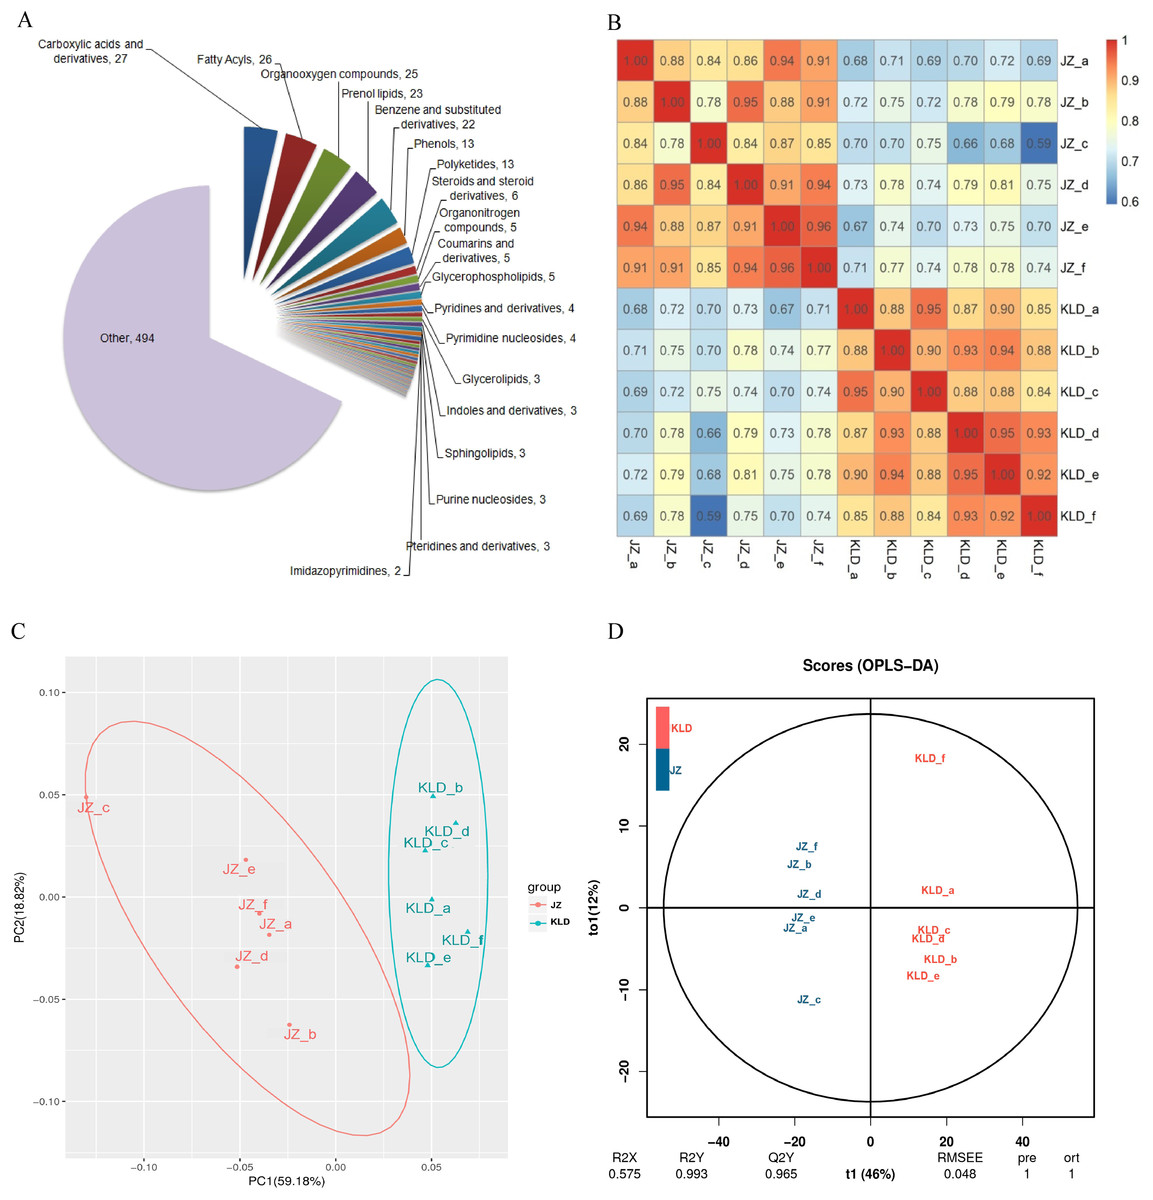
Figure 1: Metabolomics analysis of JZ and KLD fruits.
(A) Composition of metabolites of olive fruits. (B) Correlation analysis between JZ and KLD. (C) PCA of samples of JZ and KLD. (D) OPLS-DA of samples of JZ an KLD.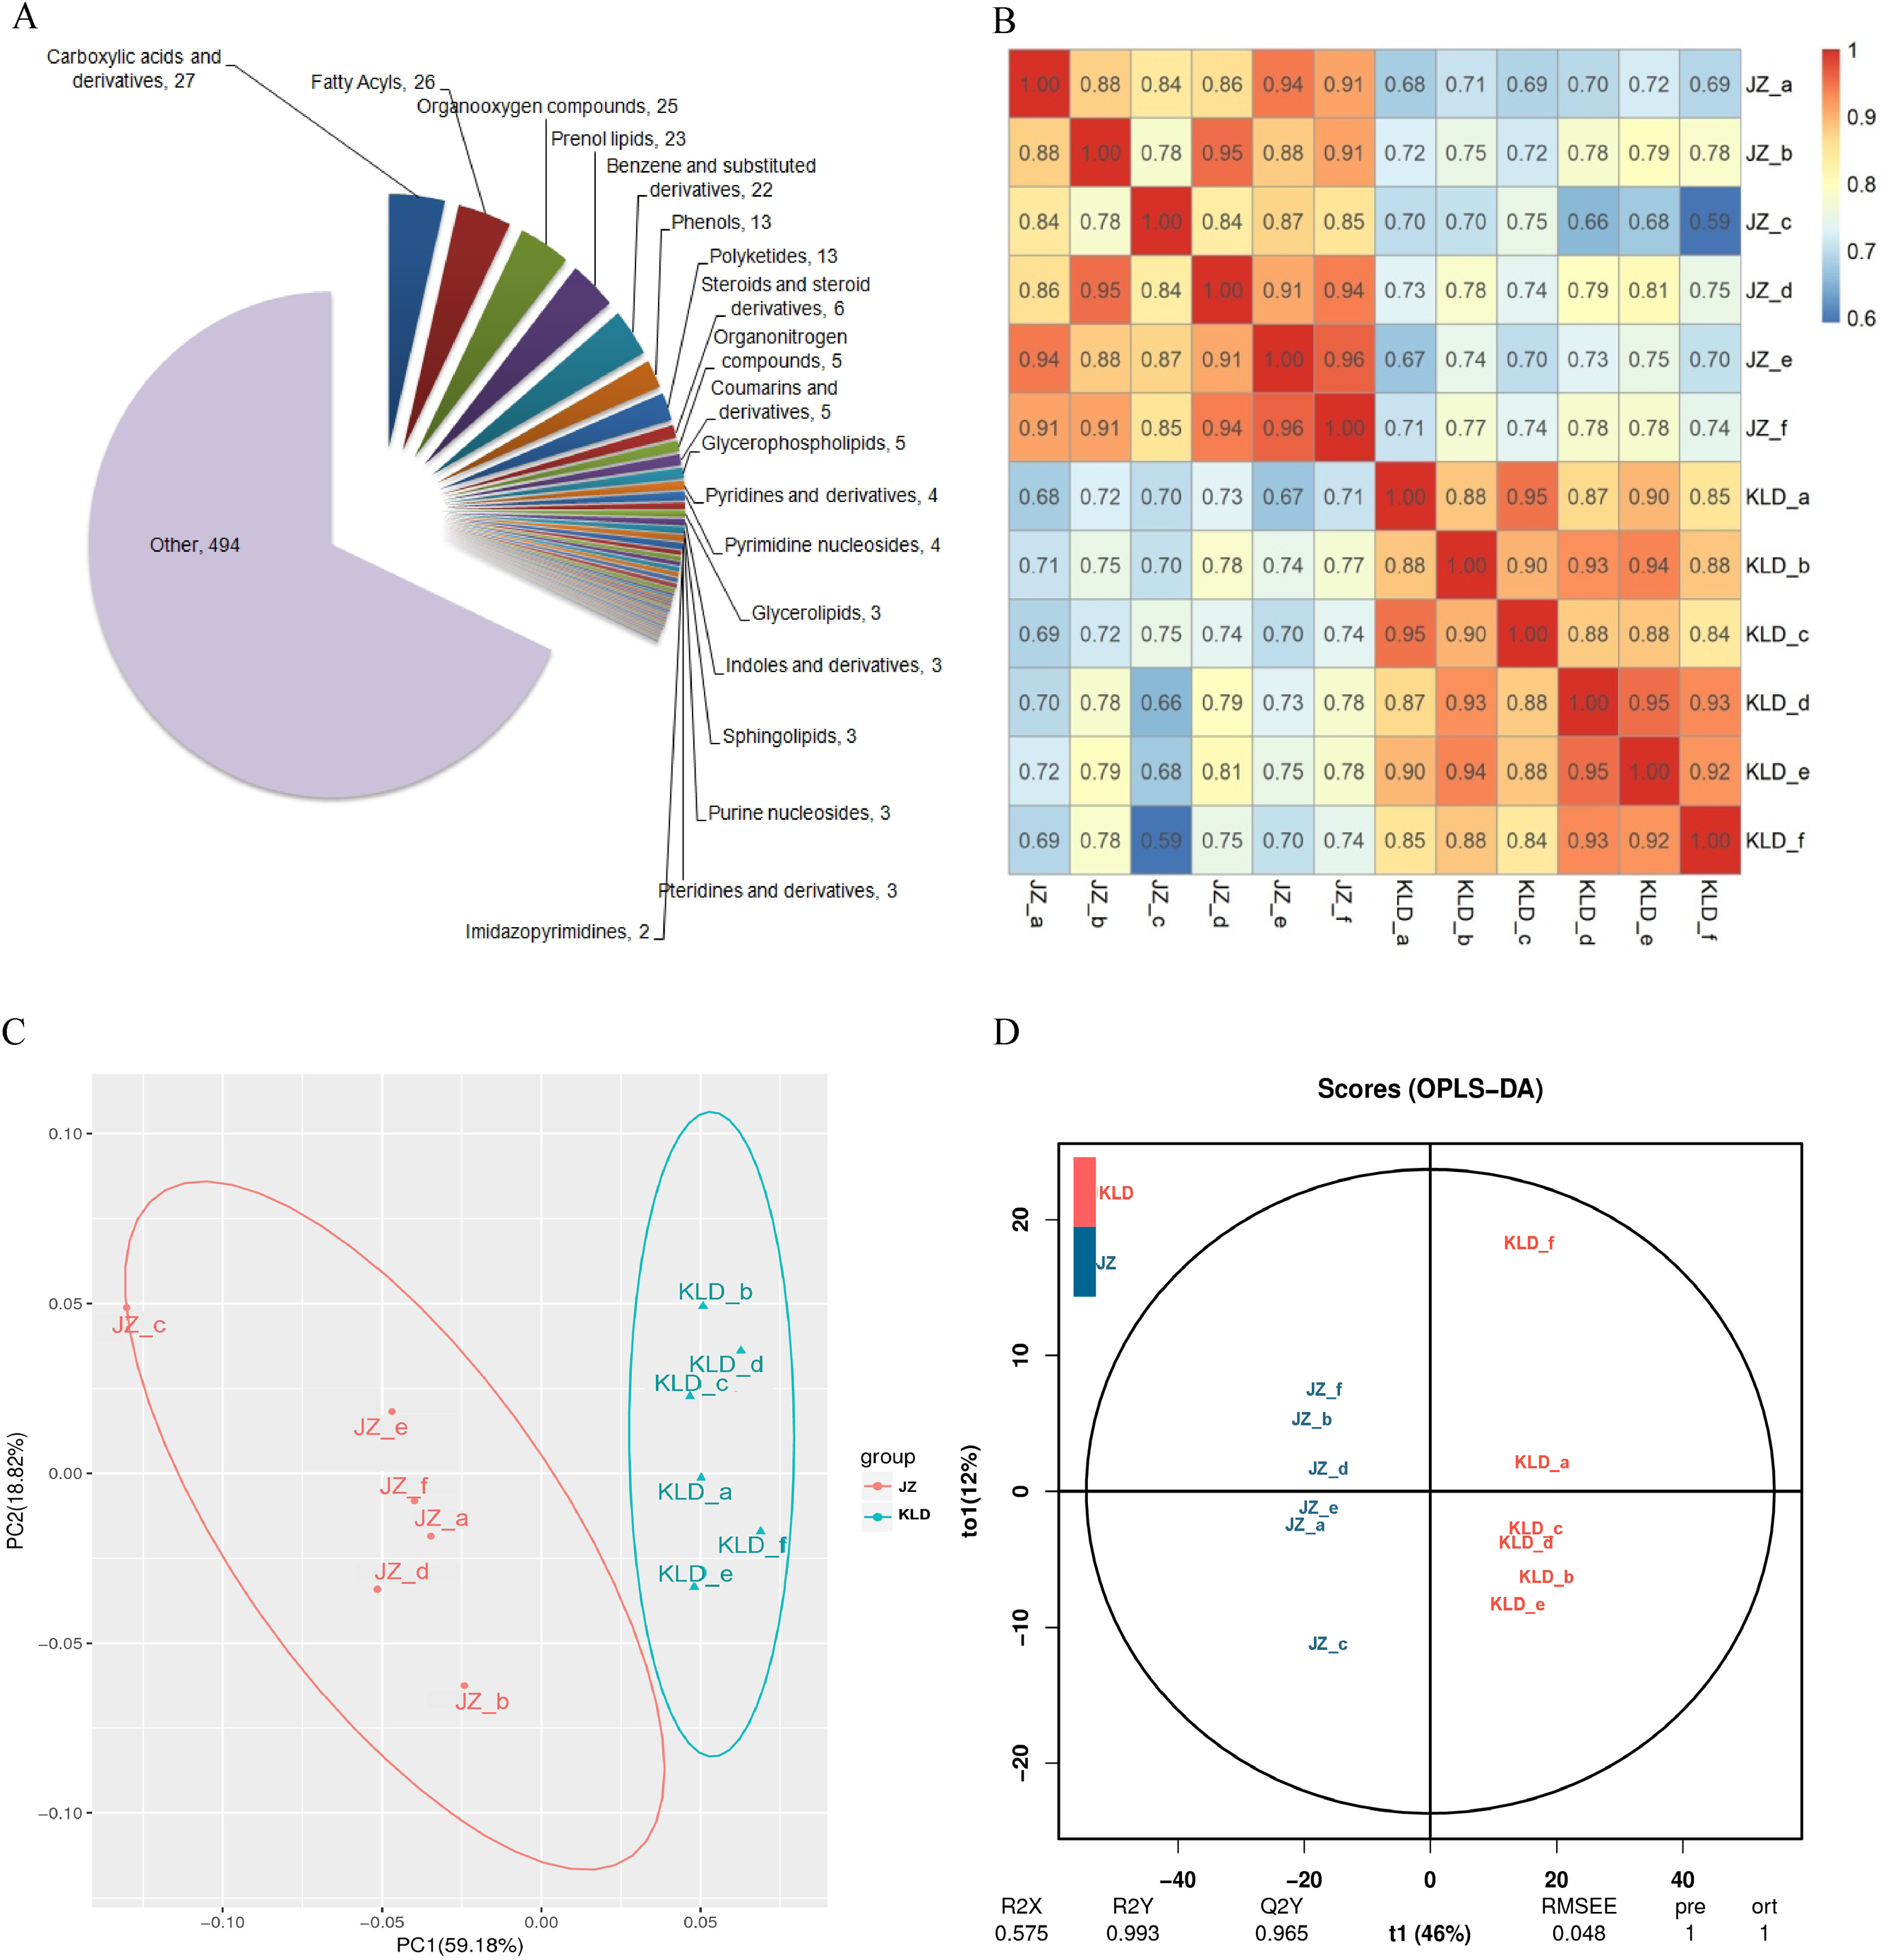
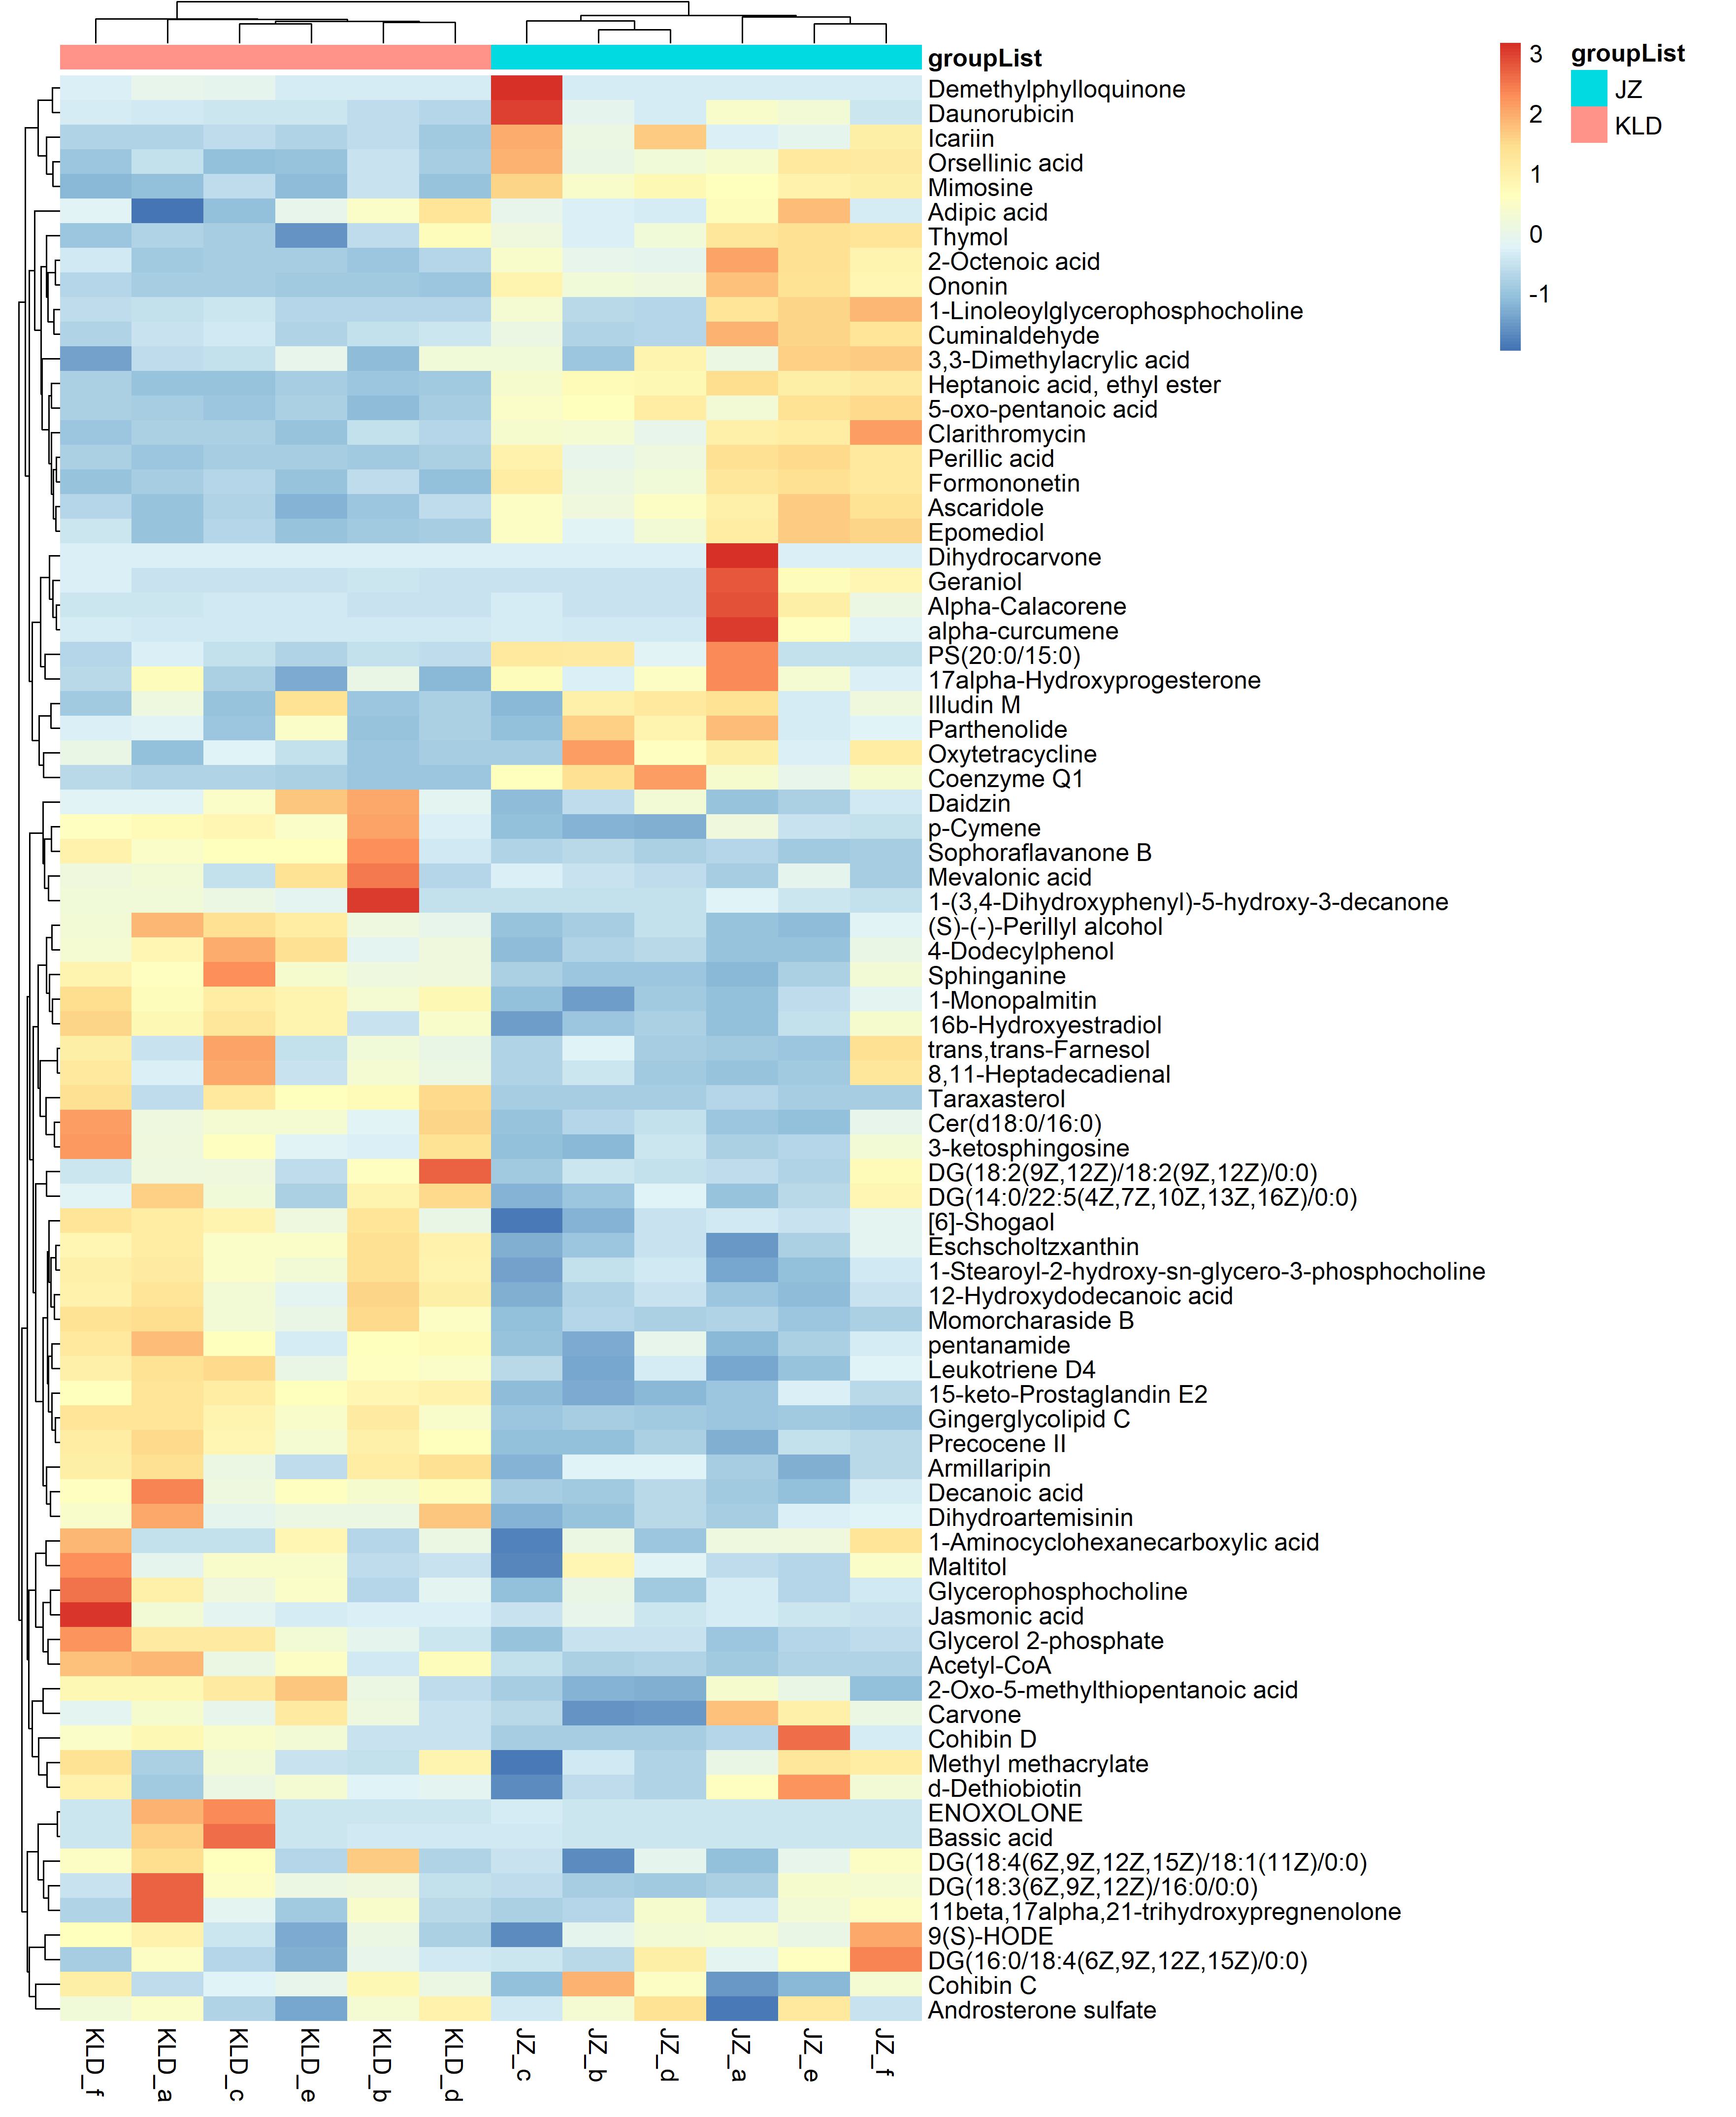
Figure 2A showed the volcano plots of all metabolites detected in olive fruits. Totally, there were 375 DAMs identified in fruits of JZ and KLD at the MI-3 stages, i.e., 254 DAMs up-regulated in KLD and 121 down-regulated in JZ (Table S5). The majorities of DAMs were lipids and lipid-like molecules, organic acids and derivatives, benzenoids, organic acids and derivatives, phenylpropanoids and polyketides, organic oxygen compounds, organic nitrogen compounds, organoheterocyclic compounds, and alkaloids and derivatives (Table S5). The significant variances of 375 DAMs from Mann–Whitney–Wilcoxon test were in accordance with previous t test, whose P-values were all less than 0.05 (Table S5). These statistical analysis results indicated that the variations of 375 DAMs between JZ and KLD were significant. The results of KEGG enrichment analysis of these 375 DAMs were presented in Fig. 2B, showing that these DAMs were significantly enriched in metabolic pathways of phenylpropane biosynthesis, tyrosine metabolism, folate metabolism, limonene and pinene degradation, isoflavone biosynthesis, FA biosynthesis, oxidative phosphorylation, and sphingolipid metabolism. The variations in the contents of DAMs in JZ and KLD fruits showed that a total of 110 of these 375 DAMs were involved in lipid biosynthesis or metabolism in JZ and KLD fruits (Fig. 2C), with the top three classes of DAMs identified as carboxylic acids and derivatives (12 metabolites), organiooxygen compounds (11 metabolites), and prenol lipids (11 metabolites). Specifically, 38 of these 110 DAMs were lipid compounds, e.g., fatty acyls, prenol lipids, glycerophospholipids, and steroids or steroid derivatives. There were 11 prenol lipids among these 38 DAMs, with six DAMs showing increased contents in KLD and five metabolites showing decreased contents in JZ. There were 10 DAMs of fatty acyls, and the contents of six polyketides in JZ were greater than those in KLD. Among the nine differentially expressed polyketides, the contents of four metabolites in KLD were higher than those in JZ. The remaining eight lipid DAMs were glycerol ester, glycerol phospholipid, steroid and steroid derivatives, and sphingolipids, each with two metabolites showing increased contents in KLD. The contents of 38 DAMs involved in olive oil in JZ and KLD fruits at MI-3 stage were presented on the heatmap, showing the evident difference between the contents of these 38 DAMs in JZ and KLD, whereas the contents of 24 lipid compounds in KLD were greater than those in JZ (Fig. 2D).

Figure 2: Screening of differentially accumulated metabolites (DAMs) and KEGG enrichment analysis of JZ and KLD fruits at MI-6 stage.
(A) Volcano map of DAMs. (B) Bubble plot of KEGG enrichment of DAMs. (C) Content variation of DAMs involved in lipid metabolism. (D) Heatmap of contents of DAMs in olive fruits.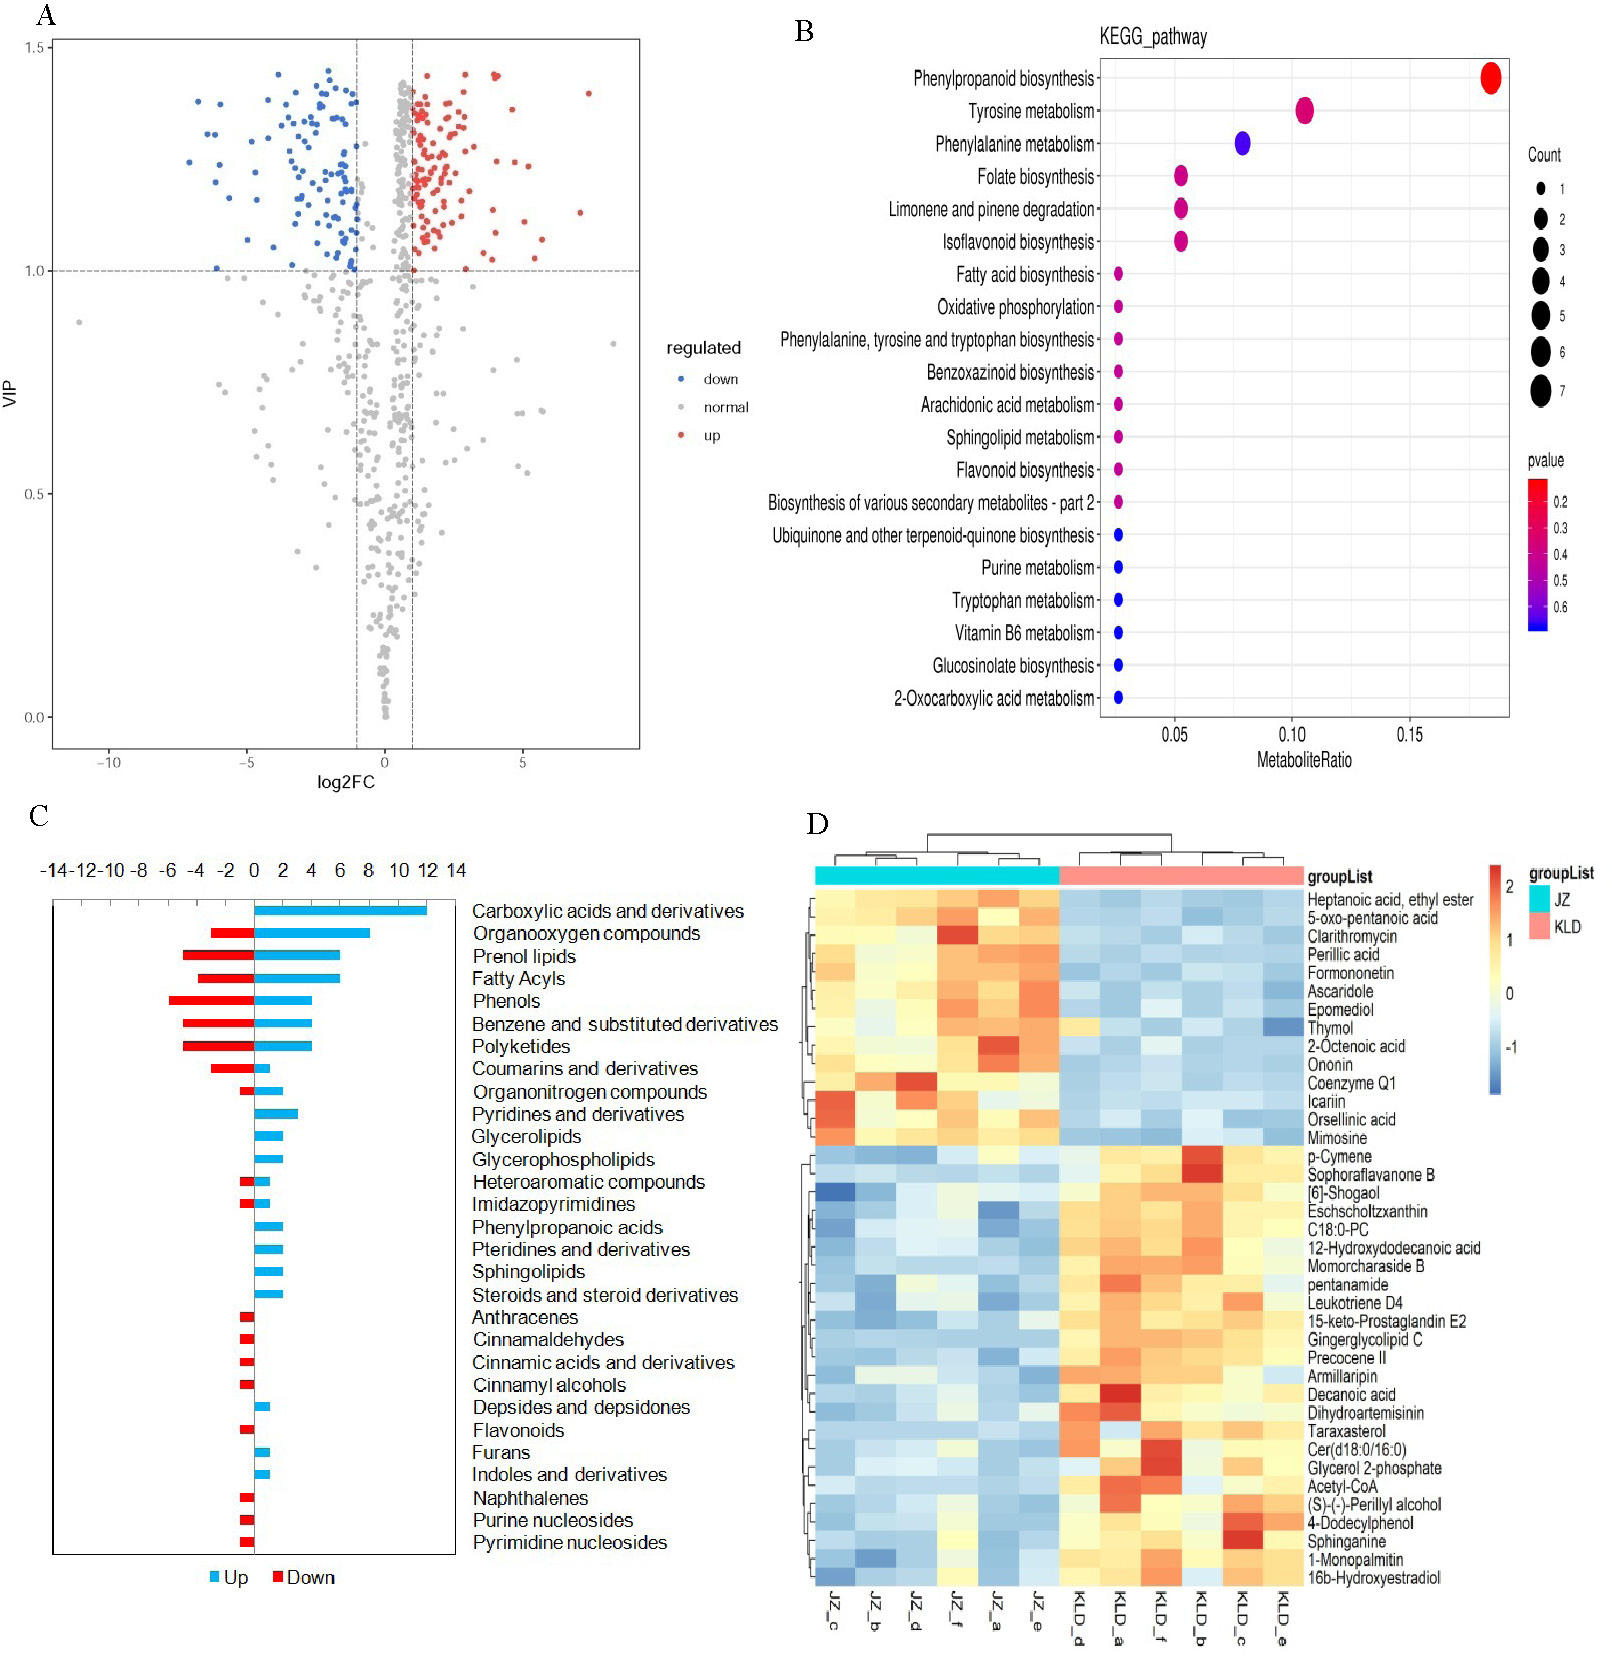
Figure 3 revealed the metabolic pathways significantly enriched by the DAMs identified between JZ and KLD fruits at MI-3 stages. p-Cymene was the starting substrate of the degradation of aromatic compounds and the xylene degradation pathway. Our results showed that the content of p-Cymene in KLD fruit was 2.51 times higher comparing to JZ fruits (Table S5). p-Cymene was finally decomposed into 2-hydroxy-3-carboxy-6-oxo-7-methylocta-2,4-dienoate by CymA, CymB, CymC, and so on. However, the contents of 2-hydroxy-3-carboxy-6-oxo-7-methylocta-2,4-dienoate between KLD and JZ fruits showed no significant difference (Table S1). Then, 2-hydroxy-3-carboxy-6-oxo-7-methylocta-2,4-dienoate was decomposed into acetyl-CoA, and finally catalyzed into decanoic acid through the FA synthesis pathway. The contents of acetyl-CoA and decanoic acid in KLD fruits were 6.87 and 2.33 times greater than that of JZ fruits, respectively (Table S5). In linoleic acid metabolism, linoleate was converted into 9(S)-HPODE in the reaction catalyzed by linoleate 9S-lipoxygenase. However, 9(S)-HPODE was not detected in our study, and its racemic mixture (±)9-hPODE was detected, showing decreased contents in KLD (Fig. 2D). In addition, linoleate is also converted to γ-linolenate/(6,9,12)-linolenic acid in the reaction catalyzed by linoleoyl-CoA desaturase (EC:1.14.19.3). In our study, the content of γ-linolenate/(6,9,12)-linolenic acid in KLD was 0.23 accounting for that in JZ (Table S5). Furthermore, γ-linolenate/(6,9,12)-linolenic acid was finally converted to 15-keto-Prostaglandin E2 and leukotriene D4 in arachidonic acid metabolism pathway. The content of 15-keto-prostaglandin E2 and leukotriene D4 in KLD were 1.49 and 1.53 times higher than those of JZ, respectively (Table S5). In limonene degradation pathway, the content of (S)-(-)-perillyl alcohol produced in KLD was 1.99 times greater than that in JZ. (S)-(-)-perillyl alcohol was further converted into perillic acid, and the content of perillic acid in KLD was 0.18 accounting for that of JZ (Table S5). Two types of sphingolipids compounds were detected increasing in KLD fruits, i.e., sphinganine and C17 sphinganine, showing 1.91 and 3.00 times greater than that of JZ. Ceramide (d18:0/16:0) was synthesized from Sphinganine. Then, ceramide (d18:0/16:0) was used to generate galactosylceramide, but its content in KLD was 0.13 accounting for that in JZ (Table S5). In the isoflavonoid biosynthesis pathway, formononetin was generated based on ononin. The contents of both ononin and formononetin were decreased in KLD compared to JZ, whereas the contents of pentanamide, glycerol 2-phosphate, and sophoraflavanone B in KLD were1.37, 3.43, and 4.52 times greater than those of JZ (Table S5).
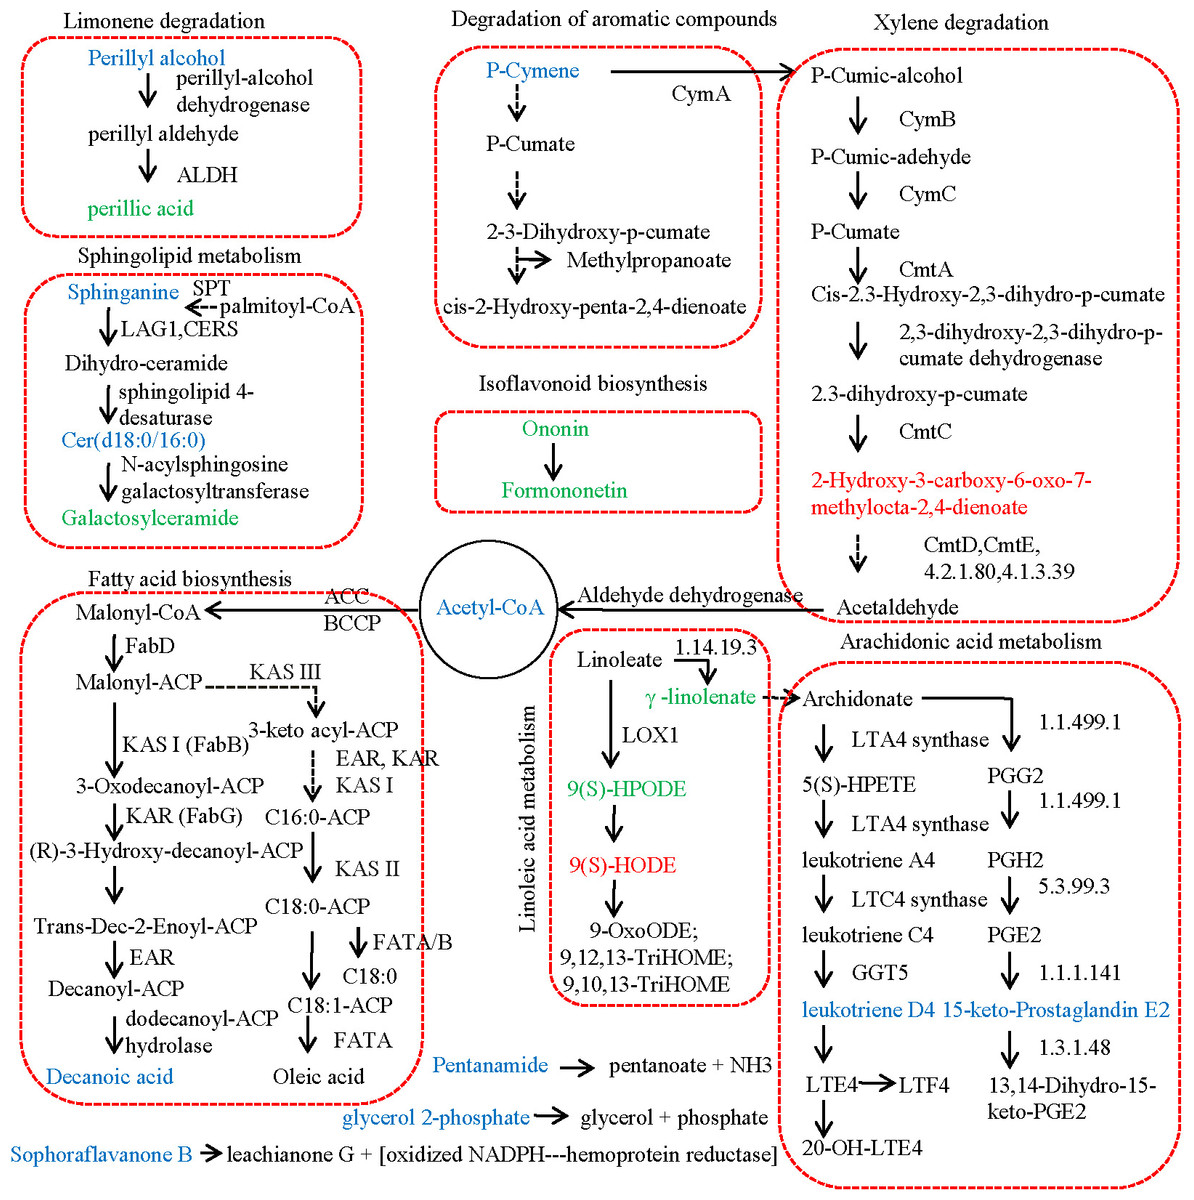
Figure 3: Metabolic pathway of differential metabolites relating to lipid in JZ and KLD fruits.
The metabolites with lower content and higher abundance in KLD than those in JZ are marked in green and blue, respectively.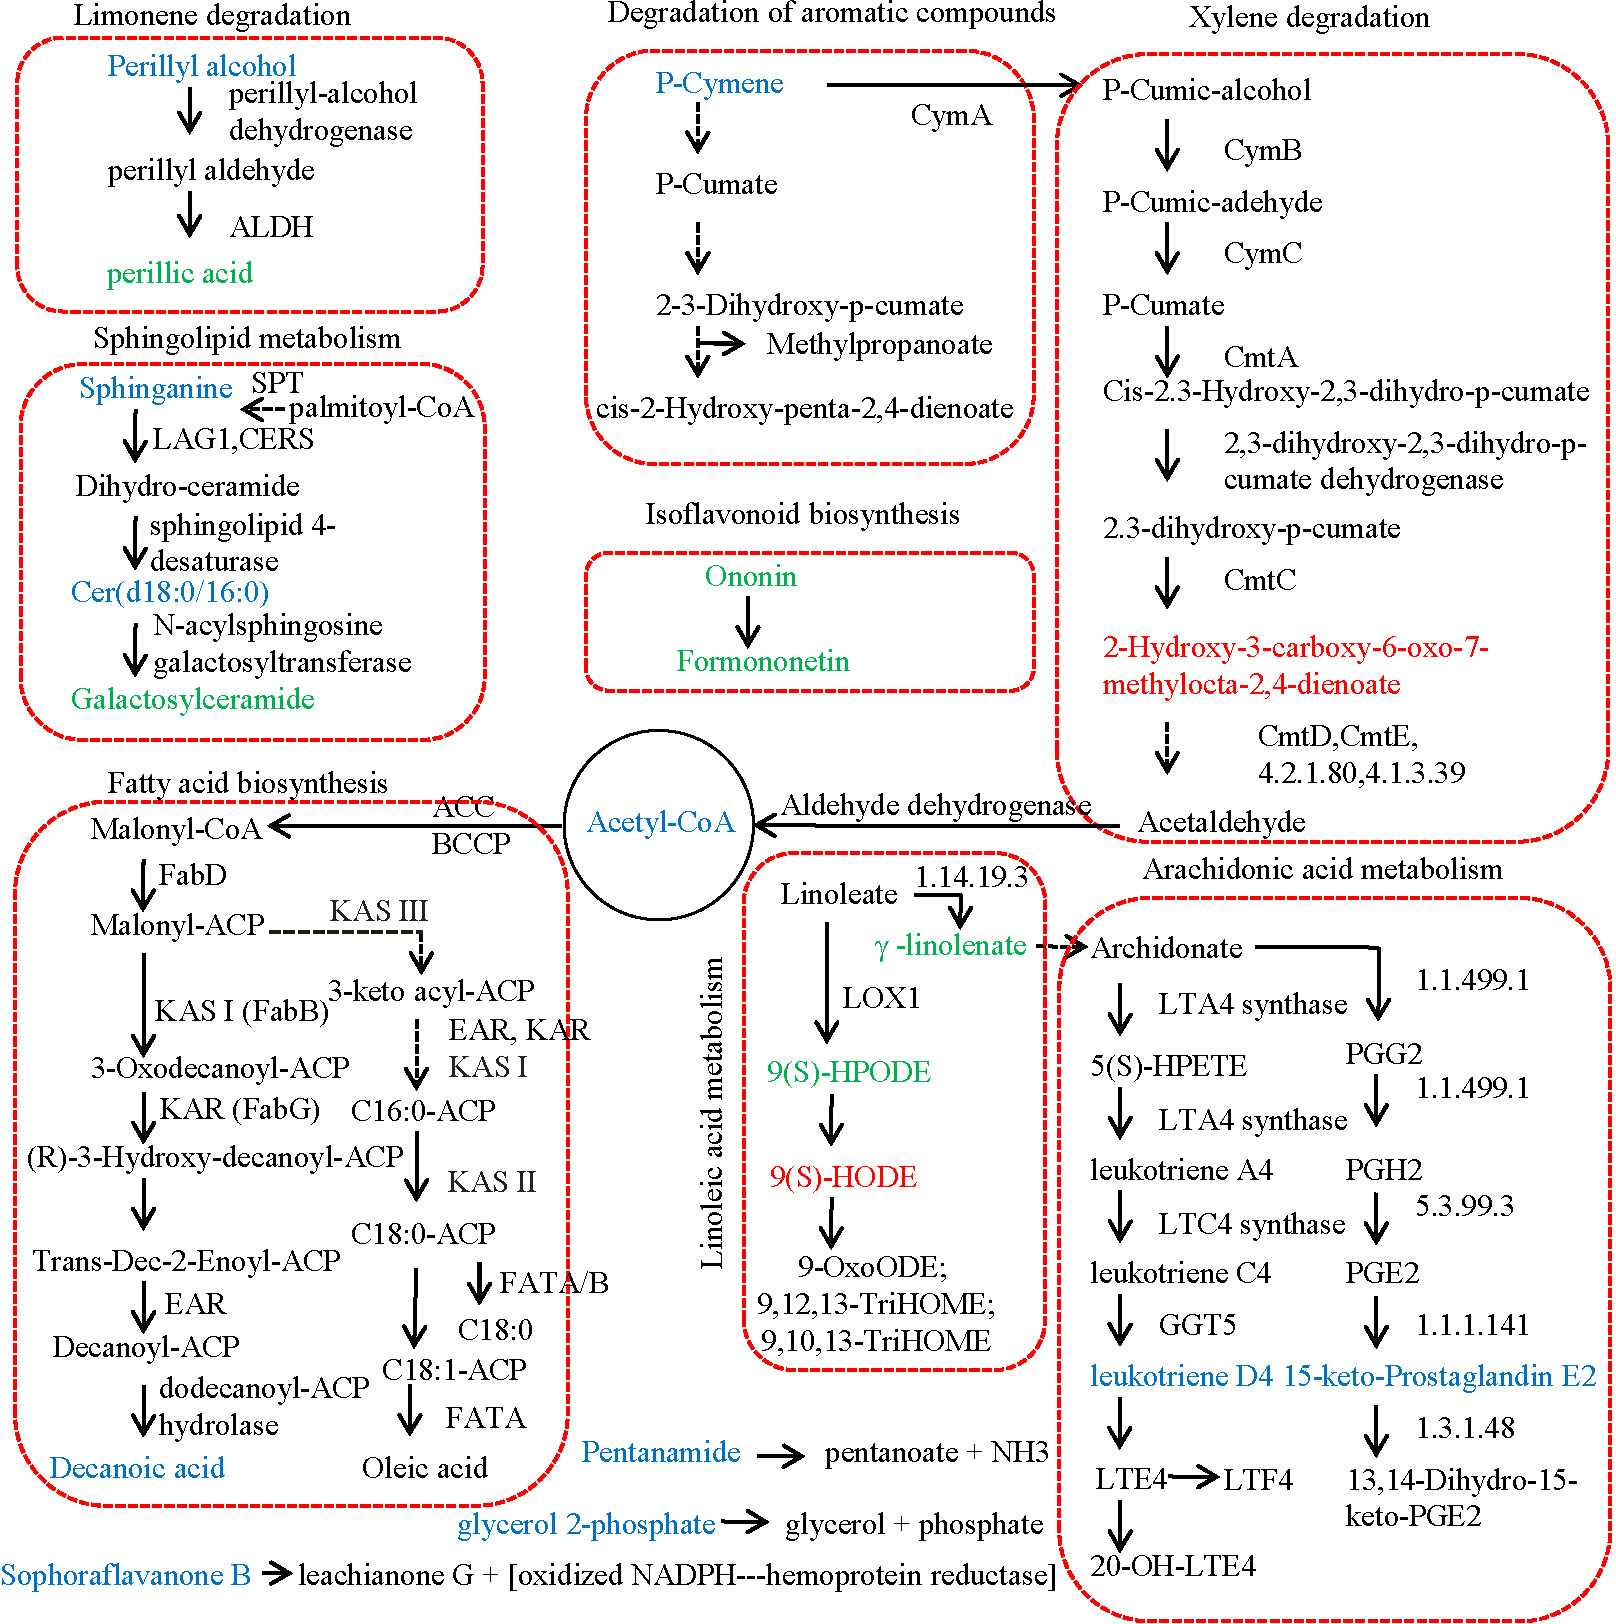
Figure 4 showed the results of integrated analysis of DAMs and DEGs in fruits of JZ and KLD at MI-3 stage. Combined KEGG enrichment analysis of DAMs and DEGs showed that only the FA synthesis pathway showed consistent expression pattern with significantly differences (P < 0.05) (Fig. 4A). Correlation network of DAMs and DEG involved in lipids of olive fruits showed that six lipid compounds were significantly correlated with 48 DEGs (Fig. 4B, Table S6). Four of these five compounds were upregulated in KLD, except perillic acid (Table S5). In Fig. 4B, the green line represented a positive correlation between DAMs and DEGs, while the black line represented a negative correlation. The thicker the line, the higher the correlation value. Pink genes were up-regulated expression in KLD, while black genes were down-regulation in KLD. Figure 4C showed expression pattern of the 48 DEGs of KLD and JZ fruits at MI-3 stage. Eight out nine DEGs having positive correlations with decanoic acid were up-regulated in KLD; a down-regulated gene in KLD, EVM0023073 was negatively correlated with decanoic acid (Fig. 4B). If the correlation coefficient between DEGs and DAMs in KLD was positive, it indicated that metabolites increased with the increasing of gene expression level; on the contrary, metabolites increased as gene expression levels decrease. Therefore, the decanoic acid content in KLD was 2.33 times greater than that in JZ (Table S5). Similarly, perillyl alcohol, leukotriene D4, glycerol 2-phosphate, and sphinganie metabolites were significantly higher accumulated in KLD than in JZ (Fig. 4B). Whereas, perillic acid was significantly lower in KLD than in JZ. The correlations between EVM0039296, EVM0042586 and perillic acid were negative, and the two DEGs were up-regulated genes in KLD. The higher the expression level of EVM0039296 and EVM0042586, the lower the perillic acid in KLD (Fig. 4B). In additions, EVM0027624, EVM0060777, and EVM0037656 were positively correlated with perillic acid, and these three genes were down-regulated in KLD (Fig. 4C), causing a decrease of perillic acid in KLD (Fig. 4B). In addition, there were 15 enzyme genes involved in the fatty acid synthesis pathway (Table S6). Sequence alignment results showed that genes identified in this study had not been reported yet, because the best identity and coverage between them were 100% and 99%, e.g., EVM0031337 and OE6A094355T1 (Table S6).
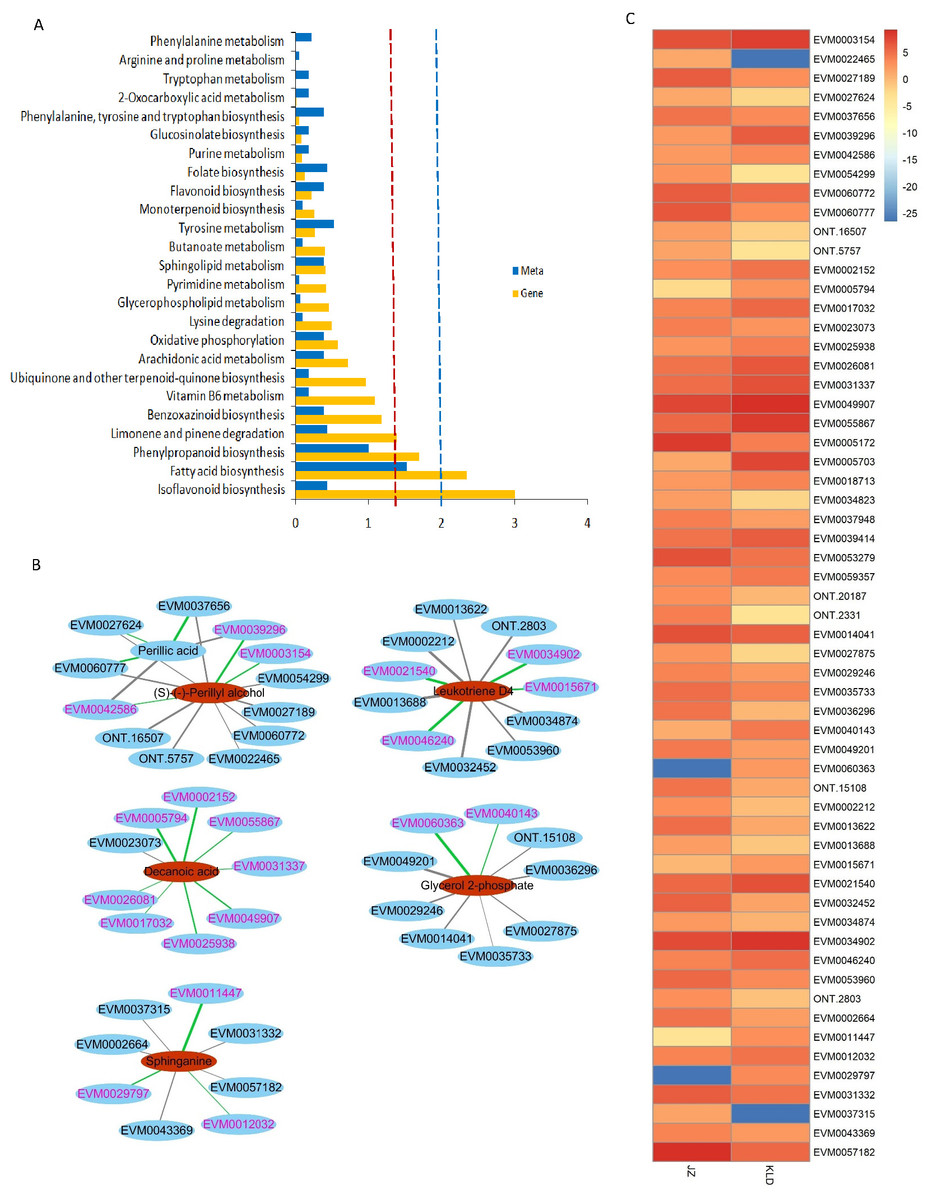
Figure 4: Integrated analysis of differentially accumulated metabolites (DAMs) and differentially expressed genes (DEGs) in JZ and KLD fruits.
(A) KEGG enrichment analysis of the DEGs (blue column) and DAMs (yellow column) that are enriched in the same metabolic pathway. The red and blue dotted lines represent P-values less than 0.05 and 0.01, respectively. (B) Connection network of DEGs and DAMs of olive fruits. (C) Expression pattern of genes involved in lipids of DAMs in JZ and KLD fruits.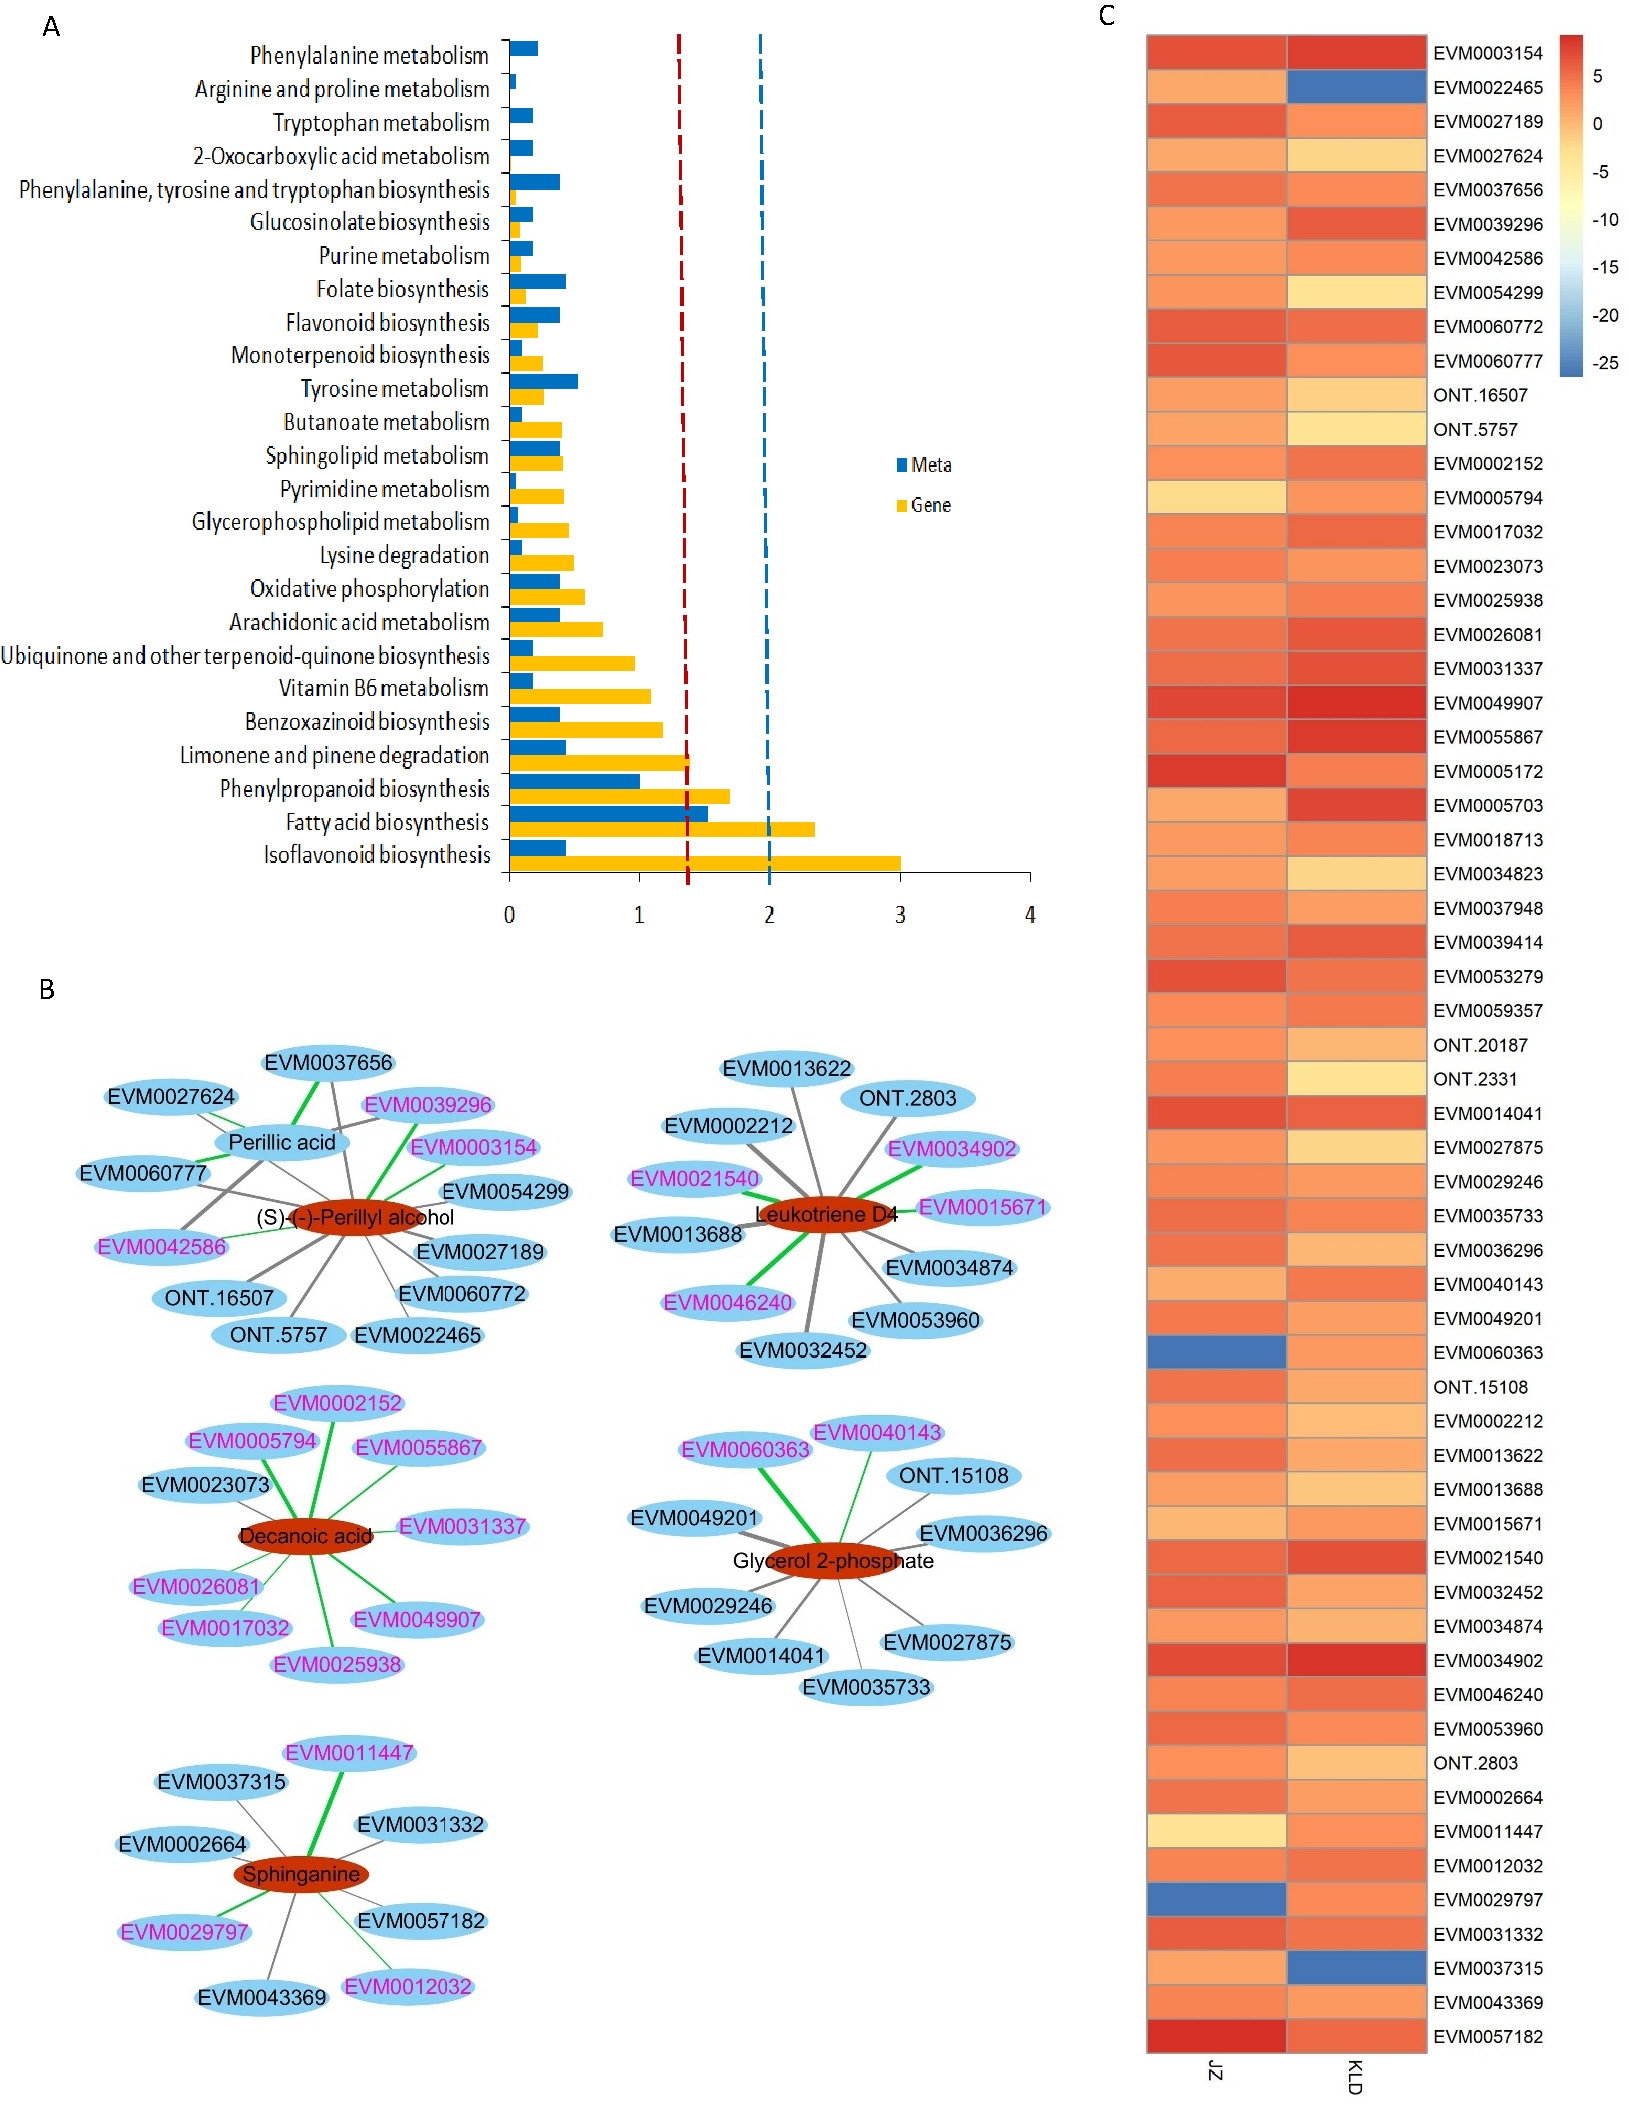
Discussion
Variations in lipid metabolites of JZ and KLD fruits
Olive fruits contain various kinds of FAs (Contreras et al., 2020; Hernández et al., 2019), whose synthesis and metabolism involve a variety of lipid substances. In recent years, metabolomics has been widely used to study FAs and their secondary metabolites in olive fruits, and to reveal the synthesis and metabolism mechanism of FAs (Rao et al., 2017; Liu et al., 2020). In order to identify the causes of lipid variations in the fruits of different varieties of olive, the metabolites of JZ and KLD fruits at MI-3 stage were detected by UHPLC-QTOF-MS non-target metabolomics. The real biological compounds from test samples and contaminants from sample collection and processing will be detected in the untargeted metabolomics analysis, as well as matrix effects and noise deriving from the computational algorithm (Frigerio et al., 2022). Previous studies have shown that using a pooled quality control (QC) sample can reduce matrix effects, noise and contaminants (Frigerio et al., 2022). A solution obtained by mixing an equal volume of each test sample is often used as pooled QC sample for untargeted metabolomics analysis (Kirwan et al., 2022). Then, compounds not detected or with a low detection rate and with a high relative standard variation in QC analyses will be filtered out from the data matrix (Frigerio et al., 2022). This approach is widely used in the untargeted metabolomics analysis (Godzien et al., 2015; Frigerio et al., 2022; Kirwan et al., 2022). In this study, we used a pooled QC solution from JZ and KLD for quality control. Moreover, L-2-chlorophenylalanine is used as an internal standard in this study, which has been widely used as an internal standard in lipids metabolism analysis for reducing matrix effects (Li et al., 2018; Ribbenstedt, Ziarrusta & Benskin, 2018; Chen et al., 2022; Liu et al., 2024). These approaches improve the accuracy of metabolite identification. PCA was carried out to detect the variations of samples from different groups (Lin et al., 2016). The total cumulative explained variance ratio of first two principal components was counting for 78% (Fig. 1A). This suggests that this PCA model can retain most of the information. Fruit samples of JZ are clearly separated from those of KLD (Fig. 1A). This result shows that there are evident variations in metabolites between them. Correlation analysis is generally used to evaluate the correlation among different biological replicates (Yang et al., 2010). Correlations of different biological replicates were considered good for SRC coefficient absolute values from 0.8–0.89, fair for values from 0.7–0.79, and poor for values less than 0.7 (Lemarignier et al., 2017). Most of biological replicate for JZ and KLD fruits have good or even high correlations, only the JZ_b and JZ_c have fair correlation (Fig. 1B). This indicates that the metabolism data of JZ and KLD is reliable and reproducible. OPLS-DA is widely performed to highlight the variation of metabolites in plant and animals. R2Y and Q2 values from permutation test, reflecting the explained fraction of variance and the model predictability, are used to evaluate the quality of OPLS-DA model (Lin et al., 2016). When the R2Y and Q2 values are closer to 1, the more reliable the model is (Lin et al., 2016). In this study, the R2Y and Q2 values are 0.993 and 0.965 (Fig. 1C, Fig. S2), this suggests that the best fitted OPLS-DA model is stable and reliable. In summary, metabolites of JZ and KLD fruits were significantly different.
DAMs and DEGs involved in lipid compounds variations between JZ and KLD fruits
FA metabolism and accumulation in olive fruits involve complex metabolic pathways, such as FA synthesis, sphingolipid metabolism, and linoleic acid metabolism, and relates to a variety of lipid and non-lipid metabolites (Unver et al., 2017; Inês et al., 2018). We utilized transcriptome and metabolome analyses to explore the variations of lipid and molecular mechanism underlying in different olive cultivars at MI-3 stage. There were 38 lipid compounds of 375 differential metabolites detected in JZ and KLD fruits. Among these 38 compounds, p-cymene was a kind of prenol lipids, which was finally decomposed into acetyl-CoA through the xylene degradation pathway. Our results showed that the content of acetyl-CoA in KLD fruit was 6.87 times higher than that of JZ (Fig. 2D, Table S5), ultimately providing more acetyl-CoA raw materials, compared with JZ fruit, for the metabolic pathway with acetyl-CoA involved. Acetyl-CoA is involved in several metabolic pathways, including the TCA cycle, FA biosynthesis, elongation, degradation, and FA metabolism (Riezman, 2007). In FA biosynthesis, acetyl-CoA is catalyzed into malonyl-CoA by acetyl-CoA carboxylase (ACC) and biotin carboxyl carrier protein (BCCP) in FA biosynthesis (Unver et al., 2017). Previous study has reported that down-regulated expression of BCCP genes lead to reduction of FA content in olive cultivar Leccino (Liu et al., 2021). In this study, we identify three BCCP genes in KLD, including EVM0009821, EVM0053294, and EVM0055867 (Table S6). Among them, EVM0053294 and EVM0055867 are highly up-regulated in KLD comparing to JZ at MI-3 stage (Table S6). We have reported that the oil content of KLD and JZ fruits at MI-3 stage was accounting for 31.27% and 14.52% on a dry basis (Qu et al., 2022), and the oil content of KLD is 2.15 times greater than that of JZ. These results prove that the overexpression of EVM0053294 and EVM0055867 can increase the oil content of olive seed, which is consistent with Liu’s result (Liu et al., 2021). Then, malonyl-CoA is catalyzed into C16:0-ACP by β-ketoacyl-ACP synthase (KASI/III), Enoyl-ACP reductase (EAR), and β-ketoacyl-ACP reductase (KAR) (Fig. 3, Zhou et al., 2024). There are seven KAR and one EAR genes significantly expressed between JZ and KLD (Table S6). All of KAR and EAR genes are up-regulated in KLD, and two KAR genes even have more than 20-fold changes in KLD (Table S6). Though we have not detected the variance for all the medium and long chain fatty acids, some medium chain, long chain fatty acids or their derivatives are up-regulated in KLD, such as decanoic acid, 12-hydroxydodecanoic acid, tridecanoic acid, and 2-dodecenal (Table S6). This demonstrates that the overexpression of KAR and EAR genes promote carbon chain extension in olive. Up-regulated expression of the KAR and EAR genes increasing the oil content also have been observed in cottonseed and oil palm (Zhou et al., 2024). Subsequently, KAS II catalyze C16:0-ACP into C18:0-ACP, and fatty acyl-ACP thioesterase A/B (FATA/B) catalyze the ACP into free FA (Fig. 3). FATA specifically catalyze hydrolysis of oleoyl-ACP (C18:1-ACP) into oleic acid (C18:1) (Resetic et al., 2013). In this study, we identify an up-regulated expression gene of FATA (EVM0031236) in KLD, whose expression level of KLD is 2.16 times more than that of JZ (Table S6). This value is very close to total oil content difference between KLD and JZ, whose oil content in KLD is 2.15 times more than that of JZ (Qu et al., 2022). Because the proportion of oleic acid in total oil for KLD and JZ is at 76% (Nissim et al., 2020) and 75.11% (Topi et al., 2021), which are very closer. Similarly, up-regulated expression of FATA gene leads to a higher accumulation of oleic acid in olive cultivar Leccino (Liu et al., 2021). These results suggest that overexpression of FATA genes can increase the content of oleic acid, and finally improve the oil production of olive fruits. Oleic acid is a monounsaturated fatty acid. The accumulation of unsaturated fatty acid has similarly been observed in castor-oil plant (Huang et al., 2016), because of the high expression level of FATA than FATB. On the contrary, the highly expressed of FATB than FATA in oil palm and date palm contribute to the accumulation of saturated palmitic acid (Huang et al., 2016). This indicates that the expression level of FATA and FATB directly affect the proportion of unsaturated fatty acids and saturated fatty acids in oil. The monounsaturated fatty acids proportion in olive fruit is an important index for evaluating the quality of olive oil, especially the content of oleic acid (Wang et al., 2019). Intake of a higher proportion monounsaturated fatty acids in the diet can reduce the risk of cardiovascular disease and stroke (Donat-Vargas et al., 2022). Thus, olive oil with higher oleic acid content has greater commercial and nutritional values. Our finding indicates that the overexpression of FATA (EVM0031236) in KLD can produce more oleic acid than JZ. These results can provide new strategies of olive molecular breeding for improving oil content and quality. Moreover, previous studies have shown that the TCA cycle can regulate FA synthesis and metabolism (Liu et al., 2020). In our study, none of the metabolites showing significant variation in TCA cycle is detected between KLD and JZ, indicating that the differences in lipid contents between KLD and JZ are not caused by TCA cycle. In addition, acetyl-coA is finally converted into decanoic acid in the FA biosynthesis pathway (Fig. 3). Decanoic acid is a medium chain saturated FA with 10 carbon atoms, and both olive and canola fruits usually contain a certain amount of decanoic acid (Larson et al., 2002). However, the molecular mechanism of decanoic acid biosynthesis in olive fruit is unclear. In this study, the integrated analysis of DAMs and DEGs reveals that the increase of decanoic acid in KLD is affected by nine DEGs (Fig. 4B). Four of nine DEGs are up-regulated expression enzyme genes, including enoyl-ACP reductase (EAR, EVM0026081), KAS (EVM0002152), KAR (EVM0031337), and ACC (EVM0049907) (Table S6). Previous studies have focused on the expression pattern of FATB and FATA, showing an increase in the proportion of medium-chain FA content in Brassica napus, Camelina sativa (Iskandarov et al., 2017), and palm seeds (Huang et al., 2016). But the molecular mechanism of decanoic acid biosynthesis about other enzyme genes in olive fruit is rarely reported. Thus, the four enzyme genes identified in olive fruits can be used to comprehensively analyze the molecular mechanism of decanoic acid synthesis. Overexpression of EAR, KAS, KAR and ACC genes were also observed promoting the accumulation of C16:0-ACP in olive (Fig. 3). Decanoic acids can improve weight loss comparing with long-chain fatty acids (St-Onge & Bosarge, 2008), and can be used as ketogenic diets in epilepsy treatment (Warren et al., 2021). Our result displays that oil of KLD contains 2.33 times of decanoic acid greater than JZ (Table S5), suggesting that the oil of KLD might have more values in weight loss and disease treatment than that of JZ.
In sphingolipid metabolic pathway, palmitoyl-CoA is catalyzed into sphinganine by serine palmitoyltransferase (SPT) and 3-dehydrosphinganine (Fig. 3). The integrated analysis of DAMs and DEGs identify an up-regulated expression of SPT gene (EVM0012032) in KLD (Table S6). This result suggests that KLD fruits can produce more sphinganine than JZ (Fig. 2D). The sphinganine and ceramide (Cer(d18:0/16:0)) belong to sphingolipids (Inês et al., 2018). Sphingolipids contribute to plant cell multiplication and enlargement, which produce amounts of membrane matrix and larger fruits (Inês et al., 2018). Similar results have been reported in cotton and Arabidopsis (Inês et al., 2018; Yang et al., 2023). Our result shows that the contents of sphinganine and ceramide in KLD are greater than that of JZ (Table S5, Fig. 2D), causing the larger fruit size and higher amounts of membrane matrix for KLD than JZ (Qu et al., 2022). In olive fruit, oil accumulation takes place mainly in the fleshy mesocarp (Hernández, Sicardo & Martínez-Rivas, 2016). Larger fruit size and higher amounts of membrane matrix can be benefit for lipids accumulation. Thus, the oil content of KLD is greater than that of JZ (Qu et al., 2022). The SPT gene (EVM0012032) can be used to reveal the molecular mechanism about olive fruit size development. Furthermore, previous studies demonstrated that a SPT gene (Unigene ID: OL002160) is also positively associated with fruits ripening, whose highest expression level was observed in olive fruit at the onset of ripening (Inês et al., 2018). We have identified a SPT gene (EVM0012032). However, the expression pattern of EVM0012032 is different from OL002160. EVM0012032 is not a DEGs during the development of JZ or KLD fruits (Qu et al., 2022). This suggests that EVM0012032 might not involve in the olive fruit ripening, and it only have effect on the fruit size. This result can be used for further research on the molecular mechanism about olive fruit size development, and provide useful information for the cultivation of new varieties.
Lipid oxidation will lead to food deterioration in terms of flavor, taste and nutritional value (Ito et al., 2017). In linoleic acid metabolism, 9(S)-HPODE is oxidize from linoleic acid by lipoxygenase (Reverberi et al., 2010). Although 9(S)-HPODE, which is not a lipid compound, was not detected in KLD, its racemic mixture (±)9-HpODE has been detected. The content of (±)9-HpODE in KLD was lower than that in JZ, suggesting that the linoleic acid content decomposed in KLD was less than that in JZ. Meanwhile, the lower content of (±)9-HPODE in KLD represents weak oxidation effect on linoleic acid of lipoxygenase (Ito et al., 2017). This could be more beneficial for the storage of olive oil.
γ-Linolenate is used to produce two types of fatty amides, i.e., leukotriene D4 and 15-keto-prostaglandin E2, in the arachidonic acid metabolic pathway. Both leukotriene D4 and 15-keto-prostaglandin E2 can modulate the inflammatory response in human body (Jara et al., 2020). However, their roles in fatty acid synthesis have not been reported yet. The integrated analysis of DAMs and DEGs identify an up-regulated gamma-glutamyltranspeptidase (GGT5) gene in KLD, which is EVM0015671 (Table S6). Our result demonstrates that the overexpression of EVM0015671 can produce more leukotriene D4 in KLD than that of JZ (Fig. 2D). This result can be used to reveal the molecular mechanism about the synthesis of leukotriene D4 in the future.
In the limonene degradation pathway, perillyl alcohol is converted to a non-lipid compound of perillic acid by perillyl-alcohol dehydrogenase and aldehyde dehydrogenase (Fig. 3). Previous study shows that aldehyde dehydrogenase (ALDH) can convert acetaldehyde into acetate, and it presented indirectly affect the biosynthesis of fatty acids in palm (Asadi et al., 2023). The integrated analysis of DAMs and DEGs identify four ALDH genes, including EVM0027624, EVM0037656, EVM0039296, and EVM0042586 (Table S6). Though EVM0027624 and EVM0037656 are down-regulated in KLD, the expression levels of EVM0039296 in KLD is more than twice of EVM0027624 and EVM0037656 in JZ (Table S6). This causes a large amount of perilla alcohol to be decomposed into perilla acid in KLD, ultimately leading to an increase of perilla acid in JZ (Fig. 2D). Perillyl alcohol plays a role in some disease treatment like cancer, diabetes, and parkinson (Saeidnia, 2015). Our results suggest that KLD have greater medical values than JZ in some disease treatment. Furthermore, the four aldehyde dehydrogenase genes in this study can be used to comprehensively analyze the metabolic pathways of limonene degradation.
Conclusions
In this study, untargeted metabolomics integrated with transcriptome analysis were used to investigate the differential metabolites and genes related to lipid metabolism compounds in KLD and JZ fruits at MI-3 stages. There were 38 DAMs detected between JZ and KLD fruits, which are mainly involved in FA synthesis, sphingolipid metabolism, and linoleic acid metabolism pathway. A total of 48 novel DEGs associated with six lipid differential metabolites were detected between JZ and KLD. In particular, two BCCP, one ACC, seven KAR, one EAR, one FATA and one SPT genes were observed involving to the content and quality of lipids in olive fruits. This study provides a strong theoretical and experimental foundation for further revealing the molecular mechanisms regulating lipid synthesis and metabolism in different olive cultivars.