
Mapping the global distribution and conservation status of oases—ecosystems of pivotal biocultural relevance
- Published
- Accepted
- Received
- Academic Editor
- Stuart Pimm
- Subject Areas
- Conservation Biology, Ecology, Environmental Sciences, Coupled Natural and Human Systems, Spatial and Geographic Information Science
- Keywords
- Biocultural diversity, Biodiversity, Conservation, Drylands, Heritage, Land use, Literature review, Machine learning
- Copyright
- © 2025 Hernández-Agüero et al.
- Licence
- This is an open access article distributed under the terms of the Creative Commons Attribution License, which permits using, remixing, and building upon the work non-commercially, as long as it is properly attributed. For attribution, the original author(s), title, publication source (PeerJ) and either DOI or URL of the article must be cited.
- Cite this article
- 2025. Mapping the global distribution and conservation status of oases—ecosystems of pivotal biocultural relevance. PeerJ 13:e18884 https://doi.org/10.7717/peerj.18884
Abstract
Background
Oases are azonal, highly productive, densely vegetated areas within drylands, often converted to agriculture, and characterized by significant biocultural diversity. Despite their importance, comprehensive information on the global distribution and biocultural diversity of oases has been lacking.
Methods
To address this gap, a detailed bibliographic search and random forest modeling were combined to create a global map of oases, with a focus on Asia and North Africa (ANA).
Results
In the ANA region, oases cover 1.5% of the dryland area and are populated by 150 million people, with an additional 268 million people living nearby and most likely being dependent on them. Globally, oases contain more than 8,200 vertebrate species, of which 13% are classified as threatened. However, less than 0.5% of their total area is currently under protection, making oases one of the least conserved ecosystems worldwide. These findings highlight the distinct biocultural, ecological, and geopolitical importance of oases, which are increasingly threatened by climate change and direct human impacts. Despite their significance, oases remain undervalued, emphasizing an urgent need for developing adaptative strategies to sustainably manage these pivotal ecosystems.
Introduction
Drylands cover almost 41 per cent of the global surfaces (excluding Antarctica) (Vicente-Serrano et al., 2024), harbor close to 40% of the total human population (Reynolds et al., 2007), and are home to species with unique traits, including important crops (Shachak et al., 2005; Buerkert et al., 2005; Buerkert, De Langhe & Al Khanjari, 2009; Davies et al., 2012). Drylands exhibit scarce and unpredictable precipitation patterns (Reynolds et al., 2007), and evapotranspiration exceeds mean precipitation by a factor of 1.5 or more (i.e., aridity index below 0.65; Safriel et al., 2005; Davies et al., 2012). Due to strong climatic constraints, drylands are very sensitive to global change (Reynolds et al., 2007); at the same time, they exhibit a high potential to alleviate its effects (Li et al., 2015). Drylands can contribute significantly to global net primary productivity (NPP) (Lal, 2019), despite being strictly controlled by water availability (Maestre et al., 2016). Simultaneously, irrigated arid lands have been identified as potentially large carbon sinks (Li et al., 2015).
Water is a scarce resource in drylands, with groundwater–often of fossil origin–as the main source (Church, 1996; Faure, Walter & Grant, 2002; Gossel, Ebraheem & Wycisk, 2004; Ward, 2016). Where water emerges to the surface, areas of high productivity in an otherwise arid or hyper-arid matrix are created, allowing oases to form and sustain (Faure, Walter & Grant, 2002; Ling et al., 2013; Chen et al., 2022).
Oases (ouahe in the demotic language of ancient Egypt; Harper, 2023) are defined in the literature as azonal (Jia et al., 2004) and highly productive (Chen et al., 2022) areas, often with permanent dense vegetation or converted into agricultural land (de Haas & El Harradji, 2001; Liu, Wang & Xin, 2022). Oases are characterized by a certain level of spatial isolation (Zhang et al., 2012; Powell & Fensham, 2016). They are considered as inland wetlands (Ramsar, 2013), also called “islands of fertility”, with nutrient enrichment (Chen et al., 2007) as well as a unique microclimate (Lü, An & Chen, 2004) and vegetation structure (Gebauer et al., 2007; Guezoul et al., 2013).
Oases are characterized by distinct biocultural diversity (Tydecks et al., 2023), and they facilitate biological and cultural exchange through otherwise highly impermeable regions (Shachak et al., 2005; Buerkert, De Langhe & Al Khanjari, 2009; Zhang et al., 2012; Tydecks et al., 2023). Oases provide manifold ecosystem services such as high primary productivity, distinct bio- and agrodiversity, recreation values, as well as cultural services represented by local and traditional knowledge systems, cultural heritages, and sense of place (Liang & Liu, 2017; Santoro, 2023). Oases can serve as pivotal stepping stones, further facilitating biological (Safriel et al., 2005; Davies et al., 2012) and cultural diversity and evolution (e.g., ancient Silk Road; Zhang et al., 2012).
Oases are of both natural or artificial origin (Zu et al., 2003). Naturally, they are either fed by rivers (linear oases), groundwater (isolated oases), temporary flow (source oases; de Haas & El Harradji, 2001) or fog (fog oases; Moat et al., 2021). Fog oases are found along the coasts of Chile, Peru and Namibia and rely on seasonal fog as their primary water source. They are “ecological islands”—ephemeral, woody, or herbaceous—hosting endemic plants and crop wild relatives (Beresford-Jones et al., 2015). However, artificial oases are classified as modern or traditional oases depending on the mode of agricultural management (Santoro, 2023).
Previous studies on oasis delineation have focused on single oases (Yan & Guo, 2019; Mihi, Tarai & Chenchouni, 2019) or on groups of oases within a single basin (Wei et al., 2020; Lei et al., 2020; Ainiwaer, Ding & Kasim, 2020). A variety of techniques has been employed to delineate oases, including image segmentation (Liu, Wang & Xin, 2022), the U-Net model (Salih, Hassaballa & Ganawa, 2021), spatial entropy (Huang et al., 2020), random forest (Wolf et al., 2016; Chen et al., 2022) or manual digitalization (Moat et al., 2021). Previous research has applied land cover maps of drylands to identify oases as any land use other than bare land and permanent snow and ice (Chen et al., 2024).
The most prevalent methodology employed to delineate oases is the utilization of normalized difference vegetation index (NDVI) thresholds in arid regions (Luedeling & Buerkert, 2008; Xie et al., 2018; Bai et al., 2023; Baioni, Fiantanese & Porta, 2024; Cui et al., 2024). Research primarily covered the human-made expansion of oases (Chen et al., 2022) or focused on their hydrology and the related water risks (Liu & Shen, 2018; Huang et al., 2020). Typically, comprehensive studies about oases distribution and delineation are limited to one (Luedeling & Buerkert, 2008; Li, Feng & Guo, 2008; Ait-El-Mokhtar et al., 2020; Chen et al., 2022; Liu, Wang & Xin, 2022) or two countries (Moat et al., 2021), partly due to their complex and diverse origin and typology (Luedeling & Buerkert, 2008).
Recent studies have contributed significantly in mapping the global distribution of oases. Two of these, either compilied a vast number of observations of oases, focusing on springs in drylands (Fensham et al., 2023a) or applied remote sensing techniques to track oasis trends over recent decades (Cui et al., 2024). Despite these advancements, there remains a critical lack of comprehensive and open-access data, on oasis biodiversity, conservation value and protection levels. This is of major concern considering a high degree of endemicity (Falcón-Brindis, Rodríguez-Estrella & Jiménez, 2019; Falcon-Brindis & León-Cortés, 2023; Fensham et al., 2023b) in oases.
There is a pressing need to advance conservation strategies that incorporate biological and cultural diversity, i.e., biocultural diversity, which is an emerging approach advocated by global organizations such as UNESCO & UNEP (2002), Millennium Ecosystem Assessment (2005) and, more recently, by IPBES (2019). Despite a growing interest in the interplay of human and nature, recent projects (Fensham et al., 2023a; Cui et al., 2024) focus mainly on the role of hydrology for the conservation of oases. Although being of crucial importance, our knowledge about the cultural values of oases and their multifaceted linkages with biological diversity remains fragmentary.
Finally, current analyses on oases are lacking comprehensive information on socio-economic aspects. While there is clear evidence that the majority of people in arid and hyper-arid areas lives in or adjacent to oases, we identified only one study on human population density in and around oases. In northern China, oases cover less than 5% of the entire territory but provide habitat for more than 90% of the respective human population (Li, Li & Wang, 2007).
Our goal is to establish a comprehensive data and knowledge base that covers the contemporary distribution, delineation and status of oases, globally, and specifically in the ANA (Asia and North Africa) region. We aim at providing–spatially explicit–information on fundamental environmental, biological and cultural characteristics of oases. To achieve this, we combined an empirical assessment with a modelling approach (i.e., a detailed bibliographic search with Random Forest modeling) to quantify i) the spatial distribution and delineation of oases, ii) their species diversity and conservation status, and iii) their human population density, land use, and overall cultural relevance. We are convinced that this comprehensive work may increase awareness about the pivotal biological and cultural importance of oases, stimulate interdisciplinary research in and of oases, and support the development and implementation of adequate conservation and adaptation measures.
Materials and Methods
To capture the current global distribution of oases and to create a comprehensive map of oases, geographic data was compiled by an extensive bibliographic search on studies of oases and by a citizen science photo project. This empirical work was integrated into a statistical modeling approach that is based on indicators derived from remote sensing data. This allowed us not only to delineate the oases identified in the literature but also to predict the location of all oases not covered by scientific publications (Fig. 1).
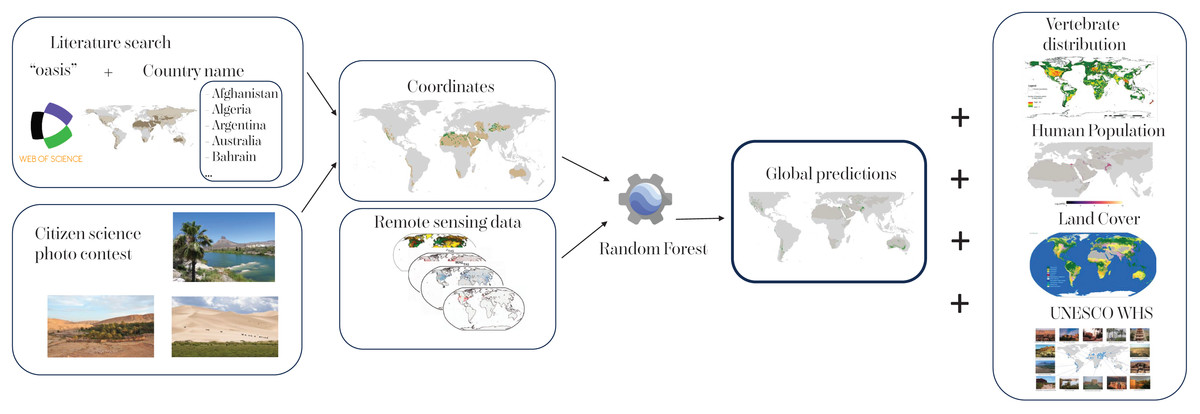
Figure 1: The methodology employed in the study.
Showcasing the sequential progression through data acquisition (left), preliminary distribution of oases based on data (left-middle), model projections (right-middle) resulting in a final map of sites for oases, and overlap with site characteristics regarding biodiversity, human population density and cultural meaning (right).
Bibliometric search
The literature search on the location and characteristics of oases was constraint in a meaningful way by selecting countries that, based on climatic conditions, are potential candidates for containing oases. Therefore, all countries with arid or hyper-arid areas (Sorensen, 2007), indicated by an average aridity index lower than 0.2, were selected (Fig. 2) by overlapping available dryland data (UNEP-WCMC, 2007) with global country boundaries (QGIS, 2021; version 3.22.0-Bialowieza). This yielded a list of 59 countries (Table 1). In the next step, bibliographical research in ‘Web of Science’ was confined by the word “oasis” (same spelling in English, French, and Spanish; i.e., “oasis” (All Fields) AND <country name in English> (All Fields)). We considered all articles published until 2023. For China, Spain, and the United States of America, we selected the first 689 articles found (i.e., the most accurate results in the bibliographic research). A total of 689 was selected as the maximum number of articles per country because it was the number of articles reviewed for Egypt, the country with the fourth highest number of research articles found in the bibliographic research. Hence, the time required for reviewing was limited without losing significant information, considering that for China, Spain, and the United States of America we found 6,023, 834, and 2,967 articles, respectively.
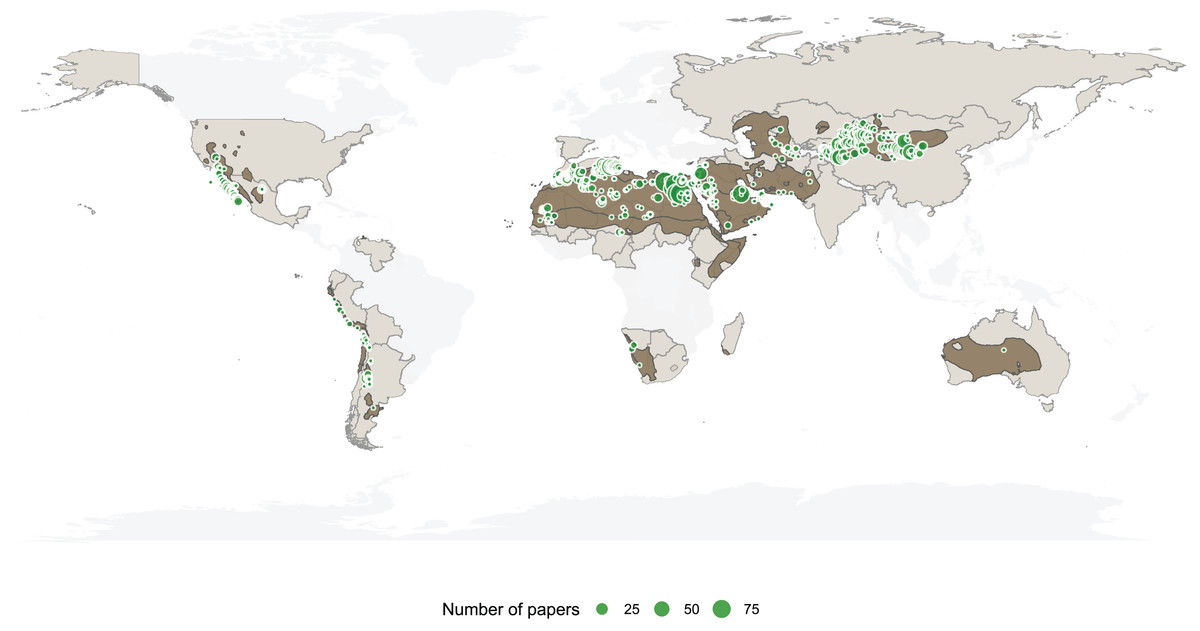
Figure 2: Research carried out on individual oases based on available literature, scaled to the number of articles.
Global distribution of arid and hyper-arid areas (aridity index value: <0.2) in brown and countries included in our bibliographic research in light brown. A high-resolution version of this figure is available in the Supplemental Materials.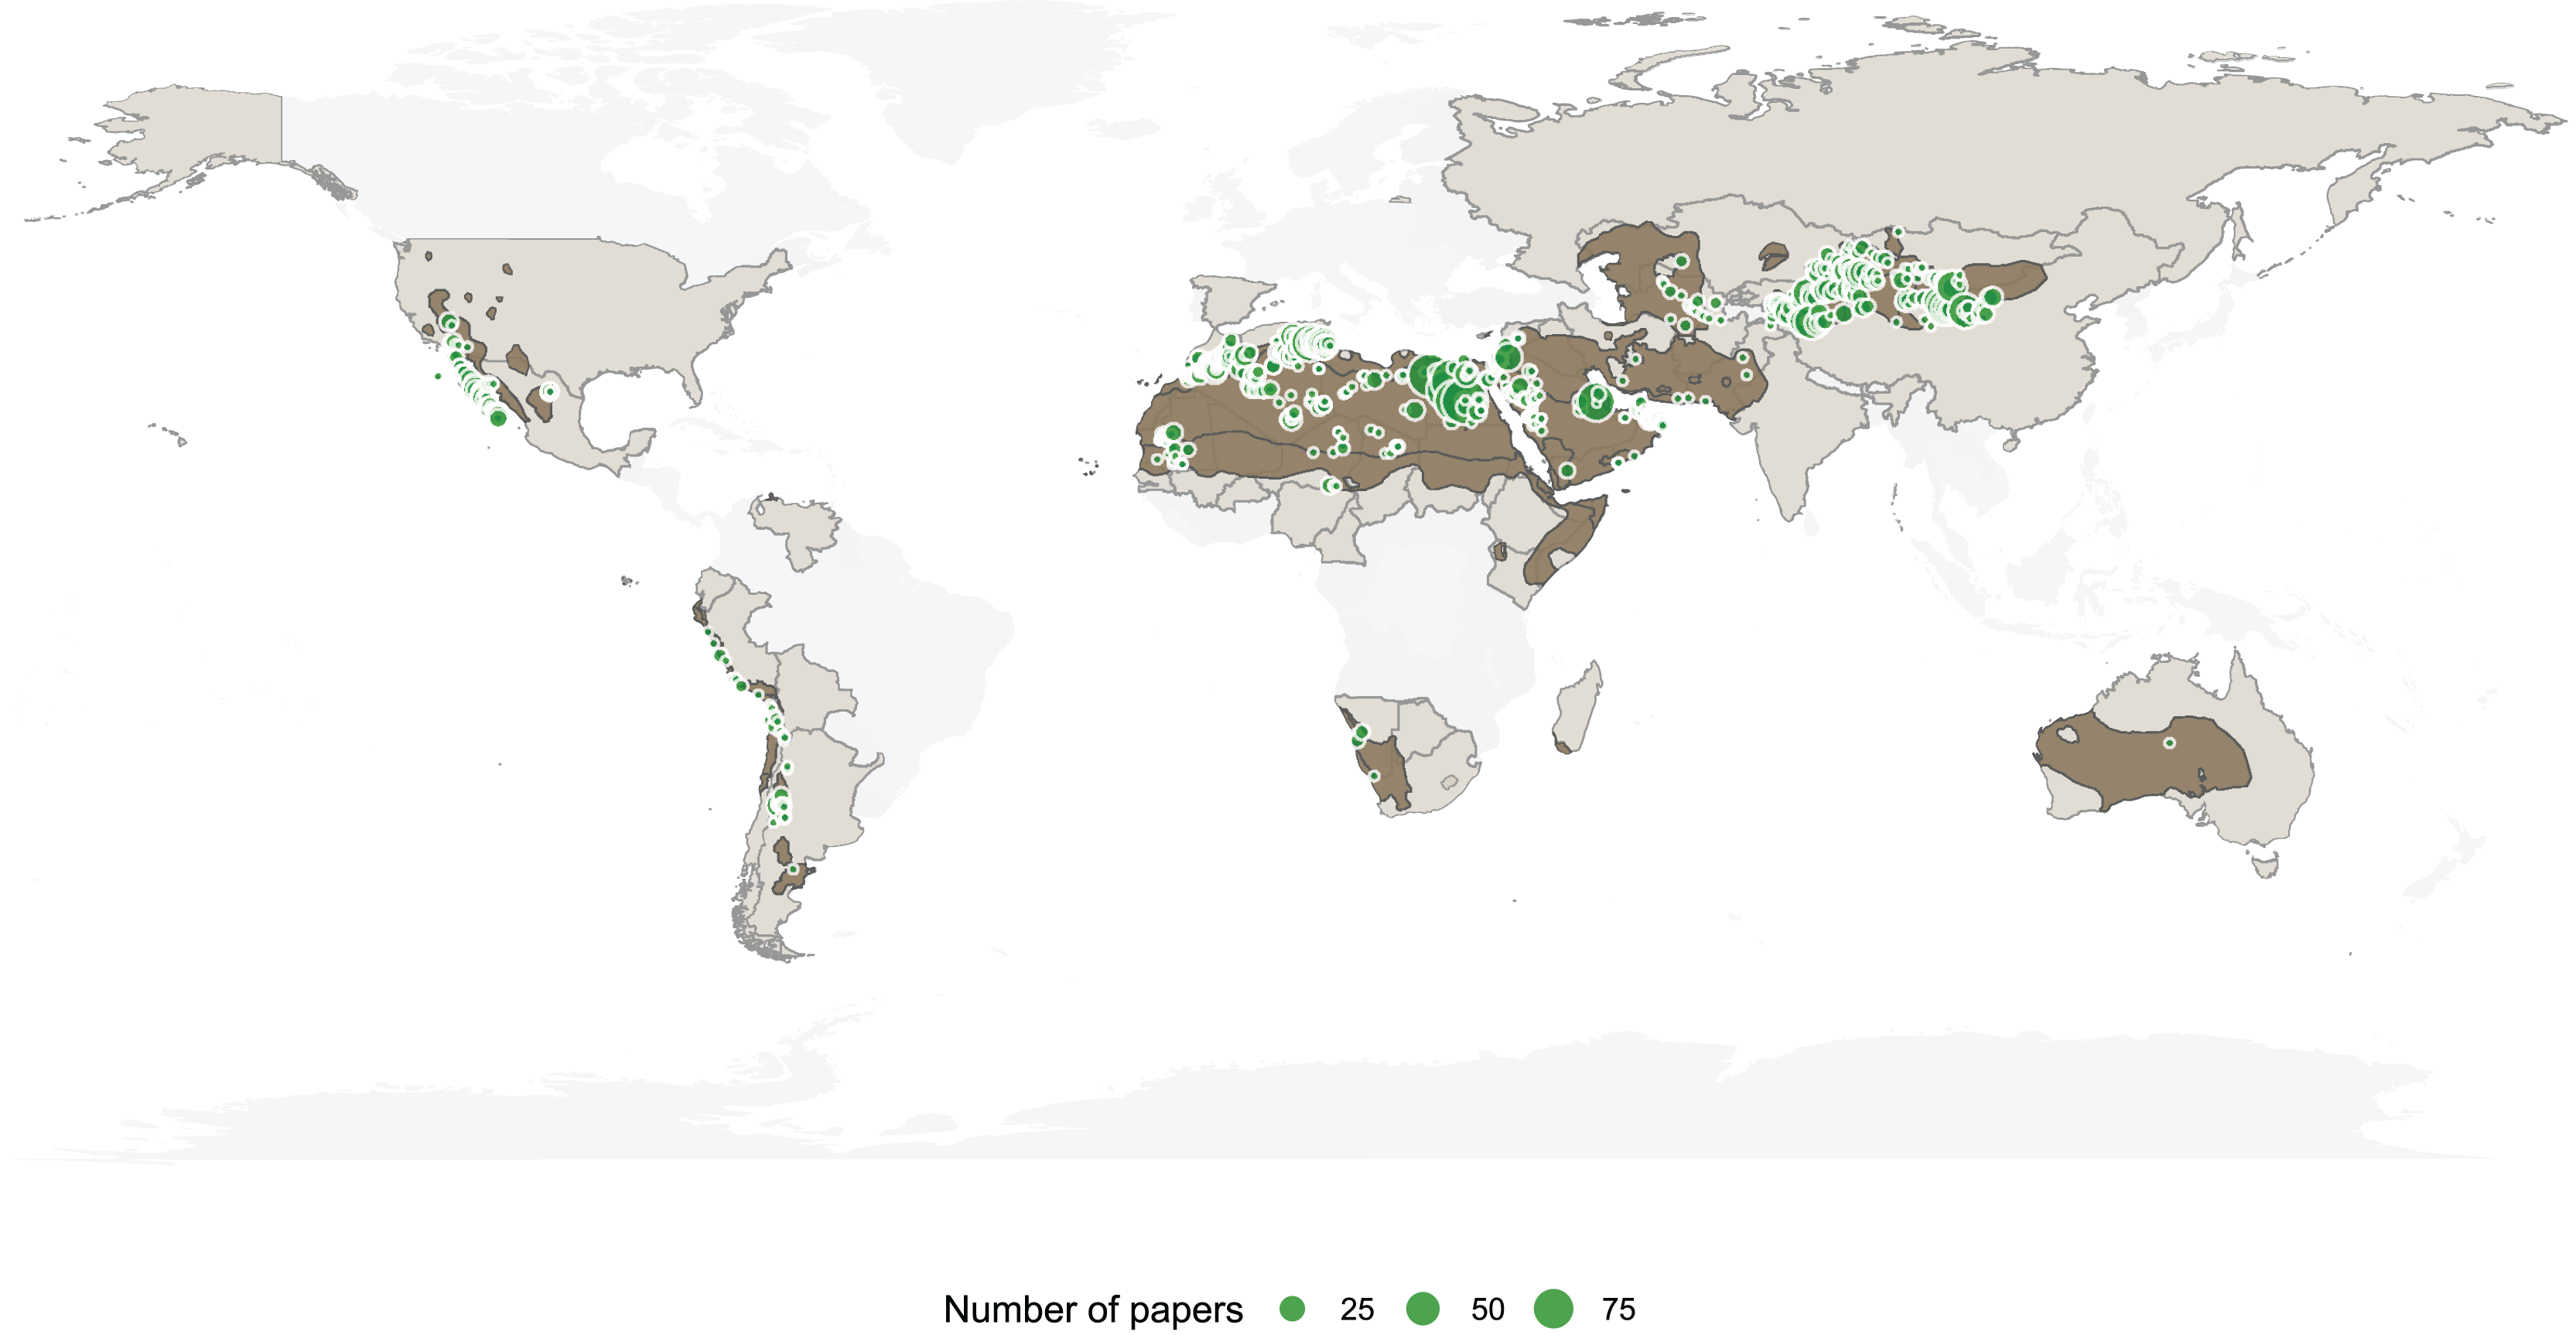
| Country | Papers in WoS | Papers in database | Oases in database | Country | Papers in WoS | Papers in database | Oases in database |
|---|---|---|---|---|---|---|---|
| Afghanistan | 6 | 0 | 0 | Mali | 20 | 1 | 0 |
| Algeria | 153 | 84 | 154 | Mauritania | 20 | 9 | 79 |
| Argentina | 149 | 22 | 33 | Mexico | 249 | 22 | 78 |
| Australia | 649 | 8 | 1 | Mongolia | 207 | 50 | 24 |
| Bahrain | 3 | 0 | 0 | Morocco | 238 | 85 | 174 |
| Bolivia | 8 | 1 | 0 | Niger | 27 | 5 | 9 |
| Botswana | 10 | 0 | 0 | Nigeria | 55 | 8 | 3 |
| Burkina Faso | 10 | 0 | 0 | Oman | 95 | 38 | 68 |
| Cameroon | 6 | 0 | 0 | Pakistan | 156 | 8 | 5 |
| Cape Verde | 7 | 0 | 0 | Palestine | 8 | 0 | 1 |
| Chad | 18 | 3 | 15 | Peru | 50 | 7 | 42 |
| Chile | 162 | 9 | 61 | Qatar | 17 | 0 | 0 |
| China | 689 | 442 | 198 | Russia | 211 | 1 | 0 |
| Cyprus | 11 | 4 | 0 | Saudi Arabia | 275 | 48 | 71 |
| Djibouti | 2 | 0 | 0 | Senegal | 10 | 1 | 0 |
| Ecuador | 5 | 0 | 0 | Somalia | 0 | 0 | 0 |
| Egypt | 689 | 350 | 40 | Somaliland | 0 | 0 | 0 |
| Eritrea | 5 | 1 | 0 | South Africa | 193 | 12 | 0 |
| Ethiopia | 34 | 1 | 0 | Spain | 689 | 16 | 0 |
| India | 505 | 4 | 0 | Sudan | 43 | 16 | 0 |
| Iran | 71 | 1 | 3 | Syria | 18 | 3 | 4 |
| Iraq | 18 | 1 | 0 | Tunisia | 392 | 154 | 132 |
| Israel | 172 | 24 | 9 | Turkmenistan | 26 | 4 | 12 |
| Jordan | 112 | 29 | 2 | UAE | 35 | 3 | 16 |
| Kazakhstan | 118 | 4 | 1 | USA | 689 | 42 | 23 |
| Kenya | 23 | 2 | 0 | Uzbekistan | 61 | 8 | 8 |
| Kuwait | 18 | 0 | 0 | Venezuela | 7 | 0 | 0 |
| Kyrgyzstan | 53 | 4 | 0 | Western Sahara | 10 | 1 | 0 |
| Libya | 53 | 27 | 27 | Yemen | 16 | 1 | 4 |
| Madagascar | 7 | 0 | 0 | TOTAL | 5,770 (7,574) | 1,573 | 1,344 |
Every abstract in all languages found (i.e., English, French, Spanish, German, and Chinese) was processed and, if it included research about oases (e.g., specific studies on the functioning of the oasis) or was based on an oasis (e.g., medical research conducted in an oasis), the article was reviewed in its entirety to obtain further information. We annotated every reviewed article to avoid duplicates. We recorded the coordinates of the oasis listed in a given article, as well as the name of the oasis. If no names or coordinates were provided, we used Google Maps to determine the location and/or the name of the oasis. Every time an oasis already included in our database was found in the bibliography, we used the same coordinates and name as before, to avoid duplicates. We annotated relevant bibliographic information about every article and a summary of topics (i.e., agronomy, archaeology, biodiversity, botany, climate, ecology, genetics, geology, human health, human impact, hydrology, ornithology, paleontology, remote sensing, among others, aims, methodology, and results (Table S1).
Coordinates obtained by a citizen science photo contest project (WOase: Citizen science to delineate world oases) were also included in the database for creating the global map. All participants were researchers who provided photographs and coordinates of oases from their study sites (for more information, see: https://oasen.sgn.one/). Coordinates supplied by the researchers who participated in the photo contest were double-checked to avoid location errors. Finally, articles provided by researchers but not found in the bibliographic research were included in the database but were not used to calculate the maps.
Mapping oases globally
To obtain a global map of oases, we carried out a three-step procedure: First, we trained random forest models (hereinafter RF) in detecting oases using our collected coordinate dataset in combination with remote sensing maps. RF is a machine-learning algorithm for classification that partitions data into subsets (regression trees) and averages the results. For classification, RF uses features (here, our list of remote sensing indicators) and their corresponding class labels (here, presence or absence of oases). For the RF class labels, coordinates of each oasis were used as presence points. We only applied one pair of coordinates and a single name per oasis to avoid pseudoreplication when training the model (1,145 in total; Fig. 1). A total of 1,145 pseudo-absences were randomly generated with the ‘randomPoints’ function of the ‘dismo’ package (Hijmans et al., 2021). The RF features reflect vegetation and climate conditions (in line with the definition of oases extracted from our bibliographic research, see Table S2). Other variables such as elevation or slope were considered originally, but were removed after showing non-substantial predictive power. Vegetation conditions were represented using the median NDVI values based on the Landsat 8 Collection 1 Tier 1 32-Day NDVI Composites between 2020-01-01 and 2021-12-31, using the software Google Earth Engine (Gorelick et al., 2017) with the ‘median’ function. For the climatic conditions, we selected ‘Actual evapotranspiration’ (aet), ‘Precipitation accumulation’ (pr), and ‘Reference evapotranspiration’ (pet), ‘Maximum temperature’ (tmmx), ‘Climate water deficit’ (def), ‘Palmer Drought Severity Index’ (pdsi), ‘Soil moisture’ (soil), and ‘Vapor pressure deficit’ (vpd) bands from TerraClimate: Monthly Climate and Climatic Water Balance for Global Terrestrial Surfaces (Abatzoglou et al., 2018). The ‘Global Aridity Index’ (b1) was extracted from Zomer & Trabucco (2019a), and Landsat eight Collection 1 Tier 1 32-Day NDVI Composites (NDVIMedian2) were also used (Table 2). The function ‘addBands’ was used to train the model. The resulting image containing four bands was cropped to the area of interest (global land surface) with the ‘clip’ function, and subsequently, only areas with median values of NDVI higher than 0.2 were selected creating a mask with the ‘gt’ function and then using the ‘updateMask’ function over the image including the predictors as bands. This threshold was implemented to eliminate bare soil in deserts while ensuring that no oases was excluded which we had identified from our bibliographic research. It was established after conducting several tests varying the threshold NDVI value to enhance the accuracy of the RF model capturing the global distribution of oases. Similar thresholds have been used previously to delineate oases (Cui et al., 2024).
| Metric | Acronym | Data type | Resolution | Time | Source | URL |
|---|---|---|---|---|---|---|
| Median NDVI | NDVI Median2 | Quantitative | 30 m | 2020-01-01 to 2021-12-31 | Landsat 8 Collection 1 Tier 1 32-Day NDVI Composites | https://developers.google.com/earth-engine/datasets/catalog/LANDSAT_COMPOSITES_C02_T1_L2_32DAY_NDVI#description |
| Global aridity index | b1 | Quantitative | 1,000 m | 1970–2000 | Zomer & Trabucco (2019b) | https://gee-community-catalog.org/projects/ai0/ |
| Actual evapotranspiration | aet | Quantitative | 4,638.3 m | 2018-01-01 to 2021-12-31 | Abatzoglou et al. (2018) | https://developers.google.com/earth-engine/datasets/catalog/IDAHO_EPSCOR_TERRACLIMATE |
| Climate water deficit | def | |||||
| Palmer drought severity index | pdsi | |||||
| Reference evapotranspiration | pet | |||||
| Soil moisture | soil | |||||
| Maximum temperature | tmmx | |||||
| Vapor pressure deficit | vdp |
In the next step we trained the final RF with the ‘ee.Classifier.smileRandomForest’ function with a grain size of 100 m. A total of 80% of the coordinates for absence or presence were selected with the ‘randomColumn’ and ‘filter’ functions to build the RF model. The remaining 20% of the coordinates were used for testing overall accuracy after training the model. We created 1,000 decision trees to train the model. We obtained a confusion matrix, and the overall accuracy for the training and validation sample. The overall accuracy value of Random Forest classification was 1.00, while validation accuracy was 0.99. The kappa value of the model was 1.00. Relative importance of predictors ranged from 322 to 479, with ‘Global Aridity Index’, ‘Actual evapotranspiration’, ‘Precipitation accumulation’, and ‘NDVI’ being the most important bands (Table S3). The out-of-bag error estimate was 0.04.
In the last step, we predicted further possible oases with the final RF model, allowing to identify additional oases that were not subject of the reviewed research so far.
ANA region: in-depth analysis
To evaluate the importance of oases in terms of species diversity, human population density, and conservation status, an extensive case study was conducted for countries of Asia and North Africa. This selection was made based on the representativeness of these countries over the total number of studies carried out on oases (covering 85% of all coordinates obtained). The total area of the oases derived via remote sensing was estimated in Google Earth Engine for every country using the ‘area’ function. Shapefiles of oases of every country were exported with the ‘Export.table.toDrive’ function at a km scale.
Species richness and conservation status
Shapefiles of global oasis distribution were used to estimate the potential number of mammal, reptile, amphibian, and bird species whose ranges include oases. Digital Distribution Maps from the IUCN Red List of Threatened Species (IUCN, 2022) and bird species distribution maps of the world from BirdLife (2022) were overlapped with the ‘Intersection’ function of QGIS to obtain a list of species whose distribution ranges include any of our predicted oases. Also, the layers were overlapped with the country boundaries to obtain a list of species per country. Maps of protected areas of the world were obtained from UNEP-WCMC & IUCN (2023), and protected areas from IUCN categories I to VI were selected. The intersection of protected areas of the world and oasis predictions generated with RF was made using the ‘Intersection’ function of QGIS. The result was dissolved at country level with the ‘Dissolve’ function, and the protected area was calculated at country level with the ‘area’ function.
Human population, land use, World Heritage sites
Human population data was obtained from WorldPop Global Project Population Data with a 100 m × 100 m resolution between 2020-01-01 and 2020-12-31, overlaying our shapefiles of global oasis distribution using the ‘sum’ function. Buffers of 1 and 10 km were created with the ‘buffer’ function, and human population was also estimated at country level for both geometries.
The relative proportion of land cover classes was extracted for global oases prediction from Copernicus Global Land Cover Layers: CGLS-LC100 Collection 3 (Buchhorn et al., 2020) between 2018-01-01 and 2019-12-31 for every category (i.e., ‘tree cover,’ ‘crop cover,’ ‘grass cover,’ ‘shrub cover,’ ‘urban cover,’ and ‘bare cover’) at country level with 1,000 m resolution. The script can be accessed in the Supplemental Script. Principal component analyses were used to characterize oasis land cover at country level with the ‘prcomp’ function, after scaling variables in the R software (R Core Team, 2020).
Coordinates of all World Heritage sites were downloaded, and a buffer of 10 km was created around every point with the ‘buffer’ function of QGis with 0.0899° diameter. The results were overlapped with the ‘Intersection’ function to obtain the list of WH UNESCO sites inside or near an oasis.
Results
Bibliographic search
The bibliographic search resulted in a total of 5,573 articles (Table S4). Of those, 1,566 articles provided information on a particular oasis or a group of oases and were therefore further considered in our analyses (Table S1). Based on these publications, a total of 1,037 individual oases from 30 countries were identified. An additional 223 oases were provided by 19 researchers who participated in a global citizen science project (https://oasen.sgn.one/). Finally, 92 articles, which were not identified by the literature browser used, were provided by colleagues, adding 84 additional oases to the database. Hence, a total of 1,344 oases were included in the database, derived from 1,658 publications (Table 1; Fig. 2; Table S5). For some oases, information regarding location was lacking, and it was not possible to find them in any other source.
Articles covered the period 1974 to 2023 and comprised 43 different topics, dominated by ‘agronomy’ (303 articles), ‘hydrology’ (295 articles), ‘paleontology’ (163 articles) and ‘remote sensing’ (112 articles; Fig. S1). Articles were published in 747 different journals, with most articles in ‘Journal of African Earth Sciences’ (54 articles), ‘Environmental Earth Sciences’ (45 articles), ‘Arabian Journal of Geosciences’ (44 articles) and ‘Journal of Arid Environments’ (37 articles). A total of 1,209 articles included only one oasis, while 166, 83, and 34 articles contained information about 2, 3, and 4 different oases, respectively. The highest number of oases were covered by Moat et al. (2021) with 85 oases from Peru and 30 from Chile, Li, Feng & Guo (2008) with 68 oases from China, and Ait-El-Mokhtar et al. (2020) with 40 oases from Morocco. The country with the highest number of oases included in the database was China (193 oases), followed by Morocco (174), Algeria (147), and Tunisia (127). The most frequently studied oases were located in Egypt: ‘Kharga oasis’ (included in 94 articles), ‘Bahariya oasis’ (92 articles), and ‘Siwa oasis’ (83 articles). The northernmost oasis was identified in Mongolia (‘Baruun Tooroi’; 50.03°N), the southernmost oasis in Argentina (‘Arroyo Telsén’; −42.47°S).
Mapping oases globally
The results of the Random Forest validation error matrix indicated 174 true positives, no true negatives, one false positive, and 43 false negatives. This yielded an overall accuracy rating of 0.99 for the classifier. Random Forest modeling suggested that oases are spread across all drylands except Antartica (Fig. 3). The basins of the rivers Nile, Euphrates, and Indus are covered by a high density of oases. The southern part of South America and southern Australia also harbor a high density of oases, concentrated along the margins of drylands. Inner Asia contains a high number of scattered oases, very similar to North America. Finally, many small oases were predicted for North-West Africa, particularly along the margin of the Sahara Desert. A vector version of the global map of oases at a resolution of 1 km can be accessed as Supplemental Material (Map).
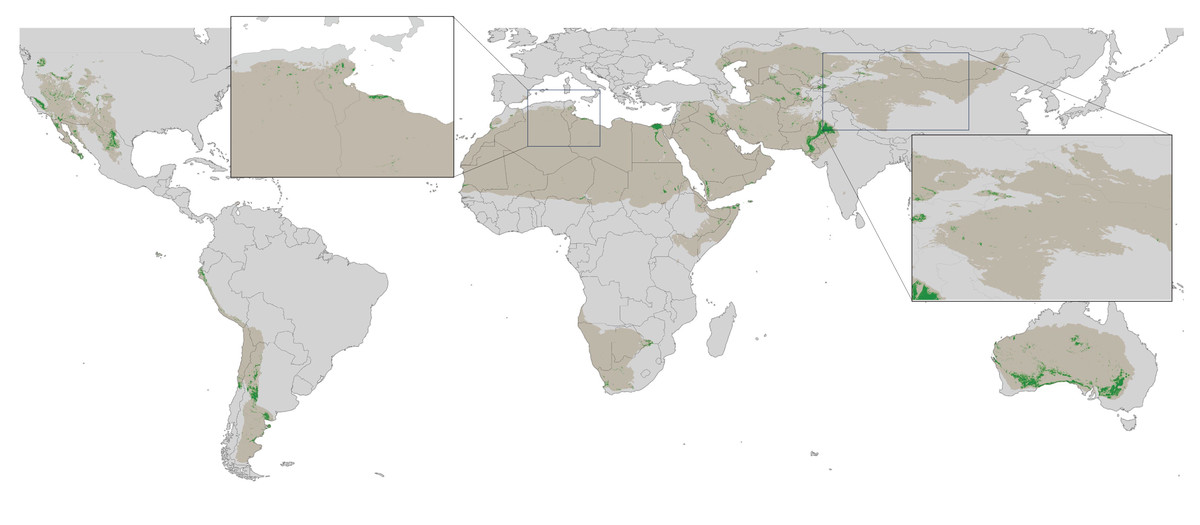
Figure 3: Global distribution of arid and hyper-arid areas (aridity index value: <0.2; in brown) and contemporary distribution of permanent densely vegetated areas (i.e., oases) in arid and hyper-arid areas predicted by the Random Forest model (in green).
Subplots are generated for North Africa and China. A high-resolution version of this figure is available in the Supplemental Materials.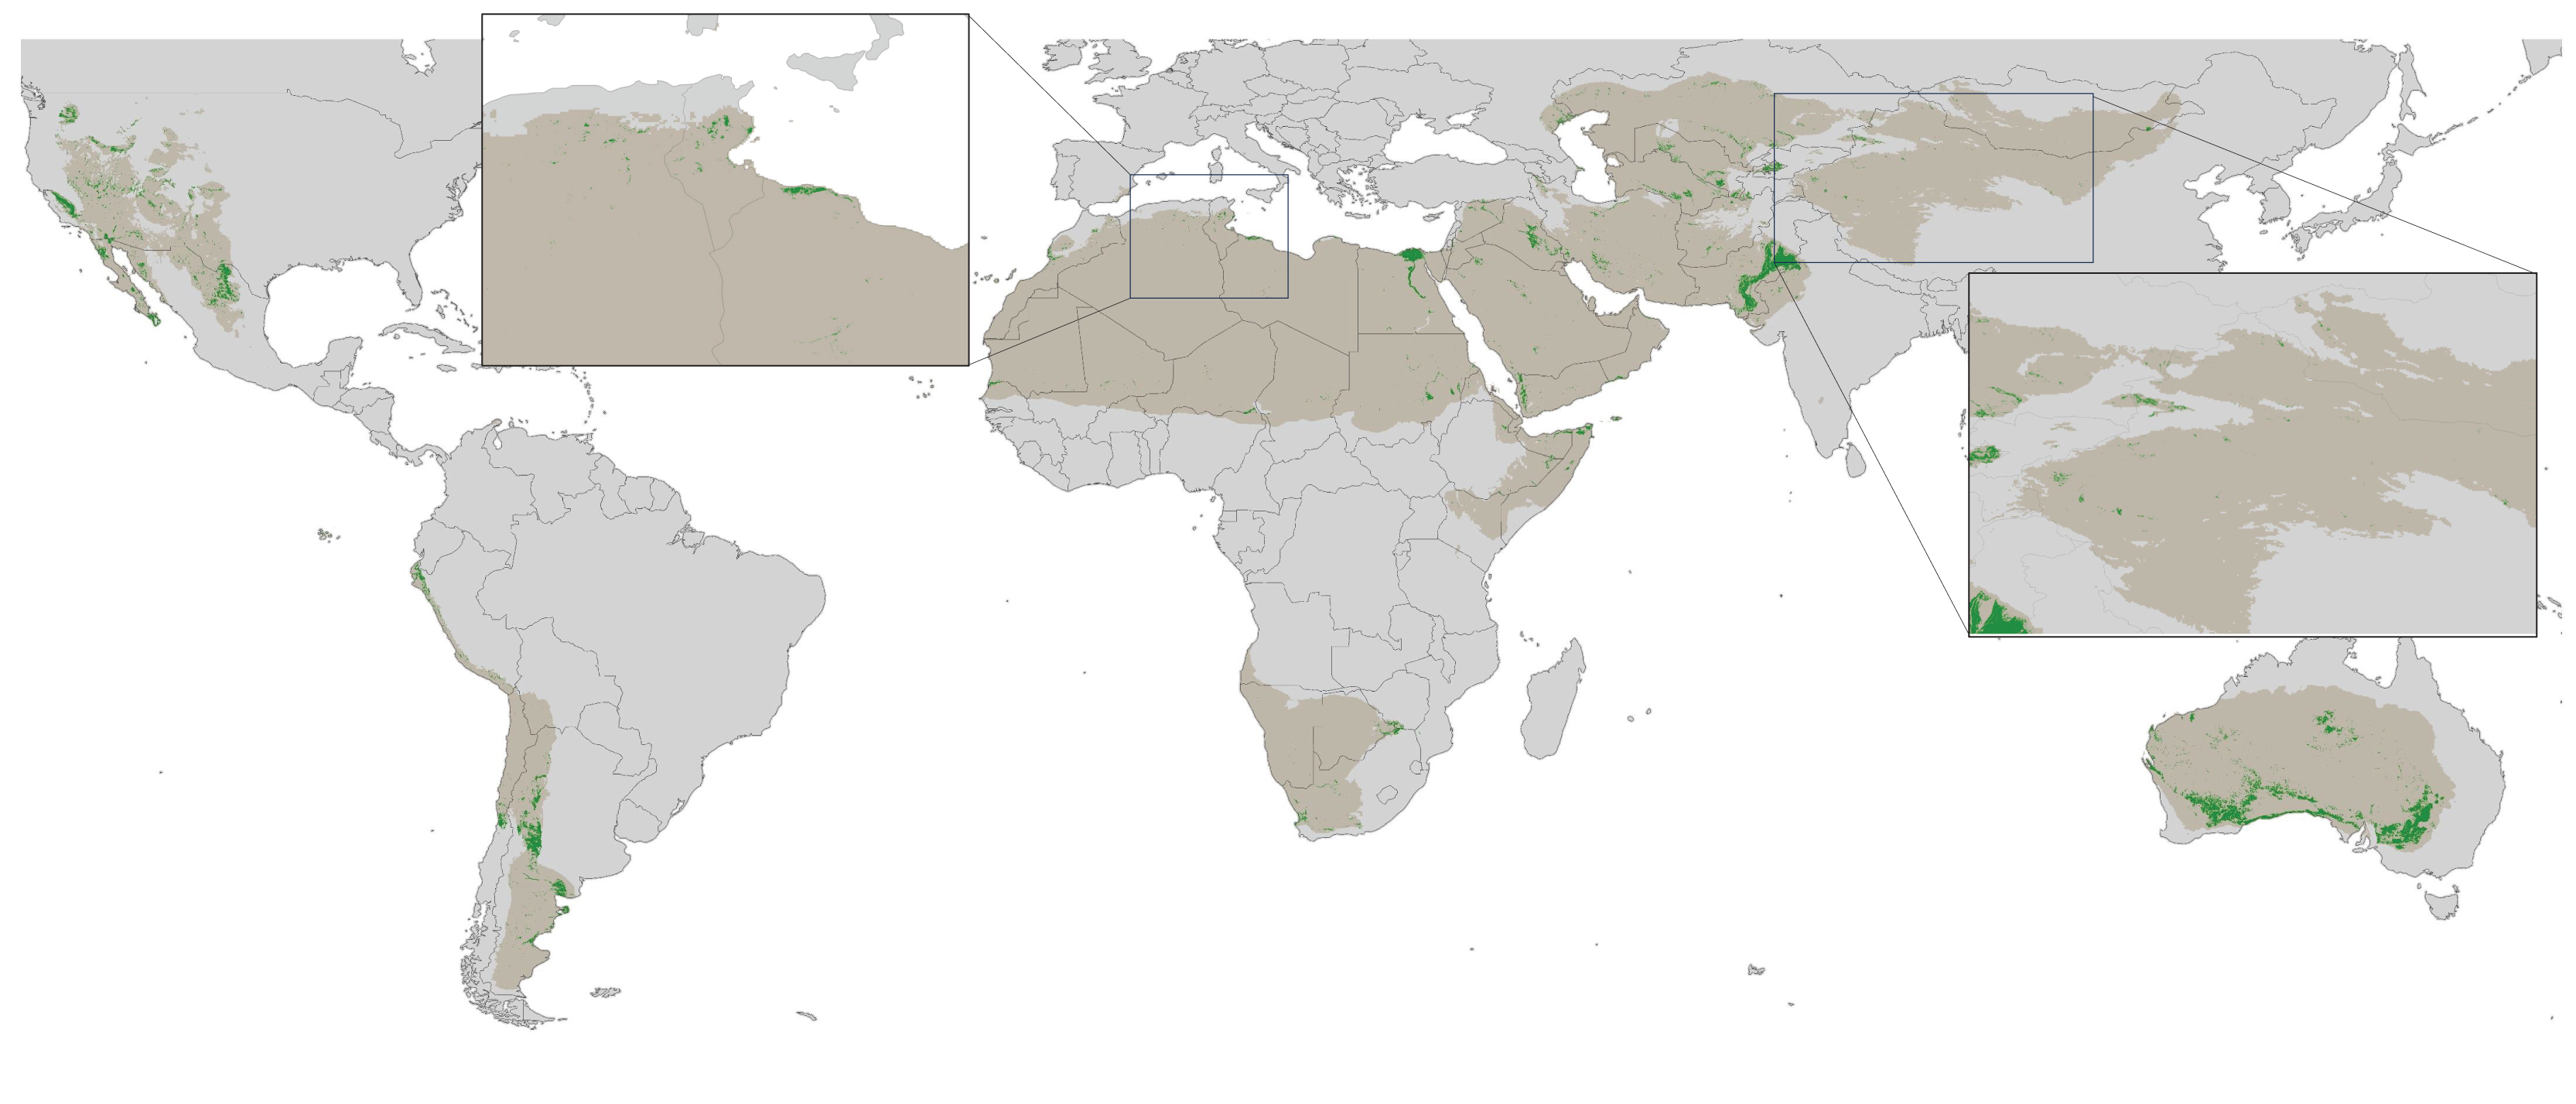
ANA region: in-depth analysis
Oases of Asia and North Africa (ANA; Fig. 4) cover a total area of 402,117 km2 (assessment: 2021) according to the predictions of our Random Forest model (Table 3). The total area of oases per country ranges from less than 9 km2 (Bahrain) to more than 123,000 km2 (Pakistan). The relative proportion of oases in terms of area is 0.68% (all countries combined in the ANA region), ranging from 0.01% (Cameroon) to 14.20% (Pakistan) of the respective country. In the ANA region, arid and hyper-arid areas cover in total 20 million km2 (40% of total area of the ANA region), of which 1.52% are covered by oases.

Figure 4: Contemporary (by 2021) distribution of oases as indicated by the Random Forest model for Asia and North Africa.
Colors represent human population density (HPD) per square kilometer in logarithmic scale. Global distribution of arid and hyper-arid areas (aridity index value: <0.2) in brown.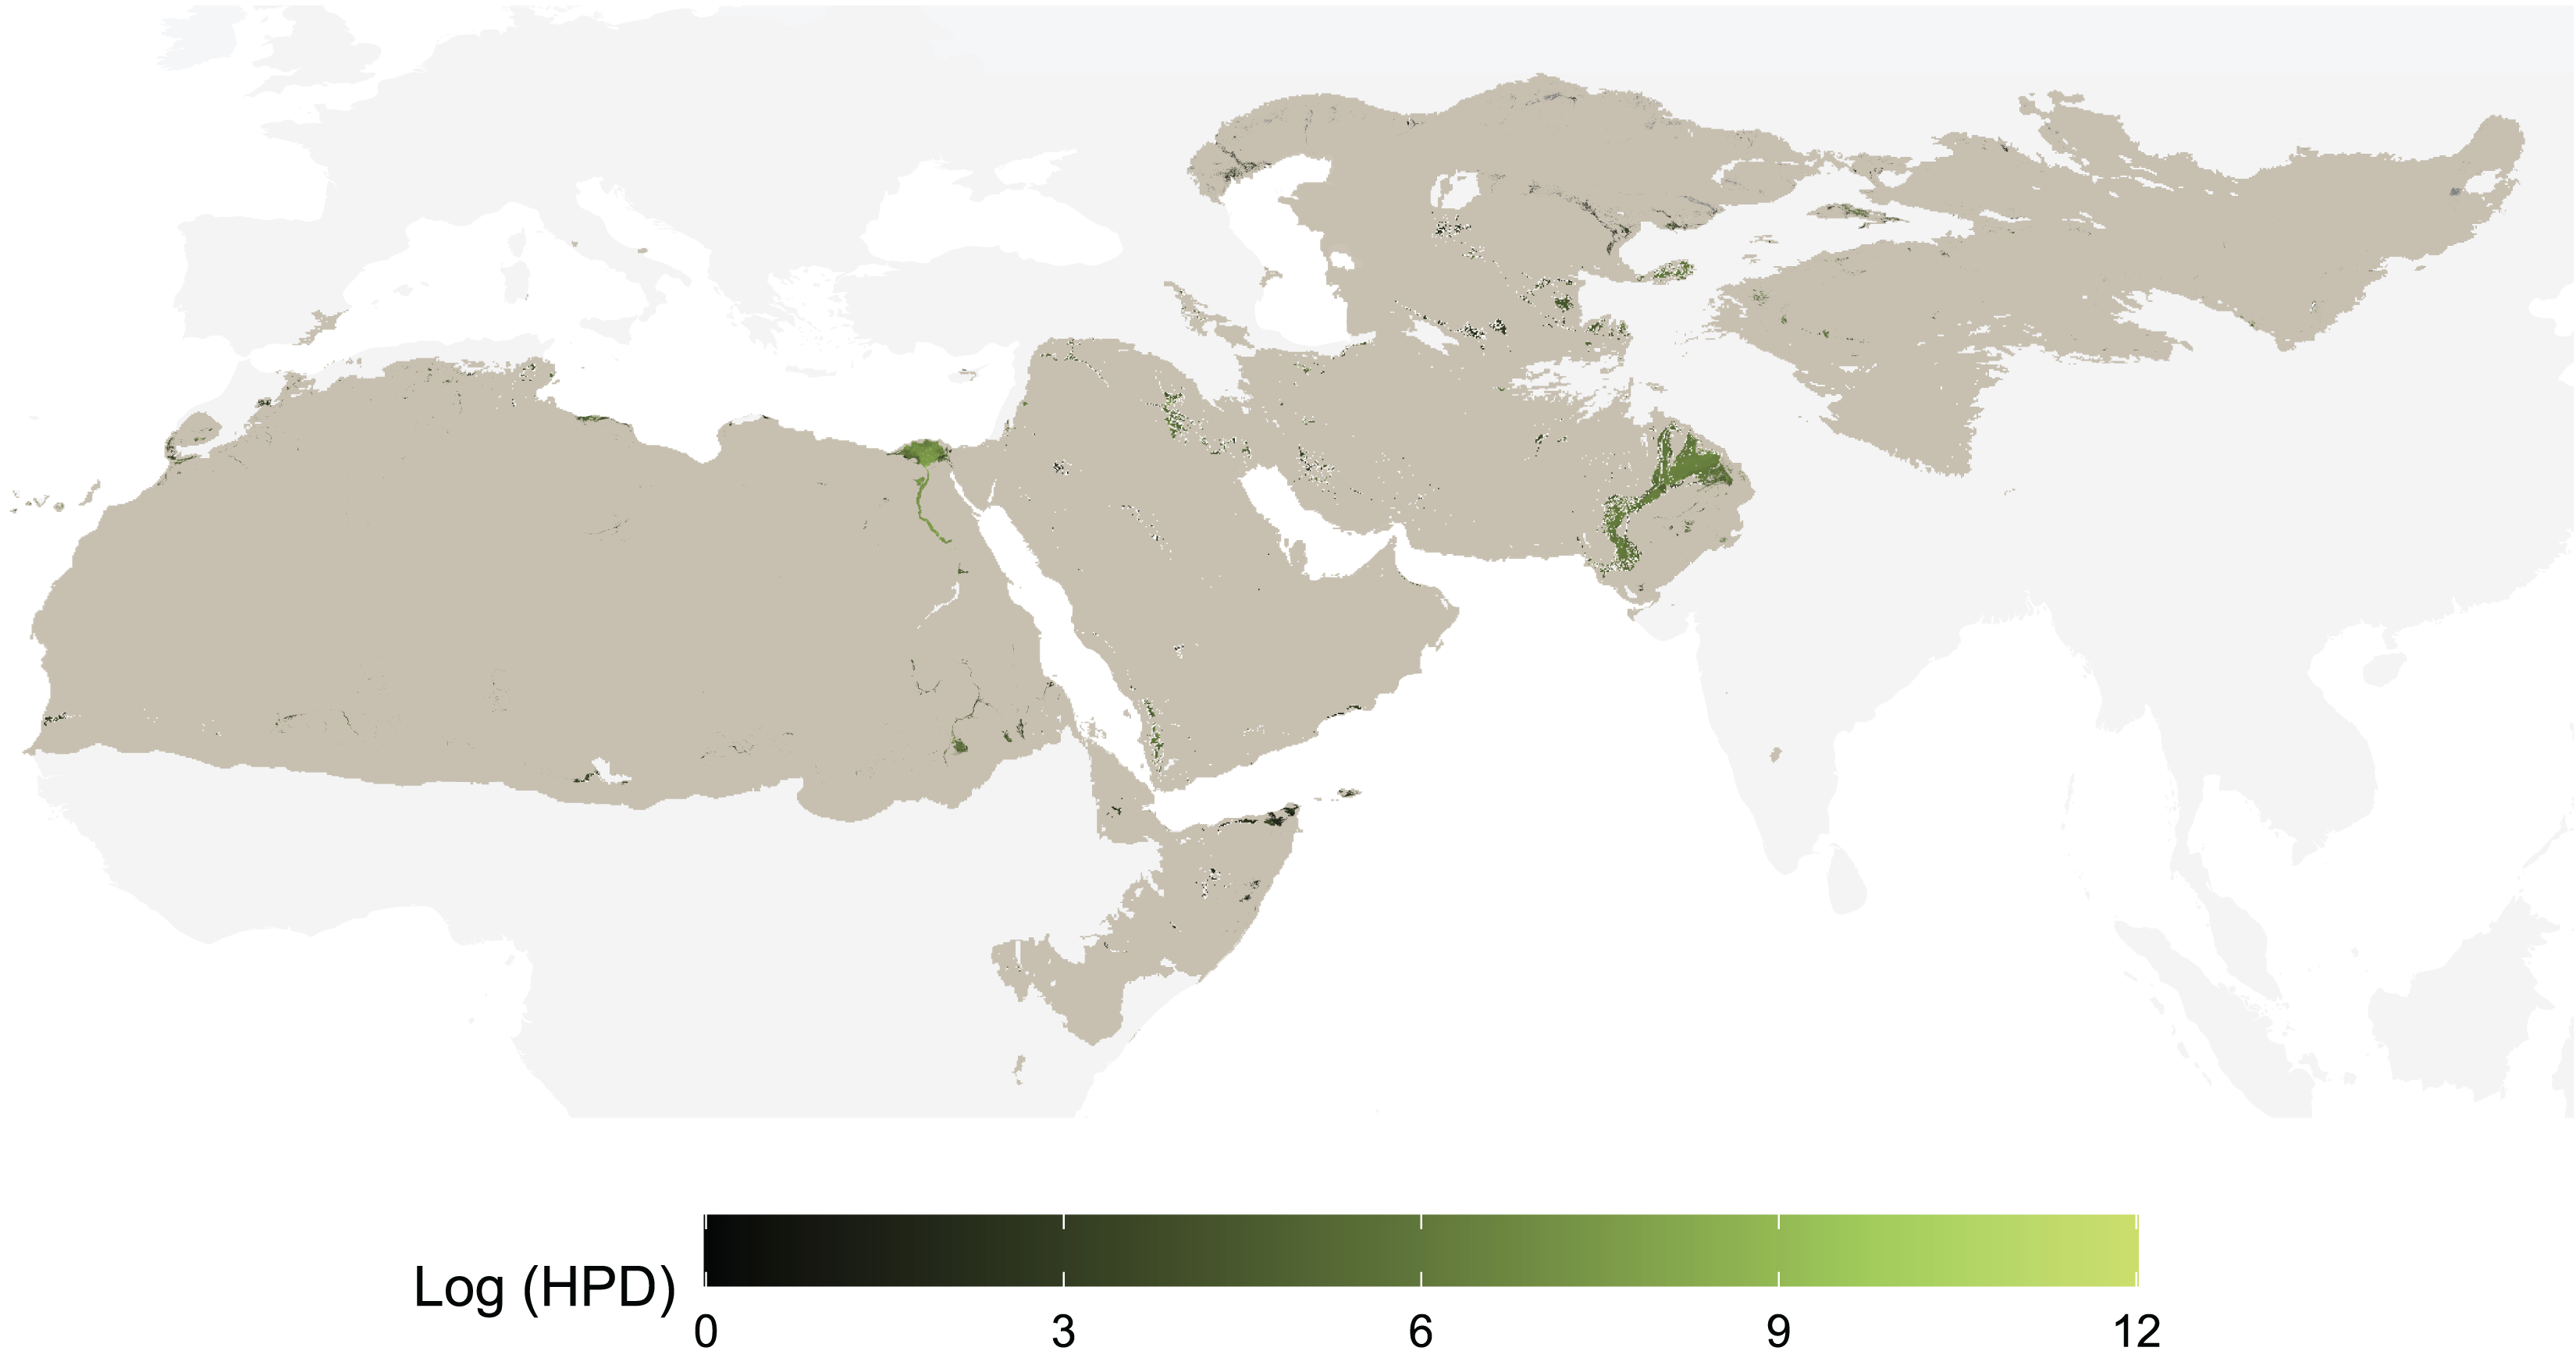
| Country | Area (km2) | % area of the country | Population | % of population of the country | Population 1 km buffer | Population 10 km buffer | % protected |
|---|---|---|---|---|---|---|---|
| Afghanistan | 5,780 | 0.90 | 1,725,714 | 6.60 | 3,376,453 | 8,693,653 | 1.82 |
| Algeria | 1,953 | 0.08 | 336,046 | 0.88 | 1,122,439 | 4,072,630 | 0.00 |
| Bahrain | 9 | 1.15 | 13,024 | 0.65 | 113,602 | 1,476,150 | 0.00 |
| Cameroon | 25 | 0.01 | 389 | 0.00 | 1,181 | 7,712 | 0.00 |
| Cape Verde | 19 | 0.47 | 1,718 | 0.38 | 13,862 | 260,321 | 0.00 |
| Chad | 5,250 | 0.41 | 69,900 | 0.49 | 150,776 | 777,656 | 0.00 |
| China | 12,239 | 0.13 | 2,140,084 | 0.17 | 6,822,464 | 26,904,128 | 0.19 |
| Cyprus | 120 | 1.32 | 23,646 | 2.05 | 110,413 | 616,225 | 4.08 |
| Djibouti | 28 | 0.13 | 7,769 | 0.77 | 34,622 | 563,602 | 0.00 |
| Egypt | 40,214 | 4.09 | 50,605,930 | 61.49 | 62,353,484 | 80,239,386 | 0.01 |
| Eritrea | 425 | 0.35 | 16,548 | 0.46 | 41,577 | 233,450 | 0.68 |
| Ethiopia | 5,258 | 0.46 | 172,275 | 0.19 | 336,141 | 1,236,715 | 2.02 |
| India | 13,275 | 0.42 | 2,575,963 | 0.21 | 4,684,631 | 13,206,803 | 0.00 |
| Iran | 19,212 | 1.18 | 3,735,907 | 5.42 | 10,589,507 | 33,164,713 | 0.15 |
| Iraq | 19,845 | 4.54 | 7,628,487 | 19.95 | 13,217,540 | 23,592,983 | 1.29 |
| Israel | 199 | 0.96 | 16,200 | 0.21 | 78,643 | 2,369,305 | 0.00 |
| Jordan | 486 | 0.54 | 110,332 | 1.81 | 292,873 | 2,622,608 | 0.00 |
| Kazakhstan | 20,447 | 0.75 | 239,027 | 1.53 | 661,980 | 2,101,884 | 0.28 |
| Kenya | 718 | 0.12 | 72,303 | 0.15 | 255,877 | 835,660 | 14.96 |
| Kuwait | 93 | 0.54 | 11,783 | 0.38 | 41,136 | 406,209 | 0.00 |
| Kyrgyzstan | 647 | 3.27 | 135,473 | 2.66 | 367,321 | 2,239,648 | 0.57 |
| Libya | 4,553 | 0.28 | 827,363 | 13.97 | 3,670,778 | 3,670,778 | 0.00 |
| Mali | 1,932 | 0.15 | 89,880 | 0.45 | 241,803 | 1,075,611 | 0.00 |
| Mauritania | 2,003 | 0.19 | 50,224 | 1.31 | 141,247 | 785,780 | 0.00 |
| Mongolia | 2,191 | 0.14 | 2,004 | 0.07 | 8,978 | 96,554 | 9.27 |
| Morocco | 7,002 | 1.69 | 1,072,358 | 34.99 | 3,113,708 | 6,813,969 | 0.50 |
| Niger | 3,020 | 0.26 | 165,513 | 0.81 | 341,361 | 1,715,058 | 0.00 |
| Nigeria | 4,027 | 0.44 | 205,542 | 0.11 | 327,819 | 827,020 | 0.00 |
| Oman | 2,914 | 0.94 | 265,052 | 8.33 | 596,047 | 2,310,171 | 0.00 |
| Pakistan | 123,343 | 14.12 | 60,213,412 | 30.27 | 77,346,330 | 105,704,443 | 0.00 |
| Palestine | 75 | 1.30 | 26,978 | 0.88 | 67,356 | 355,471 | 0.00 |
| Qatar | 41 | 0.36 | 6,412 | 0.11 | 44,927 | 2,042,803 | 0.00 |
| Russia | 5,568 | 0.03 | 55,906 | 0.13 | 250,986 | 796,131 | 0.00 |
| Saudi Arabia | 11,326 | 0.59 | 638,582 | 2.01 | 1,910,443 | 12,478,069 | 1.60 |
| Senegal | 1,526 | 0.77 | 144,258 | 1.03 | 291,706 | 751,398 | 5.90 |
| Somalia | 14,642 | 2.30 | 123,630 | 1.30 | 218,977 | 1,069,347 | 0.00 |
| Sudan | 12,609 | 0.69 | 2,249,991 | 6.19 | 4,313,434 | 11,160,534 | 0.00 |
| Syria | 3,826 | 2.04 | 1,237,517 | 5.39 | 2,962,019 | 10,512,480 | 0.00 |
| Tunisia | 2,878 | 1.85 | 367,626 | 3.70 | 948,857 | 2,691,929 | 0.00 |
| Turkmenistan | 12,797 | 2.62 | 1,278,836 | 15.05 | 3,390,680 | 7,462,666 | 0.52 |
| UAE | 326 | 0.46 | 195,776 | 2.50 | 914,134 | 6,095,182 | 0.84 |
| Uzbekistan | 23,474 | 5.24 | 6,812,989 | 23.69 | 1,193,065 | 17,148,561 | 0.34 |
| Yemen | 12,886 | 2.83 | 3,487,567 | 13.38 | 5,691,619 | 13,482,142 | 0.00 |
| TOTAL | 401,945 | 0.68 | 150,045,048 | 4.16 | 214,212,885 | 418,530,517 | 0.32 |
Species richness and conservation status
A total of 8,281 mammal, reptile, amphibian, and bird species were identified in the predicted oases globally. In China, 2,673 vertebrate species were recorded for oases, compared to 84 species for oases in Cape Verde. According to the IUCN red list, a total of 470, 450, and 220 of these vertebrate species are considered Vulnerable, Endangered, or Critically Endangered, respectively (Table S6).
Overall, only 0.32% of the total area of oases is protected to date; in 25 out of 43 countries, oases are not protected at all (i.e., <0.01% of area of oases in each country; Table 3, Table S7). The protected area peaks in Kenya (14.96% of oases protected), Mongolia (9.27%), and Senegal (5.90%).
Human population, land use, and World Heritage sites
In the ANA region, a total of 150 million people lives in oases (Table 3), primarily in Pakistan (60 million), Egypt (50 million), and Iraq (more than 7 million). However, few people live in oases in Cameroon (less than 400 people), Cape Verde (about 1,700 people), and Mongolia (about 2,000 people). In Egypt, 61% of the total human population live in oases, in Morocco 35% of all people. The human population adjacent to oases (i.e., within a perimeter of 1 km around each oasis) amounts to 64 million people (ANA region), and an additional 214 million people live between 1 km and 10 km around oases; therefore, 418 million people live in or adjacent to oases (9% of the total human population of the ANA region). Average human population density in oases is 375 people per km2, and density exceeds 1,040 people per km2 when people adjacent to oases (i.e., people living within a perimeter of 10 km of an oasis) are included, assuming that they depend on the resources provided by oases. Hence, oases are among the most densely populated areas globally, outside of urban areas.
Globally, according to Copernicus Global Land Cover maps, oases are covered by grasses (24.4%), followed by bare land (21.4%), and urban areas (21.4%; Fig. 5B). Components 1 and 2 of the Principal Component Analysis (PCA) from the percentage of each Land Cover type represent 42% and 24% of the total variation, respectively (cumulative percentage of 66.5%). PCA component 1 was positively correlated with the percentage of crops and urban areas, and inversely correlated with the percentages of trees, shrubs, and grasses. Therefore, this axis can be named the ‘Pristine-Managed’ gradient (Fig. 5A). PCA component 2 was positively correlated with the percentage of trees and inversely correlated with the proportion of grasses. Therefore, the second axis was named ‘Herbaceous-Forested’ gradient (Fig. 5C).
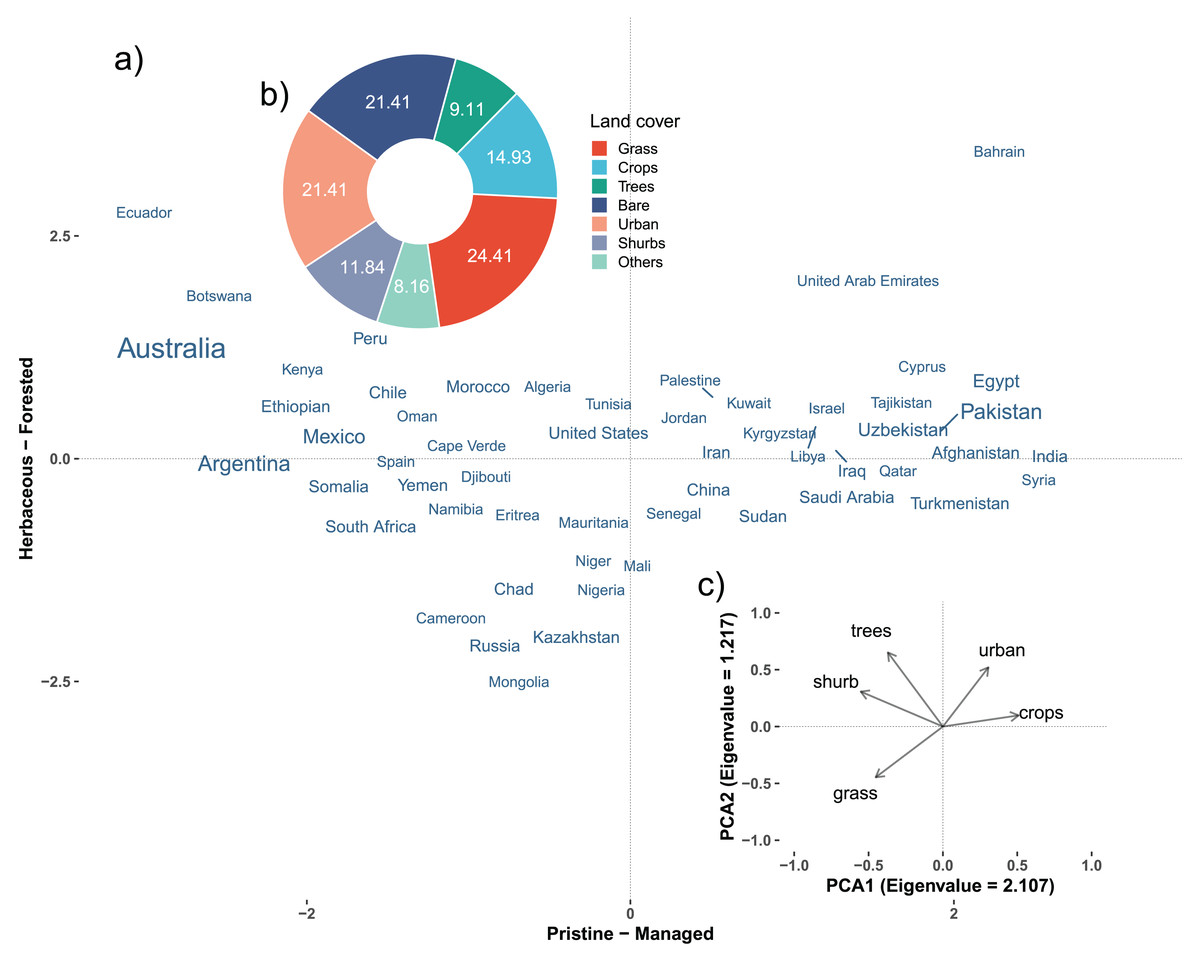
Figure 5: Land cover (%) of all oases.
Land cover (%) of all oases combined, and principal component analysis (PCA) based on land cover of the oases of each country combined (proportion of variance/standard deviation axis 1 0.42/1.451, axis 2 0.24/1.103). (A) Results of PCA representing the ordination of countries according to the two first components of the analysis. Text size represents the area of oases in each country. Axis 1 relates to the degree of management (related to crops and urban areas), axis 2 reflects the proportion of trees or grasses in oases. (B) Percentage of land cover on a global scale. (C) Biplot scores of the variables of land cover in the PCA.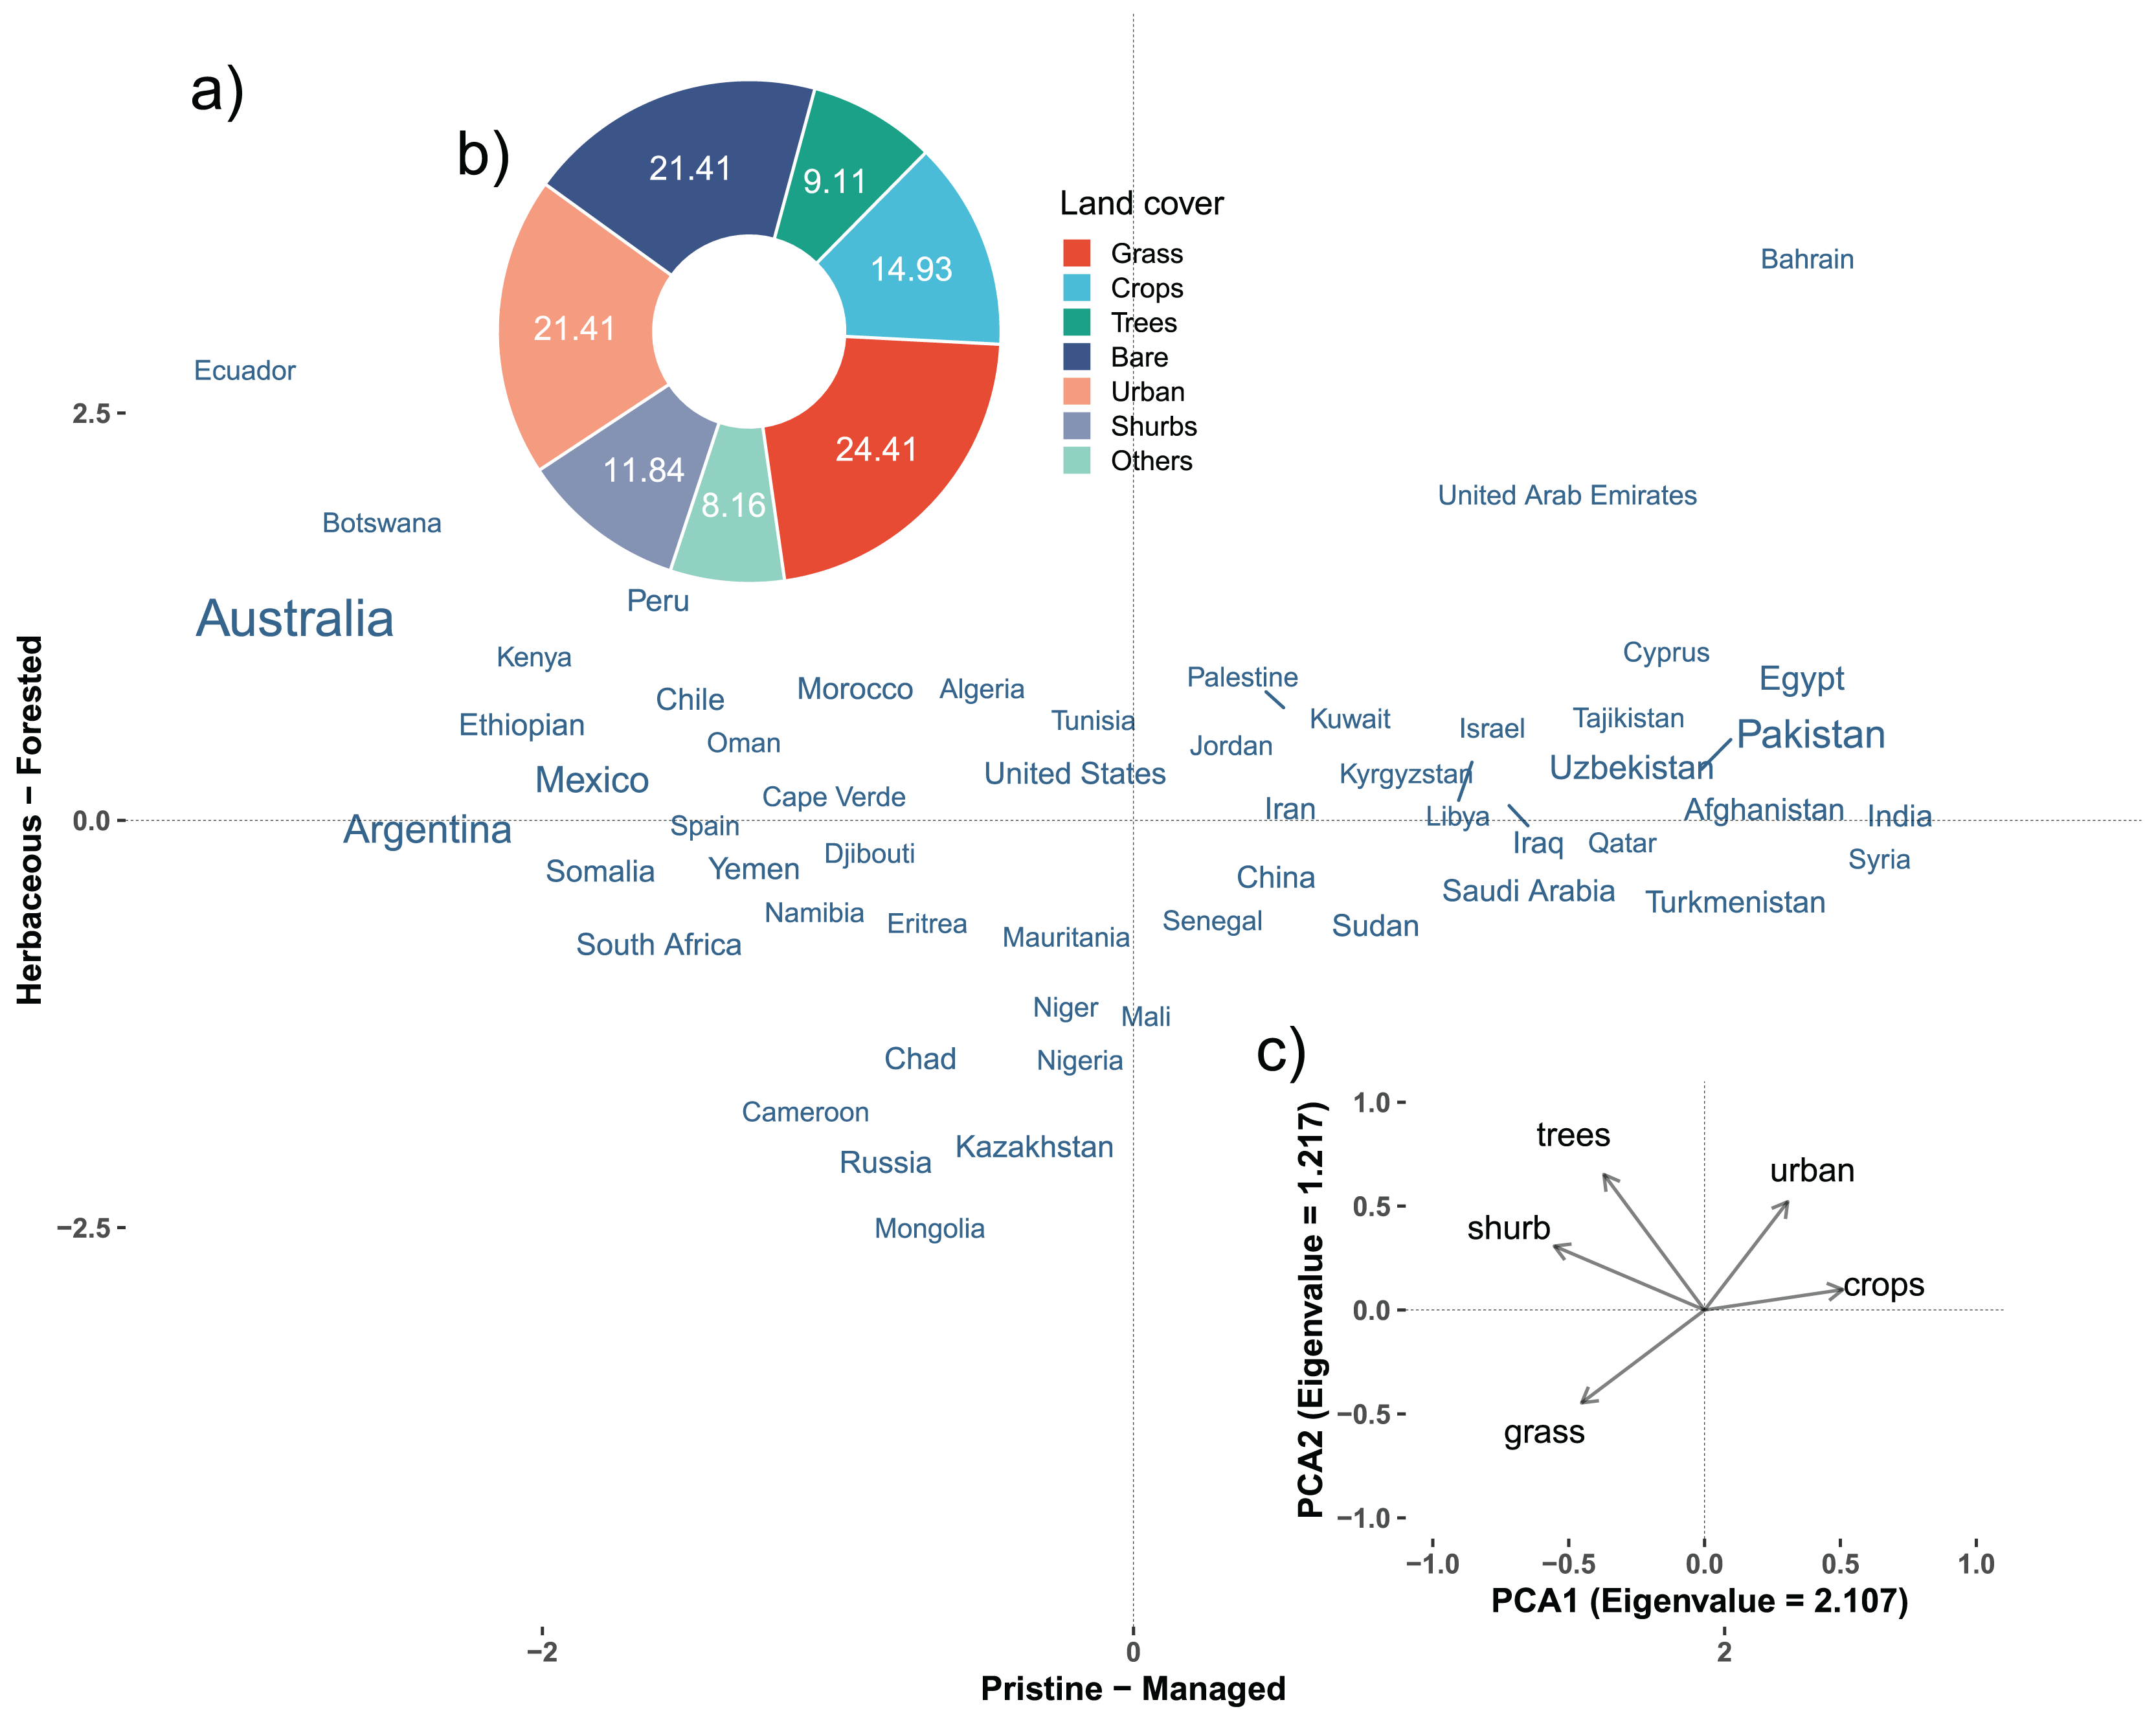
A total of 75 UNESCO World Heritage sites (WHs)–65 cultural, eight natural, and two both natural and cultural WHs–were identified in or adjacent to oases. ‘Willandra Lakes Region’ and ‘The Ahwar of Southern Iraq’ are of both cultural and natural importance. Iran contains 9 WHs, and Egypt has 5 WHs. Egypt’s WHs include ‘Historic Cairo’, ‘Abu Mena’, ‘Memphis and its Necropolis’, ‘Nubian Monuments’, and ‘Thebes with its Necropolis’ (Fig. 6).

Figure 6: Location of UNESCO World Heritage sites within or adjacent to oases worldwide.
The photographs of selected WHS are from UNESCO: https://whc.unesco.org/en/list. Copyright: The Persian Qanat, © S.H. Rashedi; Al Ain Palace, © ADACH; At-Turaif, © Ko Hon Chiu Vincent; Lake Yoan, © Sven Oehm; Ischigualasto, © Philipp Schinz; Bam, © Sacred Sites; Ait-Ben-Haddou, Ouadane, Chinguetti, Ghadamès and Shibam, © Editions Gelbart; Memphis and its Necropolis, © OUR PLACE The World Heritage Collection; Mogao Caves, © Neville Agnew; Sacred City of Caral-Supe, © Christopher Kleihege; El Pinacate and Gran Desierto de Altar, © Pinacate; Old Town of Ghadamès, © Editions Gelbart; Old Walled City of Shibam, © Editions Gelbart.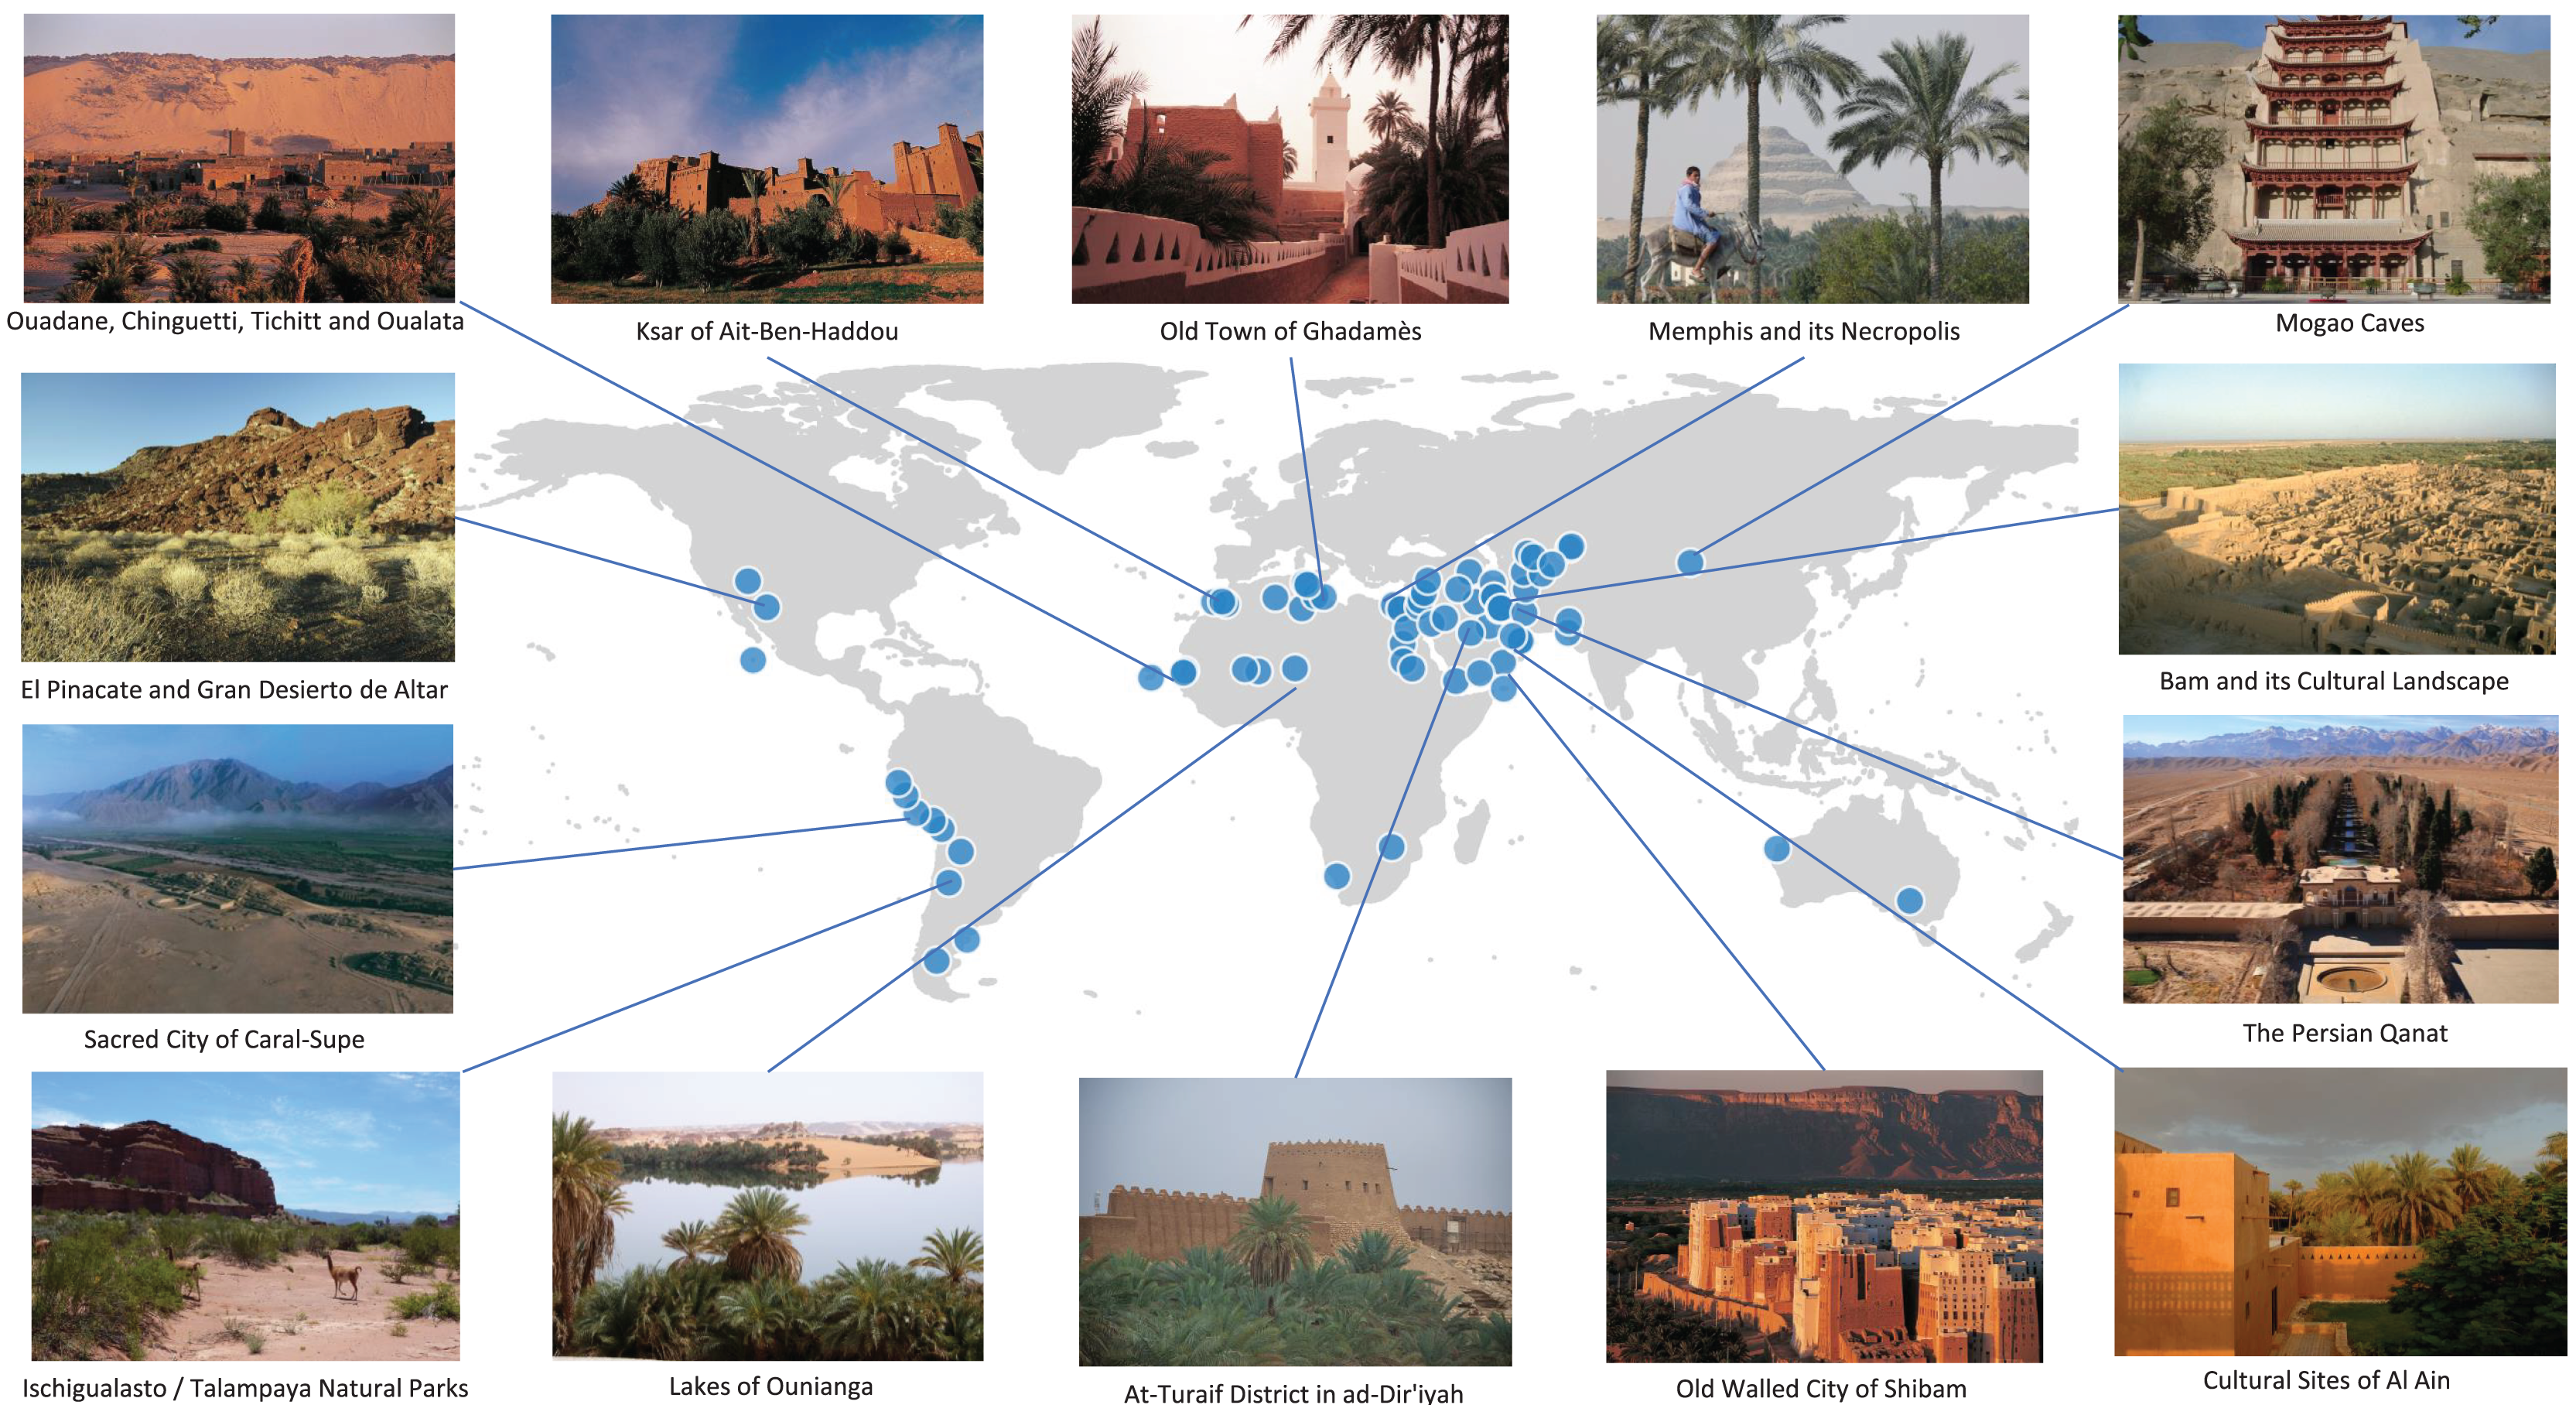
Discussion
Globally, oases are unique systems that occur in most drylands, where they form key nodes for humans and nature alike. However, until now, a comprehensive overview of the distribution, delineation and biocultural diversity of oases has been missing. In this study, we identified a total of 1,344 oases from 30 different countries, based on 1,657 relevant research articles. In Asian and North African (ANA) countries, oases cover in total about 400,000 km2, corresponding to 1.5% of the arid and hyper-arid area of this region. To date, more than 8,200 vertebrate species have been recorded in oases globally, with more than 13% of them listed as threatened. At the same time, less than 0.5% of the total area of oases is protected.
In the ANA region, over 150 million people inhabit oases, and up to 400 million people are most likely dependent on oases. This reflects the high productivity and overall relevance of oases in an otherwise harsh environment. Moreover, 75 UNESCO World Heritage sites are located in or adjacent to oases, which underpins the cultural importance of this landform through history.
A key challenge is to develop an inclusive definition of oases, which may have constrained a global inventory and synoptic research of oases. Based on extensive literature search (Table S2) and the model applied, we defined oases as: “Azonal, highly productive areas, with permanent dense vegetation and mostly converted to agriculture, embedded in drylands and with a certain degree of isolation; they facilitate high biocultural diversity and allow biological and cultural exchange through otherwise impermeable regions.” We are aware that this is a pragmatic definition, which may stimulate discussion and most likely requires future revision. Moreover, we need a convincing classification of oases based on origin, hydrogeomorphology, function, and state. Finally, our bibliometric search did not cover many oases in Australia or in the Americas, because other names than oases are used in these regions (e.g., springs).
Bibliographic search
We identified articles covering 43 different topics, with agronomy ranking first due to major agricultural importance and expansion of oases in countries such as Tunisia (Rodríguez-Caballero et al., 2017), Egypt (Elbeih, 2021), or China (Bai et al., 2014). Many publications address crop varieties cultivated in oases, due to the importance oases have for specific crop species and their genetic variation (Shachak et al., 2005; Buerkert et al., 2005; Buerkert, De Langhe & Al Khanjari, 2009; Davies et al., 2012). Examples include wheat (Filatenko & Hammer, 2014), maize (Belalia et al., 2019), alfalfa (Loumerem et al., 2007), apricot (Bourguiba et al., 2013), date palm (Zehdi-Azouzi et al., 2015), and pistachio (Choulak et al., 2019), both regionally and globally. An additional research focus was on water resources, for example on salinity in oases (Zhao, Chang & He, 2004; Wang & Li, 2013; Yin et al., 2021). Agronomy and hydrology control the contemporary distribution, state and future persistence of oases. Concurrently, the past conditions explain the present status and the role oases play for people and nature. In Egypt, for example, paleontology and archaeology are predominant subjects of published articles (e.g., Brookes, 1989; Moiisen, 1992; Kamal El-Din, 2003; El-Saadawi et al., 2014). More recently, remote sensing technology is applied (Luedeling & Buerkert, 2008; Contreras et al., 2011; Moat et al., 2021; Liu, Wang & Xin, 2022) to study oasis expansion (Chen et al., 2022) and land use changes, which again may alter local environmental conditions such as precipitation (Cai et al., 2019).
Biodiversity has been widely explored in oases, in the past but also in recent times. Examples include studies on ants (Taheri et al., 2021), beetles (Jaskuła & Rewicz, 2015), bees (Falcon-Brindis & León-Cortés, 2023), ticks (Zhao et al., 2018), grasshoppers (Soudani & Moussi, 2020), birds (Selmi & Boulinier, 2003), and bats (Loumassine et al., 2020). Studies also cover the genetic variation of species such as honeybees (Shaibi & Moritz, 2010). However, a systematic survey of biodiversity sensu lato is missing at local to global scales and through time.
Mapping oases globally
This study provides a state-of-the-art delineation and quantification of oases on the global scale. Current numbers can be compared with those reported for individual countries such as China (Liu, Wang & Xin, 2022) or Oman (Luedeling & Buerkert, 2008). We mapped 198 oases for China, while Liu, Wang & Xin (2022) only mentioned 93 oases. Indeed, the delineation of oases remains challenging. For example, the number of oases in China has decreased during the past 20 years, probably due to the expansion and concurrent fusion of oases. We included six articles published prior to the year 2000, which may cover oases that no longer exist as individual oases. In addition, discrepancies in the nomenclature of oases may lead to an overestimation of the total number of oases within a given country. The spatial distribution of Chinese oases in our study is consistent with the recent study by Liu, Wang & Xin (2022). The primary discrepancy may be attributed to the fact that certain oases, which have been the subject of only a limited number of studies (see Fig. 2), are included within the boundaries of other oases. The Qinghai region represents a significant point of controversy, with our study listing only three oases, whereas the predictions by Liu et al. result in additional oases within this region.
Luedeling & Buerkert (2008) listed a total of 2,663 different oases in Oman, while we included only 68 oases in our database. In contrast to our approach, Luedeling & Buerkert (2008) considered every vegetation patch as an oasis. Our prediction, with a resolution of ~250 m (the resolution used in their approach), resulted in 2,262 different vegetation patches in Oman, a number much closer to the results shown in their article.
Moat et al. (2021) calculated a total area of oases of 12,000 km2 in Peru and 5,000 km2 in Chile. Our calculations (Table S7) result in an area of 19,000 km2 for Peru and 9,800 km2 for Chile. Moat et al. (2021) studied arid coastal belt fog oases only, while we also included non-coastal oases (e.g., oases of San Pedro de Atacama).
Some countries have zero or only a low number of oases in existing databases, although we identified oases in our predictions (e.g., Afghanistan, Australia, Botswana). This reflects a lack of research in certain regions, especially in Africa (Pimm, 2007), or differences in the terminology applied (see above). For example, a recent initiative aimed to document the world’s ‘oases’ defined as springs in drylands (Fensham et al., 2023a). That article provided a map with 14,518 coordinates of drylands springs, showing a certain level of overlap with the database presented here, although no detailed methodological information or a comprehensive list of coordinates was provided. It is evident that there are major discrepancies among the databases covering semi-arid and arid regions. While our database only contains information about oases located in arid areas and hyper-arid, the study by Fensham et al. (2023a) included thousands of coordinates plotted in semi-arid regions. This phenomenon is especially notable in North America, Southern Europe, and Australia. There, the ‘Dryland Springs Database’ contains the highest number of coordinates, in sharp contrast to the present study, in which majority of coordinates are located in arid or hyper-arid regions.
Random forest had been used before as the most suitable model for estimating vegetation cover of oases (Wang et al., 2022), and aridity index and NDVI have been applied in the past to classify arid lands (Gamo, Shinoda & Maeda, 2013). The latter methodology resulted in four different categories: Severe deserts, semi-arid regions, soil degradation areas, and areas including irrigated land and oases. Irrigated land, where vegetation is abundant despite dry conditions, are defined as NDVIymx ≥ 3.2AI (Gamo, Shinoda & Maeda, 2013). This category covers 0.8% of global land surface, while our calculations yielded 0.68%, similar to the results found by Thenkabail et al. (2009), indicating that our estimations are in line with previous approaches. Finally, the most comparable approach to ours to date (Cui et al., 2024) estimated a global area covered by oases of about 2 million km2, which corresponds to around 1.2% of the global surface area. This prediction is almost two times higher than our prediction; primarily explained by discrepancies within Asia (see next paragraph).
ANA region: in-depth case analysis
Oases in the ANA countries cover, based on our analyses, more than 400,000 km2. To put this number in context, global lakes cover 2,670,000 km2 (Messager et al., 2016), while global urban areas cover 621,000 km2 (He et al., 2019). In China the estimated total area of oases was 243,000 km2 in 1987, which increased to 331,700 km2 in 2017 (Chen et al., 2022). Other sources reported an increase from 207,812 km2 in 2000 to 289,751 km2 in 2020 (Liu, Wang & Xin, 2022). Our predictions exhibited an area of only 12,239 km2 in China. Most oases predicted in Liu, Wang & Xin (2022) can be also found in our models (Fig. 3), although the total spatial extent is considerably smaller in the present study. This is most likely due to methodological differences; while we consider NDVI median values higher than 0.2, no restriction in this parameter was used for mapping oases in China by Liu, Wang & Xin (2022).
Chinese oases are characterized by the presence of deciduous tree species, such as the poplar Populus euphratica and the salt cedar Tamarix chinensis (Li et al., 2020), as well as the presence of crops, mostly restricted to the months April to September (Sun et al., 2020). The reduction of leaf material in the winter months leads to a decrease of the total NDVI values, thus resulting in a much lower spatial extent of oases compared to the methodologies used by Liu, Wang & Xin (2022), Chen et al. (2022) and Cui et al. (2024). The principal advantage of our methodology, in comparison to existing approaches, is the utilization of coordinates from a global array of locations to construct a random forest model, as opposed to focusing on a specific region or country. By using a consistent, standardized methodology across different geographical areas, we enable meaningful comparisons between regions and continents. While this approach may result in reduced modelling power for individual region, the benefits of standardization and global applicability outweigh this limitation.
The discrepancies in the number of oases, or predicted in our random forest model, may also reflect the challenge with the definition of oasis. The border of a given oasis is often difficult to determine, considering their fractal nature, from isolated and contiguous oases to archipelagos, including fluvial oases. Irrigated areas predicted by Gamo, Shinoda & Maeda (2013) existed in large river basins. Fringing oases along large rivers (e.g., Nile River in Egypt, Punjab River in Pakistan, or Euphrates and Tigris rivers in Iraq) are not typically considered oases, while other riverine areas are widely defined as oases (e.g., Draa river in Morocco, Tarim river in China). We define oases as “…highly productive areas with permanent dense vegetation, embedded in drylands…” which aligns with the consideration of oases along dryland rivers where vegetation remains present seasonally permanent; contrast to temporary vegetation presence in drylands, such as deciduous tree crops. It is crucial to develop and establish a consensus regarding the definition (and typology) of oases that integrates both scientific understanding and indigenous and local communities knowledge. This may facilitate the modelling of the distribution, status, trend and relevance of oases, regionally to globally. Our approach encompasses a range of definitions (Table S2) aligning with the underlying conceptual framework as well as with a detailed spatial description.
Species richness and conservation status
Oases disproportionately contribute to dryland biodiversity, with 70 % of all dryland vertebrates recorded in oases. This is a higher share than previously reported by IUCN (2022) for drylands (Brito & Pleguezuelos, 2020). At the same time, more than 10% of all reported species are threatened, illustrating a high conservation value of oases for vertebrate species and overall biodiversity. Despite their value, oases are not yet included in global conservation planning. Indeed, only 0.32% of the area is actually under protection. Moat et al. (2021) stated that 4% of oases are protected in Peru and Chile, compared to less than 0.5% in the present study. This difference may be explained by the types of protected areas considered. We focused on internationally listed protected areas (i.e., IUCN categories I to VI), while all types of protected areas were used for the Andean fog oases. In any case, the low level of protection makes oases one of the most sensitive and threatened regions in the world (cf. Hoekstra et al., 2005). Typically, steppes are considered the most threatened terrestrial habitats (Wesche et al., 2016), but oases may be even more endangered. The Thirty-by-thirty (30 × 30) objective aims to preserve 30% of terrestrial and marine habitats by 2030; the inclusion of oases is considered vital for the conservation of drylands including desert biodiversity (Eckert et al., 2023). Our research represents a pioneering contribution to the field, emphasizing the vulnerability of otherwise highly neglected ecosystems.
Human population, land use, World Heritage sites
Drylands harbor close to 40% of the total human population, but only 343 million people live in desert (arid hyper-arid) areas. Twenty years ago, oases were estimated to contain more than 150 million inhabitants (Clouet & Dollé, 1998; RADDO, 2002). Considering that the human population has grown by 25% in the last 20 years, the human population inside oases would thus be up to 190 million people. These results agree with those found in our study. We determined a total of 150 million people living inside oases in ANA countries. For arid western China, more than 95% of the total human population and 90% of the social wealth are gathered in oases, which occupy only 4% of the respective land area (Li, Li & Wang, 2007). This is the most up-to-date estimation of the human population currently inhabiting oases. Moreover, most people live adjacent to oases, benefiting from the resources they provide without occupying these highly valuable ecosystems.
The land cover of oases differs among countries (Fig. 5). In some countries, oases are mostly composed of natural grasses, while in others crop land and urban areas dominate. This discrepancy may explain differences in oasis terminology among countries. Oases in Inner Asia except China (i.e., Russia, Kazakhstan, and Mongolia) are characterized by low human impacts and herbaceous vegetation, while oases in the Middle East are mostly managed for agriculture and therefore harbor woody vegetation (e.g., date palm trees). Finally, oases in Australia exhibit a low degree of human alteration and are covered by forests. Indeed, our model underestimates oases in China, while it overestimates oases in southern Australia or southwestern North America. For Australia, this could be explained by a higher vegetation cover compared to arid areas with a similar climate. Indeed, in Australia, a long history of spatial isolation has facilitated the adaptation of many plant species to dry environments (Maestre et al., 2021).
Additional research is needed to improve model predictions and broaden the knowledge base of oases at the global scale. Current global predictions (Cui et al., 2024) provide important information on hydrological trends, which are particularly relevant in the context of climate change, and offer insights into past land-use changes. However, previous research has not investigated or mapped the biocultural diversity that oases harbor. Our research goes beyond previous contributions by not only explicitly addressing but also mapping biocultural diversity. Oases include significant cultural sites, such as 75 UNESCO World Heritage Sites (Fig. 6), which represent 6.2% of all WHS globally; although oases only cover 0.7% of land surface. They are also home to up to 70% of all dryland vertebrates, 13% of which are classified as threatened. However, less than 0.5% of their total area is currently protected, making oases one of the least conserved ecosystems worldwide, as stated above. Overall, our findings highlight the crucial role oases play in global biocultural diversity, while underscoring the urgent need to protect these ecosystems and the unique diversity they support. To ensure transparency and replicability, we provide all data openly under FAIR (Findable, Accessible, Interoperable, Reusable) principles (Supplemental Materials), offering tools and opportunities for other scientists to build upon this line of research.
Future research
This article provides a comprehensive open-source database including an overview of research results obtained during the past decades, and reveals a global map of oases, which may facilitate interdisciplinary research on oases. There is an urgent need to map the past and present distribution of oases more accurately, characterize them, including the delineation of individual oases and to identify the underlying mechanisms that explain the multifaceted trends oases are exposed. Research questions may include: i) What is the status and the trend of oases in terms of cultural and biological diversity? ii) How fragile are (traditional) oases across geographical areas and types in terms of loss of acreage, population, and biocultural diversity? iii) What is the impact of climate change and groundwater exploitation on the environmental, ecological, and cultural status? iv) In what ways can traditional and sustainable oasis management and indigenous and local knowledge be more economically viable than current practices? v) How does a changing geopolitical context impact oases, and what role do oases play for human and animal migration? vi) To what extend can tourism be utilized to sustain oases instead of causing excessive exploitation?, and vii) can tourism improve awareness of traditional knowledge and mainstream environmental responsibility? We are convinced that the present study will stimulate research on oases and increase the awareness about the status and the futures of these fascinating albeit threatened ecosystems.
Conclusions
Oases represent vital albeit neglected ecosystems of global significance, playing crucial roles in supporting and maintaining biodiversity, ecological integrity, and having a rich cultural heritage. However, oases face escalating threats from various human activities and environmental changes, necessitating major attention and concerted conservation efforts. The conservation and management of oases must be improved by integrating ecological, socio-economic, and cultural dimensions. This requires collaborative efforts involving indigenous people and local communities, policymakers, scientists from various disciplines, and conservation practitioners. Our global analysis is considered an important step towards achieving these goals. Moreover, providing a comprehensive, open-source database of research results, covering past, present and future trends, will facilitate the study and sustainable use of oases as pivotal ecosystems for nature and people alike.
Supplemental Information
Number of papers per topic included in the database.
Topics with less than 20 papers each were aggregated (‘others’). Color gradient represents the year of publication of each paper and topic (period: 1975 to 2023).
List of oases and references found in the bibliographic research, including coordinates.
Relative importance of predictors used in Random Forest model to predict oases distribution.
List of references included in the bibliographic review with relevant bibliographic information.
Complete list of oasis with coordinates and the country of each oasis.
Biodiversity in oases.
1. Total list of species detected on oases and county in which each species was found in oases; 2. Total number of species per taxa per county found in oases, divided by endangered categories of IUCN; and 3. Total number of species per county found in oases, divided by endangered categories of IUCN.
Biocultural data of oases.
Biocultural information of oases per county including human population, size, land use and level of protection.
Final predictions of oases.
Vector version of the global map of oases at 1 km resolution.
Supplementary Script.
Google Earth Engine (GEE) script to implement a Random Forest classification model to predict vegetation presence across multiple countries using multi-source remote sensing data.