
Examining ozone effects on the tropical C4 crop Sorghum bicolor
- Published
- Accepted
- Received
- Academic Editor
- Douglas Domingues
- Subject Areas
- Plant Science, Atmospheric Chemistry, Environmental Impacts
- Keywords
- Biomass, Leaf mass per area, Stomatal properties
- Copyright
- © 2025 Farha et al.
- Licence
- This is an open access article distributed under the terms of the Creative Commons Attribution License, which permits using, remixing, and building upon the work non-commercially, as long as it is properly attributed. For attribution, the original author(s), title, publication source (PeerJ) and either DOI or URL of the article must be cited.
- Cite this article
- 2025. Examining ozone effects on the tropical C4 crop Sorghum bicolor. PeerJ 13:e18844 https://doi.org/10.7717/peerj.18844
Abstract
Ozone (O3), a major air pollutant, can negatively impact plant growth and yield. While O3 impacts have been widely documented in crops such as wheat and soybean, few studies have looked at the effects of O3 on sorghum, a C4 plant and the fifth most important cereal crop worldwide. We exposed grain sorghum (Sorghum bicolor cv. HAT150843) to a range of O3 concentrations (daytime mean O3 concentrations ranged between 20 and 97 ppb) in open-top chambers, and examined how whole plant and leaf morphological traits varied in response to O3 exposure. Results showed no significant impact of realistic O3 exposure on whole plant biomass and its partitioning in sorghum. These findings suggest that sorghum is generally resistant to O3 and should be considered as a favourable crop in O3 polluted regions, while acknowledging further research is needed to understand the mechanistic basis of O3 tolerance in sorghum.
Introduction
Tropospheric ozone (O3) is one of the most important air pollutants produced naturally by a series of photochemical reactions between the precursors: nitrogen oxides (NOx), volatile organic compounds (VOCs), methane (CH4) and carbon monoxide (CO) (Ainsworth et al., 2012; Schneider et al., 2017). Since the start of the industrial revolution, ground-level O3 concentrations have significantly increased globally due to increasing abundance of O3 precursor emissions (Monks et al., 2015; Young et al., 2013), and the influence of changing atmospheric chemistry under contemporary climate change (Brown et al., 2022). Ozone is well known to have a detrimental impact on plant growth, yield, and productivity (Ainsworth et al., 2012; Emberson et al., 2018). Indeed, it has been suggested that current O3 exposure reduces global yields of wheat, soybean, maize, and rice by 227 Tg annually (Mills et al., 2018). Even accounting for the positive CO2 fertilization effect, Tai et al. (2021) estimated global yield losses of 3.6 ± 1.1% for maize, 2.6 ± 0.8% for rice, 6.7 ± 4.1% for soybean, and 7.2 ± 7.3% for wheat. Such substantial crop losses due to O3 are a threat to global food production and security.
Generally, O3 from the atmosphere enters plant leaves through stomata (Ainsworth et al., 2012). When inside the leaf, O3 reacts rapidly with molecules in the liquid surrounding leaf cells and forms reactive oxygen species (ROS) such as hydrogen peroxide (H2O2), superoxide (O2−), and hydroxyl (OH˙) radicals (Ainsworth et al., 2012). O3 and its ROS derivatives can initially attack the cell membranes with primary targets being membrane lipids, susceptible amino acids in membrane proteins, and a variety of organic metabolites contained in the cell wall (Fiscus, Booker & Burkey, 2005). Due to these reactions within the cell membrane, O3 may produce new reaction products causing further cellular changes including oxidation of membrane lipids, alterations of protein function, and formation of ozonolysis products (Emberson et al., 2018; Fiscus, Booker & Burkey, 2005). This metabolic dysfunction and possible cell death causes a reduction in leaf photosynthesis and stomatal conductance, increased respiration rates, accelerated leaf senescence and visible injury (Ainsworth et al., 2012; Emberson et al., 2018). These physiological changes ultimately reduce plant growth, yield, and biomass accumulation (Emberson et al., 2018).
The reductions of biomass accumulation and yield represent integrated responses, useful in O3 risk assessments (Mills et al., 2018). Although leaf visible injury has commonly been used as an O3 response indicator, it is biologically less significant than the integrated measure of impacts on growth (Feng et al., 2014). The reduction in photosynthesis is also a functional O3 response variable that corresponds with the O3 impact on plant productivity (Li et al., 2016); however, the response of biomass has received more attention, as growth integrates internal and external processes that operate at different plant organizational levels (Uddling et al., 2004). These response variables in relation to O3 exposure metrics have been used to examine O3 effects on many plant species across a range of studies (Büker et al., 2015; Calatayud et al., 2011; Li et al., 2016; Zhang et al., 2012).
Different O3 metrics have been developed for assessing O3 risk (Emberson et al., 2018). At present, the most commonly used O3 metrics are the concentration-based AOT40 (accumulated O3 concentrations over a threshold of 40 ppb) and the flux-based PODy (Phytotoxic O3 Dose-the accumulated stomatal O3 flux above a threshold of y) (Shang et al., 2017). The AOT40 metric only considers the O3 concentrations in air that are above the 40 ppb threshold during daylight hours (Assis et al., 2015). However, as O3 uptake is mediated through the stomata, PODy which quantifies the effective stomatal flux of O3 entering the leaves, and considers the biological and climatic factors influencing gs, is a more rational metric than AOT40 (Assis et al., 2015; Peng et al., 2019). Studies also have indicated that PODy represents a better predictor than AOT40 to estimate the negative O3 impacts on plants (Büker et al., 2015; Karlsson et al., 2007; Mills et al., 2011). Therefore, the development of O3 flux-response relationships for specific species in different climatic conditions is a central step for assessing the O3 risk at regional, national, and global scales (Feng et al., 2015).
There are many studies about the adverse effects of O3 on C3 plant species (e.g., wheat, rice, soybean). However, relatively little work has been done on C4 species (Li et al., 2022, 2023; McGrath et al., 2015). Sorghum (Sorghum bicolor), a C4 tropical crop, is the fifth most important cereal crop in the world and has a high potential for bioenergy and ethanol production (Regassa & Wortmann, 2014; Yuan et al., 2008). Sorghum is highly adaptable and can be cultivated on marginal land where water deficit stress, alkalinity, salinity, and other limitations exist (Regassa & Wortmann, 2014; Yuan et al., 2008). Sorghum originated in Africa and is widely planted in tropical and sub-tropical regions (Hossain et al., 2022). At present, the tropics are experiencing high levels of O3 pollution due to the combined pressures of an increase in population, industrialization, and energy consumption (Kunhikrishnan et al., 2004; Leventidou et al., 2018). Though some studies have investigated the effects of O3 on sorghum in temperate environments (Li et al., 2021, 2022), studies under tropical conditions with local cultivars are still absent. As regional variation in the O3 susceptibility of crop cultivars is often present due to differences in breeding strategies and different climatic conditions (Hayes et al., 2020b), it is essential to investigate the impact of O3 pollution on sorghum under tropical climatic conditions.
Therefore, we carried out this study to evaluate the effects of a range of O3 exposures on sorghum using a cultivar grown in tropical Australia. Our objectives were (1) to examine the effects of O3 on sorghum biomass under various O3 concentrations and (2) to assess the leaf morphological trait responses to O3 to understand mechanisms of impact and/or tolerance.
Materials and Methods
The effects of O3 on Sorghum bicolor were examined in open top chambers (OTC) built at the UK University of Exeter’s TropOz Research facility (www.tropoz.org) located at James Cook University’s Environmental Research Complex (ERC) on the Nguma-bada campus in northeast Queensland, Australia. The experiment was conducted using nine independently controlled and monitored OTCs employing a gradient design (daytime mean O3 concentrations ranged between 20 and 97 ppb, Table 1). This gradient-design offers a better approach than replicating a limited number of exposure points, especially when attempting to identify a possibly nonlinear treatment response (Kreyling et al., 2018). Details of the OTC experimental set up are described in Farha et al. (2023). However, in brief, pure O3 generated on site (AirSep Onyx Plus O2 generator and OZ-T4600 O3 generator; Oxyzone International, Somersby, Australia) was provided between 08:00 and 17:00 h to OTC’s (internal volume 22.2 m3) receiving continuous ventilation with activated carbon filtered air (AirFlow-VC; Airpure Australia North St Marys, North St Marys, NSW, Australia). An ultraviolet (UV) absorption O3 analyser (Model 205, 2B technology, Boulder, CO, USA) was used to continuously monitor O3 concentrations in each chamber. At the same time environmental variables including air temperature (T), relative air humidity (RH), and photosynthetically active radiation (PAR) were recorded in the central OTC using a single meteorological monitoring station (Campbell Scientific, Logan, UT, USA) with an assumption that environmental conditions other than O3 concentrations were the same between OTC’s.
| Chamber ID | Daytime mean O3 (ppb) | POD6 (mmol m−2) |
|---|---|---|
| 1 | 20.7 ± 4.8 | 0.1 |
| 2 | 21.2 ± 5.0 | 0.1 |
| 3 | 28.3 ± 6.2 | 2.0 |
| 4 | 34.3 ± 8.7 | 5.1 |
| 5 | 37.8 ± 10.0 | 7.2 |
| 6 | 48.4 ± 15.5 | 13.8 |
| 7 | 60.1 ± 22.8 | 21.5 |
| 8 | 76.0 ± 28.7 | 31.7 |
| 9 | 97.0 ± 39.3 | 44.9 |
Plant material
Seedlings of grain sorghum (Sorghum bicolor cv HAT150843, commonly used in Queensland) were used in this experiment. A total of 2 months after germination, three seedlings established in 20-L pots filled with a locally sourced ‘garden mix’ topsoil were thinned to result in 27 homogeneous seedlings in individual pots. Each of these replicate seedlings were transferred into one of nine OTCs for O3 exposure (n = 3). The plants were grown under O3 fumigation for 3 months (from 13/07/2020 to 16/10/2020) until grain filling stage with a daily maximum exposure of 9 h (from 08:00 to 17:00). Plants were maintained in well-watered conditions using an automated drip irrigation system.
Stomatal conductance measurements and DO3SE model parameterization
At various points throughout the experiment, stomatal conductance to water vapor (gs) was measured on the newest fully expanded mature leaf using an SC-1 Leaf Porometer (Decagon Devices, Pullman, WA, USA). Point measurements of gs on both abaxial and adaxial leaf surfaces were conducted over a range of conditions for a total of 270 measurements of gs. These data were used to parameterize the Deposition of O3 for Stomatal Exchange (DO3SE) model (www.sei.org/tools/do3se-deposition-ozone-stomatal-exchange/) based on an empirical model of gs (Emberson et al., 2000; Jarvis, 1976), allowing for the calculation of the O3 flux-based metric POD6 (phytotoxic O3 dose-the accumulated stomatal O3 flux above a threshold of 6 nmol O3 m−2 projected leaf area (PLA) s−1) according to Convention on Long-range Transboundary Air Pollution (CLRTAP) (2017).
Prior to fitting DO3SE empirical parameters (Table 2), all gs data were transformed to relative stomatal conductance (RSC, gs/gmax), with the maximum stomatal conductance (gmax) calculated as the measurement’s 95th percentile of abaxial and adaxial data and final gs computed on a projected leaf area basis (PLA) using the abaxial: adaxial gs ratio. Parameterization of DO3SE was carried out according to Holder & Hayes (2022) using the plotting of RSC against light, leaf temperature and VPD independently. In order to fit the physiologically relevant curves, the x-axis was divided into parts and for each part, the 90th percentiles of the observed gs data were calculated (Fig. 1). To convert the gmax to gmaxO3, a conversion factor of 0.663 was used. The DO3SE model estimates the stomatal O3 uptake using the hourly mean values of O3 and meteorological conditions from the experiment (Table 2, Data set S1).
| Parameter | Unit | Sorghum bicolor cv HAT150843 | |
|---|---|---|---|
| gmax | mmol O3 m−2 s−1 | 290 | |
| Lm | m | 0.02 | |
| fmin | Fraction | 0.13 | |
| fPAR | Unitless | 0.007 | |
| fVPD | VPDmin | kPa | 4.50 |
| VPDmax | kPa | 2.60 | |
| ftemp | Tmin | °C | 14 |
| Topt | °C | 31 | |
| Tmax | °C | 48 |
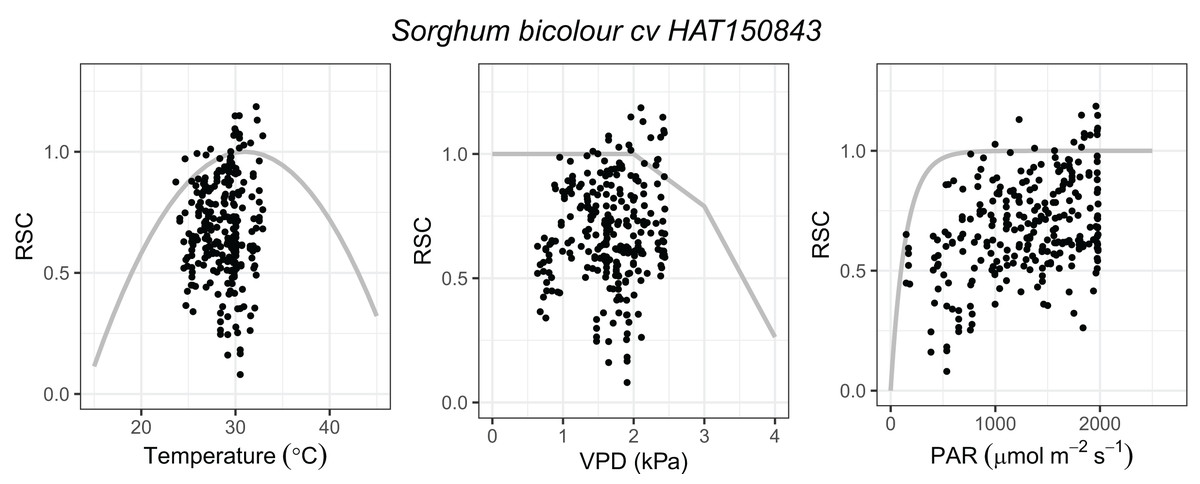
Figure 1: Functions describing the dependence relationship between relative stomatal conductance (RSC, gs/gmax) and air temperature (°C), vapour pressure deficit (VPD, kPa), and photosynthetically active radiation at the leaf surface (PAR, μmol m−2 s−1) respectively in Sorghum bicolor cv HAT150843.
Data points represent the observed data, and the grey lines show the physiologically relevant curve derived from the functions (based on 90th percentiles of the observed data).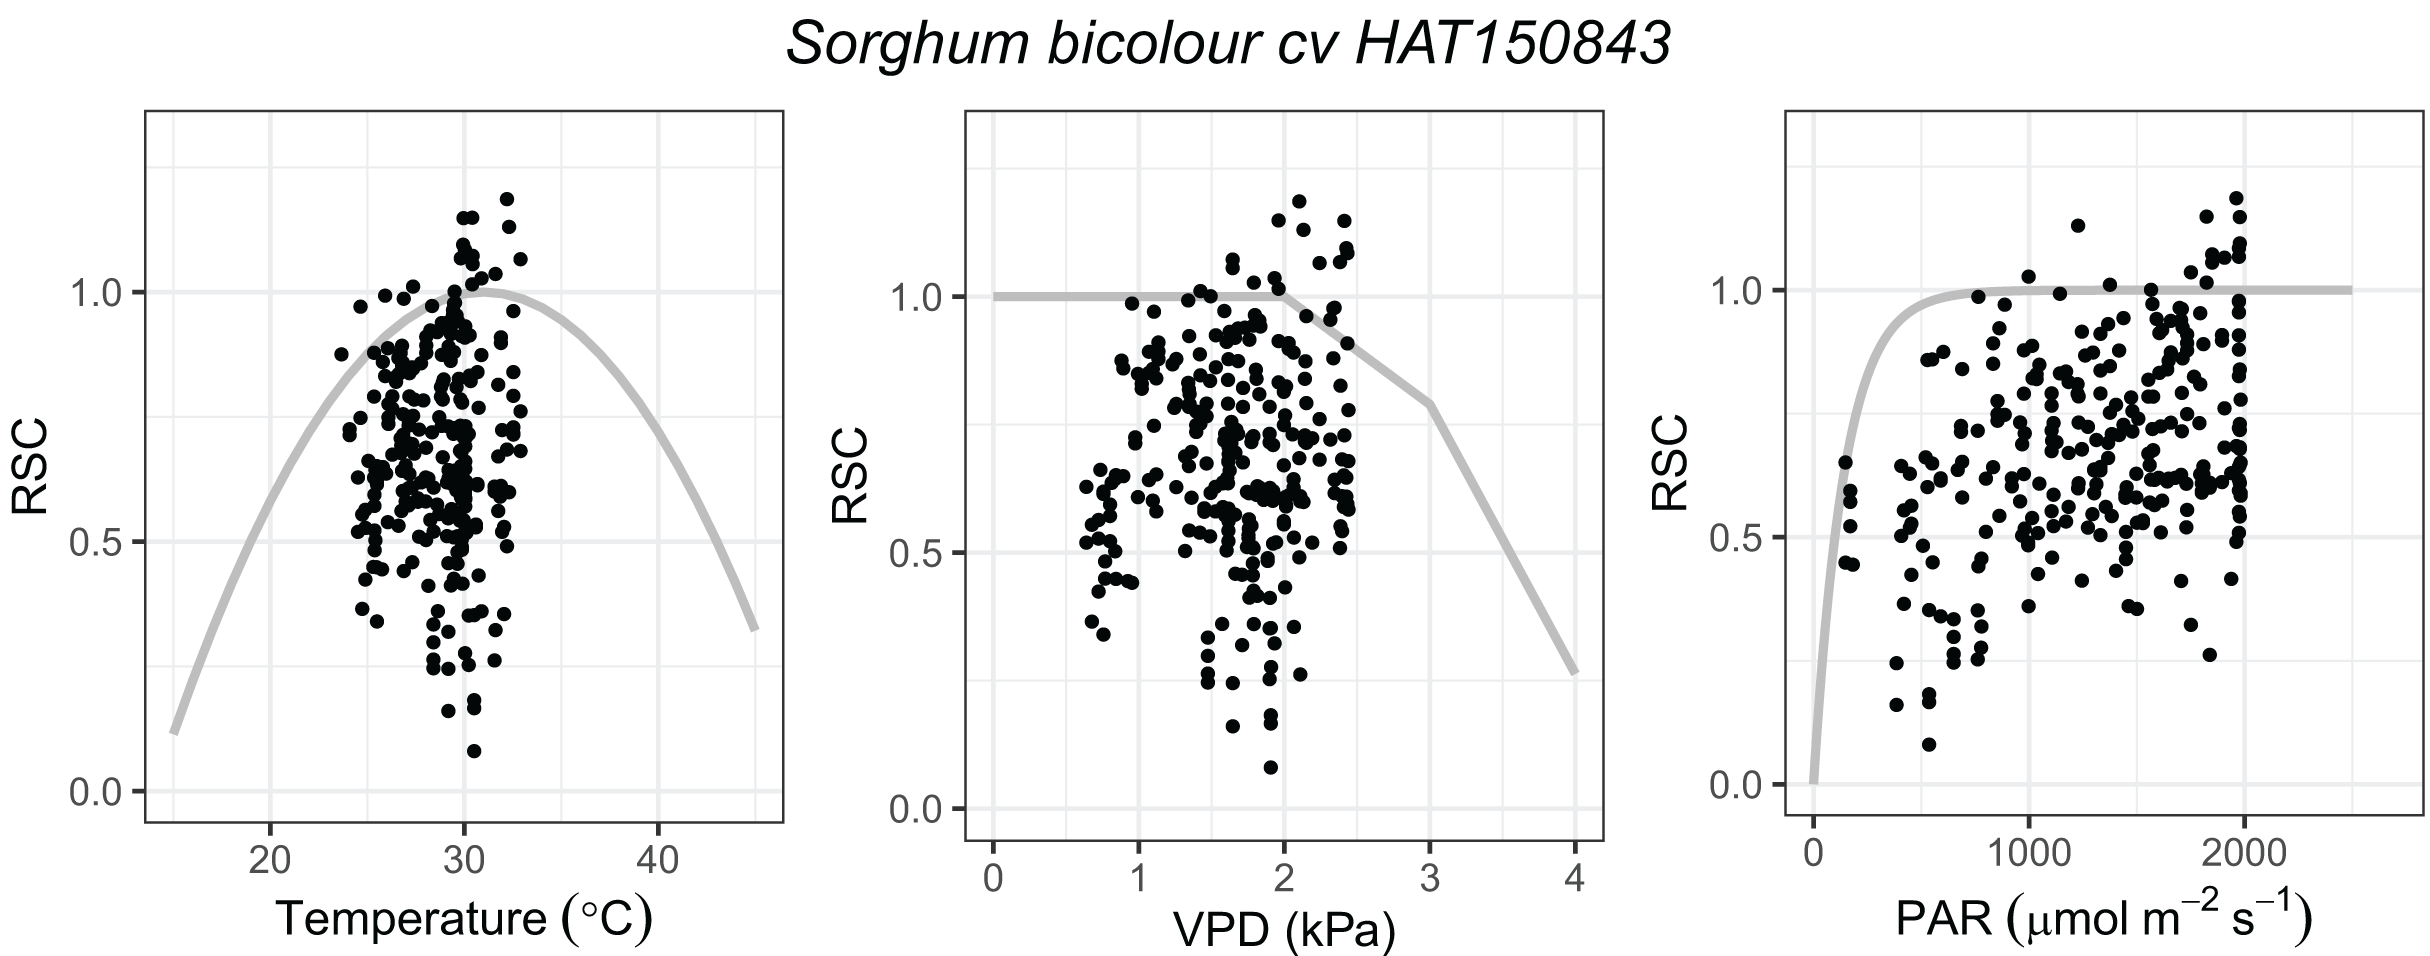
Net photosynthesis and chlorophyll concentration measurements
Additional gas exchange survey measurements using a portable photosynthesis system (Licor-6400; LI-COR Inc., Lincoln, NE, USA) were conducted at one point in time (14/08/2020) on all plants to determine the response of net photosynthesis (Anet) and gs to O3 exposure. During these survey measurements, carried out approximately halfway along the newest fully expanded leaf of each plant, block temperature was set to 28 °C, while PAR, and the CO2 concentration and relative humidity in the cuvette were set at 1,500 μmol m−2 s−1, 400 ppm and 70% to 80% to match ambient conditions at the time.
Changes in leaf chlorophyll content index (CCI) were measured in developing leaves from across the range in O3 exposure using a portable chlorophyll meter (MC-100; Apogee instruments, Logan, UT, USA) (Data set S2). The CCI metric was determined along the entire leaf-bade (six measurements) of one leaf per plant every 2 to 3 days for a total of 2 months from leaf-initiation through full expansion and to the point that chlorophyll concentration declined (i.e., 13 sampling points). For each leaf/sampling date measurements across the lamina were averaged, with CCI values converted to leaf chlorophyll concentration (μmol m−2) according to the sorghum conversion equation of Parry, Blonquist & Bugbee (2014). To estimate maximum chlorophyll concentration and the time since leaf-initiation that maximum concentration was reached, a quadratic equation was fitted to the averaged lamina data for each plant (Table 3).
| Chamber ID | Maximum chlorophyll concentration (μmol m−2) | β | topt (day) |
|---|---|---|---|
| 1 | 739.1 | 0.7 | 29 |
| 2 | 762.4 | 0.7 | 28 |
| 3 | 771.2 | 0.8 | 27 |
| 4 | 760.7 | 0.7 | 27 |
| 5 | 769.8 | 0.8 | 26 |
| 6 | 717.6 | 0.6 | 26 |
| 7 | 678.7 | 0.7 | 25 |
| 8 | 673.9 | 0.4 | 31 |
| 9 | 682.2 | 0.5 | 27 |
| Mean | 728.4 | 0.6 | 27 |
| SD | 41.1 | 0.1 | 2 |
Leaf morphological traits
At the end of the experimental period, three fully developed leaves were collected from each plant. Lamina subsections from each leaf were taken and measured for total fresh weight. After weighing, lamina sections were scanned (Cannon LiDE 400) and kept in a drying oven (70 °C, 72 h) for dry mass determination. Leaf dry mass and the lamina area, calculated using image analyser software (Image-J, NIH), were used to calculate leaf mass per unit area (LMA, g m−2). Prior to drying, lamina sections were subjected to the leaf impression method to determine the stomatal density (SD, number of stomata per unit area) and stomatal pore length (SPL, the length of stomatal pore opening). This method utilizes clear nail polish to make an impression or cast of the leaf surface, with the cast removed with sticky tape and mounted on a microscope slide. These slides were scanned with an Aperio CS2 scanner (Leica, Wetzlar, Germany). Aperio ImageScope Slide Viewing Software was used to count stomata and measure SPL.
Biomass
At the end of the experiment, leaves, stems, roots, and grain were each harvested separately. All plant materials were dried in an oven at 70 °C until constant weight and finally, dry biomasses were determined.
Statistical analyses
We examined the impact of O3 on response variables using a gradient design (Kreyling et al., 2018) wherein a linear regression of averaged data at the chamber level (n = 3 plants) was used to investigate the relationship of plant biomass, maximum chlorophyll concentration and leaf traits with the O3 flux metric, POD6. Pearson’s correlation test was performed to identify correlations between the leaf traits. Statistical analyses were conducted using the software R version 4.1.2 (R Core Team, 2021) utilizing base R and the packages plyr (Wickham, 2011), ggplot2 (Wickham, 2016), scales (Wickham, Pedersen & Seidel, 2023), nlme (Pinheiro et al., 2021), plantecophys (Duursma, 2015), and drc (Ritz et al., 2015).
Results
Sorghum (Sorghum bicolor cv HAT150843) was exposed to nine different concentrations of O3 in OTCs. Over the experimental period, the average values of daytime (i.e., between 8 am and 5 pm) O3 concentration ranged between 20.7 ± 4.8 and 97 ± 39.3 ppb (Table 1) and the average daytime air temperature, PAR, and RH were 28.1 ± 3.2 °C, 1137.7 ± 670.3 μmol m−2 s−1, and 57.5 ± 12.9%, respectively (Data set S1). Parameterization of gs functions in the DO3SE model (Table 2, Fig. 1) were carried out in accordance with Holder & Hayes (2022), with calculated POD6 ranging between 0.1 and 44.9 mmol m−2 (Table 1).
Biomass accumulation in sorghum was found to be not significantly impacted by exposure to O3. Specifically, there was no significant change in above ground (leaves and stems) biomass (Adj-R2 = −0.14, P = 0.86), below ground biomass (Adj-R2 = −0.01, P = 0.38) or grain biomass (Adj-R2 = −0.14, P = 0.85) with increasing O3 flux metric, POD6 (Fig. 2).
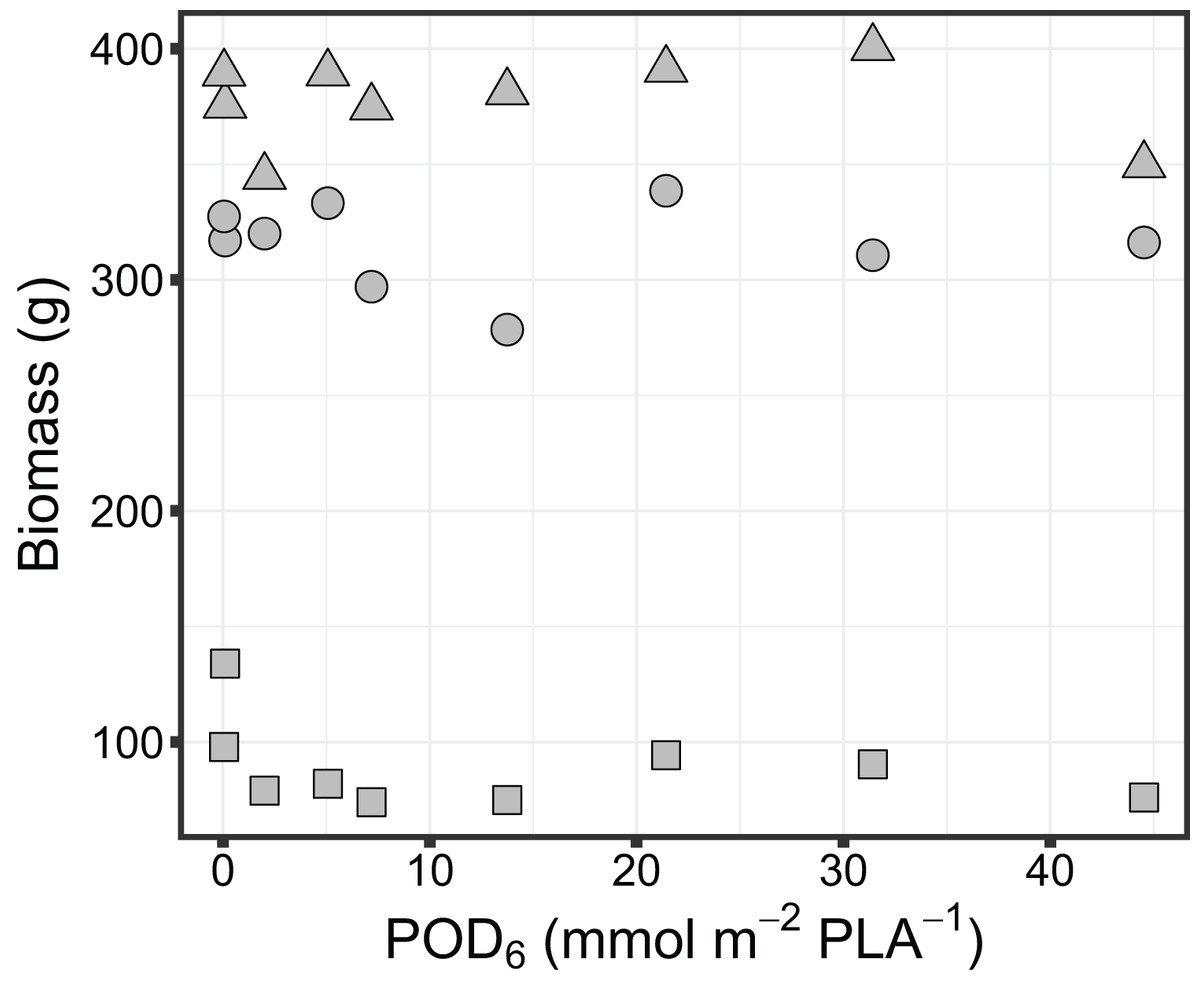
Figure 2: Variation in biomass of grain sorghum (Sorghum bicolor cv HAT150843) grown under various O3 concentrations. Grain biomass (triangle), above ground biomass (circle) and below ground biomass (square) are shown in relation to the O3 metric POD6.
No significant relationship was found for grain biomass (Adj-R2 = −0.14, P = 0.85), above ground biomass (Adj-R2 = −0.14, P = 0.86), or below ground biomass (Adj-R2 = −0.01, P = 0.38) with increasing O3 flux metric POD6.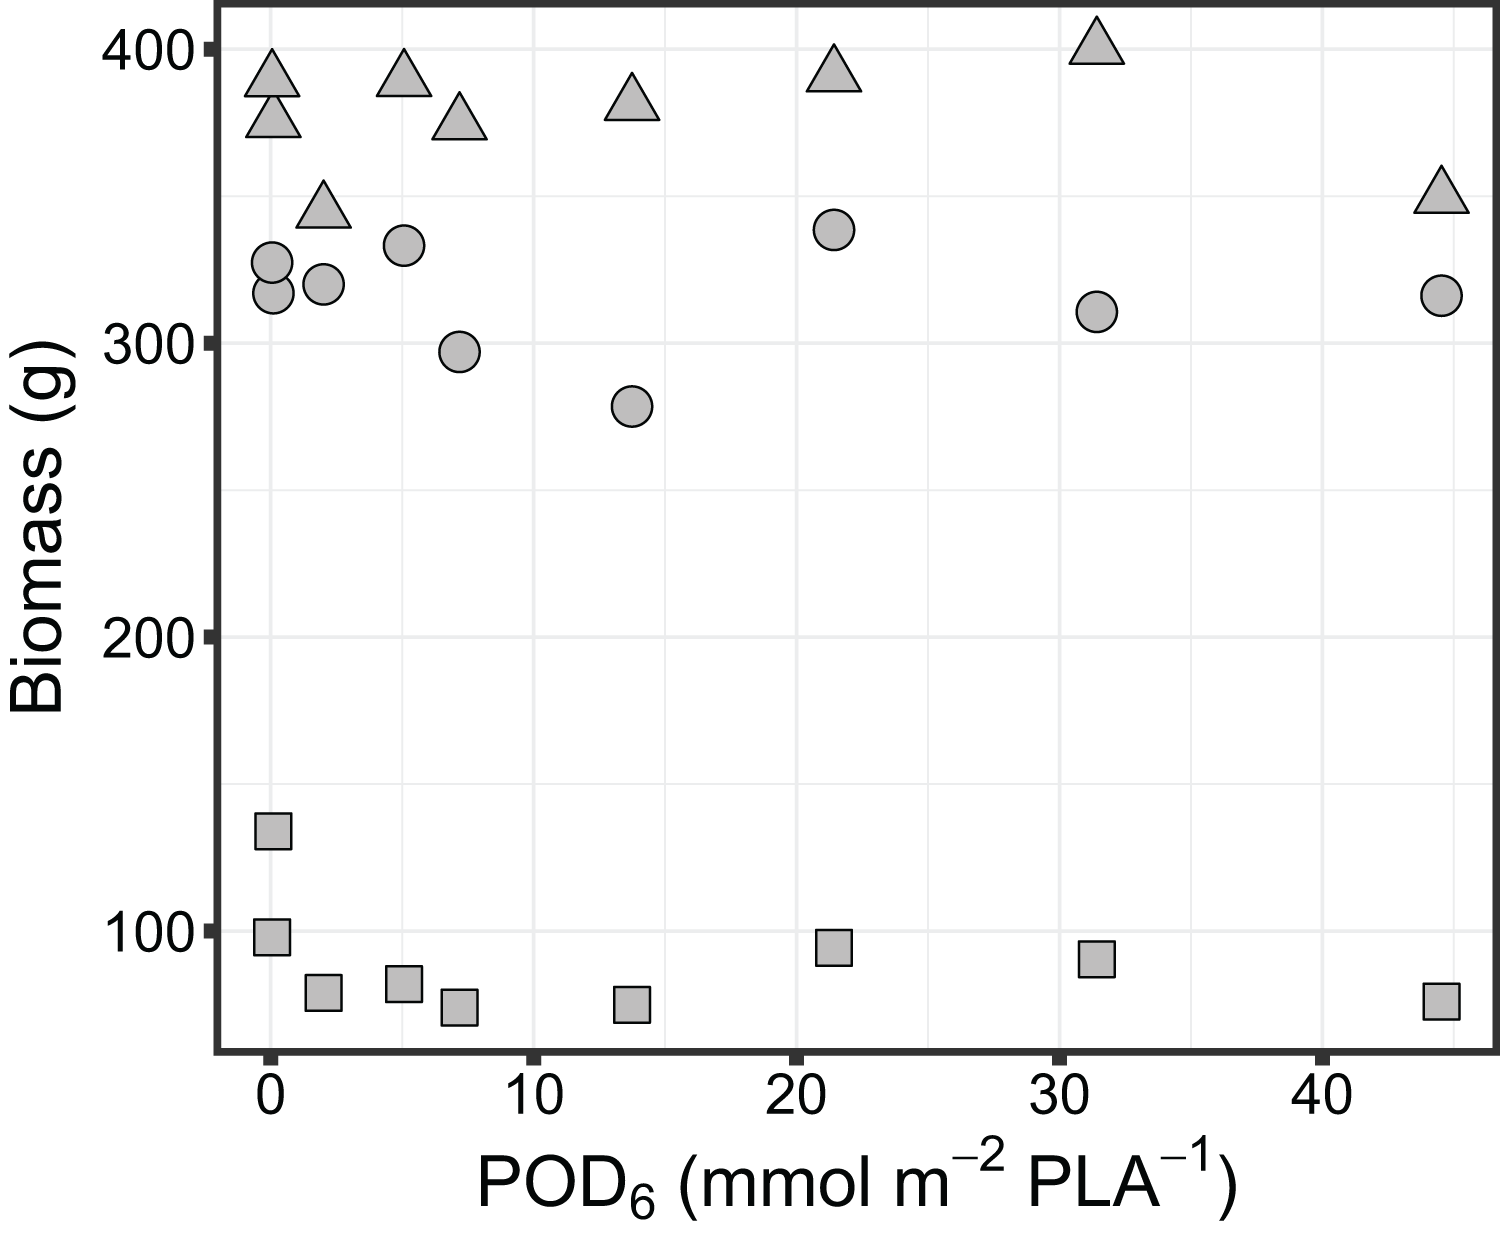
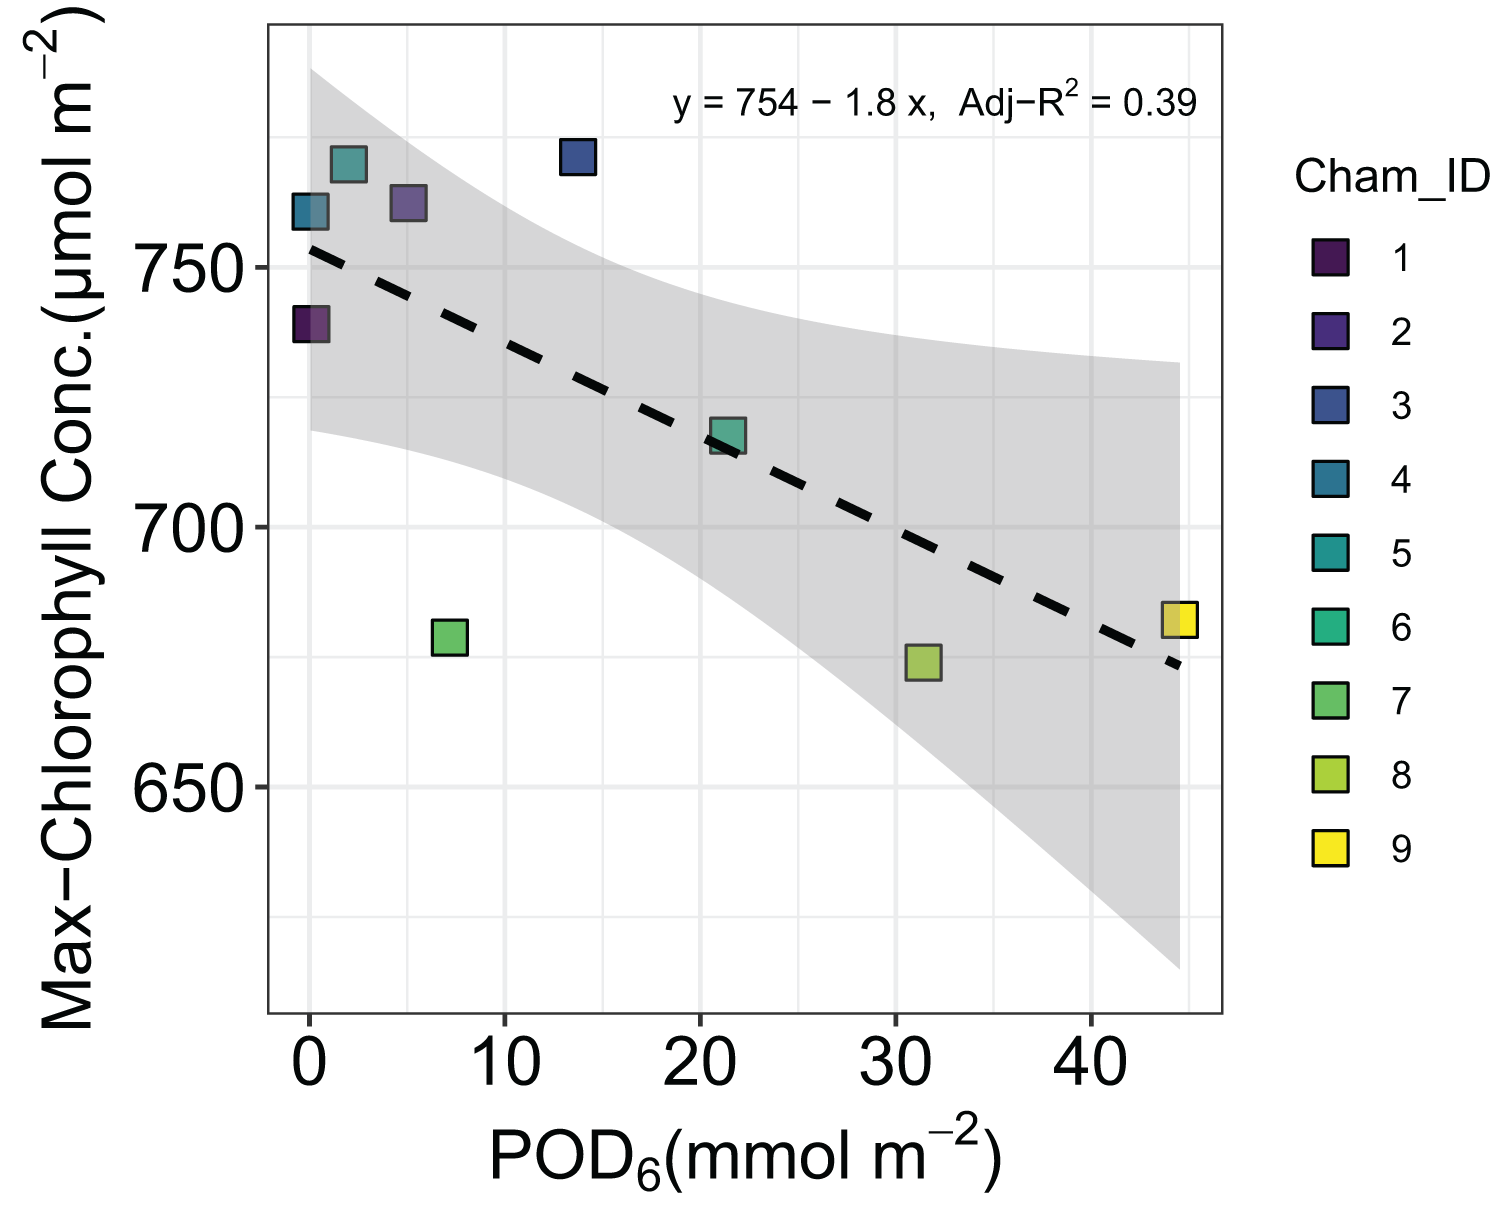
Our quadratic model provided an estimate of the optimal time (topt) for maximizing chlorophyll concentration and a rate parameter beta (β) as well as the mean and standard deviation of each parameter across all chambers (Table 3). Parameter beta indicates how quickly chlorophyll concentration decreases as time moves away from topt. The maximum chlorophyll concentration showed a slight but significant decline with increasing POD6 (Adj-R2 = 0.39, P < 0.05) (Fig. 3). However, leaf morphological traits such as LMA, SD, and SPL were not affected by O3 flux in sorghum. The LMA across the O3 exposure ranged between 44.8 and 48.8 g m−2 (Adj-R2 = −0.07, P = 0.52), SD ranged between 173 and 206 mm−2 (Adj-R2 = −0.10, P = 0.62) and SPL ranged between 19.4 and 20.6 µm (Adj-R2 = −0.13, P = 0.80) (Data set S1).
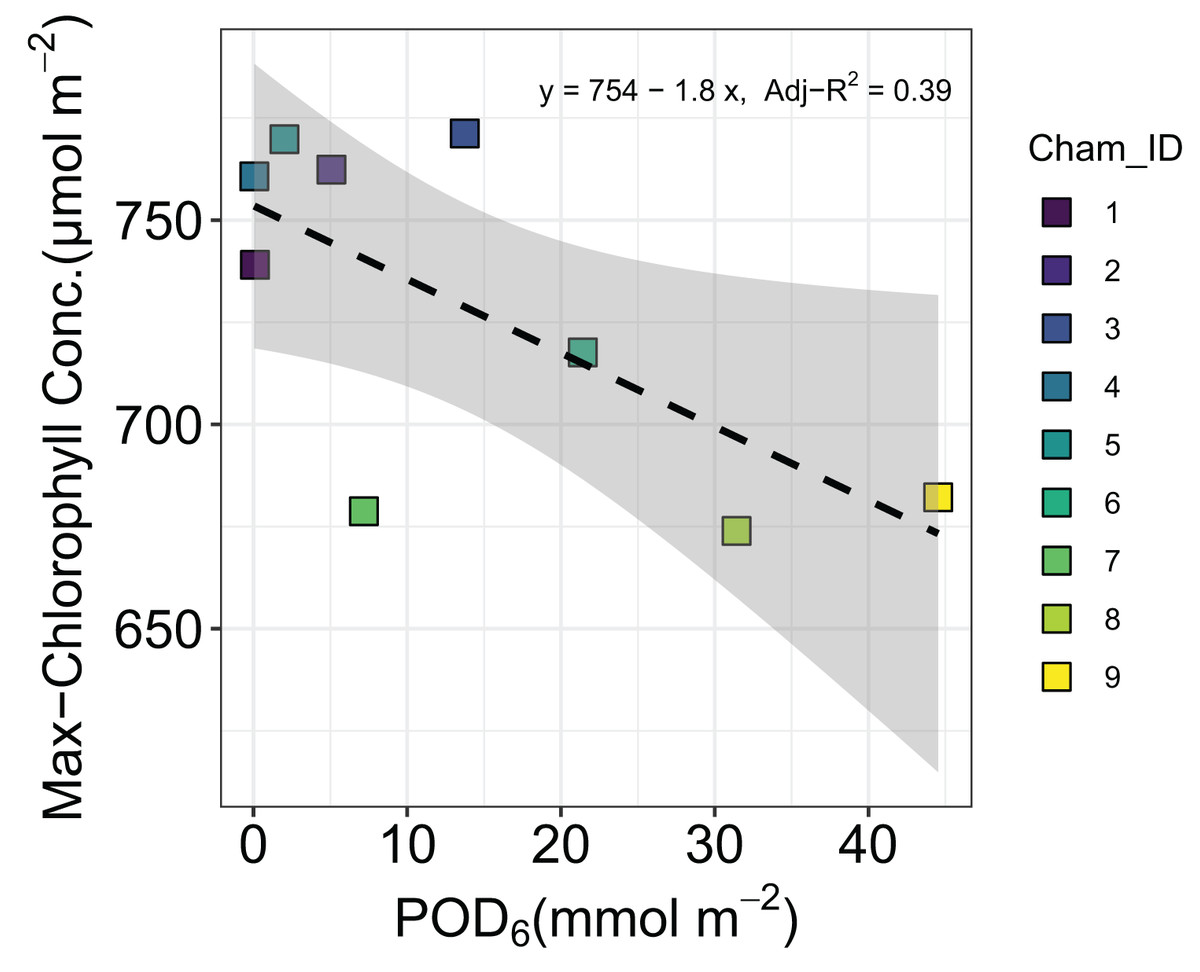
Figure 3: Changes in maximum chlorophyll concentration of grain sorghum (Sorghum bicolor cv HAT150843) grown under various O3 concentrations.
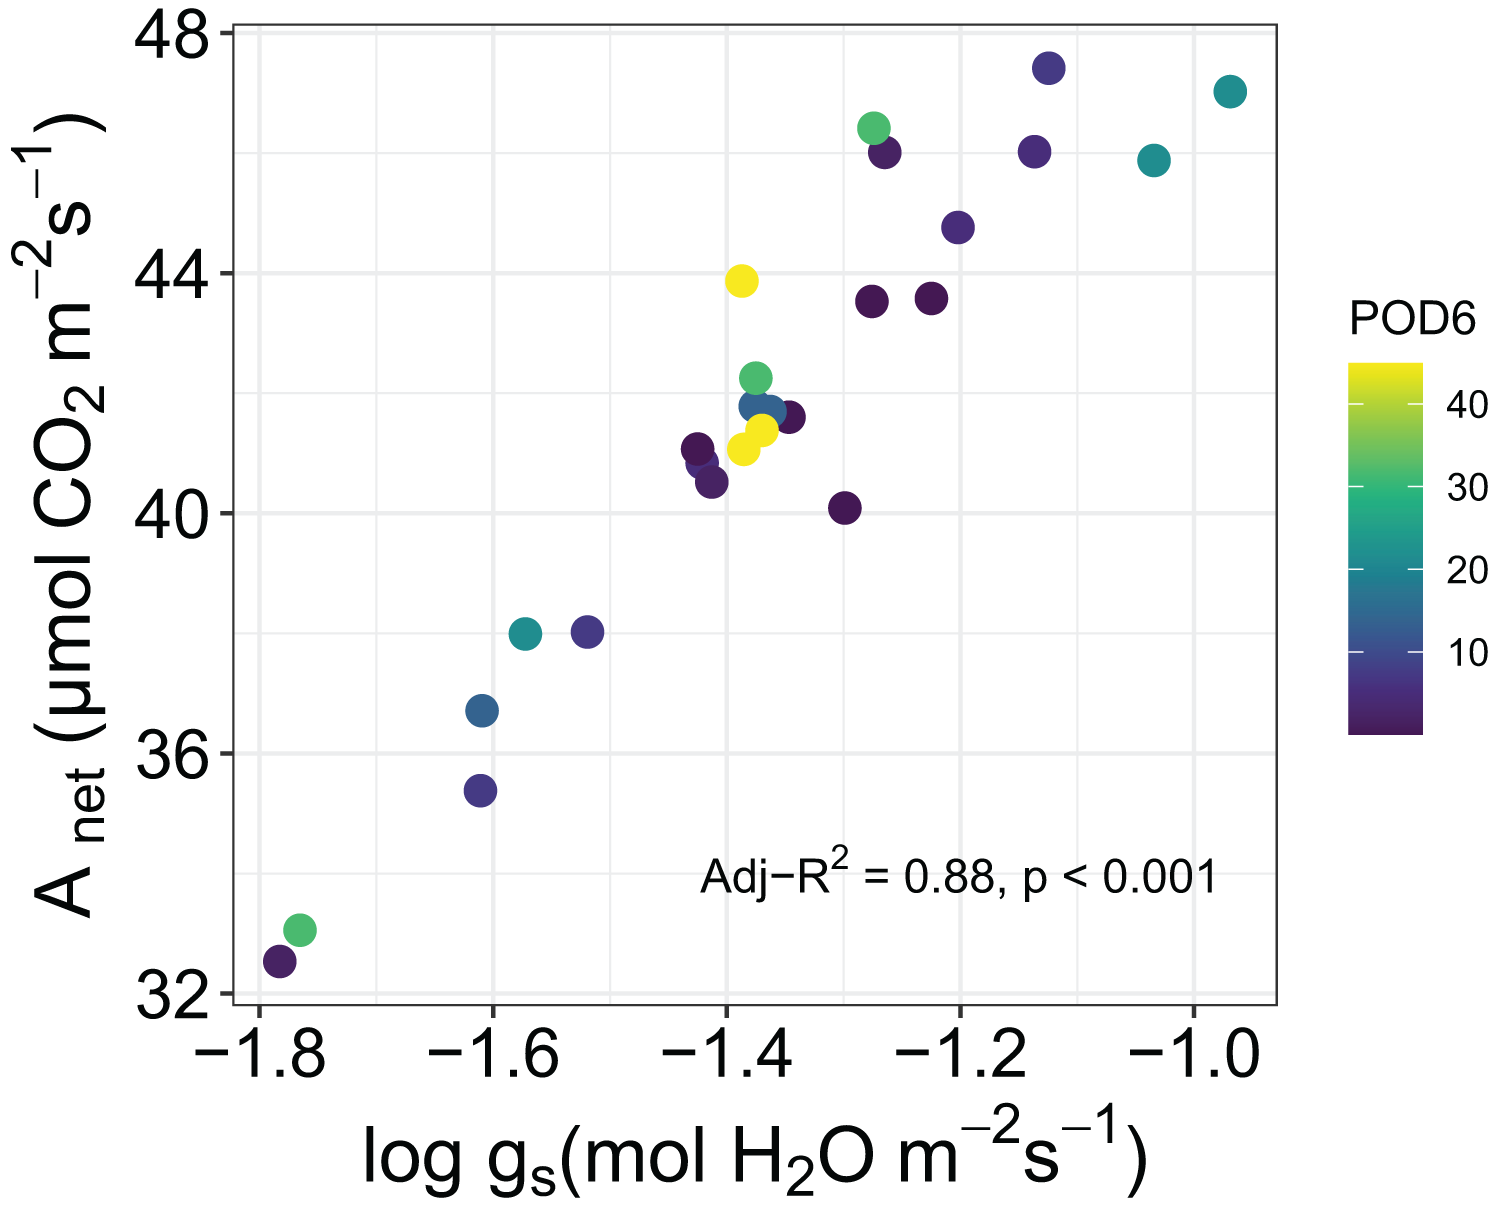
In addition, we tested for correlations among leaf traits in sorghum. There was a strong correlation between Anet and log of gs as measured by the portable photosynthesis analyzer (Adj-R2 = 0.88, P < 0.001), but the slope of the relationship was not affected by increasing POD6 (Fig. 4). Between the morphological traits the Pearson’s correlation test showed a positive correlation between LMA and SD (r = 0.41, P < 0.05) and a negative correlation between SD and SPL (r = −0.41, P < 0.05).
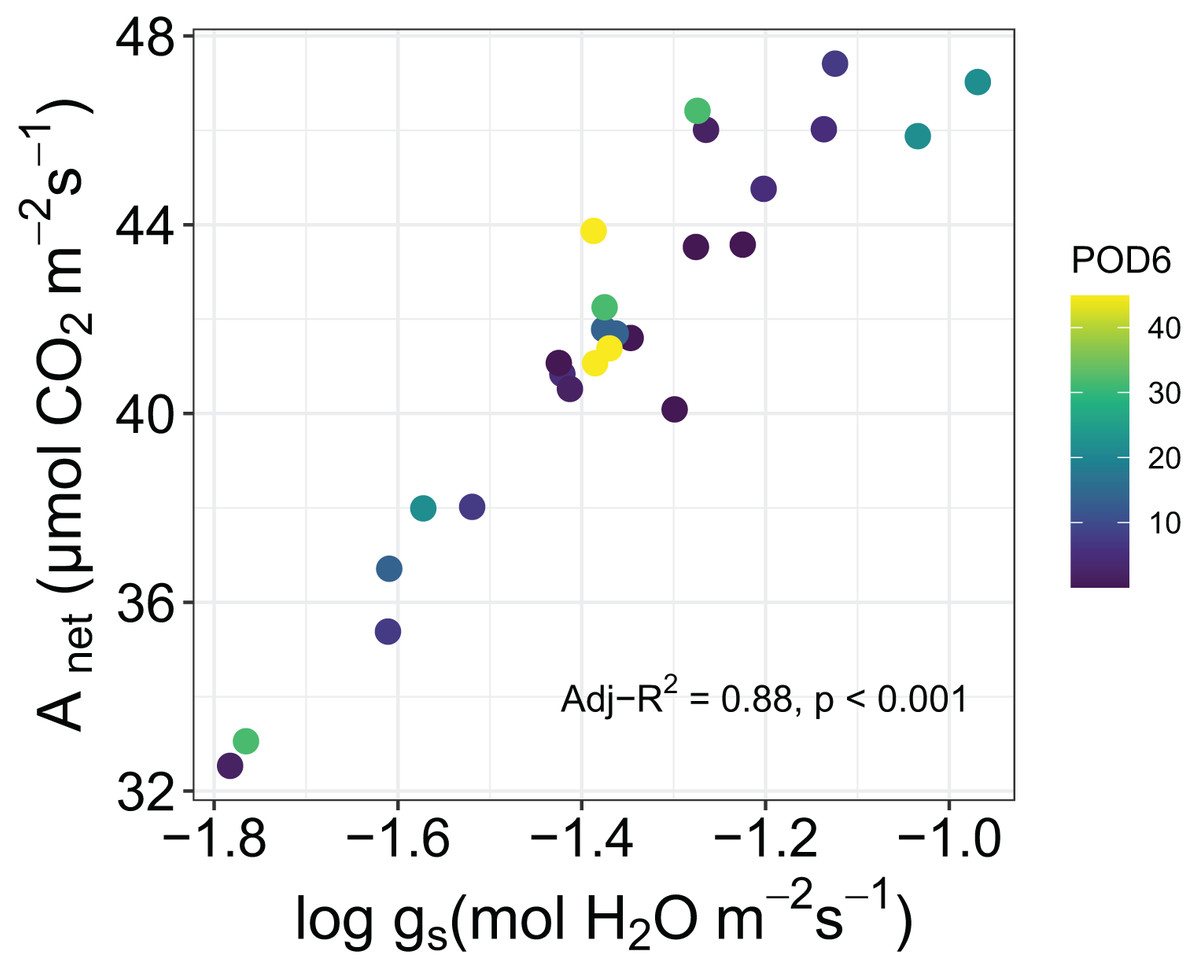
Figure 4: Relationship between net photosynthesis, Anet, and log of stomatal conductance, log gs, for sorghum grown under various O3 concentrations.
Discussion
Many studies have highlighted the interspecific and cultivar-level variability in negative impacts of O3 on plant biomass and yields in C3 crops (Emberson et al., 2018; Wittig et al., 2009). However, while C4 plants are generally more O3 tolerant there is also evidence that elevated O3 has a variable impact on C4 plants (Li et al., 2022) with some species such as switchgrass (Li et al., 2019) and sorghum (Hayes et al., 2020a; Li et al., 2021) showing a low suceptibility to O3 exposure. In the first experiment for sorghum grown under tropical conditions, we found that in the cultivar examined (cv. HAT150843) there was no significant change in biomass or yield with increasing O3 flux, although maximum chlorophyll concentration was found to be reduced with increasing POD6. As sorghum has evolved in the tropics, environmental adaptations to cope with environmental stresses such as high temperature, drought, and light intensity (Regassa & Wortmann, 2014) have resulted in high water-use efficiency and antioxidant capacity, which may confer a capacity to also cope with the oxidative stress as a result of O3 exposure (Li et al., 2021).
Leaf mass per area is a good indicator of plant functional type that can explain the differences in O3 susceptibility among species (Feng et al., 2018), whereby leaves with high LMA tend to be less susceptible to O3 (Li et al., 2016). However, there can be an impact of O3 on LMA itself, as demonstrated by Shang et al. (2017) who found a significant negative relationship between LMA and O3 metrics in C3 poplar clones. Our results show no significant relationship between LMA and O3 flux in sorghum, consistent with a recent study of maize (Peng et al., 2020) and other C4 bioenergetic crop species (i.e., switchgrass, sorghum, maize, and miscanthus) (Li et al., 2022). This difference may be the result of the unique leaf anatomical features of C4 species, including mesophyll cells surrounding bundle sheath cells in which the photosynthetic carbon reduction cycle occurs (Montes et al., 2022).
As O3 uptake from the atmosphere occurs through leaf stomata, stomatal properties play an important role in shaping plant responses to O3, at the same time that O3 exposure can impact stomata through disrupting leaf development. Previous work in other species has reported that O3 exposure increases SD (Fusaro et al., 2016; Paoletti & Grulke, 2005). In our study, neither SD nor SPL were found to be significantly correlated with O3 flux, POD6, with similar findings reported in switchgrass with respect to foliar anatomy (Li et al., 2019). However, in our study on sorghum, there was a negative correlation between SD and SPL, and a positive correlation between SD and LMA. Across various species, SD shows a negative relationship with SPL (Franks & Beerling, 2009; Hetherington & Woodward, 2003; Roth-Nebelsick et al., 2012), with plants with a higher density of small stomata able to open and close them more rapidly in response to changes in leaf water status (Hetherington & Woodward, 2003). This has been shown to contribute in varying degrees to drought tolerance in grasses (Xu & Zhou, 2008) and olive cultivars (Bosabalidis & Kofidis, 2002). It may also contribute to tolerance of O3 induced stress. However, more studies on a range of sorghum genotypes would be required to understand the relationship among leaf traits across the breadth of genetic variation observed within the species.
As might be expected we found a strong correlation between Anet and log of gs as measured by leaf-level gas-exchange in sorghum, however the proportionality between the two did not respond to increasing O3 exposure. This is perhaps inconsistent with a recent study in which this proportionality was shown to have responded to increasing O3 concentrations (Cernusak, Farha & Cheesman, 2021), and provides yet another indication that the physiology of sorghum was largely resistant to impacts of O3 across the range of exposure that we applied in our experiment. In this context, it is interesting that we could detect an influence of increasing level of O3 exposure on the maximum chlorophyll concentrations observed in leaves of the experimental plants (Fig. 3). However, it seems that the approximately 10% decline in maximum chlorophyll concentration from lowest to highest O3 exposures was not of large enough magnitude to markedly impact leaf-level gas exchange (Fig. 4).
Conclusion
Based on plant biomass, leaf-level gas exchange and the morphological trait responses studied, our results showed little significant effect of O3 on grain sorghum. Thus, it can be concluded that sorghum is not susceptible to elevated O3, even when grown under tropical field conditions. Hence, sorghum could be an advantageous crop in tropical regions with high levels of O3 pollution to help combat tropical food insecurity challenges (Hayes et al., 2020a). However, it should be noted that in this study, only one genotype was examined. To more broadly understand O3 responses, additional experiments with more genotypes, and a broader range of functional traits and conditions are required.