
Abnormal hypothalamic functional connectivity and serum arousal-promoting neurotransmitters in insomnia disorder patients: a pilot study
- Published
- Accepted
- Received
- Academic Editor
- Feng Liu
- Subject Areas
- Psychiatry and Psychology, Radiology and Medical Imaging, Translational Medicine, Mental Health
- Keywords
- Hypothalamus, Functional connectivity, Insomnia disorder, Orexin-A, Histamine
- Copyright
- © 2024 Lin et al.
- Licence
- This is an open access article distributed under the terms of the Creative Commons Attribution License, which permits using, remixing, and building upon the work non-commercially, as long as it is properly attributed. For attribution, the original author(s), title, publication source (PeerJ) and either DOI or URL of the article must be cited.
- Cite this article
- 2024. Abnormal hypothalamic functional connectivity and serum arousal-promoting neurotransmitters in insomnia disorder patients: a pilot study. PeerJ 12:e18540 https://doi.org/10.7717/peerj.18540
Abstract
Objective
The present study aimed to investigate the functional connectivity (FC) of the anterior and posterior hypothalamus with the whole brain in insomnia disorder (ID) patients. Additionally, we explored the relationship between FC values and serum levels of arousal-promoting neurotransmitters (orexin-A and histamine) in ID patients.
Methods
This study enrolled 30 ID patients and 30 age- and gender-matched healthy controls. Resting-state functional magnetic resonance imaging (RS-fMRI) was employed to assess the FC of the anterior and posterior hypothalamus with the whole brain. Serum concentrations of orexin-A and histamine were measured using enzyme-linked immunosorbent assay (ELISA). Moreover, Spearman correlation analysis was conducted to investigate the relationship between FC values and serum levels of arousal-promoting neurotransmitters in ID patients.
Results
Our findings showed decreased FC between the posterior hypothalamus and several brain regions including the bilateral orbital superior frontal gyrus, the bilateral angular gyrus, the right anterior cingulate cortex, the left precuneus, and the right medial superior frontal gyrus in ID patients. Additionally, decreased FC was observed between the anterior hypothalamus and the right anterior cingulate cortex among ID patients. Compared to the healthy controls, ID patients showed significantly elevated serum concentrations of orexin-A and histamine. Furthermore, we identified a positive correlation between the FC of the right medial superior frontal gyrus with posterior hypothalamus and histamine levels in ID patients.
Conclusion
ID patients exhibited aberrant FC in brain regions related to sleep-wake regulation, particularly involving the default mode network and anterior cingulate cortex, which may correlate with the peripheral levels of histamine. These findings contribute to our understanding of the potential neuroimaging and neurohumoral mechanism underlying ID patients.
Introduction
Insomnia disorder (ID) is a common sleep disorder characterized by challenges in falling asleep or staying asleep, even with sufficient time and proper conditions for sleep, resulting in decreased daytime performance and quality of life (Krystal, Ashbrook & Prather, 2021; Perlis et al., 2022). It impacts a substantial portion of the global population, with prevalence estimates varying from 10% to 30% in the general population (Chung et al., 2015). However, the exact causes of ID are complex and not fully understood. Various hypotheses have been proposed by scholars to explain ID, with particular attention given to the hyperarousal hypothesis (Riemann et al., 2010).
Recent advancements in neuroimaging techniques have offered valuable insights into the neural correlates of ID. Specifically, functional magnetic resonance imaging (fMRI) studies have revealed changes in brain activity and functional connectivity (FC) linked to ID, emphasizing abnormal functioning in regions important for sleep-wake regulation (Kay & Buysse, 2017; Khazaie et al., 2017). Previous studies have utilized regions of interest (ROI) including the amygdala (Huang et al., 2012), the anterior cingulate cortex (ACC) (Wang et al., 2023), the thalamus (Li et al., 2019), and the default mode network (DMN) (Aquino et al., 2024) to investigate connectivity patterns in ID, revealing altered FC in various brain regions of ID patients; however, conclusions were inconsistent (Fasiello et al., 2022; Aquino et al., 2024).
The hypothalamus plays a critical role in regulating the sleep-wake cycle (Saper, Chou & Scammell, 2001; Saper, Scammell & Lu, 2005; Szymusiak & McGinty, 2008). Human observational studies on the anatomical basis of sleep-wake regulation indicate that the posterior hypothalamus (PH) promotes arousal while the anterior hypothalamus (AH) facilitates sleep (Boes et al., 2018). Early animal studies on sleep-wake regulation pathways have identified the PH nucleus as a major component of the ascending arousal system promoting wakefulness. Meanwhile, the ventrolateral preoptic nucleus within the AH has emerged as a key player in promoting sleep through inhibitory actions (Köhler et al., 1986; Ko et al., 2003; Takahashi, Lin & Sakai, 2009). Lesions in the PH can trigger narcolepsy episodes, whereas lesions in the AH can result in insomnia symptoms, thus supporting the role of the hypothalamus in sleep-wake regulation (Swett & Hobson, 1968; Lu et al., 2000). Additionally, AH and PH exhibit negatively correlated state-dependent discharge patterns, with the PH predominantly discharging during wakefulness, while the AH shows specific activation during non-rapid eye movement (NREM) sleep (Steininger et al., 1999; De Luca et al., 2022).
The precise localization of the human ROI within the hypothalamus remains unclear. Boes et al. (2018) utilized fMRI to examine 98 healthy participants, delineating a negative correlation between the anterior and posterior regions of the hypothalamus. The ROIs within the hypothalamus were selected by two anatomists with expertise in hypothalamic anatomy, utilizing a standard Montreal Neurological Institute (MNI) space high-resolution T1-weighted MRI template (Fonov et al., 2011). Furthermore, a recent study refined the coordinates of anterior and posterior regions of the hypothalamus during wakefulness and NREM sleep by simultaneously collecting electroencephalography (EEG) and fMRI data from healthy participants to investigate brain functionality (Jiang et al., 2021). Currently, there are relatively few studies using MRI to examine structure and function of hypothalamus in ID patients. Ding et al. (2021) found higher FC between the left hypothalamus and other brain regions, including the medial prefrontal cortex and pallidum in ID patients compared with healthy control (HC). Additionally, ID patients showed increased volumes in the specific subunits of the hypothalamus when compared to HC (Luo et al., 2024). Therefore, it is currently crucial to investigate the FC in the AH and PH of ID patients, as these regions are associated with sleep-promoting and arousal-promoting functions, respectively.
Orexin-A and histamine are neurotransmitters known to promote wakefulness. Previous studies have explored the role of these neurotransmitters together in relation to the pathophysiology of diseases such as Alzheimer’s disease and narcolepsy (Shan, Dauvilliers & Siegel, 2015; Gabelle et al., 2017). Orexin-A primarily exerts excitatory effects on sleep-wake cycles, typically coupling with intracellular Gq signaling proteins (Hoang et al., 2003; Karteris et al., 2005). Histamine, another key arousal-promoting neurotransmitter, acts via H1 and/or H3 receptors and crucially regulates sleep-wake cycles (Thakkar, 2011). Administration of histamine or H1 receptor agonists induces wakefulness, while H1 receptor antagonists promote sleep. Anatomically, histamine neurons and orexin neurons partially overlap in the PH (Anaclet et al., 2009). Histamine neurons located in the tuberomammillary nucleus (TMN) and surrounding areas exhibit increased firing during wakefulness (Steininger et al., 1999), whereas orexin neurons in the perifornical area discharge during both wakefulness and rapid eye movement (REM) sleep (Mileykovskiy, Kiyashchenko & Siegel, 2005).
Based on the hyperarousal theory and the role of the hypothalamus in sleep regulation, we hypothesized that ID patients would exhibit altered connectivity patterns between the hypothalamus and other sleep-related regions, accompanied by elevated concentrations of arousal-promoting neurotransmitters. Therefore, using seed-based FC analysis, this study aimed to investigate the resting-state FC of the AH and PH within the whole brain in ID patients. Additionally, we measured serum levels of orexin-A and histamine to explore their relationship with the FC of the PH within the whole brain in ID, as these arousal-promoting neurotransmitters are primarily secreted by neurons in the PH.
Materials and Methods
Participants
The present study recruited participants from outpatient clinics, the sleep center, or surrounding communities affiliated with the First Affiliated Hospital of Jinan University from February 2023 to January 2024. The study was conducted at the First Affiliated Hospital of Jinan University and obtained approval from its medical ethics committee (Approval No. KY2022-144/2023-113). Written informed consent was obtained from all participants prior to their participation.
All recruited participants met the following criteria: (1) aged between 18 and 65 years; (2) education level of primary school or above; (3) right-handedness; and (4) absence of contraindications for MRI. The ID group met the criteria for insomnia disorder (F51.01) as outlined in the Diagnostic and Statistical Manual of Mental Disorders, Fifth Edition (DSM-5). Participants in the HC group did not meet the DSM-5 diagnostic criteria for insomnia disorder, either previously or currently.
The exclusion criteria of both groups were: (1) comorbid severe somatic or neurological diseases; (2) comorbid other sleep-wake disorders, including obstructive sleep apnea syndrome or periodic limb movement of sleep; (3) comorbid psychiatric disorders such as schizophrenia, depressive disorders, anxiety disorders, bipolar affective disorder, and post-traumatic stress disorder; (4) insomnia symptoms caused by substance use such as central nervous system stimulants; (5) history of shift work or jet lag; (6) pregnant and lactating women; and (7) history of taking sedative-hypnotic drugs or receiving other interventions in the past 2 weeks.
Clinical assessment
We investigated demographic information and administered scale assessments to participants. Clinical interviews and diagnoses were conducted by two senior physicians. Sleep was evaluated through the use of both the Pittsburgh Sleep Quality Index (PSQI) and the Insomnia Severity Index (ISI), with higher scores indicating worse sleep quality. The PSQI was employed to evaluate self-reported sleep quality and disturbances over a 1-month period, with scores ranging from 0 to 21. The ISI is a 7-item self-report measure used to assess the severity of insomnia symptoms, including the intensity of initial, middle, and late insomnia. Additionally, the Hamilton Depression Rating Scale (HAMD-17) and the Hamilton Anxiety Rating Scale (HAMA) were used to assess mood symptoms, and the Montreal Cognitive Assessment (MOCA) was administered to evaluate cognitive function.
Polysomnography
The participants underwent multi-channel sleep monitoring using a dynamic 64-channel polysomnography (PSG) device (Compumedics, Melbourne, Australia). All participants completed two consecutive nights of PSG, with the first night designated to exclude other sleep disorders including parasomnias, sleep apnea syndrome, and periodic limb movement disorders. The PSG conducted on the second night was used to eliminate the first-night effect (Hu et al., 2024). Data from the second night were exclusively used for subsequent analysis. The objective PSG parameters included total sleep time (TST); sleep efficiency (SE); time of wakefulness after sleep onset (WASO_time); number of wakefulness after sleep onset (WASO_number); sleep onset latency (SOL); REM latency (REM_L); wake duration; NREM sleep stage 1 (N1) duration; NREM sleep stage 2 (N2) duration; NREM sleep stage 3 (N3) duration; REM (R) duration; N1 sleep time; N2 sleep time; N3 sleep time; R sleep time; and the respective percentages of each sleep stage: N1 percentage (N1_perc), N2 percentage (N2_perc), N3 percentage (N3_perc), R percentage (R_perc); REM latency, number of awakenings (NAW), arousal index of REM (ArI_REM), arousal index of NREM (ArI_NREM).
MRI data acquisition
MRI scans were conducted on the same day as blood sampling at the Radiology Department of the First Affiliated Hospital of Jinan University. All MRI data were collected using a GE Discovery MR750 3.0T scanner, equipped with an eight-channel head coil. Foam pads were employed to minimize head movement, while appropriately sized earplugs helped to reduce the scanner noise. Participants were instructed to remain supine and motionless, stay awake without falling asleep, and refrain from engaging in any other cognitive activities during scanning. Conventional T1-weighted and T2-weighted images were acquired to identify any potential brain structural abnormalities. Resting-state fMRI (RS-fMRI) images were collected using a gradient-recalled echo-planar imaging (EPI) sequence with the following parameters: repetition time (TR)/echo time (TE) = 2,100 ms/20 ms; flip angle = 90°; thickness/interval = 3.0 mm/0.6 mm; field of view (FOV): 240 × 240 mm2; matrix = 64 × 64 mm2; voxel size = 3.125 × 3.125 × 3.6 mm3; number of volumes = 160; number of slices = 42. High-resolution T1-weighted brain structural magnetic resonance images were acquired using three-dimensional brain volume imaging (3D-BRAVO) with the following parameters: TR/TE = 8.1 ms/3.1 ms; flip angle = 15°; thickness/interval = 1.0 mm/0.5 mm; FOV = 240 × 240 mm2; matrix = 256 × 256.
MRI data preprocessing
The fMRI data preprocessing was conducted using the Data Processing & Analysis Assistant for Resting-State Brain Imaging (DPABI, Chinese Academy of Sciences, Beijing, China, http://www.restfmri.net). The first 10 time-point images of each fMRI dataset were discarded, and slice timing was performed sequentially for the remaining 150 images. Subjects exhibiting head motion exceeding 2° of maximum rotation or greater than 2 mm of maximum displacement in any direction were excluded. According to the head motion criteria, 3 ID patients and 1 HC subject were excluded. Then, data were normalized to the MNI space by applying T1-segment information and resampling to voxels with a size of 3 × 3 × 3 mm3. The resultant normalized functional images were subjected to spatial smoothing using a 6-mm full width at half-maximum (FWHM) Gaussian kernel. Temporal band-pass filtering (0.01–0.08 Hz) was performed and removal of linear trends. Linear regression analysis was conducted to control for confounding factors, including Friston-24 motion parameters, white matter signals, and cerebrospinal fluid (CSF) signals (Cai et al., 2024).
FC analysis
We defined two subregions of the hypothalamus as seed ROIs (the AH and the PH) according to the previous study (Jiang et al., 2021). The MNI coordinates of the center of gravity for the PH were X = −5.5, Y = −7.9, Z = −12.1, and for the AH were X = −4.5, Y = 1.6, Z = −13.8. FC analysis was used to explore the connectivity patterns of AH and PH with the voxels within the whole brain. Correlation coefficients were converted to Z-scores via Fisher’s transformation to improve normality (Liu et al., 2017).
Biochemical analysis
Following the completion of PSG on the second night, all participants underwent fasting venous blood collection of 5 mL between 7:00 and 9:00 the next morning. The blood was collected in dry tubes, left to stand at room temperature for 30 min, and then processed using a centrifuge (3,000 rpm, 4 °C, 15 min). After centrifugation, the supernatant was extracted and aliquoted into cryovials, and promptly stored at −80 °C for subsequent serum metabolite concentration analysis. The frozen serum samples were thawed at room temperature before measurement.
Levels of serum orexin-A and histamine were determined using commercial enzyme-linked immunosorbent assay (ELISA) kits (Jiangsu Meimian Industrial Co., Ltd., Jiangsu, China). The orexin-A assay included 5-point calibrators at 3, 6, 12, 24, and 48 pg/mL, respectively; the histamine assay included five spot calibrators at 1, 2, 4, 8, and 16 µg/L, respectively. The intra-assay coefficient of variation was 10% and the inter-assay coefficient of variation was <12%. The correlation coefficient for the linear regression of the sample and the expected concentration exceeded 0.95.
Statistical analysis
Statistical analysis was performed using IBM SPSS v27.0 Statistics software (IBM Corp., Armonk, NY, USA) and R4.0.2. We employed the Shapiro-Wilk test to assess the normality of the data and the Levene test to evaluate the homogeneity of variances. The data were presented as mean ± standard deviation for normally distributed variables and as mean (quartile) for non-normally distributed variables. Normally distributed continuous variables were compared using an independent t-test for intergroup comparisons, while skewed continuous variables were analyzed using the Mann-Whitney U test. Categorical data were compared using either the Chi-squared test or Fisher’s exact test. Correlation analysis was conducted using the Spearman rank correlation test. Multiple comparison correction was implemented with Bonferroni correction. Age and gender were included as covariates in analyses of MRI outcomes. Since the study was exploratory, no sample size calculation was performed.
Results
Demographic and clinical characteristics
In this study, 30 ID patients and 30 HCs were recruited (Fig. 1). There were no significant differences between the ID and HC groups in terms of age, gender, BMI, or some objective sleep parameters derived from PSG (SOL, REM_L, N1, N2, N3 duration, N1_perc, N2_perc, N3_perc, R_perc, ArI_NREM, ArI_total) (P > 0.05). However, significant differences were observed between the ID and HC groups in other PSG parameters (TST, SE, SOL, Wake duration, R duration, ArI_REM) (P < 0.05). Significant differences were also found between the ID and HC groups in sleep scales (ISI, PSQI), emotional scales (HAMA, HAMD), and cognitive scale MOCA (P < 0.05) (Table 1). These findings align closely with the clinical features of sleep onset and maintenance difficulties, as well as emotional and cognitive aspects in ID patients reported in previous studies (Baglioni et al., 2014; Künstler et al., 2023).
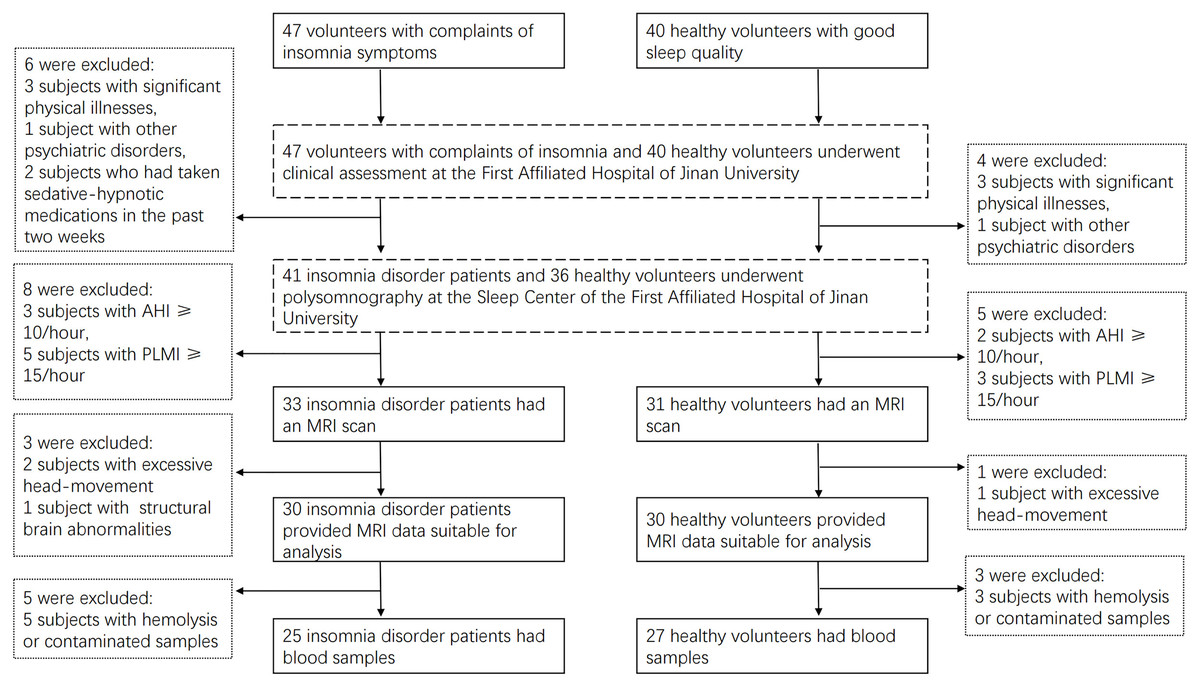
Figure 1: Participants recruitment flow chart.
| Characteristics | ID (N = 30) | HC (N = 30) | χ2/Z/t | P |
|---|---|---|---|---|
| Age (year) | 32.00 (19.00) | 27.70 (6.55) | −1.591a | 0.112 |
| Gender, male/female | 10/20 | 10/20 | 0.000b | 1.000 |
| BMI (kg/m2) | 20.13 (3.89) | 21.58 (3.93) | −1.567a | 0.117 |
| ISI | 15.00 (7.00) | 2.00 (4.75) | −6.104a | <0.001 |
| PSQI | 11.00 (5.00) | 4.00 (2.00) | −5.925a | <0.001 |
| HAMA | 4.00 (4.00) | 1.00 (2.00) | −4.710a | <0.001 |
| HAMD | 5.00 (4.00) | 0.50 (3.00) | −5.161a | <0.001 |
| MOCA | 27.00 (2.00) | 28.00 (3.00) | −2.394a | 0.017 |
| TST (min) | 355.48 ± 91.08 | 413.85 ± 70.23 | 2.78c | 0.007 |
| SE (%) | 0.78 (0.17) | 0.88 (0.12) | −2.602a | 0.009 |
| WASO_time (min) | 68.50 (80.00) | 42.75 (52.40) | −2.499a | 0.012 |
| WASO_number | 26.00 (11.00) | 21.50 (19.00) | −2.153a | 0.031 |
| SOL (min) | 16.50 (19.50) | 9.50 (20.10) | −1.863a | 0.062 |
| REM_L (min) | 115.00 (84.50) | 94.75 (53.50) | −0.577a | 0.564 |
| Wake duration (min) | 107 (113.00) | 57.75 (67.10) | −2.476a | 0.013 |
| N1 duration (min) | 44.00 (34.50) | 37.75 (20.00) | −0.458a | 0.647 |
| N1_perc (%) | 11.80 (9.50) | 9.05 (8.40) | −1.582a | 0.114 |
| N2 duration (min) | 167.97 ± 50.78 | 189.83 ± 40.47 | 1.844c | 0.070 |
| N2_perc (%) | 45.33 ± 9.73 | 46.19 ± 7.88 | 0.376c | 0.708 |
| N3 duration (min) | 68.11 ± 33.43 | 84.82 ± 39.33 | 1.773c | 0.081 |
| N3_perc (%) | 19.07 ± 9.01 | 20.44 ± 8.23 | 0.615c | 0.541 |
| R duration (min) | 75.00 ± 27.43 | 94.57 ± 36.48 | 2.348c | 0.022 |
| R_perc (%) | 20.22 ± 5.88 | 22.25 ± 6.68 | 1.251c | 0.216 |
| ArI_REM | 1.20 (3.20) | 0.70 (1.50) | −1.972a | 0.049 |
| ArI_NREM | 5.90 (8.60) | 3.75 (5.30) | −0.904a | 0.366 |
| ArI_total | 9.30 (5.40) | 6.40 (7.50) | −1.390a | 0.165 |
Notes:
aMann Whitney U-test;bChi-square test; cStudent t-test. Numbers in bold represent P < 0.05. Normally distributed data are presented as mean ± standard deviation, non-normally distributed data as median (interquartile range).
ID, insomnia disorder; HC, healthy control; BMI, body mass index; ISI, Insomnia Severity index; PSQI, Pittsburgh Sleep Quality Index; HAMA, Hamilton Anxiety Scale; HAMD, Hamilton Depression Rating Scale; REM, Rapid Eye Movement; NREM, Non-Rapid Eye Movement; TST, Total Sleep Time; SE, Sleep Efficiency; WASO, Wake After Sleep Onset; SOL, Sleep Onset Latency; REM_L, REM Latency; N1, NREM sleep stage 1; N2, NREM sleep stage 2; N3, NREM sleep stage 3; N1_perc, N2_perc, N3_perc, R_perc, Percentage of stage N1, N2, N3, REM sleep; ArI, Arousal index.
Alterations of FC in ID patients
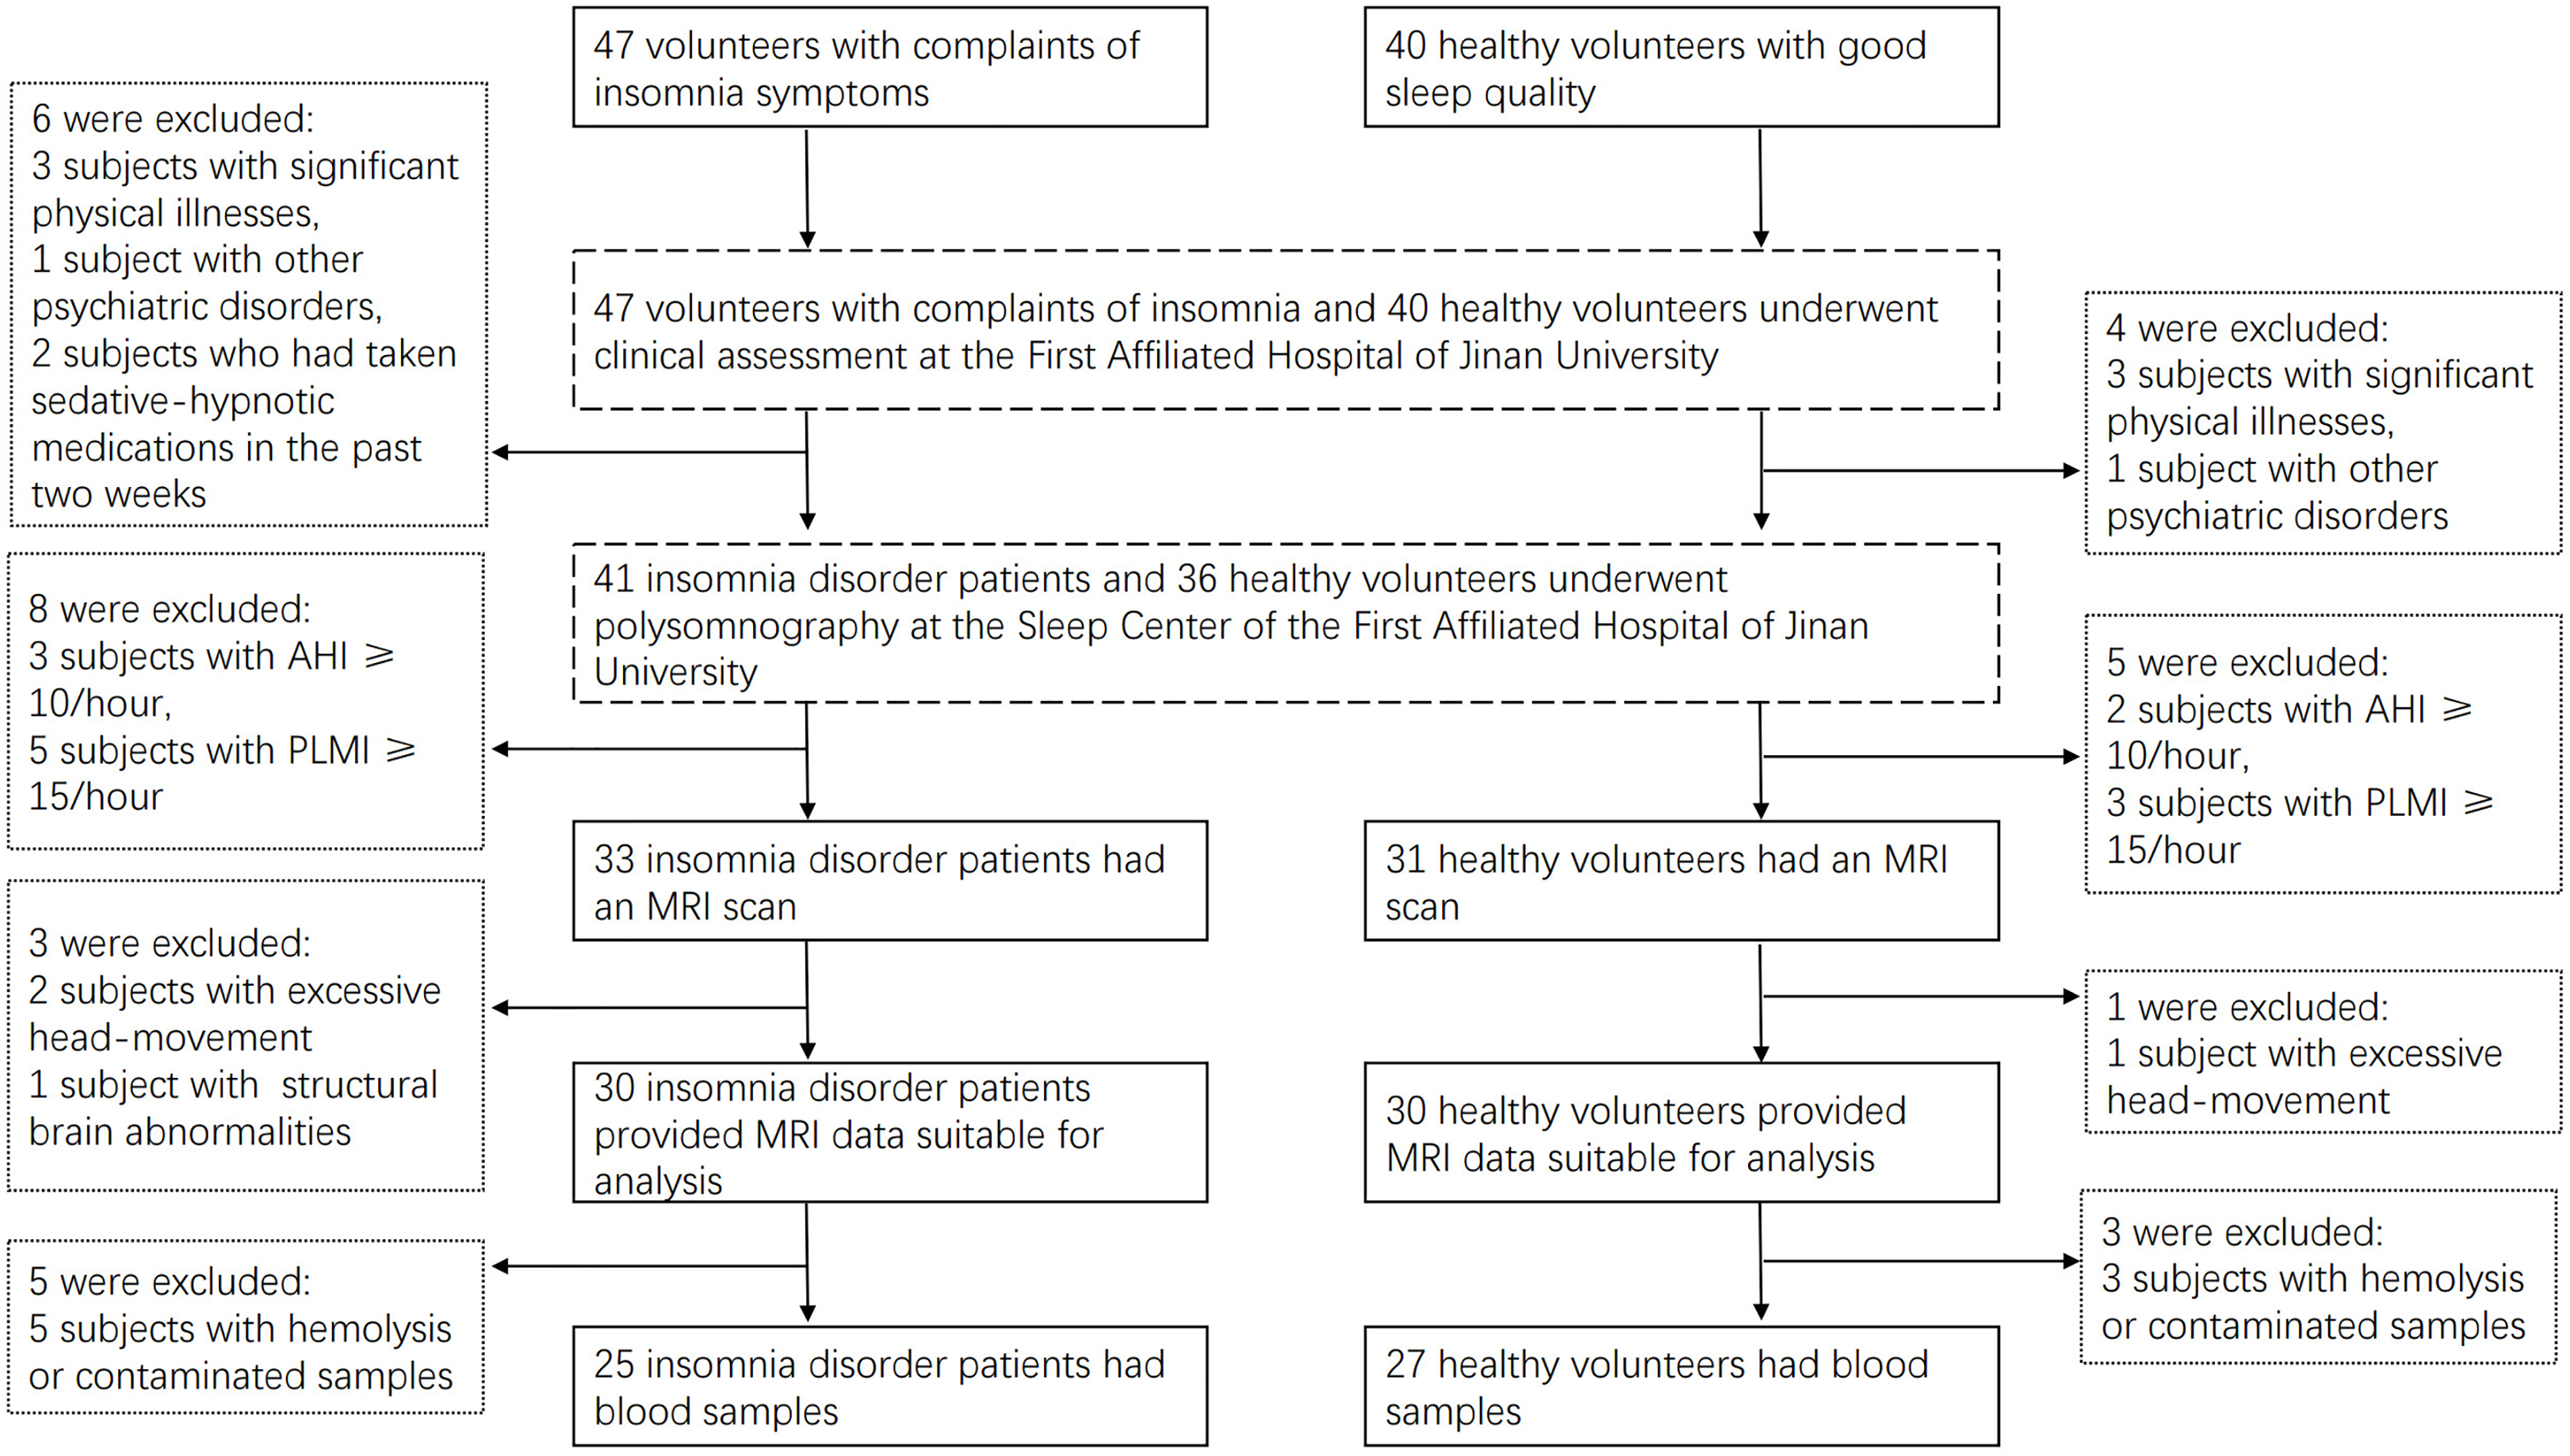
Compared to the HCs, PH-based FC analysis revealed decreased FC between the PH and several brain regions, including the bilateral orbital superior frontal gyrus, the bilateral angular gyrus, the right ACC, the left precuneus, and the right medial superior frontal gyrus in ID patients (Table 2 and Fig. 2). Additionally, the AH-based FC analysis showed decreased FC between the AH and the right ACC in ID patients (Table 3 and Fig. 3). The significance threshold was set at a voxel-level P < 0.001 and a cluster-level P < 0.05 (Bonferroni corrected).
| Brain regions | MNI coordinates | Cluster size | T-value | ||
|---|---|---|---|---|---|
| X | Y | Z | |||
| Frontal_Sup_Orb_R | 18 | 60 | −6 | 59 | 4.32 |
| Frontal_Sup_Orb_L | −12 | 60 | 9 | 85 | 4.38 |
| Cingulum_Ant_R | 9 | 36 | 6 | 58 | 4.55 |
| Precuneus_L | −6 | −48 | 21 | 440 | 4.87 |
| Angular_L | −36 | −72 | 39 | 148 | 5.18 |
| Angular_R | 42 | −57 | 30 | 137 | 4.75 |
| Frontal_Sup_Medial_R | 15 | 27 | 48 | 91 | 4.76 |
Notes:
R represents right and L represents left side of the brain.
ID, insomnia disorder; HC, healthy control; PH, posterior hypothalamus; Frontal_Sup_Orb, Orbital superior frontal gyrus; Cingulum_Ant, Anterior cingulate cortex; Angular, Angular gyrus; Frontal_Sup_Medial, Medial superior frontal gyrus.
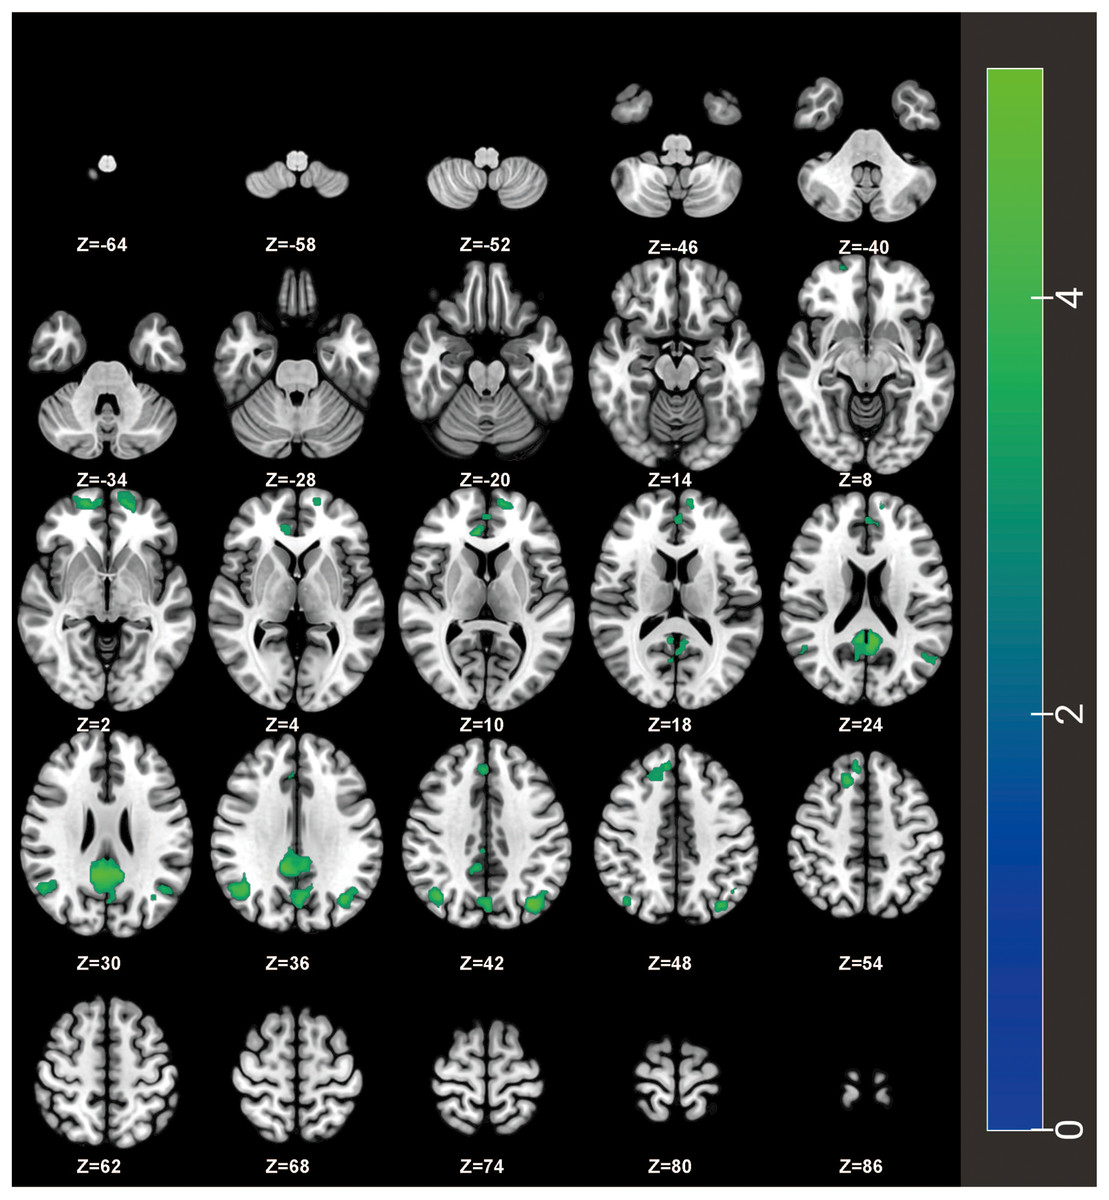
Figure 2: FC differences of the PH with the whole brain between ID patients and HCs on an axial map from Z = −64 to Z = +86 mm (every 6 mm).
The ID patients showed decreased FC of PH with the bilateral orbital superior frontal gyrus, the bilateral angular gyrus, the right ACC, the left precuneus, and the right medial superior frontal gyrus compared to HCs. Cool colors represent decreased connectivity in the ID patients. FC, functional connectivity; ID, insomnia disorder; HC, healthy control; PH, posterior hypothalamus; ACC, anterior cingulate cortex.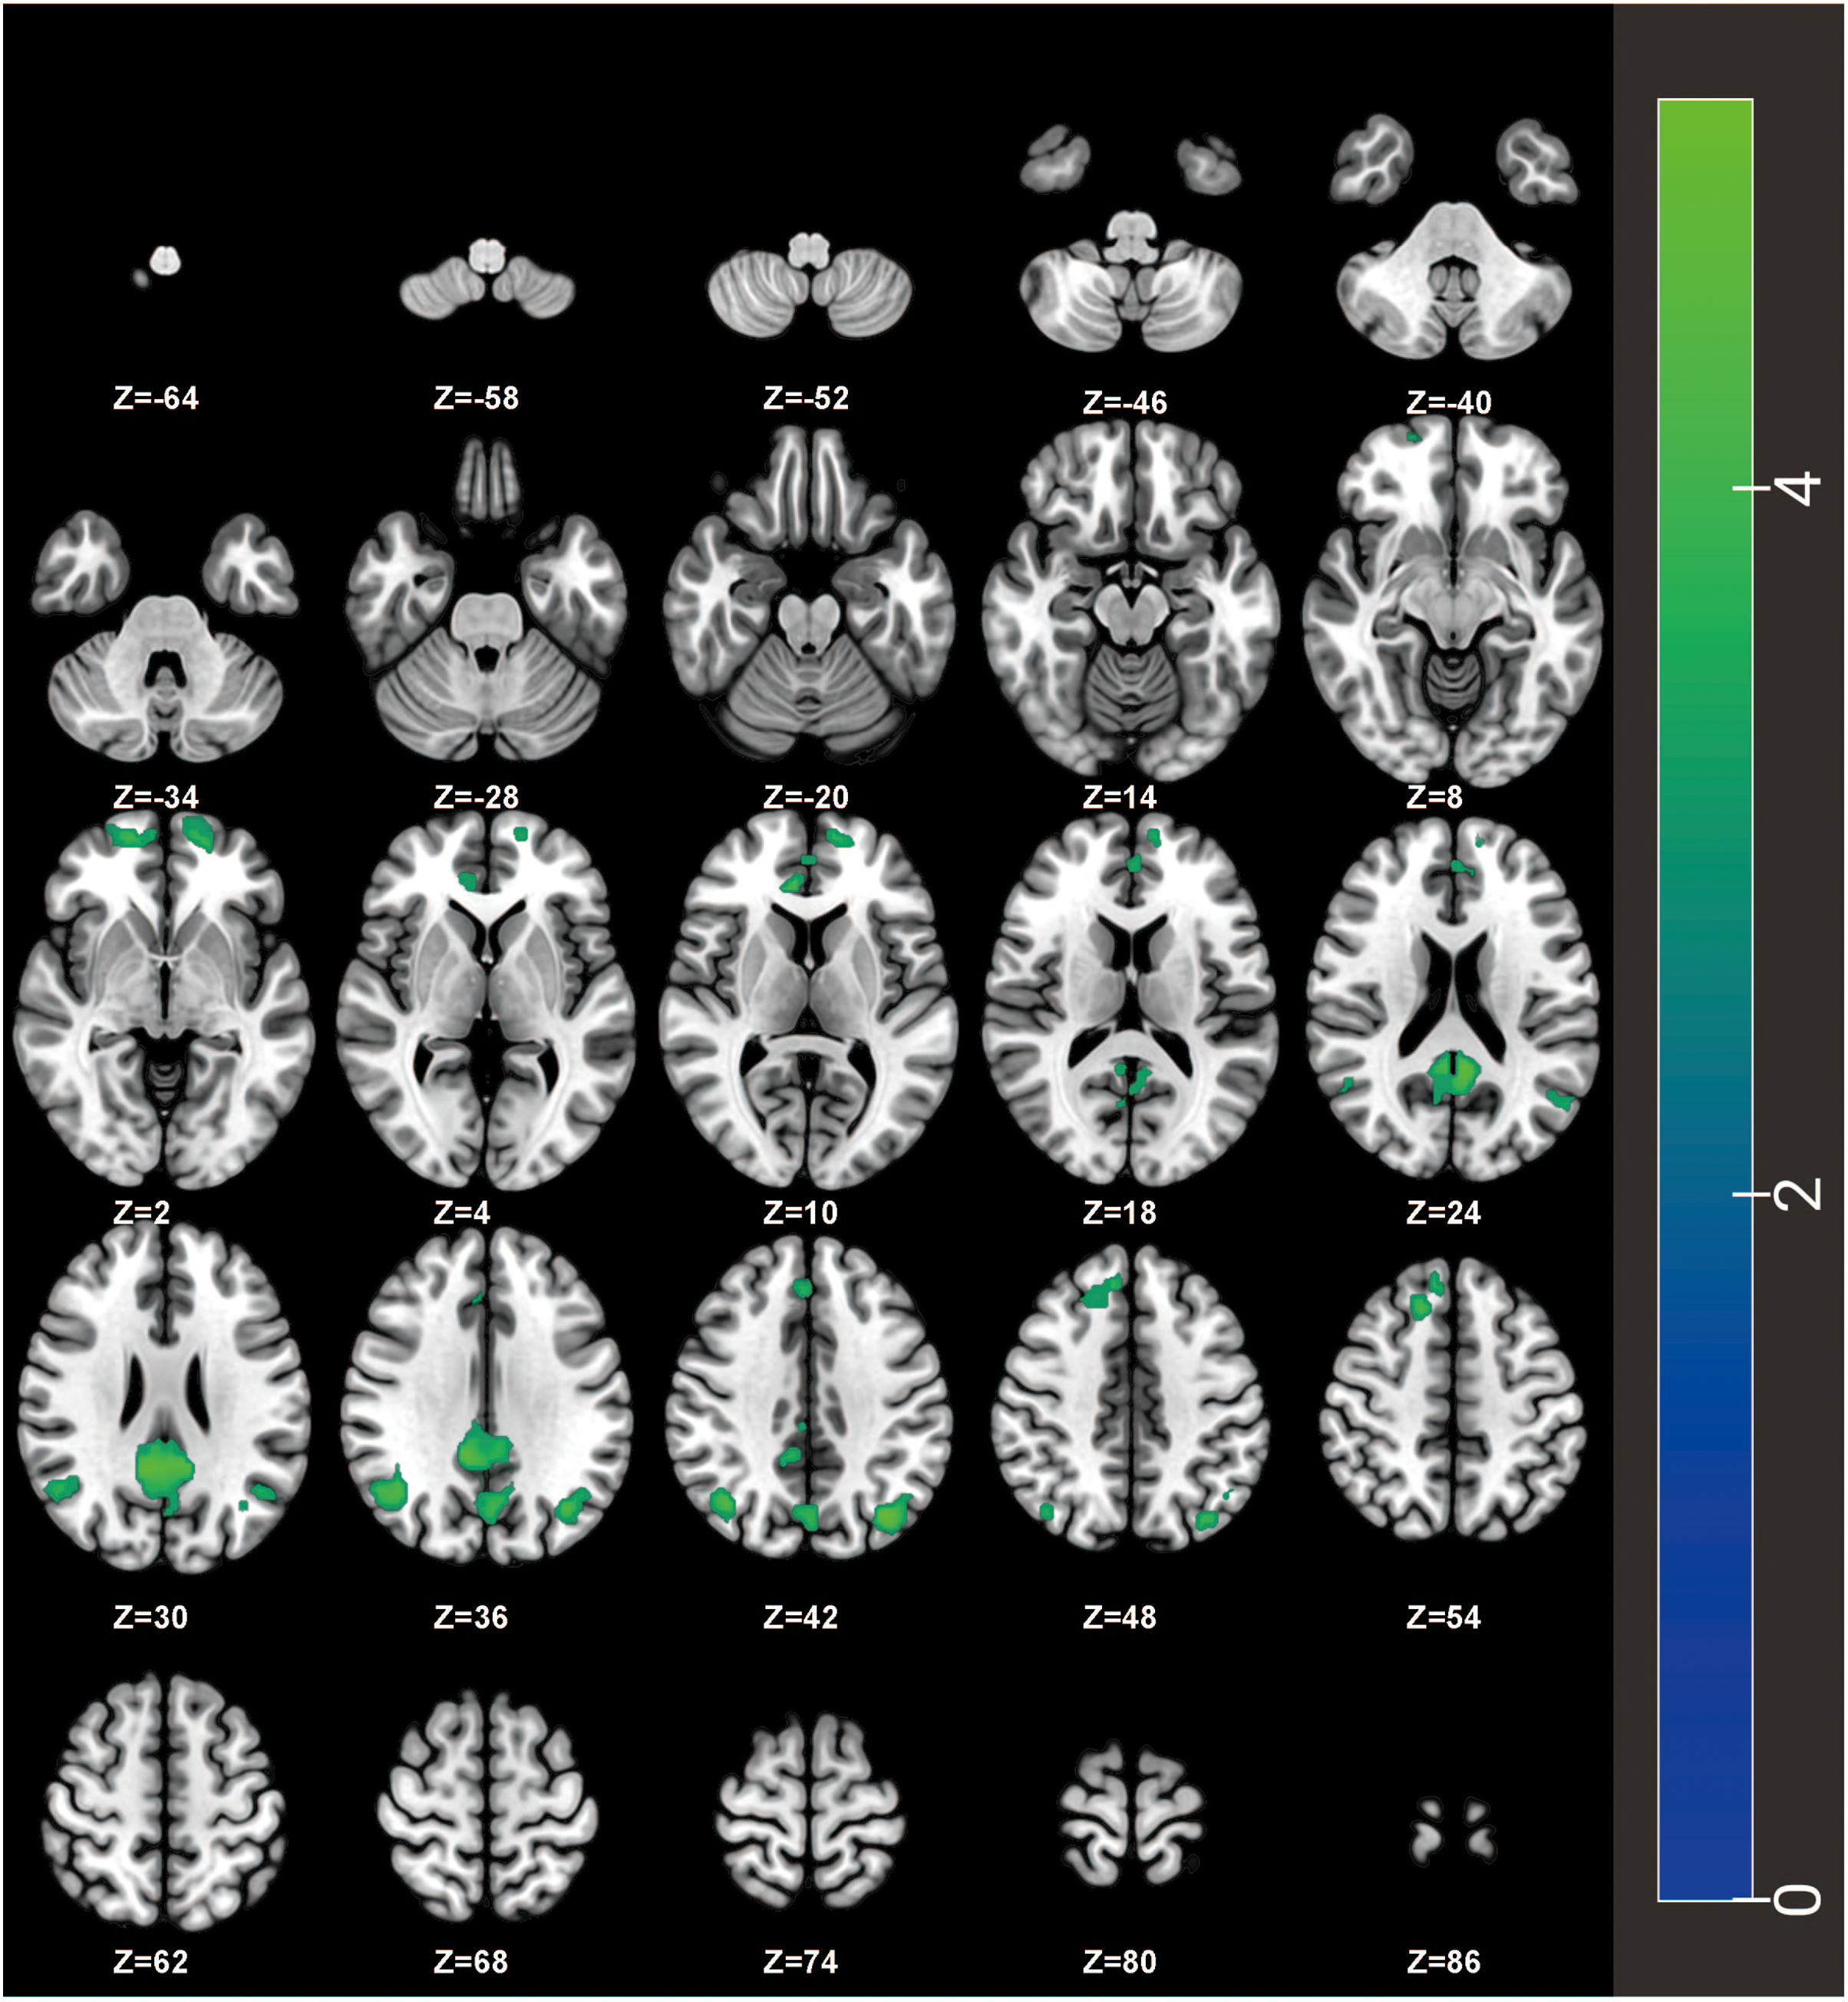
| Brain regions | MNI coordinates | Cluster size | T-value | ||
|---|---|---|---|---|---|
| X | Y | Z | |||
| Cingulum_Ant_R | 15 | 27 | 48 | 91 | 4.79 |
Notes:
R represents right side of the brain.
ID, insomnia disorder; HC, healthy control; AH, anterior hypothalamus; Cingulum_Ant, Anterior cingulate cortex.
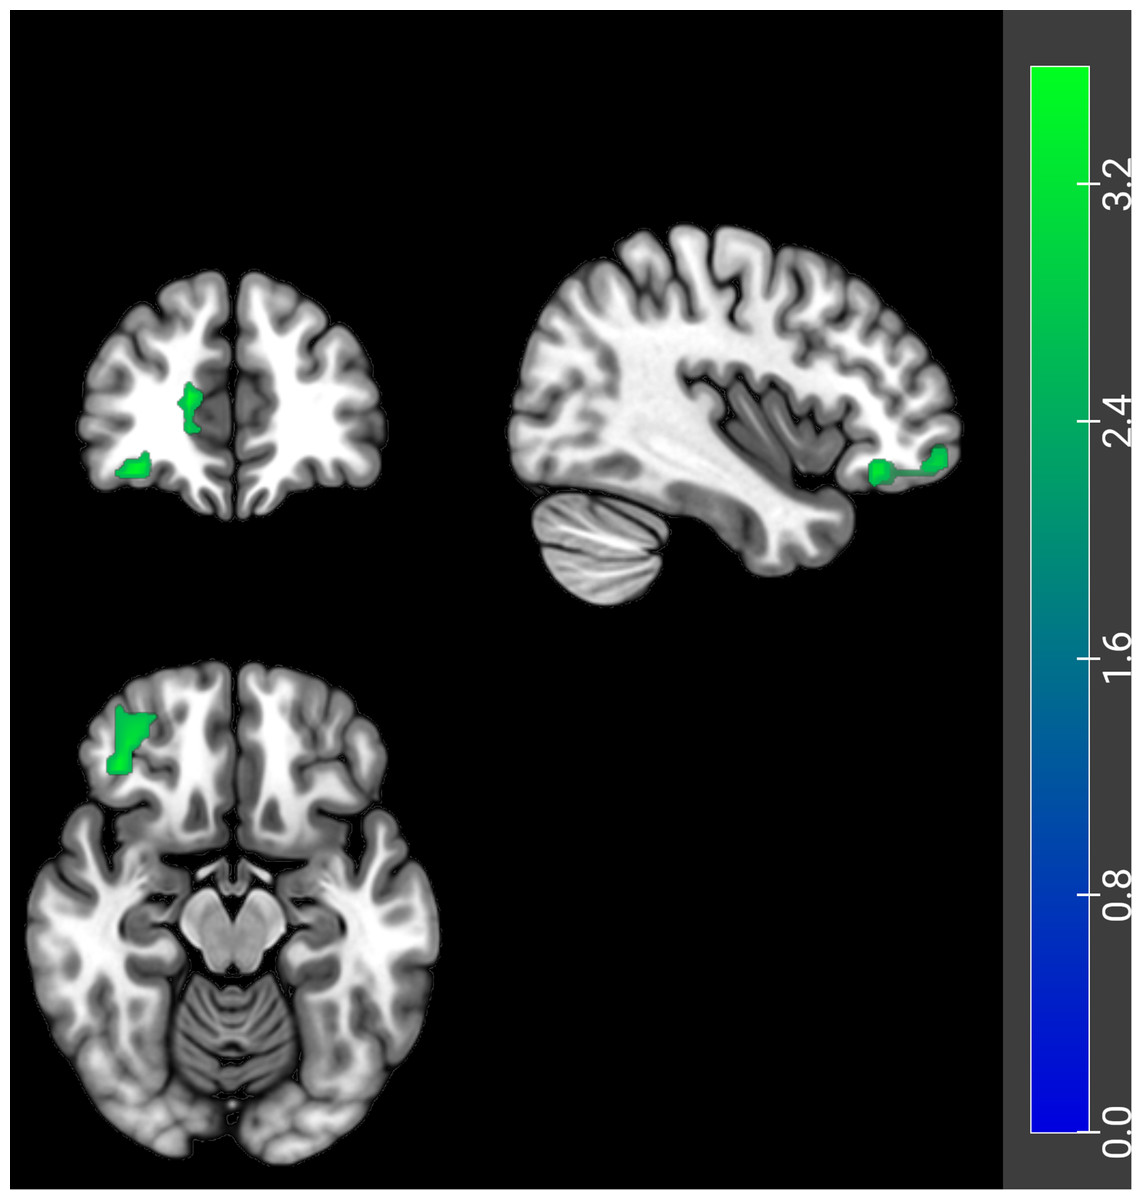
Figure 3: FC differences of the AH with the whole brain between ID patients and HCs.
The ID patients showed decreased FC of AH with the right ACC. Coronal (top left), sagittal (top right), and axial (bottom left) planes are shown. Cool colors represent decreased connectivity in the ID patients. FC, functional connectivity; AH, anterior hypothalamus; ID, insomnia disorder; HC, healthy control; ACC, anterior cingulate cortex.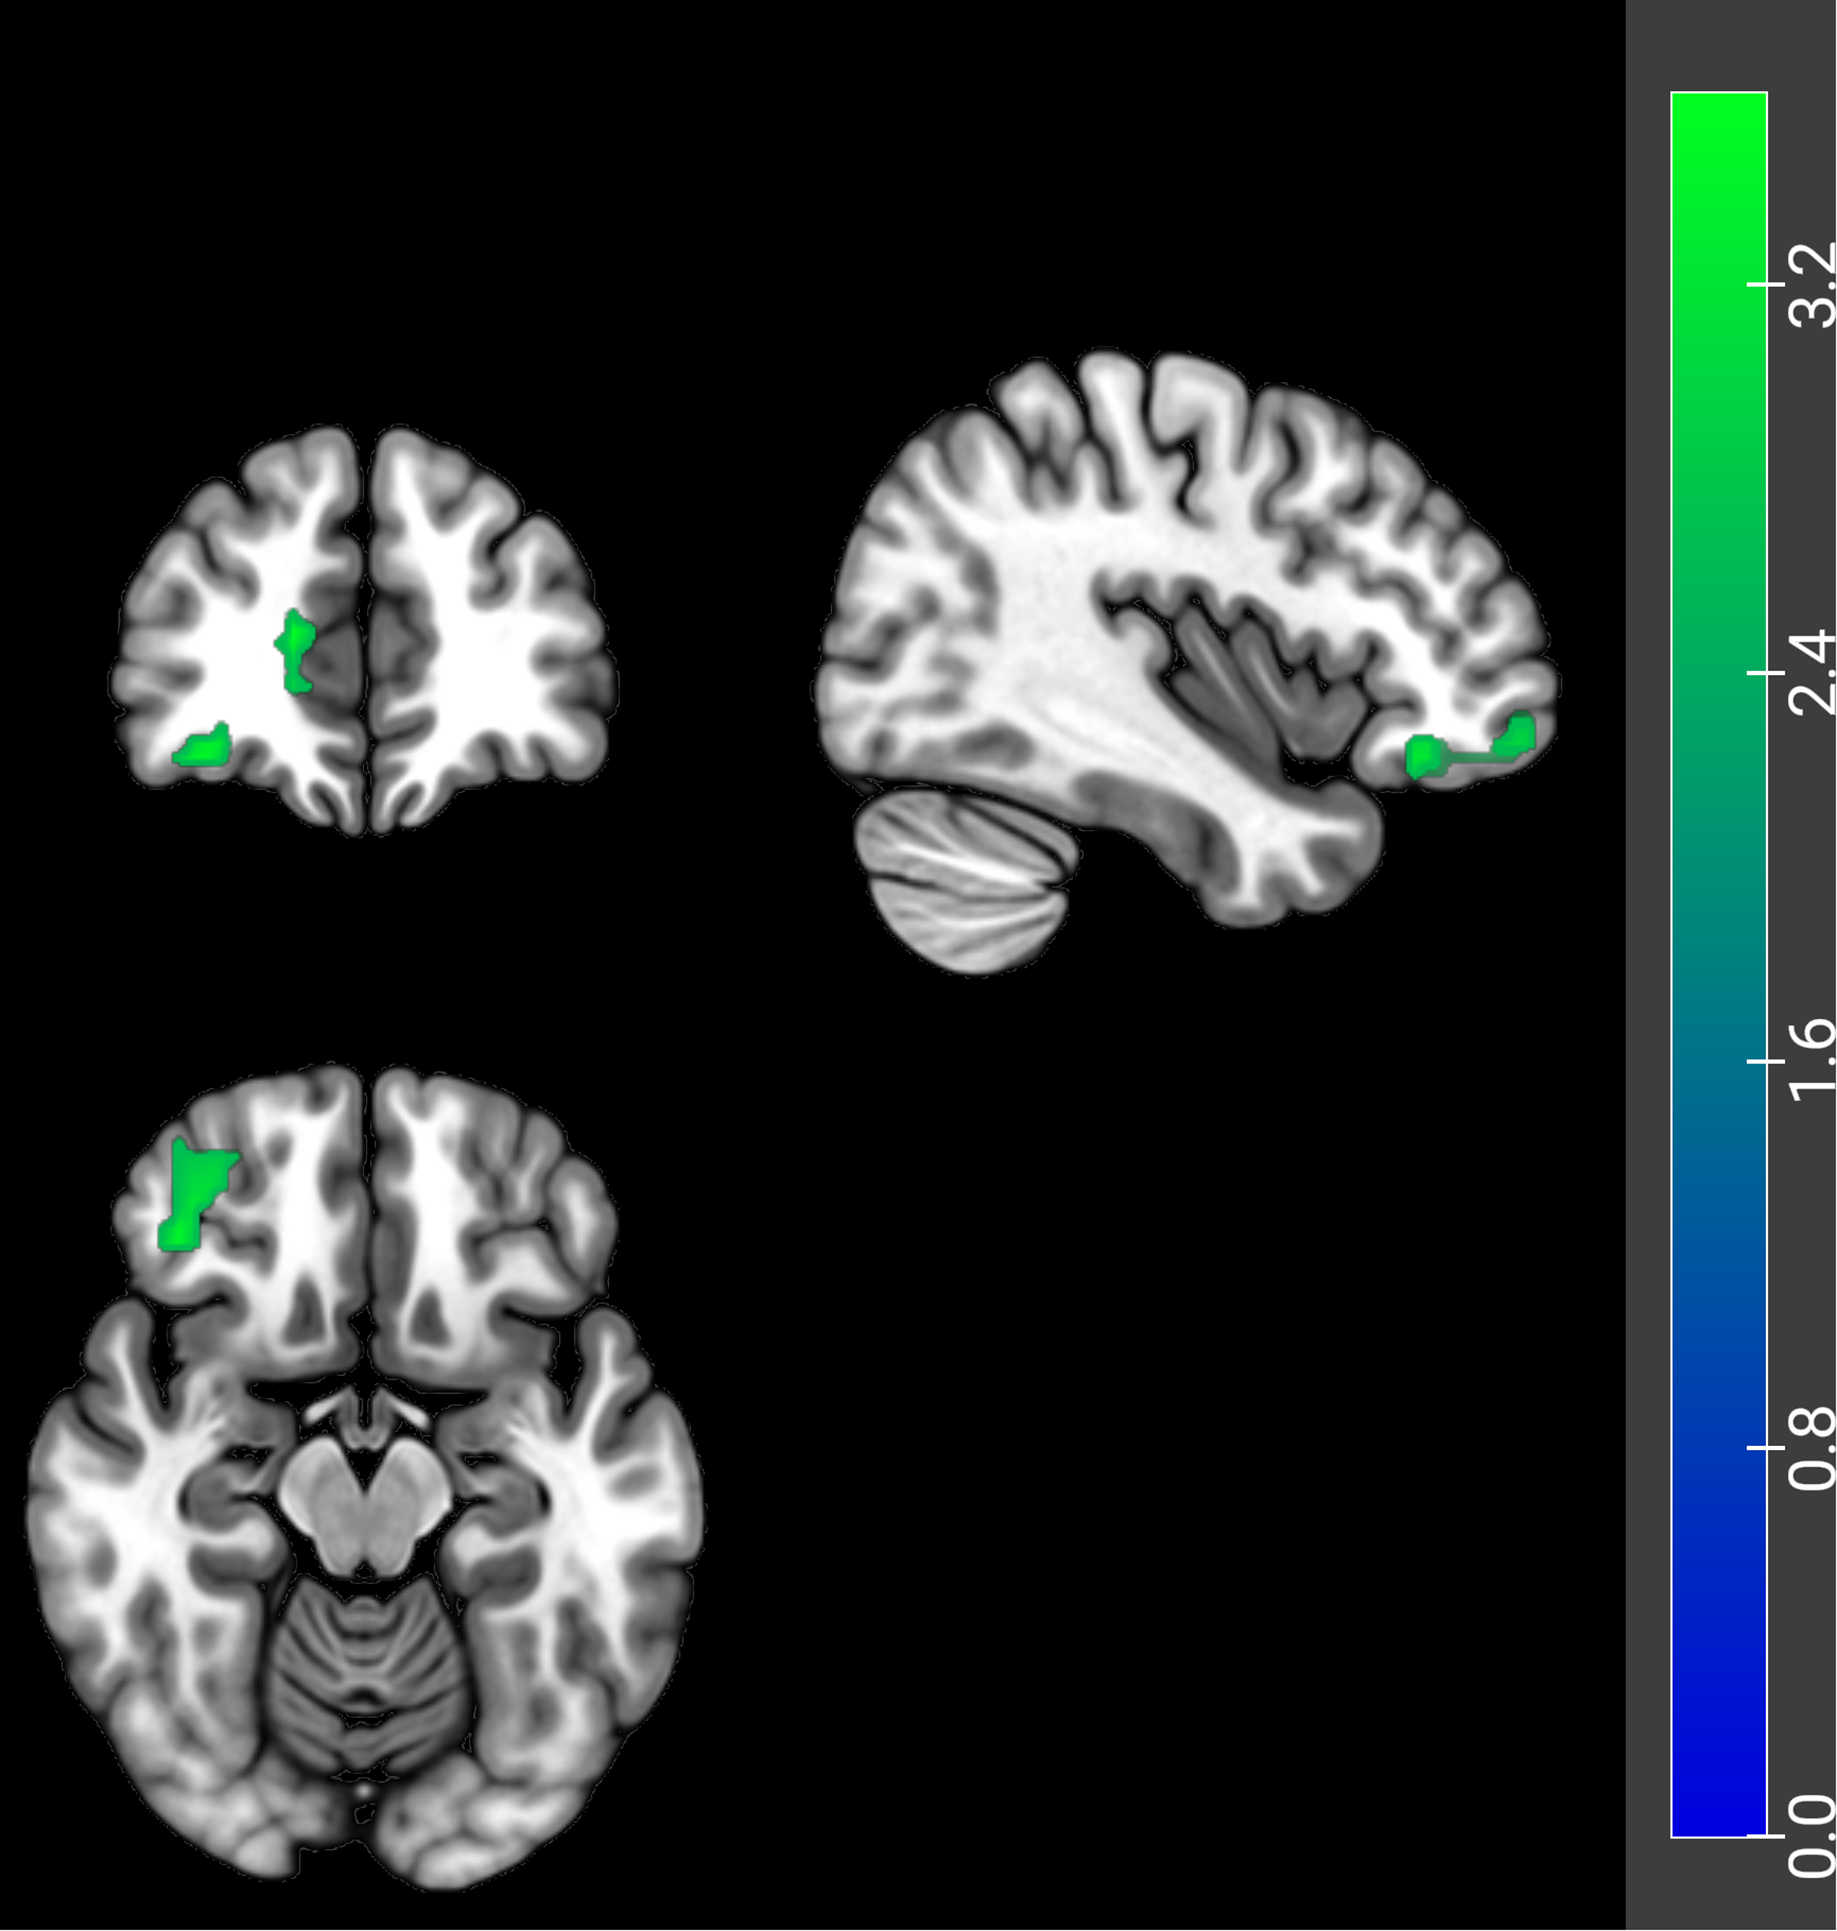
Correlation between clinical characteristics and FC values in ID patients
Correlation analyses were performed between clinical characteristics and FC values of AH and PH with brain regions exhibiting significant differences in ID patients. The results revealed that in ID patients, the FC values of the PH with left precuneus were positively correlated with R duration (P < 0.05), N3 duration (P < 0.01), N3_perc (P < 0.05), while negatively correlated with N1 duration (P < 0.05). The FC values of PH with the left angular gyrus showed positive correlation with R duration (P < 0.01), R_perc (P < 0.01) in ID patients. The FC values of the PH with the left orbital superior frontal gyrus showed a negative correlation with N1 duration (P < 0.05) in ID patients. The FC values of the PH with the right ACC demonstrated positive correlations with N1 duration, N1_perc, N3 duration, and N3_perc (P < 0.01), while a negative correlation with N2_perc (P < 0.05) in ID patients. However, the FC value of AH was not observed to correlate with clinical characteristics in ID patients. The absolute values of the correlation coefficients (|r|) for the above associations were all greater than 0.48 (Fig. 4).
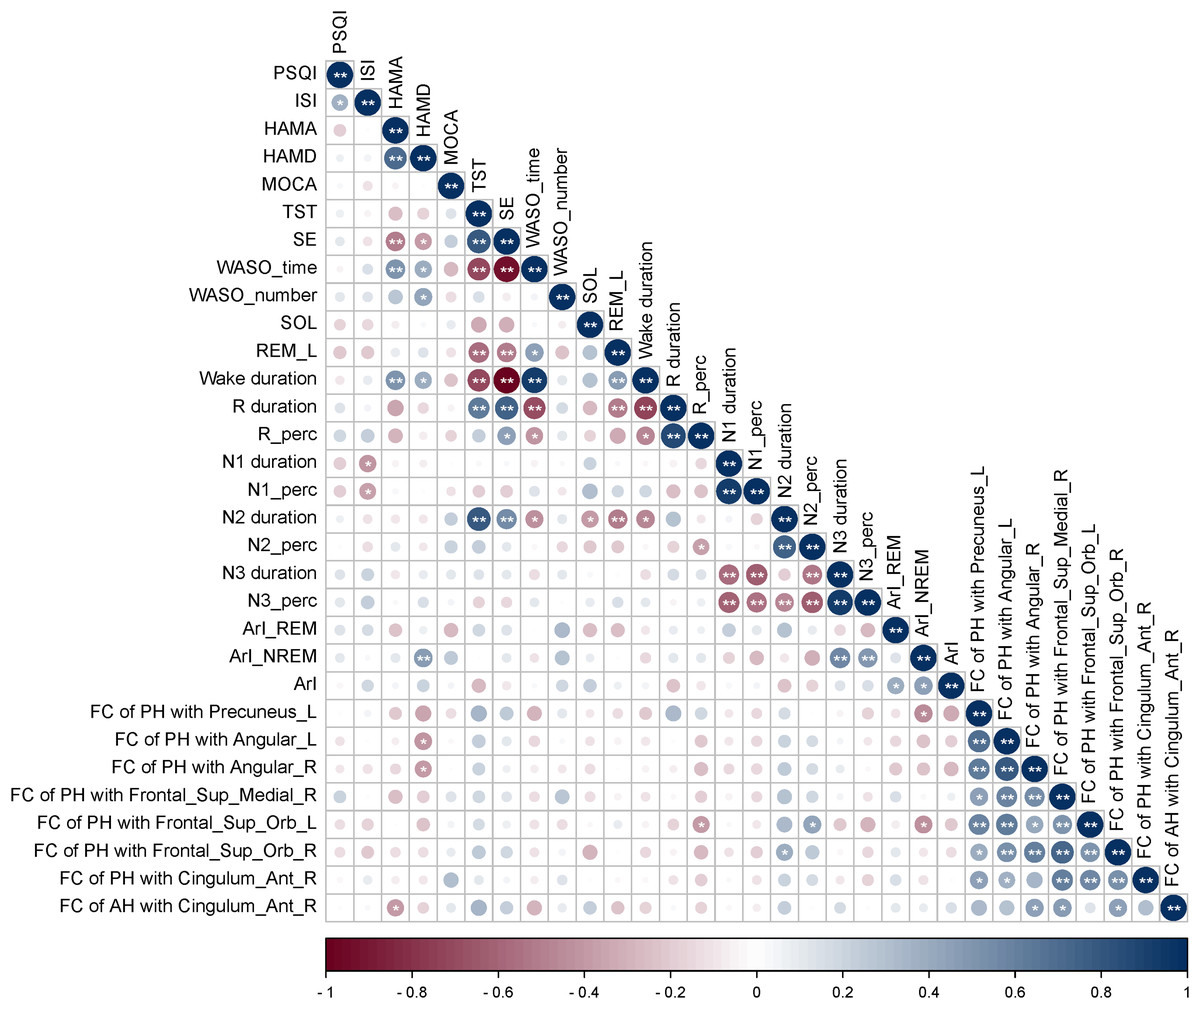
Figure 4: Correlation analyses between clinical characteristics and FC values of brain regions showing significant FC differences.
In ID patients, the FC values of the PH with left precuneus were positively correlated with R duration, N3 duration, N3_perc, while negatively correlated with N1 duration. The FC values of PH with left angular gyrus showed positive correlation with R duration, R_perc. The FC values of the PH with the left orbital superior frontal gyrus showed a negative correlation with N1 duration. The FC values of the PH with the right ACC demonstrated positive correlations with N1 duration, N1_perc, N3 duration, and N3_perc, while a negative correlation with N2_perc. FC, functional connectivity; ID, insomnia disorder; HC, healthy control; PH, posterior hypothalamus; ISI, Insomnia Severity Index; PSQI, Pittsburgh Sleep Quality Index; HAMA, Hamilton Anxiety Scale; HAMD, Hamilton Depression Rating Scale; REM, Rapid Eye Movement; NREM, Non-Rapid Eye Movement; TST, Total Sleep Time; SE, Sleep Efficiency; WASO, Wake After Sleep Onset; SOL, Sleep Onset Latency; REM_L, REM Latency; N1, NREM sleep stage 1; N2, NREM sleep stage 2; N3, NREM sleep stage 3; N1_perc, N2_perc, N3_perc, R_perc, Percentage of stage N1, N2, N3, REM sleep; ArI, Arousal index; Frontal_Sup_Orb, Orbital superior frontal gyrus; Cingulum_Ant, Anterior cingulate cortex; Angular, Angular gyrus; Frontal_Sup_Medial, Medial superior frontal gyrus. R represents right and L represents left side of the brain. * Represents P < 0.05, ** represents P < 0.01.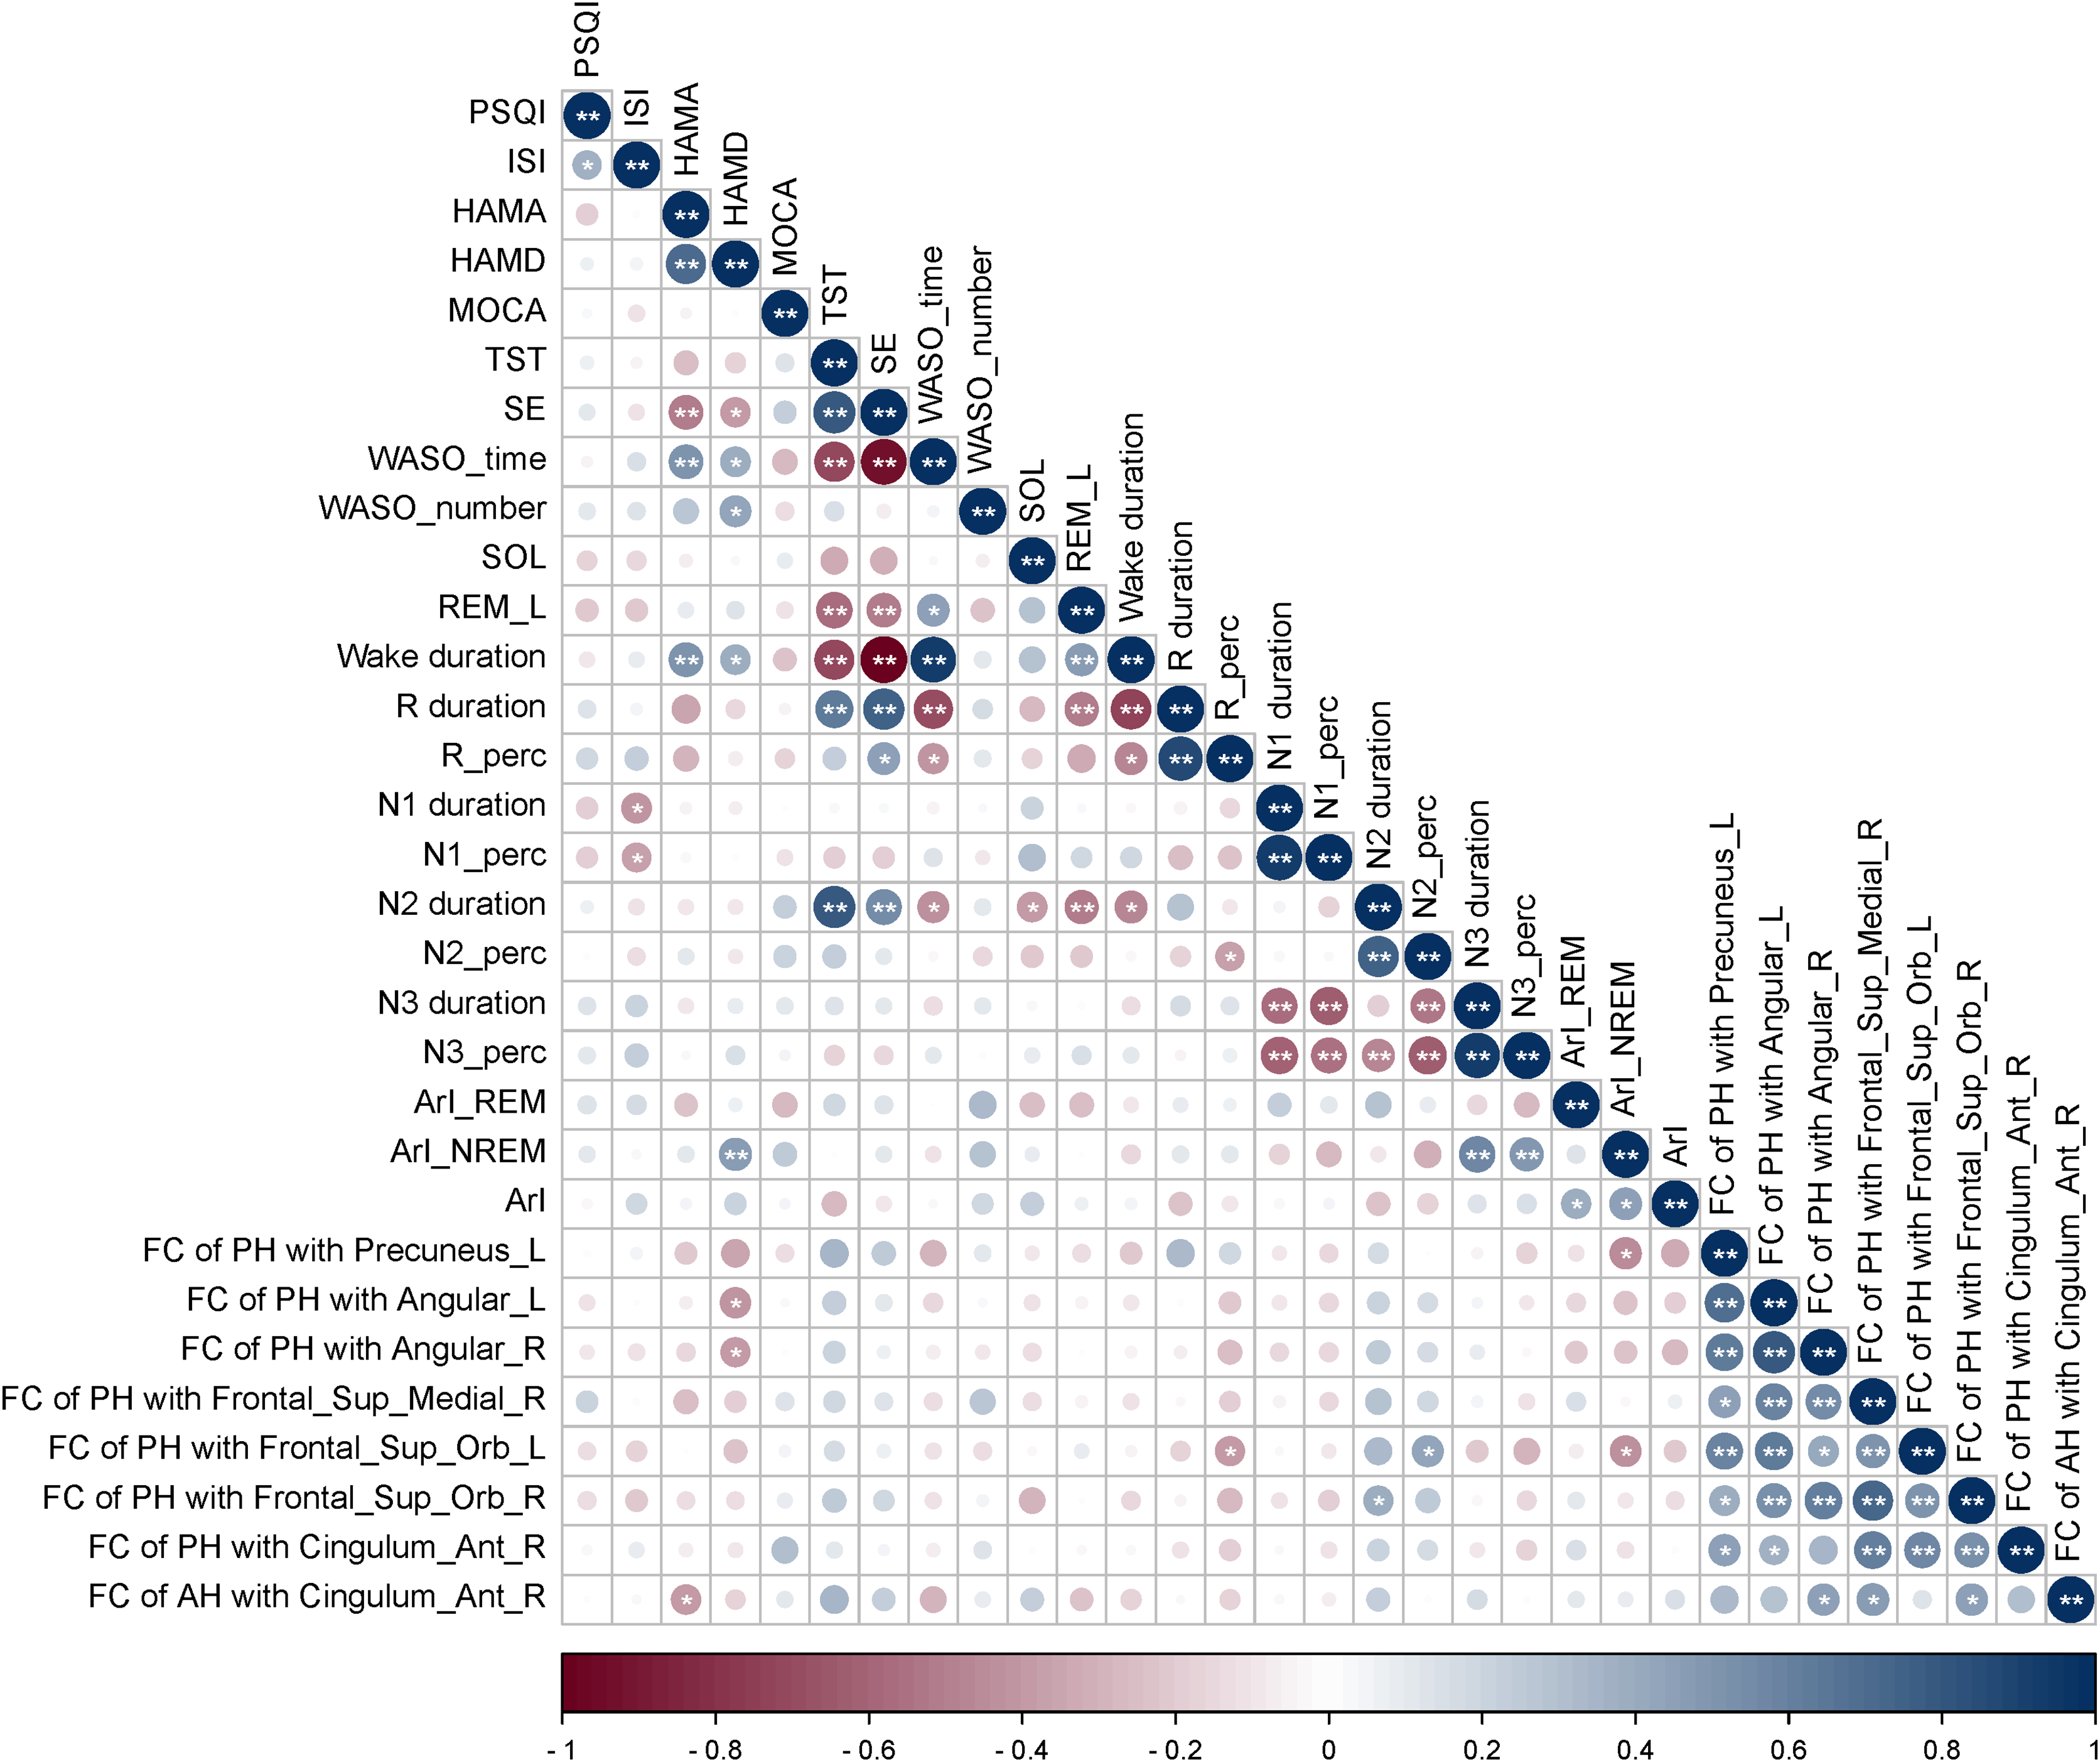
Changes in the levels of serum arousal-promoting neurotransmitters in ID patients
Among the recruited participants, 25 ID patients and 26 HCs provided eligible blood samples for analysis (demographic information was shown in Table S1). We measured serum orexin-A and histamine concentrations using ELISA. Serum orexin-A (12.30 [5.59] pg/mL in ID, 10.87 [1.21] pg/mL in HC, Z = 4.315, P < 0.001) and histamine (19.59 [2.05] µg/L in ID, 16.52 [1.80] µg/L in HC, Z = 5.634, P < 0.001) concentrations in ID patients were significantly elevated compared to HCs (Fig. 5).
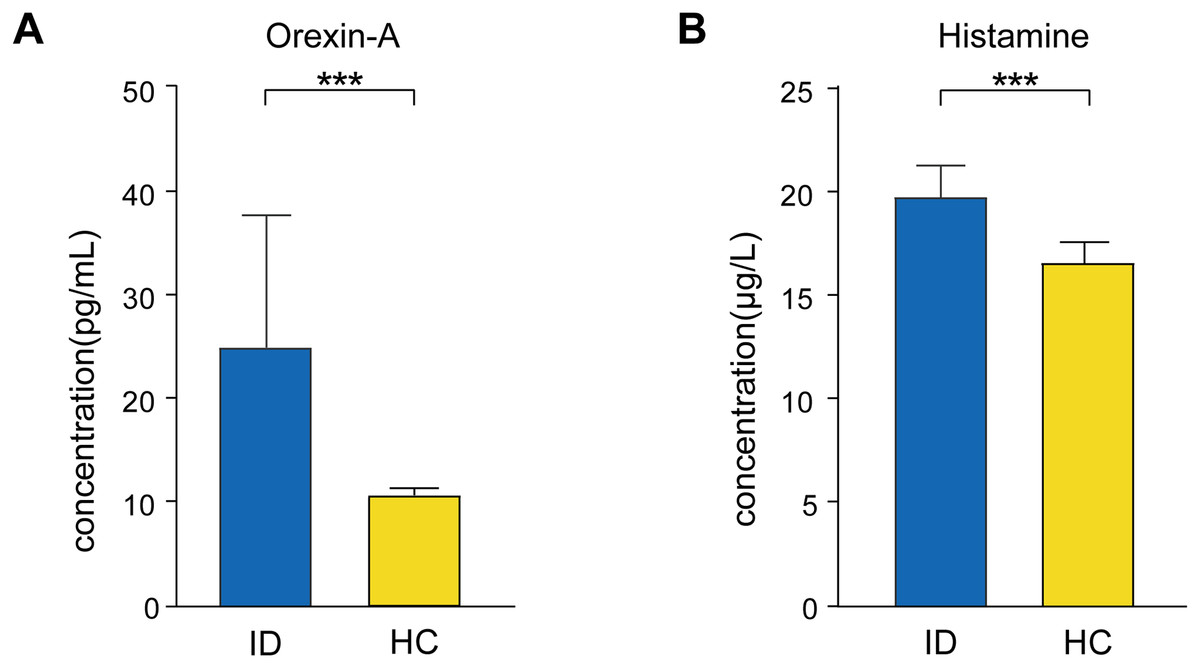
Figure 5: Changes in the levels of serum (A) orexin-A and (B) histamine in ID patients compared to HCs.
Serum orexin-A and histamine concentrations in ID patients were significantly elevated compared to HCs. ID, insomnia disorder; HC, healthy control. *** Represents P < 0.001. The heights of the bars in the graph represent the mean values, while the error bars denote the standard deviation (SD).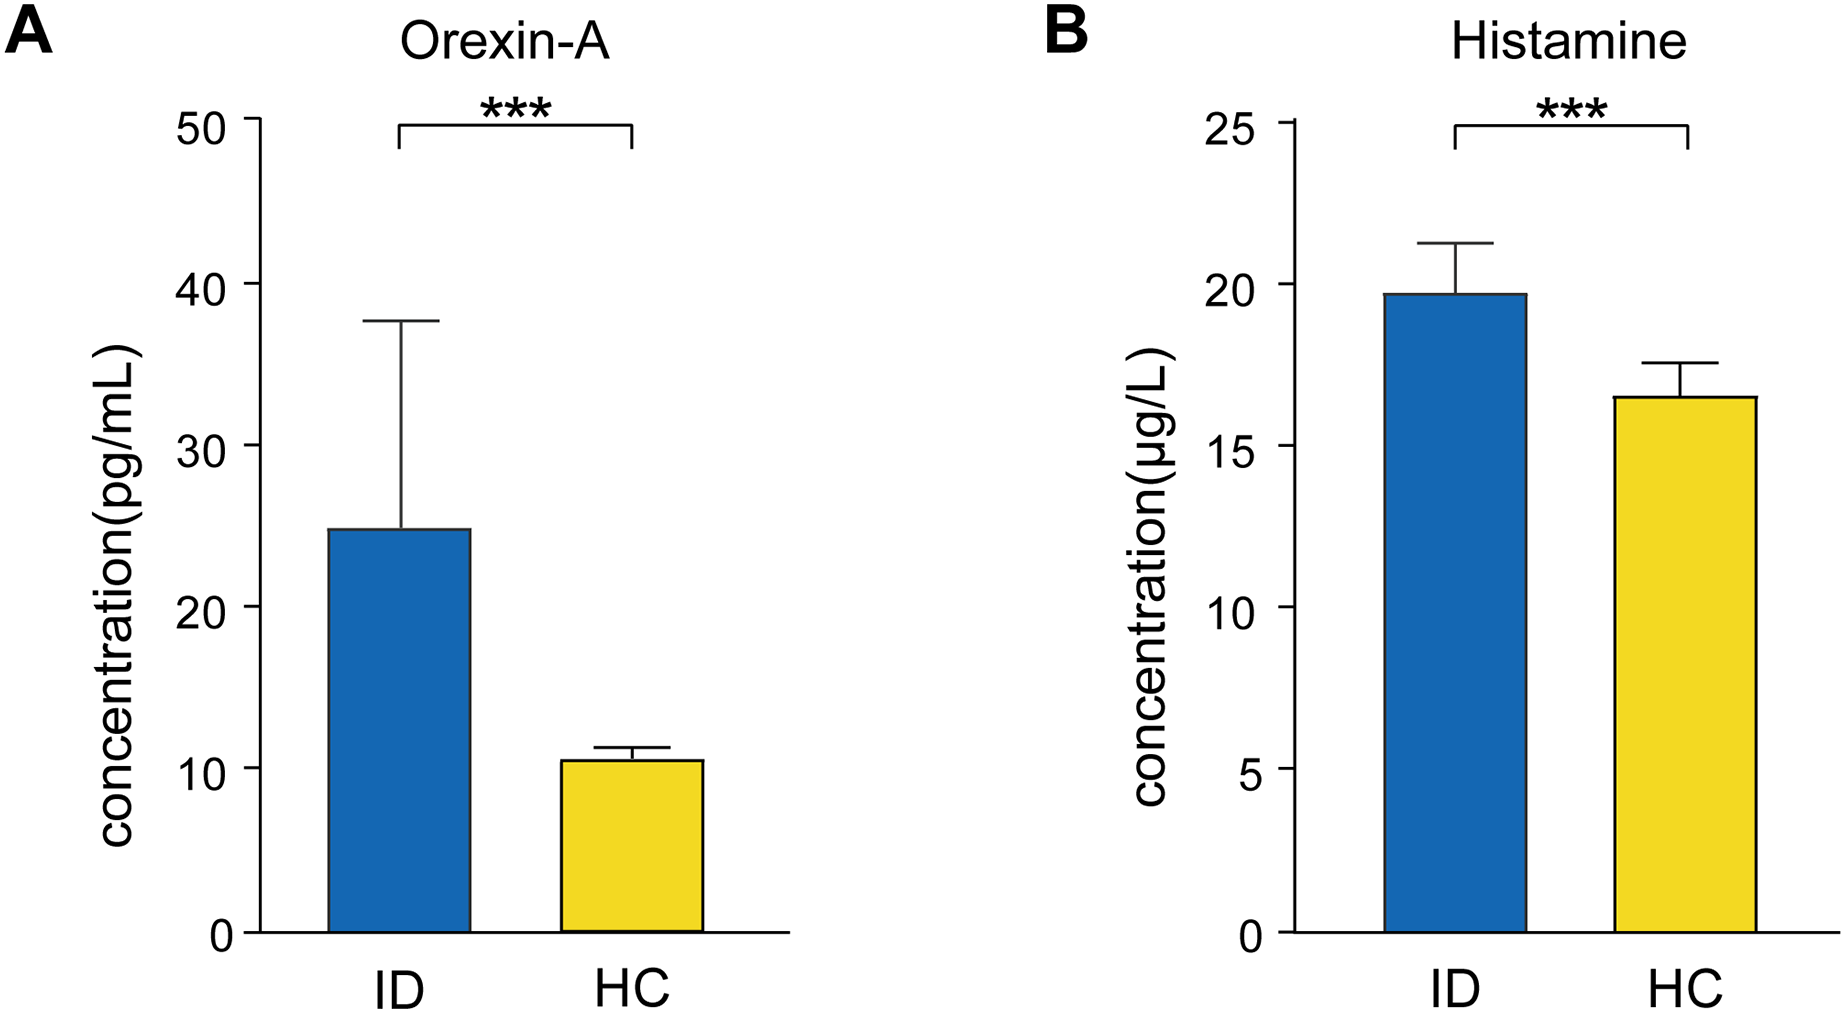
Correlation between FC of PH and arousal-promoting neurotransmitters
Given that arousal-promoting neurotransmitters (orexin-A and histamine) are predominantly secreted by neurons in the PH, we only conducted correlation analysis between FC values of PH with brain regions exhibiting significant differences and the levels of arousal-promoting neurotransmitters in ID patients. The results revealed a positive correlation between the FC of the PH and right medial superior frontal gyrus and histamine in ID patients (R = 0.41, P = 0.04) (Fig. 6).
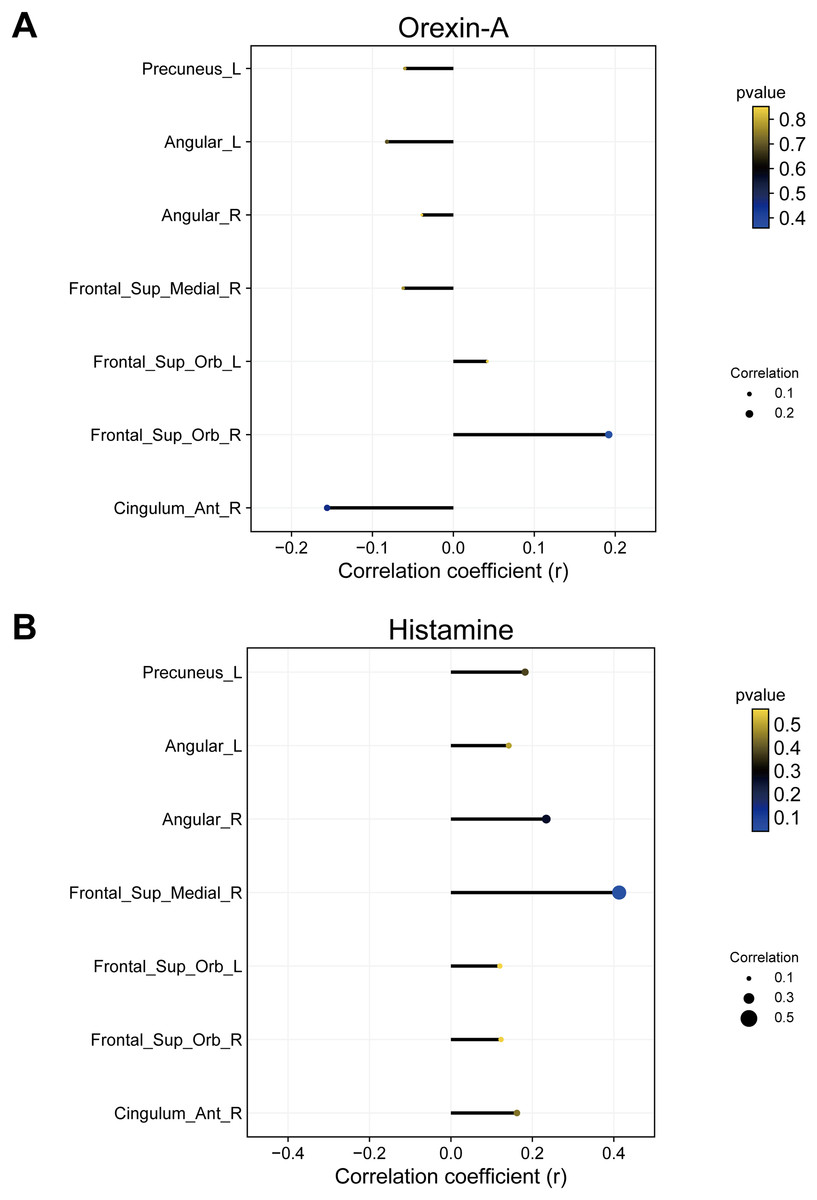
Figure 6: Correlation between FC of PH with brain regions showing significant differences and (A) orexin-A or (B) histamine.
The FC of PH with right medial superior frontal gyrus was positively correlated to histamine. FC, functional connectivity; ID, insomnia disorder; HC, healthy control; PH, posterior hypothalamus. Frontal_Sup_Orb, Orbital superior frontal gyrus; Cingulum_Ant, Anterior cingulate cortex; Angular, Angular gyrus; Frontal_Sup_Medial, Medial superior frontal gyrus. R represents right and L represents left side of the brain. The X-axis represents the magnitude of correlation coefficients. Larger circle diameters indicate greater absolute values of correlation coefficients. Cooler colors of circles denote smaller P-values, while warmer colors indicate larger P-values.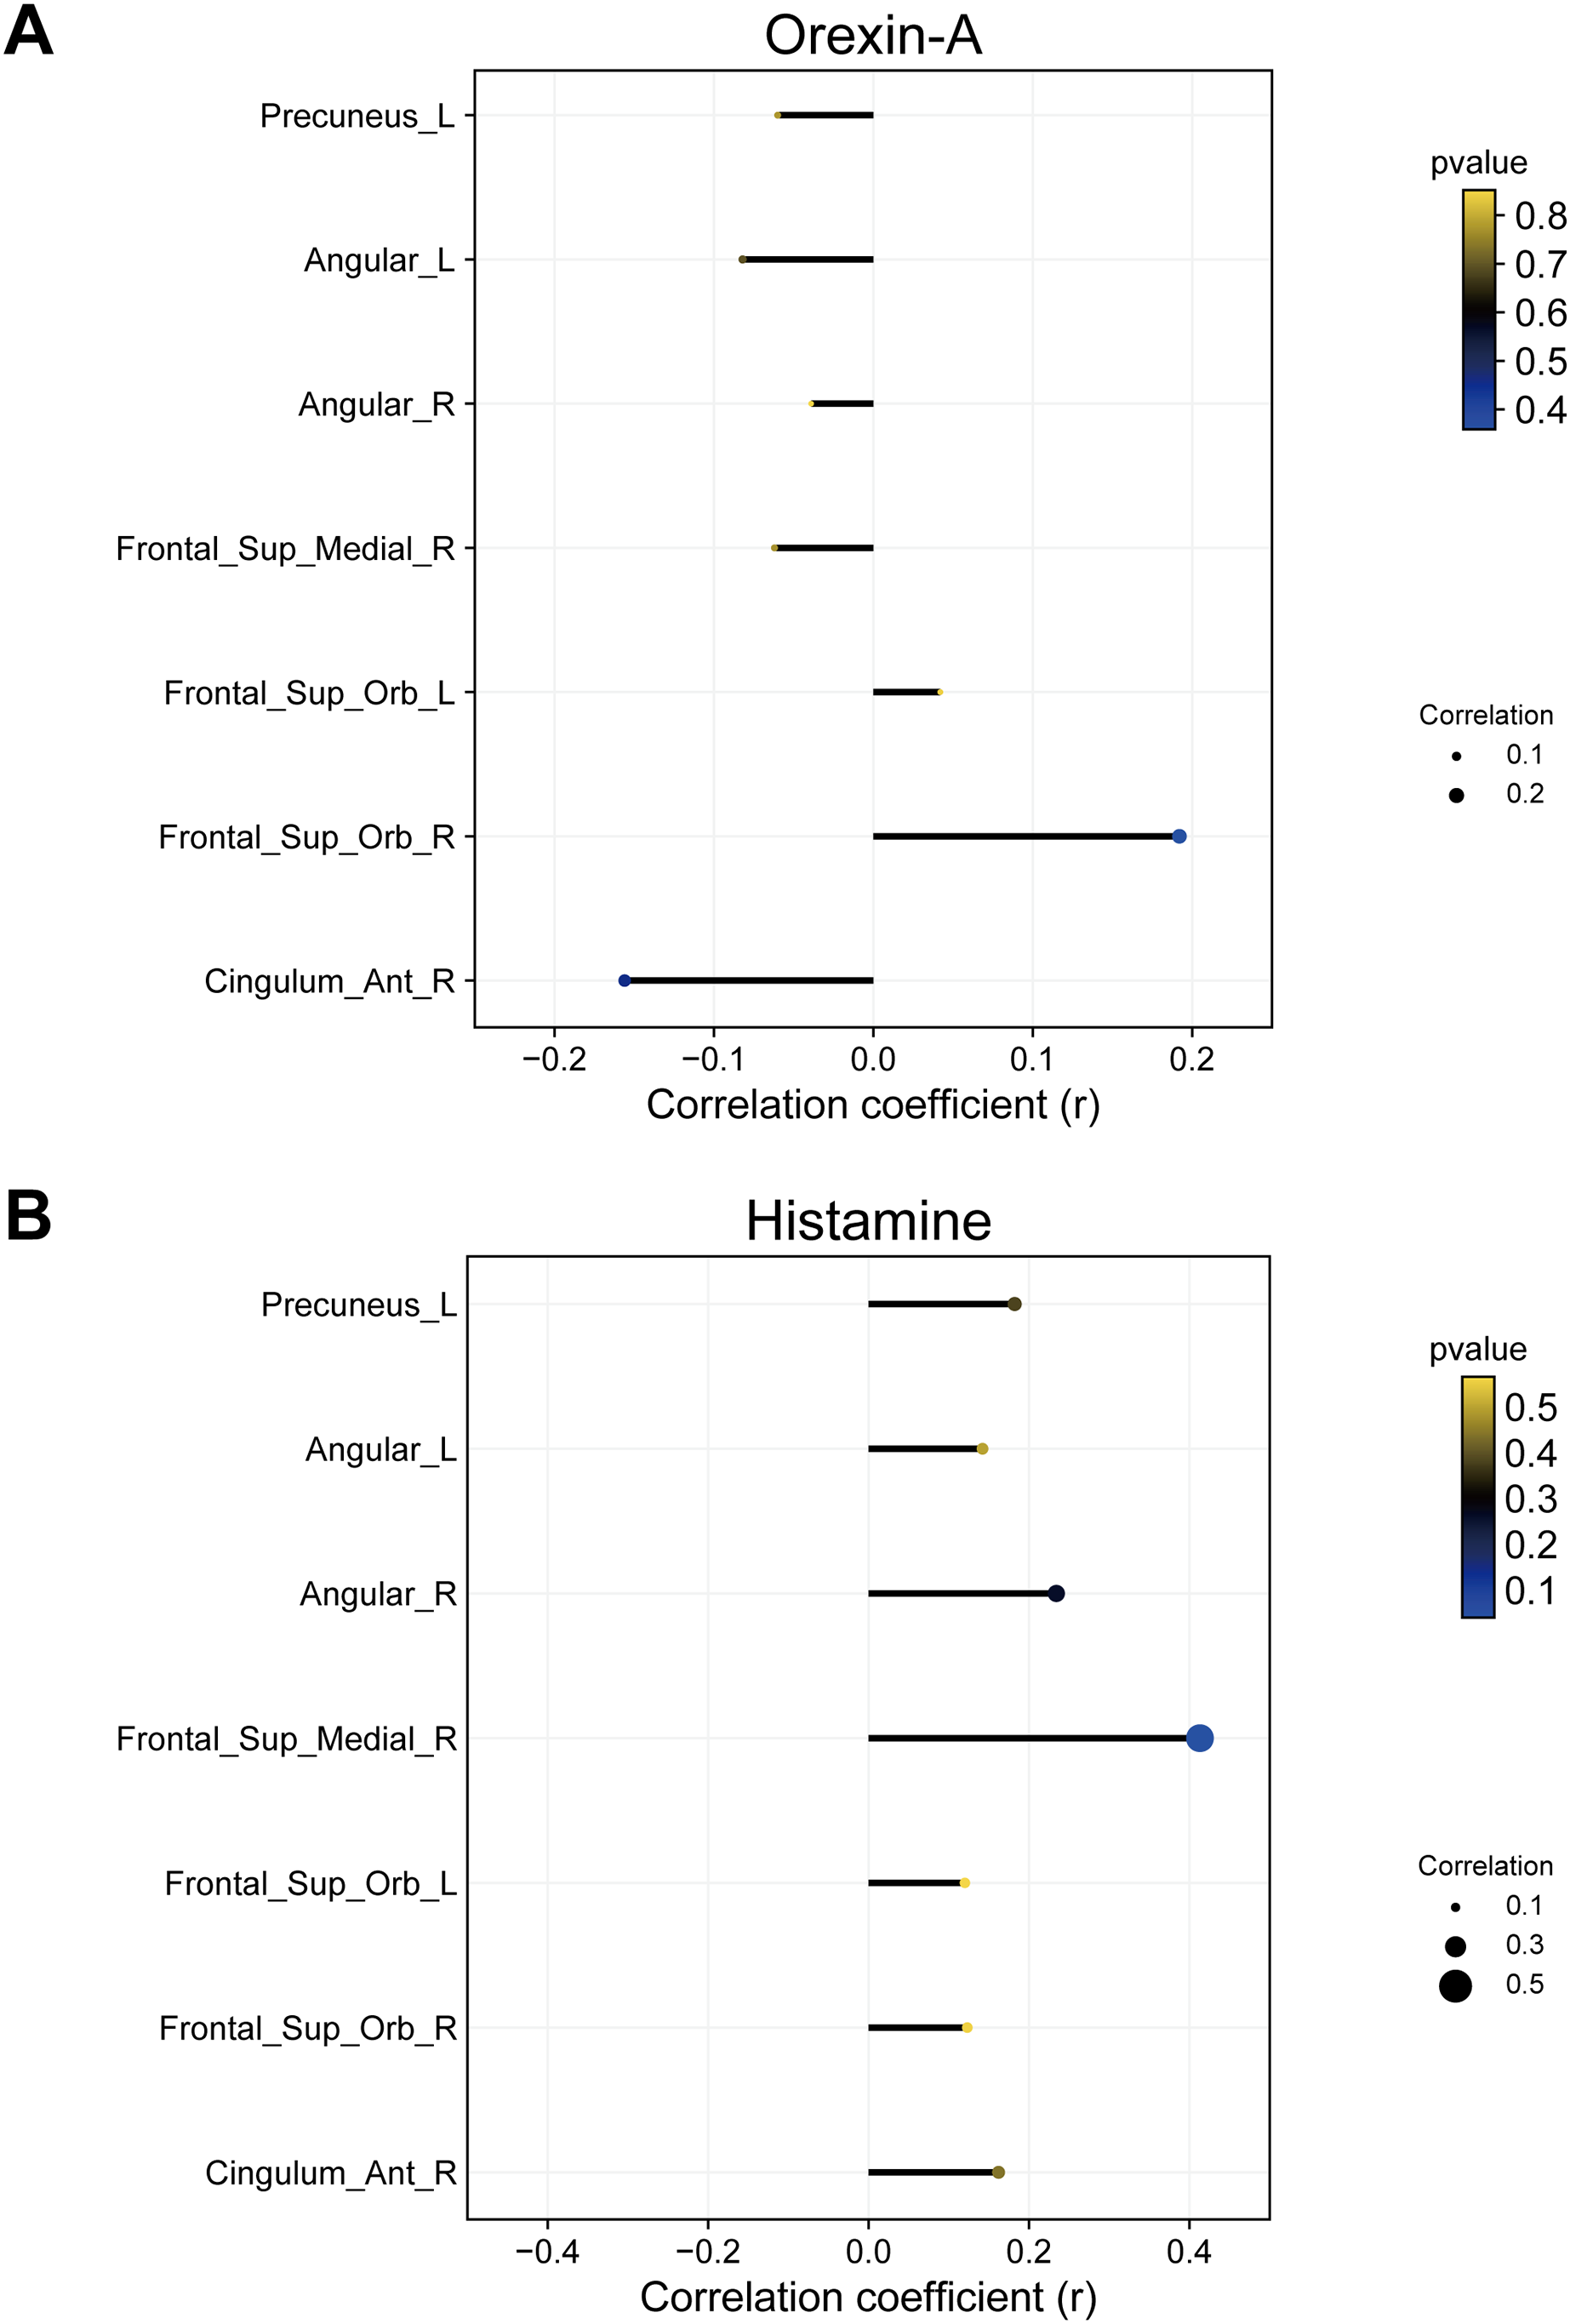
Discussion
In the present study, seed-based FC analysis was applied to investigate the resting-state FC between the AH/PH and the whole brain in ID patients. Additionally, we measured serum concentrations of orexin-A and histamine to explore the relationship between FC and arousal-promoting neurotransmitters in ID patients. The results revealed altered FC of the hypothalamus in ID patients, which correlated with the levels of arousal-promoting neurotransmitters. To our knowledge, this is the first study to investigate the FC of AH/PH with the whole brain and to examine the correlation between PH and arousal-promoting neurotransmitters in ID patients, which indicated shared alterations in hypothalamic function and humoral factors in ID.
Our study found decreased FC between the PH and brain regions associated with the DMN and ACC in ID patients. The PH is a primary brain region where arousal-promoting neurons are located, and the changes of connectivity within PH may reflect alterations in arousal mechanisms. The DMN is an interconnected brain system that is most active during undisturbed solitary thinking, involving a wide range of advanced cognitive functions (Regen et al., 2016). ID patients show significantly decreased FC between the anterior DMN and posterior DMN (Huang et al., 2017; Dong et al., 2018; Yu et al., 2018); however, several studies have also reported increased FC between subregions of the DMN (Ma et al., 2018; Zhou et al., 2018; Leerssen et al., 2019). Changes in FC within the DMN may explain the sensitivity and alterations in self-awareness observed in ID patients, which could potentially affect the process of falling asleep (Morin et al., 2015). This study identified reduced FC between the PH and specific DMN brain regions (the bilateral angular gyrus, the left precuneus). We speculate that ID may be linked to a failure in arousal mechanisms, hindering the transition from wakefulness to sleep states. Additionally, this study found significantly reduced FC between the ACC and both the anterior and posterior hypothalamus, suggesting that ACC may be a key brain region involved in the onset and development of ID. Two previous studies revealed alterations in FC between ACC and brain regions such as the thalamus and orbitofrontal cortex in ID patients (Yan et al., 2018; Li et al., 2018). Additionally, correlation analysis in our study showed that the FC of PH and the precuneus, angular gyrus, orbital superior frontal gyrus, ACC were correlated with sleep stages and their latency periods, suggesting the function of the hypothalamus is associated with sleep quality and architecture. Similarly, Guo et al. (2023) also investigated the relationship between FC and sleep stages in ID patients, finding a positive correlation between transition probabilities from N2 to wakefulness and the FC of the ACC with the anterior cerebellum during N2. However, research in this area is still limited, and further studies are required.
Elevated serum levels of orexin-A and histamine were found in ID patients in this study. Our findings are consistent with that of Gabelle et al. (2017) who reported significantly higher levels of orexin-A in the peripheral blood of ID patients compared to HCs. However, the comparison of peripheral blood histamine levels in ID patients has not been previously reported. Both histamine and orexin-A are involved in regulating brain functions, including the sleep-wake cycle, energy regulation, and endocrine homeostasis (Shan, Dauvilliers & Siegel, 2015). Histaminergic neurons are innervated by orexinergic neurons, both located in the PH, playing crucial roles in regulating the sleep-wake cycle (Yamanaka et al., 2002; Saito et al., 2018). The levels of histamine in the brain are related to alertness and the circadian rhythm, with histamine release increasing during wakefulness (Yoshikawa, Nakamura & Yanai, 2021). The activation of orexin neurons promotes arousal and maintains wakefulness, whereas decreased orexin activity induces sleep (Taheri, Zeitzer & Mignot, 2002). While measuring neurotransmitter concentrations in the CSF is ideal, obtaining CSF from individuals can be challenging (Chien et al., 2015). Strawn et al. (2010) demonstrated a strong correlation between levels of orexin-A in CSF and peripheral blood samples from individual subjects. Therefore, this study collected serum samples rather than CSF samples. The correlation between neurotransmitters (histamine and orexin-A) in the brain and peripheral blood has not been fully clarified. In normal conditions, histamine is typically unable to pass through the blood-brain barrier (BBB) (Thakkar, 2011). However, histamine can increase BBB permeability by opening the interendothelial cell tight junctions (Sakurai et al., 2009; Sedeyn et al., 2015). Moreover, histamine in the blood can affect hypothalamic activity through circumventricular organs that lack the BBB (Alstadhaug, 2014). Orexin-A efficiently cross the BBB through simple diffusion to reach the brain tissue (Kastin & Akerstrom, 1999). Previous studies have indicated a positive correlation between wakefulness and extracellular histamine concentration in the hypothalamus (Rozov et al., 2014). Therefore, the elevation of peripheral arousal-promoting neurotransmitters may be one of the neural mechanisms underlying the occurrence of ID.
Furthermore, we conducted a correlation analysis between arousal-promoting neurotransmitters and FC values of the PH, revealing a positive correlation between the FC of the PH and right medial superior frontal gyrus and histamine in ID patients. Stimuli from peripheral tissues can be transmitted to the brain, and changes in brain function are reflected in peripheral immune responses (Cacabelos et al., 2016). In this neuroimmune regulation, histamine serves as a significant pleiotropic factor (Smolinska et al., 2014). Additionally, histamine neurons are found solely within the TMN of the PH (Scammell et al., 2018), which may explain the changes in FC of PH linked to histamine. This result indicated a combined influence of arousal-promoting neurotransmitters and brain function, providing additional evidence for the hyperarousal theory of ID. However, previous studies have not examined the FC between the hypothalamus and arousal-promoting neurotransmitters, and further research is needed.
However, our study had several limitations. First, as an observational study, it lacked interventional research, thereby limiting the depth of mechanistic understanding and the strength of evidence guiding targeted therapies for the ID. Second, the studies analyzed neurotransmitters measured in the blood rather than in the CNS, including direct measurements of concentrations in the brain or CSF. Third, ID encompasses various subtypes, yet this study did not extensively investigate the differences between these subtypes among the included patients, leading to a restricted comprehensive interpretation of the results and limiting the generalizability of the research findings. Fourth, integrating real-time EEG-fMRI could further explore the FC changes in the anterior and posterior hypothalamus between ID patients and HCs across wakefulness and different sleep stages. Finally, this is a small sample exploratory study, and therefore the results are preliminary. Future research should aim for larger sample sizes and increased replication to establish more robust conclusions.
Conclusion
The ID patients exhibited aberrant FC between the AH/PH and the brain regions related to sleep-wake regulation, particularly involving the DMN and ACC, which may correlate with elevated peripheral levels of arousal-promoting neurotransmitters (orexin-A and histamine). These findings enhance our understanding of the potential neuroimaging and neurohumoral mechanisms underlying ID, suggesting a possible collaborative role of the hypothalamus and arousal-promoting neurotransmitters in the pathogenesis of ID. However, further research with larger sample sizes is needed to validate the findings of this pilot study.
Supplemental Information
Demographic and clinical characteristics of participants with ID and HCs.
Notes: aMann Whitney U-test, bChi-square test. Abbreviations: ID: insomnia disorder; HC: healthy control; BMI: body mass index.