
Evaluation and driving factors of ecological environment quality in the Tarim River basin based on remote sensing ecological index
- Published
- Accepted
- Received
- Academic Editor
- Timothy Randhir
- Subject Areas
- Environmental Contamination and Remediation, Spatial and Geographic Information Science
- Keywords
- Tarim river basin, Moran’s index, Remote sensing ecological index, Geodetector
- Copyright
- © 2024 Tang et al.
- Licence
- This is an open access article distributed under the terms of the Creative Commons Attribution License, which permits using, remixing, and building upon the work non-commercially, as long as it is properly attributed. For attribution, the original author(s), title, publication source (PeerJ) and either DOI or URL of the article must be cited.
- Cite this article
- 2024. Evaluation and driving factors of ecological environment quality in the Tarim River basin based on remote sensing ecological index. PeerJ 12:e18368 https://doi.org/10.7717/peerj.18368
Abstract
Changes in the ecological environment quality (EEQ) in the main inland Tarim River Basin in China substantially impact the regional development. Indeed, comprehensive ecological environment measures have been implemented in the Tarim River Basin since 2000. In this context, the main objective of the present study was to investigate the spatiotemporal evolution of the EEQ and monitor the effectiveness of ecological restoration measures in the Tarim River Basin over the 2000–2020 period using remote sensing data. First, a Remote Sensing Ecological Index (RSEI) was constructed based on the Moderate Resolution Imaging Spectroradiometer remote sensing data. Second, the spatial distributions and factors of the RSEI were analyzed by using Moran’s Index and Geodetector. The results indicated that the overall RSEI values for the Tarim River Basin increased from 0.22 in 2000 to 0.25 in 2020. Moreover, the values for areas with poor EEQ decreased from 50.7% to 44.73%, while those with moderate EEQ increased from 11.45% to 16.91%. Therefore, the results demonstrated a slight overall improvement in the EEQ of the study area over the 2000–2020 period. On the other hand, the EEQ in the Tarim River Basin exhibited a significant spatial autocorrelation in the 2000–2020 period, with a relatively stable overall spatial distribution. Areas with high–high aggregation were distributed in the high-elevation mountainous areas in the western, northern, and southern parts of the study area. In contrast, areas with low–low aggregation were observed in the central and eastern low-elevation desert areas. The EEQ in the Tarim River Basin was driven by the interactions of several factors, including the normalized difference vegetation index, land surface moisture, land surface temperature, normalized differential build-up and bare soil index, and elevation. In particular, heat was the main driving factor that severely impacted the EEQ in the study area. Indeed, increase in the heat values could directly enhance meltwater runoff from glaciers in the basin, thereby resulting in short-term improvement in the basin EEQ. Furthermore, rapid urbanization from 2015 to 2020 resulted in a decrease in the average RSEI value of the Tarim River Basin by 0.1 over this period, consequently, the EEQ level decreased slightly. Briefly, the EEQ in the Tarim River Basin showed an overall increasing trend from 2000 to 2020, further demonstrating the effectiveness of a series of implemented ecological restoration measures in the Tarim River Basin over this period.
Introduction
Ecological environmental integrity is a crucial baseline for human communities and socio-economic growth. The ecological environmental quality (EEQ) directly influences the prosperity of civilizations (Liu, 2023). However, global economy, population growth, and increased urbanization levels have exacerbated serious ecological degradation. Intensive changes in the urban heat-island effect, air quality, and land use types have generated increasingly serious environmental issues, resulting in increased attention toward environmental protection (Wu et al., 2020; Wang et al., 2022b). Timely and dynamic evaluation of regional environmental quality and its associated driving mechanisms are necessary for formulating effective policies to protect the environment and sustain ecological growth (Aronson et al., 2017; Zheng et al., 2022).
The EEQ refers to the geographical differences manifested by the combined effects of intrinsic elements of the ecosystem and the external environment within a certain spatial and temporal range, reflecting the degree of strength and weakness of the ecological environment. The assessment of EEQ aids in systematic comprehension of the state of the ecological environment and the threshold of ecological degradation (Ma et al., 2019; Boori et al., 2021). In the early days, most of the information regarding EEQ assessment was obtained from manual statistics, surveys, and single-point monitoring, which consumed a lot of manpower, material resources, and time. In recent years, remote sensing technology, with its advantages of rapid, real-time, large-scale monitoring and open access to data, has been widely used in the field of ecology and environment. Moreover, it has promoted large-scale and long-term dynamic monitoring of EEQ (Yang et al., 2021). However, most current studies have described the overall eco–environment quality situation based on a single indicator only. For example, some re-searchers have used vegetation cover (Peng et al., 2019; Huang et al., 2021), land use (Wang et al., 2021), surface temperature (Alexander, 2020), enhanced vegetation index (Tariq et al., 2021), and other single factors to comprehensively reflect the overall development level of regional EEQ. However, due to the complexity and diversity of ecosystems, it is difficult to effectively characterize the overall condition of complex regional ecosystems based on a single factor alone (Chen et al., 2023).
For further systematic exploration of complex regional ecosystems, the Organization for Economic Co-operation and Development and the United Nations Environment Programme jointly established the “Pressure-State-Response” (PSR) model in the 1990s, which has been used on a large scale in the field of ecological and environmental research (Liu & Gang, 2010). Mehebub et al. (2022) combined the PSR approach with geospatial techniques to explore the environmental quality of the Sundarbans Nature Reserve in India, showing consistent results with actual environmental quality in the reserve. However, specific weight attributions to indicators using this approach were subjective (Ye & Kuang, 2022), which might have resulted in erroneous conclusions. Moreover, the comparison of the environmental quality assessment results obtained via this method with those revealed in other regions worldwide may be a challenging task due to the regional differences in the characteristics of study areas.
In 2006, China’s Ministry of Environmental Protection released the Technical Specifications for Ecological Environmental Status Assessment (HJ/T192-2006) for trial implementations. These specifications recommended the application of an Eco–environmental Status Index. Subsequently, the Ministry officially released the Technical Specifications for Ecological Environmental Status Evaluation in 2015 (HJ192-2015), providing a unified set of ecological environmental evaluation standards in China (Ou et al., 2022). Indeed, these specifications were used to comprehensively evaluate the environmental quality in some areas of China, such as Gansu Province (Du et al., 2019), Inner Mongolia (Ou et al., 2020), and Northeast China (Liu et al., 2021). However, some indicators highlighted in the specifications exhibited strong autocorrelations, resulting in their constant relative weights, consequently, affecting the reliability of the assessment results. Moreover, it remains difficult to obtain statistical data on the specification and evaluation results to spatially visualize the results (Wang et al., 2022a).
In this context, in 2013, Xu (2013) proposed for the first time the use of the remote-sensing ecological index (RSEI) to characterize the level of EEQ, which is based on remotely sensed image data and consists of four indicators, namely, greenness, humidity, heat, and dryness. Greenness is expressed in terms of the Normalized Difference Vegetation Index (NDVI), which is used to measure the degree of vegetation cover and vegetation type of the ecosystem. Humidity is expressed in terms of the surface humidity (WET), which reflects the degree of precipitation, evapotranspiration, and soil water content of the ecosystem. Dryness is expressed by the Normalized Difference Cumulative and Bare Soil Index (NDBSI), which reflects the degree of aridity and the efficiency of water use of the ecosystem; and heat is expressed by the surface temperature (LST), reflecting the climatic condition of the ecosystem. The RSEI model was constructed by extracting the first principal component (PC1) from the four ecological factors of greenness, wetness, dryness, and heat by the principal component analysis (PCA) method (Xu et al., 2018). Therefore, RSEI can reflect the pressure on the environment caused by human activities, changes in environmental status, and climate change response. An et al. (2022) assessed the EEQ of the Three Gorges Ecological Economic Corridor from 2001–2019 by using the RSEI model and found that the areas with poorer EEQ in the region were located in the eastern and western parts of the study area. Zhang et al. (2022) explored the response of EEQ in the Yangtze River Delta region to the direct and indirect impacts of natural and anthropogenic factors based on the RSEI model and Partial Least Squares Structural Equation Modeling (PLS-SEM), and spatial autocorrelation of regional EEQ was evaluated. Xiong et al. (2021) conducted a comprehensive evaluation of the EEQ of the Erhai basin by combining the Google Earth Engine and RSEI models, and found that the EEQ of the Erhai basin showed an overall decreasing trend from 1999 to 2009 and an increasing trend from 2009 to 2019. The method offers the advantages of simple data acquisition, as well as objective weight calculations and spatial visualizations, explaining its extensive application in assessing regional environmental quality.
The Tarim River Basin is one of the largest inland river basins worldwide, including Aksu Prefecture, Kizilsu Kirgiz Autonomous Prefecture, Bayingol Mongolian Autonomous Prefecture, Kashgar Prefecture, and Hotan Prefecture (Long et al., 2021). Since the 1950s, under the influence of large-scale soil and water development, the number of source streams in the basin has been separated from the main stream one after another, and the amount of water delivered by the source streams to the main stream has been decreasing year by year. Moreover, water quality has been deteriorating, desertification and salinization have intensified, downstream of the river has been cut off for nearly 400 km, Taitema Lake in the tailrace has dried up, a large area of the poplar forests has died, and the ecological environment is facing an extremely severe challenge (Ling et al., 2019). To improve the EEQ of the Tarim River Basin, China has been involved in huge monetary investments to start the comprehensive management of the Tarim River Basin since 2000. Therefore, this article aims to (1) construct an RSEI model to quantitatively evaluate the spatio-temporal changes of EEQ in the Tarim River Basin from 2000 to 2020, (2) reveal the spatial aggregation characteristics of RSEI in the Tarim River Basin using Moran’s I method, and (3) identify the main driving factors affecting EEQ changes in the Tarim River Basin using the Geodetector method. These results provide further insights into future environmental restoration and sustainable development.
Materials and Methods
This research mainly includes three contents (Fig. 1). Firstly, MODIS remote sensing data from 2000 to 2020 was collected to construct a remote sensing ecological index to comprehensively evaluate the ecological environment quality in the Tarim Basin. Secondly, the temporal and spatial characteristics of ecological environment quality in Tarim River Basin are analyzed by Moran’s index. Finally, the main driving factors affecting the evolution of ecological environment quality in the basin were analyzed by using Geodetector.
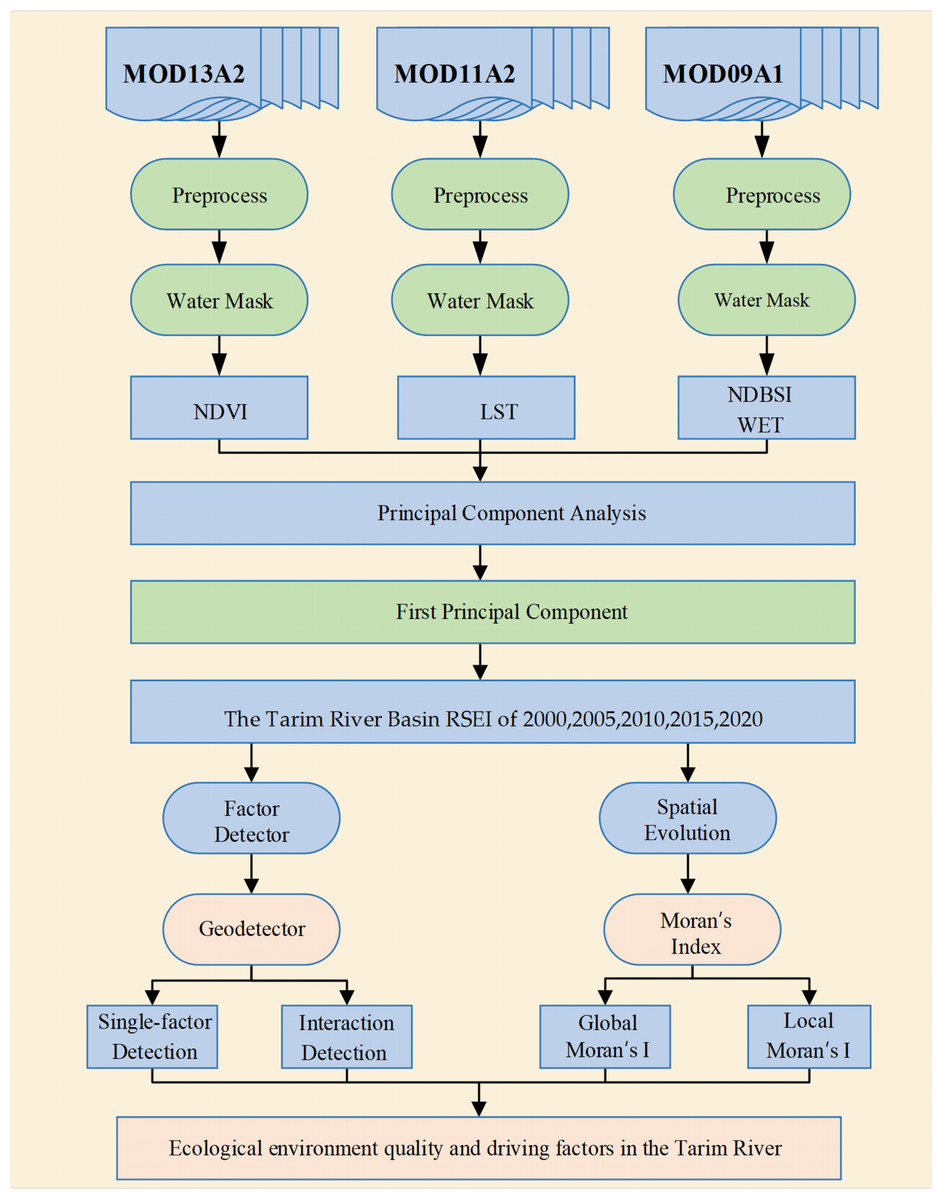
Figure 1: Methodological framework.
Remote sensing images of the study area from 2000 to 2020 were extracted by MOD13A2, MOD11A2 and MOD09A1. Four ecological indicators, NDVI, LST, NDBSI and WET, were obtained after image preprocessing. The obtained ecological indicators were used to construct the RSEI model by extracting the first principal component through principal component analysis, and the spatial and temporal variations of ecological environment quality and the main driving factors in the study area were analysed by the Moran index and geodetector. Templates were made by Visio.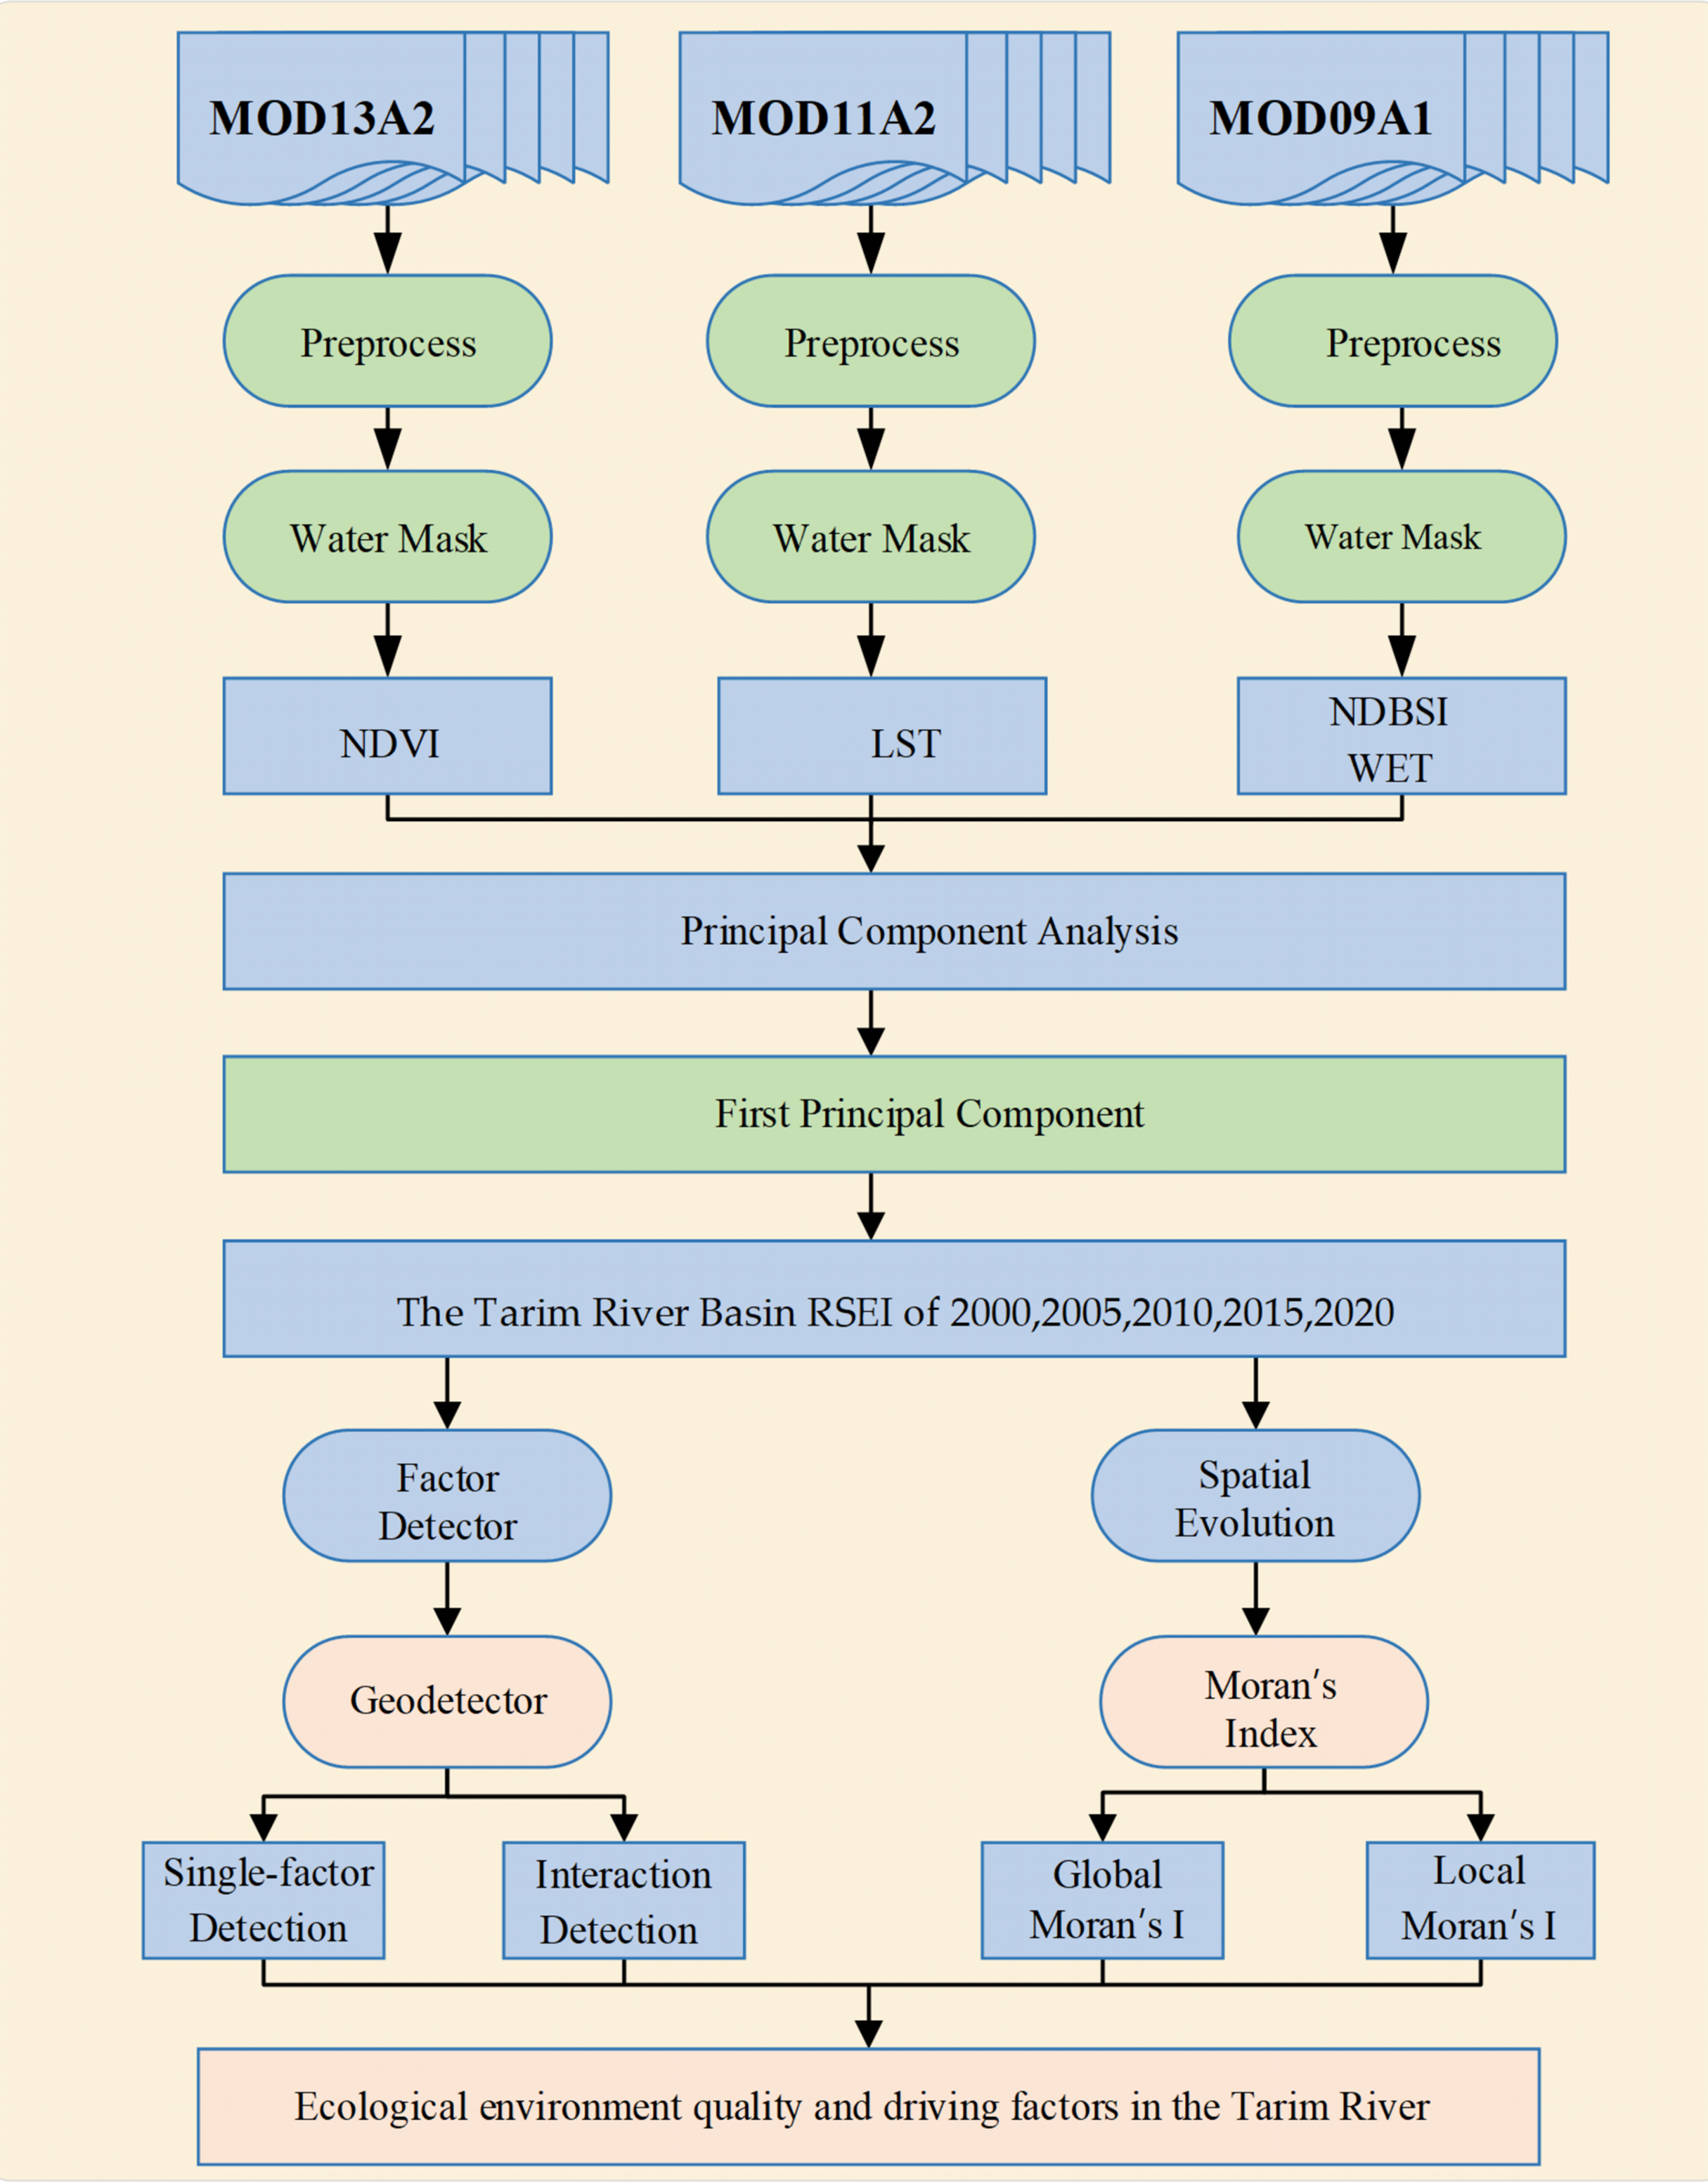
Study area
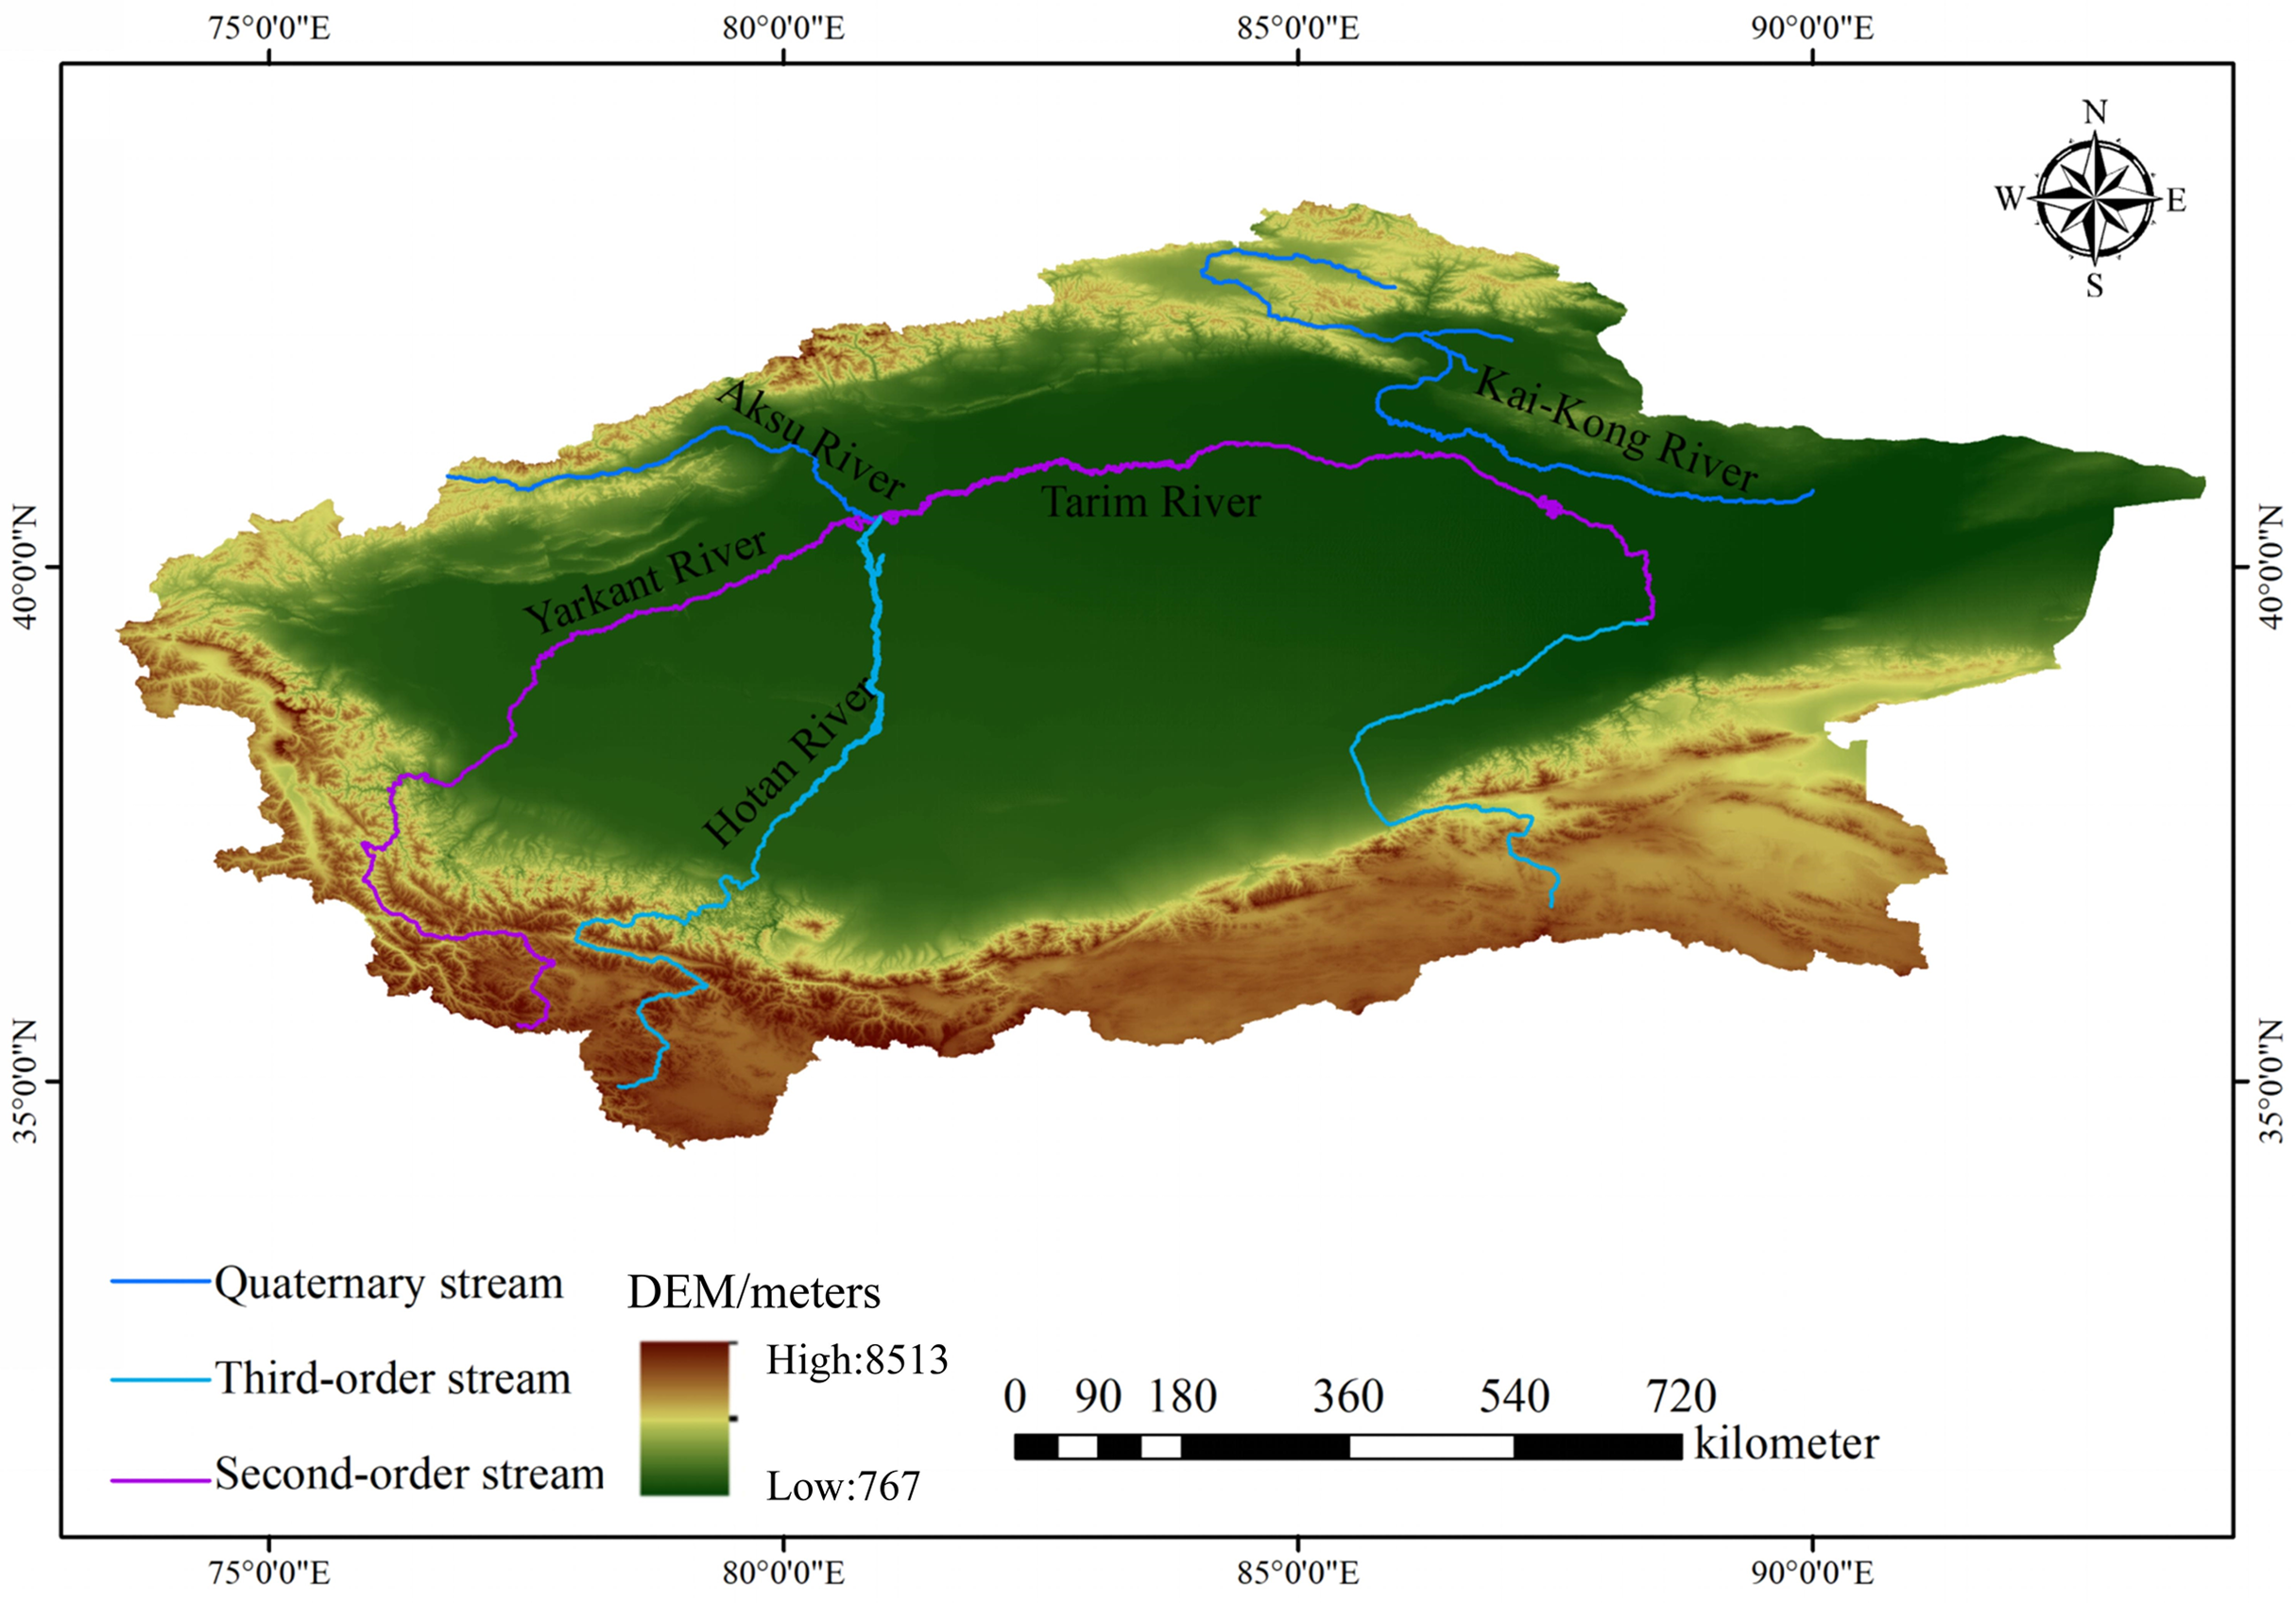
The Tarim River Basin (73°10′–94°05′E; 34°55′–43°08′N) is situated in the Eurasian hinterland in the southern part of the Xinjiang Uygur Autonomous Region in China, covering a total area of 1.02 × 10⁶ km2. The river system includes the mainstream Tarim River and four tributaries, including the Hotan, Yarkant, Aksu, and Kai-Kong rivers (Fig. 2). Moreover, it has abundant natural resources, such as oil and gas reserves. However, water resources are extremely scarce in the study area due to the dry climate, scarce rainfall events, and intense evapotranspiration, forming a typical continental warm temperate climate (Sun et al., 2021).
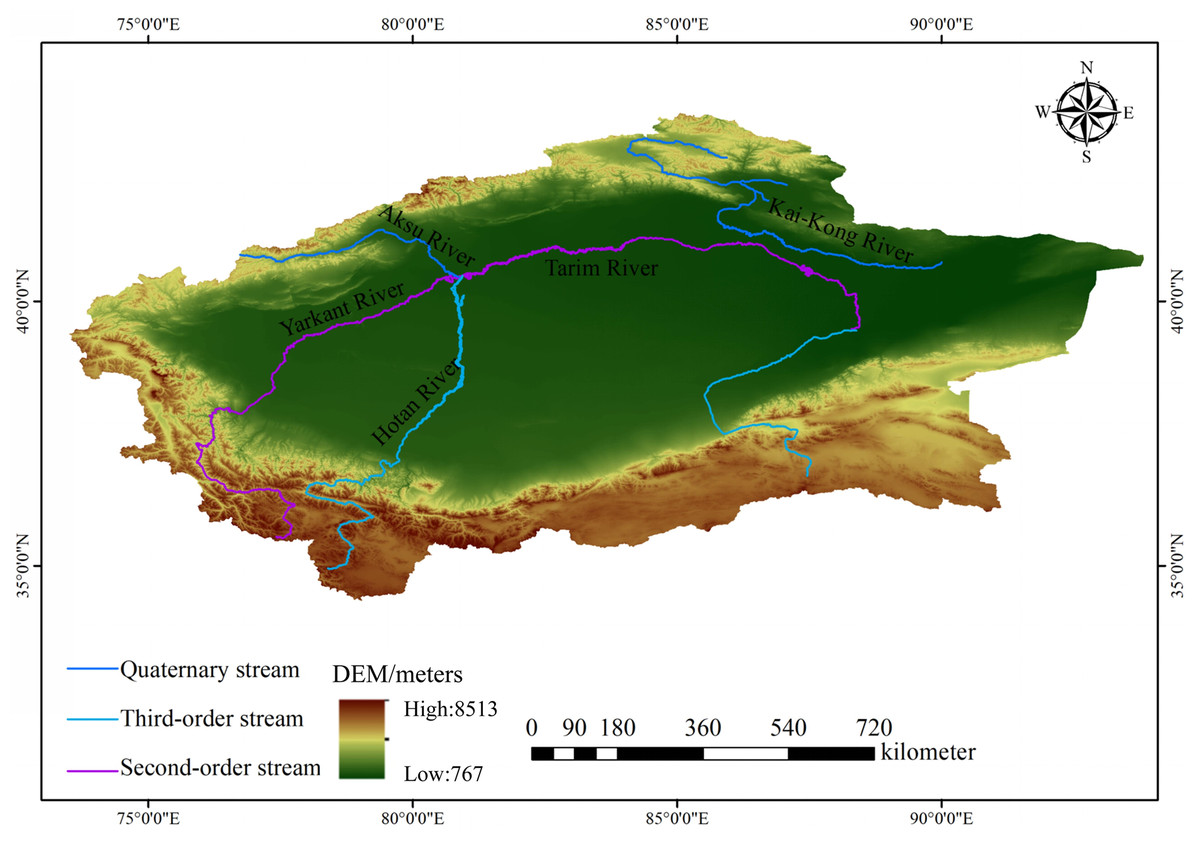
Figure 2: Location map of the study area.
Data source and processing
The data used in this study consisted of imagery and digital elevation model (DEM) for 2000, 2005, 2010, 2015, and 2020. MODIS imagery was derived from the MOD09A1, MOD11A2, and MOD13A2 data (https://search.earthdata.nasa.gov/), including 18 scenes for each year, totaling 90 scenes (Table 1). The land use data were obtained from the Resource and Environmental Science and Data Centre of the Chinese Academy of Sciences (https://www.resdc.cn/) (Xu & Deng, 2022), while the DEM data were obtained from the Geospatial Data Cloud (https://www.gscloud.cn/). The collected data were processed by several methods, including batch cropping, projection, and splicing. Further, the MODIS reflectance band values were synthesized, while large water bodies in the study area were masked by using the normalized difference water index (NDWI) before the RSEI extraction to remove the influence of surface water bodies on the wetness and major component loadings. The NDWI was calculated by using the following formula:
(1) where ρGreen and ρNIR are the surface reflectance values within the green band and near-infrared band, respectively.
| Data name | Data sources | Resolution | Index |
|---|---|---|---|
| MOD13A2 | NASA (https://search.earthdata.nasa.gov/) | 1,000 m | NDVI |
| MOD11A2 | 1,000 m | LST | |
| MOD09A1 | 500 m | WET and NDBSI | |
| DEM | Geospatial data cloud (https://www.gscloud.cn/) | 90 m | DEM, slope, slope direction |
| Land use | The resource and environmental science and data center (https://www.resdc.cn/) | 30 m | Type of land use |
Remote sensing ecological index model
In this study, changes in the quality of the ecological environment were evaluated through the RSEI. The RSEI values were determined by combining heat (LST), dryness (NDBSI), wetness (WET), and greenness (NDVI) factors. Further, the four indicators were evaluated by PCA. Specifically, the PC1 was considered to obtain the RSEI. The four indicators and their specific formulas are presented in Table 2. The RSEI was calculated by using the following formulas (Xu, 2022):
(2)
(3) where RSEI0 denotes the PCA-based RSEI value normalized to [0,1] for ease of analysis and interpretation. RSEI0 values ranging from 0 to 1 indicate worse and better ecological conditions, respectively.
| Index | Calculation method | Parameter description |
|---|---|---|
| NDVI (Maity et al., 2022) | NIR: near infrared band; Red: red light band. | |
| WET (Wang et al., 2021) |
|
ρi(i = 1, 2, 3, … 7) for MODIS09A1 around the table reflectance band |
| LST (Yue et al., 2019) | DN is the gray value of the temperature of land surface | |
| NDBSI (Hu & Xu, 2018) |
|
S1, Red, Green, NIR, and Blue represent short-wave infrared, red, blue, near-infrared, and blue wavelengths, respectively |
Spatial autocorrelation
Spatial autocorrelation is an important indicator for assessing the degree of dependence between the attribute values of elements in a geographic space and those of their neighbors. The spatial autocorrelation analysis of EEQ can aid in accurate description of the spatial pattern and homogeneous distribution characteristics of EEQ in the study area. Spatial autocorrelation analysis includes both Local and Global Moran’s index (Liu et al., 2019). The Global Moran index can reflect the overall spatial distribution characteristics of EEQ. However, it cannot reflect the aggregation characteristics and spatial differentiation characteristics of EEQ; therefore, the Local Moran index was introduced herein to analyze the degree of regional EEQ agglomeration and the type of spatial differentiation. The localized Moran index is divided into five categories based on the degree of agglomeration: non-significant, low–low (L–L), low–high (L–H), high–low (H–L), and high–high (H–H) aggregation (Zhang et al., 2023a). The non-significant class indicates the absence of any significant spatial relationship between the EEQ sampling values and those of the surrounding region. The L–L class indicates that the EEQ values and those of the surrounding region are low. The L–H class indicates that the EEQ values are low, while those of the adjacent region are high. The H–L class indicates that the EEQ values are high, while those of the adjacent region are low. The H–H class indicates that the EEQ values and those of the surrounding region are high. The Global and Local Moran’s I value were calculated by using the following equations:
(4)
(5) where n denotes the total number of image elements in the basin; m denotes the total number of neighboring units for image i; Wij denotes a weight factor of the spatial weight matrix W; represents the average RSEI value in the basin.
The Moran’s I value ranges from −1 to 1, indicating positive and negative spatial correlations, respectively. Higher Moran’s I value indicate stronger positive spatial correlations. Moran’s I value of 0 indicates a lack of spatial correlation, suggesting random spatial distribution of units. Negative Moran’s I value imply negative spatial correlations. With the decrease in the value, the negative correlation becomes more pronounced, and the spatial variability becomes larger (Ye et al., 2023).
Geodetector
The Geodetector method has been used in several related studies to explore heterogeneity at the spatial scale and identify its driving mechanisms (Wang & Xu, 2017). In this study, the RSEI values from 2000 to 2020 were considered as the dependent variable, while the NDVI, WET, NDBSI, LST, altitude, slope, slope aspect, and land use data were used as independent variables. The effects of these driving forces on the EEQ were analyzed via single-factor and double-factor interaction detections (Geng et al., 2022). The interaction detection results were subsequently classified into five categories (Table 3). The Geodetector method was applied in this study by using the following equation:
(6) where h = 1,…., L represent the number of layers of factor X; Nh denotes the number of layers of factor h; N denotes the number of samples in the entire basin; σh is the variance in the factor h; σ2 denotes the total variance in the entire basin (Zhang et al., 2023b). Further, q denotes the explanatory power of each factor on the RSEI in the basin, ranging from 0 to 1. The higher the q value, the greater the effect of the power factor on the RSEI.
| Condition | Interaction |
|---|---|
| q(X1 ∩ X2) < min[q(X1), q(X2)] | Nonlinear attenuation |
| min[q(X1), q(X2) < q(X1 ∩ X2) < max[q(X1), q(X2)] | Single-factor nonlinear enhancement |
| q(X1 ∩ X2) > max[q(X1), q(X2)] | Double-factor enhancement |
| q(X1 ∩ X2) = q(X1) + q(X2) | Mutual independence |
| q(X1 ∩ X2) > q(X1) + q(X2) | Nonlinear enhancement |
Results
Principal component analysis of ecological factors
The principal component analysis (PCA) results of the four ecological factors from 2000 to 2020 are presented in Table 4. The results indicate that the contribution rates of the RSEI by PC1 in 2000, 2005, 2010, 2015, and 2020 were 76.39%, 68.21%, 65.75%, 65.83%, and 63.86%, respectively. Simultaneously, among the four ecological factors, NDVI and WET exhibited the same sign, and LST and NDBSI exhibited the same sign, which indicates that NDVI and WET play the same role on EEQ, which is opposite to that of LST and NDBSI. This is consistent with the result of the effect of the four ecological factors on EEQ in reality. Therefore, the PC1 in the results of PCA of the four ecological factors can well integrate the main information of the four ecological factors, and it also shows that the RSEI model constructed by PC1 can present a high degree of reliability and accuracy in evaluating the EEQ in the study area.
| Year | Indicator | PC1 | PC2 | PC3 | PC4 |
|---|---|---|---|---|---|
| 2000 | NDVI | −0.0565 | 0.9399 | −0.2505 | −0.2251 |
| WET | −0.297 | 0.3004 | 0.7811 | 0.4597 | |
| LST | 0.9358 | 0.1344 | 0.3242 | −0.034 | |
| NDBSI | 0.1814 | 0.0909 | −0.4712 | 0.8584 | |
| Eigenvalue | 0.0356 | 0.005 | 0.0041 | 0.0019 | |
| Percentage (%) | 76.39 | 87.08 | 95.92 | 100 | |
| 2005 | NDVI | 0.2572 | −0.9658 | 0.0229 | 0.0247 |
| WET | 0.3734 | 0.1292 | 0.8316 | 0.3904 | |
| LST | −0.8555 | −0.2192 | 0.4604 | −0.09 | |
| NDBSI | −0.2501 | −0.0505 | −0.3098 | 0.9159 | |
| Eigenvalue | 0.0361 | 0.0111 | 0.005 | 0.0007 | |
| Percentage (%) | 68.21 | 89.19 | 98.64 | 100 | |
| 2010 | NDVI | 0.2261 | −0.9686 | −0.0579 | 0.0855 |
| WET | 0.2868 | 0.0523 | 0.8609 | 0.417 | |
| LST | −0.9048 | −0.2377 | 0.3473 | −0.0649 | |
| NDBSI | −0.219 | 0.0505 | −0.3673 | 0.9026 | |
| Eigenvalue | 0.036 | 0.0121 | 0.0045 | 0.0022 | |
| Percentage (%) | 65.7500 | 87.84 | 96.03 | 100 | |
| 2015 | NDVI | −0.2362 | 0.9671 | 0.0927 | −0.0170 |
| WET | −0.2708 | 0.0246 | −0.9597 | −0.0704 | |
| LST | 0.9319 | 0.2503 | −0.2509 | −0.0765 | |
| NDBSI | 0.0485 | 0.0376 | −0.0856 | 0.9944 | |
| Eigenvalue | 0.0389 | 0.0145 | 0.0048 | 0.0009 | |
| Percentage (%) | 65.83 | 90.3 | 98.41 | 100 | |
| 2020 | NDVI | 0.3475 | −0.925 | −0.1168 | 0.0999 |
| WET | 0.3365 | 0.0639 | 0.8456 | 0.4095 | |
| LST | −0.8362 | −0.3721 | 0.3962 | −0.0729 | |
| NDBSI | −0.2584 | 0.0433 | −0.3382 | 0.9039 | |
| Eigenvalue | 0.0339 | 0.0123 | 0.0047 | 0.0022 | |
| Percentage (%) | 63.86 | 87.01 | 95.95 | 100 |
Validation of the RSEI representativeness
In this study, Spearman rank correlation analysis between the ecological indicators and RSEI was performed to determine whether the RSEI correctly reflects the EEQ in the study area. The NDBSI, NDVI, RSEI, WET, and LST were uniformly sampled in the study area, resulting in a total of 11,436 sample points. Spearman correlation analysis was also performed to assess the representativeness of the RSEI in relation to the four ecological factors.
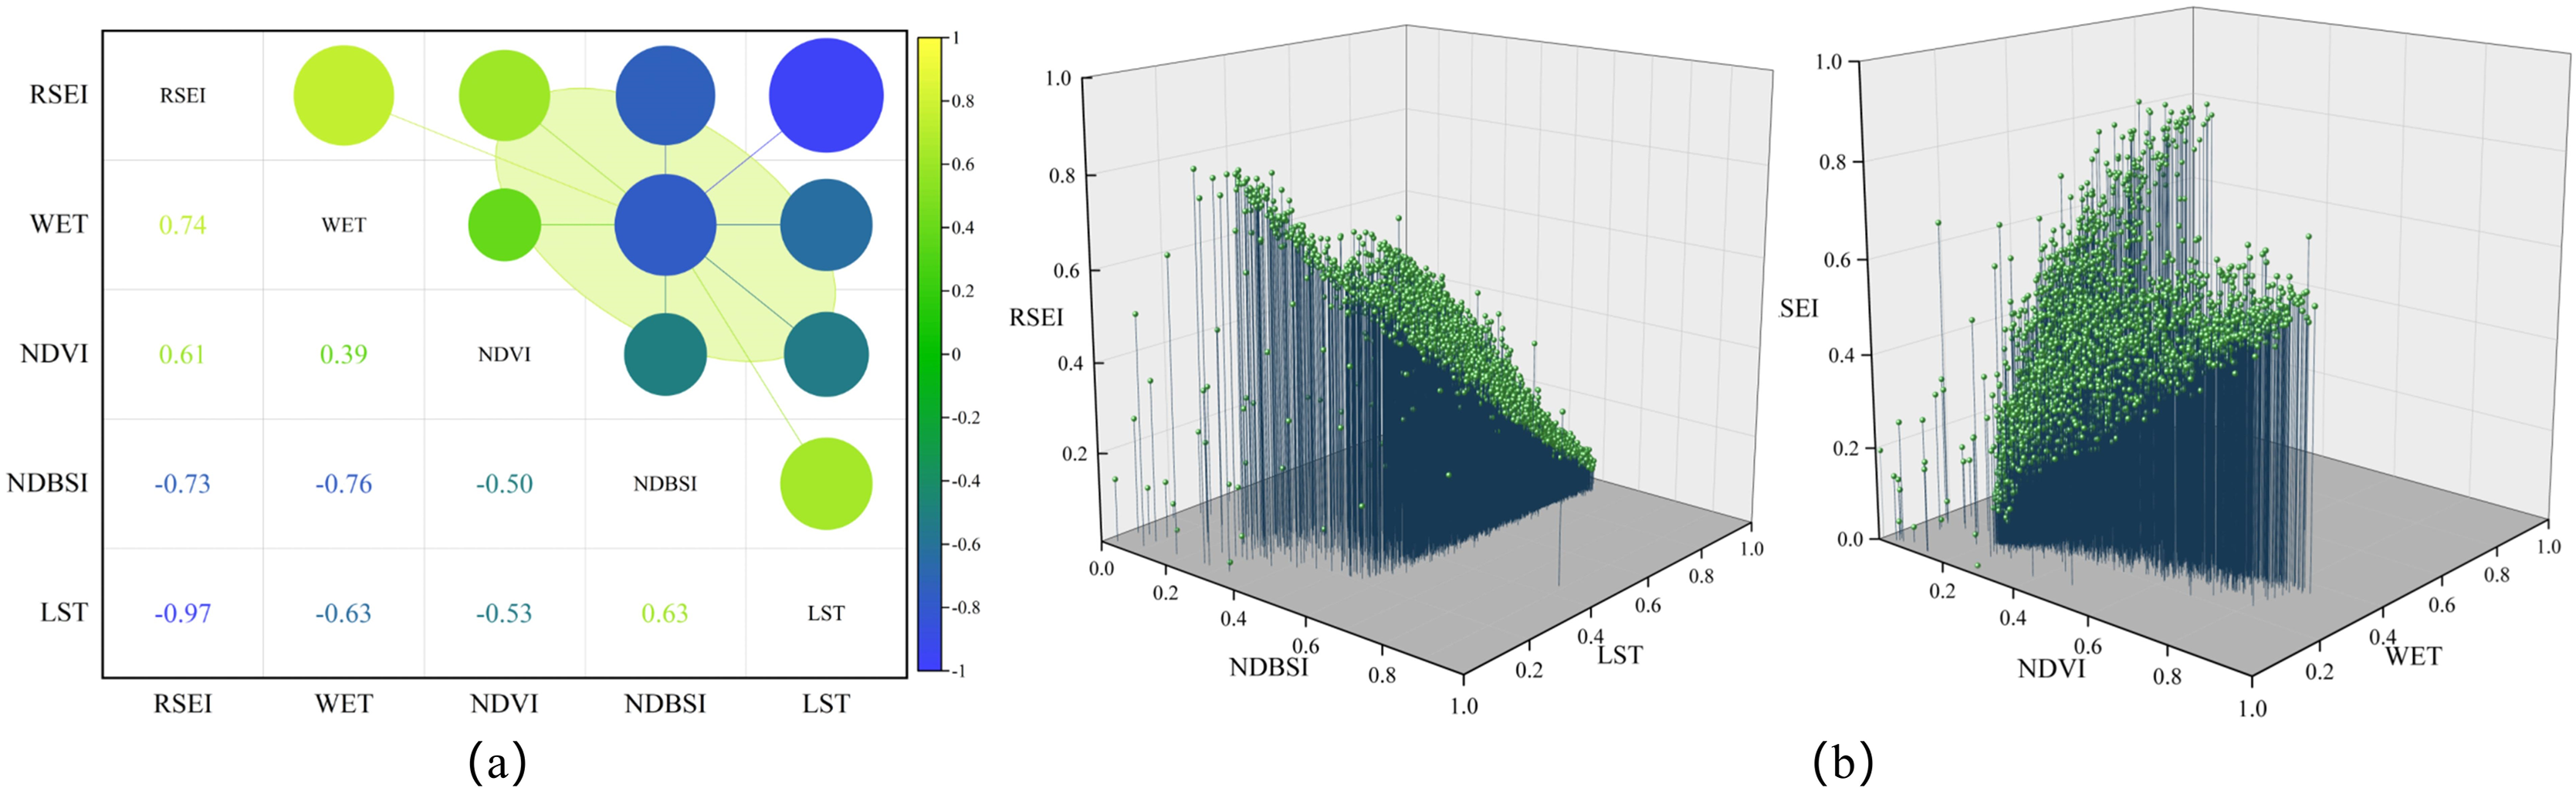
Figure 3A exhibits that the absolute values of the correlation coefficients between the eco-logical factors are in the range from 0.39 to 0.76. Moreover, the RSEI exhibited strong correlations with the ecological factors. The RSEI values showed Spearman correlation coefficients with the WET, NDVI, NDBSI, and LST of 0.74, 0.61, −0.73, and −0.97, respectively. Noteworthy, the correlation coefficients between the indicators and RSEI values were all >0.6. Therefore, RSEI is more representative compared to a single ecological factor, in addition to pooling information from each factor. Figure 3B shows the three-dimensional scatter plot of the four ecological indicators versus RSEI, clearly exhibiting that RSEI is negatively correlated with NDBSI and LST, and positively correlated with NDVI and WET, which is consistent with the results presented in “Principal component analysis of ecological factors”. This is attributed to the fact that NDBSI and LST reflect the indicators of surface temperature and surface aridity of the ecological environment in the study area. Moreover, the increase in surface temperature and aridity directly leads to a series of problems such as intensification of desertification in the watershed and sharp increase in evapotranspiration, which limit the positive development of the quality of the ecological environment. In contrast, NDVI and WET reflect the dense vegetation, rainfall, and soil water environment in the study area, and with the increase in NDVI and WET, the ecological environment of the watershed improves, which promotes the positive development of EEQ.
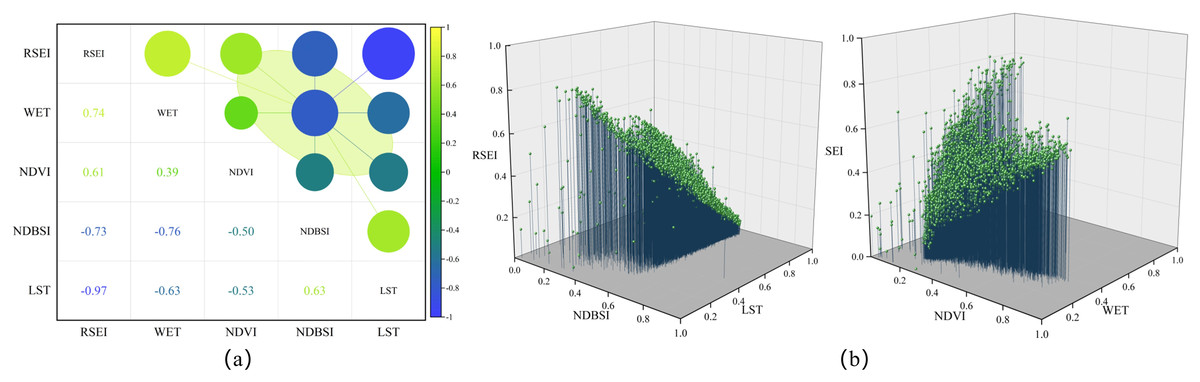
Figure 3: (A) Correlation coefficients between the ecological environmental factors and RSEI; (B) three-dimensional scatter plots.
Analysis of temporal and spatial evolution of ecological environmental quality
To further investigate the EEQ in the study area, the RSEI values were classified into different classes, namely excellent, good, moderate, fair, and poor, with RSEI ranges of 0.8–1, 0.6–0.8, 0.4–0.6, 0.2–0.4, and 0–0.2, respectively (Fig. 4). In general, regions with high RSEI were found to be distributed mainly in high-altitude mountainous areas in the southern, western, and northern parts of the study area. These areas are characterized by the presence of the basin’s headwaters, high vegetation coverage, and intensive anthropogenic activities. On the other hand, the central and eastern desert areas exhibited low RSEI values due to low rainfall amounts and low vegetation coverage.
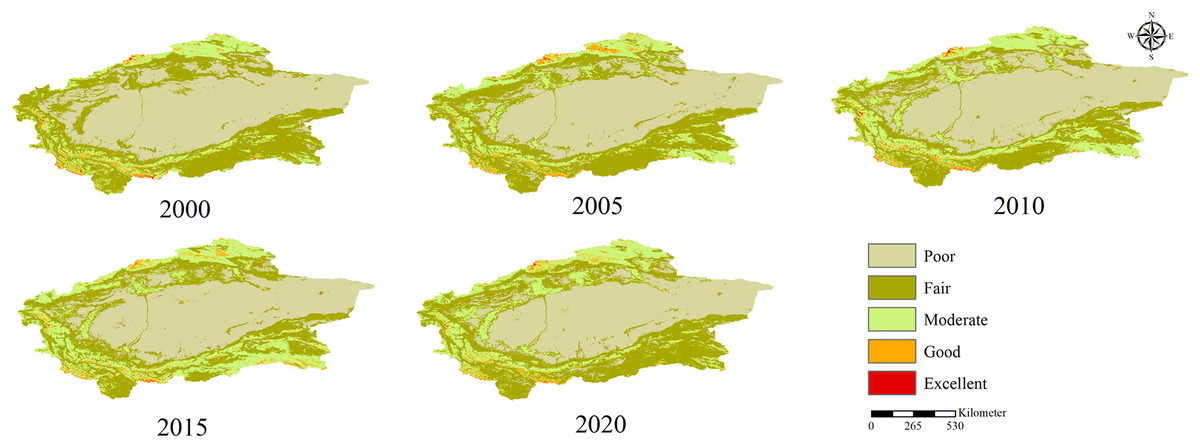
Figure 4: Spatial distributions of the EEQ levels in the Tarim River basin in 2000, 2005, 2010, 2015, and 2020.
Spatial distribution of ecological environment quality in Tarim River basin mapped by ARCGIS. The five colors represent different levels of ecological environmental quality. Poor indicates the worst ecological environment quality, and excellent indicates the best ecological environment quality.Vector boundary maps of the study area were obtained from the Resources and Environment Data Centre of the Chinese Academy of Sciences.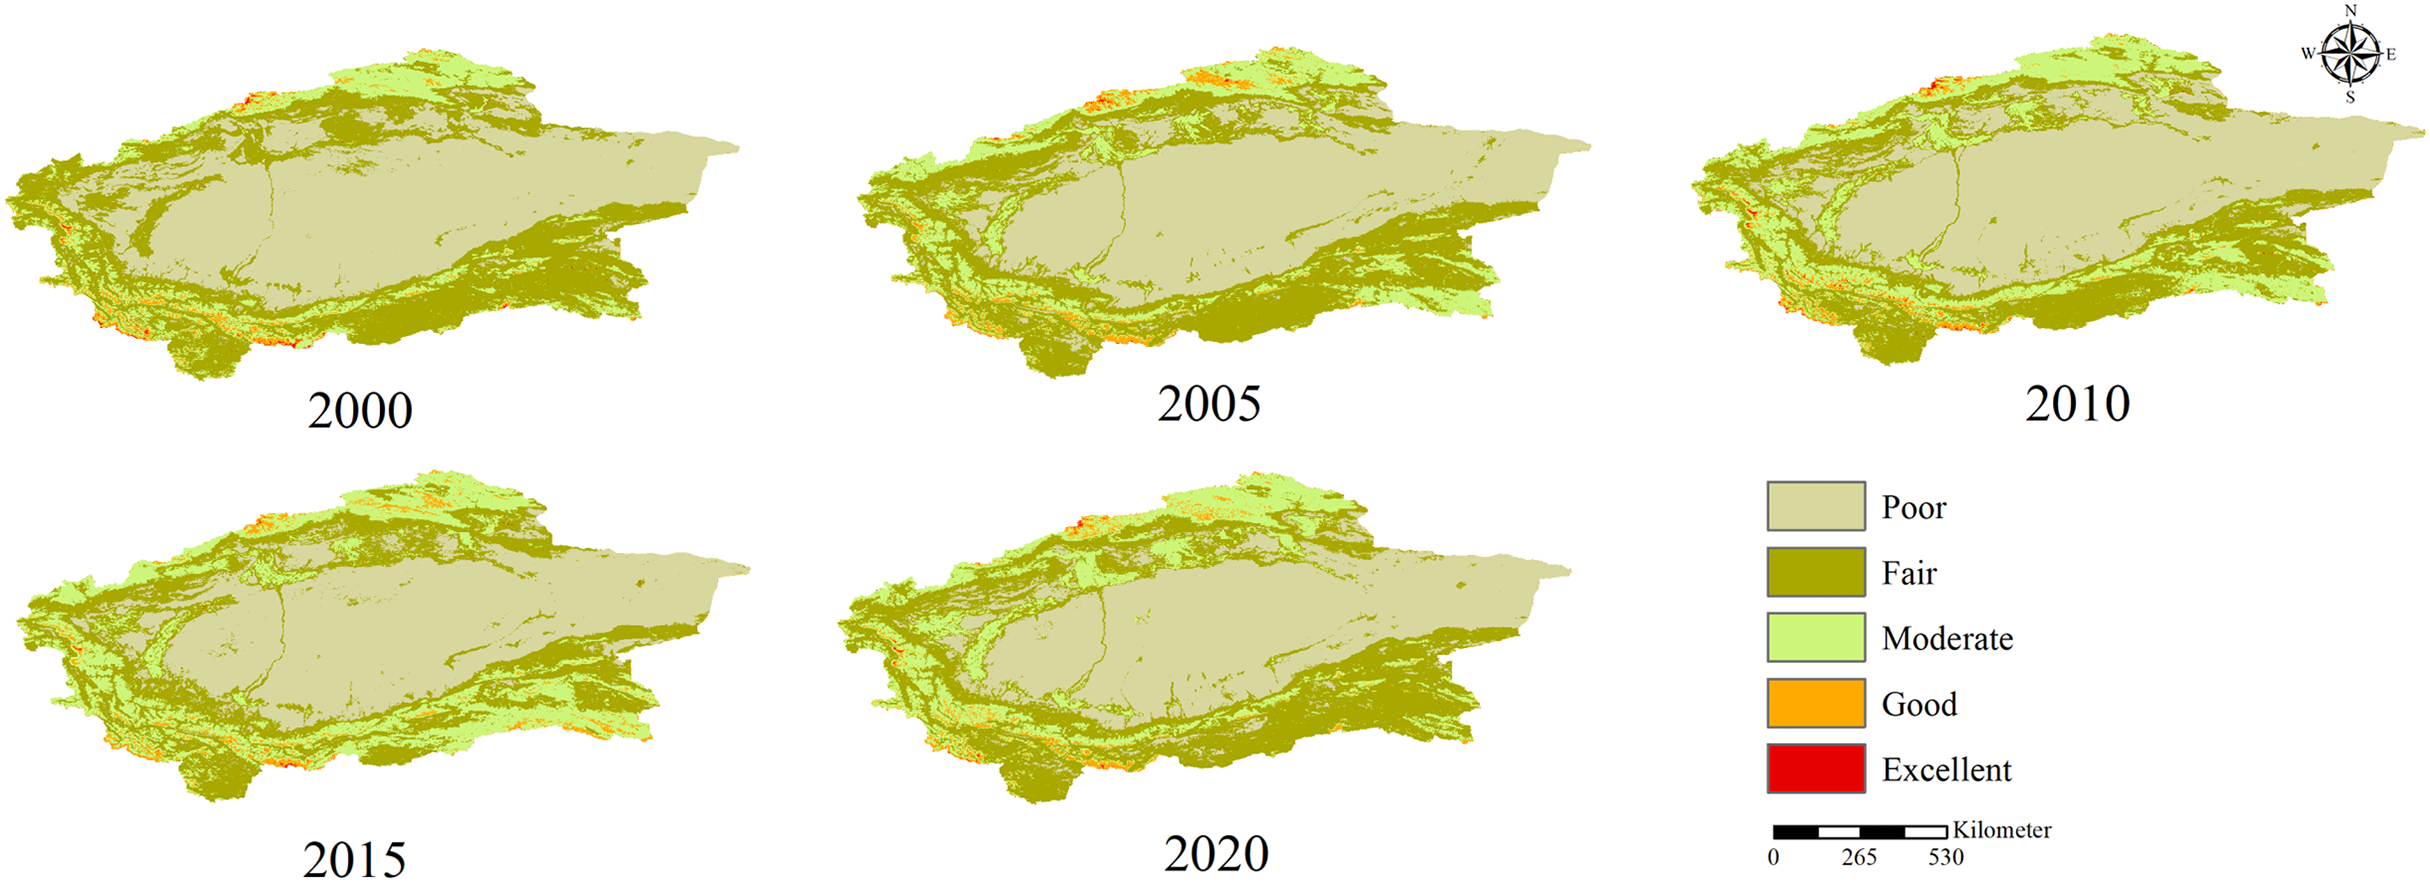
The changes in the average RSEI and the proportion of area in each class in the Tarim River Basin in 2000, 2005, 2010, 2015, and 2020 during the study period are presented in Table 5. The results indicate that the average RSEI in the Tarim River Basin from 2000 to 2020 showed an increasing trend, from 0.22 in 2000 to 0.25 in 2020, which reflects the enhancement in the ecological quality of the region. However, in terms of the proportion of area, the proportion of good and excellent area is very small, and the average RSEI is between 0.2 and 0.3, which is at a relatively low level. These results thus indicate that the ecological environment foundation of the basin is still weak. Therefore, comprehensive management of the Tarim River Basin since 2000 has provided initial results, and the ecological environment of the basin has been basically improved.
| Year | RSEI level (%) | RSEI mean | ||||
|---|---|---|---|---|---|---|
| Poor | Fair | Moderate | Good | Excellent | ||
| 2000 | 50.50 | 35.99 | 11.45 | 1.90 | 0.16 | 0.22 |
| 2005 | 46.59 | 35.87 | 15.18 | 2.29 | 0.07 | 0.24 |
| 2010 | 48.47 | 30.67 | 18.67 | 1.99 | 0.20 | 0.24 |
| 2015 | 45.69 | 30.17 | 21.67 | 2.38 | 0.09 | 0.26 |
| 2020 | 44.73 | 36.22 | 16.91 | 2.07 | 0.07 | 0.25 |
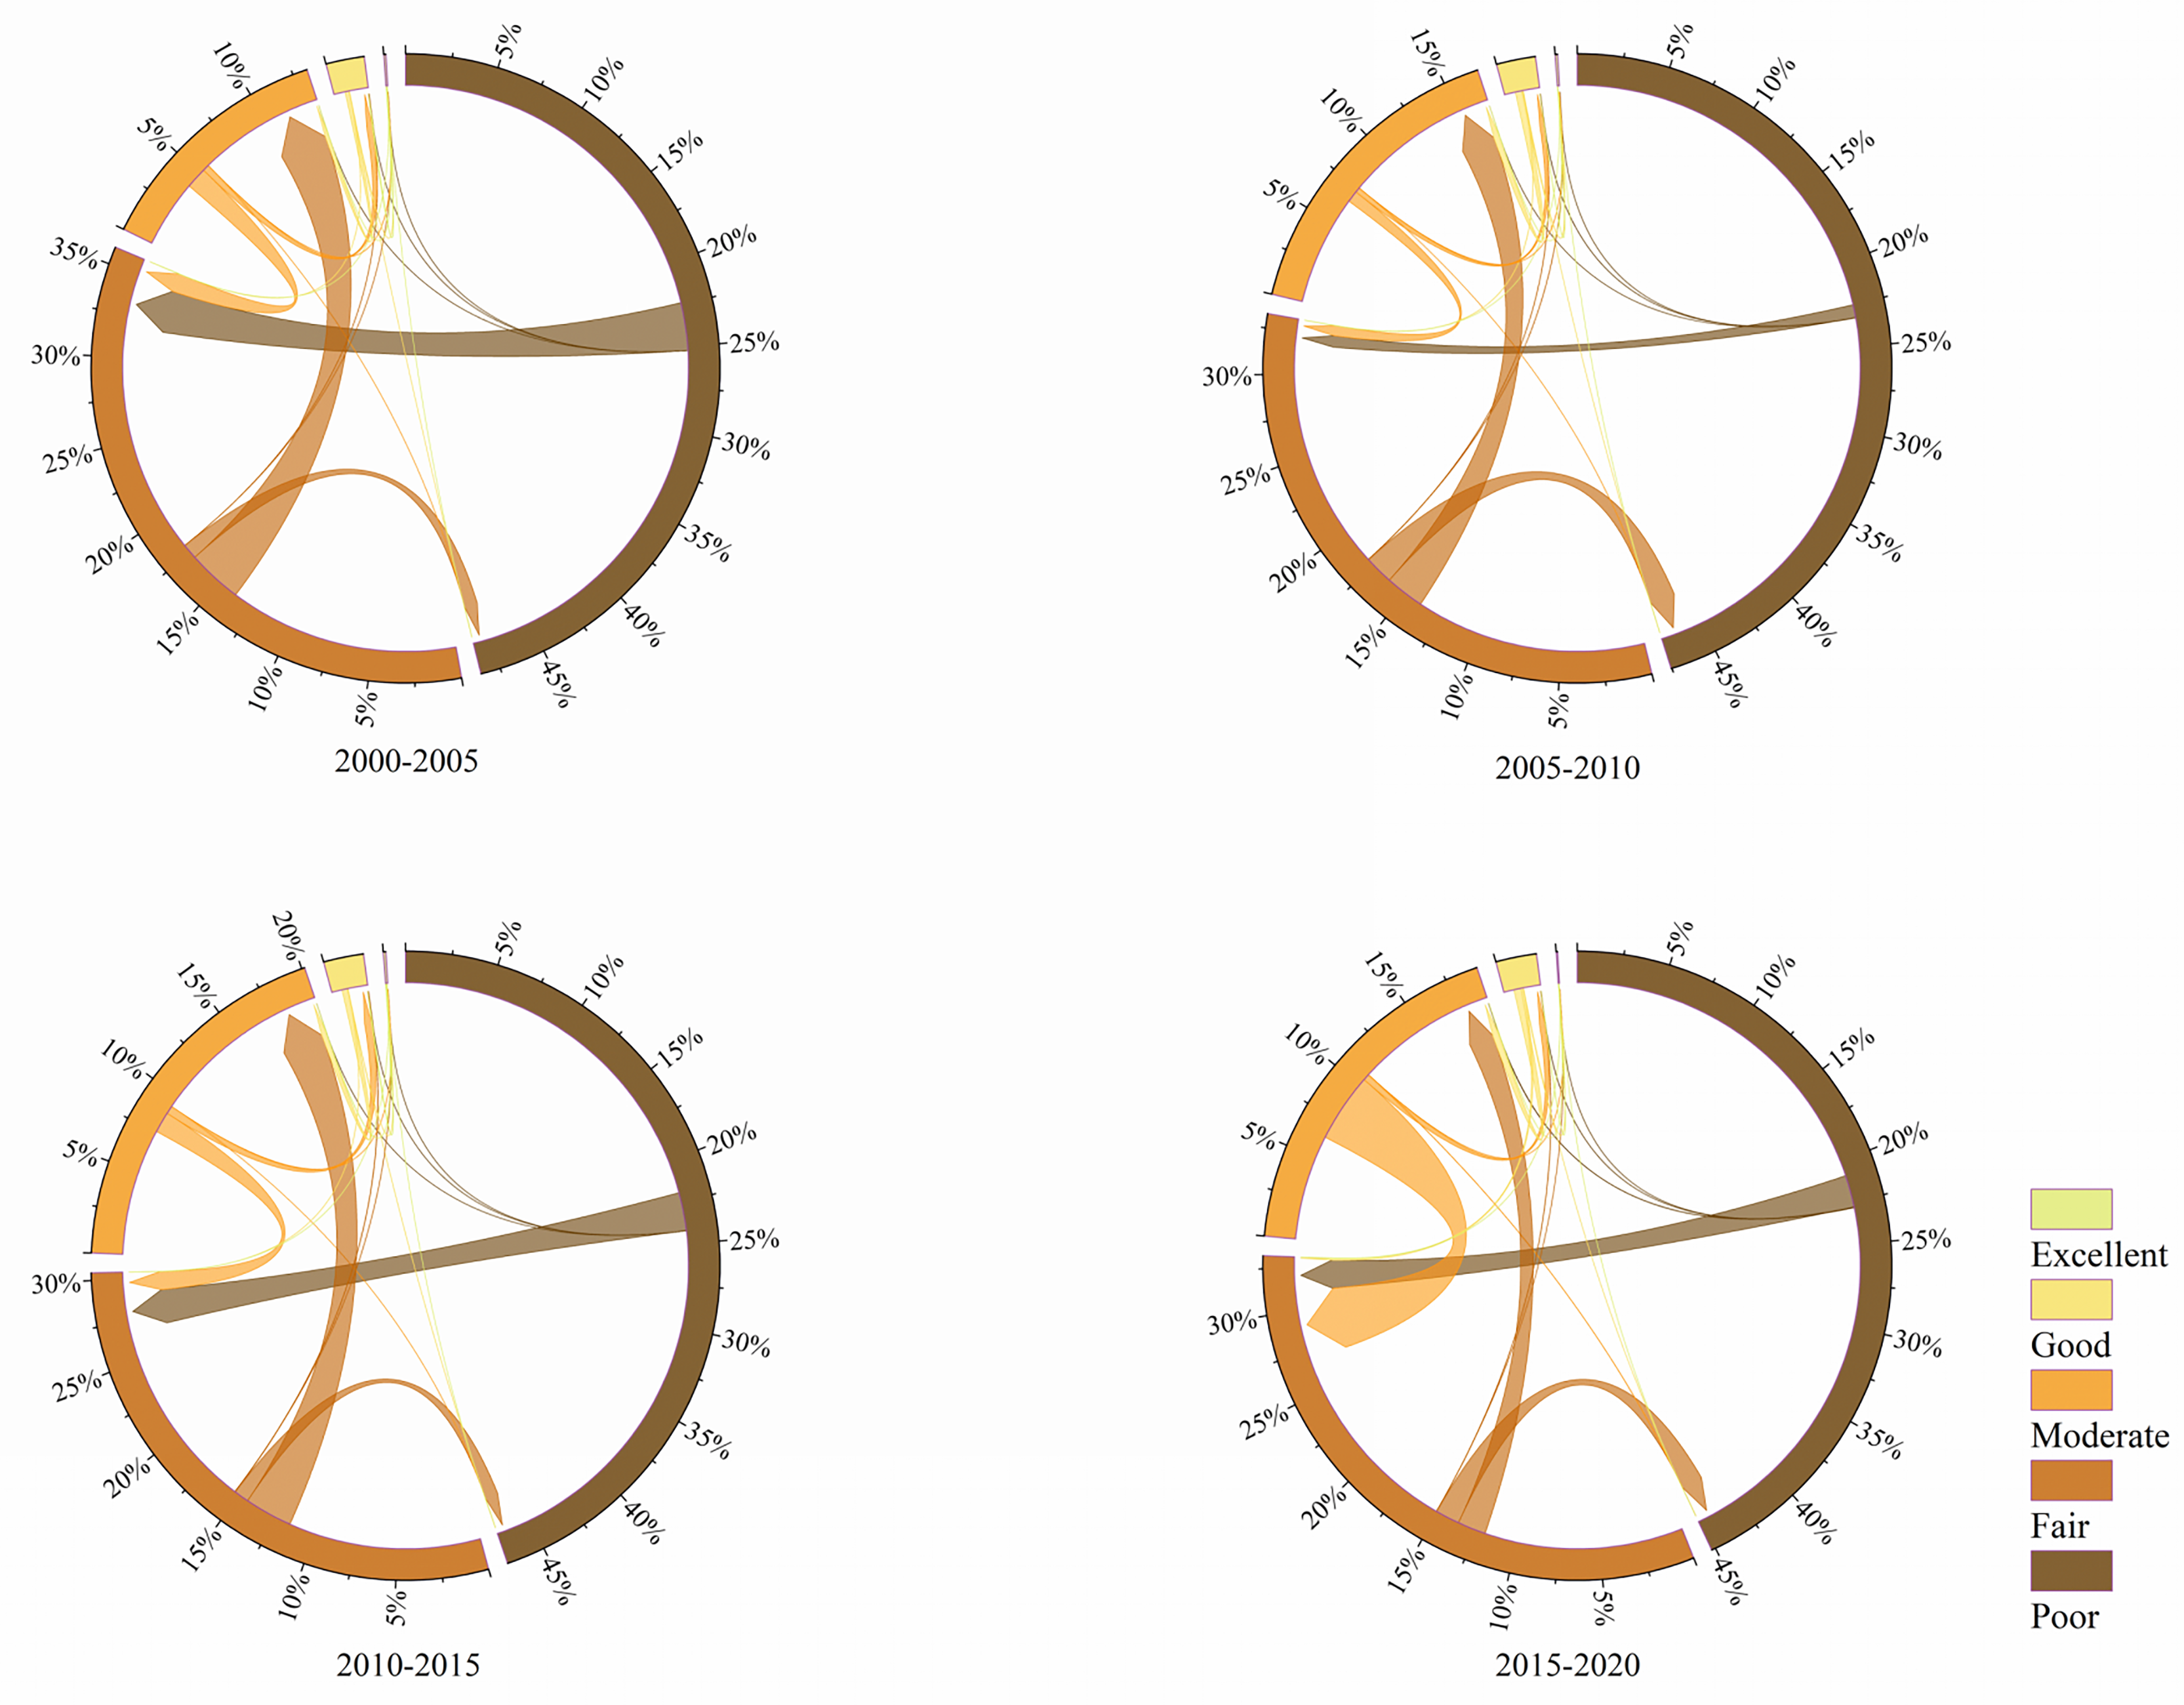
Figure 5 shows the transfer matrix of the EEQ in the study area for 2000, 2005, 2010, 2015, and 2020. These results reveal that the largest transfers were from poor to fair and from fair to moderate over the 2000–2020 period, indicating improvement in the EEQ. However, the proportion of the area converted from moderate to fair RSEI classes increased significantly from 2015 to 2020, which is consistent with the decrease in the average RSEI value over the same period (2015 to 2020). Overall, the proportion of areas with poor RSEI in the basin decreased from 50.7% to 44.73% from 2000 to 2020, resulting in a slight increase in the fair class area. The proportion of areas with moderate RSEI also increased from 11.45% to 16.91%. This increase was due to the conversion of fair RSEI areas to moderate RSEI areas.
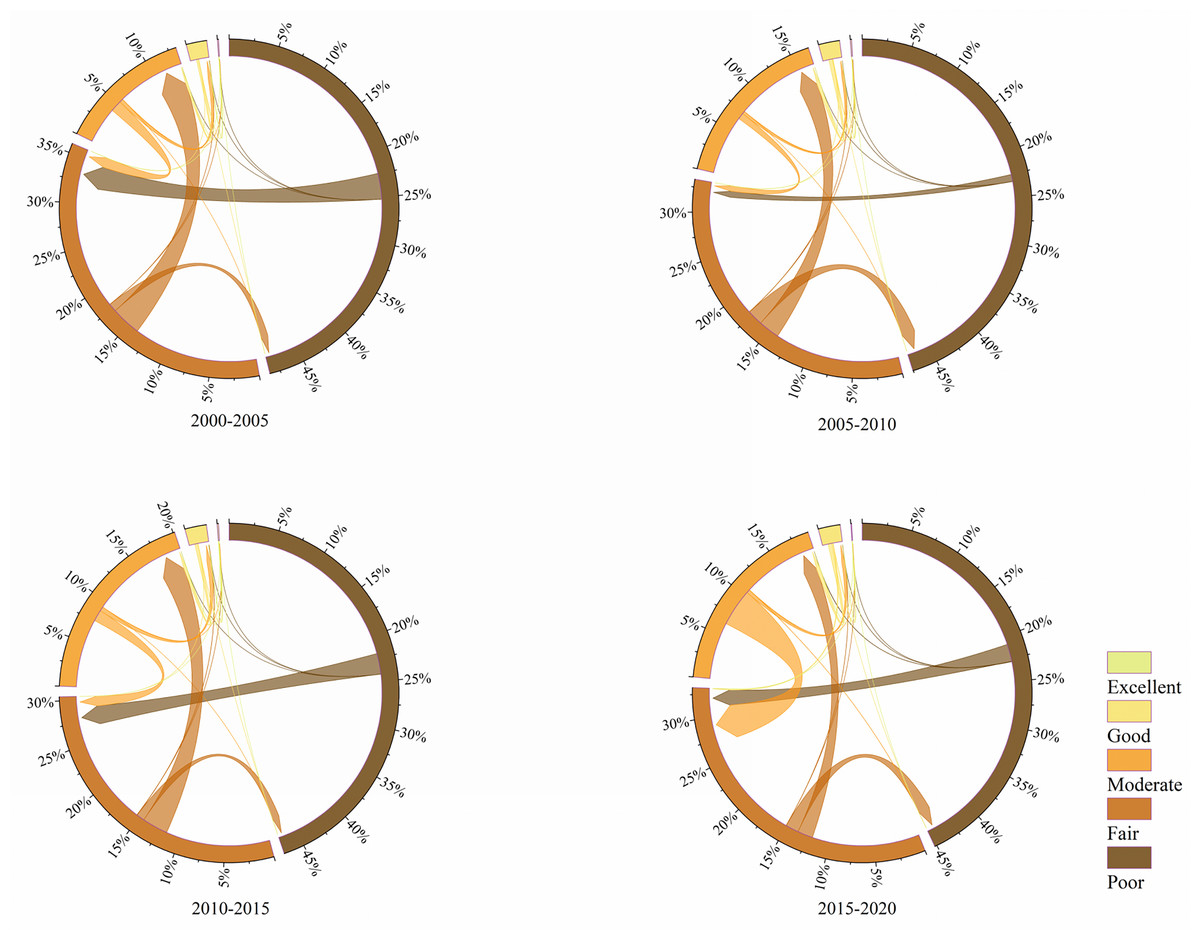
Figure 5: Transfer matrix of the RSEI for the Tarim River Basin from 2000 to 2020.
Characteristics of RSEI spatial aggregation in the study area
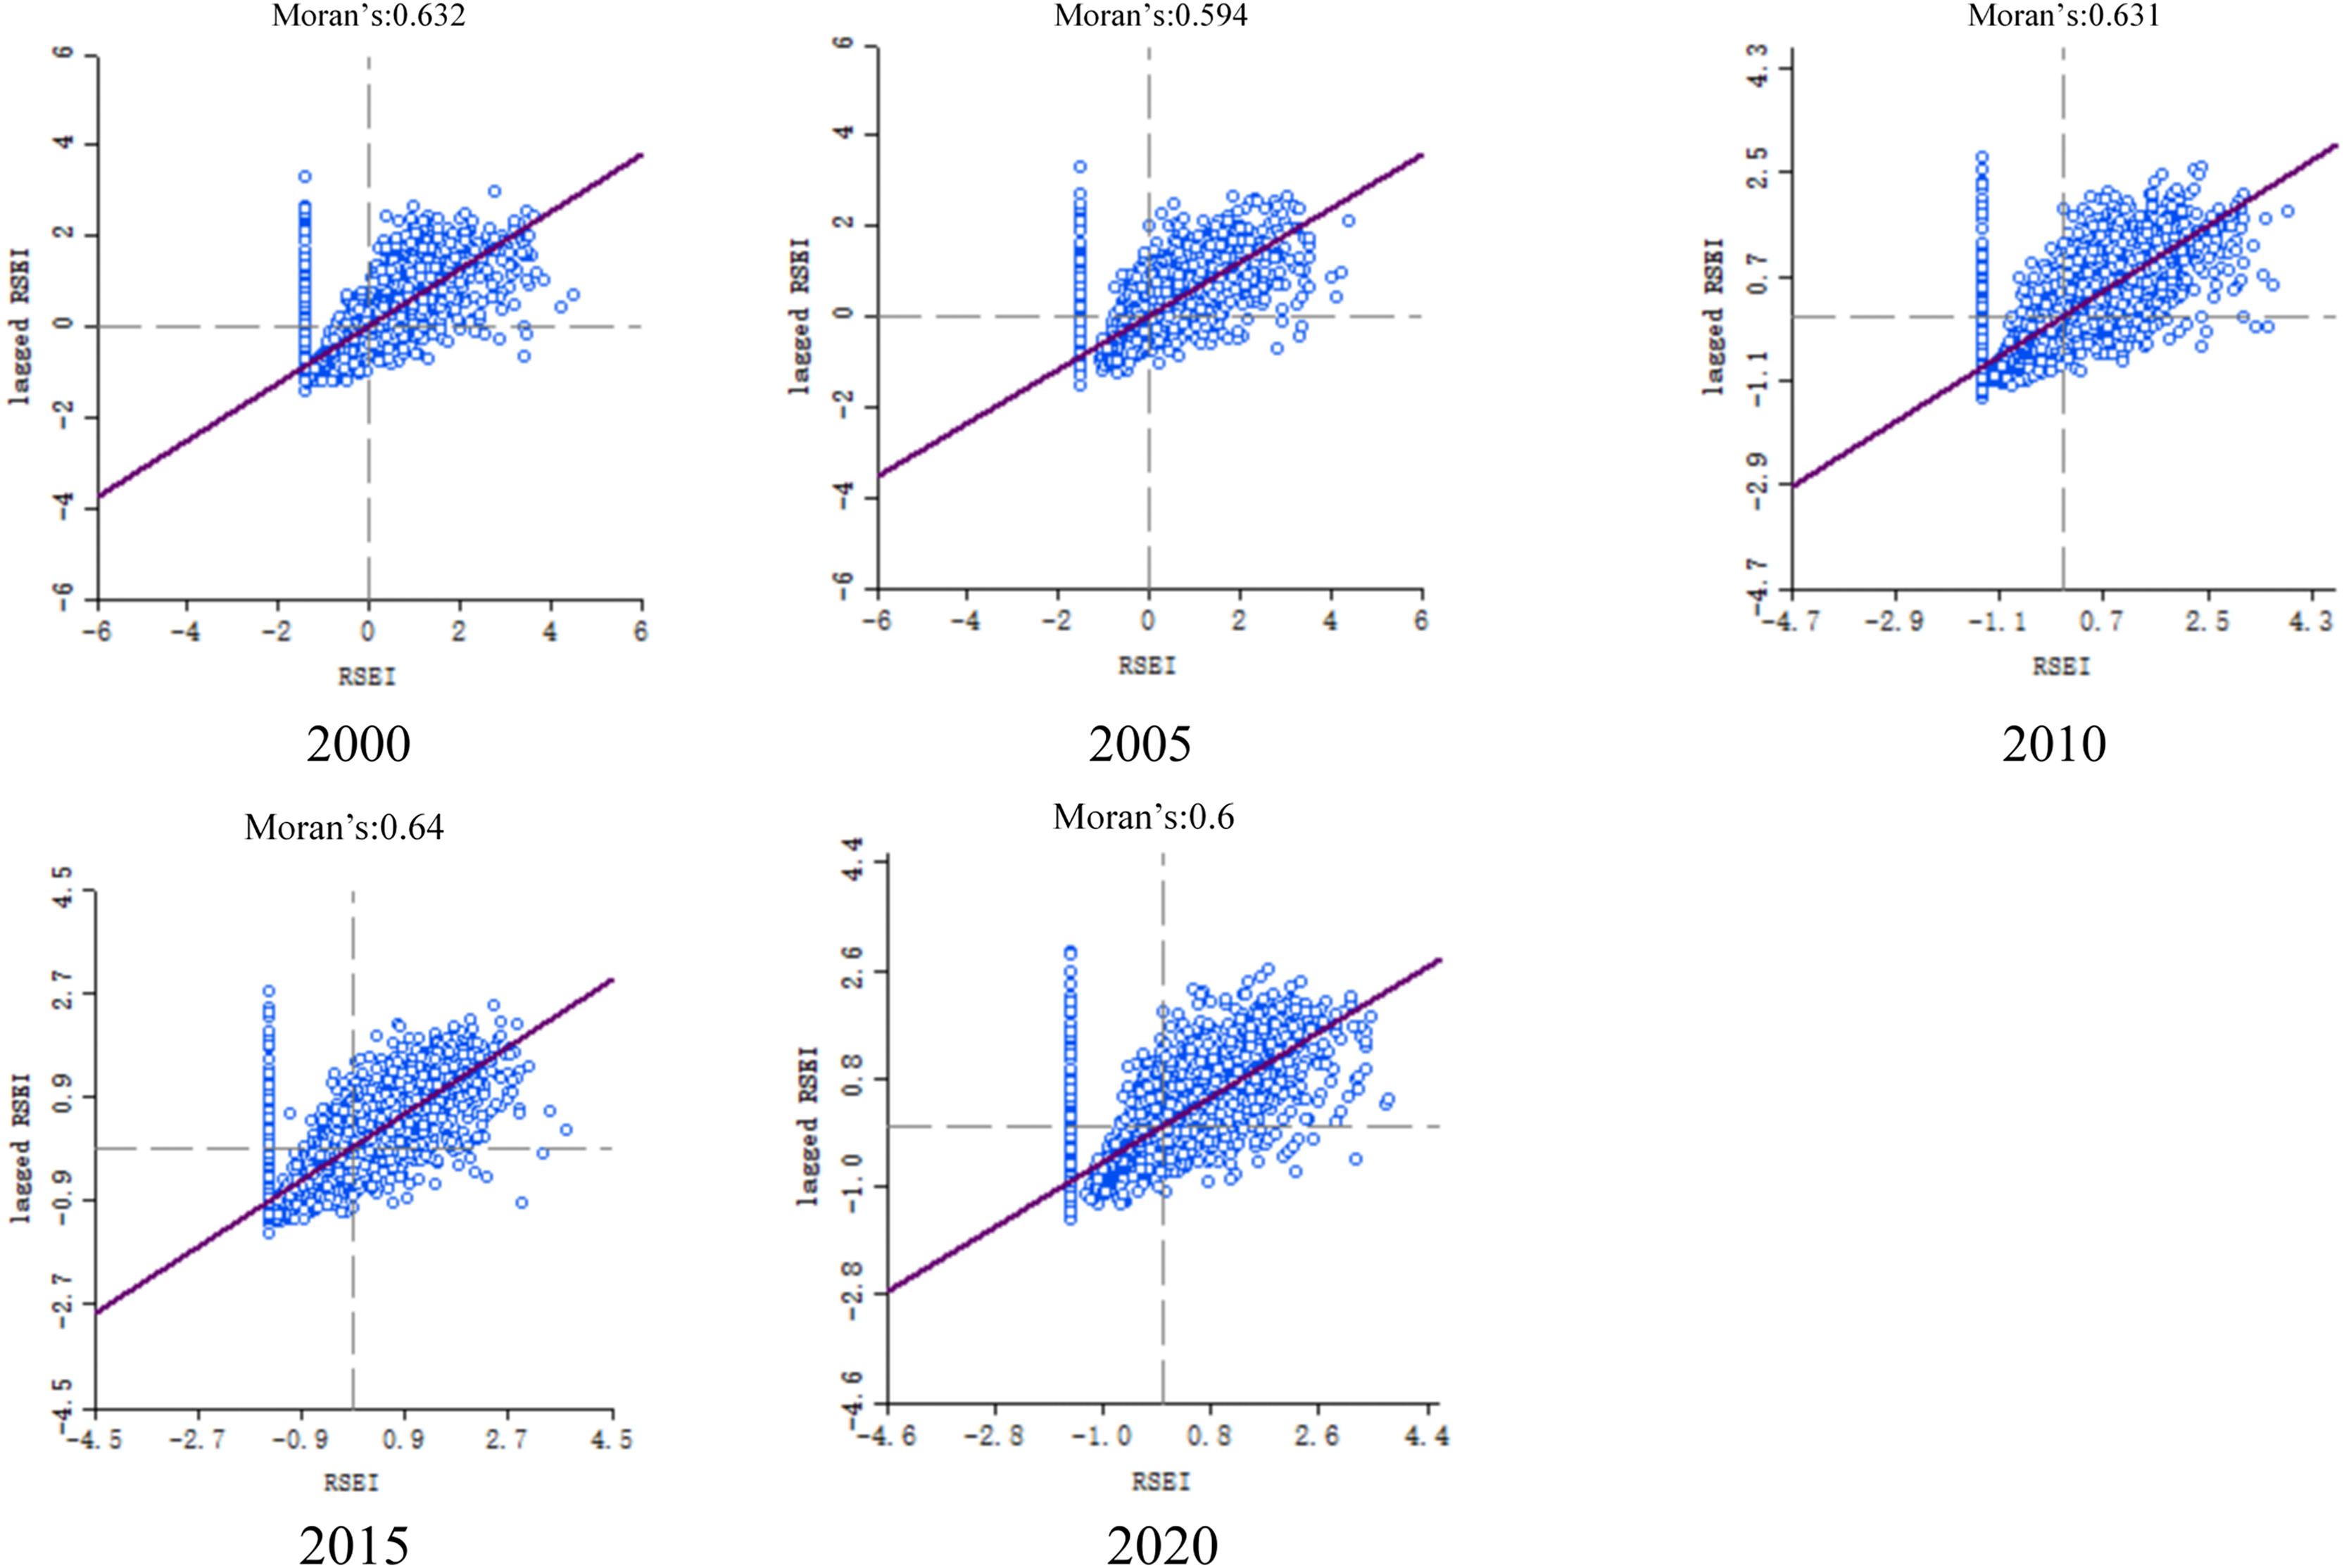
In this study, Local and Global Moran’s I value were computed to further investigate the spatial autocorrelations of the RSEI. Figure 6 shows the Moran’s I scatter plots of the RSEI. The Global Moran’s I value exceeded 0. Most of the calculated values were found to be mainly plotted in the first and third quadrants. The first and third quadrants represent the H–H and L–L clusters, respectively. On the other hand, the second and fourth quadrants represent the H–L and L–H clusters, respectively. The obtained results revealed a positive auto-relationship of the EEQs of the basin with significant spatial clustering. Moreover, Moran’s I decreased from 0.632 to 0.6 from 2000 to 2020, implying a decrease in the overall spatial aggregation of the RSEI.
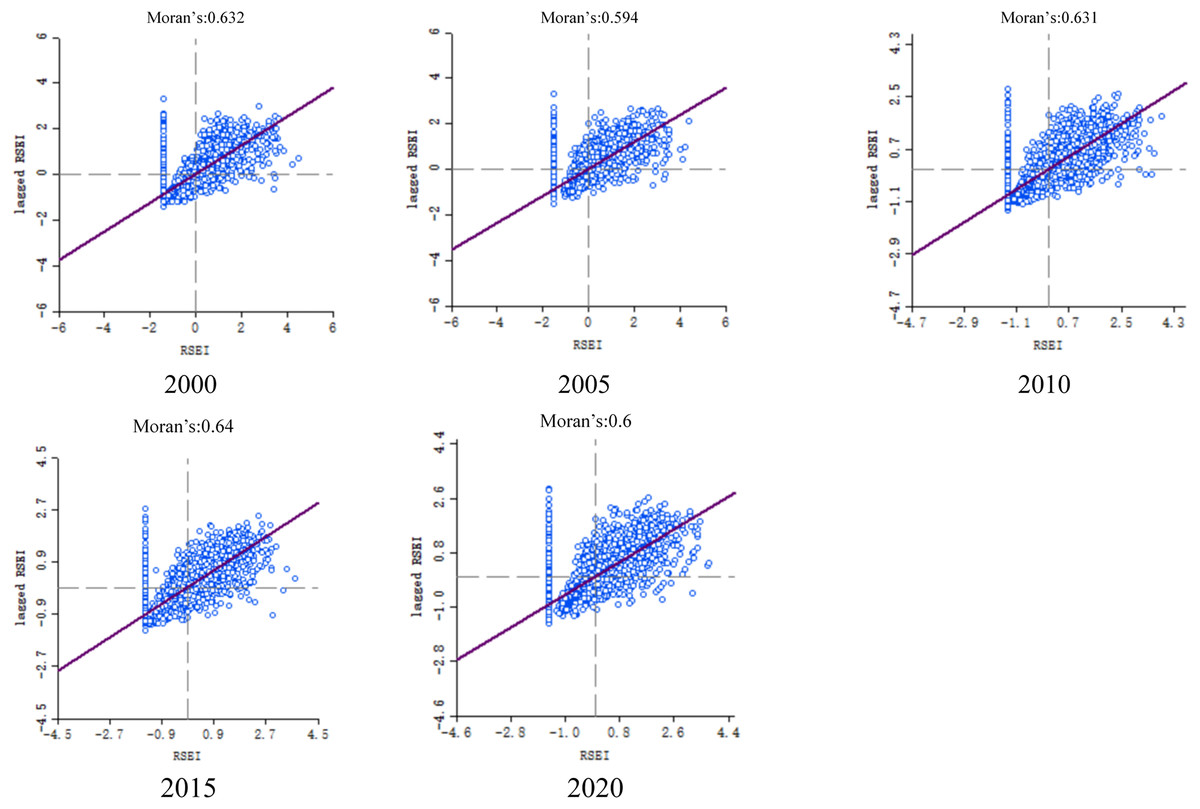
Figure 6: Moran’s I scatter plots of the RSEI for the Tarim River Basin over the 2000–2020 period.
The local indicators of spatial association (LISA) cluster map demonstrated a relatively stable spatial allocation of the environmental quality in the study area (Fig. 7). The H–L and L–H aggregation areas were more dispersed, while the H–H and L–L aggregation areas were more clustered. The H–H aggregation regions were mainly observed to be situated in high-elevation areas in the northern, western, southwestern, northwestern, and southern parts of the basin. On the other hand, the L–L aggregation regions were mainly situated in the central and eastern low-elevation areas. Significant decrease and increase in the H–H and L–L clustering areas were observed in the southern high-altitude and central low-altitude parts of the basin, respectively, over the 2000–2005 period, indicating deterioration in the EEQ. From 2005 to 2015, a relatively stable spatial distribution of the L–L aggregation regions was observed, while the H–H aggregation regions increased significantly in the high-altitude areas in the southern part of the basin. From 2015 to 2020, the H–H clustering area decreased significantly in the southern high-altitude region, while the H–H clustering area increased significantly in the northern high-altitude region. This finding indicates unstable EEQ in these areas, with higher vulnerability to natural and human disturbances.
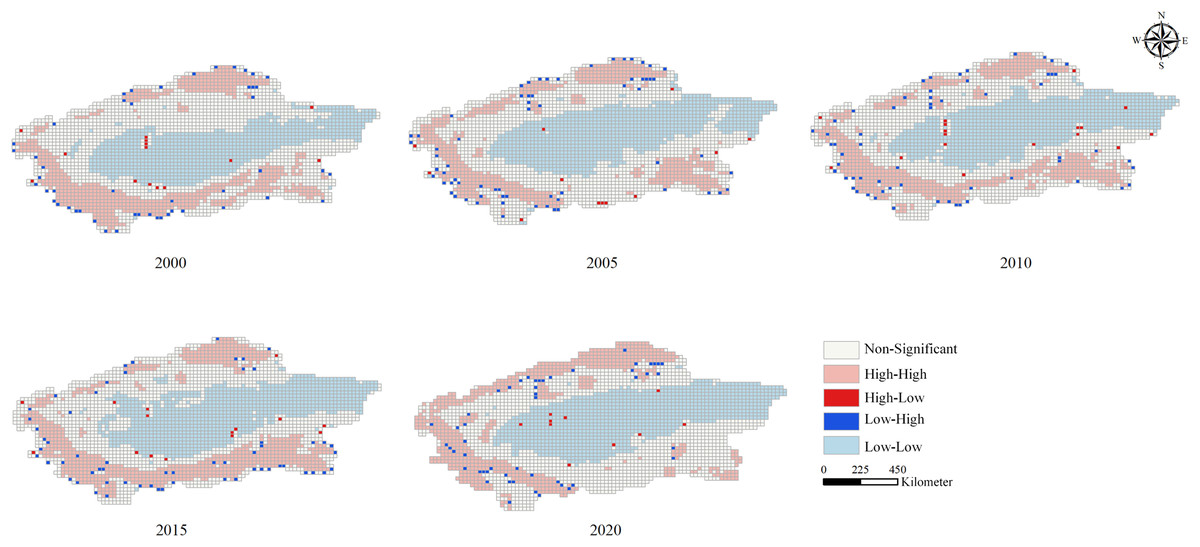
Figure 7: Local indicators of spatial association (LISA) maps of the RSEI for the Tarim River Basin.
The non-significant class indicates the absence of any significant spatial relationship between the EEQ sampling values and those of the surrounding region. The L–L class indicates that the EEQ values and those of the surrounding region are low. The L–H class indicates that the EEQ values are low, while those of the adjacent region are high. The H–L class indicates that the EEQ values are high, while those of the adjacent region are low. The H–H class indicates that the EEQ values and those of the surrounding region are high. Vector boundary map data of the study area were obtained from the Resources and Environment Data Centre of the Chinese Academy of Sciences.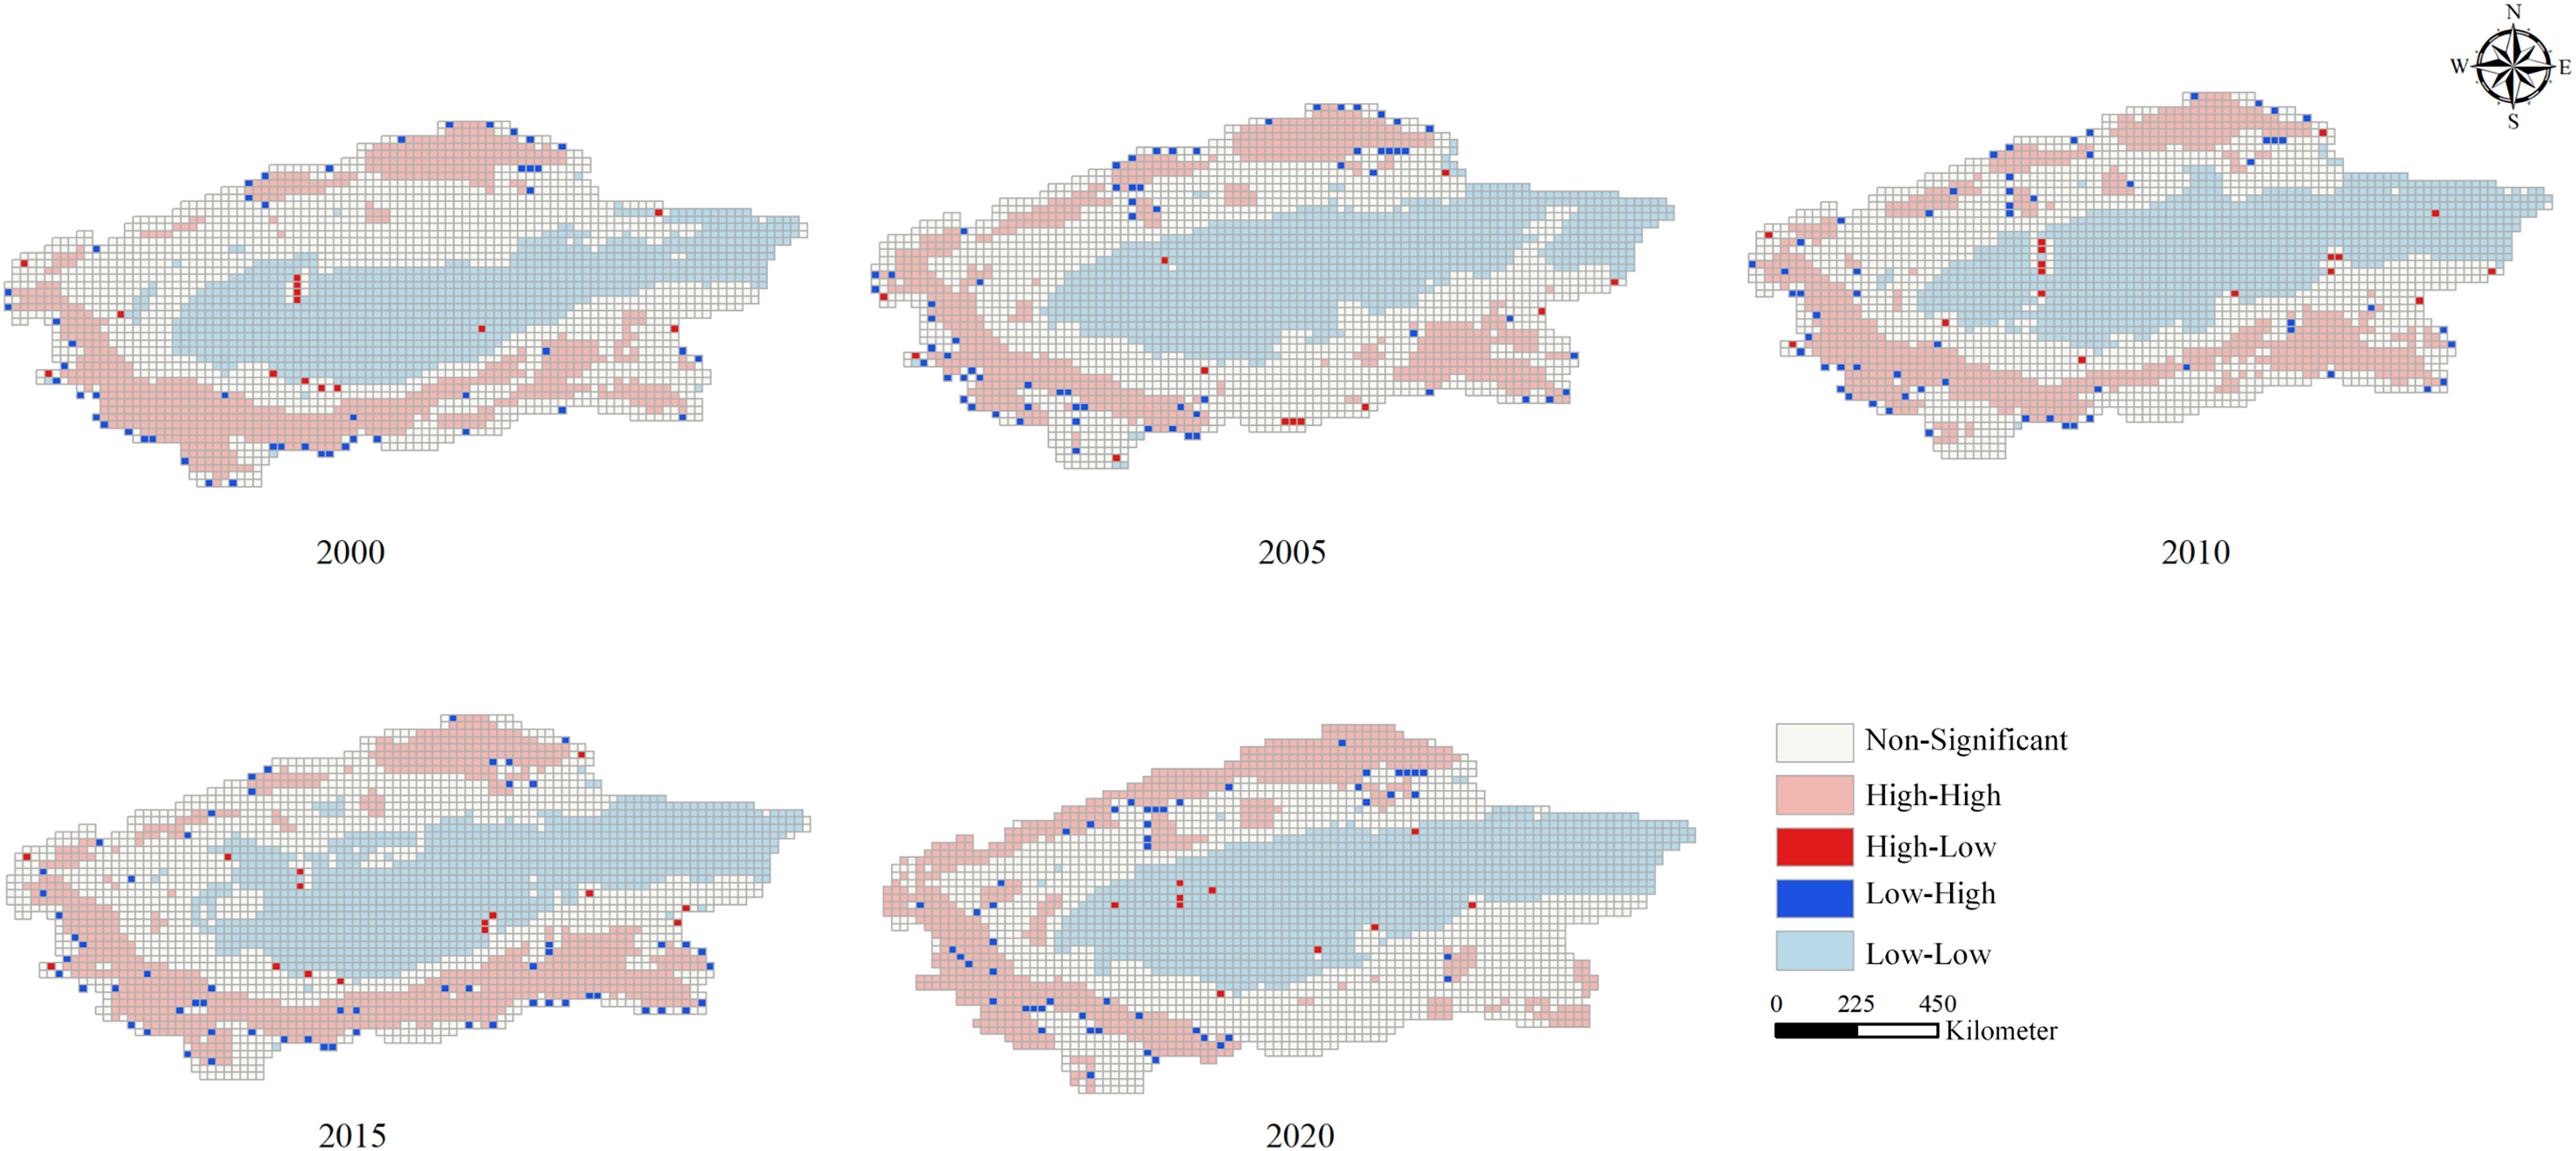
Analysis of driving factors of ecological environmental quality
Single-factor detection results
The Geodetector-based single-factor detection results are presented in Table 6. The LST was the main controlling factor, exhibiting the strongest impact on the EEQ in the study area, with an average annual q-value of over 0.9. On the other hand, the slope aspect showed the lowest impact on the EEQ in the study area. Noteworthy, although most of the driving factors did not fluctuate significantly over the study period, an increase in the NDBSI value was observed from 0.3827 in 2000 to 0.5561 in 2020. This increase led to a change in the importance ranking of the NDBSI from fifth in 2000 to third in 2020. These results suggest significant increase in the built-up and bare soil areas in the basin over the 2000–2020 period, increasing the negative effects on the ecological environment of the basin. In general, the LST, NDVI, WET, NDBSI, and altitude were found to be the major factors affecting the changes in the EEQ in the study area. In contrast, comparatively weaker explanatory powers of the slope, land use, and slope aspect were found on the EEQ in the basin.
| Driving factor | 2000 | 2005 | 2010 | 2015 | 2020 | Rank | |||||
|---|---|---|---|---|---|---|---|---|---|---|---|
| q | p | q | p | q | p | q | p | q | p | ||
| WET | 0.5822 | 0 | 0.63 | 0 | 0.5436 | 0 | 0.4727 | 0 | 0.5929 | 0 | 3 |
| NDVI | 0.4406 | 0 | 0.5812 | 0 | 0.5761 | 0 | 0.4839 | 0 | 0.4291 | 0 | 4 |
| NDBSI | 0.3827 | 0 | 0.5702 | 0 | 0.4897 | 0 | 0.3847 | 0 | 0.5561 | 0 | 5 |
| LST | 0.9332 | 0 | 0.9009 | 0 | 0.9146 | 0 | 0.9239 | 0 | 0.8679 | 0 | 1 |
| Land use | 0.2695 | 0 | 0.3149 | 0 | 0.2814 | 0 | 0.2541 | 0 | 0.3269 | 0 | 7 |
| Slope | 0.3288 | 0 | 0.2863 | 0 | 0.3088 | 0 | 0.2965 | 0 | 0.2656 | 0 | 6 |
| Slop direction | 0.0073 | 0 | 0.0049 | 0 | 0.0046 | 0 | 0.0059 | 0 | 0.0047 | 0 | 8 |
| DEM | 0.6329 | 0 | 0.5225 | 0 | 0.5811 | 0 | 0.6188 | 0 | 0.4236 | 0 | 2 |
Interactive detection results
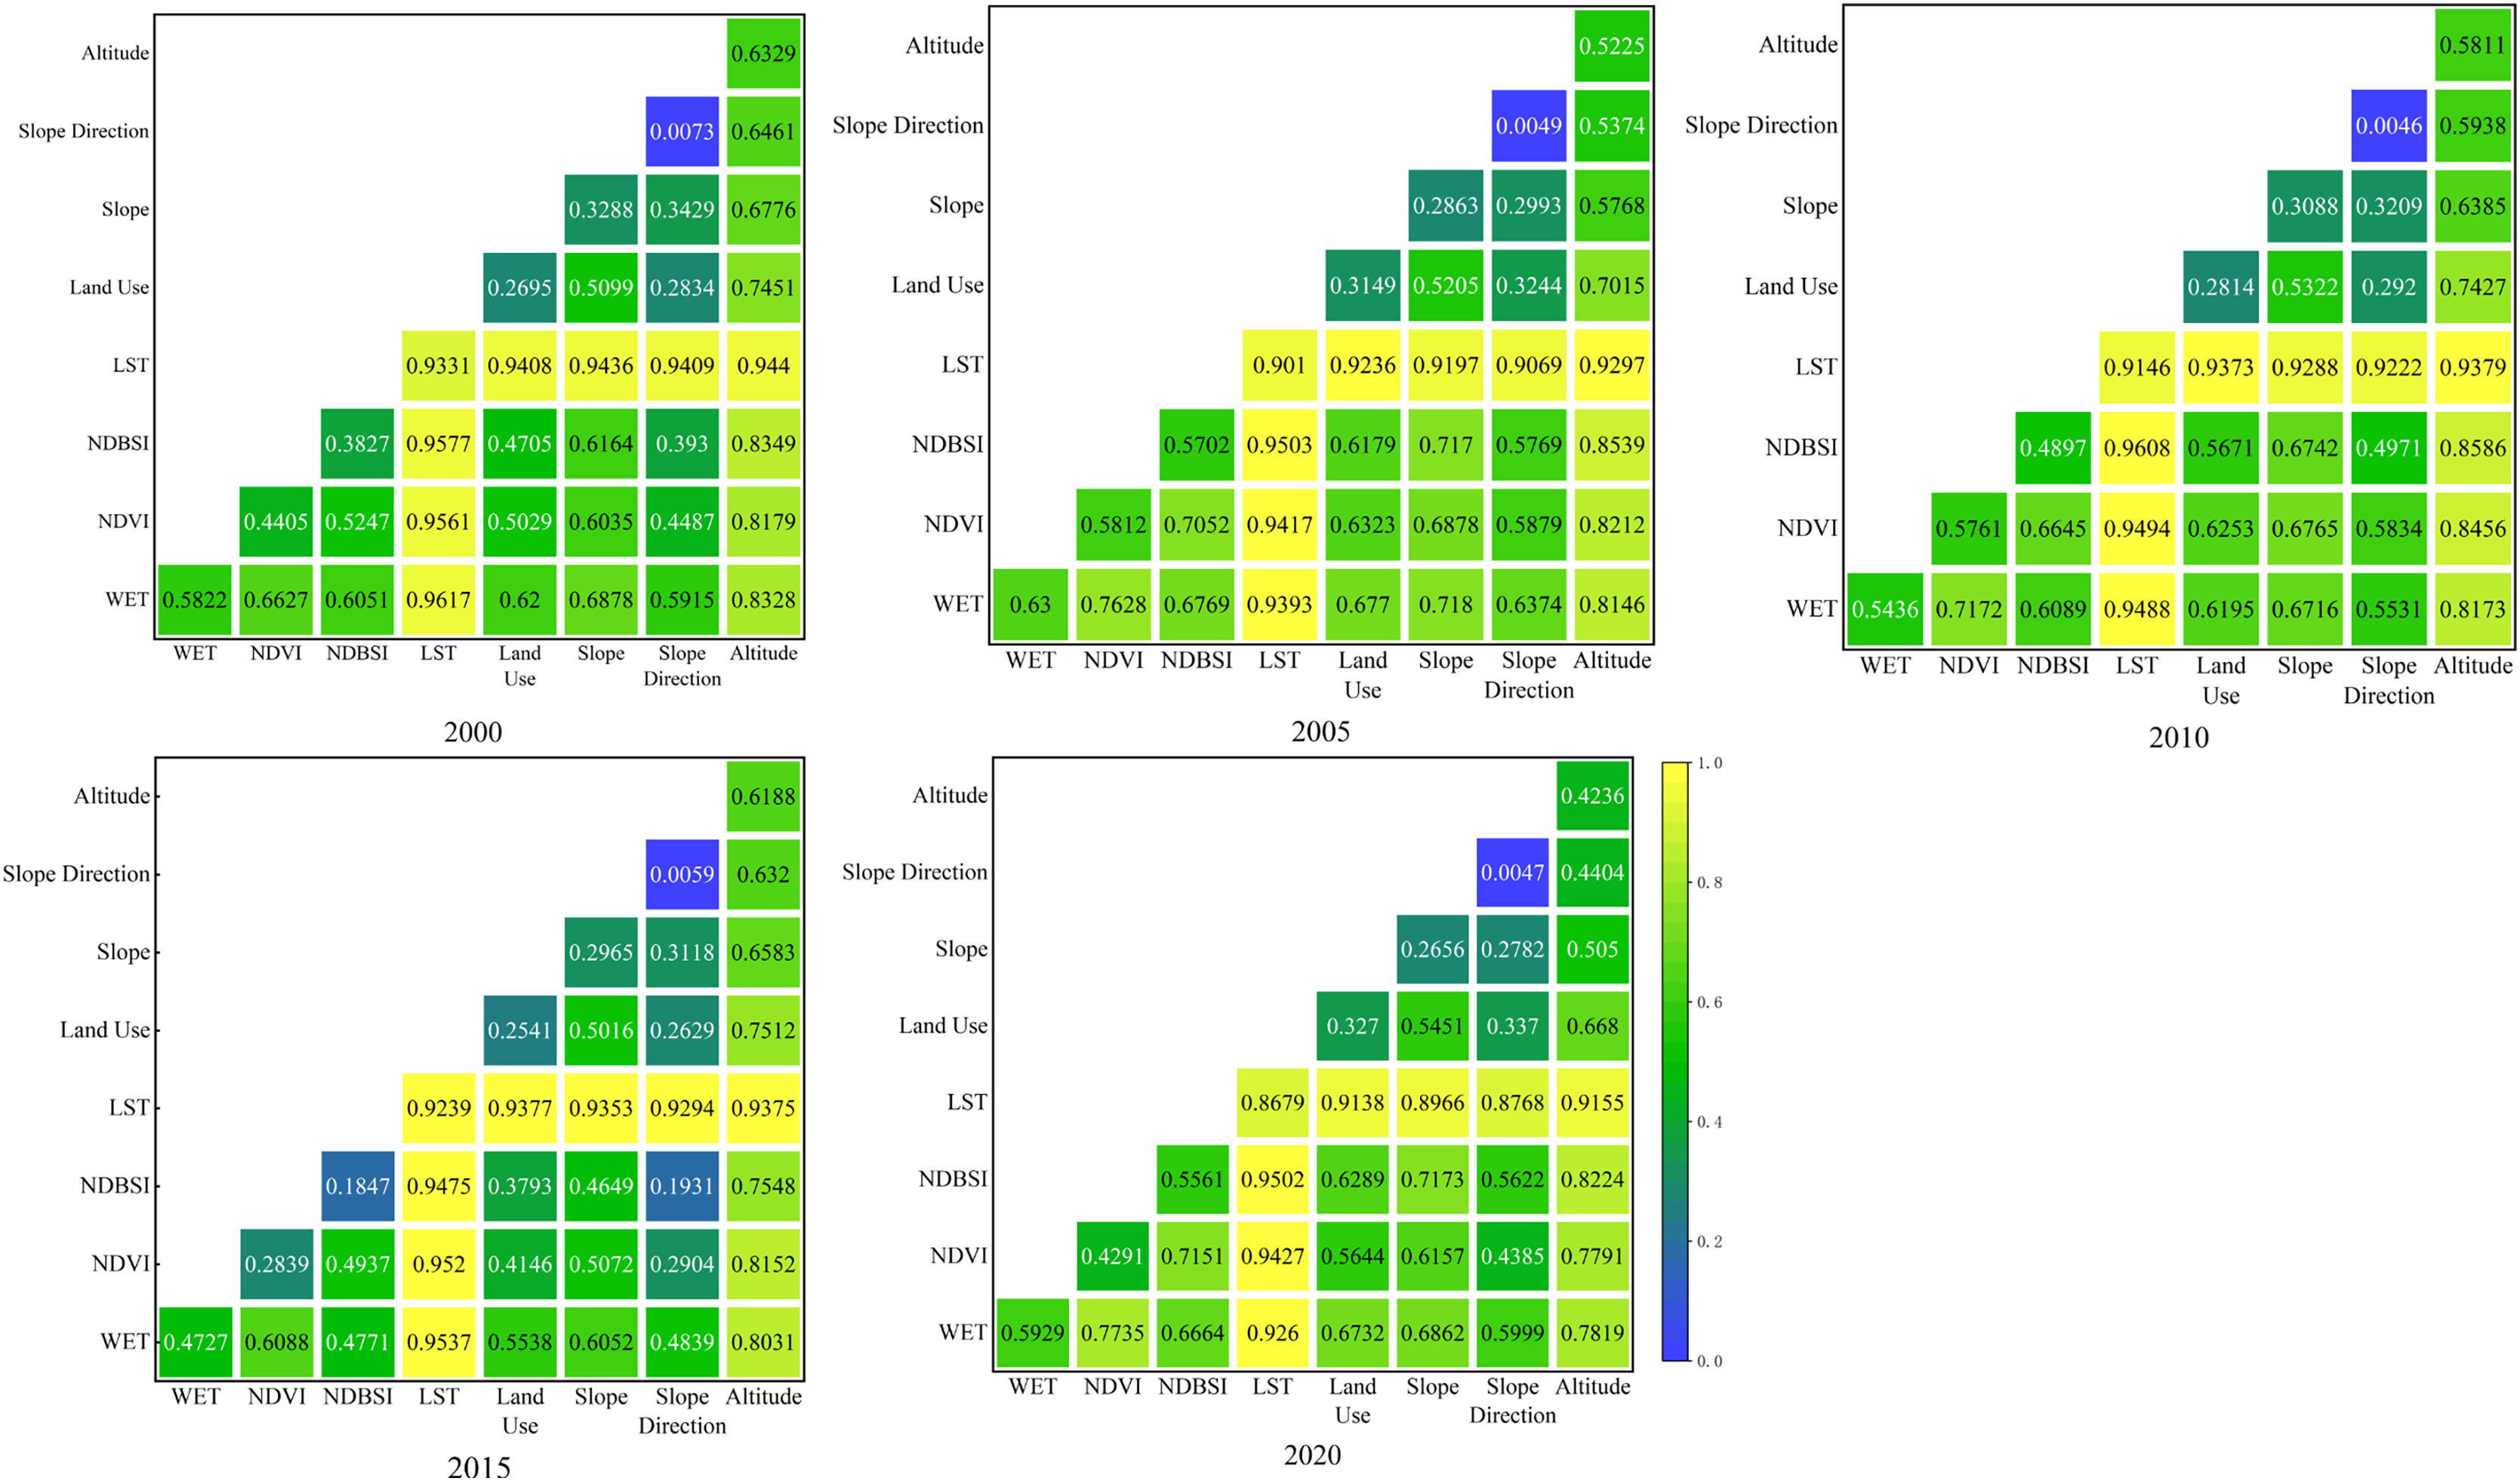
The interactive detection results of the dependent variable (RSEI) with the eight independent variables in the basin in 2020, 2015, 2010, 2005, and 2000 are shown in Fig. 8. The results showed two detection types, namely enhanced two-factor and nonlinear enhanced detections. The two-factor interaction type was more sensitive to the changes in the EEQ in the basin compared with the single-factor detection type.
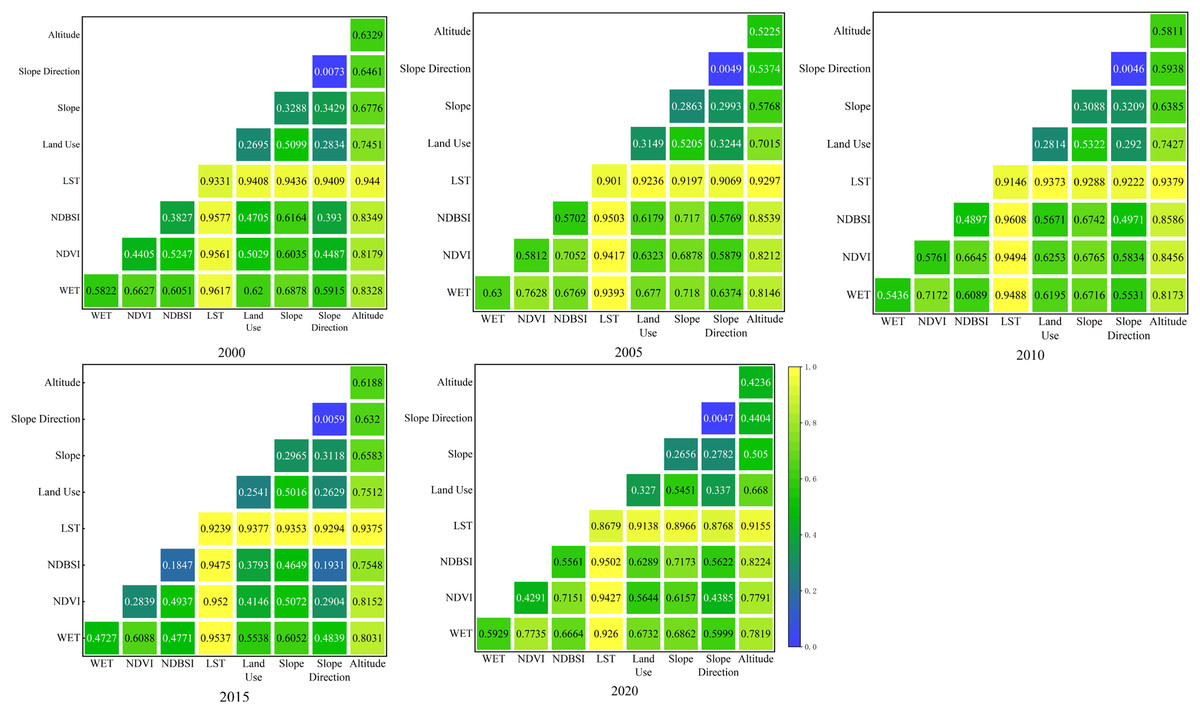
Figure 8: Geodetector based interactive detection results in the Tarim River basin from 2000 to 2020.
The strongest interactions were observed between the LST and WET in 2000 and 2015 (q = 0.9617, q = 0.9537), as well as between the LST and NDBSI in 2005, 2010, and 2020 (q = 0.9503, q = 0.9608, q = 0.9502) (Fig. 8). The interactions between the LST and the other driving factors were also highly significant, with an average q value of over 0.9. This finding indicates that changes in the LST strongly impacted the spatial distribution of EEQ in the basin. Moreover, although the land use types exhibited the lowest single impact on the EEQ, they showed significant two-factor detection-based effects on the EEQ in the study area. This indicates the indirect impacts of the land use changes on the EEQ by directly influencing the other driving factors. Among them, the LST exhibited the strongest interaction with the land use types, with an average interaction intensity of over 0.9. This finding suggests the strong effect of the land use changes on the LST in the basin, thereby indirectly affecting the changes in the EEQ in the basin.
Discussion
RSEI model calculation
In this study, NDVI and WET were positively correlated with RSEI and exhibited a positive impact on ecological quality, while NDBSI and LST were negatively correlated with RSEI and negatively impacted the development of ecological quality, which is in line with the results of previous studies (Gao et al., 2020). The largest weight was given to LST in the PCA results, attributed to the fact that the Tarim River Basin is a typical arid and semi-arid region, and the basin includes a large area of desert, thus climate change significantly impacts the ecological quality of the basin. Furthermore, the contribution rate of PC1 that constituted the RSEI model in this study was relatively low, between 60% and 80%. Nonetheless, PC1 was still used to construct the RSEI model, to ensure the rationality of the results. This is because the four ecological elements play the same role of greenness and humidity in the actual situation, and dryness and heat play the same role in the ecological environment, and only PC1 conforms to this characteristic among PC1, PC2, PC3, and PC4. For example, in 2000, all four ecological elements in PC2 showed positive values and played the same role in determining EEQ, which is obviously contradictory to the actual situation. Greenness played the same role as dryness and heat in PC3 and PC4, which is also inconsistent with the actual situation, thus only greenness and humidity showed the same signs in PC1, which indicates that they have the same role in determining EEQ. Moreover, dryness and heat showed the same sign, which is in line with the role of the four indicators on ecological quality in the actual situation. Therefore, only PC1 can be used for the reasonable interpretation of RSEI and is not expected to affect the final evaluation results.
Characteristics of the spatial and temporal distribution of the RSEI
In terms of temporal evolution, the average value of RSEI in the Tarim River Basin from 2000 to 2020 ranged from 0.22 to 0.26, and the ecological environment of the basin is poorly based. This is mainly attributed to the fact that the Tarim River Basin is a typical arid inland river basin, and the central part is the Taklamakan Desert, the second largest flowing desert in the world, which covers an area of 33.7 × 10⁴ km2. Flowing dunes account for more than 90% of the dune types, and desertification has not only engulfed many ancient oases, but also caused their advancement to new oases. Except for a better area of vegetation cover around the river system, the other areas are more affected by desertification and have lower vegetation cover. Furthermore, soil salinization is particularly severe in the Tarim River Basin due to its extreme arid climatic characteristics and unusually strong evapotranspiration, coupled with its geographical location in an inland closed basin where salts are difficult to drain outward (Xu et al., 2015). This series of effects resulted in a lower level of overall ecological quality in the entire study area, which is also consistent with the findings reported by Ji et al. (2022), that the overall level of eco-logical quality in Northwest China is lower compared to that in other regions.
After nearly 20 years of comprehensive management, the EEQ of the Tarim River Basin has been initially improved, with the average RSEI increasing from 0.22 in 2000 to 0.25 in 2020, and the EEQ of the basin is generally showing an upward trend. Since 2000, China has embarked on a series of in-depth and comprehensive integrated management projects for the Tarim River Basin. These major projects cover a wide range of areas, including “irrigation district water conservation renovation”, “modernization and upgrading of plain reservoirs”, “rational development and utilization of groundwater resources”, “river desilting and management”, “optimization of Bosten Lake water delivery system”, “ecological restoration and construction”, “upgrading of the control capacity of mountain reservoirs”, “improvement in the water resources of the basin”, unified scheduling and management of water resources in the basin, etc., corresponding to a total of 485 individual projects. Currently, the area of natural vegetation in the lower reaches of the Tarim River has increased, its growth has improved, biodiversity has been significantly improved, dried-up lakes have been restored, and the history of the lower reaches of the Tarim River, which had been cut off from the flow of the river for nearly 30 years, has been ended. Thus, the overall quality of the ecological environment has been preliminarily improved (Chen et al., 2017). It also shows the effectiveness of this series of management measures, and simultaneously lays down the foundation for further management of the ecological environment in the Tarim River Basin.
In terms of spatial distribution pattern, the spatial distribution characteristics of EEQ in the Tarim River Basin from 2000 to 2020 were basically consistent. Regions with L–L aggregation were mainly observed in the central and eastern low-altitude areas, showing a poor EEQ. The high-altitude mountainous areas along the Tien Shan in the north, the Pamir Plateau in the west, and the Kunlun Mountains in the south are areas of H–H aggregations, with a relatively high level of ecological quality. These differences were directly related to the topographic and climatic features of the study area. Indeed, the basin is characterized by higher elevations in the southern, western, and northern parts than those in the eastern and central parts. The Yarkant, Hotian, and Aksu rivers in the basin are derived from the high-elevation areas in the western, northern, and southern parts. In contrast to the eastern and central areas, these parts are covered mainly with woodlands and grasslands, explaining the high EEQ in these areas. On the other hand, the eastern and central parts consist of desert areas with extremely poor vegetation cover, poor hydrothermal conditions, scarce precipitation, and large temperature variations, restricting optimal growth of vegetation. Furthermore, the poplar forests in the central and eastern parts of the basin have undergone extensive degradation in recent years due to the effects of anthropogenic activities and natural sources. Huang & Jiwu (2021) reported that 51.04% of the Populus euphratica forests in the basin underwent degradation from 2000 to 2020, explaining the poor EEQ in these parts of the basin. Under the influence of this unique geographical characteristic, the low level of ecological quality of the Tarim River Basin is observed in the center and east, and the high level of ecological quality is observed in the “crescent-shaped” distribution in the west, north, and south of the Taklamakan Desert.
Factors affecting the quality of the ecological environment and recommendations
Numerous factors can affect EEQs in basin environments. In this study, the explanatory powers of the main driving factors of the RSEI in the study area showed obvious spatial differences. Among them, the average q-value of the LST exceeded 0.9, also showing strong interactions with the other driving factors. This finding indicates that the changes in the EEQ in the basin were mainly related to the changes in the LST. Li (2022) highlighted an increasing trend of the average LST in the Tarim River Basin from 2000 to 2020, with significant fluctuations in the average annual temperature since 2008. This increase in the LST might increase the aridity in some parts of the basin, which, in turn, limit the growth of vegetation and negatively affect the EEQ (Shi et al., 2022). Analysis of the Geodetector results indicates that strong interaction effects of the LST are observed with the WET and NDVI. Indeed, increase in the LST can enhance the glacier melt, providing water supplies in arid areas, and consequently, increasing the WET and NDVI. Sun et al. (2020) showed a significant increase in the vegetation cover in the Tarim River Basin from 2000 to 2020 due to increased runoff, which is consistent with the observed variations in the RSEI in this study. However, glacial meltwater may only induce a short-term improvement in EEQ in the basin. Glaciers are an important regulator of the hydro-logical cycle, regulating large water amounts and thus reducing potential fluctuations in river flows. Therefore, the potential disappearance of the glaciers may lead to significant negative impacts on the EEQ in the basin.
The land use types strongly affected the EEQ in the basin. Moreover, the Geodetector results revealed a substantial increase in the explanatory power of the land use types from 0.25 in 2015 to 0.33 in 2020. Urban construction has been strongly recommended in the Xinjiang Uygur Autonomous Region since 2000, explaining the substantial increase in the urban land use area. Wang et al. (2022c) revealed significant increase in the industrial, residential, and ecological land areas in the basin from 2000 to 2020, in particular, over the 2015–2020 period. Indeed, these areas increased by 39.61% and 48.46% in the 2010–2015 and 2015–2020 periods, respectively. In addition, China began to implement the western development policy in 2000. As an important part of Xinjiang Uygur Autonomous Region in the west, the Tarim River basin has undergone tremendous changes in ecological environment due to the influence of its development policy (Wang, Wu & Qian, 2024). This finding further demonstrates the strong reduction effect of the land use changes on the RSEI from 2015 to 2020.
Conclusions
In this study, an RSEI model was constructed by using the MODIS remote sensing image data to assess the spatiotemporal variations in the EEQ in the Tarim River basin from 2000 to 2020. Further, the Geodetector method was used to study the mechanisms driving the changes in the environmental quality of the basin. The obtained results showed positive correlations of the WET and NDVI with the RSEI. In contrast, the RSEI showed negative correlations with the LST and NDBSI. These findings are in line with the expected effects of these four factors on the EEQ. The observed correlations between the ecological indicators and RSEI were stronger than those between the individual ecological indicators. Therefore, the RSEI comprehensively reflected the EEQ in the Tarim River Basin. The RSEI increased from 0.22 in 2000 to 0.25 in 2020, resulting in a decrease in the poor EEQ class area proportion from 50.7% to 44.73%. On the other hand, the moderate EEQ class area proportion increased from 11.45% in 2000 to 16.91% in 2020. Overall, improvements in the EEQ of the Tarim River Basin were observed over the 2000–2020 period.
The spatial distribution of the EEQ in the basin was relatively stable, with overall slight decrease in the EEQ aggregation. High–high aggregation areas were mainly observed in the central and high-elevation mountainous areas in the western, northern, and southern parts of the basin. Indeed, these areas exhibited higher EEQs due to the presence of glacier-fed rivers and abundant forest and vegetation covers. On the other hand, the low–low aggregation areas were mainly located in the desert areas in the central and eastern parts of the basin, showing poor EEQs. The temporal variations in the EEQ in the basin are the result of interactions between several driving factors, including the NDVI, WET, LST, NDBSI, and DEM. The LST showed the most obvious interactions with the other driving factors, resulting in the strongest impact on the changes in the EEQ in the basin. Moreover, the interactions between the land use types and the other drivers exhibited strong impacts on the EEQ in the Tarim River basin, in particular, from 2015 to 2020. Indeed, the drastic changes in land use types resulted in a decreasing trend of the overall RSEI in the basin. Overall, the EEQ changes in the basin were affected by several natural and anthropogenic factors. Undeniably, a lot more systematic explorations are further demanded to investigate the land use types and vegetation cover in future restoration planning in the basin. Moreover, several large-scale management measures can be implemented in the basin to mitigate future increase in the LST and improve the EEQ, such as reduction of poplar forest degradation, expansion of forests and grasslands, effective control of urban land development, construction of artificial oases, and increase in vegetation cover.