
Classification of major species in the sericite–Artemisia desert grassland using hyperspectral images and spectral feature identification
- Published
- Accepted
- Received
- Academic Editor
- Ahmet Tansel Serim
- Subject Areas
- Agricultural Science, Plant Science, Natural Resource Management
- Keywords
- Grassland plants, Spectral characteristics, Identification parameters, Screening, Fisher discriminant
- Copyright
- © 2024 Liu et al.
- Licence
- This is an open access article distributed under the terms of the Creative Commons Attribution License, which permits using, remixing, and building upon the work non-commercially, as long as it is properly attributed. For attribution, the original author(s), title, publication source (PeerJ) and either DOI or URL of the article must be cited.
- Cite this article
- 2024. Classification of major species in the sericite–Artemisia desert grassland using hyperspectral images and spectral feature identification. PeerJ 12:e17663 https://doi.org/10.7717/peerj.17663
Abstract
Background
The species composition of and changes in grassland communities are important indices for inferring the number, quality and community succession of grasslands, and accurate monitoring is the foundation for evaluating, protecting, and utilizing grassland resources. Remote sensing technology provides a reliable and powerful approach for measuring regional terrain information, and the identification of grassland species by remote sensing will improve the quality and effectiveness of grassland monitoring.
Methods
Ground hyperspectral images of a sericite–Artemisia desert grassland in different seasons were obtained with a Soc710 VP imaging spectrometer. First-order differential processing was used to calculate the characteristic parameters. Analysis of variance was used to extract the main species, namely, Seriphidium transiliense (Poljak), Ceratocarpus arenarius L., Petrosimonia sibirica (Pall), bare land and the spectral characteristic parameters and vegetation indices in different seasons. On this basis, Fisher discriminant analysis was used to divide the samples into a training set and a test set at a ratio of 7:3. The spectral characteristic parameters and vegetation indices were used to identify the three main plants and bare land.
Results
The selection of parameters with significant differences (P < 0.05) between the recognition objects effectively distinguished different land features, and the identification parameters also differed due to differences in growth period and species. The overall accuracy of the recognition model established by the vegetation index decreased in the following order: June (98.87%) > September (91.53%) > April (90.37%). The overall accuracy of the recognition model established by the feature parameters decreased in the following order: September (89.77%) > June (88.48%) > April (85.98%).
Conclusions
The recognition models based on vegetation indices in different months are superior to those based on feature parameters, with overall accuracies ranging from 1.76% to 9.40% higher. Based on hyperspectral image data, the use of vegetation indices as identification parameters can enable the identification of the main plants in sericite–Artemisia desert grassland, providing a basis for further quantitative classification of the species in community images.
Introduction
The convenient and rapid identification of the composition of and changes in natural grassland communities is highly important for identifying grassland type, quantity and quality and monitoring grassland degradation and restoration. The development of remote sensing technology compensates for the limitations of human and material resources in traditional grassland resource investigation and monitoring methods (Reinermann, Asam & Kuenzer, 2020). Hyperspectral remote sensing, one such technology, is mainly used in spectral feature extraction because of its many bands and narrow channels (Yu et al., 2018) and its strong advantages in grassland vegetation classification and identification (Qiao et al., 2022). The identification and classification of plant species are the basis of biodiversity monitoring. Clarifying the categories and distributions of plant species has important implications for monitoring ecosystem biodiversity, community reconstruction, and maintaining ecological function (Khdery & Yones, 2021). Species composition is an important parameter that describes the structure of vegetation communities and indicates biodiversity and ecosystem health in a region (Lyu et al., 2020), and species identification is crucial for environmental monitoring (Zhang et al., 2020). Previous studies mostly selected characteristic bands from the period of vigorous vegetation growth to analyse and compare different grassland vegetation or transformed the characteristic bands and used quantitative spectral characteristic parameters and vegetation indices to distinguish different vegetation types, obtaining good research results (Melville, Lucieer & Aryal, 2018; Yu et al., 2018; Frank et al., 2022). Spectral parameters can enhance the ability to separate plants (Dmitriev et al., 2022; Soubry & Guo, 2021). However, due to the phenological characteristics of vegetation, the selected parameters respond differently depending on the phenological period (Zhang et al., 2018), so it is necessary to screen parameters with high response degrees for vegetation classification research. For example, Han et al. (2020) successfully identified seven species of millet (Setaria italica) using visible near infrared (VIS-NIR) spectral information from growing leaves and established a recognition model with a correlation coefficient of up to 0.9994. Feng et al. (2016) used ground-measured hyperspectral data to identify indicator species of grassland degradation, namely, Artemisia frigida Willd, Stellera chamaejasme L, and Potentilla acaulis L., using a mixed spectral model and found that the recognition accuracy of these three species was 83.3%, 88.9%, and 94.4%, respectively. Li et al. (2016) identified red, blue and near-infrared bands as sensitive bands and obtained the normalized vegetation index of the blue band (NDVIblue) as the best parameter through analysis, and the extraction accuracy of Stellera chamaejasme Linn reached 90%. To further strengthen research on vegetation classification and recognition, selecting an appropriate identification period and identification parameters is an important step, especially for grassland communities with no obvious individual plant characteristics (Singh et al., 2018).
The ecosystem of the Seriphidium transiliense (Poljak) desert grassland is fragile and concentrated in Xinjiang, China. Overgrazing and general degradation have seriously damaged the animal husbandry production of herders and threatened the biodiversity of grasslands and the ecological security of oases (Jin et al., 2011). At present, hyperspectral research on S. transiliense desert grasslands has focused on the analysis of vegetation spectral characteristics, and estimation models of grassland coverage and biomass have been established by using spectral reflectance. He et al. (2014) found obvious differences among an invasive species (Polygonum aviculare L), an increased species (Petrosimonia sibirica (Pall)) and a reduced species (S. transiliense) in the near-infrared band, and in terms of spectral reflectance, the rank was bare ground > P. aviculare > S. transiliense > P. sibirica. Wei et al. (2017a) and Wei et al. (2017b) estimated grassland coverage by using specific sensitive bands and the vegetation index through ground and satellite hyperspectral images, and the accuracy of the best model exceeded 85%. They estimated the aboveground biomass inside and outside the fence, and the differences in the estimation models were due to the different types and seasons of the measured grassland communities. The above studies mainly considered the red and near-infrared bands of vegetation, with limited analysis of other bands, and did not include in-depth research or analysis on the identification period and identification parameters of the main species in the focal community.
Therefore, to further improve the identification accuracy and utilization of the identification parameters for the main plants in a grassland community, this study used an imaging spectrometer to collect spectral images of the S. transiliense desert grassland community, established spectral characteristic parameters and vegetation indices, and analysed these spectral characteristic parameters and the vegetation indices of the main plants. The sensitive identification parameters in different periods were selected, and the identification objects were classified by Fisher analysis to provide a theoretical basis for the classification and identification of grassland plants.
Materials & Methods
Study site
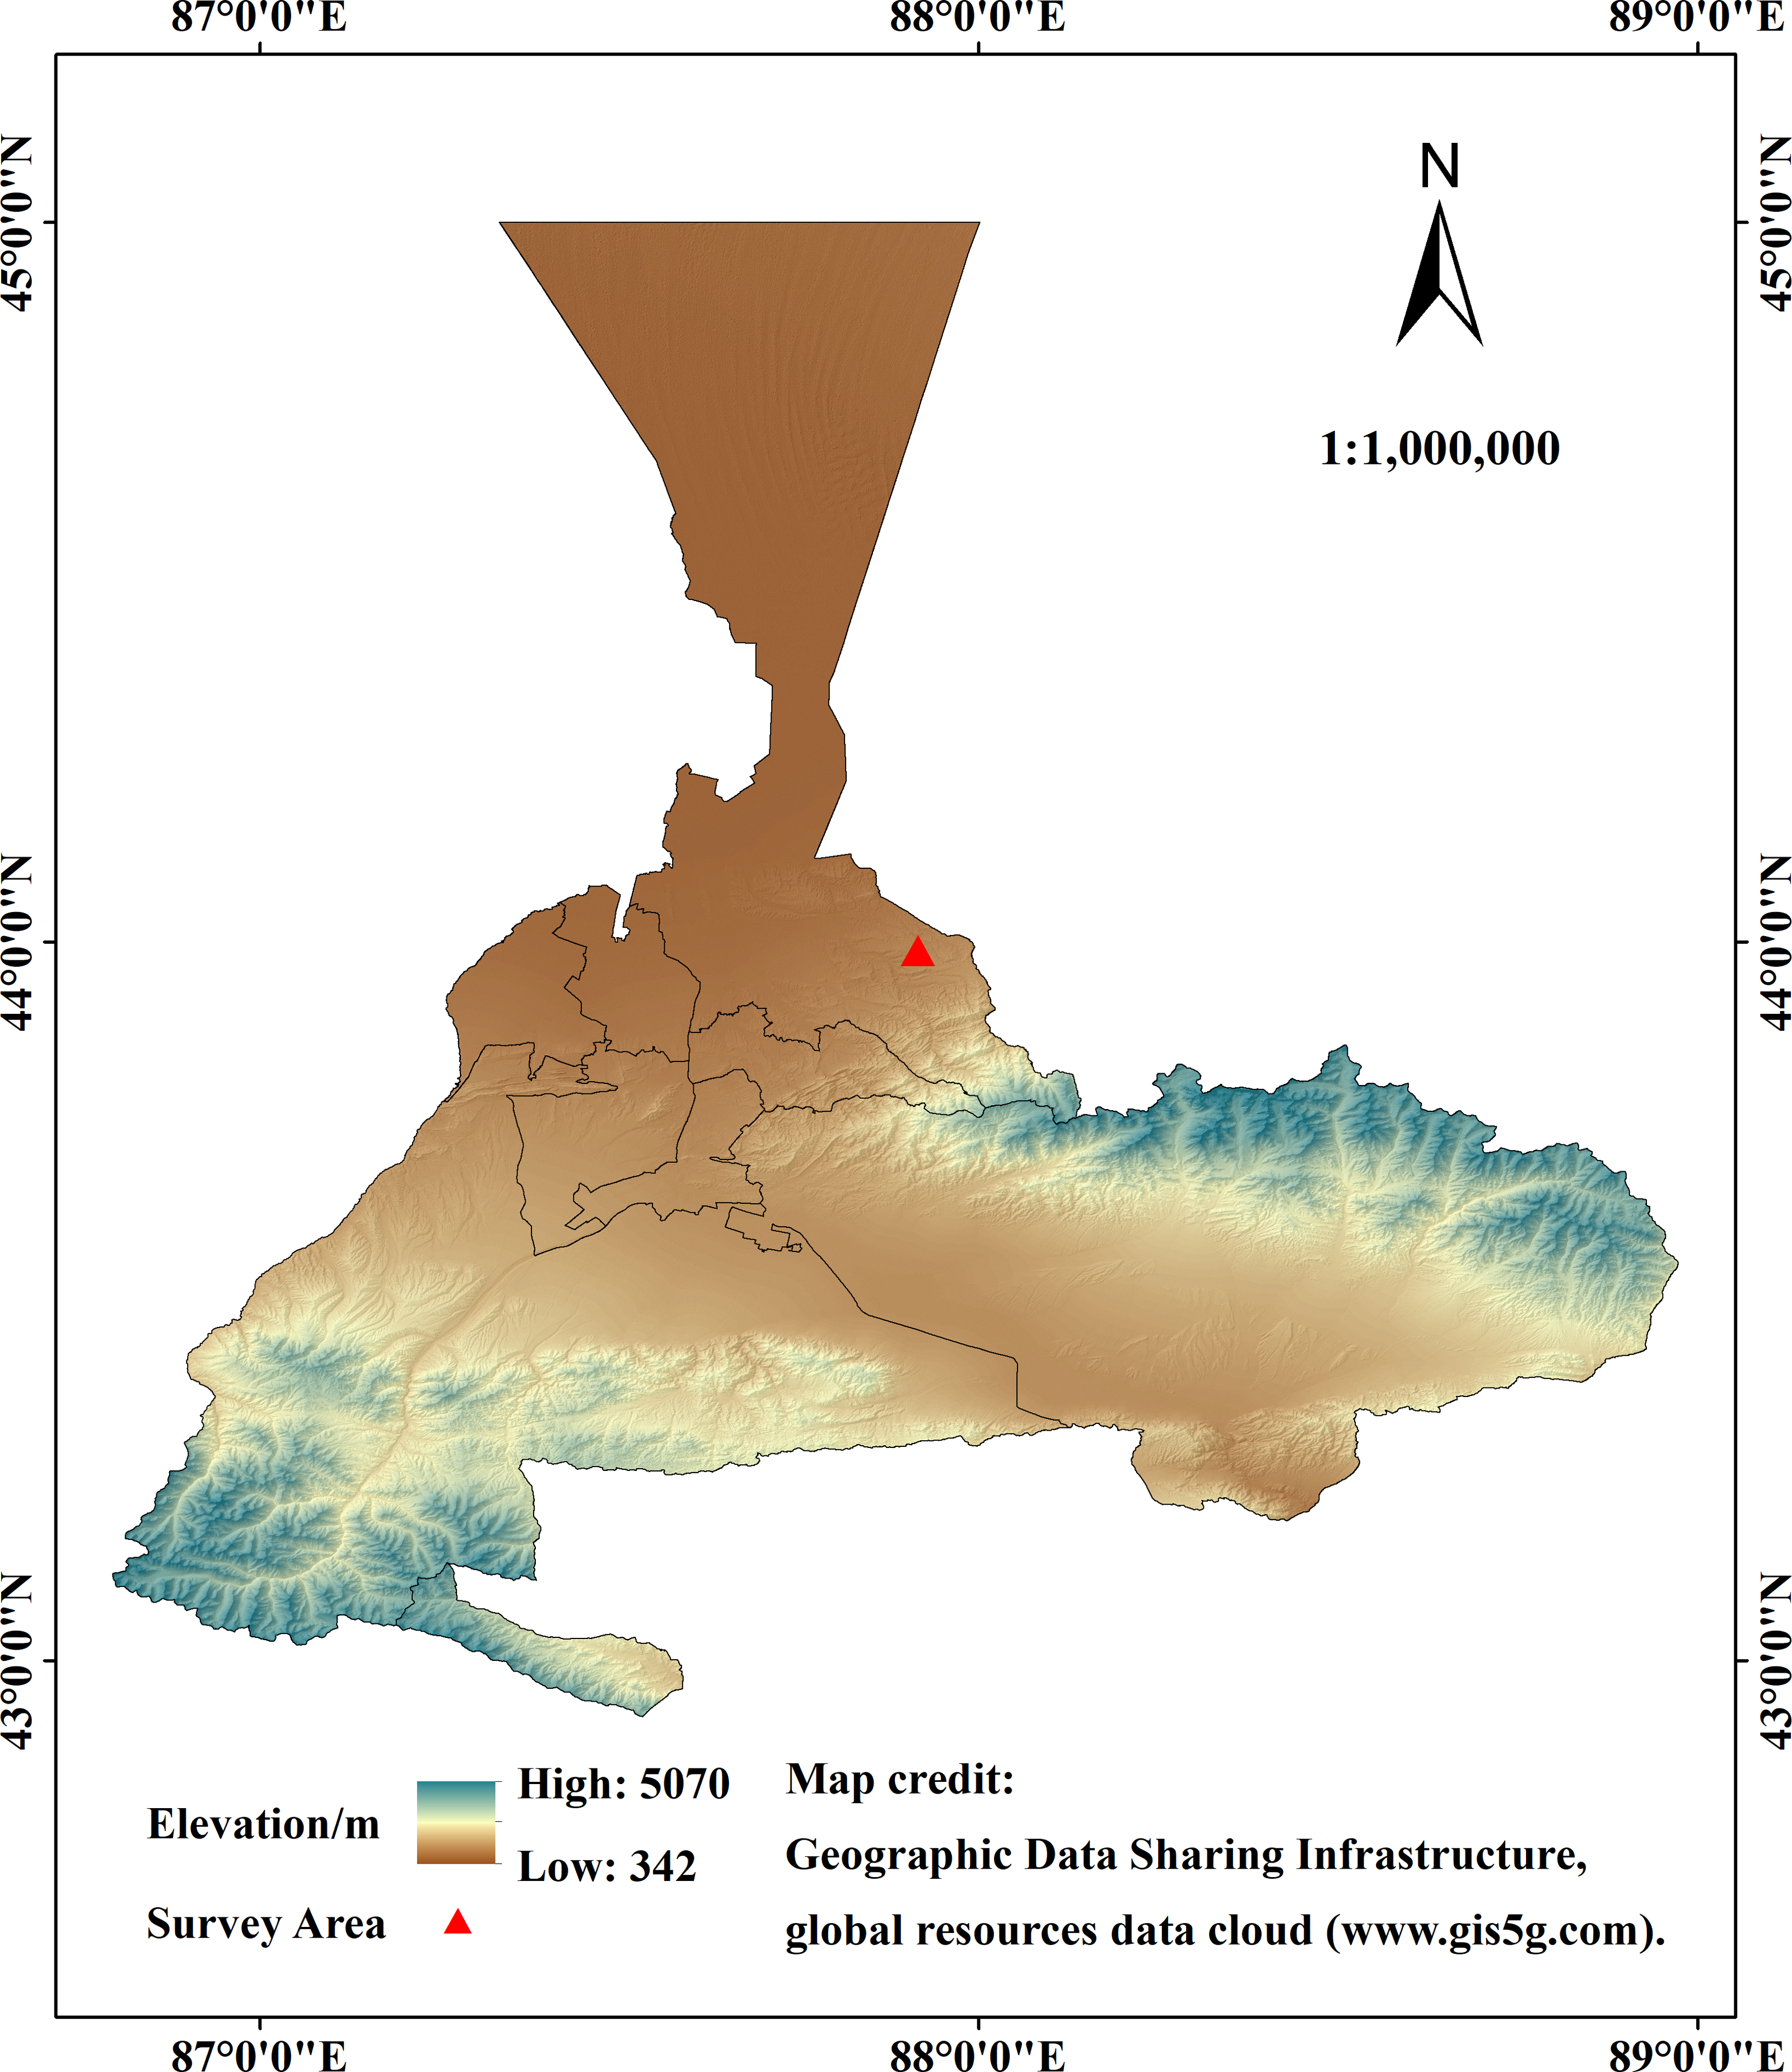
The study area is located in the middle part of the northern slope of the Tianshan Mountains in the S. transiliense habitat in Baiyanghe Township, Midong District, Urumqi. The geographical location is between 87°52′59″ and 87°55′13″E and 44°00′16″ and 44°01′20″N (Fig. 1). The mean annual temperature is 16 °C, the highest temperature is 39 °C in July and August, the lowest temperature is −31 °C in January, the altitude is 895–954 m, and the annual precipitation is 170–276 mm (National Earth System Science Data Center). The area has a temperate continental semiarid and semidesert climate.
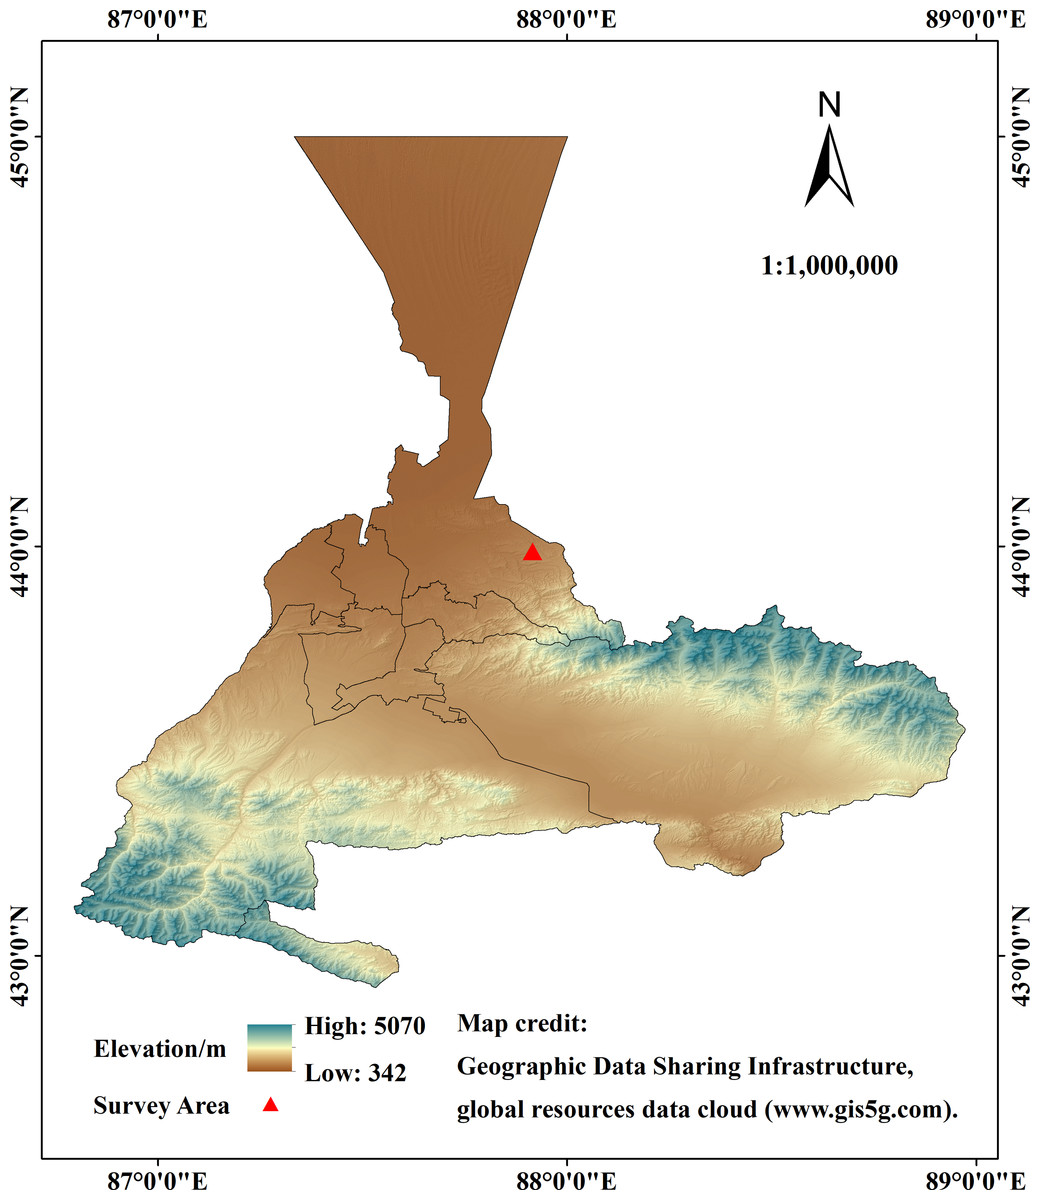
Figure 1: Study area located in Urumqi, Xinjiang Uygur Autonomous Region, China.
The grassland types in this area are representative and have good growth conditions. The area is home to an important local spring and autumn pasture. The community characteristics are shown in Table 1. The dominant species is S. artemisia, and the subdominant species are the annual plants Ceratocarpus arenarius L and P. sibirica. There are also scattered distributions of Carpesium abrotanoides L., Ceratocephalus orthoceras DC, Draba nemorosa L., Trigonella arcuata CA, Koelpinia linearis (Pall), Stipa capillata L. and so on. The 0–5 cm soil moisture content is 11.32%, the soil bulk density is 1.21 g/cm3, the conductivity is 199.33 us/cm, the pH is 7.87, the soil C content is 9.10 g/kg, the soil N content is 1.25 g/kg, the soil P content is 0.73 g/kg, and the soil K content is 9.93 g/kg.
|
Time (Month) |
Height (cm) |
Coverage (%) |
Density (number m−2) |
Aboveground biomass (Fresh weight) (g m−2) |
Species composition |
|---|---|---|---|---|---|
| 4 | 5.85 ± 1.66 | 34.51 ± 15.79 | 226.28 ± 65.57 | 95.48 ± 38.45 | Seriphidium transiliense (0.4094) |
| Ceratocarpus arenarius (0.1897) | |||||
| Petrosimonia sibirica (0.1408) | |||||
| 6 | 14.93 ± 2.63 | 40.91 ± 9.93 | 147.78 ± 35.52 | 69.07 ± 30.92 | Seriphidium transiliense (0.5964) |
| Ceratocarpus arenarius (0.2951) | |||||
| Petrosimonia sibirica (0.0535) | |||||
| 9 | 14.40 ± 4.00 | 28.52 ± 14.58 | 14.83 ± 5.74 | 128.64 ± 43.46 | Seriphidium transiliense (0.7643) |
| Ceratocarpus arenarius (0.2356) |
Notes:
The numbers in brackets are the importance values of the species, which were calculated with the formula (relative height + relative coverage + relative density + relative biomass)/4.
Data acquisition
Sample plot establishment
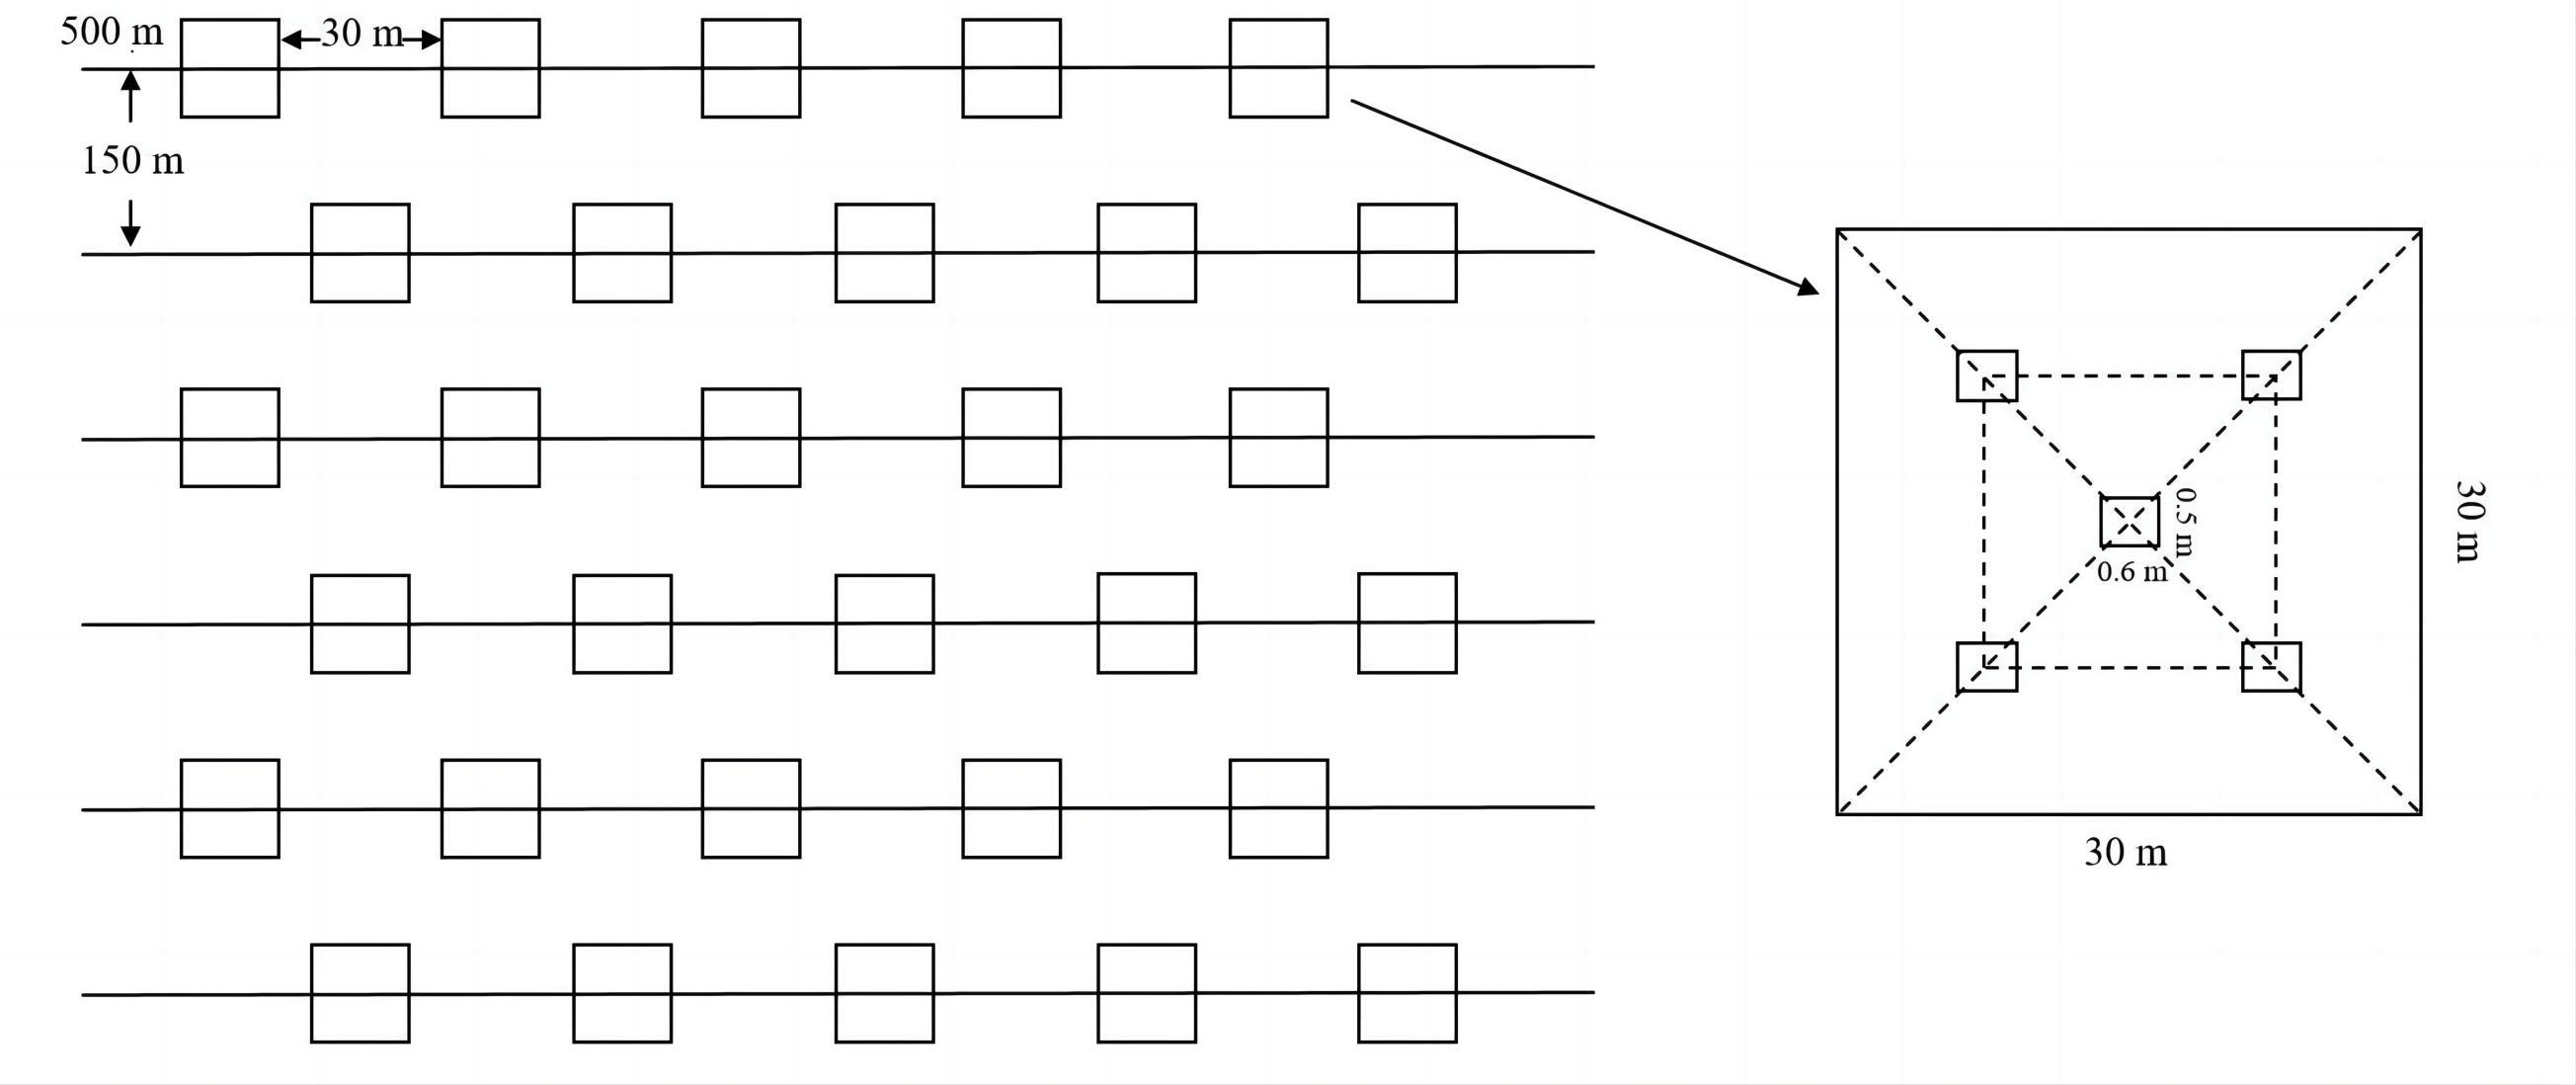
In the study area, a 500 m long transect was established every 150 m, with a total of six parallel transects. Five 30 m × 30 m transects with a spacing of 30 m were arranged along each transect. Five transects were arranged on two diagonal lines of the transects with a 5-point sampling method as the data acquisition points. According to the field of view of the instrument, the area of the transect was set as 0.5 m × 0.6 m, with a total of 150 transects (Fig. 2).
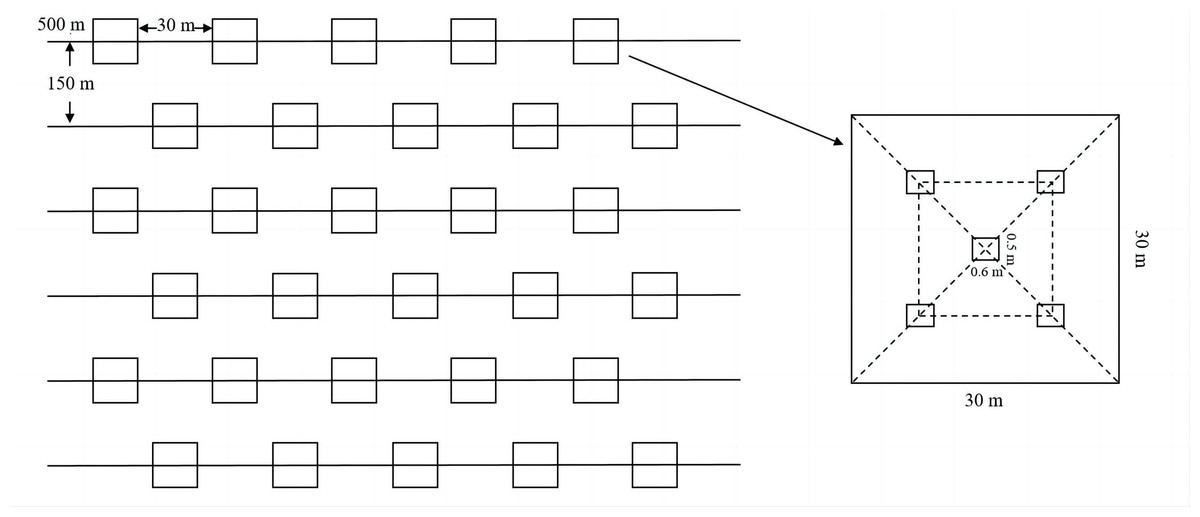
Figure 2: Sample plot and quadrat establishment.
Hyperspectral image acquisition
An SOC710VP imaging spectrometer was used to collect spectral data of plant communities in the field (spectral range, 400∼1,000 nm; resolution, 4.68 nm; number of bands, 128; and imaging resolution, 1,392 × 1,040 pixels), and the spectral measurement time ranged from 11:00 to 16:00 in April, June and September 2018 (solar altitude angle > 45°). The measurements were taken on sunny, cloudless, and windless or less windy (wind < 3 m/h) days. During measurement, the lens was vertically downwards, and the vertical height from the plant canopy was approximately 1.0 m. Based on the analysis of the spectral characteristics of the three main plants, the other plants distributed sporadically in the quadrat were extracted, and the community canopy spectrum and bare-ground hyperspectral images were collected in each quadrat. A total of 450 images were collected. In addition, the coverage and biomass of each species in the quadrat were measured to provide a reference for the extraction of spectral data.
Extraction of spectral data
The spectral data of pure pixels of S. transiliense, C. arenarius, P. sibirica and bare ground were extracted from the images of plant communities in each measurement period by using SRAnal 710 software of the imaging spectrometer. A total of 150 quadrat images were obtained in each period, yielding 150 reflectance samples of three types of plants and bare land from which the damaged samples were removed. To ensure the consistency of the reflectance samples, 90 reflectance samples of each type were ultimately classified: 360 reflectance samples in April (spring), 273 reflectance samples in total due to the scarcity of P. sibirica in June (summer), and 184 samples in total due to the scarcity of C. arenarius in September (autumn).
Spectral data processing
First-order differential processing
The first-order differential can eliminate the influence of partial atmospheric and soil backgrounds, highlight the characteristics of the vegetation spectrum, and be beneficial to the extraction of vegetation information such as vegetation indices and the leaf area index.
The first-order differential method was selected to process the spectrum, with the following formula: (1) where FR(λi) is the first-order differential spectrum of wavelength λi; R(λi+1) is the original spectral reflectance of wavelength i+1; R(λi−1) is the original spectral reflectance of wavelength i-1; and Δλ is the wavelength difference between wavelength i and wavelength i+1.
Selection of spectral parameters
To explore the spectral response characteristics of the main species and bare land of the S. transiliense desert grassland, 10 common spectral characteristic parameters were selected, including eight location parameters, two area parameters and 11 vegetation indices, including seven wide-band vegetation indices and four narrow-band vegetation indices, as shown in Tables 2 and 3.
| Parameter type | Characteristic parameter | Abbreviation/ symbol | Definition |
|---|---|---|---|
| Location parameters | Blue edge amplitude | Mb | First-order differential maximum in the range of 490∼530 nm in the blue edge |
| Blue edge position | Lb | Wavelength corresponding to blue edge amplitude | |
| Green peak amplitude | Mg | Maximum reflectivity of 510∼560 nm in the green light range | |
| Green peak position | Lg | Wavelength corresponding to 510∼560 nm green peak in the green light range | |
| Red valley amplitude | Mr | Maximum reflectivity of 640∼680 nm in the range of red light | |
| Red valley position | Lr | Wavelength corresponding to 640∼680 nm red valley in the red light range | |
| Red edge amplitude | Mre | Maximum value of the first-order differential at 680∼760 nm on the red edge | |
| Red edge position | Lre | Corresponding wavelength of the red edge amplitude | |
| Area parameter | Blue edge area | Ab | Sum of first-order differential values within the blue edge range |
| Red edge area | Are | Sum of first-order differential values within the red edge range |
| Parameter type | Vegetation index | Abbreviation | Formula |
|---|---|---|---|
| Wide band vegetation index | Normalized difference vegetation index | NDVI | (Rnir-Rred)/(Rnir+Rred) |
| Ratio vegetation index | RVI | Rnir/Rred | |
| Difference vegetation index | DVI | Rnir-Rred | |
| Blue normalized difference vegetation index | BNDVI | (Rnir-Rb)/(Rnir+Rb) | |
| Green normalized difference vegetation index | GNDVI | (Rnir-Rg)/(Rnir+Rg) | |
| Enhanced vegetation index | EVI | 2.5(Rnir-Rred)/(Rnir+ 6 ×Rred-7.5 ×Rb+1) | |
| Normalized difference green index | NDGI | (Rg-Rred)/(Rg+Rred) | |
| Red index | RI | (Rred-Rg)/(Rred+Rg) | |
| Narrow band vegetation index | Photochemical reflectance index | PRI | (R531-R570)/(R531+R570) |
| Red edge normalized difference vegetation index | RENDVI | (R750-R705)/(R750+R705) | |
| Plant senescence reflectance index | PSRI | (R680-R500)/R750 | |
| Vogelmann red edge index | VOG | R740/R720 |
Fisher discriminant analysis is used to establish a linear discriminant function based on the original information of samples of known categories or the feature space information that can represent the information of samples of known categories, project the multidimensional spatial space to one-dimensional space, classify and discriminate the samples of unknown categories through the discriminant criteria, and then verify the classification accuracy of the sample classification information (Huang et al., 2019). (2) (3) (4) (5) (6) (7) where mi is the mean vector of each class of samples in the original high-dimensional space; is the mean vector of each class of samples in the one-dimensional space Y after projection; m is the mean vector of all of the samples; X is the sample point vector; Sω is the discrete matrix within the sample class; Sb is the discrete matrix between sample classes; is the pooled within-class scatter matrix; JF(ω) is the Fisher criterion function; L(ω, λ) is the Lagrange function; λ is the Lagrange multiplier; and ω∗ is the maximum value, which is the best projection method.
Screening of sensitive spectral parameters
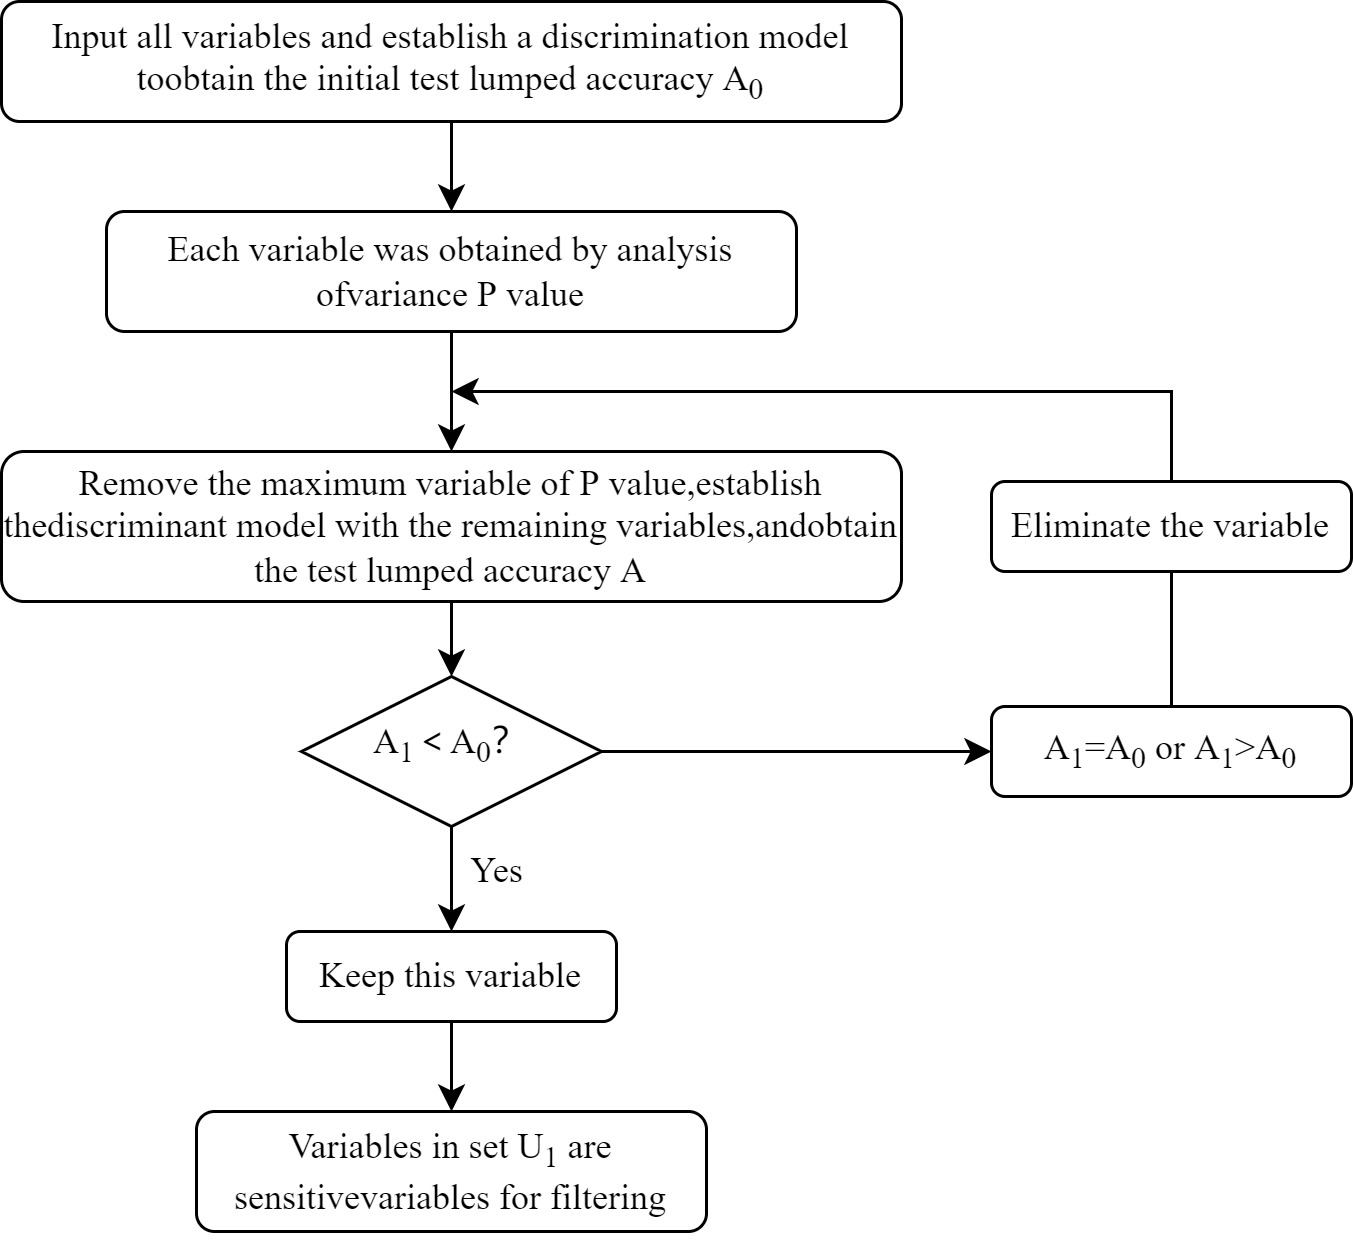
Variance analysis and a discriminant model were used to screen the eight location parameters, two area parameters and 12 vegetation indices, and the, contributions of these parameters to the identification of the four objects were determined. The P value between two identified objects was determined by variance analysis. The smaller the P value is, the more significant the difference is. All 10 spectral characteristic parameters and 12 vegetation index parameters were taken as input parameters to obtain the initial discrimination accuracy. The characteristic parameters were removed one by one according to the P value. If the discrimination accuracy of the model after removing the parameters was greater than or equal to the initial accuracy, the parameter was removed; otherwise, the parameter was retained in the discrimination model (Fig. 3).
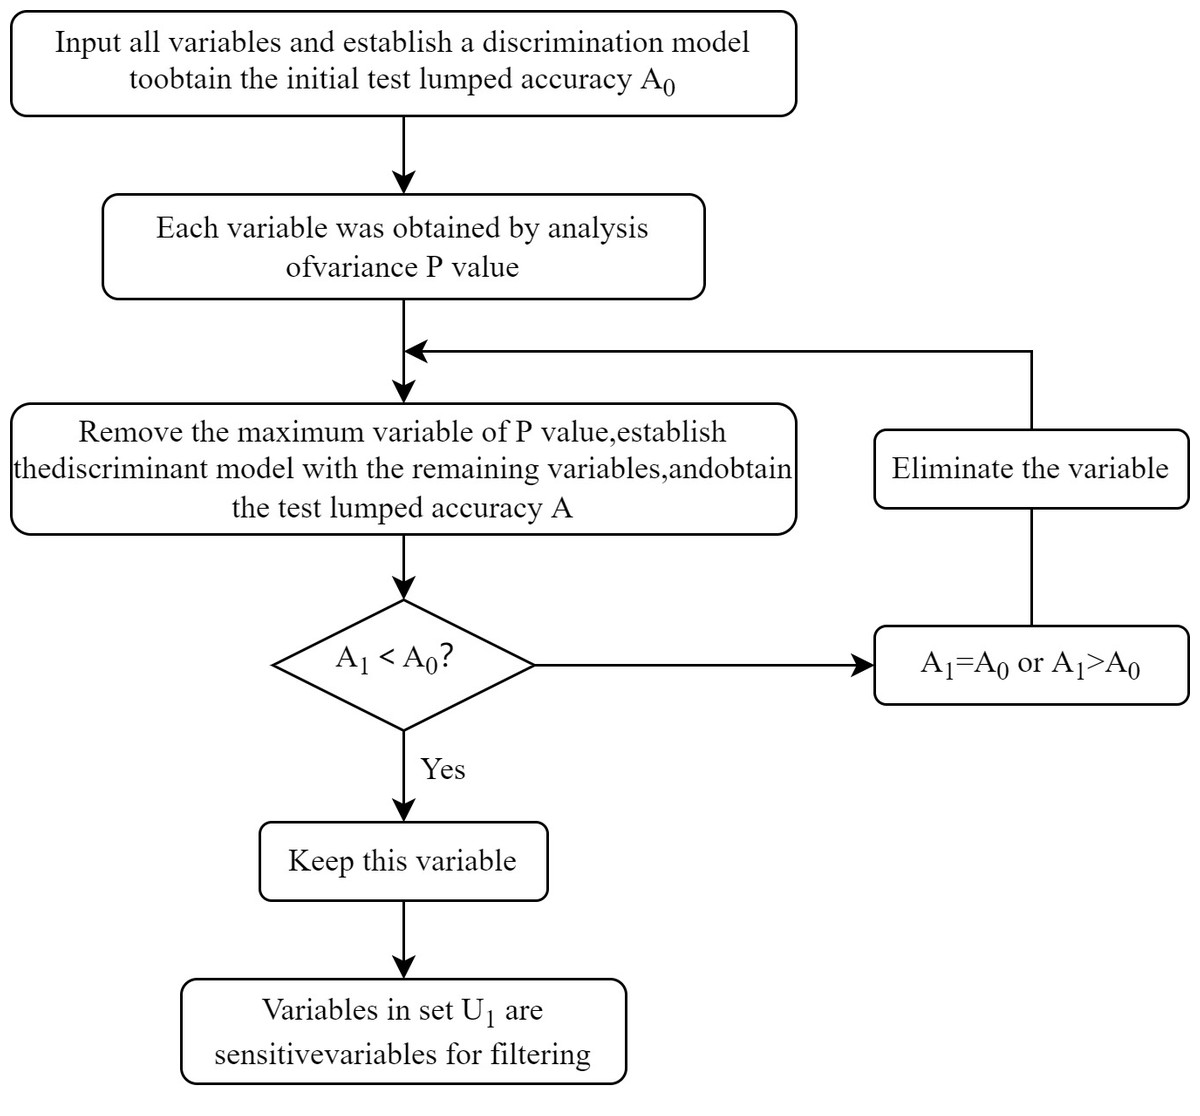
Figure 3: Parameter screening.
Data analysis
The spectral reflectance values of different recognition objects were extracted using SRAnal710 and imported into Excel 2016 to remove abnormal data. First-order differential processing was performed, and feature parameters and vegetation indices were calculated. Principal component analysis was performed in SPSS 20.0 software to screen feature bands, and significance tests were conducted on the feature parameters of each identified object and vegetation index. Fisher discriminant analysis was used to classify samples and verify accuracy. SigmaPlot 14.0 software was used for plotting.
Results
Characteristic parameter analysis
In April, the six spectral parameters of blue edge amplitude Mb, green peak amplitude Mg, red valley amplitude Mr, red edge amplitude Mre, blue edge area Ab and red edge area Are showed significant differences among the four recognition objects (P < 0.05); there were significant differences in various spectral parameters between bare land and the three plants (P < 0.05). The spectral parameters in June and September showed significant differences among the four objects, including the red valley position Lr and the red edge area Are, which were significantly different among the identified objects (P < 0.05, Table 4).
Vegetation index analysis
In April, the significant differences in the NDVI, RVI, BNDVI, GNDVI, EVI, PSRI and REEDVI were observed among the four objects were found (P < 0.05); there was a significant difference between bare land and the three plants, except for the PRI (P < 0.05, Table 5).
|
Time (Month) |
Species |
Blue edge position |
Blue edge amplitude |
Green peak position |
Green peak amplitude |
Red valley position |
Red valley amplitude |
Red edge position |
Red edge amplitude |
Blue edge area |
Red edge area |
|---|---|---|---|---|---|---|---|---|---|---|---|
| 4 | Seriphidium transiliense | 525.58a | 0.27b | 555.92c | 17.31b | 641.46b | 12.88c | 725.84b | 0.96b | 1.87b | 15.44b |
| Ceratocarpus arenarius | 525.59a | 0.28a | 556.29c | 20.61a | 641.60b | 15.46b | 725.62b | 1.06a | 2.18a | 16.29a | |
| Petrosimonia sibirica | 525.56a | 0.21c | 557.02b | 14.61c | 641.63b | 10.87d | 732.09a | 0.89c | 1.42c | 14.67c | |
| Bare land | 507.95b | 0.08d | 559.12a | 12.49d | 739.71a | 17.95a | 707.67c | 0.15d | 0.62d | 0.82d | |
| 6 | Seriphidium transiliense | 521.44a | 0.13b | 556.06c | 16.66bc | 653.76c | 17.32b | 717.01a | 0.44b | 0.84b | 4.49b |
| Ceratocarpus arenarius | 506.81b | 0.11c | 558.59ab | 18.34ab | 664.42b | 21.45a | 716.70a | 0.44b | 0.72b | 3.13c | |
| Petrosimonia sibirica | 524.14a | 0.19a | 557.65b | 19.59a | 642.93d | 17.66b | 717.08a | 0.86a | 1.37a | 11.68a | |
| Bare land | 508.01b | 0.10c | 559.12a | 15.61c | 672.91a | 19.90ab | 713.70a | 0.31c | 0.72b | 0.73d | |
| 9 | Seriphidium transiliense | 523.32a | 0.15a | 556.16b | 14.44b | 650.59c | 13.33b | 726.86a | 0.56a | 0.88a | 7.80a |
| Ceratocarpus arenarius | 511.27b | 0.16a | 557.91a | 18.74a | 666.75b | 21.41a | 711.11b | 0.51a | 0.80a | 3.60b | |
| Bare land | 507.42b | 0.10b | 559.12a | 16.51ab | 673.25a | 20.78a | 709.57b | 0.31b | 0.76a | 0.81c |
Notes:
The different lowercase letters in the table indicate significant differences between different recognition objects within the same characteristic parameter and season (P < 0.05).
In June, there were significant differences in six vegetation indices (DVI, BNDVI, GNDVI, NDGI, PSRI and VOG) among the four detection objects (P < 0.05), but there were no significant differences in the NDVI, RVI or EVI between bare land and C. arenarius. The DVI, NDGI and VOG differed from those in April.
In September, there were significant differences among the seven vegetation indices: the NDVI, DVI, EVI, NDGI, PSRI, RENDVI and VOG (P < 0.05). The NDVI, EVI and PSRI were the same in June and April; and the DVI, NDGI, PSRI and VOG were the same in June and April. Only the EVI differed from that in June and April.
|
Time (Month) |
Species | NDVI | RVI | DVI | BNDVI | GNDVI | EVI | NDGI | RI | PRI | PSRI | RENDVI | VOG |
|---|---|---|---|---|---|---|---|---|---|---|---|---|---|
| 4 | Seriphidium transiliense | 0.60b | 4.10b | 42.38a | 0.65b | 0.57b | 2.05c | 0.04b | −0.04b | −0.05a | −0.44b | 0.45b | 1.50b |
| Ceratocarpus arenarius | 0.56c | 3.59c | 41.28a | 0.60c | 0.52c | 2.12b | 0.06a | −0.06c | −0.05b | −0.47c | 0.44c | 1.49b | |
| Petrosimonia sibirica | 0.62a | 4.42a | 38.23b | 0.66a | 0.59a | 2.19a | 0.05a | −0.05c | −0.06c | −0.49d | 0.51a | 1.59a | |
| Bare land | 0.14d | 1.34d | 5.01c | 0.32d | 0.28d | 0.38d | −0.15c | 0.15a | −0.06c | 0.19a | 0.02d | 1.03c | |
| 6 | Seriphidium transiliense | 0.28b | 1.80b | 14.01b | 0.38b | 0.28d | 1.06b | −0.35d | 0.07c | −0.04a | 0.11b | 0.13b | 1.10b |
| Ceratocarpus arenarius | 0.19c | 1.49c | 10.73c | 0.34c | 0.31c | 0.60c | −0.12b | 0.12b | −0.05ab | 0.07c | 0.13b | 1.06c | |
| Petrosimonia sibirica | 0.41a | 2.46a | 25.12a | 0.49a | 0.43a | 1.63a | −0.02a | 0.02d | −0.05b | 0.29a | −0.18c | 1.25a | |
| Bare land | 0.21c | 1.53c | 6.94d | 0.37b | 0.34b | 0.56c | −0.14c | 0.14a | −0.06c | 0.04d | 0.17a | 1.04d | |
| 9 | Seriphidium transiliense | 0.44a | 2.80a | 23.32a | 0.52a | 0.47a | 1.69a | −0.02a | 0.02c | −0.04a | −0.15c | 0.30a | 1.32a |
| Ceratocarpus arenarius | 0.18b | 1.58b | 11.93b | 0.31b | 0.28b | 0.69b | −0.10b | 0.10b | 0.04ab | 0.10b | 0.07b | 1.10b | |
| Bare land | 0.12c | 1.30b | 5.26c | 0.31b | 0.27b | 0.31c | −0.15c | 0.15a | −0.07b | 0.21a | 0.01c | 1.02c |
Notes:
The different lowercase letters in the table indicate significant differences between different recognition objects within the same vegetation index and season (P < 0.05).
Discriminant parameter analysis and screening
Discriminant parameter analysis
In April, there were no significant differences in the characteristic parameters among the identified objects, which were Lb, Lre, Lg and Are. For June, the parameters were Lb, Lre, Lg, Mg, Mr, Mre and Ab, and for September, they were Lb, Lre, Mb, Lg, Mg, Mr, Mre and Ab (Table 6).
| Time (Month) | Average P value | |||||||||
|---|---|---|---|---|---|---|---|---|---|---|
| Lb | Lr | Lre | Mb | Lg | Mg | Mr | Mre | Ab | Are | |
| 4 | 0.48 | 0.00 | 0.14 | 0.00 | 0.02 | 0.00 | 0.00 | 0.00 | 0.00 | 0.03 |
| 6 | 0.20 | 0.00 | 0.56 | 0.00 | 0.04 | 0.07 | 0.18 | 0.13 | 0.13 | 0.00 |
| 9 | 0.05 | 0.00 | 0.25 | 0.26 | 0.07 | 0.08 | 0.26 | 0.16 | 0.38 | 0.00 |
In April, there were no significant differences in the vegetation indices among the identified objects, which were the DVI, NDGI, RI, PRI, PSRI, and VOG. For June, the measured indices were the PRI and RENDVI, and for September, they were the RVI, BNDVI, GNDVI and PRI (Table 7).
| Time (Month) | Average P value | |||||||||||
|---|---|---|---|---|---|---|---|---|---|---|---|---|
| NDVI | RVI | DVI | BNDVI | GNDVI | EVI | NDGI | RI | PRI | PSRI | RENDVI | VOG | |
| 4 | 0.00 | 0.00 | 0.03 | 0.00 | 0.00 | 0.00 | 0.07 | 0.07 | 0.09 | 0.02 | 0.00 | 0.04 |
| 6 | 0.00 | 0.00 | 0.00 | 0.00 | 0.00 | 0.00 | 0.00 | 0.00 | 0.07 | 0.00 | 0.08 | 0.00 |
| 9 | 0.00 | 0.04 | 0.00 | 0.32 | 0.26 | 0.00 | 0.00 | 0.01 | 0.17 | 0.00 | 0.00 | 0.00 |
Discriminant parameter screening
Since the average P value can indirectly reflect the size of the difference, the parameters that did not have very significant differences were eliminated one by one from small to large according to the P value (P < 0.01), and the discrimination accuracy of the four recognition objects and the total discrimination accuracy of the test set were calculated. The group with more eliminated parameters and an accuracy no less than that of the noneliminated parameters was taken as the optimal set of parameters. The eliminated parameters and retained parameters of sericite, S. transiliense, C. arenarius, P. sibirica and bare land in April, June and September are shown in Tables 8 and 9.
| Time (Month) | Species | Eliminated parameters | Retained parameters |
|---|---|---|---|
| 4 | Seriphidium transiliense | Lb, Lr, Lre | Mb, Lg, Mg, Mr, Mre, Ab, Are |
| Ceratocarpus arenarius | Lb, Lr, Lre, Mb, Lg, Mg, Mr, Mre, Ab, Are | ||
| Petrosimonia sibirica | Lb, Lr, Lre, Lg | Mb, Mg, Mr, Mre, Ab, Are | |
| Bare land | Lb, Lre, Are, Lg | Lb, Lre, Mg, Mr, Mre, Ab | |
| 6 | Seriphidium transiliense | Lre, Mr, Ab, Mre | Lre, Mb, Lg, Mg, Lr, Are |
| Ceratocarpus arenarius | Lb, Mb, Lg, Mg, Lr, Lre, Are | Mr, Ab, Mre | |
| Petrosimonia sibirica | Lb, Lr, Lre, Mb, Lg, Mg, Mr, Mre, Ab, Are | ||
| Bare land | Lre, Lb, Mr, Mre, Lg | Mb, Mg, Lr, Ab, Are | |
| 9 | Seriphidium transiliense | Ab, Mb, Mr, Lre, Mre, Mg, Lg | Lb, Lr, Are |
| Ceratocarpus arenarius | Lre, Mre, Lg | Lb, Mb, Mg, Lr, Mr, Ab, Are | |
| Bare land | Ab, Mb, Mr, Lre, Mre, Mg, Lg | Lb, Lr, Are |
| Time (Month) | Species | Eliminated parameters | Retained parameters |
|---|---|---|---|
| 4 | Seriphidium transiliense | RI, NDGI, VOG, DVI, PSRI | NDVI, RVI, BNDVI, GNDVI, EVI, PRI, RENDVI |
| Ceratocarpus arenarius | PRI, RI, NDGI, PSRI | NDVI, RVI, DVI, BNDVI, GNDVI, EVI, RENDVI, VOG | |
| Petrosimonia sibirica | RI, NDGI, DVI, PSRI | NDVI, RVI, BNDVI, GNDVI, EVI, PRI, RENDVI, VOG | |
| Bare land | PRI, RI, NDGI, VOG, DVI, PSRI | NDVI, RVI, BNDVI, GNDVI, EVI, RENDVI | |
| 6 | Seriphidium transiliense | RENDVI, PRI | NDVI, RVI, DVI, BNDVI, GNDVI, EVI, NDGI, RI, PSRI, VOG |
| Ceratocarpus arenarius | PRI | NDVI, RVI, DVI, BNDVI, GNDVI, EVI, NDGI, RI, PSRI, RENDVI, VOG | |
| Petrosimonia sibirica | RENDVI, PRI | NDVI, RVI, DVI, BNDVI, GNDVI, EVI, NDGI, RI, PSRI, VOG | |
| Bare land | RENDVI, PRI | NDVI, RVI, DVI, BNDVI, GNDVI, EVI, NDGI, RI, PSRI, VOG | |
| 9 | Seriphidium transiliense | BNDVI, GNDVI, PRI, DVI, RI | NDVI, RVI, DVI, EVI, NDGI, PSRI, VOG |
| Ceratocarpus arenarius | BNDVI, GNDVI, RI | NDVI, RVI, DVI, EVI, NDGI, PRI, PSRI, RENDVI, VOG | |
| Bare land | BNDVI, GNDVI, DVI, RI | NDVI, RVI, EVI, NDGI, PRI, PSRI, RENDVI, VOG |
Recognition object discrimination
Characteristic parameter discrimination
In April, 1,200 samples of the three plants and bare land were divided into a training set and a test set at a ratio of 7:3. Taking the selected spectral characteristic parameters as input variables, a discrimination model was established, and the recognition effect is shown in Fig. 4. Discriminant analysis of S. transiliense (A), C. arenarius (B), P. sibirica (C) and bare land (D) was performed. When classifying S. transiliense and the other three objects, S. transiliense was incorrectly identified 17 times, with an accuracy of 81.11%. The other objects were incorrectly identified as S. transiliense 102 times, with an accuracy of 62.22%, yielding a total accuracy of 71.67%. When classifying C. arenarius with the other three objects, C. arenarius was incorrectly identified six times, with an accuracy of 95.56%, and other objects were incorrectly identified as C. arenarius 51 times, with an accuracy of 79.26%, yielding a total accuracy of 87.41%. When classifying P. sibirica and the other three objects, the other objects were incorrectly identified as P. sibirica 52 times, with an accuracy of 82.96%, yielding a total accuracy of 85.93%. When classifying the bare land and the three plants, the bare land and all plants were classified into the correct category with an accuracy of 100%.
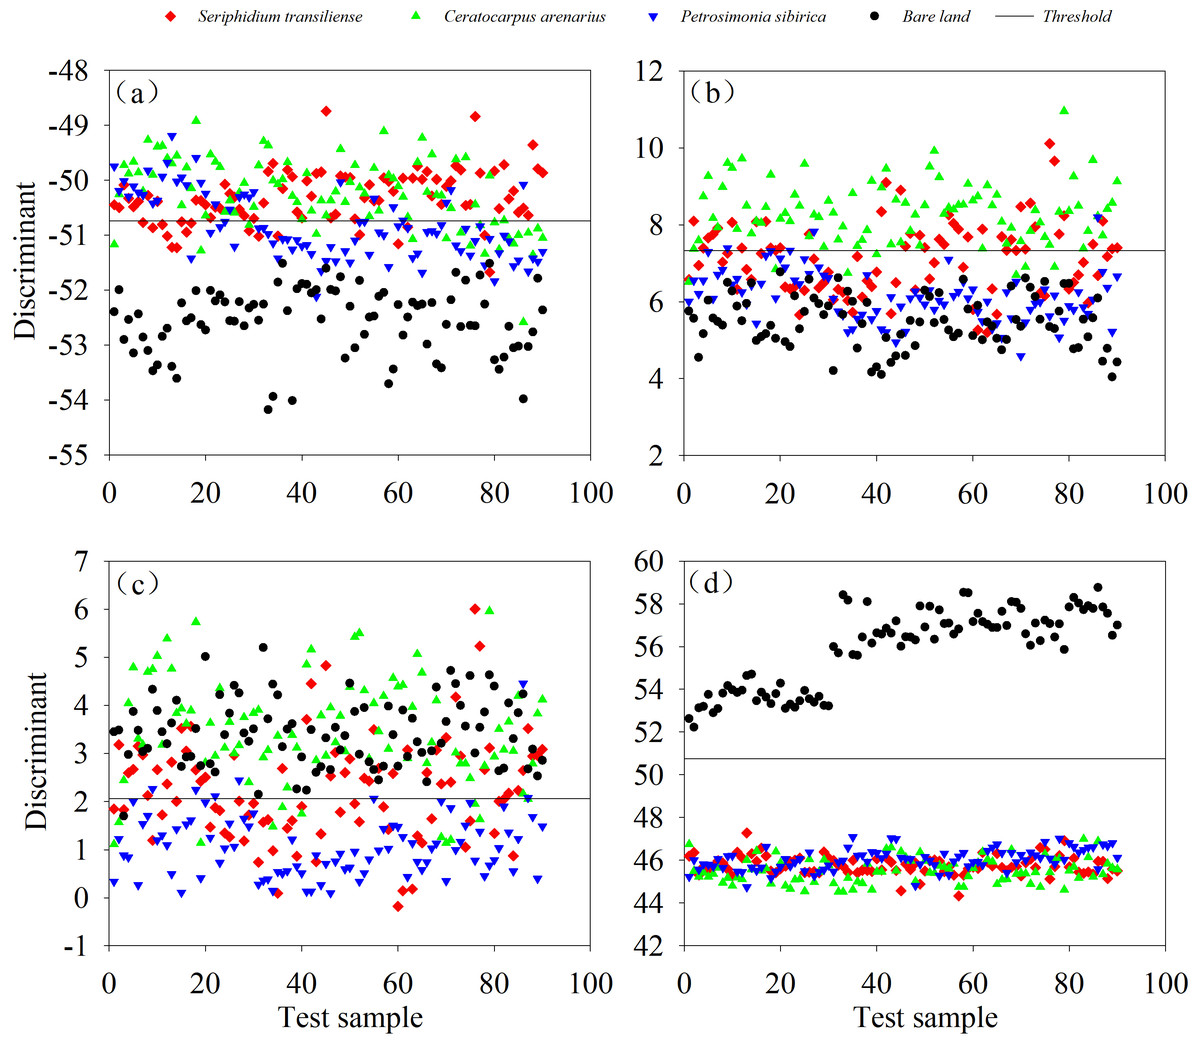
Figure 4: Classification based on characteristic parameters in April.
(A) Classification results of Seriphidium transiliense and the other three types of recognition objects, (B) classification results of Ceratocarpus arenarius and the other three types of recognition objects, (C) classification results of Petrosimonia sibirica and the other three types of recognition objects, (D) classification results of bare land and the other three types of plants.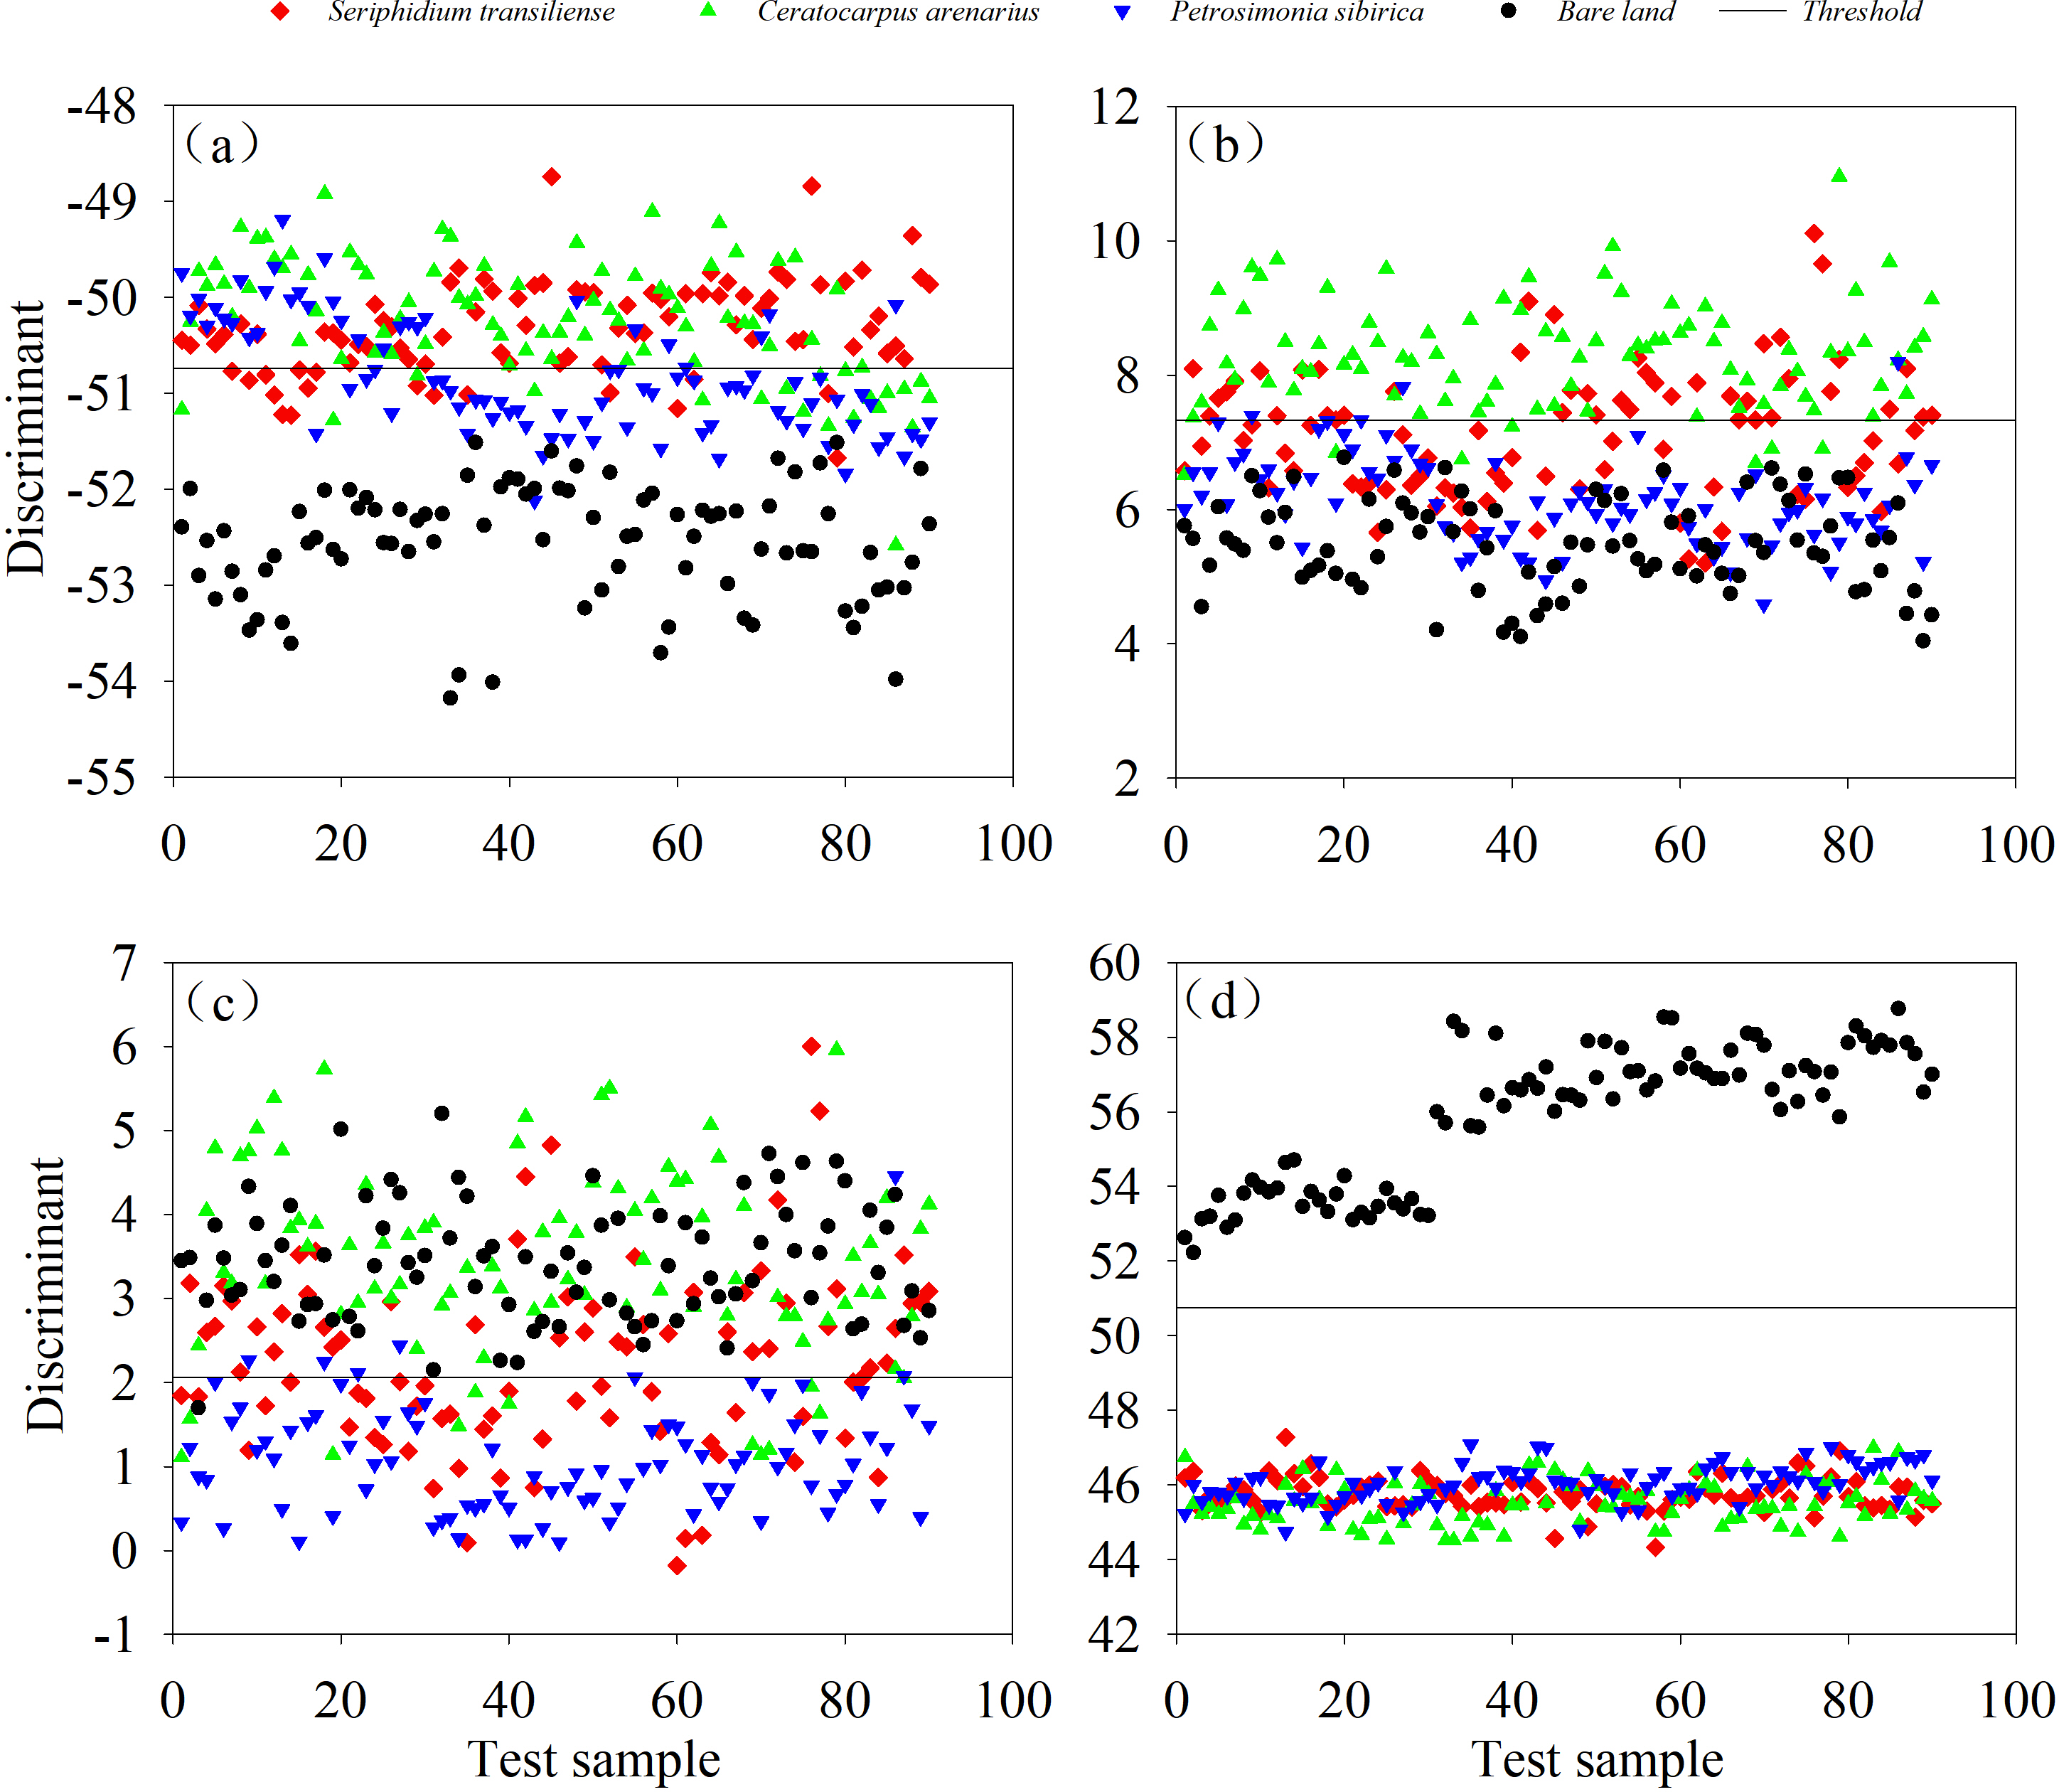
In June, 910 samples of the three plants and bare land were divided into a training set and a test set at a ratio of 7:3. The test set samples of S. transiliense, C. arenarius, P. sibirica and bare land were classified. When classifying S. transiliense and the other three objects, S. transiliense was incorrectly identified four times, with an accuracy of 95.56%. The other objects were incorrectly identified as S. transiliense three times, with an accuracy of 98.36%, yielding a total accuracy of 96.96%. When classifying C. arenarius with the other three objects, C. arenarius was incorrectly identified 15 times, with an accuracy of 83.33%, and the other objects were incorrectly identified 32 times as C. arenarius, with an accuracy of 82.51%, yielding a total accuracy of 82.92%. When classifying P. sibirica and the other three objects, P. sibirica was incorrectly identified once, with an accuracy of 66.66%, and the other objects were incorrectly identified three times as P. sibirica, with an accuracy of 98.89%, yielding a total accuracy of 82.78%. When classifying the bare land and the three plants, the bare land and all plants were placed in the correct category, and the other objects were incorrectly identified as bare land 32 times, with an accuracy of 82.51%, yielding a total accuracy of 91.26% (Fig. 5).
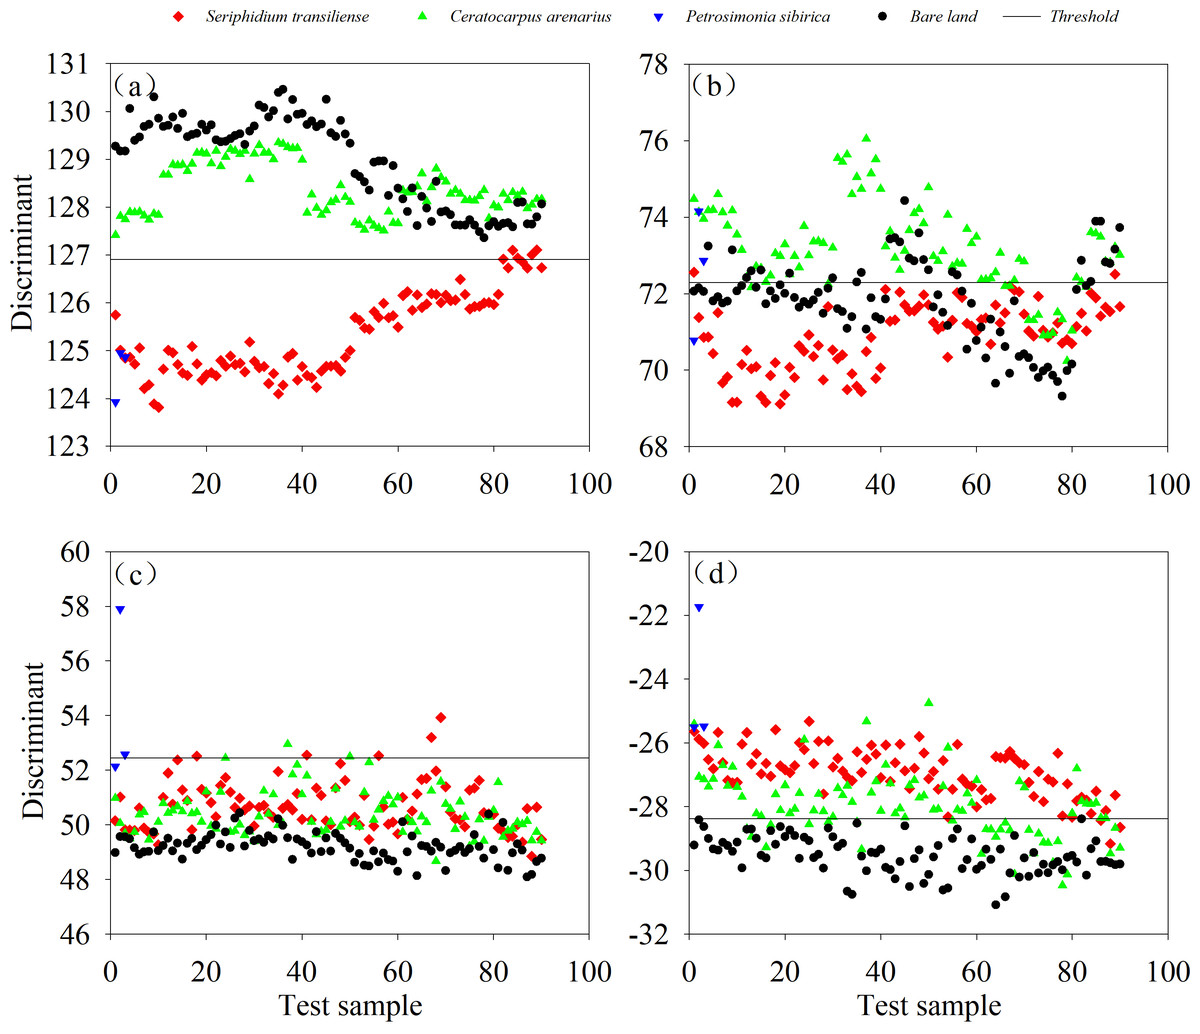
Figure 5: Classification based on characteristic parameters in June.
(A) Classification results of Seriphidium transiliense and the other three types of recognition objects, (B) classification results of Ceratocarpus arenarius and the other three types of recognition objects, (C) classification results of Petrosimonia sibirica and the other three types of recognition objects, (D) classification results of bare land and the other three types of plants.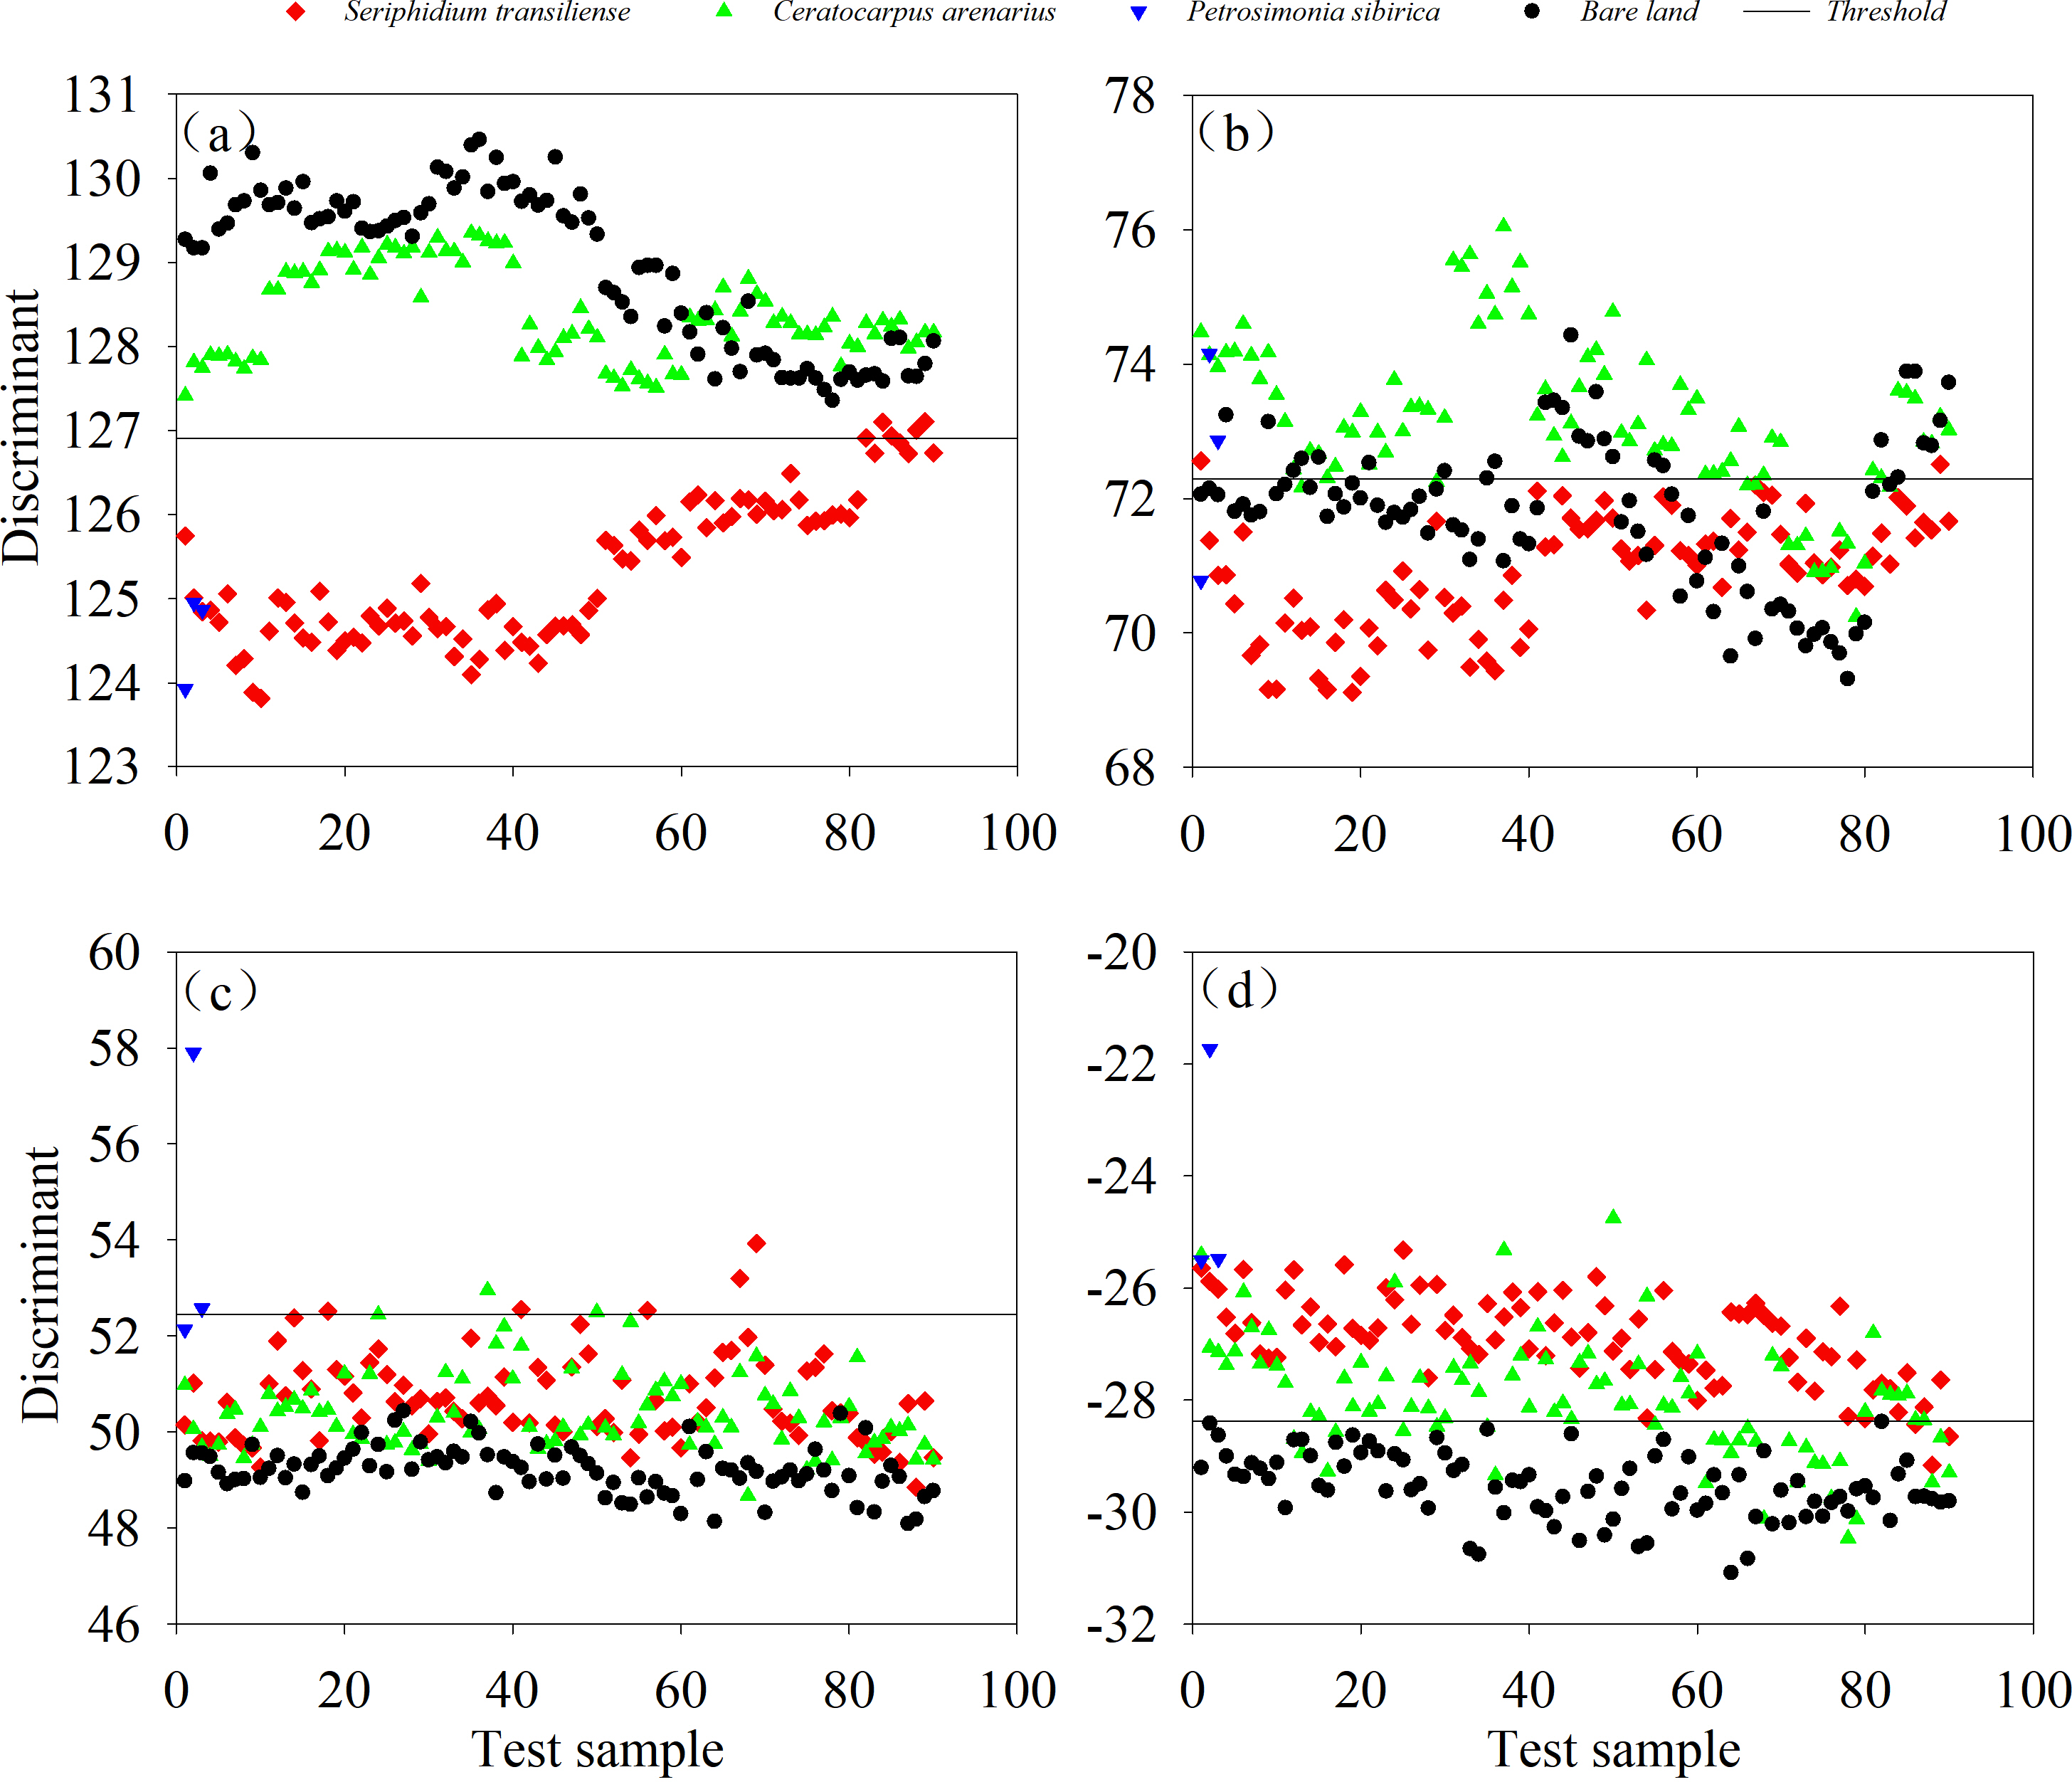
A total of 614 samples of three plants and bare land were divided into a training set and a test set at a ratio of 7:3. When classifying S. transiliense and the other three objects, S. transiliense was incorrectly identified zero times, with an accuracy of 100%, and the other objects were incorrectly identified as S. transiliense zero times, with an accuracy of 100%, yielding a total accuracy of 100%. When classifying C. arenarius with other objects, C. arenarius was incorrectly identified once, with an accuracy of 75%, and the other objects were incorrectly identified as C. arenarius 56 times, with an accuracy of 68.89%, yielding a total accuracy of 71.95%. When classifying the bare land and the other two plants, all the bare land was placed in the correct category, and the other objects were incorrectly identified as bare land four times, with an accuracy of 95.74%, yielding a total accuracy of 97.37% (Fig. 6).
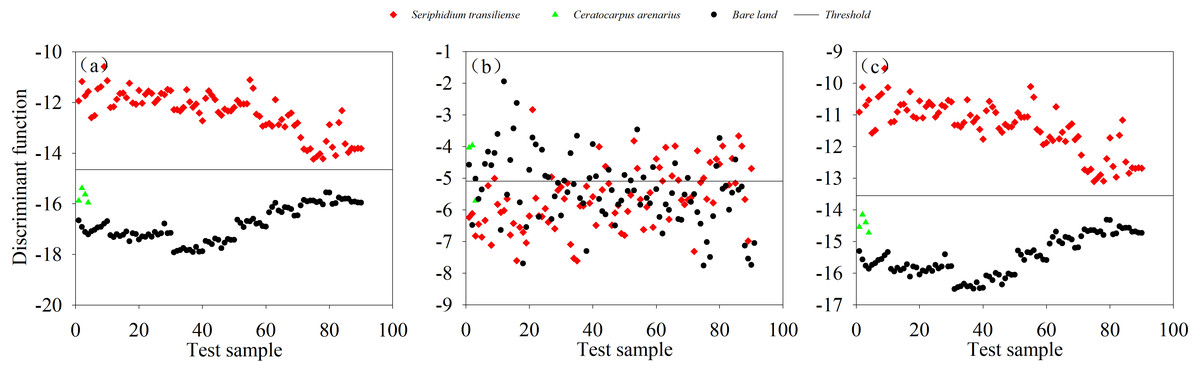
Figure 6: (A–C) Classification based on characteristic parameters in September.
Vegetation index model and accuracy evaluation
In April, 1,200 samples of three plants and bare land were divided into a training set and a test set at a ratio of 7:3. The samples in the test set were classified as S. transiliense, C. arenarius, P. sibirica and bare ground. When classifying S. transiliense and the other three objects, S. transiliense was incorrectly identified 10 times, with an accuracy of 88.89%. The other objects were incorrectly identified as S. transiliense 57 times, with an accuracy of 78.89%, yielding a total accuracy of 83.89%. When classifying C. arenarius with the other three objects, C. arenarius was incorrectly identified seven times, with an accuracy of 92.22%, and the other objects were incorrectly identified as C. arenarius 46 times, with an accuracy of 82.96%, yielding a total accuracy of 86.30%. When classifying P. sibirica and the other three objects, P. sibirica was incorrectly identified three times, with an accuracy of 96.67%. The other objects were incorrectly identified as P. sibirica 38 times, with an accuracy of 85.93%, yielding a total accuracy of 91.30%. When classifying the bare land and the three plants, the bare land and all plants were placed in the correct category, with an accuracy of 100% (Fig. 7).
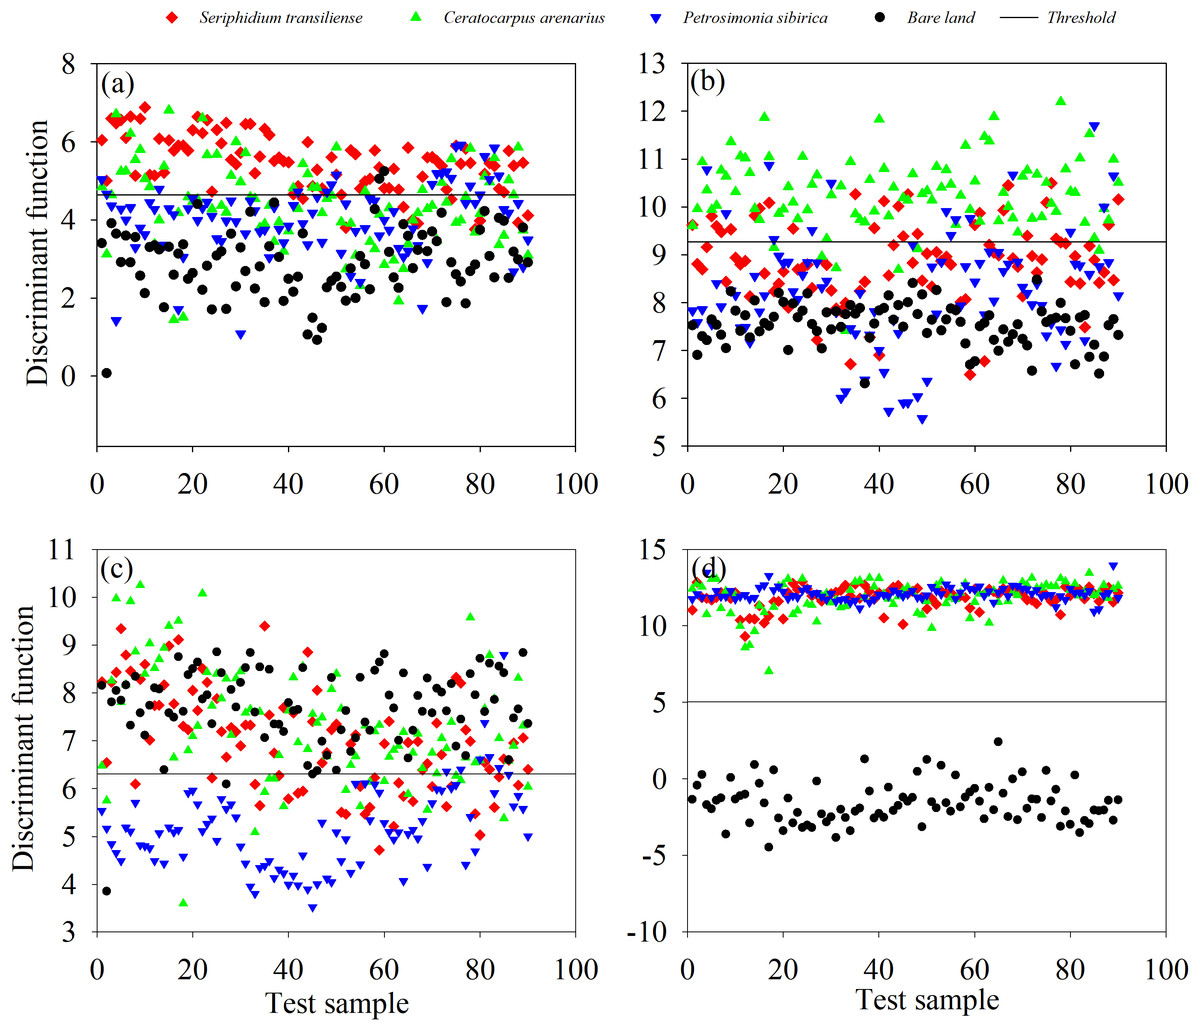
Figure 7: Classification based on the vegetation indices in April.
(A) Classification results of Seriphidium transiliense and the other three types of recognition objects, (B) classification results of Ceratocarpus arenarius and the other three types of recognition objects, (C) classification results of Petrosimonia sibirica and the other three types of recognition objects, (D) classification results of bare land and the other three types of plants.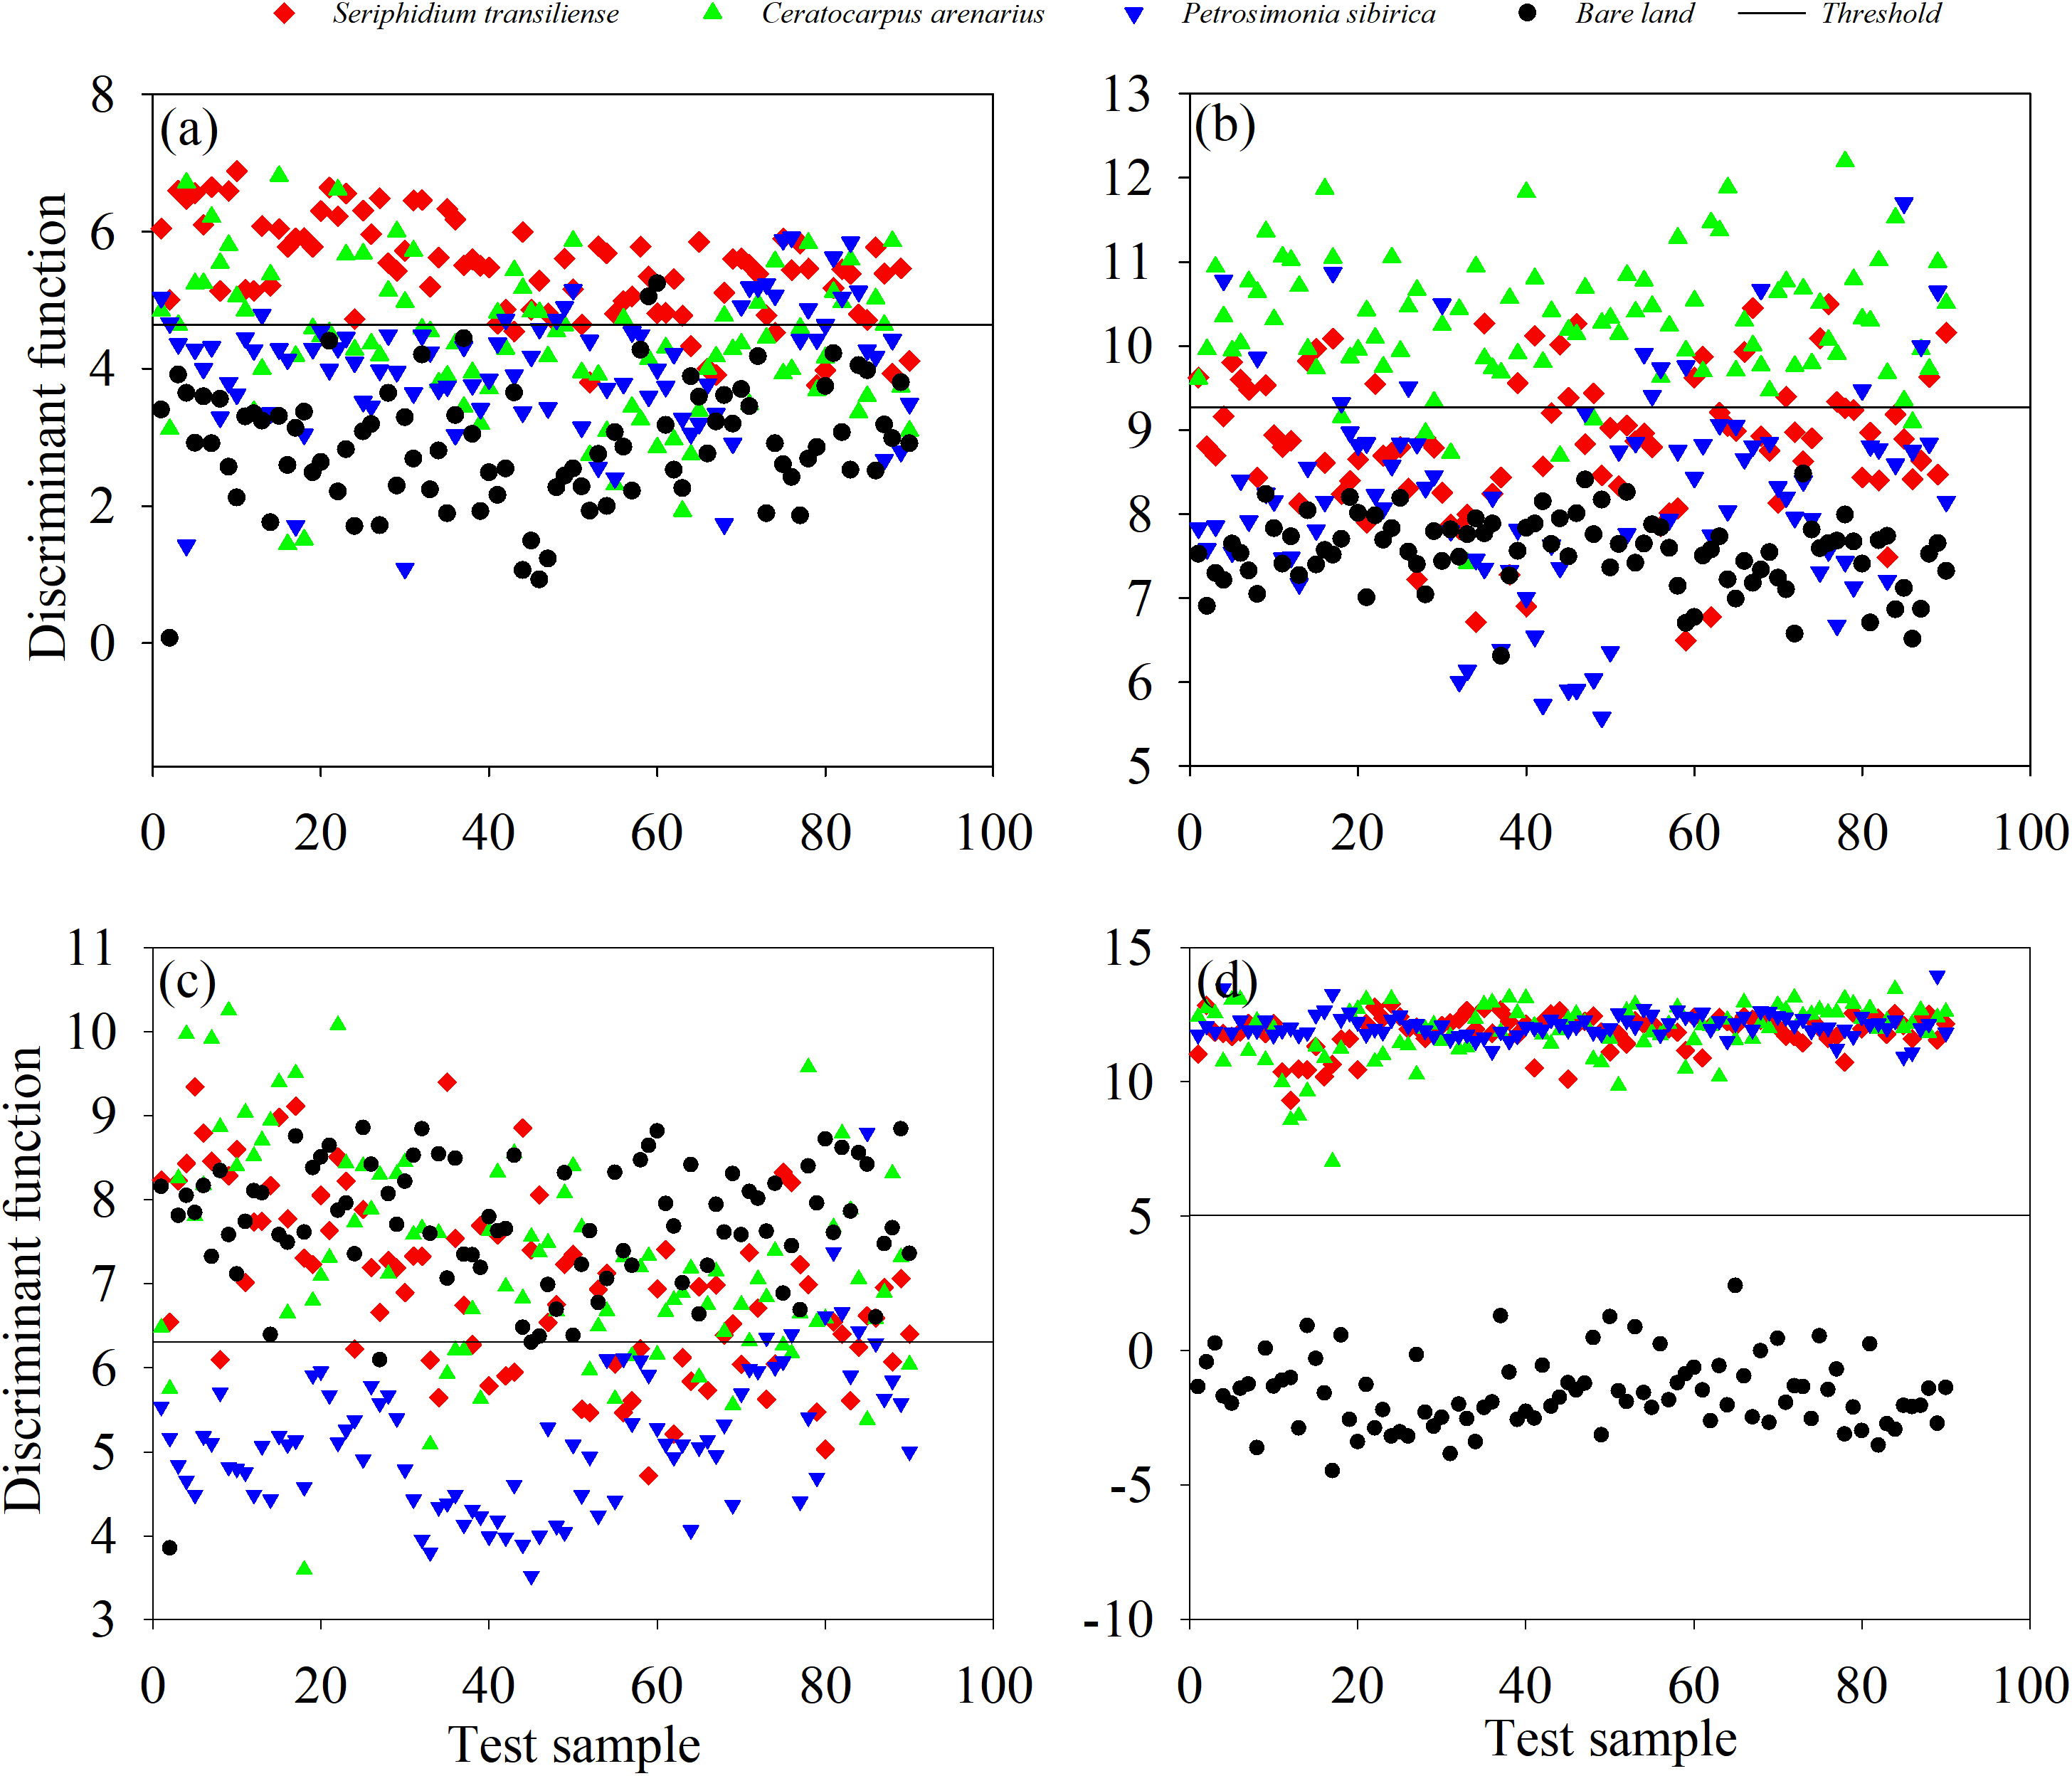
In June, 910 samples of three plants and bare land were divided into a training set and a test set at a ratio of 7:3. When classifying S. transiliense and the other three objects, S. transiliense was incorrectly identified zero times, with an accuracy of 100%. When classifying C. arenarius with the other three objects, C. arenarius was incorrectly identified as S. transiliense four times, with an accuracy of 95.56%, and the other objects were incorrectly identified as C. arenarius eight times, with an accuracy of 95.63%, yielding a total accuracy of 95.60%. When classifying P. sibirica and the other three objects, P. sibirica was incorrectly identified zero times, with an accuracy of 100%. Other objects were incorrectly identified as P. sibirica zero times, with an accuracy of 100%, yielding a total accuracy of 100%. When classifying the bare land and the three plants, the bare land and all plants were placed in the correct category, and the other objects were incorrectly identified as bare land 15 times, with an accuracy of 91.80%, yielding a total accuracy of 95.90% (Fig. 8).
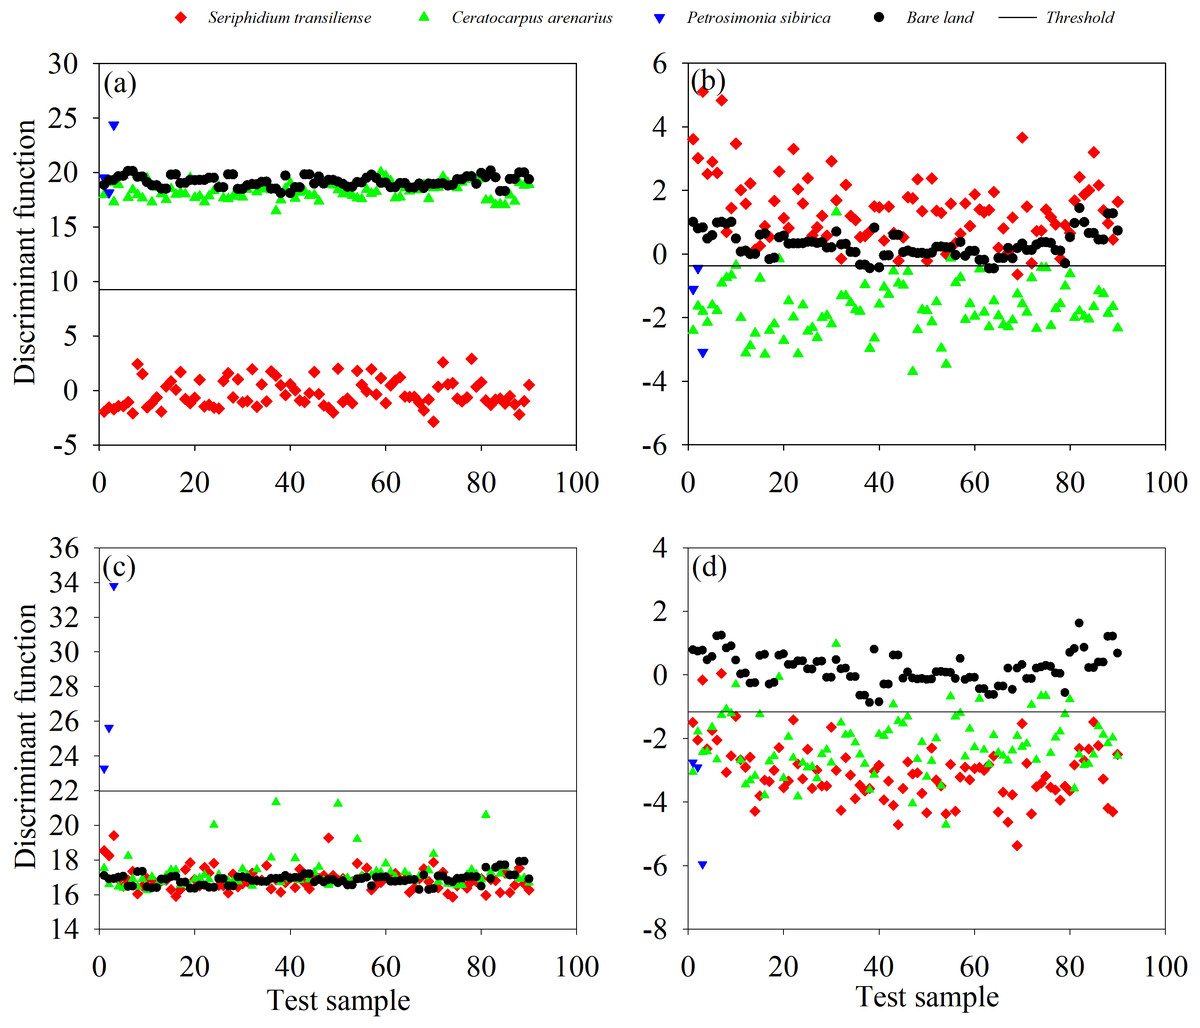
Figure 8: Classification based on the vegetation indices in June.
(A) Classification results of Seriphidium transiliense and the other three types of recognition objects, (B) classification results of Ceratocarpus arenarius and the other three types of recognition objects, (C) classification results of Petrosimonia sibirica and the other three types of recognition objects, (D) classification results of bare land and the other three types of plants.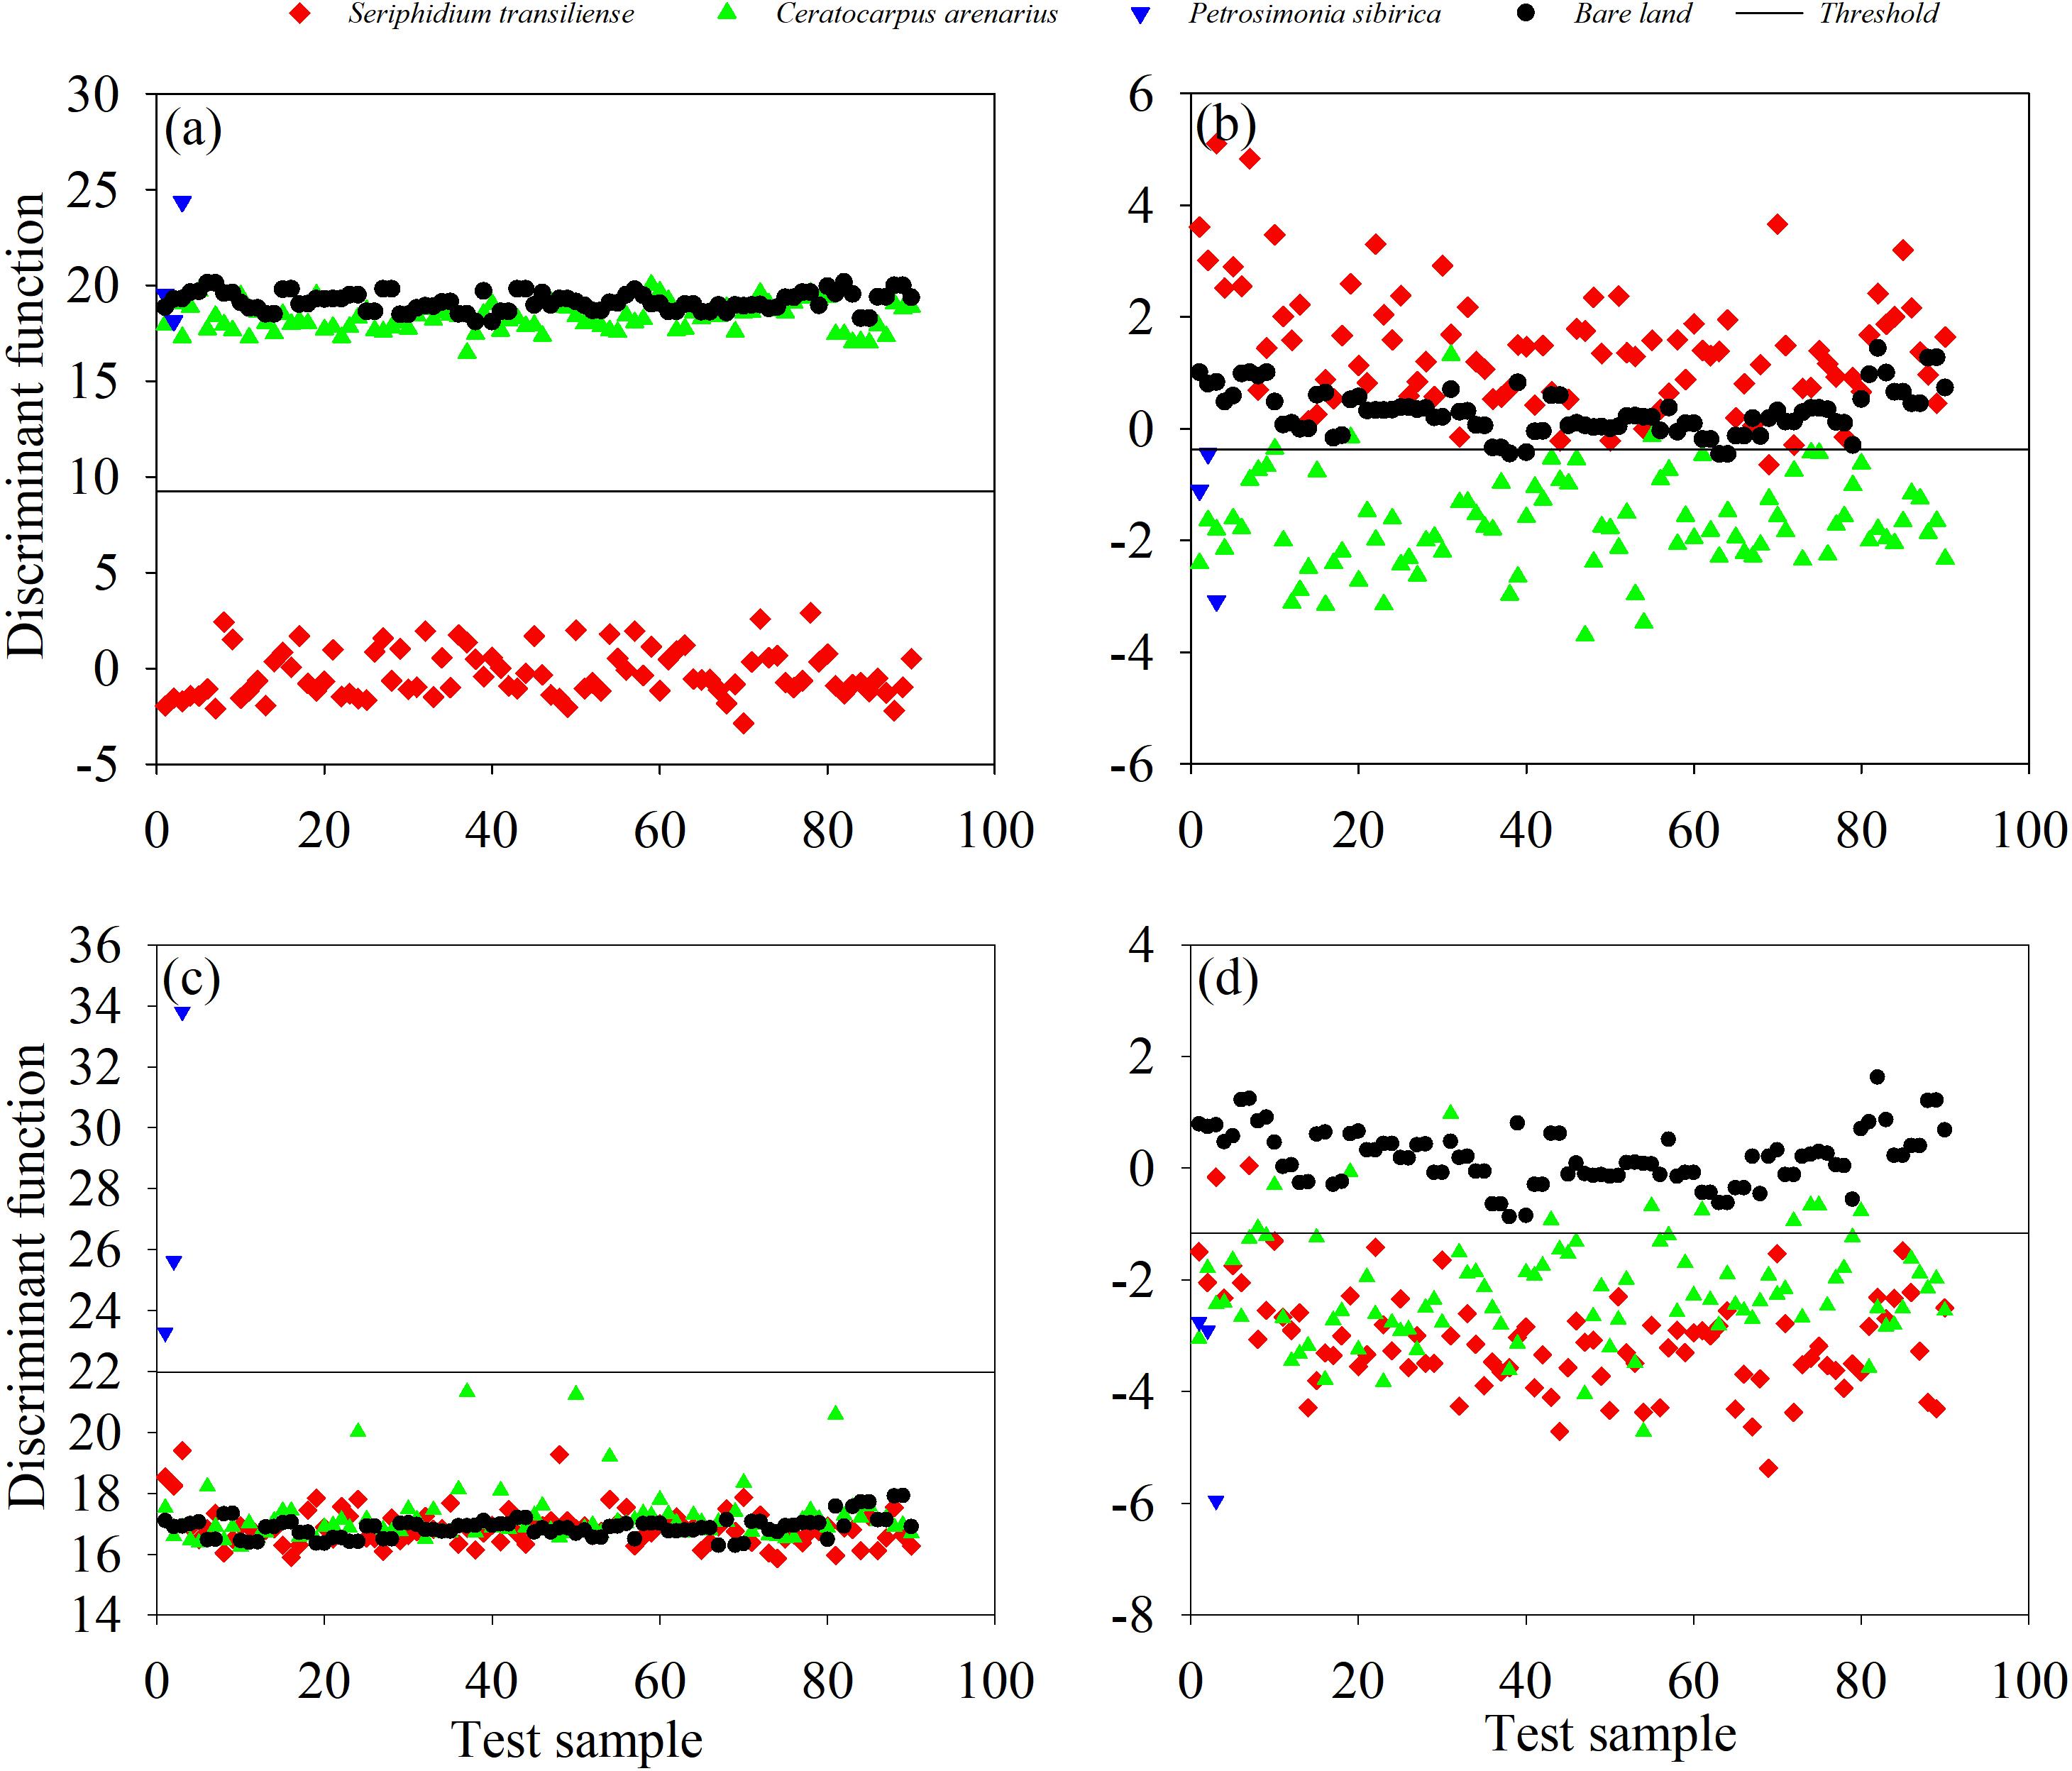
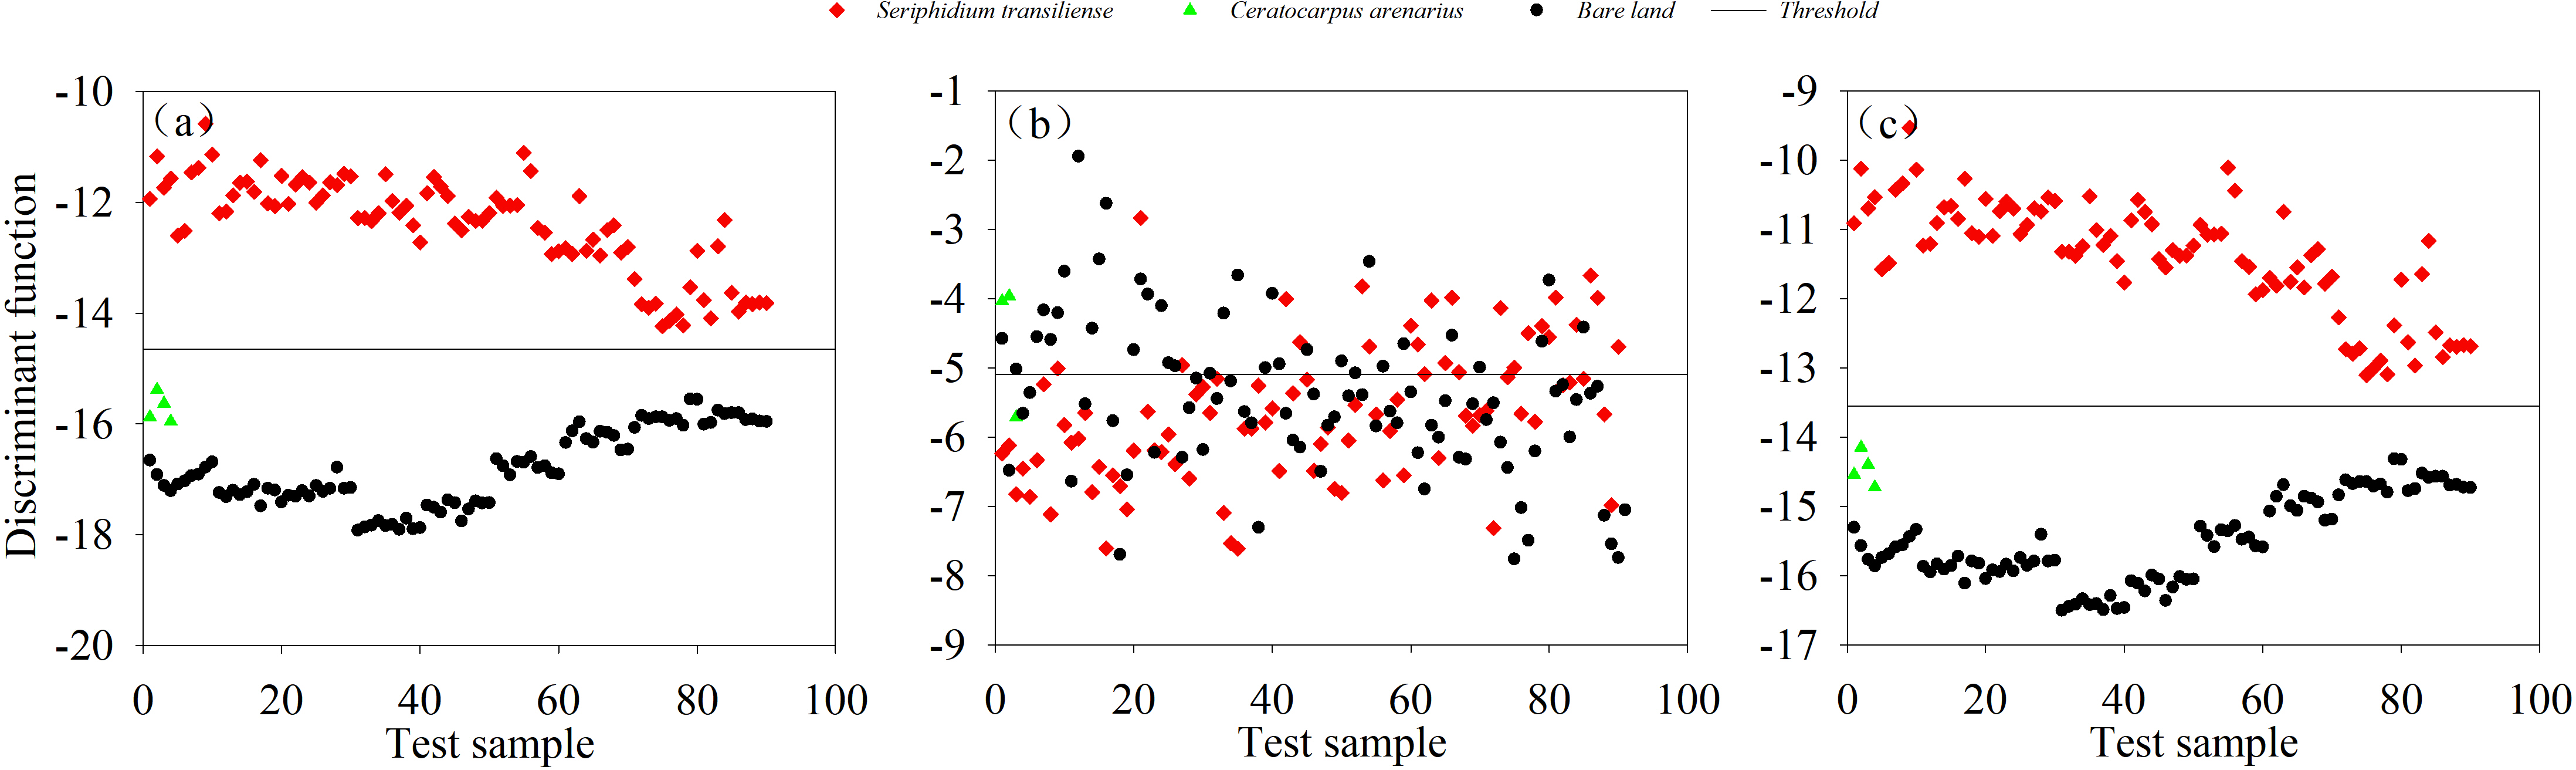
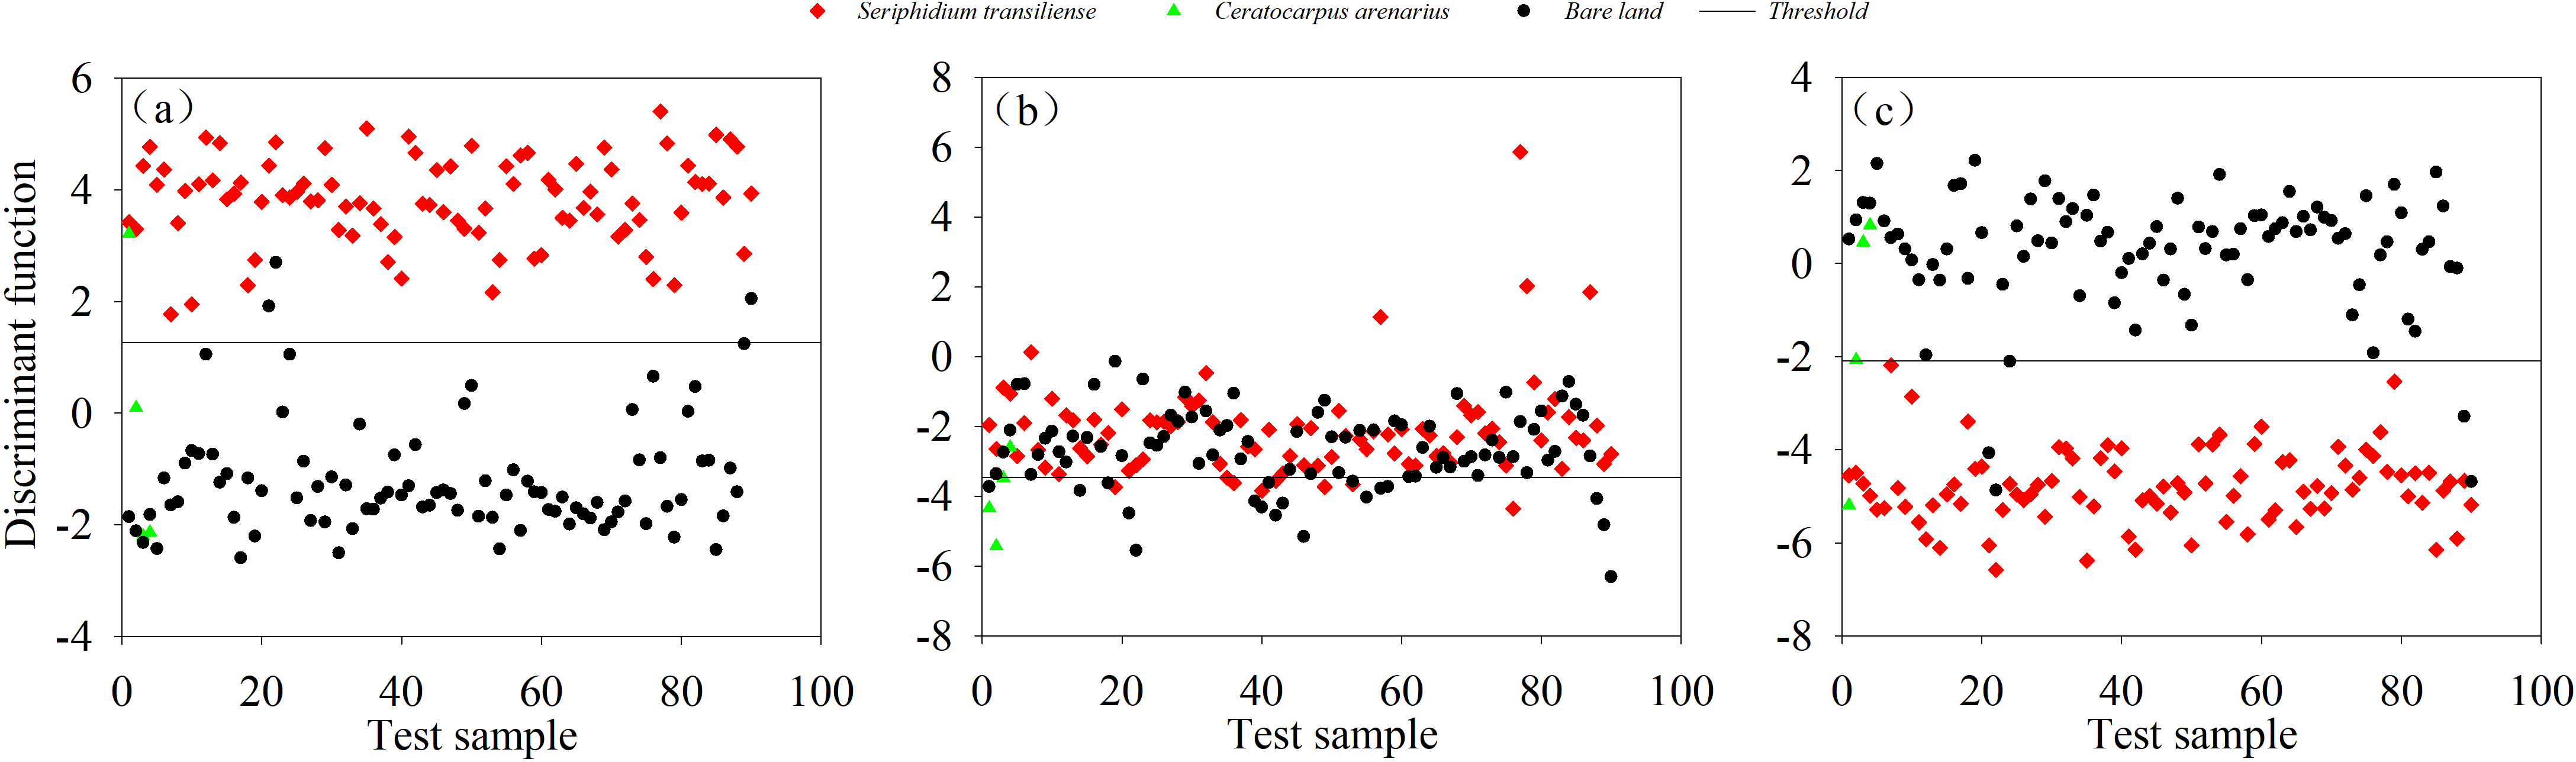
In September, 614 samples of three plants and bare land were divided into a training set and a test set at a ratio of 7:3. When classifying S. transiliense and the other three objects, S. transiliense was incorrectly identified zero times, with an accuracy of 100%, and the other objects were incorrectly identified three times as S. transiliense, with an accuracy of 96.81%. The total accuracy was 98.41%. When classifying C. arenarius and other objects, C. arenarius was incorrectly identified once, with an accuracy of 75%, and the other objects were incorrectly identified as S. transiliense 25 times, with an accuracy of 86.11%, yielding a total accuracy of 80.56%. When classifying bare land and the other two plants, bare land was incorrectly identified five times, with an accuracy of 94.44%, and the other objects were incorrectly identified three times as bare land, with an accuracy of 96.81%, yielding a total accuracy of 95.63% (Fig. 9).
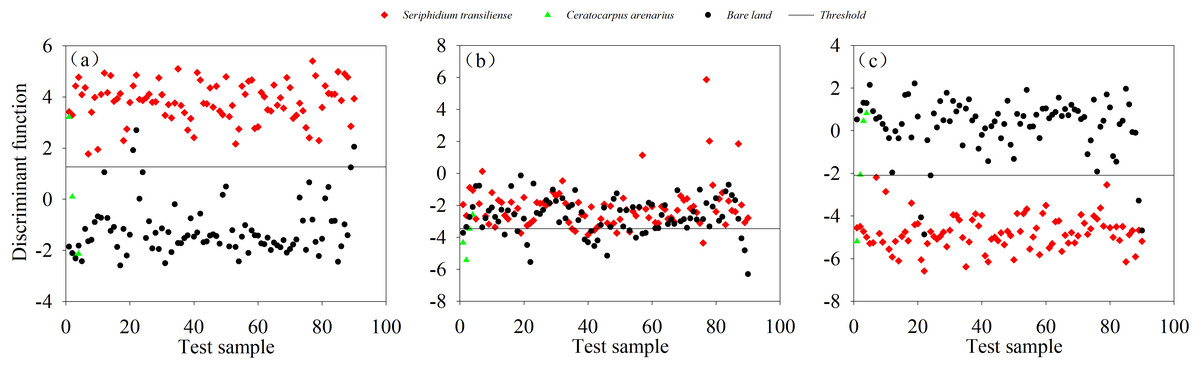
Figure 9: (A–C) Classification based on the vegetation indices in September.
Discussion
Differences in identification parameters among seasons
The recognition parameters showed different responses in different recognition seasons and for different recognition objects, revealing a certain complexity. The parameters of the same plant and the remaining recognition objects are significantly different in different seasons, and accurate classification can be achieved based on differences in plant phenology (Weisberg et al., 2021). In this study, both the spectral characteristic parameters and the vegetation indices reflected this result; for example, there were six spectral characteristic parameters in April (the period of seedling establishment) for S. transiliense, which significantly differed from the number for other recognition objects, while there were two in June (the peak period) and September (the dry and yellow periods). The reason is that the spectra of the same plant differ depending on the phenological period (Ouyang et al., 2013; Soubry & Guo, 2021; Wang et al., 2021). Although the spectral characteristics of different plants are roughly the same, they are still different in terms of reflectivity or some individual bands (Ge et al., 2006; Liang, Yang & Xing, 2021; Zhou, Li & Xu, 2022). Both the characteristic parameters and vegetation indices are based on the spectra, explaining this result. However, in June (peak period) and September (dry and yellow period), there were red valley positions Lr and red edge areas. These two spectral characteristic parameters showed significant differences among the identified objects, which may be because the red light band is the most sensitive to vegetation and because the S. transiliense desert grassland is affected by drought year round. Vegetation reflectance in the dry and yellow seasons is similar to the spectral reflectance and characteristics of litter on the ground (He et al., 2014).
Identification parameter screening
This study included 10 spectral characteristic parameters and 12 vegetation indices. Through verification via analysis of variance and the discrimination model, it was found that the characteristic parameters and vegetation indices removed and retained in different seasons were different. When these parameters are eliminated one by one, the precision is improved or the same compared with the original precision, which shows that the eliminated parameters do not play a corresponding role in the discrimination of the four recognition objects; in contrast, there will be errors in the identification results due to the similarity of the information included. For example, in April, the three parameters Lb, Lr, and Lre show only small, nonsignificant differences among plants and are thus eliminated, while Lg does not show significant differences among the four recognition objects but is retained. This may be because Lg is strongly affected by plant chlorophyll content (Datt, 2010). Dmitriev et al. (2022) also reported that the vegetation indices used to identify Populus plants vary among periods, which is related to the chlorophyll content and photosynthetic intensity. Therefore, whether there are significant differences in parameters among plants cannot be used as the only criterion for elimination, and different characteristic parameters have different contributions and sensitivities in the determination of recognition objects. For example, through a continuous projection algorithm, Cao et al. (2023) reported that among 27 spectral parameters, colour parameters played a more important role in the classification of 18 oolong tea cultivars and can be accurately divided into early, mesophytic, and late species, with a recognition accuracy of more than 90%.
Identification of different parameters in the same season
In the same season, the characteristic parameters and vegetation indices were used to classify and identify the three types of plants and bare land. The discrimination accuracy of bare land is always high because the spectral reflectance and characteristics of bare land are quite different from those of vegetation (Qiao et al., 2022); therefore, bare land had little effect on the ground hyperspectral identification of the three types of plants. However, there were some differences in the accuracy obtained by using different types of recognition parameters; for example, in April (returning green stage), the accuracy of the characteristic parameters was 85.51%, and those of the vegetation indices were 89.50%, 92.50% and 98.01% in June (peak period) and 89.85% and 86.16% in September (dry and yellow period), respectively. In this study, different characteristic parameters were selected to establish the discrimination model, and the vegetation index model had the best recognition effect and the highest accuracy. When using a single model for identification in different periods, the overall recognition accuracy of the characteristic parameters was 85.98% in April, 88.48% in June and 89.77% in September; the overall accuracy of the vegetation index model was 90.37% in April, 97.88% in June and 91.53% in September. Characteristic parameters and vegetation indices are also widely used as identification parameters, but the species, quantity and identification accuracy of vegetation indices selected when identifying different plants are different (Li et al., 2016). Du et al. (2021) classified four dominant plant communities in wetlands by calculating vegetation indices through screening feature bands. The highest recognition accuracy for the dominant species, Phragmites australis, was 89.17%, while the recognition performance for Scirpus triqueter was relatively poor at 72.80%. This study also showed the best recognition effect for the dominant species Seriphidium transiliense, with an overall accuracy of 89.54% for the characteristic parameters and a vegetation index of 94.10%.
Identification of the same parameter in different seasons
The accuracy of classification and identification using the same identification parameters also differed between periods. For example, the characteristic parameters used in April (turning green period) yielded an accuracy of 85.51% in April, 92.50% in June (peak period), 89.85% in September (dry yellow period), 89.50% in April (turning green period), 98.01% in June (peak period), and 86.16% in September (dry yellow period). Scholars have also studied the identification and classification of different vegetation or plants at different scales in different periods and determined the optimal period. Liu et al. (2002) compared the classification results of different band combinations and finally generated a vegetation map, concluding that the images obtained in late spring and summer were better than those obtained in other seasons. Lu & He (2017) used spectral indices to classify Canadian grassland plants and found that the overall accuracy in June was the highest at 86%, which is consistent with the result of this study that the optimal period for the identification of S. transiliense desert grassland was June (the peak period). Furthermore, Tarantino et al. (2019) studied the classification results of multiseasonal WorldView-2 (WV-2) satellite images, which were used to map the invasive species Ailanthus altissima, and concluded that the combination of remote sensing images of communities and corresponding growing seasons was the best strategy, which was helpful for vegetation interpretation and classification (Wei et al., 2017a; Wei et al., 2017b), similar to the results of this study. Therefore, in this study, the identification parameters were used to identify the optimal combination of vegetation indices in June (peak period) for three main plants in the S. transiliense desert grassland.
Conclusions
The identification model established based on the vegetation indices in June had the best discrimination, with the highest accuracy for the test samples of S. transiliense, C. arenarius, P. sibirica and bare land, reaching 100.00%, 95.60%, 100.00% and 95.90%, respectively. Considering the identification period and parameters, the vegetation index model is the best way to identify land features in the sericite–Artemisia desert grassland in June.