
A retrospective evaluation of individual thigh muscle volume disparities based on hip fracture types in followed-up patients: an AI-based segmentation approach using UNETR
- Published
- Accepted
- Received
- Academic Editor
- Meir Barak
- Subject Areas
- Orthopedics, Radiology and Medical Imaging, Computational Science, Data Mining and Machine Learning, Rehabilitation
- Keywords
- AI, Segmentation, CT, Radiology, Hip fracture, Thigh, Muscle volume, Disparity, UNETR
- Copyright
- © 2024 Kim et al.
- Licence
- This is an open access article distributed under the terms of the Creative Commons Attribution License, which permits using, remixing, and building upon the work non-commercially, as long as it is properly attributed. For attribution, the original author(s), title, publication source (PeerJ) and either DOI or URL of the article must be cited.
- Cite this article
- 2024. A retrospective evaluation of individual thigh muscle volume disparities based on hip fracture types in followed-up patients: an AI-based segmentation approach using UNETR. PeerJ 12:e17509 https://doi.org/10.7717/peerj.17509
Abstract
Background
Hip fractures are a common and debilitating condition, particularly among older adults. Loss of muscle mass and strength is a common consequence of hip fractures, which further contribute to functional decline and increased disability. Assessing changes in individual thigh muscles volume in follow-up patients can provide valuable insights into the quantitative recovery process and guide rehabilitation interventions. However, accurately measuring anatomical individual thigh muscle volume can be challenging due to various, labor intensive and time-consuming.
Materials and Methods
This study aimed to evaluate differences in thigh muscle volume in followed-up hip fracture patients computed tomography (CT) scans using an AI based automatic muscle segmentation model. The study included a total of 18 patients at Gyeongsang National University, who had undergone surgical treatment for a hip fracture. We utilized the automatic segmentation algorithm which we have already developed using UNETR (U-net Transformer) architecture, performance dice score = 0.84, relative absolute volume difference 0.019 ± 0.017%.
Results
The results revealed intertrochanteric fractures result in more significant muscle volume loss (females: −97.4 cm3, males: –178.2 cm3) compared to femoral neck fractures (females: −83 cm3, males: −147.2 cm3). Additionally, the study uncovered substantial disparities in the susceptibility to volume loss among specific thigh muscles, including the Vastus lateralis, Adductor longus and brevis, and Gluteus maximus, particularly in cases of intertrochanteric fractures.
Conclusions
The use of an automatic muscle segmentation model based on deep learning algorithms enables efficient and accurate analysis of thigh muscle volume differences in followed up hip fracture patients. Our findings emphasize the significant muscle loss tied to sarcopenia, a critical condition among the elderly. Intertrochanteric fractures resulted in greater muscle volume deformities, especially in key muscle groups, across both genders. Notably, while most muscles exhibited volume reduction following hip fractures, the sartorius, vastus and gluteus groups demonstrated more significant disparities in individuals who sustained intertrochanteric fractures. This non-invasive approach provides valuable insights into the extent of muscle atrophy following hip fracture and can inform targeted rehabilitation interventions.
Introduction
Hip fractures represent a significant health concern, particularly among the older population. These fractures often lead to a substantial loss of muscle mass and strength, which can contribute to functional decline and increased disability (Yoo et al., 2018; Turkmen & Ozcan, 2019; Groenendijk et al., 2020). Efficient and targeted rehabilitation strategies are, therefore, crucial to mitigate the loss of thigh muscles, which play a significant role in mobility following a hip fracture (Pham et al., 2017; Min et al., 2021; Yoo et al., 2022).
In the realm of hip fractures, several prominent types can be identified, including femoral neck fractures (FNF), intertrochanteric fractures (ITF), greater trochanteric fractures and lesser trochanter fractures. A femoral neck fracture, which takes place in the region connecting the femoral shaft to the femoral head, leads to atrophy in the muscles of the hip flexors, adductors and the gluteal region muscles (Chang et al., 2023). An intertrochanteric fracture occurs between the greater and lesser trochanter, leads to muscle loss in the hip adductor and quadriceps muscle groups (Satone et al., 2022). These insights inform the necessity of targeting specific muscles for rehabilitation post-hip fracture surgery, tailored to the type of fracture sustained. However, quantifying the progress of this specialized treatment can prove to be a challenging task.
The cross-sectional area (CSA) of muscles has been utilized to assess muscle size, intending to identify individuals at risk of sarcopenia and quantify deformities of muscles, the degenerative loss of skeletal muscle mass and strength. However, this approach has several limitations. The primary limitation is that by quantifying the muscle area in a single plane, CSA overlooks the complexity of individual muscle groups (Honkanen et al., 2019). It fails to capture essential aspects such as muscle composition, distribution and overall performance. Factors such as participant positioning, limb orientation and the choice of imaging plane can also influence the accuracy and comparability of CSA measurement.
The volume of each individual muscle, obtained by calculating the annotated segmentation mask, can overcome these limitations (Hiasa et al., 2019). However, manual segmentation on CT scans is a time-intensive, laborious and costly task that requires significant effort and expertise. The process often exhibits high variation due to the difficulty of differentiating tissue characteristics. While CT scans provide excellent visualization of bony structures and dense tissue, they have limitations in differentiating soft tissues such as muscles. Muscles have similar radiodensity, making it a challenge to distinguish individual muscles based on CT scans. Yet, achieving precise voxel-level segmentation is critical for accurately quantifying each individual muscles’ volume and gaining comprehensive insights into muscle performance.
To address these challenges, our previous study proposed a deep learning based automatic individual thigh muscle segmentation approach using the UNETR architecture (Hatamizadeh et al., 2021). Our model demonstrated a high degree of accuracy and precision, achieving a dice score of 0.84 and a relative absolute volume difference of 0.019 0.017%. The dice score, a statistical measure of similarity, quantifies the overlap between the model’s segmentation output and the ground truth, while the relative absolute volume difference assesses the absolute difference in volume between the segmented output and the ground truth volume, presented as a percentage. This approach leverages the power of deep learning algorithms to learn intricate muscle features and perform precise segmentation at the voxel level. By automating the segmentation process, our proposed method enables efficient and accurate calculation of each individual muscle’s volume (Kim et al., 2024).
The application of our UNETR based model holds promise in advancing muscle volume assessment and enhancing the rehabilitation process by providing valuable insights into muscle performance. Furthermore, our findings provide the groundwork for future research exploring the potential of automatic muscle segmentation models in large cohorts and assessing functional outcomes based on muscle volume changes.
The primary objective of our study is to specifically examine how individual thigh muscle volumes vary in response to different types of hip fractures, focusing on femoral neck fractures and intertrochanteric fractures. By analyzing pre-operative and post-operative CT scans of patients with these fractures, we aim to identify distinct patterns of muscle volume changes. This detailed examination is designed to provide crucial information that can be used to optimize rehabilitation methods for individuals based on hip fracture type.
Materials and Methods
Study design
In our study, we utilized a trained AI model to execute segmentation of individual thigh muscles, spanning from the hip to knee (whole thigh level), within CT scans (Masoudi et al., 2021). The goal was to calculate the differences in individual thigh muscle volumes between pre-operative and post-operative states. The model was trained using a dataset of 72 CT scans from a cohort of hip fracture patients at Gyeongsang National University.
The study adhered to the principles of the Declaration of Helsinki and was approved by the IRB (IRB No. GNUH 2022-01-032-008) at Gyeongsang National University Hospital. All research procedures were carried out with strict adherence to ethical standards, including protection of participant privacy, confidentiality, and rights. In the cohort of hip fracture patients at Gyeongsang National University Hospital, we screened 49 individuals from a pool of 478. Verbal informed consent was obtained from all participants prior to their participation in the study. These selected participants, who were part of the study from December 2016 to June 2022, had undergone CT scans and had their grip strength and height recorded. The research data were accessed on February 23, 2023 and the period of ethical approval for the study spanned from May 9, 2022 to May 8, 2023.
Utilizing the state-of-the-art deep learning architecture, UNETR, specifically designed for precise voxel-level segmentation and sequential information processing (Masoudi et al., 2021). The trained UNETR model achieved a dice score of 0.84 and relative average volume difference of 0.019% on ground truth annotations provided by two radiologists and the trained segmentation model (Kim et al., 2024). To assess the differences in individual thigh muscle volume, segmentation was performed on both pre-operative and post-operative CT scans, obtained when patients revisited the hospital for unrelated reasons.
Despite the importance of assessing intermuscular or intramuscular adipose tissue in aging populations and their physical capabilities (Waters, 2019), our model was trained using a labeled dataset created by thresholding fat tissues to isolate them as background, enabling the model to exclusively identify muscle tissue while excluding fat within muscle. This limitation impedes accurate assessment of muscle fat infiltration percentages in our current model’s outputs.
Using the outcomes from the segmentation, we computed the volume of each individual thigh muscle and categorized the results by the patient’s gender. We then examined the disparities in muscle volume loss in cubic centimeters (cm3) between patients with femoral neck fractures and those with intertrochanteric fractures. To determine which type of hip fracture exhibited greater disparities in each individual thigh muscle, we calculated the percentage difference relative to the other fracture type.
Additionally, to address the issue of bias due to the small sizes of certain subgroups (femoral neck fracture patient in female group; n = 2), we combined the subgroups based on gender for our analysis. In our merged dataset, the total count of femoral neck fracture patients was six, while intertrochanteric fractures were 12. In this study, we assessed the disparity ratio by dividing the difference in muscle volume between pre-operative and post-operative states by pre-operative muscle volume.
CT scans acquisition
Our investigation included 18 participants, drawn from a cohort of 478 individuals who had been identified with hip fractures. These participants had an average age of 77.3 years old, with a standard deviation of 9.73. Specifically, the average age for females was 78, while for males it was 72.7. Both pre-operative and post-operative CT scans were conducted for each participant in the study. These CT scans were carried out with patients in a supine position (both Head-First Supine and Feet-First Supine), encompassing the entire thigh area from the hip to the knee joint, referred as whole thigh level CT scans. The participants were selected from Gyeongsang National University Hospital during the period from December 2016 to June 2022.
As illustrated in Fig. 1, the criteria for inclusion targeted those with femoral neck fracture and intertrochanteric fracture who were in stable condition, whether to follow up, required evaluation for the skeletal muscle index (SMI) variable and no objections to CT scanning. To uphold the credibility of muscle segmentation, we set exclusion criteria, such as lower limb amputation, femur shaft fracture, subtrochanteric fracture, noticeable muscle or bone deformities and presence of significant artifacts in imaging.
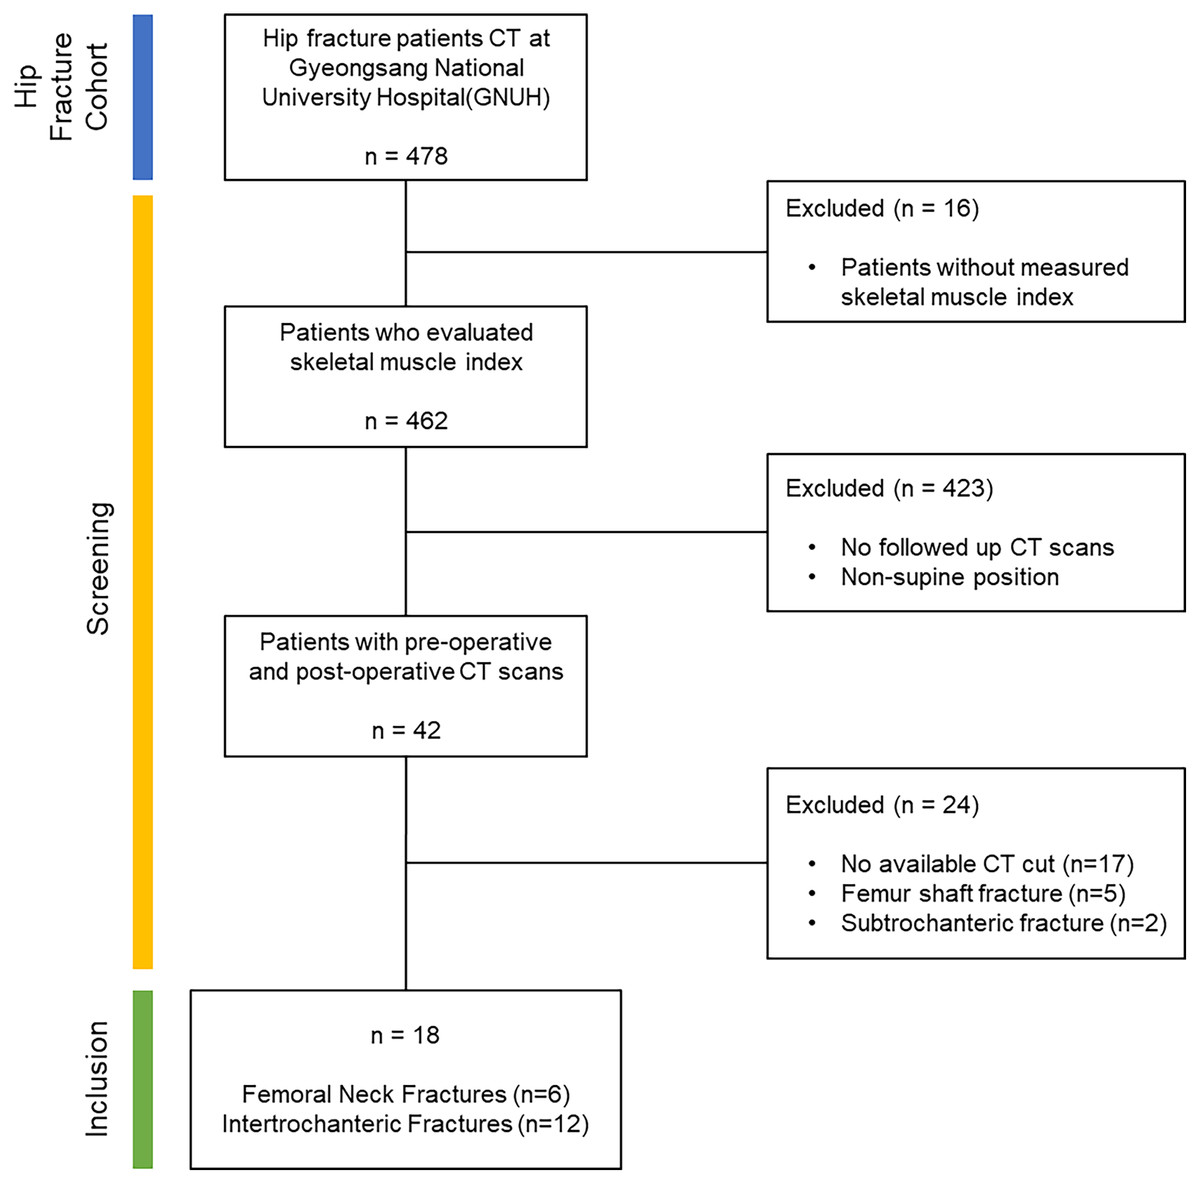
Figure 1: Dataflow: the criteria used for screening within the study.
Starting with a cohort of hip fracture patients totaling 478, we excluded those who did not have skeletal muscle index measurements to enhance the data reliability of the volume calculation results. From the screened patients (n = 462), only those who underwent follow-up CT scans in a supine position were selected to ensure more reliable results (n = 42). To maintain the integrity of the muscle segmentation outcomes, patients with limb amputations, femur shaft fractures and subtrochanteric fractures were omitted from the analysis. Additionally, CT scans with excessively high artifacts or noise were excluded as they were not suitable for segmentation model processing. Following this screening process, the final inclusion criteria were met by patients with femoral neck fractures (n = 6) and intertrochanteric fractures (n = 12).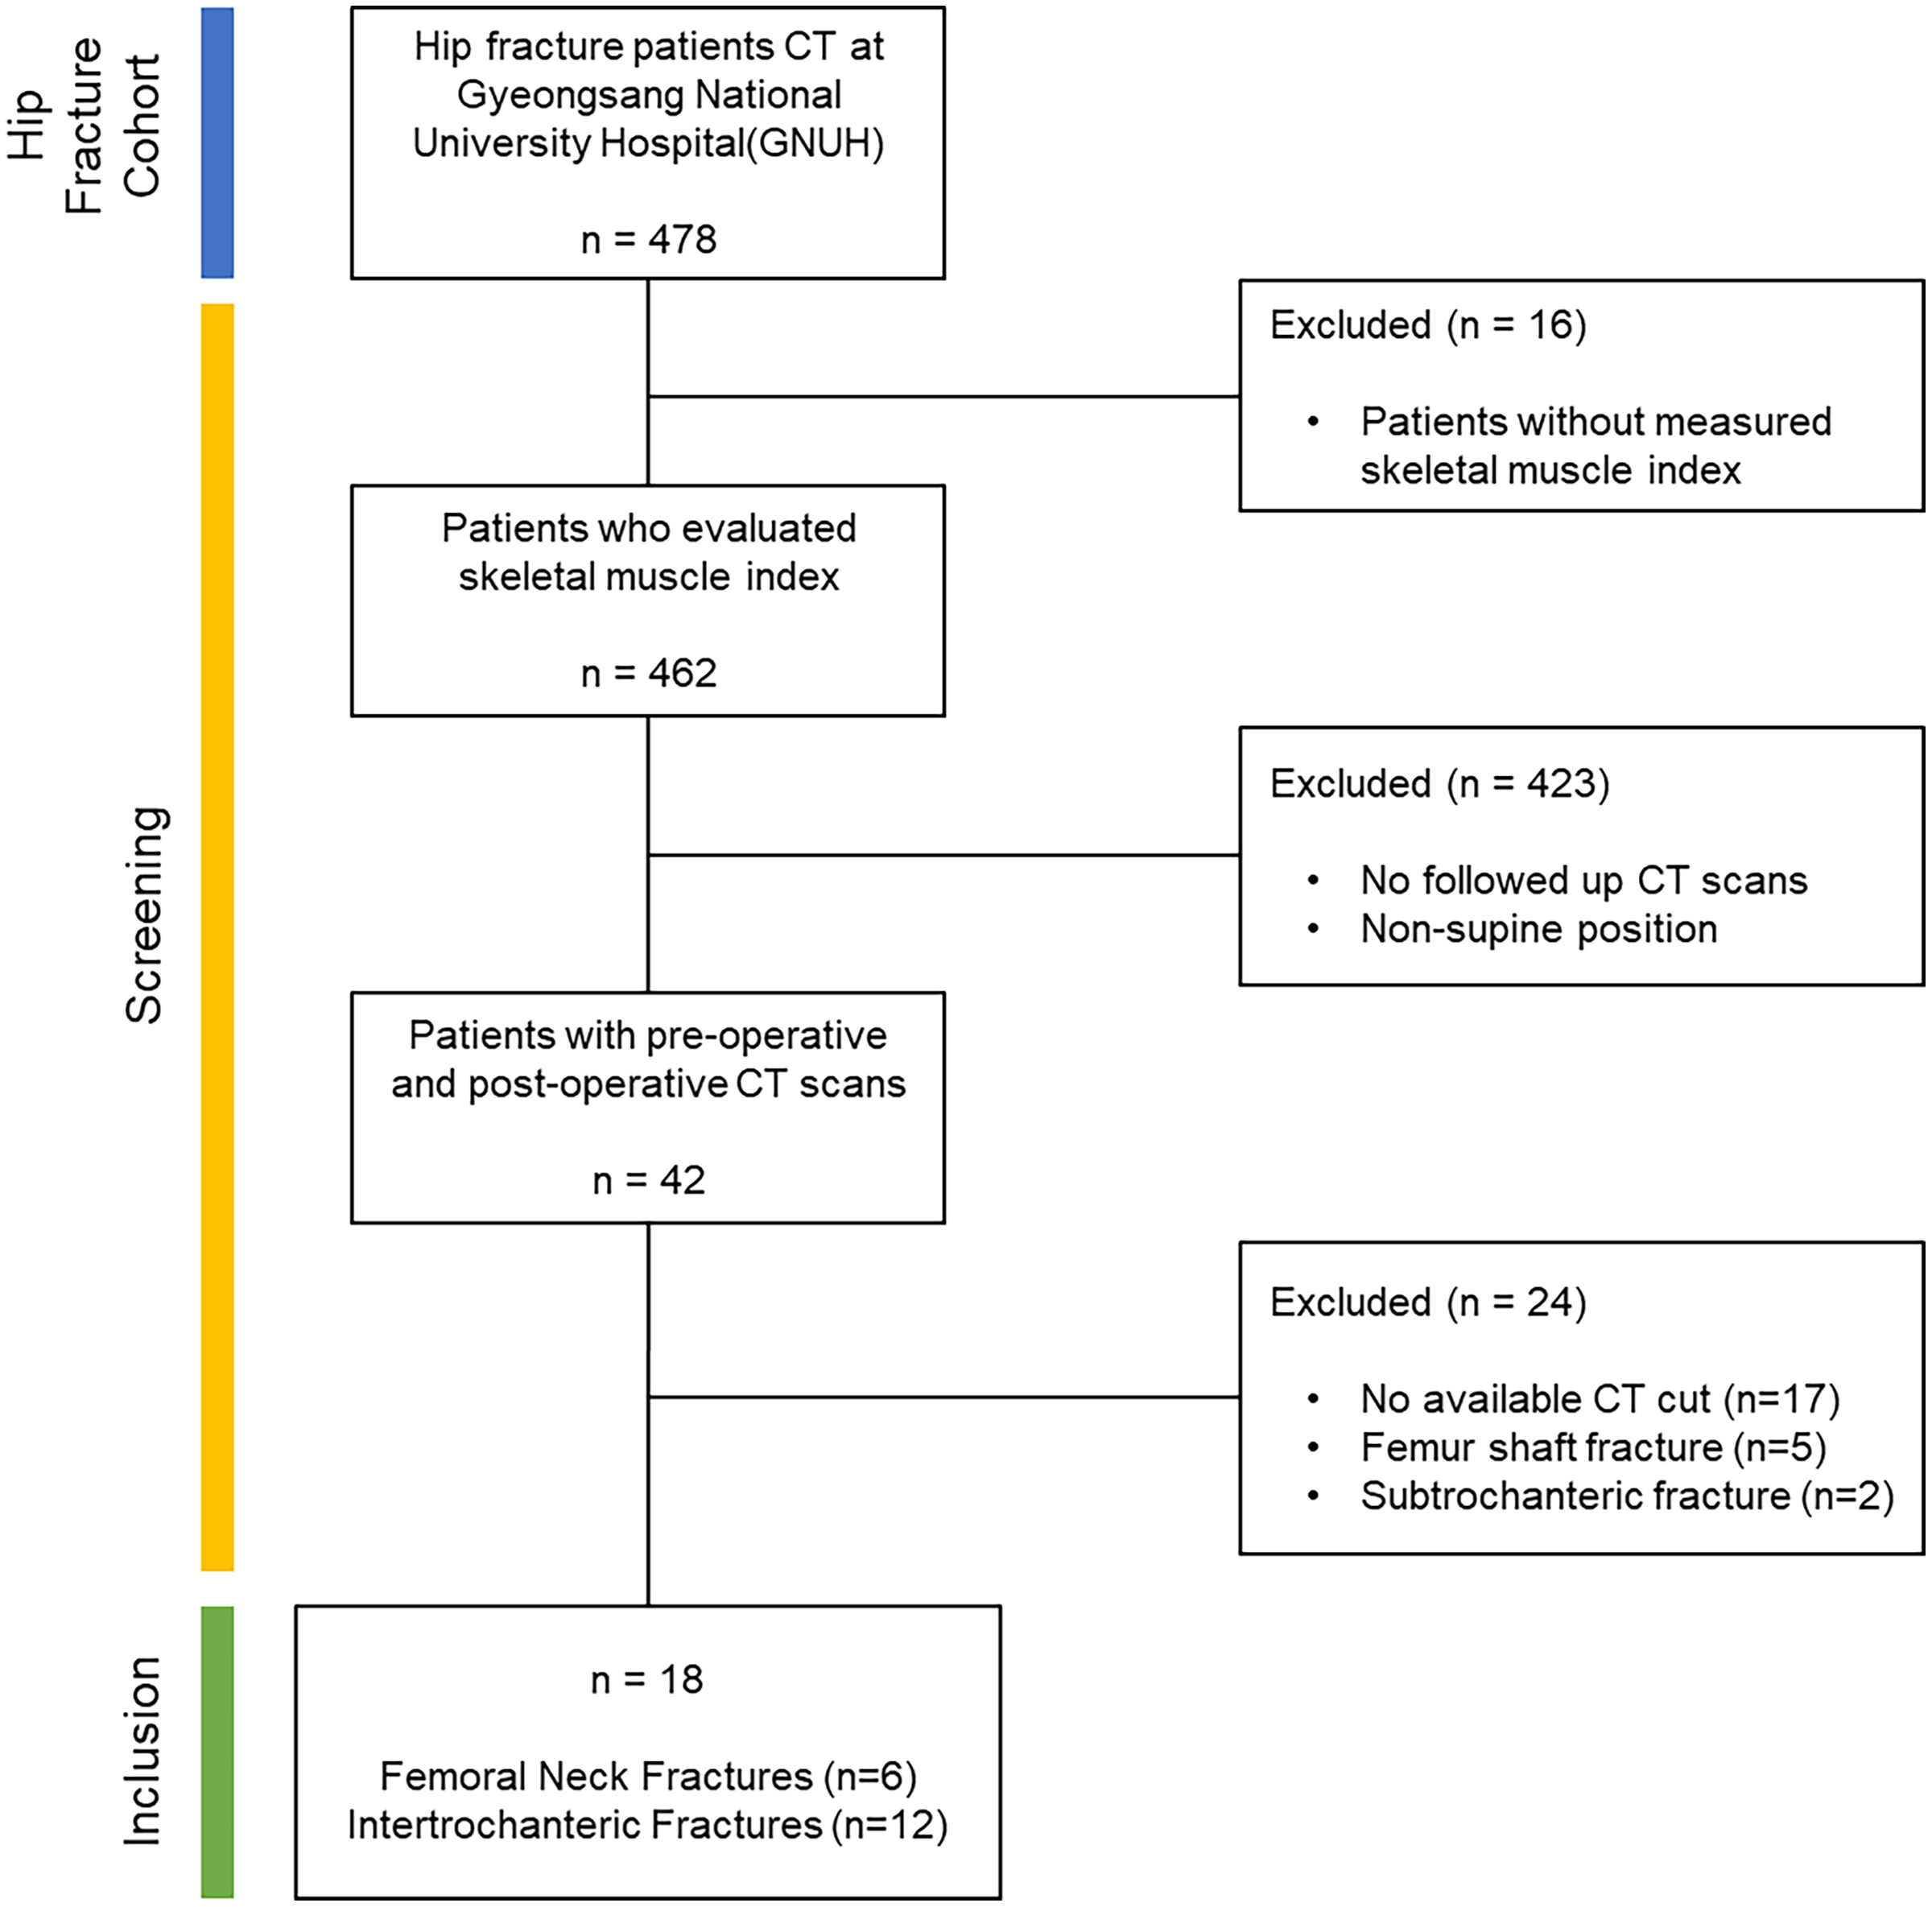
The rationale behind excluding lower limb amputation was the potential for major anatomical variations that might hinder accurate muscle segmentation. Participants who had femur shaft and subtrochanteric fractures were also omitted to prevent potential distortion in muscle appearance due to the angulation of the two portions of the fractured region. This exclusion helped to mitigate any confounding variables associated with the fractured femur.
Additionally, mobility after hip fracture surgery is a crucial factor in the evaluation of patients (Huo et al., 2015). In our study, we assessed mobility using Koval’s grade, focusing on a range from 1 to 6, which present varying degrees of walking ability, from the full scale of 1 to 7. Koval’s grade categorizes walking dependency into three main groups: (1–3) Community ambulatory, (4–6) Household ambulatory, (7) Nonfunctional ambulatory. Our study’s data shows that out of 18 participants, 15 were identified as Community ambulatory (Koval’s grades 1 to 3), while three were classified as Household ambulatory (Koval’s grades 4 to 6).
Through the careful application of these selection criteria, our intention was to establish a consistent and comparable study group, thereby reducing any potential variables that might otherwise influence the analysis of muscle segmentation.
Segmentation labels
In our study, we performed a classification encompassing 30 different classes, including the iliac, femur and background elements, all within five principal thigh muscle groups from hip to knee joint CT scans, referred to as whole thigh level CT scans. These five prominent thigh muscle groups were divided into the anterior, medial and posterior thigh muscles along with the gluteal region muscle and other miscellaneous categories.
Within the anterior thigh, we classified five muscles, namely the sartorius, rectus femoris and vastus muscles, which are further subdivided into the lateralis, intermedius and medialis. In the medial thigh region, five muscles were categorized, consisting of the adductor muscles (magnus, brevis and longus), gracilis and pectineus. The posterior thigh muscles were distinguished as semitendinosus, semimembranosus and biceps femoris. In the gluteal region, eight muscles were classified, including the gluteus muscles (maximus, medius and minimus), fascia lata, piriformis, quadratus femoris, obturator internus and obturator externus.
Furthermore, distinct classification was made for the iliacus, iliopsoas, psoas, abdominal oblique, rectus abdominis, multifidus, femur, iliac and background within the image. CT scan starting slices varied (L3 or L4) among subjects, preventing complete imaging of the iliacus, iliopsoas, psoas, abdominal oblique, rectus abdominis, and multifidus muscles. Due to these inconsistencies, these muscles were excluded from detailed analysis and grouped under ‘Else’. The study primarily examined muscle disparities in the thigh region. An illustrative example of these classifications has been presented in Fig. 2.
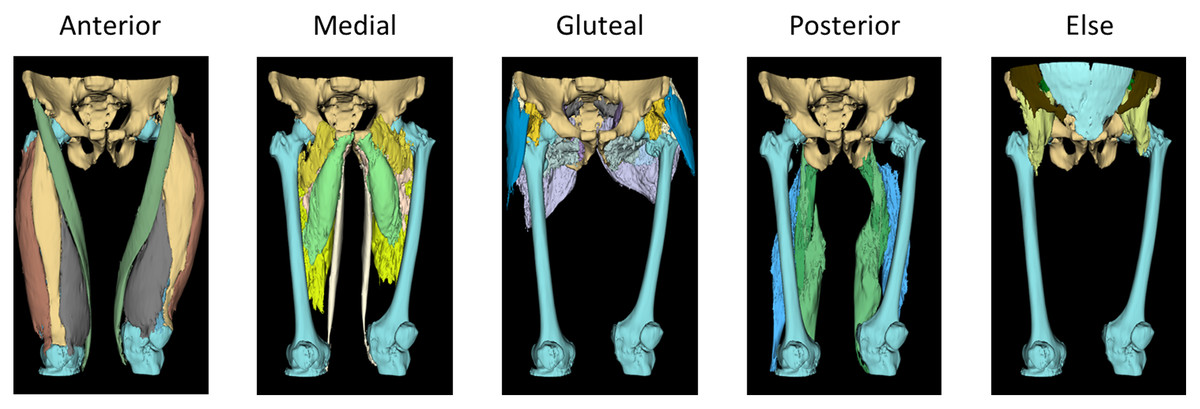
Figure 2: 3D rendered ground truth image.
The 3D modeled ground truth images used for the training dataset of the automatic segmentation model, showcasing the classification of thigh muscles into 30 distinct classes grouped as anterior, medial, gluteal, posterior and else. Anterior group: sartorius, rectus femoris and vastus muscles (lateralis, intermedius and medius). Medial group: adductor muscles (magnus, brevis and longus), gracilis and pectineus. Gluteal region: gluteus muscles (maximus, medius and minimus), fascia lata, piriformis, quadratus femoris, obturator internus and obturator externus. In Posterior group: semitendinosus, semimembranosus and biceps femoris. Else group: iliacus, iliopsoas, psoas, abdominal oblique, rectus abdominis, multifidus, femur, iliac and background.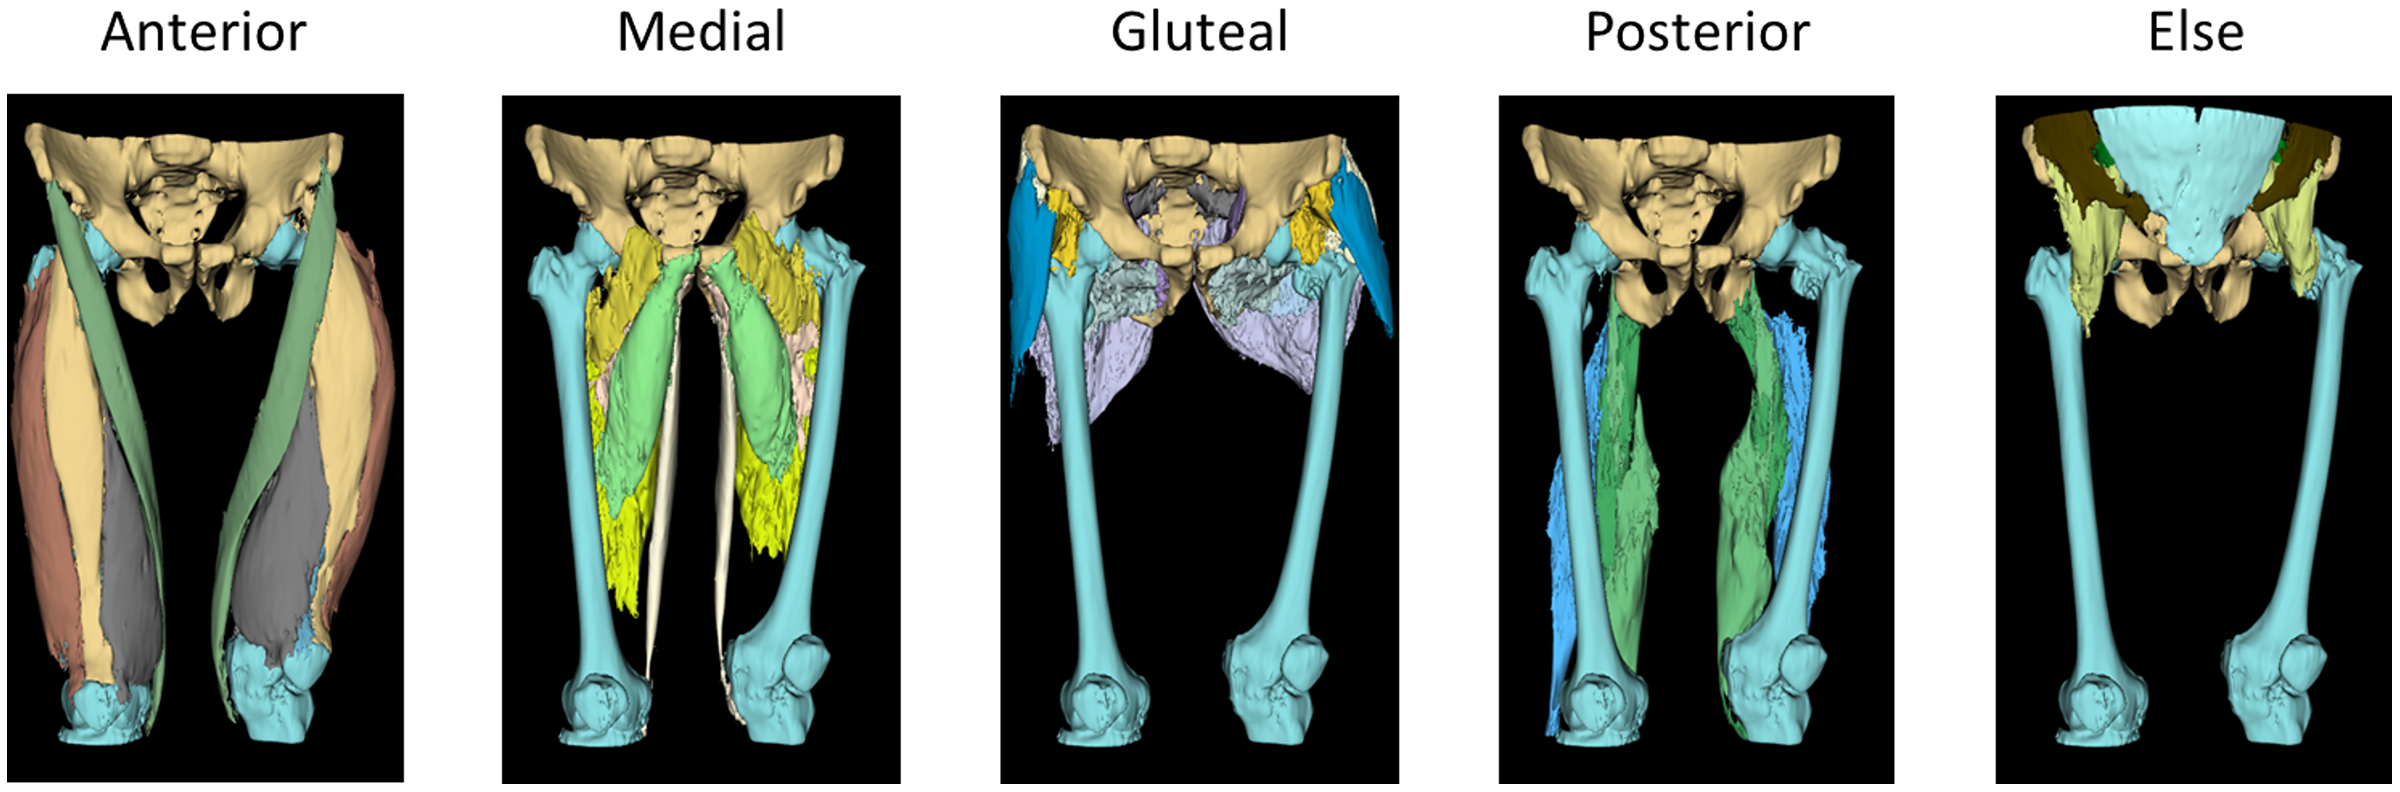
Image pre-processing
In the initial phase of pre-processing, we implemented various heuristic techniques to augment the performance of deep learning in visual tasks. The first step involved scaling the intensity range of the CT scan images from −57 to 164, a measure aimed at amplifying the differentiation of individual muscle tissues within the scans (Engelke et al., 2018; Masoudi et al., 2021). Subsequent to this adjustment, we applied a contrast modification using a gamma value of two to further enhance the image clarity. The modified image, characterized by its intensified contrast and reduced metal artifacts, is presented in Fig. 3. To focus on the relevant information, the image was then meticulously cropped to encompass only foreground region.
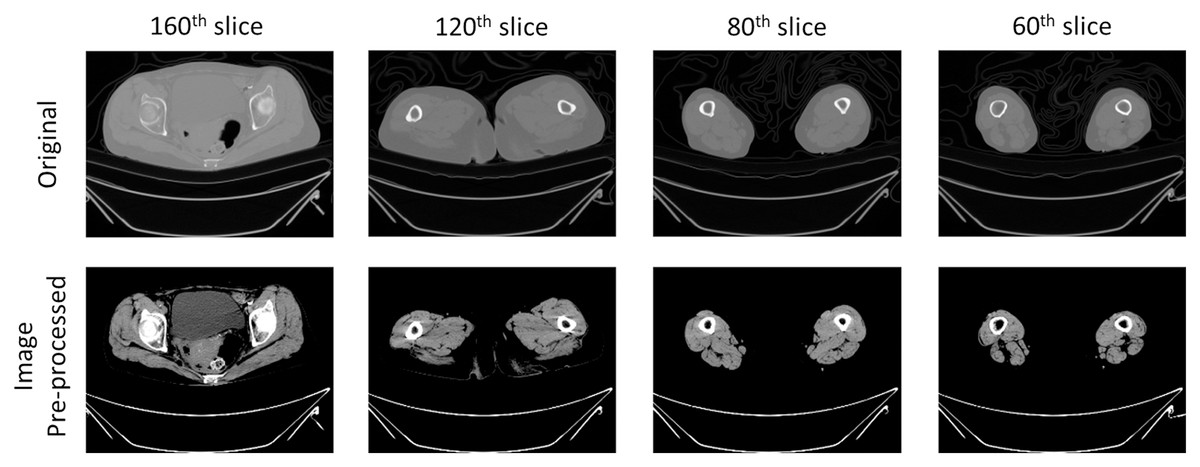
Figure 3: Example image of pre-processing on CT scans.
The outcomes of pre-processing techniques applied in image processing to enhance the accuracy of the automatic segmentation model. This step involved augmenting the contrast within CT images to distinctly delineate tissues of muscle, fat and bone. The process adjusted the intensity range of the original CT image from −57 to 164, targeting the enhancement of differentiation among various muscle tissues within the scans. Additionally, a gamma value of two was utilized to modify the contrast, thereby improving the clarity of the images. The pre-processing procedure intensified contrast and reduced metal artifacts of CT scans.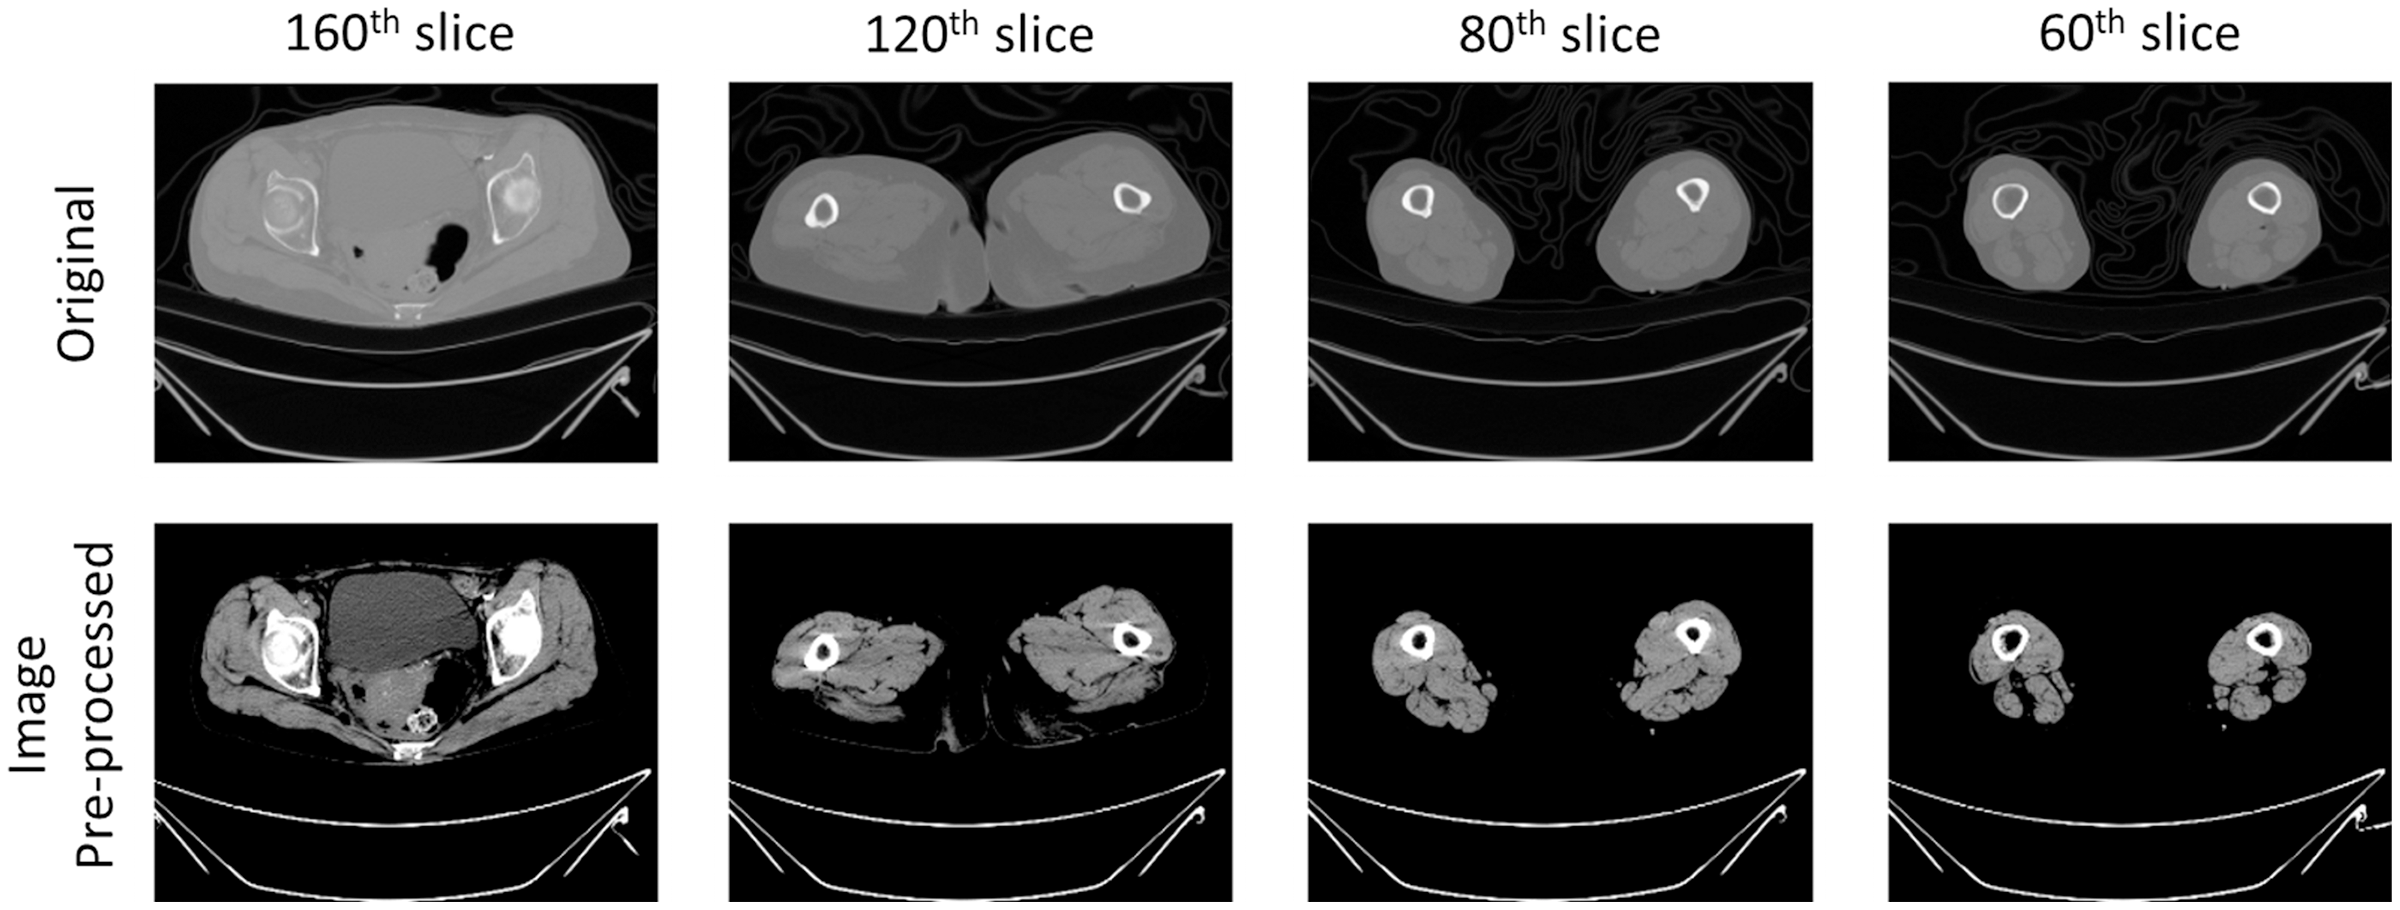
Deep learning method of automatic muscle segmentation
Our study focuses on the essential task of semantic segmentation, a key component in computer vision for quantifying tasks, particularly crucial in medical imaging. This process aims to delineate and categorize distinct regions of interest inside an imaging (Wang et al., 2022). In terms of muscle segmentation, semantic segmentation necessitates assigning each voxel in the image to a specific category, such as muscle tissue, bone tissue or background. The complexities of this task lie in the need to accurately capture intricate details and variations in the images. This includes accommodating differences in patient’s size, position and tissue textures, all while navigating noise and other imaging artifacts. The ambiguity of muscle tissue in CT scans compounds this challenge, demanding precise voxel-level segmentation (Hiasa et al., 2019). To address this, we employed the architecture of the UNETR model, as depicted in Fig. 4 (Hatamizadeh et al., 2021).
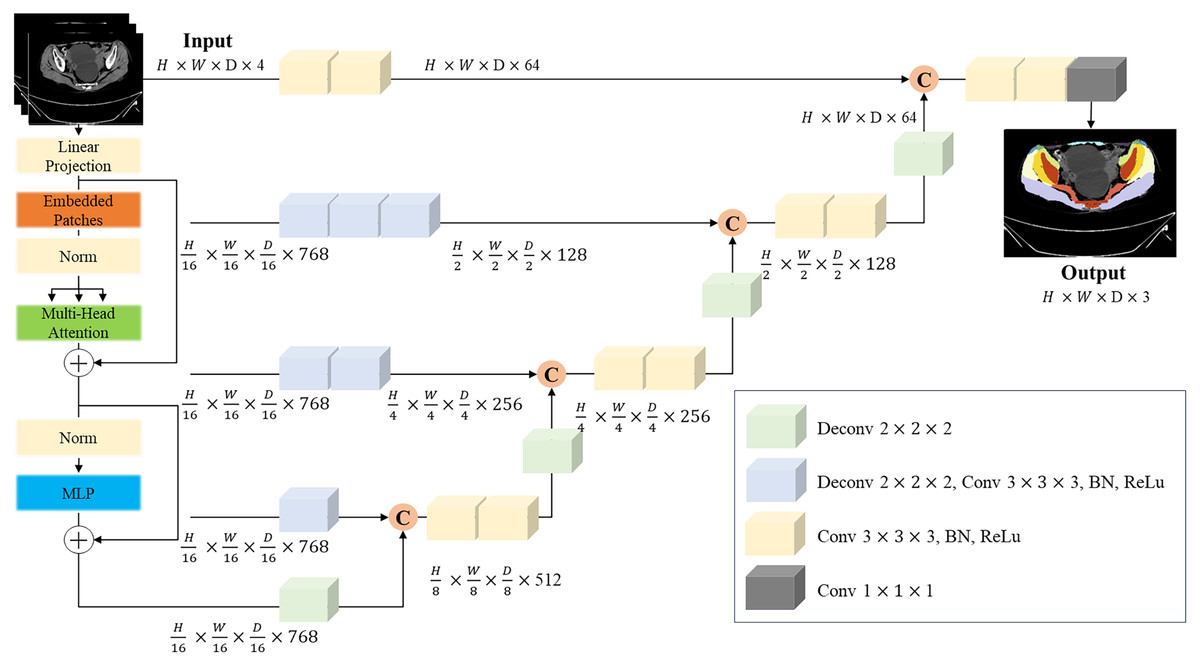
Figure 4: UNERT architecture.
Overview of the UNETR architecture. A 3D input volume, with C = 4 channels for CT images, is segmented into a series of uniform, non-overlapping patches. These patches are then projected into an embedding space via a linear layer. Positional embedding is added to this sequence, which is then inputted into a transformer model. The encoded representations from various layers in the transformer are extracted and combined with a decoder through skip connections to predict the final segmentation. The output sizes are based on a patch resolution of P = 16 and an embedding size of K = 768.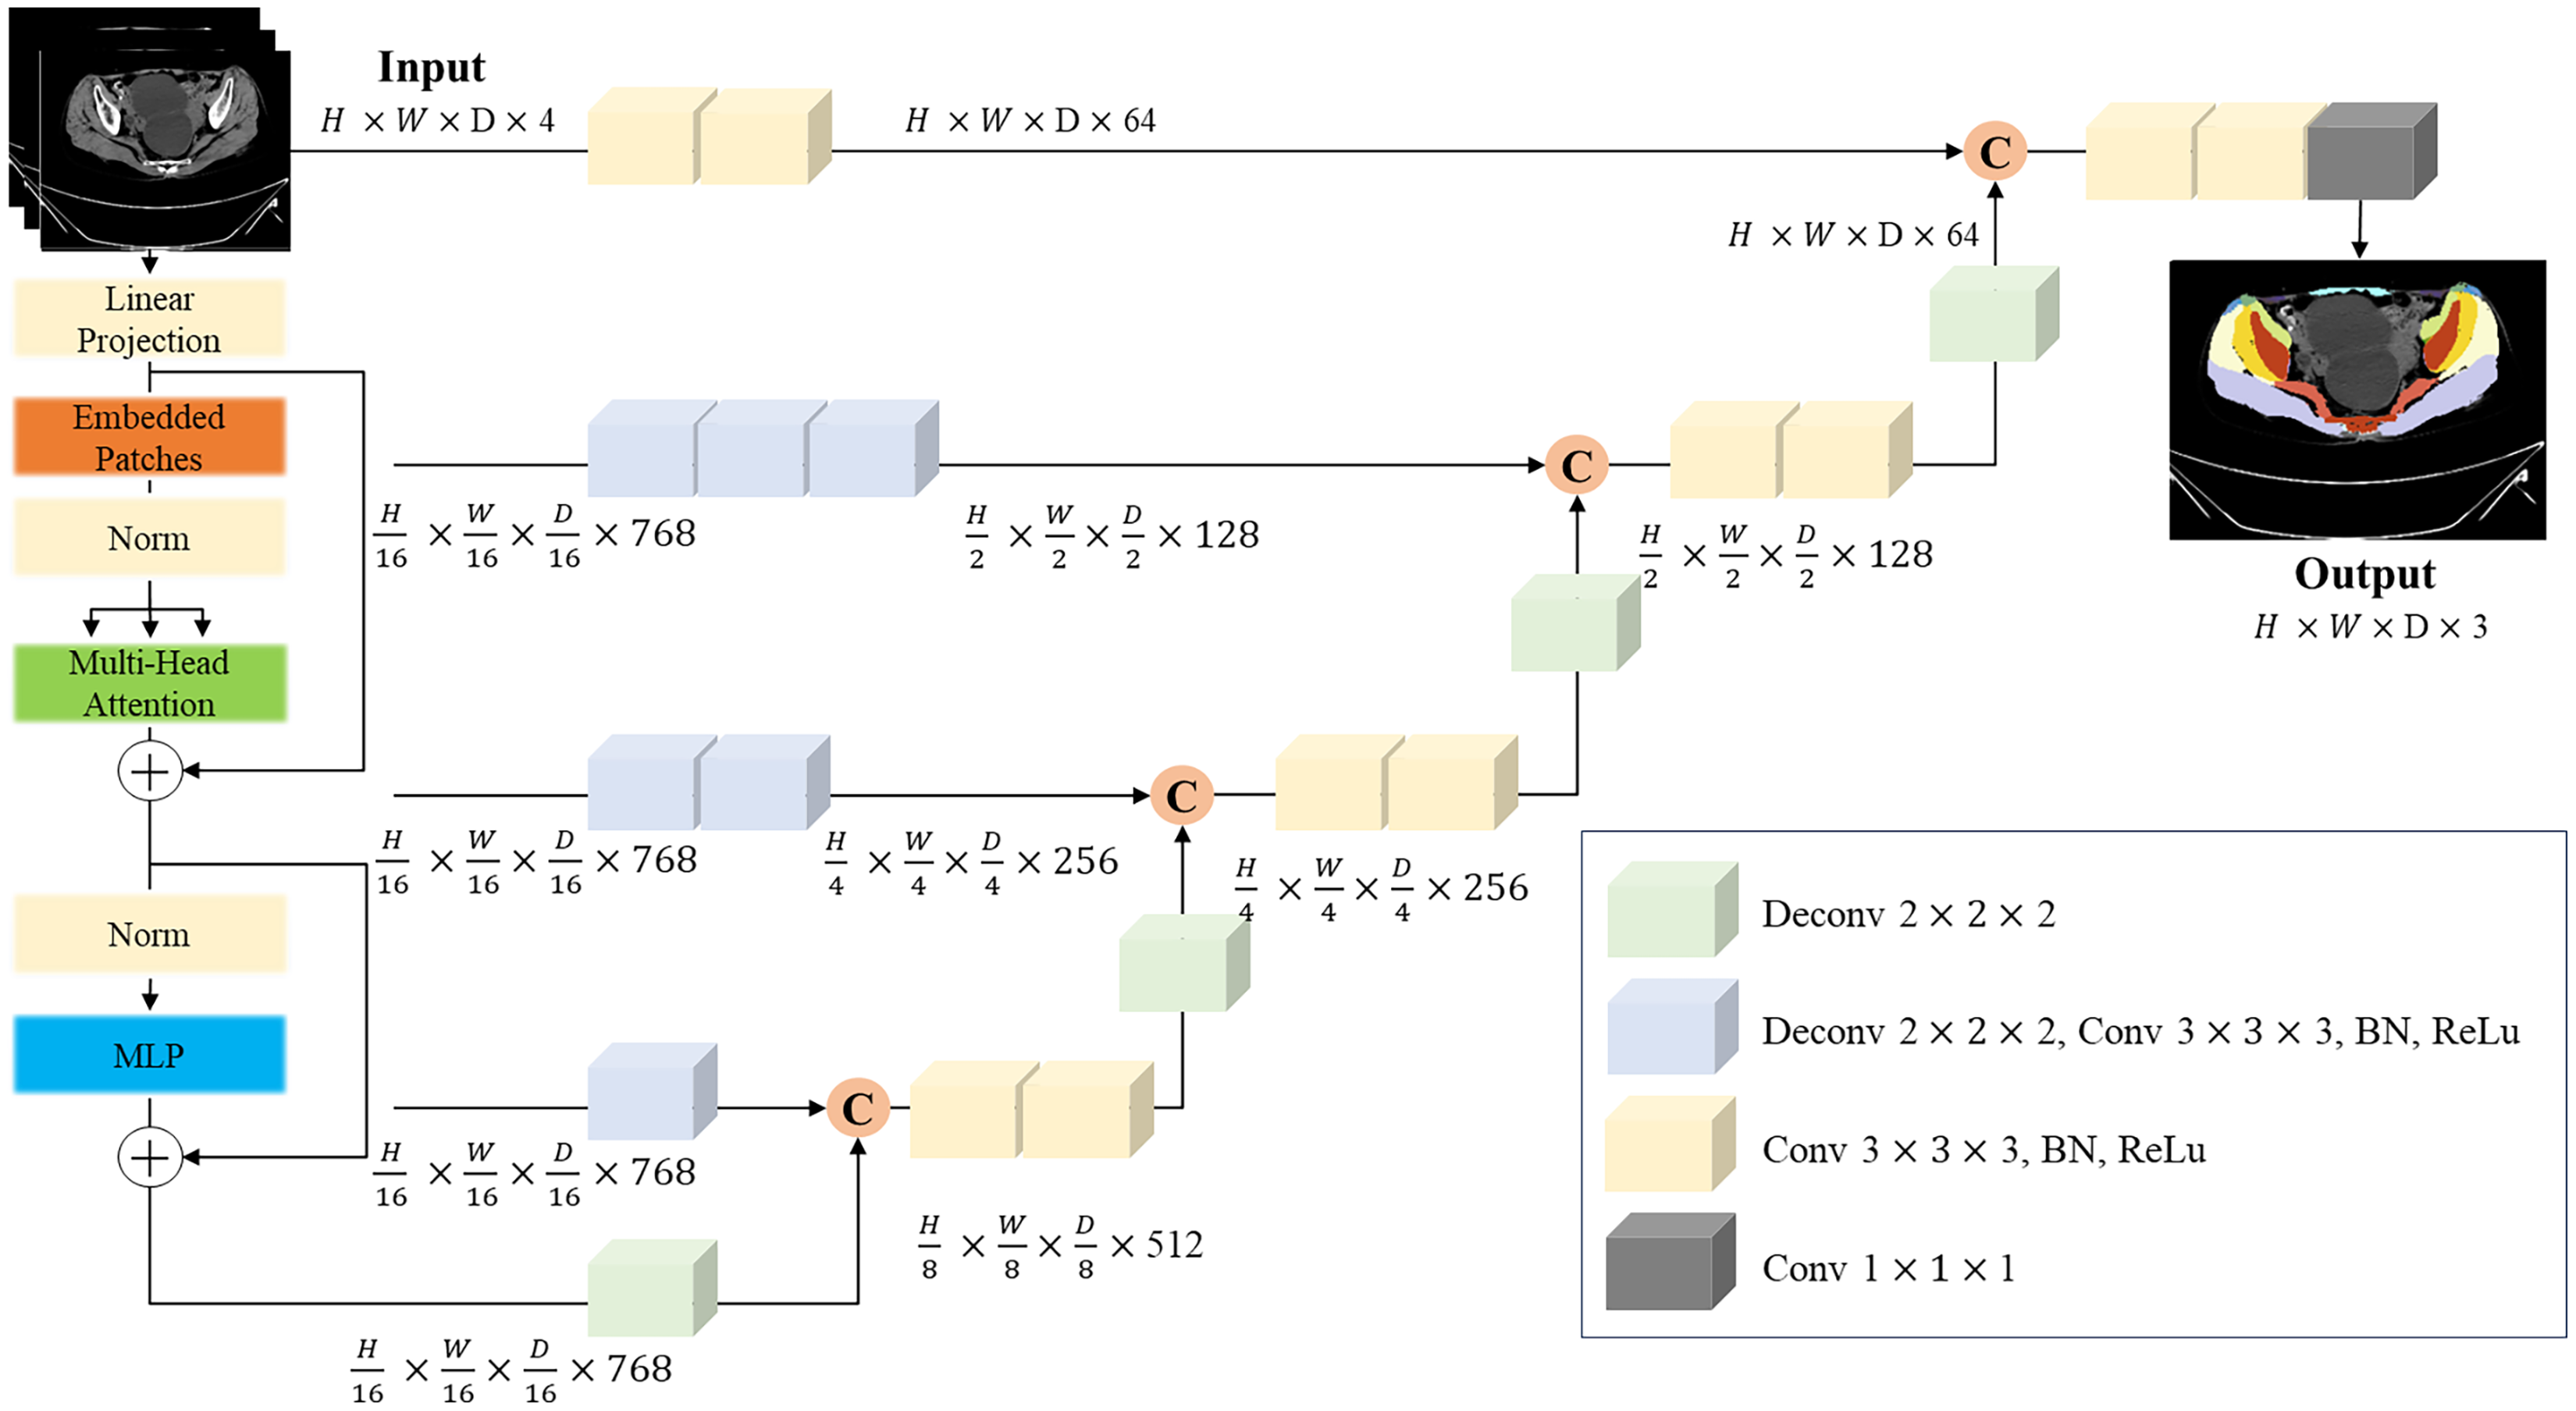
The UNETR model capitalizes on the capabilities of transformers, which have proven to be extraordinarily effective in the timeseries domain, including natural language processing (NLP). By reconceptualizing the task of 3D medical image segmentation as a sequence, the UNETR model utilizes a transformer as the encoder to assimilate sequence representations of the input volume, capturing global multi-scale information. The encoder adopts a U-shaped design, reflective of the original U-net architecture, renowned for its efficacy in biomedical image segmentation (Ronneberger, Fischer & Brox, 2015). This architectural design empowers the model to grasp both high-level contextual insights and granular spatial details, rendering it particularly suitable for individual thigh muscle segmentation. The trained segmentation model shows the segmentation result in Fig. 5.
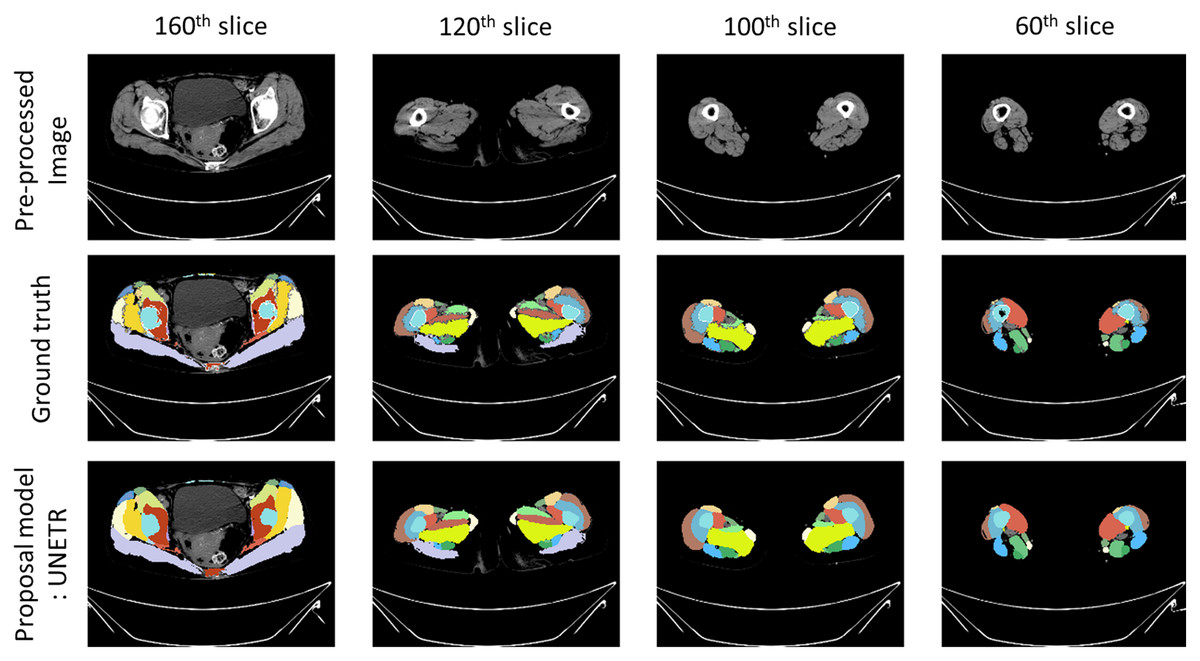
Figure 5: Prediction example image from proposal model.
Example images of segmentation results. ‘Pre-processed image’ illustrates a CT scan that has undergone pre-processing. ‘Ground truth’ represents the annotations used to train the automatic segmentation model. ‘Proposal model: UNETR’ demonstrates the outcomes generated by the trained segmentation model.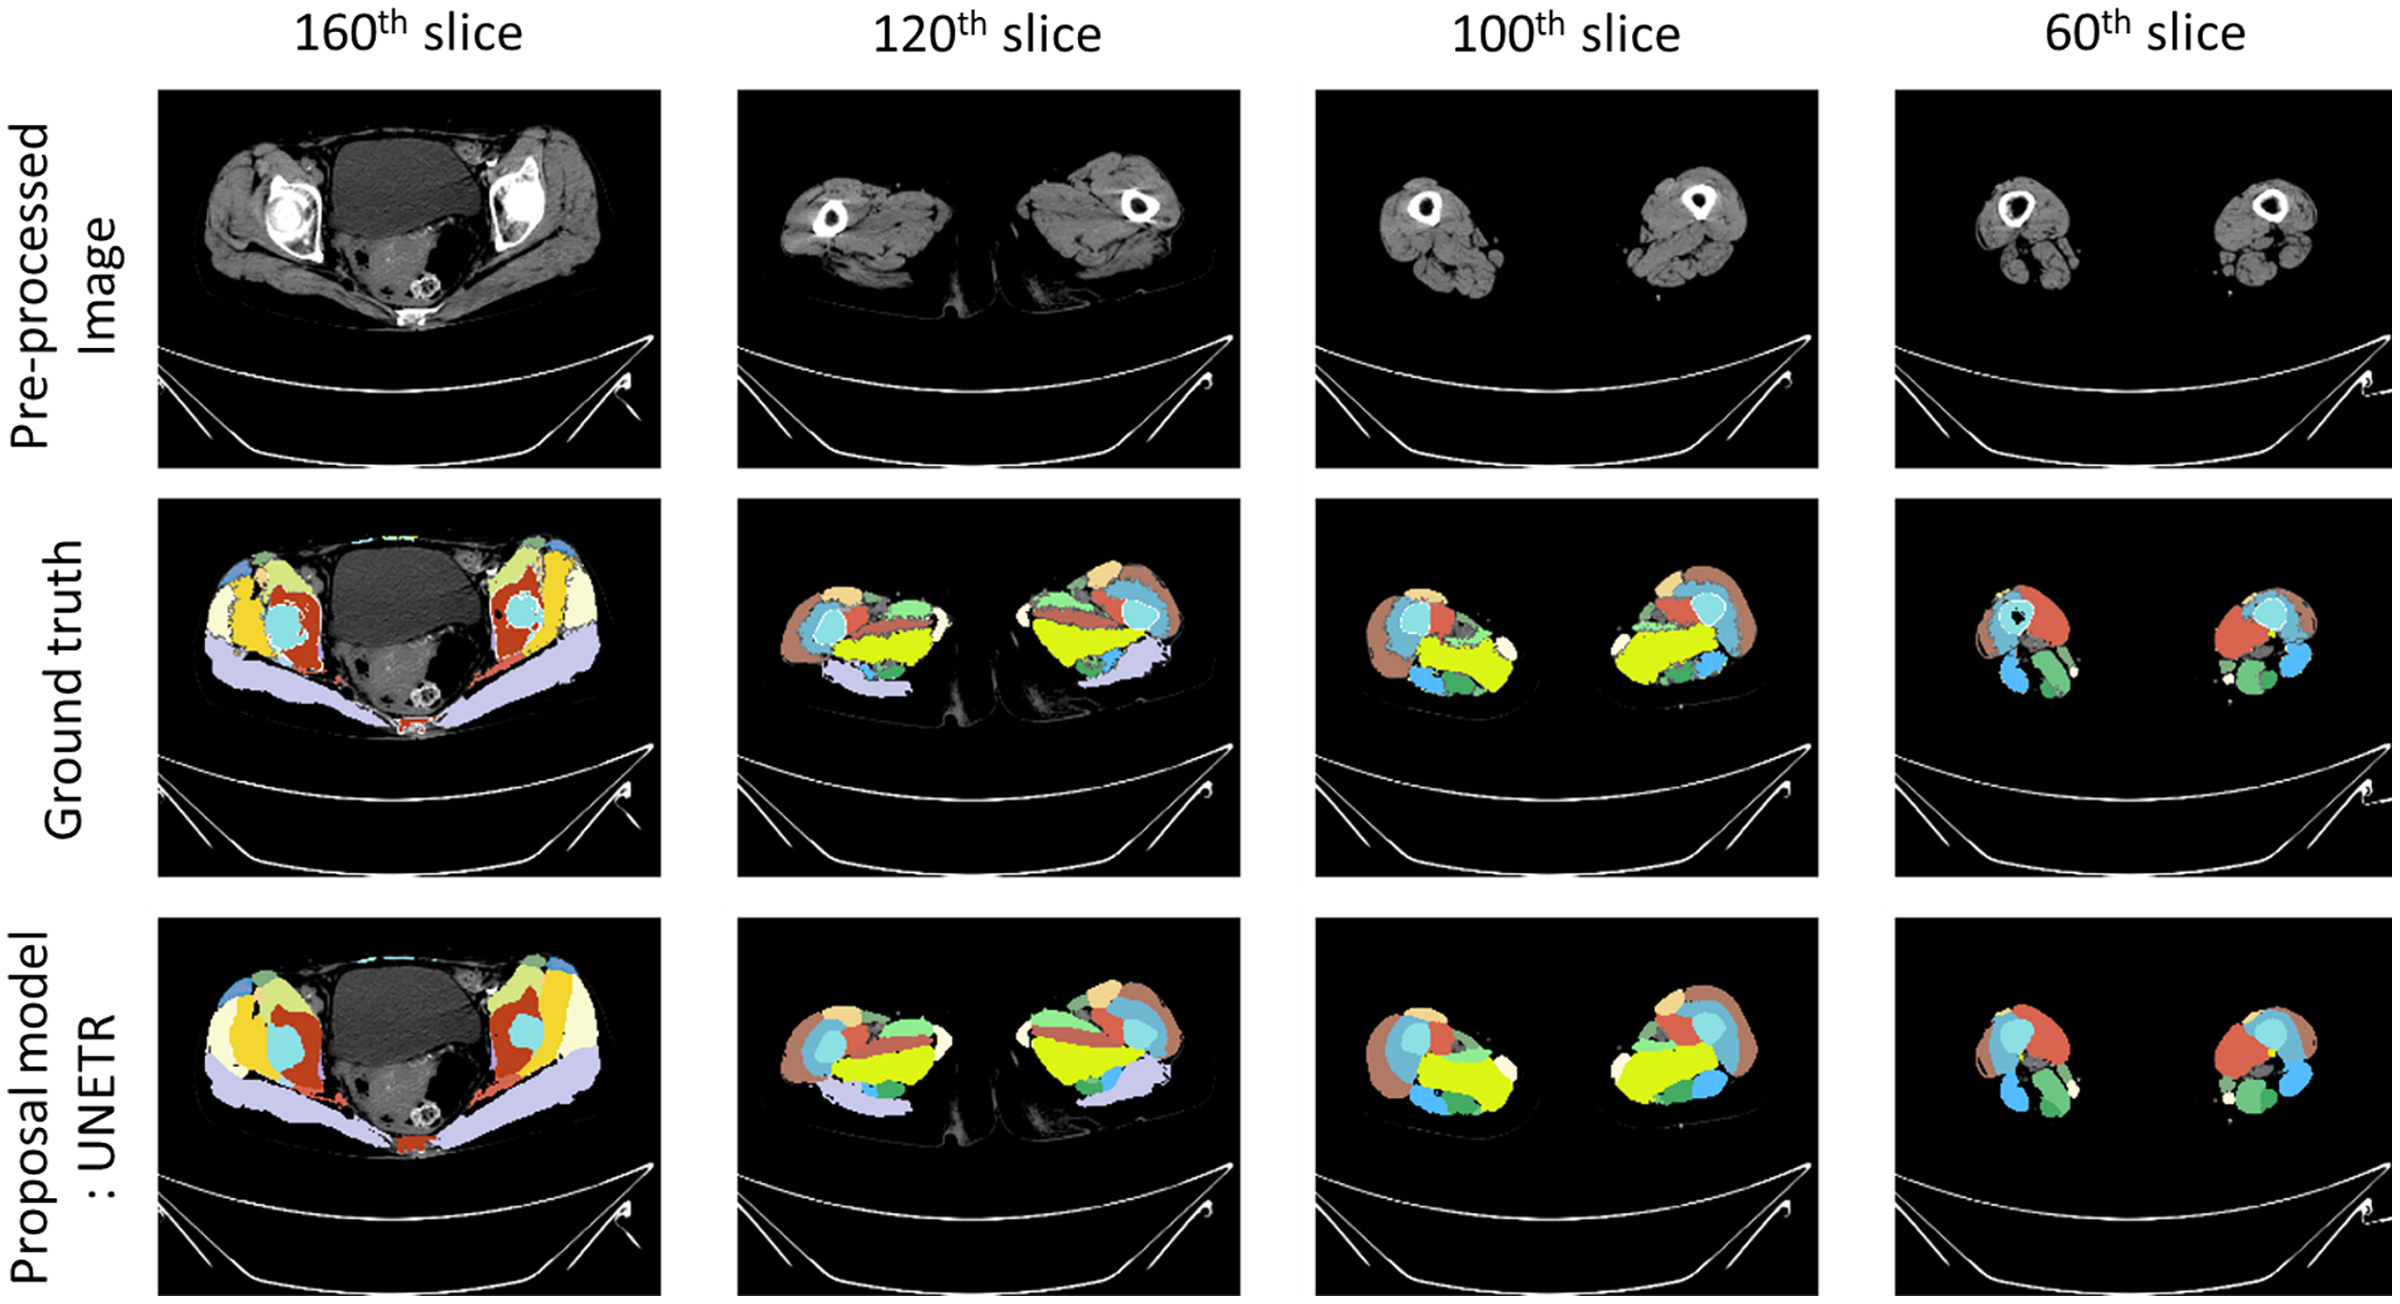
Evaluation metrics
To evaluate the loss of muscle between femoral neck fractures and intertrochanteric fractures, we calculated the average differences in individual thigh muscle volume. This was achieved by subtracting the average of individual thigh muscle volume via pre-operative CT scans from the post-operative CT scans, utilizing our trained segmentation model. To ensure linearity in the skeletal muscle index (SMI) for each patient, we further adjusted the individual thigh muscle volume. This adjustment was made by dividing the volume (measured in cm3) by the height2 (measured in m2). This process allowed for a more nuanced and precise understanding of muscle loss between the two types of fractures.
Results
We selected patients from the hip fracture cohort at Gyeongsang National University Hospital, consisting of six individuals with femoral neck fractures and 12 with intertrochanteric fractures. These patients were further grouped by gender: in the femoral neck fracture category, there were two females and four males, while in the intertrochanteric fracture category, there were 10 females and two males. Table 1 illustrates the average percentages of individual thigh muscle volumes prior to surgical operations. Notably, the vastus muscle group (including lateralis, intermedius, and medialis), along with the adductor magnus and gluteus maximus muscles, constitute significant portions of the thigh muscle composition.
| Percentage of muscle volume | Male group | Female group | ||
|---|---|---|---|---|
| Femoral neck fracture group | Intertrochanteric fracture group | Femoral neck fracture group | Intertrochanteric fracture group | |
| Sartorius | 2.7 | 2.7 | 2.3 | 2.6 |
| Rectus femoris | 3.9 | 3.4 | 3.6 | 4.0 |
| Vastus lateralis | 9.1 | 10.0 | 7.7 | 8.5 |
| Vastus intermedius | 9.2 | 9.6 | 8.0 | 9.2 |
| Vastus medialis | 6.9 | 7.9 | 6.4 | 6.8 |
| Adductor longus | 2.5 | 2.5 | 2.5 | 2.9 |
| Adductor brevis | 2.5 | 2.7 | 2.5 | 3.0 |
| Adductor magnus | 11.3 | 11.4 | 12.2 | 12.1 |
| Gracilis | 1.8 | 1.9 | 1.8 | 1.8 |
| Pectineus | 1.4 | 1.3 | 1.1 | 1.5 |
| Gluteus maximus | 16.2 | 15.5 | 18.3 | 17.2 |
| Gluteus medius | 5.5 | 5.6 | 5.9 | 5.1 |
| Gluteus minimus | 2.7 | 2.3 | 2.6 | 2.4 |
| Tensor fascia latae | 1.4 | 1.2 | 1.4 | 1.4 |
| Piriformis | 0.9 | 0.7 | 1.1 | 1.0 |
| Obturator internus | 1.3 | 1.0 | 1.1 | 1.1 |
| Obturator externus | 0.9 | 1.1 | 1.0 | 0.8 |
| Quadratus femoris | 1.6 | 1.2 | 1.5 | 1.7 |
| Semitendinosus | 3.1 | 2.9 | 3.4 | 3.3 |
| Semimembranosus | 4.0 | 4.7 | 3.9 | 3.5 |
| Biceps femoris | 5.3 | 5.1 | 5.3 | 5.0 |
| Sum | 94.2 | 94.4 | 93.9 | 95.0 |
Note:
The percentages of muscle volume composition observed in pre-operative CT scans among patients grouped by gender (male and female) and type of hip fracture (femoral neck fracture and intertrochanteric fracture). The individual muscle volume percentages are calculated relative to the total muscle volume visualized in the pre-operative CT scans.
In Figs. 6 and 7, it is evident that there are notable differences in the loss of vastus intermedius and gluteus maximus between the group with femoral neck fractures and the group with intertrochanteric fractures, across both genders. The patterns indicate that the greater the volume contribution of a larger muscle to the thigh, the higher the likelihood of observing differences in muscle atrophy.
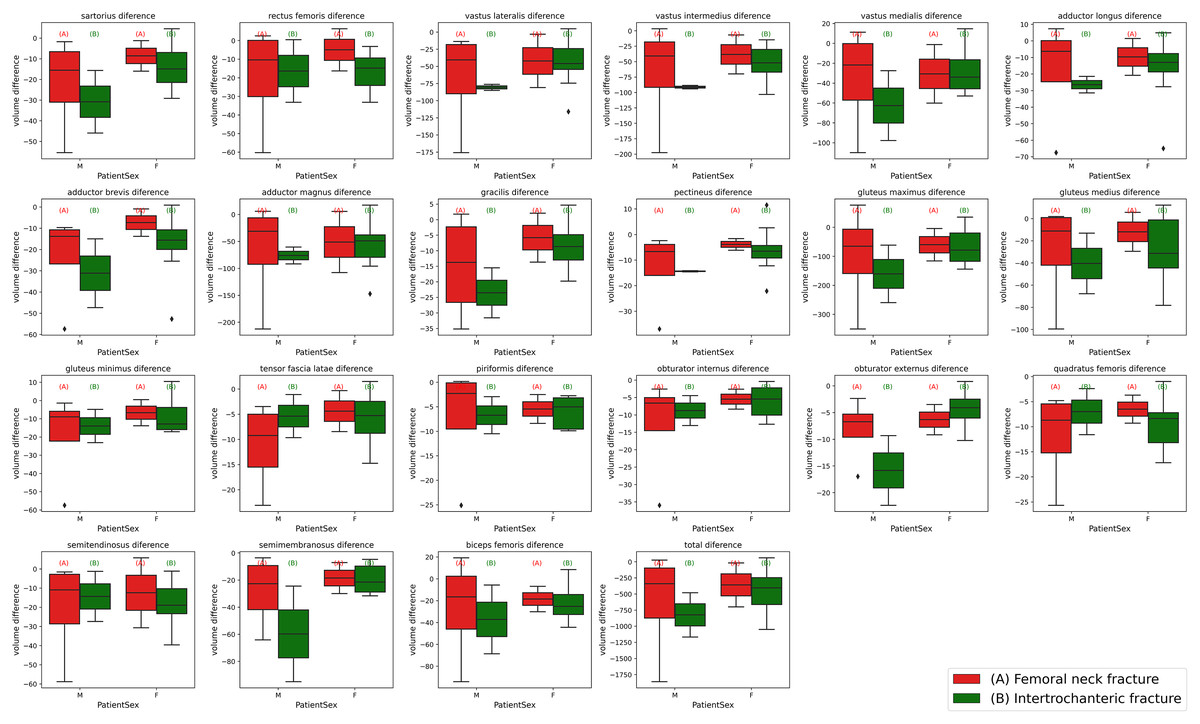
Figure 6: Box plots of individual muscle volume loss based on fracture types.
The variations in thigh muscle volume derived from segmentation analyses of pre-operative and post-operative CT scans, categorized by type of hip fracture. The red (A) plots represent patients with femoral neck fractures, while the green (B) plots correspond to those with intertrochanteric fractures. The left side of each plot grouping depicts the male cohort, and the right side represents the female cohort.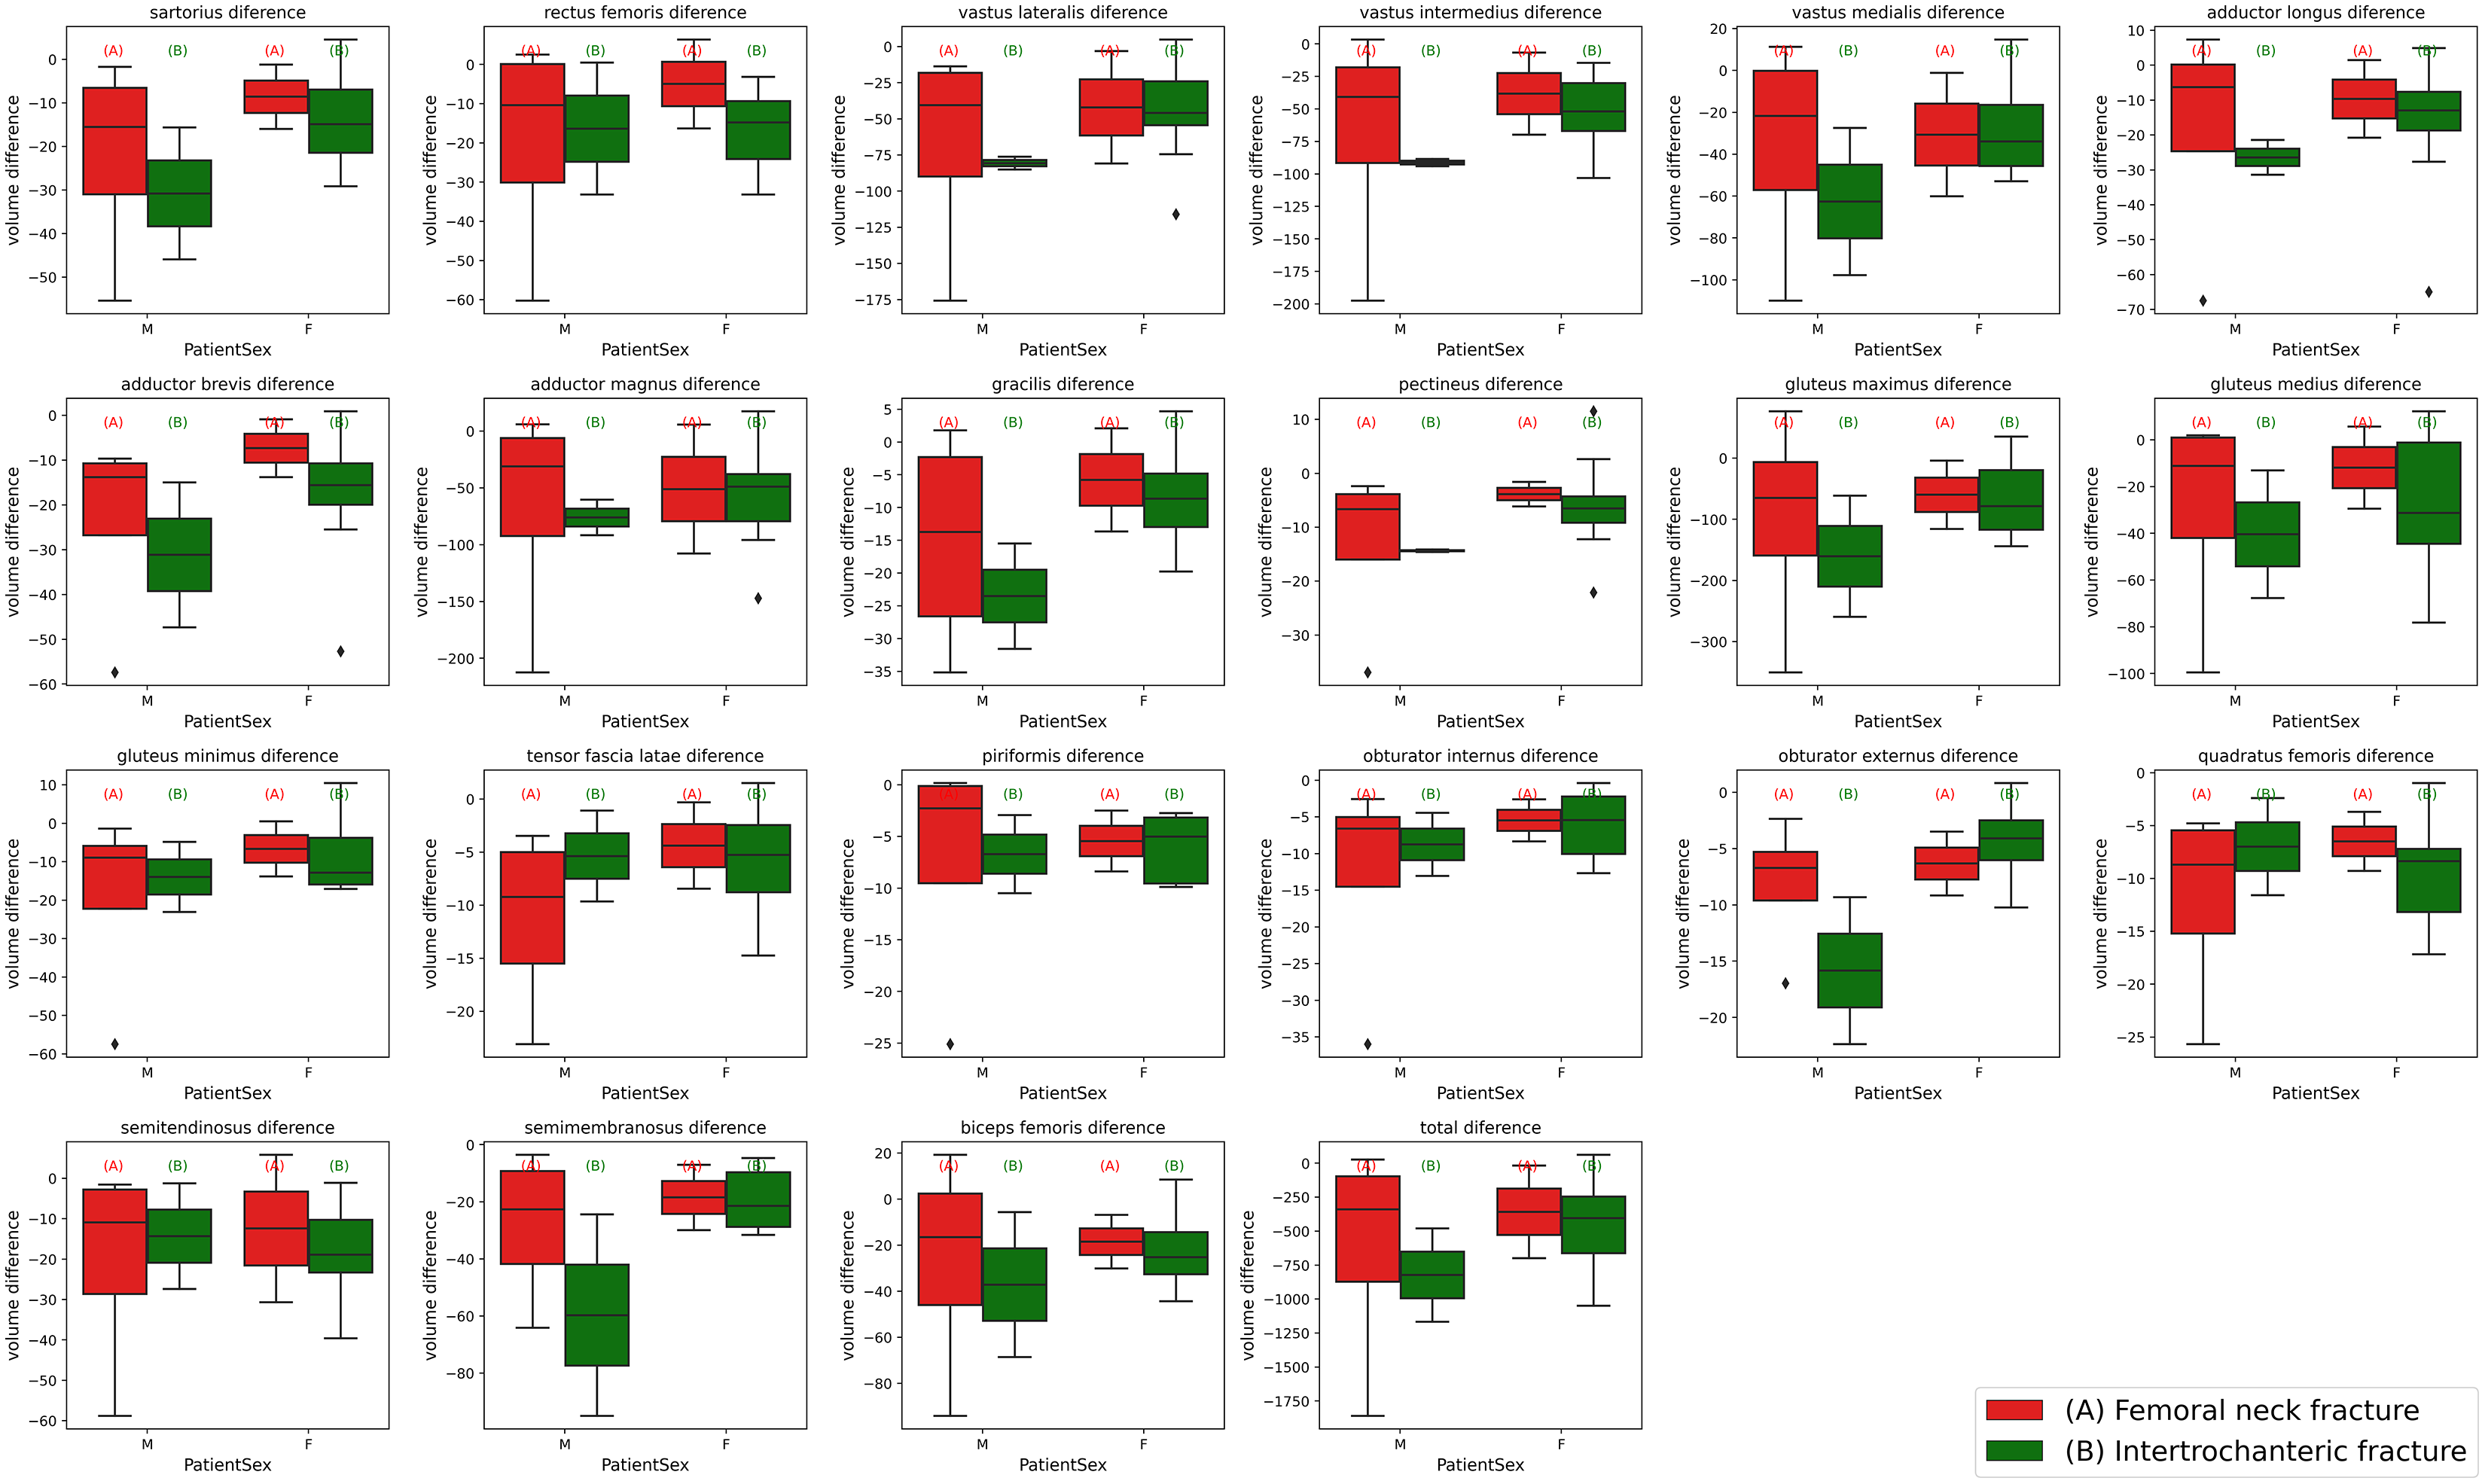
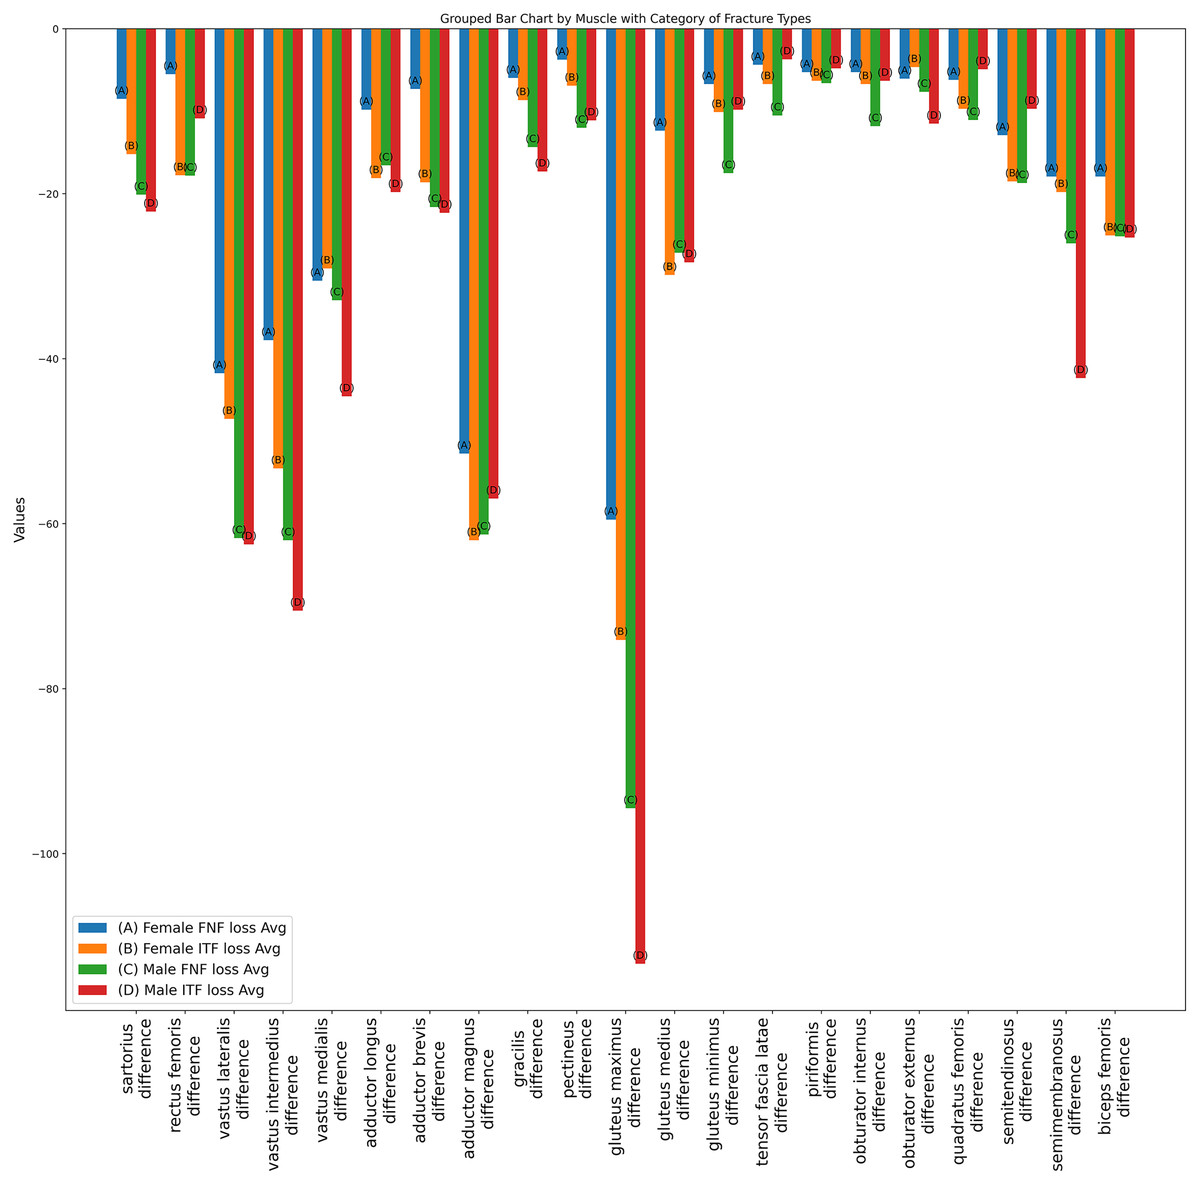
Figure 7: Bar plot of individual muscle volume loss based on fracture types.
The average individual thigh muscle volume differences, as obtained from segmentation results between pre-operative and post-operative CT scans, categorized by types of hip fracture. The blue (A) bars represent the subgroup of females with femoral neck fractures, orange (B) bars denote males with femoral neck fractures, green (C) bars correspond to females with intertrochanteric fractures, and red (D) bars indicate males with intertrochanteric fractures.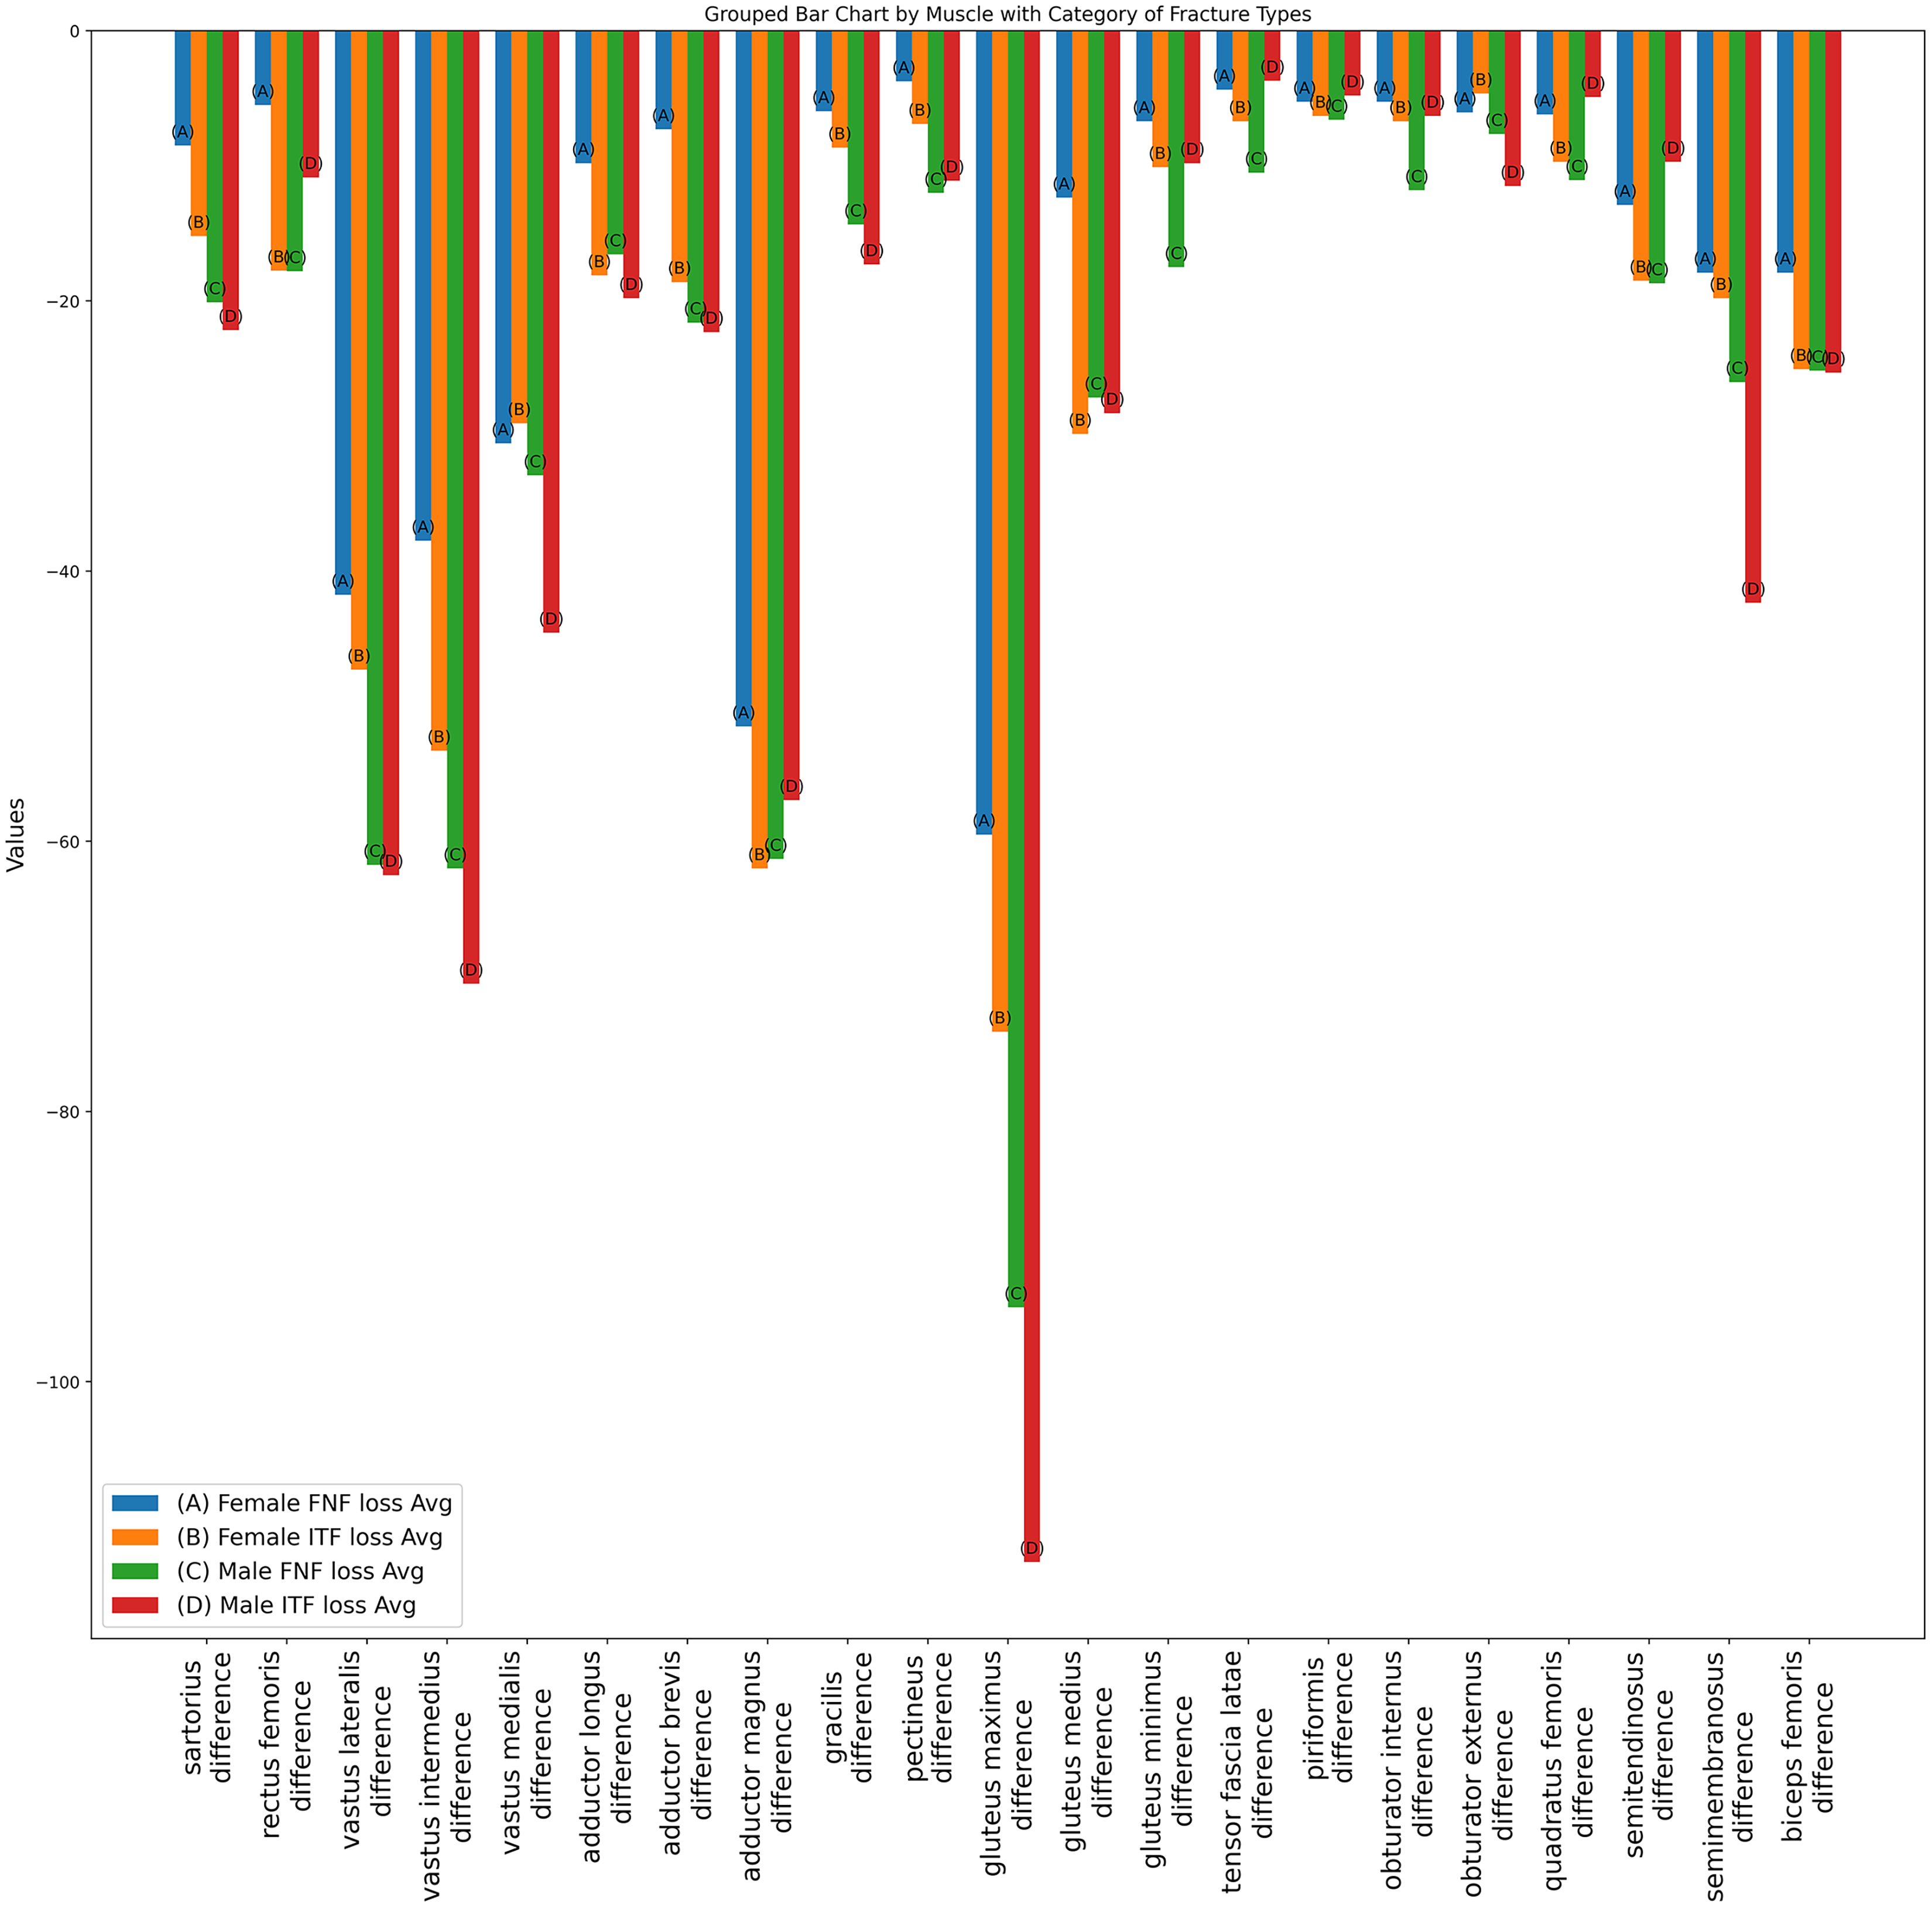
Also as detailed in Table 2, prior to making any adjustments, the average total muscle volume loss for females with femoral neck fractures was −83 cm3, compared to −97.4 cm3 for intertrochanteric fractures. For males, the average total muscle volume loss for femoral neck fractures was −147.2 cm3, while intertrochanteric fractures showed a loss of −178.2 cm3. These results suggest that patients with intertrochanteric fractures may be more susceptible to muscle loss and deformities compared to those with femoral neck fractures.
| Raw muscle volume | Adjusted muscle volume (volume/height²) | |||||||
|---|---|---|---|---|---|---|---|---|
| Female FNF loss Avg | Female ITF loss Avg | Male FNF loss Avg | Male ITF loss AVG | Female FNF loss Avg | Female ITF loss Avg | Male FNF loss Avg | Male ITF loss AVG | |
| Mean | 83.0 | 97.4 | 147.2 | 178.2 | 3.2 | 4.0 | 5.2 | 5.4 |
| Std | 86.1 | 89.4 | 129.1 | 178.4 | 3.3 | 3.7 | 4.6 | 5.5 |
| Max | 304.4 | 352.9 | 529.9 | 741.3 | 11.8 | 14.7 | 18.8 | 22.6 |
| 75% | 91.2 | 137.4 | 150.2 | 219.5 | 3.5 | 5.7 | 5.3 | 7.7 |
| 50% | 40.3 | 70.5 | 102.0 | 113.3 | 1.5 | 2.8 | 3.6 | 3.7 |
| 25% | 29.0 | 30.3 | 66.2 | 55.1 | 1.1 | 1.2 | 2.3 | 1.9 |
| Min | 20.0 | 20.1 | 13.9 | 21.3 | 0.1 | 0.8 | 0.5 | 0.7 |
Note:
The average total muscle volume loss in the thigh, comparing pre-operative and post-operative states. The volume loss is expressed in cubic centimeters (cm3), and for adjusted muscle volume, the figures have been normalized by dividing the volume by the square of the patient’s height (volume/height2).
Table 3 illustrates a comparison between femoral neck fractures and intertrochanteric fractures, focusing on the loss of individual thigh muscle volume. We calculated the difference of individual thigh muscle volume between pre-operative and post-operative. To adjust each participant’s characteristic, we also adjusted the muscle volume, achieved by dividing the volume by the square of the height2 (m2). Observations indicate that in the female group, individual muscle volumes showed greater discrepancies in cases of intertrochanteric fractures compared to femoral neck fractures (average loss ratio of FNF: 17.8%, average loss ratio of ITF: 42%). However, in the male group, some major muscles like the sartorius (45.2%), vastus intermedius (39.8%), vastus medialis (30.4%) and gluteus maximus (38.0%) demonstrated particularly pronounced disparities for intertrochanteric fractures when compared to femoral neck fractures.
| Sartorius | Rectus femoris | Vastus lateralis | Vastus intermedius | Vastus medialis | Adductor longus | Adductor brevis | Adductor magnus | Gracilis | Pectineus | Gluteus maximus | Gluteus medius | Gluteus minimus | Fascia lata | Piriformis | Obturator internus | Obturator externus | Quadratus femoris | Semitendinosus | Semimembranosus | Biceps Femoris | ||
|---|---|---|---|---|---|---|---|---|---|---|---|---|---|---|---|---|---|---|---|---|---|---|
| Raw muscle volume (cm3) | Female FNF loss Avg | 43.4 | 28.6 | 213.5 | 193.0 | 156.3 | 50.3 | 37.2 | 264.0 | 30.6 | 19.0 | 304.3 | 63.5 | 34.3 | 22.3 | 26.7 | 26.8 | 30.8 | 31.4 | 66.4 | 91.4 | 91.2 |
| Female ITF loss Avg | 71.5 | 85.6 | 227.4 | 256.7 | 140.2 | 86.5 | 88.9 | 296.3 | 40.8 | 32.6 | 353.8 | 144.8 | 48.6 | 31.9 | 30.5 | 32.2 | 22.5 | 46.4 | 89.0 | 95.4 | 120.3 | |
| Male FNF loss Avg | 112.0 | 99.7 | 344.1 | 346.2 | 184.1 | 93.0 | 120.2 | 343.2 | 79.8 | 67.1 | 530.0 | 152.2 | 97.8 | 58.2 | 37.1 | 65.9 | 42.5 | 61.2 | 104.5 | 144.5 | 141.0 | |
| Male ITF loss Avg | 120.5 | 59.1 | 340.6 | 384.5 | 242.6 | 108.0 | 121.6 | 310.3 | 94.1 | 60.4 | 617.3 | 154.0 | 53.5 | 20.0 | 26.1 | 34.2 | 62.8 | 26.7 | 52.6 | 230.6 | 137.9 | |
| Adjusted muscle volume (volume/height2) | Female FNF loss Avg | 17.0 | 11.0 | 83.5 | 75.5 | 61.1 | 19.6 | 14.6 | 103.0 | 11.9 | 7.5 | 119.0 | 24.7 | 13.4 | 8.7 | 10.5 | 10.5 | 12.1 | 12.4 | 25.8 | 35.8 | 35.8 |
| Female ITF loss Avg | 30.4 | 35.5 | 94.6 | 106.6 | 58.1 | 36.2 | 37.2 | 124.0 | 17.3 | 13.8 | 148.2 | 59.7 | 20.2 | 13.4 | 12.6 | 13.4 | 9.3 | 19.4 | 37.0 | 39.6 | 50.1 | |
| Male FNF loss Avg | 40.2 | 35.6 | 123.5 | 124.0 | 65.8 | 33.1 | 43.2 | 122.6 | 28.7 | 24.0 | 189.0 | 54.3 | 35.0 | 21.0 | 13.2 | 23.6 | 15.3 | 22.1 | 37.4 | 52.0 | 50.3 | |
| Male ITF loss Avg | 44.3 | 21.7 | 125.0 | 141.1 | 89.1 | 39.6 | 44.6 | 113.9 | 34.6 | 22.2 | 226.7 | 56.6 | 19.6 | 7.4 | 9.6 | 12.6 | 23.0 | 9.8 | 19.4 | 84.7 | 50.6 | |
| Average muscle volume loss ratio | Female FNF loss ratio | 16.8 | 3.3 | 23 | 21.4 | 19.3 | 12.4 | 13.4 | 14.4 | 9.4 | 18 | 15.4 | 11.8 | 13.4 | 14.4 | 26.2 | 28.9 | 34.6 | 25.4 | 7.8 | 25.4 | 19 |
| Female ITF loss ratio | 44.8 | 37.8 | 43.4 | 45.4 | 35.6 | 43.7 | 48.9 | 41.9 | 40.1 | 34.8 | 37.7 | 39 | 34.9 | 38.2 | 49.1 | 47.5 | 44.2 | 43.1 | 43.6 | 47.9 | 41 | |
| Male FNF loss ratio | 42.8 | 27.9 | 41.2 | 37 | 29.6 | 28.3 | 52.5 | 31.2 | 45.9 | 48.4 | 34.4 | 29.4 | 38.1 | 53.2 | 32.2 | 52.3 | 60.4 | 48.5 | 34.3 | 40.2 | 27.9 | |
| Male ITF loss ratio | 45.2 | 17.6 | 33.8 | 39.8 | 30.4 | 44.3 | 43.8 | 26.9 | 51.8 | 46.4 | 38 | 26.2 | 22.7 | 19 | 36.4 | 33.8 | 54.2 | 22.2 | 18.3 | 46.3 | 23.8 |
Note:
The losses in volume for individual thigh muscles from pre-operative to post-operative assessments. The average loss is measured in cubic centimeters (cm3), with adjusted muscle volumes normalized by the square of the patient’s height (volume/height2). The ratio values provide a comparative analysis of muscle volume losses between different types of hip fractures. To discern which hip fracture type corresponds to greater muscle volume disparities, the percentage differences for each individual muscle relative to the alternate fracture type are calculated and presented.
Additionally, as depicted in Fig. 8, which presents data for subgroups merged by gender, the average disparity ratio of total muscle volume in thigh was found to be 29.8% in the femoral neck fracture group and 40.3% in the intertrochanteric fracture group. Most larger thigh muscles exhibited a greater volume loss in intertrochanteric fractures compared to femoral neck fractures. The average percentage of muscles volume loss in vastus lateralis (FNF: 35.1% vs. ITF: 41.8%), vastus intermedius (FNF: 31.8% vs. ITF: 44.4%), vastus medialis (FNF: 26.1% vs. ITF 34.7%), adductor magnus (FNF: 25.6% vs. ITF: 39.4%), gluteus maximus (FNF: 28% vs. ITF: 37.8%), gluteus medius (FNF: 23.5% vs. ITF: 36.9%), sartorius (FNF: 34.2% vs. ITF: 44.9%), rectus femoris (FNF: 19.7% vs. ITF: 34.5%) and adductor longus (FNF: 23% vs. ITF: 43.8%).
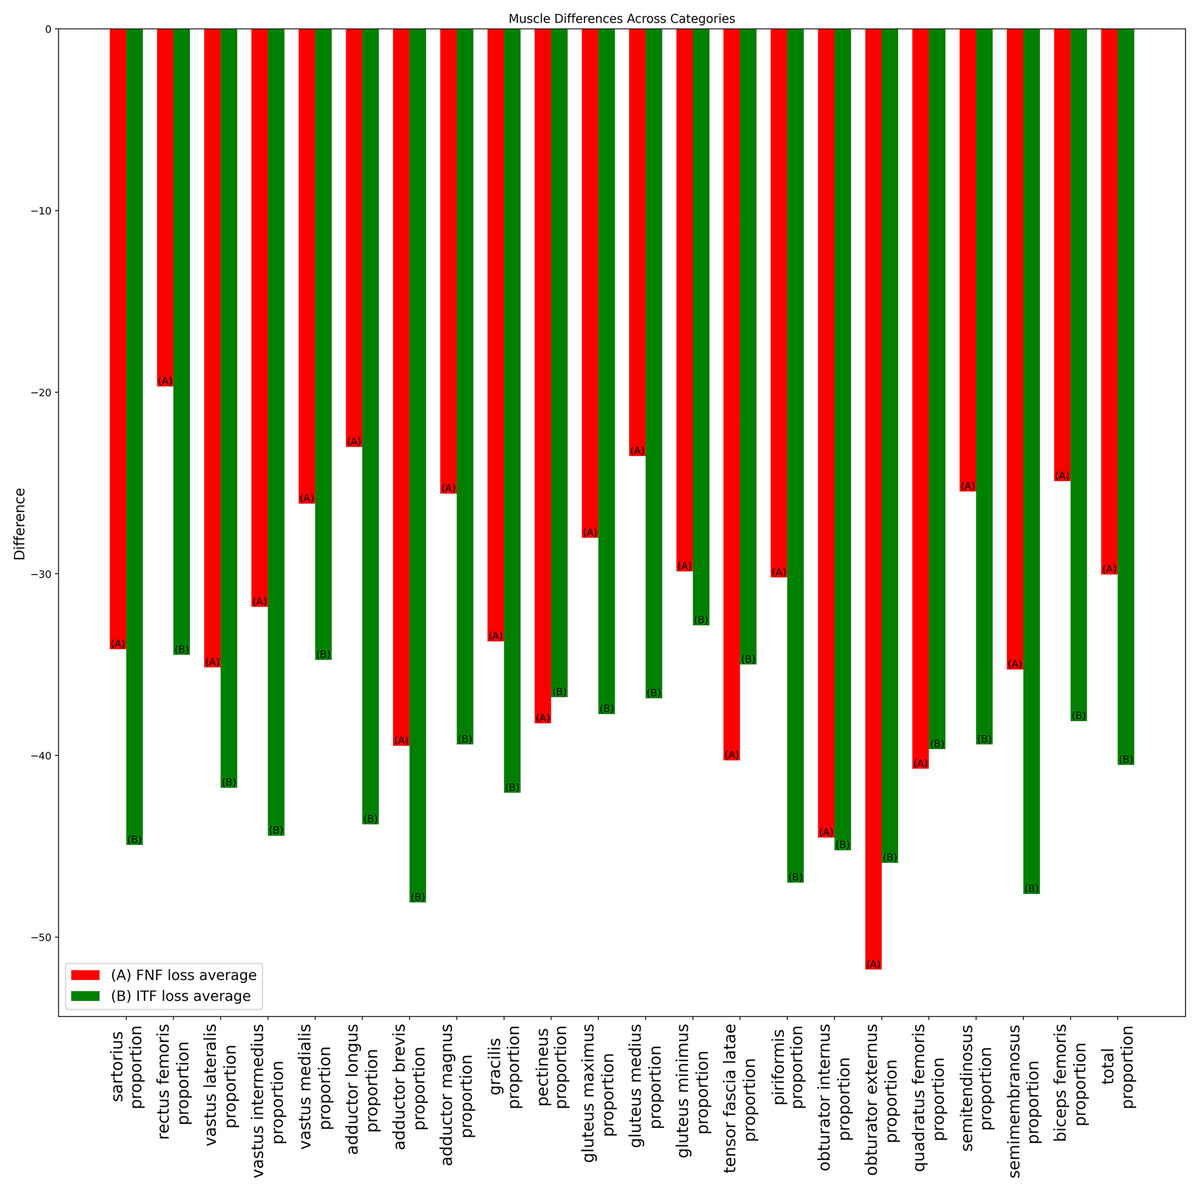
Figure 8: Bar chart of average muscle volume difference ratio across fracture types in combined-gender groups.
The ratios of average individual muscle volume differences for gender-combined groups, comparing pre-operative and post-operative results. Ratios were calculated by dividing the difference between pre- and post-operative results by the pre-operative volume. Red (A) bars denote the femoral neck fracture group, while green (B) bars represent the intertrochanteric fracture group.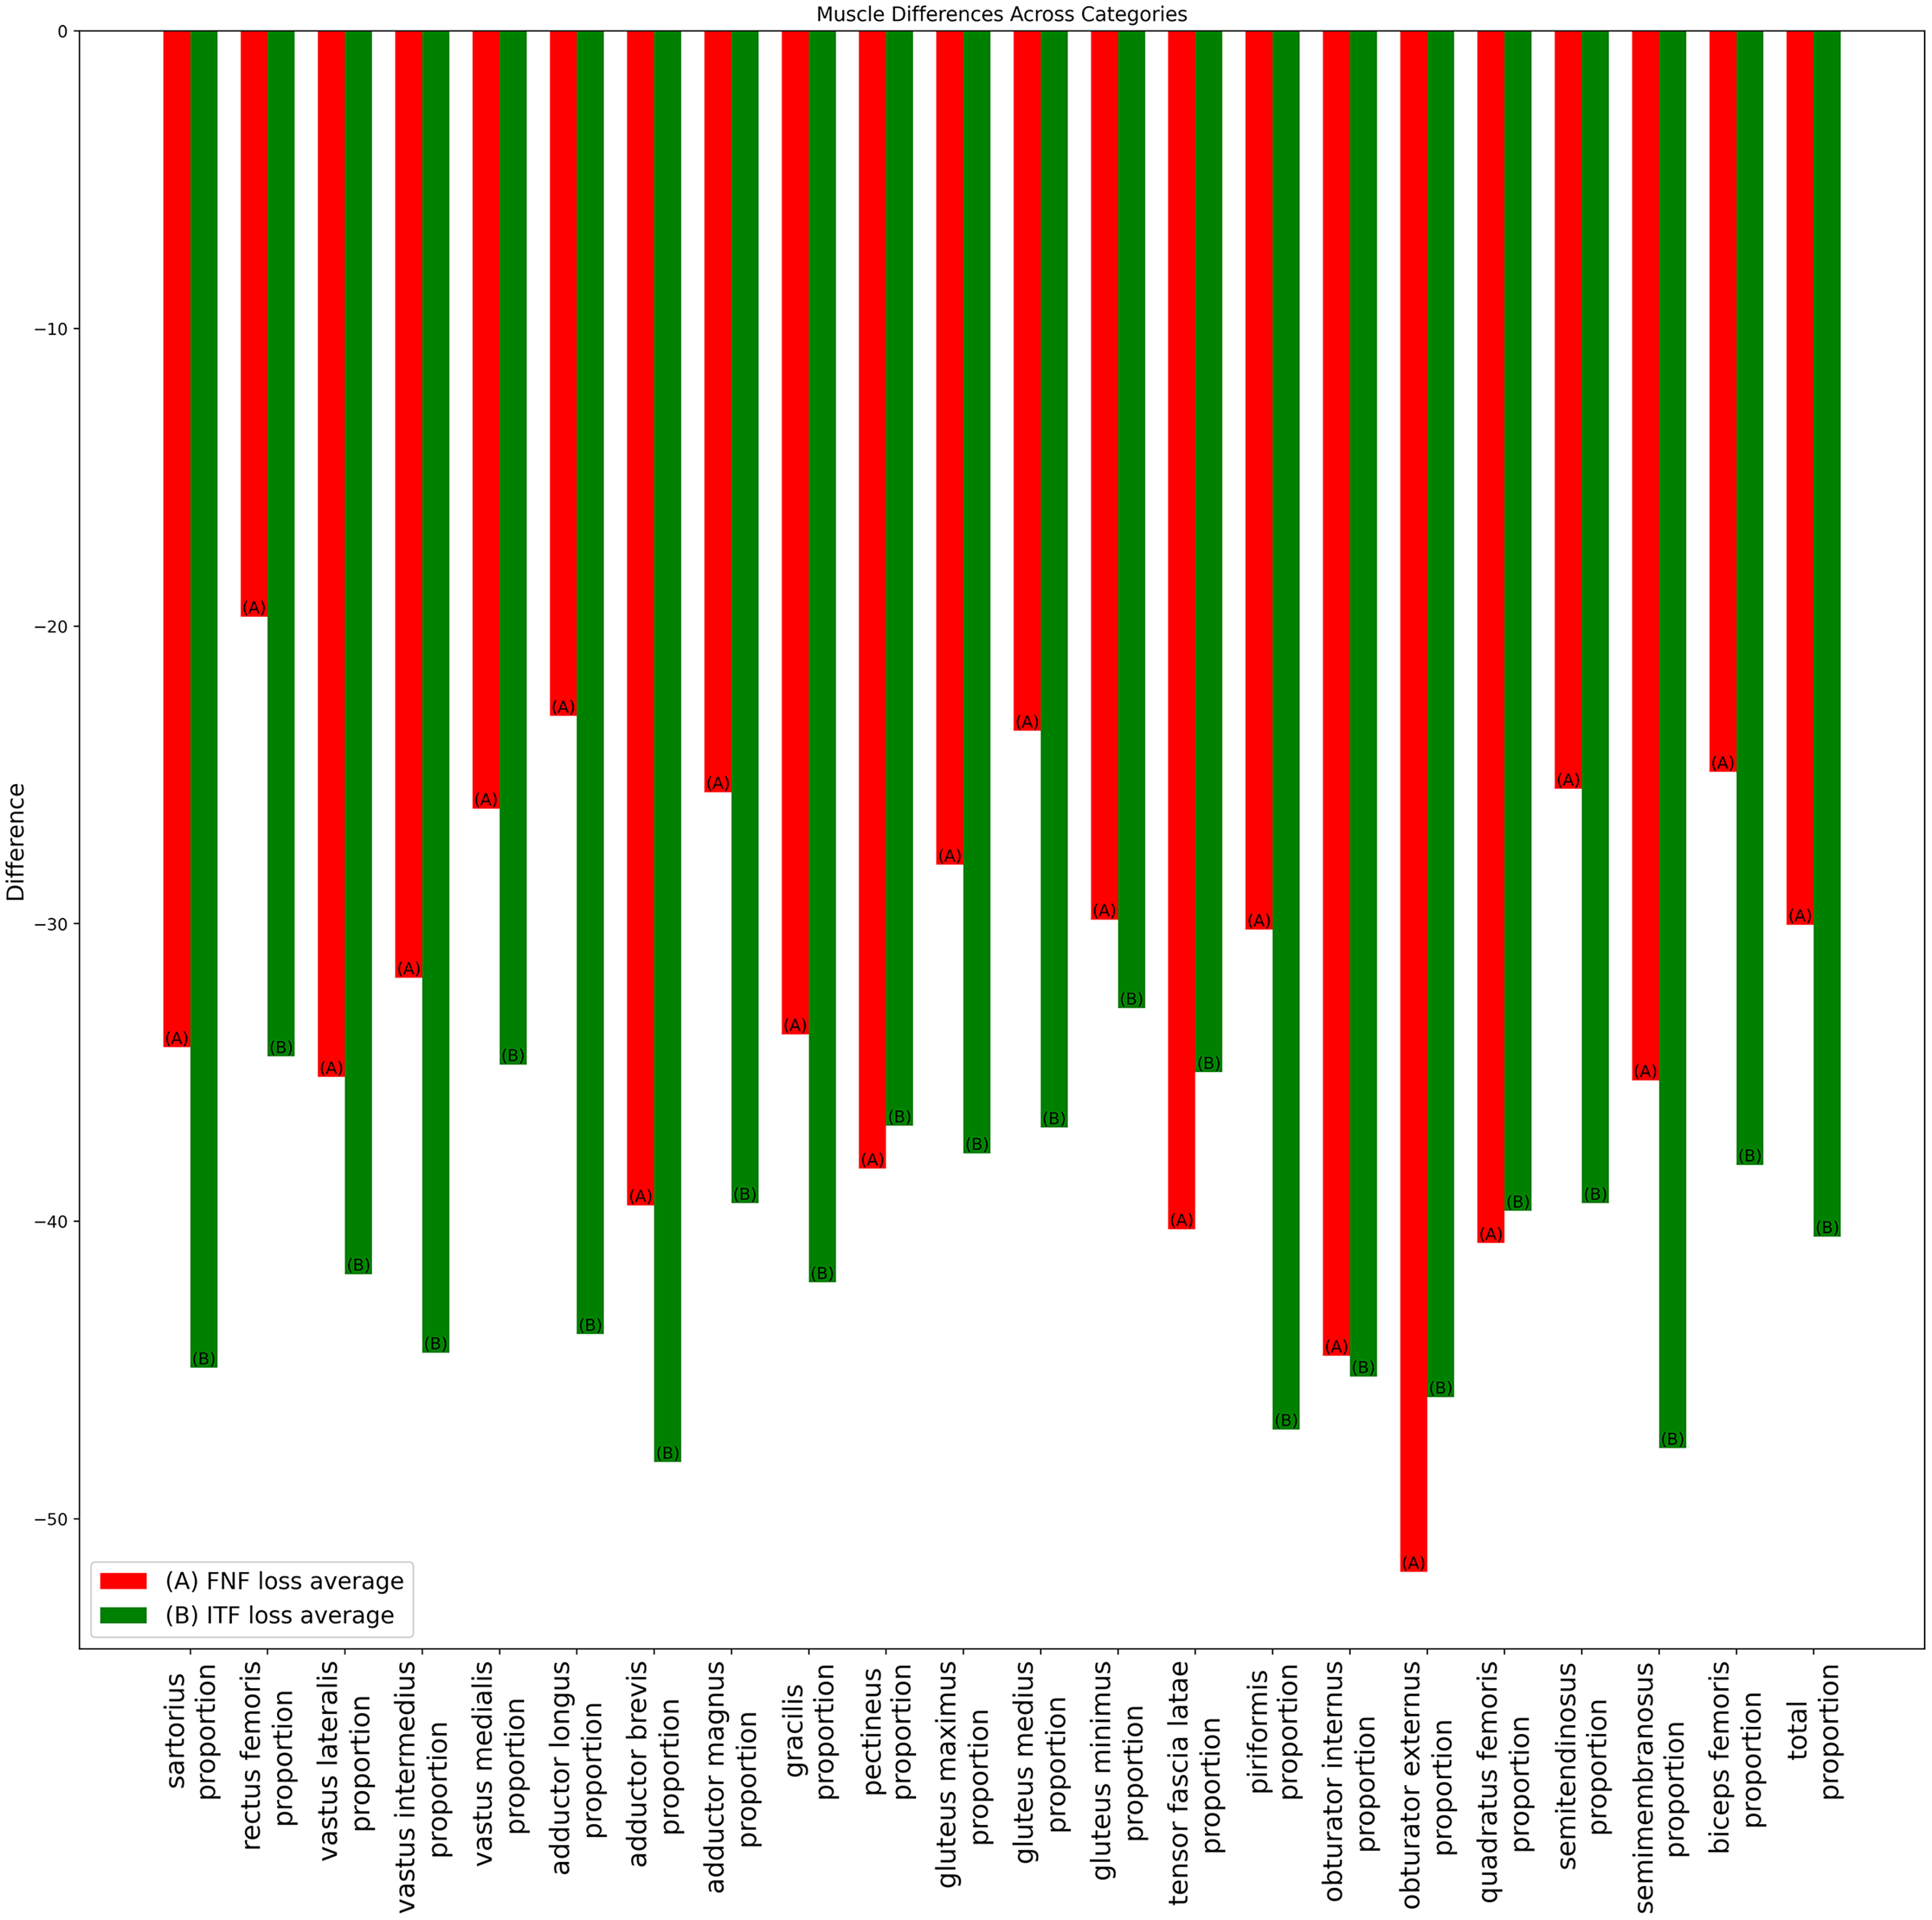
Discussion
Hip fractures, particularly those requiring surgical intervention, often bring about significant traumatic pain (Elboim-Gabyzon, Andrawus Najjar & Shtarker, 2019). This traumatic pain, in turn, could influence muscle strength and exacerbate muscle loss might cause gait abnormalities (Xu et al., 2019; Peres-Ueno et al., 2023). Furthermore, these fractures are predominantly observed in the elderly, linking them closely to issue of sarcopenia (Eguchi et al., 2019; Inoue et al., 2020; Chiang, Kuo & Chen, 2021; Park et al., 2022). By incorporating these various factors, we can form a more comprehensive understanding of the complexities surrounding muscle loss due to hip fractures. This enriched perspective sets the stage for future research and clinical practice (Inan et al., 2005; Oh et al., 2020; Kanaya et al., 2023; Robinson et al., 2023).
Building on this context, our research has unveiled some key findings related to the differential muscle loss experienced in patients with intertrochanteric and femoral neck fractures. The analysis of muscle loss patterns, as detailed in Table 2, reveals a key finding that the average total muscle volume loss is higher in patients with intertrochanteric fractures compared to those with femoral neck fractures. This suggests a greater susceptibility to muscle loss and deformities in intertrochanteric fractures, a concern particularly relevant in the context of sarcopenia after hip fracture and the development of rehabilitation strategies.
Further detailed in Figs. 6 and 7, along with Table 3, are the comparison of individual thigh muscle volume losses between femoral neck and intertrochanteric fractures. This comparison, incorporating a ratio to represent the comparative loss, highlights specific muscles such as the vastus lateralis, adductor longus and gluteus maximus are more adversely affected by volume loss in cases of intertrochanteric fractures in both females and males. Conversely, as depicted in Fig. 8, the sartorius muscle exhibits a contrasting trend, with greater disparities in femoral neck fractures, particularly in the subgroups merged by gender. These variations in individual muscle volume loss are critical for developing customized rehabilitation strategies and interventions following hip fracture surgery, highlighting the importance of fracture-type-specific approaches.
In prior studies on muscle deformation related to types of hip fractures, cross-sectional area (CSA) measurements of the psoas and gluteus medius indicated that the CSA of Gluteus medius was significantly larger in cases of intertrochanteric fractures (ITF) than in femoral neck fractures (FNF) (Yerli et al., 2022). Contrarily, our findings, as shown in Table 3, reveal a marked increase in gluteus medius volume loss in the ITF group but only among females, with an average volume loss of 11.8% for ITF compared to 39% for FNF. Another investigation into the CSA of gluteus medius and minimus found no significant difference (Erinç et al., 2020). However, our research illustrates a notable distinction in the female group, where the average loss of gluteus minimus volume in ITF (34.9%) far exceeded that in FNF (13.4%).
Potential explanation for the greater volume loss observed in ITF compared to FNF could be anatomical; major muscles such as the gluteus and vastus are located in the intertrochanteric region and are likely impacted by neural factors as well. Research has shown that bone mineral density (BMD) is significantly associated with the size of the gluteus maximus (p < 0.001) and the mid-thigh area (Yin et al., 2020). This association might partially elucidate why ITF results in significantly greater volume loss in females compared to FNF. The decrease in bone peak in females, primarily due to changes in estrogen levels, is linked to muscle deformation (Spangenburg et al., 2012; Huo et al., 2015). Concerning hip fractures, the intersection point of peak bone and muscle mass loss marks a period of increased hip fracture fragility (Henry et al., 2004; Ho-Pham et al., 2011; Pasco, Nicholson & Kotowicz, 2012). Upon experiencing a hip fracture, females are often already undergoing osteoporosis, and a lower BMD may accelerate the deformation of hip and thigh muscles.
One major limitation of our research lies in the limited dataset size pertaining to hip fracture patients that we could analyze more precisely for muscle volume on hip fracture types. This limitation prevented us from conducting more advanced statistical methods, such as point-biserial correlation or Wilcoxon signed-rank tests. Moreover, the retrospective design of our current study did not allow for the standardized collection of data regarding follow-up duration. To provide a more comprehensive view, we have included the follow-up duration details in the supplementary section. In our future research endeavors, we aim to prospectively gather data, which will enable us to categorize based on follow-up duration. This approach will facilitate the execution of advanced statistical analyses, thereby enhancing the depth of our findings.
Additionally, we acknowledge the significant importance of not only assessing muscle size but also considering the quality of intermuscular adipose tissue (IMAT). However, our training dataset was subject to certain constraints, primarily due to the labor-intensive nature of the manual annotation process using 3D slicer software. This process entailed the initial identification and delineation of muscle regions within specific classes, followed by the application of a hue threshold to differentiate non-muscle tissue in the imaging. These constraints led us to focus predominantly on muscle volume. Despite this focus, we recognize the need for and value of including IMAT volume in future research. To address this, we are considering two approaches: either modifying our existing dataset or developing a new AI model dedicated to the isolation and detailed analysis of IMAT tissue.
In addition, the presence of high artifacts in post-surgery CT scans, originating from screws and implants, might compromise the accuracy of voxel-level segmentation. These limitations should take into account when interpreting our findings and should be the focus of further research to rectify them. To address the limitations of high artifacts in future work, we plan to employ deep learning based pre-processing method by using Deep Residual U-Net architectures, which show promise in minimizing the impact of metal artifacts on the imaging (Selles et al., 2023).
It is crucial, however, to bear in mind that the specific surgical treatments administered for each type of fracture may have a role in shaping these outcomes. Future investigations should therefore focus on isolating the effects that different surgical methods have on muscle atrophy and functionality. Moving forward, we plan to integrate gait and muscle performance into our future research endeavors. This approach will enable us to assess the impact of surgical interventions on muscle function and recovery, providing valuable insights into their effectiveness in enhancing patient outcomes.
Conclusions
In conclusion, our study specifically focuses on the impact of femoral neck and intertrochanteric hip fractures on muscle volume loss, a key factor in sarcopenia among the elderly. Using our UNETR model for muscle segmentation, we found that intertrochanteric fractures, in particularly, lead to significant muscle volume loss in both genders, as evidenced in our results. This reduction in muscle volume was particularly evident in muscles such as the sartorius, the vastus group and gluteus group. These insights directly inform targeted rehabilitation strategies, aiming to improve recovery and quality of life for hip fracture patients. Our study provides a basis for future research into muscle loss associated with hip fractures, aimed at improving treatment and rehabilitation techniques.