
A comparison of the performance of bacterial biofilters and fungal–bacterial coupled biofilters in BTEp-X removal
- Published
- Accepted
- Received
- Academic Editor
- Paripok Phitsuwan
- Subject Areas
- Environmental Sciences, Ecotoxicology, Environmental Contamination and Remediation, Environmental Impacts
- Keywords
- Bacterial biofilter, Fungal-bacterial coupled biofilter, BTEp-X, Removal performance, Microbial community structure
- Copyright
- © 2024 Wang et al.
- Licence
- This is an open access article distributed under the terms of the Creative Commons Attribution License, which permits using, remixing, and building upon the work non-commercially, as long as it is properly attributed. For attribution, the original author(s), title, publication source (PeerJ) and either DOI or URL of the article must be cited.
- Cite this article
- 2024. A comparison of the performance of bacterial biofilters and fungal–bacterial coupled biofilters in BTEp-X removal. PeerJ 12:e17452 https://doi.org/10.7717/peerj.17452
Abstract
Background
Conventional biofilters, which rely on bacterial activity, face challenges in eliminating hydrophobic compounds, such as aromatic compounds. This is due to the low solubility of these compounds in water, which makes them difficult to absorb by bacterial biofilms. Furthermore, biofilter operational stability is often hampered by acidification and drying out of the filter bed.
Methods
Two bioreactors, a bacterial biofilter (B-BF) and a fungal–bacterial coupled biofilter (F&B-BF) were inoculated with activated sludge from the secondary sedimentation tank of the Sinopec Yangzi Petrochemical Company wastewater treatment plant located in Nanjing, China. For approximately 6 months of operation, a F&B-BF was more effective than a B-BF in eliminating a gas-phase mixture containing benzene, toluene, ethylbenzene, and para-xylene (BTEp-X).
Results
After operating for four months, the F&B-BF showed higher removal efficiencies for toluene (T), ethylbenzene (E), benzene (B), and para-X (p-Xylene), at 96.9%, 92.6%, 83.9%, and 83.8%, respectively, compared to those of the B-BF (90.1%, 78.7%, 64.8%, and 59.3%). The degradation activity order for B-BF and F&B-BF was T > E > B > p-X. Similarly, the rates of mineralization for BTEp-X in the F&B-BF were 74.9%, 66.5%, 55.3%, and 45.1%, respectively, which were higher than those in the B-BF (56.5%, 50.8%, 43.8%, and 30.5%). Additionally, the F&B-BF (2 days) exhibited faster recovery rates than the B-BF (5 days).
Conclusions
It was found that a starvation protocol was beneficial for the stable operation of both the B-BF and F&B-BF. Community structure analysis showed that the bacterial genus Pseudomonas and the fungal genus Phialophora were both important in the degradation of BTEp-X. The fungal-bacterial consortia can enhance the biofiltration removal of BTEp-X vapors.
Introduction
Volatile organic compounds (VOCs) and odorous compounds emitted from petrochemical industry wastewater treatment plants have become a significant source of gaseous pollutants. These emissions have been linked to poor air quality and adverse health effects in humans. An increasing number of government agencies are implementing stringent environmental legislation to compel polluting industries to implement effective air pollution treatment processes to control the output of VOCs and odorous gases. According to Hu et al. (2020), biological waste air treatment processes are not only more environmentally friendly but also less expensive than conventional technologies, such as catalytic and thermal oxidation, wet scrubbing, and activated carbon adsorption. Bacterial biofilters (B-BFs) are compost beds that allow waste gases to pass through while being absorbed and degraded by microorganisms immobilized on porous packing media (Delhomenie et al., 2002). Inorganic nutrients, such as nitrogen, phosphorous, potassium, and microelements, are regularly sprayed. B-BFs are commonly utilized for the treatment of large volumes of low-concentration VOCs or odors in air streams. Generally, B-BFs eliminate gaseous VOCs by converting them from the gas phase to the liquid phase, transferring them to biofilms, and ultimately to the microorganisms being degraded. Therefore, gas-liquid mass transfer is a crucial factor that influences VOC biodegradation by B-BFs. The rate at which pollutants transfer from air to water is proportional to Henry’s law constant (Sander, 2023). (1) where (dimensionless) represents Henry volatility (defined as c/c), while Cg (mol m−3) and Ca (mol m−3) represent the gas-phase concentration and aqueous-phase concentration of VOC, respectively.
On the basis of Henry’s law constants, VOCs were classified into three categories: hydrophilic VOCs (with a Henry’s law constant at 25 °C ranging from 0.0001 to 0.099), moderately hydrophilic VOCs (with a constant of 0.1−0.99) and hydrophobic VOCs (with a constant of 1−70) (Cheng et al., 2016a). Hydrophobic VOCs are more resistant to degradation in B-BFs due to the low mass transfer from the liquid phase to the biofilm phase, compared to hydrophilic VOCs (Zehraoui, Hassan & Sorial, 2012). In contrast, the removal efficiency (RE, %) of moderately hydrophilic VOCs is determined by both mass transfer and microbial activity (Dwivedi et al., 2004; Hernández et al., 2011). As shown in Eq. (2), a higher value of Hc results in a higher value of Cgo, which in turn leads to a lower VOC RE. (2) (3) where Cgi and Cgo is the inlet and outlet VOCs concentration, D is the diffusion coefficient in liquid phase (m2 s−1), as is the the biolayer surface per volume of package, Z the depth of packed bed (m), R is the ideal gases constant (Pa m3 mol−1 K−1), T is the temperature (K), Hc the Henry’s law constant (Pa m3 mol−1), U 0 the superficial velocity (m s−1), δ the biofilm thickness (m), and k is the reaction rate constant (s−1), h is the height of the filter bed, and φ is the Thiele number. Therefore, increasing the mass transfer of hydrophobic VOCs is beneficial for enhancing the removal performance of B-BFs. Several strategies have been investigated to increase bioavailability, such as innovative bioreactors, biofiltration with pretreatment, the use of fungal biocatalysts, the utilization of hydrophilic compounds, and the addition of hydrophilic compounds, have been investigated (Cheng et al., 2016a). The coexistence of fungi and bacteria has clear advantages in terms of removing VOCs and maintaining performance stability. This system is particularly effective for hydrophilic and moderately hydrophobic VOCs removal, as demonstrated by Cheng et al. (2016b), Lebrero et al. (2016), and Vergara-Fernández et al. (2018). Fungi are especially adept at purifying hydrophobic VOCs than other organisms due to their special hyphal structure, high hydrophobins, and abundant functional groups on their cell surfaces (Cheng et al., 2016a). Furthermore, fungi enhance the availability of contaminants and nutrients for bacteria by extending their hyphae (Kohlmeier et al., 2005). Additionally, they secrete thiamine (Deveau et al., 2010), cellulase and pectinase (Boer et al., 2005; Duponnois & Garbaye, 1990), and organic acids (Duponnois & Garbaye, 1990; Bharadwaj, Lundquist & Alström, 2008) that provide nutrients and break down hydrophobic VOCs into intermediates with improved water solubility, thereby improving bacterial performance. The secretion of chemicals can promote fungal development, stimulate fungal enzyme activity, eliminate compounds released by fungi that hinder their growth, and enhance biofilm formation. Consequently, in the coexistence system, bacteria can work in concert to break down complex molecules (Wang et al., 2023).
This study constructed a fungal-bacterial coupled biofilter (F&B-BF) to purify a mixture of hydrophobic VOCs and compared its REs, mineralization rates (MRs), physicochemical properties of biofilm, and microbial community structure with B-BF in detail. The aim of this work was to evaluate the performance of B-BF and F&B-BF in removing mixed hydrophobic VOCs and explain the potential mechanisms responsible for the superior performance of F&B-BFs.
Materials & Methods
Mixed VOCs
This study focuses on the efflux gases from three odour treatment units (pretreatment unit, biochemical treatment unit, and sludge disposal unit) in a typical petrochemical industry wastewater treatment plant (WWTP). The detection of mixed VOCs was carried out using solid-phase microextraction (SPME)-gas chromatography (GC)-mass spectrometry (MS) for qualitative and quantitative analysis (Tait et al., 2014; Sousa et al., 2006). Benzene, toluene, ethylbenzene, and para-xylene (BTEp-X) were the most prevalent pollutants according to the measured results. To simulate the BTEp-X gas experimentally, the method described by Cho et al. (2009) was used.
Experimental setup
The experimental system is illustrated in Fig. 1. Two bioreactors, B-BF and F&B-BF, were established to eliminate BTEp-X from an upflow waste air feed. The lab-scale biofilter was made of transparent Plexiglas and had an internal diameter of 8 cm, an effective bed height of 100 cm, and a working packed bed volume of 5 L. A perforated Teflon mesh was placed at the bottom to act as a support for the packing material and distribute gas-phase pollutants, while another perforated mesh at the top was used to distribute the mineral salt medium (MSM). Gas sampling ports sealed with rubber septa were available at equal intervals (10 cm) along the biofilter height and were used to collect gas samples by gas-tight syringes (250 µL, Hamilton, Switzerland) to determine the concentrations of toluene (T), ethylbenzene (E), benzene (B), and para-X (p-Xylene), and CO2 at different heights of the outlet. And the media sampling port was located in the middle of each bed layer vertically to collect packing samples using tweezers for bioinformation analysis (Fig. 1). Each sample was analyzed in triplicate. The system was supplied with compressed air via an air pump and filtered before being divided into five channels. Four of these channels were precisely controlled by four mass flow meters (CS200, Beijing Sevenstar Flow Co., LTD., China) and passed through vessels containing B, T, E, and p-X, respectively. And the fifth channel was just clean air. After mixing in a tank (inner diameter = 5 cm, effective bed height = 15 cm), these five streams were fed into the B-BF in an up-flow mode. Another mixture of BTEp-X was created following the same procedure to be introduced into the F&B-BF. The thermostat water bath (DK-S24, Shanghai Jing Hong Laboratory Instrument Co., Ltd., China) maintained a constant temperature of 25 °C for liquids B, T, E, and p-X, ensuring their consistent volatility throughout the experiment. Polyurethane foam (1 cm3) was used as the packing material due to its large specific surface area, high porosity, resistance to compaction, and low cost, as reported by Dorado et al. (2009).
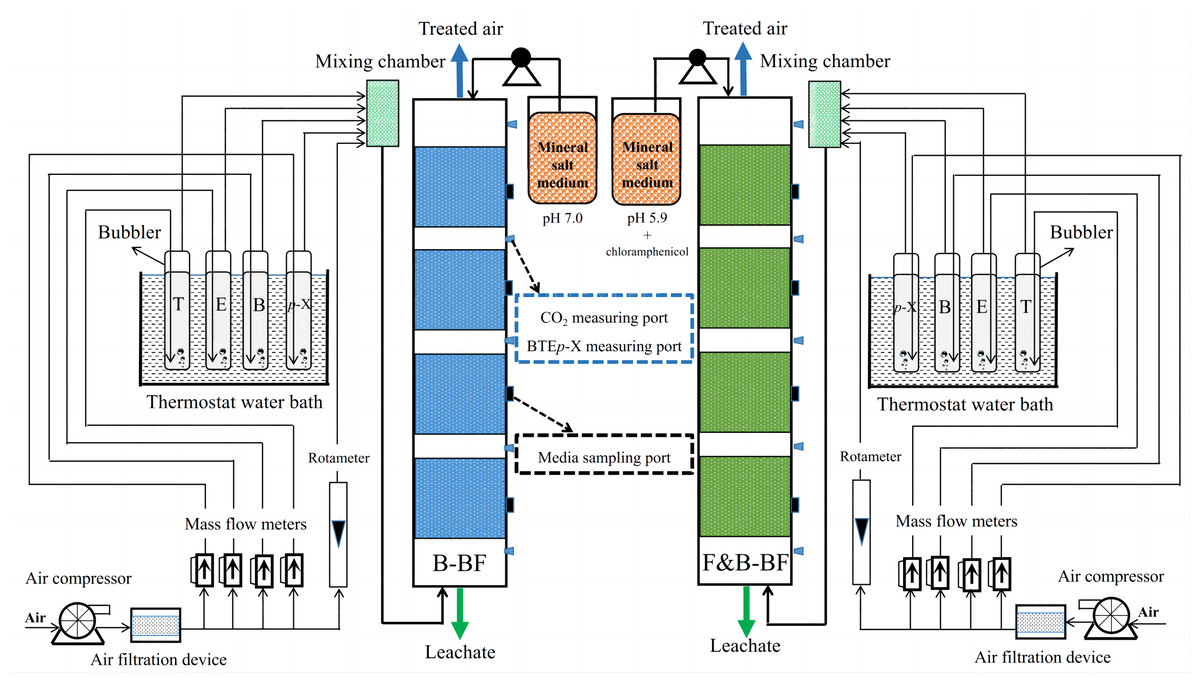
Figure 1: Schematic diagram of the B-BF and F&B-BF for BTEp-X waste gas treatment.
Method for construction and start-up
The B-BF start-up was initiated by introducing activated sludge from a WWTP in the petrochemical sector. An inducer-target graded acclimation strategy and a gas-liquid phase joint inoculation method were used (Devinny, Deshusses & Webster, 2017). The activated sludge was mixed with a nutrient solution and continuously dripped onto the filter bed packings from the top. Simultaneously, 100 mg m−3 of T exhaust gas was supplied to the filter bed to allow the biofilm to adhere to the packings. The degradation efficiency was low during the early stages of membrane hanging when the biofilm had not yet matured. After purification, T was reintroduced to the filter bed using an air pump. After the biofilm matured, T was replaced with a mixture of B, T, E, and p-X to simulate exhaust gas for domestication purposes. The start-up of B-BF was considered complete when the removal rate exceeded 80%. The F&B-BF was built and launched based on the B-BF, utilizing the low pH of the MSM and antibiotics (Zhai, Jiang & Long, 2020). The start-up of F&B-BF was considered to be complete when the ratio of the 18S rRNA to 16S rRNA gene copy number (F/B) was greater than 0.27 (Veiga et al., 1999). The B-BF and F&B-BF were operated at room temperature with an empty bed residence time (EBRT) of 120 s, 90 s and 60 s, respectively, by modifying the inflow of air. The MSM utilized in the B-BF was described by van Groenestijn & Liu (2002). It contained the following per liter of demineralized water: 4.5 g KH2PO4, 0.5 g K2HPO4, 2.0 g NH4Cl, 1.0 g MgSO4 ⋅ 7H2O, 2 mL of a solution of minerals and 2 mL of a vitamin solution. For the F&B-BF, the components of MSM were adjusted as follows: pH 5.9, NO3− substituting for NH4+ as the nitrogen source, and the addition of 20 g m−3 chloramphenicol as antibiotics (Zhai, Jiang & Long, 2020). To maintain adequate nutrient and moisture contents within the filter bed, a liquid medium was periodically sprinkled at a rate of 20 mL min−1 (10 min), once every 3 d, from the top of the biofilter. The pH of the recirculated nutrient medium was maintained constant, at 7.0 for B-BF and 5.9 for F&B-BF using a 0.1 mol L−1 solution of sodium hydroxide or hydrochloric acid, depending on the experimental program. The pH was measured by means of a pH electrode (EASYFERM 120, Hamilton) attached to the nutrient collection tank and an on-line pH controller coupled to an electro valve (DO 9765T, Dual 3½ Digit pH redox indicator and regulator, Italy). Biofilter efficiency is influenced by the biomass attached to the packing inside the biofilters (Moussavi et al., 2009). However, a high concentration of biomass does not guarantee superior removal efficiencies. Instead, it can lead to the rapid accumulation of excess biomass, an increase in pressure drop (ΔP), and ultimately clogging and poor removal performance (Kennes & Veiga, 2002; Ryu, Cho & Chung, 2010). To control the excessive biomass accumulation, weekly backwashing was performed with 1 L of 20 °C water from the top of B-BF and F&B-BF for 1 h, respectively (Han, Wang & Liu, 2018).
Analytical procedures
Gas samples collected from the inlet and outlet of the B-BF and F&B-BF were measured for individual gaseous BTEp-X concentrations using a gas chromatograph (GC) (2014, SHIMADZU, Japan) equipped with a Rtx-5 capillary column (30 m, 0.32 mm ID, 0.5 µm) and a flame ionization detector (FID), as previously described (Lee et al., 2002). The injector, oven, and detector were set to temperatures of 210, 100, and 250 °C, respectively. The concentration of carbon dioxide (CO2) was analyzed using a GC (9890A, Shanghai Linghua Instrument Co., Ltd., China), fitted with a methane conversion furnace, a TDX-01 packed column (0.7 m, 2 mm) and equipped with a FID. The injection and oven temperatures were 350 °C and 90 °C, respectively, with the FID set at 250 °C (Zhai, Jiang & Long, 2020). The ΔP across the height of the biofilter was periodically observed using a glass U-tube water manometer with an operating range of 0–40 cm. The removal performance of BTEp-X was compared between B-BF and F&B-BF using the following parameters: EBRTs, REs, and MRs. Each error bar represents the mean ± SD. (4) (5) (6) (7) (8) (9) where Q is the gas flow rate (m3 h−1), and V is the effective volume of the filter bed (m3). Cin and Cout represent the inlet and outlet individual BTEp-X concentrations (mg m−3), respectively. Cairborne CO2,in represents the inlet airborne CO2 concentrations (mg m−3), while CCO2,out,B,T,E,p−X represents the outlet CO2 concentrations (mg m−3) of individual BTEp-X, respectively. These concentrations were measured using a carbon dioxide isotope analyzer (CCIA-36-EP, LGR, USA).
Qualitative analysis of biofilm
The relative biofilm hydrophobicity was determined according to the method described by Rosenberg, Gutnick & Rosenberg (1980), Xie et al. (2019) and Mu et al. (2020. In brief, one mL of bacteria (OD400 = 0.6) was placed into glass tubes and 250 µL of n-hexadecane (Macklin, H810865) was added. The OD400 of the aqueous phase was measured before and after extraction with n-hexadecane. The relative biofilm hydrophobicity can be calculated using Eq. (10): (10) Where OD 0 and OD are the OD 400 before and after extraction with n-hexadecane, respectively. The experiments were conducted with three independent cultures per condition. Biofilm extracellular polymeric substances (EPS) were extracted accurately and analyzed promptly using heat extraction as follows: heating for 10 min at 80 °C (1 bar), two ultracentrifugations 4 °C (20000G, 20 min and 10000G, 15 min), purification with a 3500D dialysis membrane, 4 °C, 24 h, as described by Comte, Guibaud & Baudu (2006). The EPS samples were freeze-dried immediately after extraction and stored at −18 °C until use. The zeta potential was roughly calculated using the Helmholtz-Smoluchowski method based on electrophoretic mobility measurements obtained from a Doppler electrophoretic light scattering analyzer (Zetamaster, Malvern Instruments, Malvern, UK) (Hiementz, 1986).
Microbial analysis
Biofilms were sampled from the middle layer of the B-BF and F&B-BF at designed intervals on days 112, 140 and 168. As detailed in a prior study, sample DNA extraction, quantitative real-time polymerase chain reaction (qRT-PCR) for bacteria and fungi, Illumina high-throughput sequencing, and bioinformatics analysis were carried out using the method described by Zhai et al. (2017).
Results and Discussion
VOC determination
Based on the in situ measurements, B, T, E, p-X were selected as model VOCs for moderately hydrophobic chemical emissions commonly found in a typical petrochemical industry WWTP. The main VOC components and concentrations are shown in Table 1.
Removal performance comparison
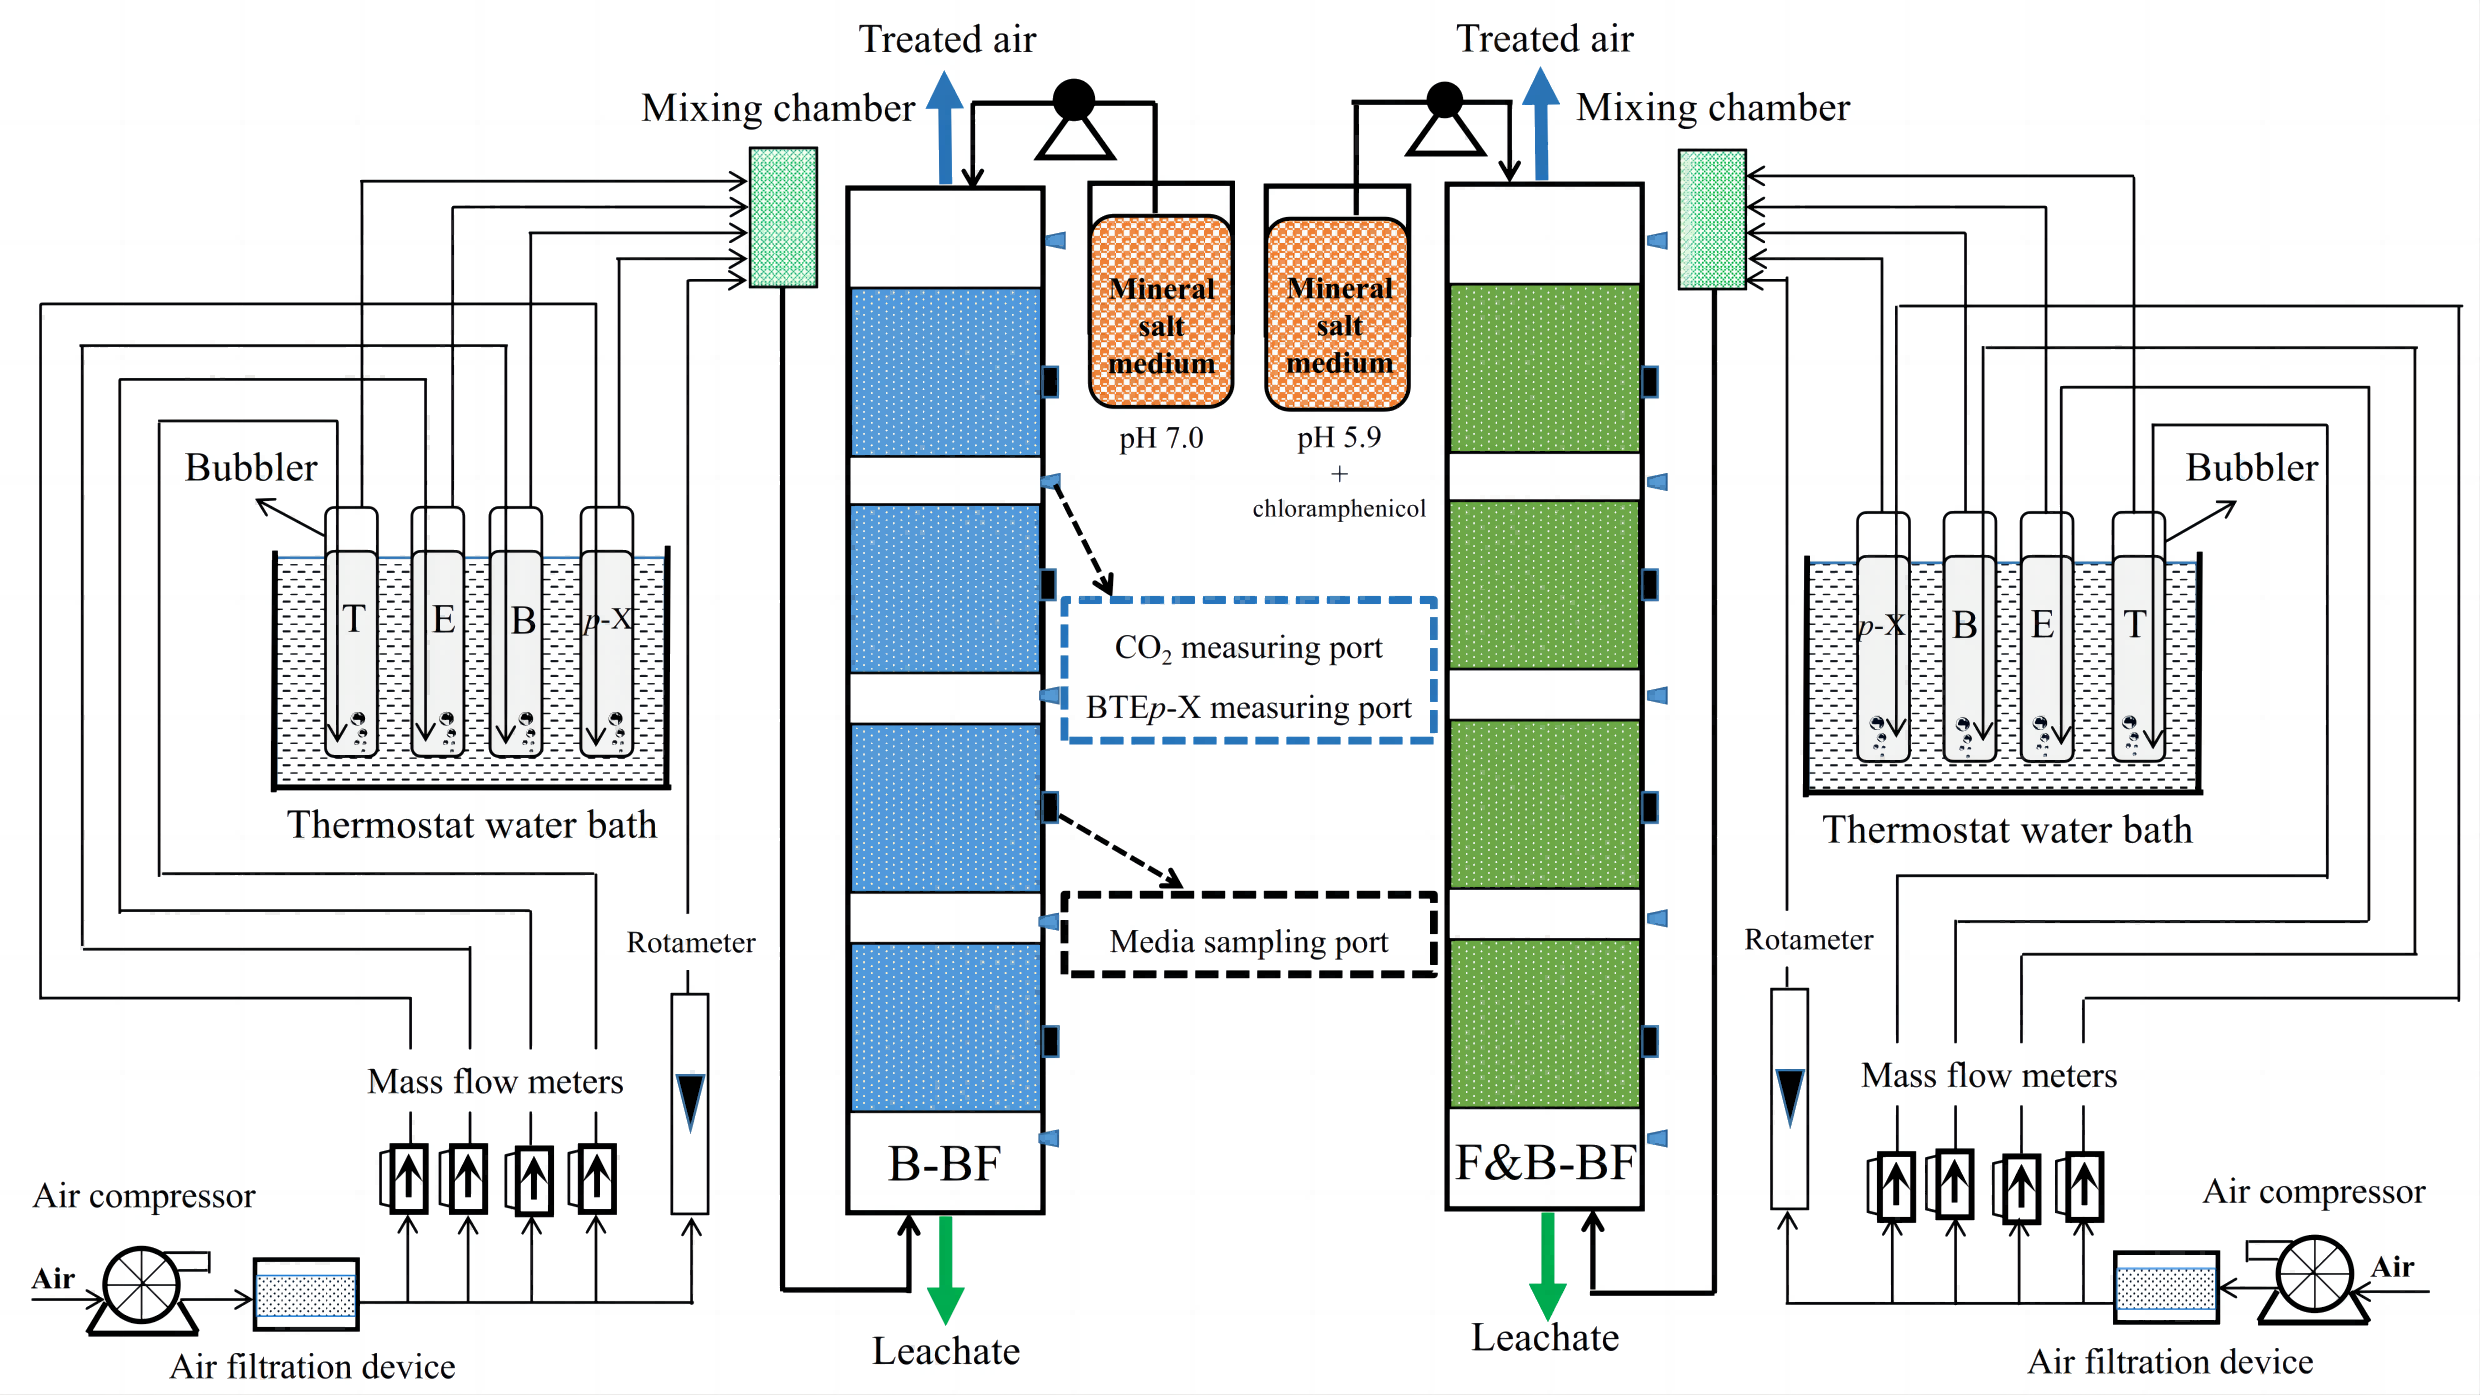
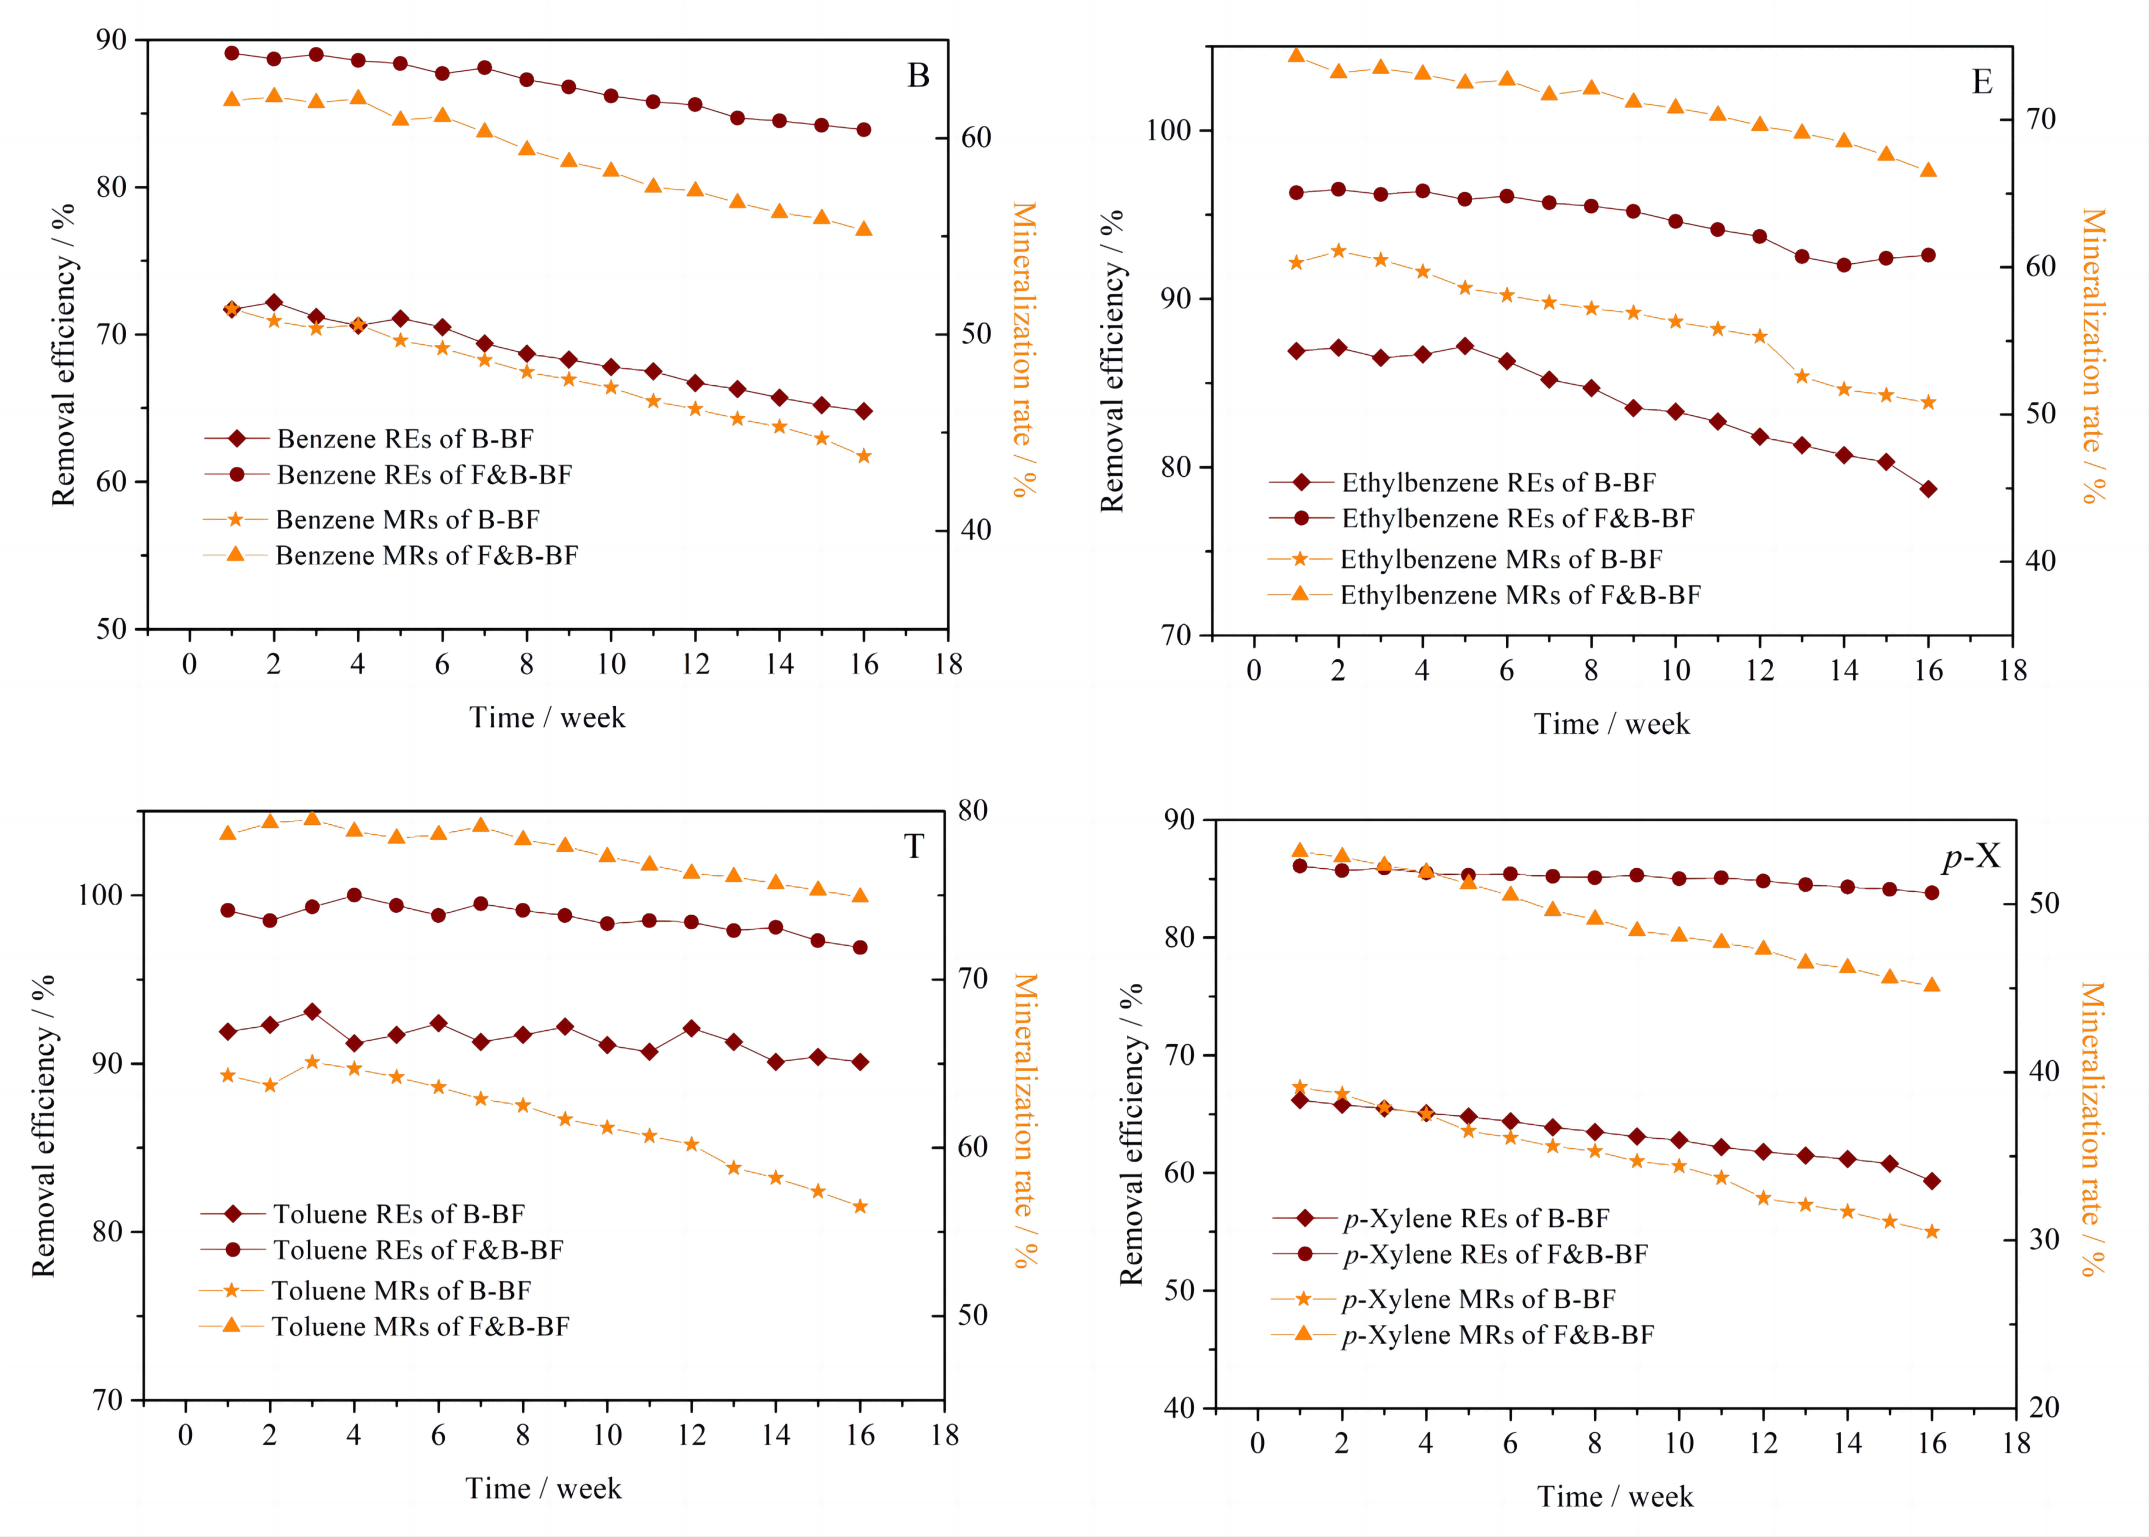
After the successful start-up, the BTEp-X REs and MRs of the B-BF and F&B-BF were compared over the following 112 days at an EBRT of 90 s. During the 112-day operation period, the influent concentrations of BTEp-X were as follows: B = 35.8 ± 2.3 mg m−3, T = 22.7 ± 1.5 mg m−3, E = 9.5 ± 0.7 mg m−3, and p-X = 14.4 ± 1.2 mg m−3 for the B-BF and F&B-BF, respectively. According to Kim & Deshusses (2005), the REs decrease as the Henry’s law constants increase. The Henry’s law constants for B, T, p-X, and E at 25 °C are 0.557, 0.673, 0.699 and 0.798, respectively, which were obtained from the SRC Phys Prop Database (http://esc.syrrees.com) (Sieg, Fries & Puttmann, 2008). Therefore, it can be assumed that the REs for B are the highest, followed by T, with p-X and E having the lowest. However, the data presented in Fig. 2 shows that the B-BF removed individual VOCs with the following efficiency over the tested concentration range: T, 90.1–93.1%; E, 78.7–87.2%; B, 64.8–72.2%; and p-X, 59.3–66.2%. It is important to note that B-BFs are only effective for removing VOCs with low and medium Henry’s law constants due to mass transfer limitations (Deshusses & Johnson, 2000; Zhu et al., 2004). Additionally, previous studies have shown that B and p-X are more resistant to removal than T and E (Hassan & Sorial, 2009; Garciá-Pea et al., 2008). The F&B-BF showed RET,E values of over 95% and 90%, respectively, compared to the REs of B and p-X, which were between 80% and 90% (Fig. 2). Its RET,E,B,p−X was superior to that of the B-BF. The production of CO2 is a crucial characteristic for assessing the biodegradation rates of pollutants, as it can reveal critical details about the extent of VOC mineralization. Similarly, for the F&B-BF, the MRs of individual BTEp-X outperformed those of the B-BF. These results were obviously higher than those previously reported in the literature (Sun et al., 2020; Ghasemi et al., 2020), indicating improved performance. Although compounds with higher Henry’s law constants generally have lower removal rates, the BTEp-X were efficiently degraded and mineralized by the F&B-BF under the experimental operating conditions. The presence of fungi in the F&B-BF allows for direct capture of BTEp-X from the gas phase to biofilms, resulting in higher partitioning of pollutants to biofilms than the B-BF.
| Wastewater treatment unit | Benzene (B) |
Toluene (T) |
Ethylbenzene (E) |
para-Xylene (p-X) |
|---|---|---|---|---|
| Pretreatment unit (Grill well-Catchment tank-Regulating tank-Oil-water separator-Cavitation air flotation-Dissolved air flotation) |
564.2 | 259.4 | 30.1 | 142.2 |
| Biochemical treatment unit (Anaerobic-aerobic process) |
323.3 | 63.2 | 4.8 | 36.7 |
| Sludge disposal unit (Surplus sludge dewatering and drying process) |
60.2 | 5.7 | 19.8 | 82.3 |
| Negative pressure gas collector | 35.8 | 22.7 | 9.5 | 14.4 |
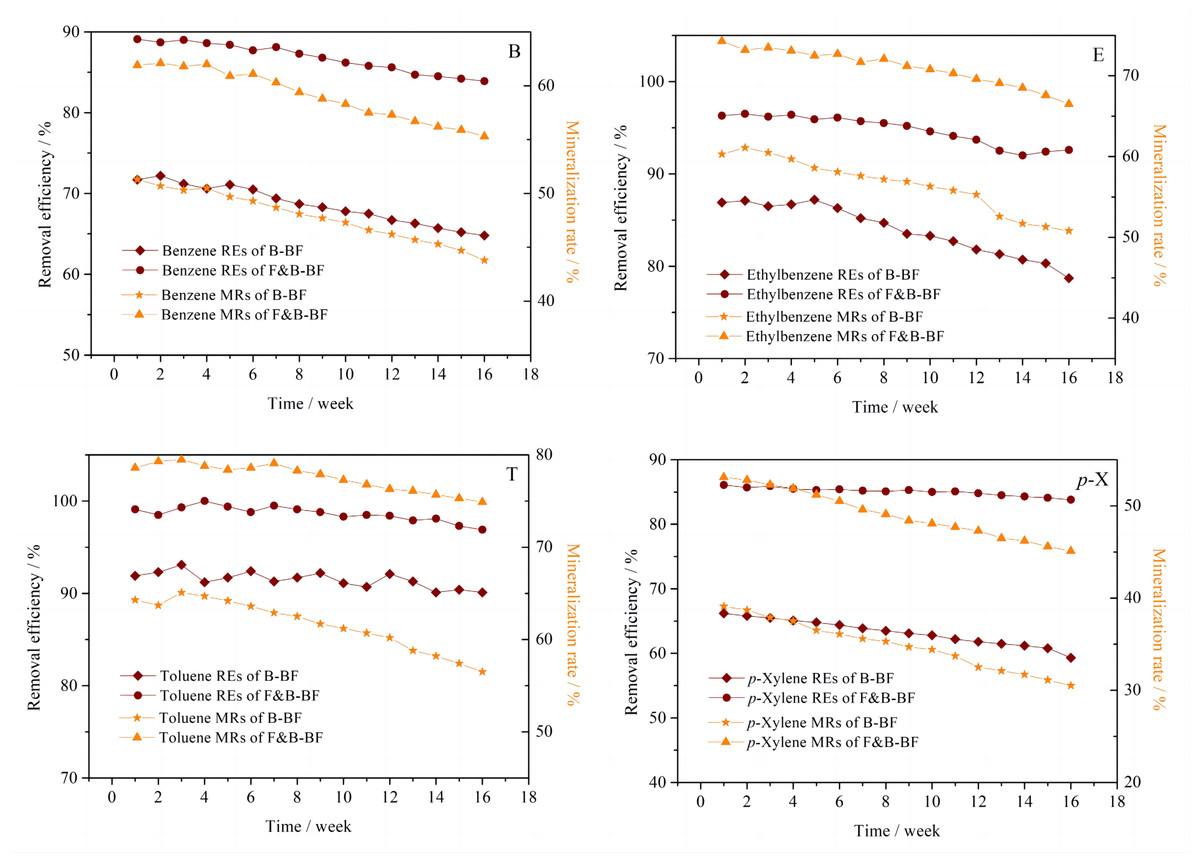
Figure 2: Comparison of the performance in BTEp-X removal between the B-BF and F&B-BF.
Cell surface hydrophobicity (CSH) is a crucial factor that affects microbial adsorption and degradation (Yuan et al., 2018). Strains with high hydrophobicity can enhance the degradation of hydrophobic VOCs (Zhang et al., 2010). Fungi generally have higher CSH than bacteria (Zhang et al., 2019), which is why the fungal biofilter (F-BF) outperformed the B-BF in removing hydrophobic VOCs removal (Cheng et al., 2016b). Analysis revealed that after 4 months of stable operation, the relative hydrophobicities of the biofilms in the B-BF and F&B-BF were 21–35% and 76–89%, respectively. This difference in hydrophobicity was one of the reasons why the F&B-BF outperformed the B-BF in BTEp-X removal.
Chen et al. (2017) discovered that a higher negative zeta potential of of EPS is more beneficial for generating migration potential and increasing the probability of collision between the pollutant molecules and degrading strains. The analysis results show that the zeta potential of the biofilm EPS in the B-BF changed from −13.7 mV to −9.5 mV. However, the zeta potential of the biofilm EPS in the F&B-BF showed a more significant slow-growth trend (−18.3 mV to −16.1 mV) following a four-month load operation test. Based on the experimental results, it is evident that the negative zeta potential of the biofilm EPS in the F&B-BF was higher than in the B-BF. The results indicate that the BTEp-X are more likely to come into contact with degrading strains in the F&B-BF than in the B-BF. This is why the BTEp-X removal performance of the F&B-BF was superior to that of the B-BF. These results further elucidated the excellent VOC purification performance of the fungal/bacterial coexistence system from the point of view of physicochemical cell surface properties.
EBRTs comparison
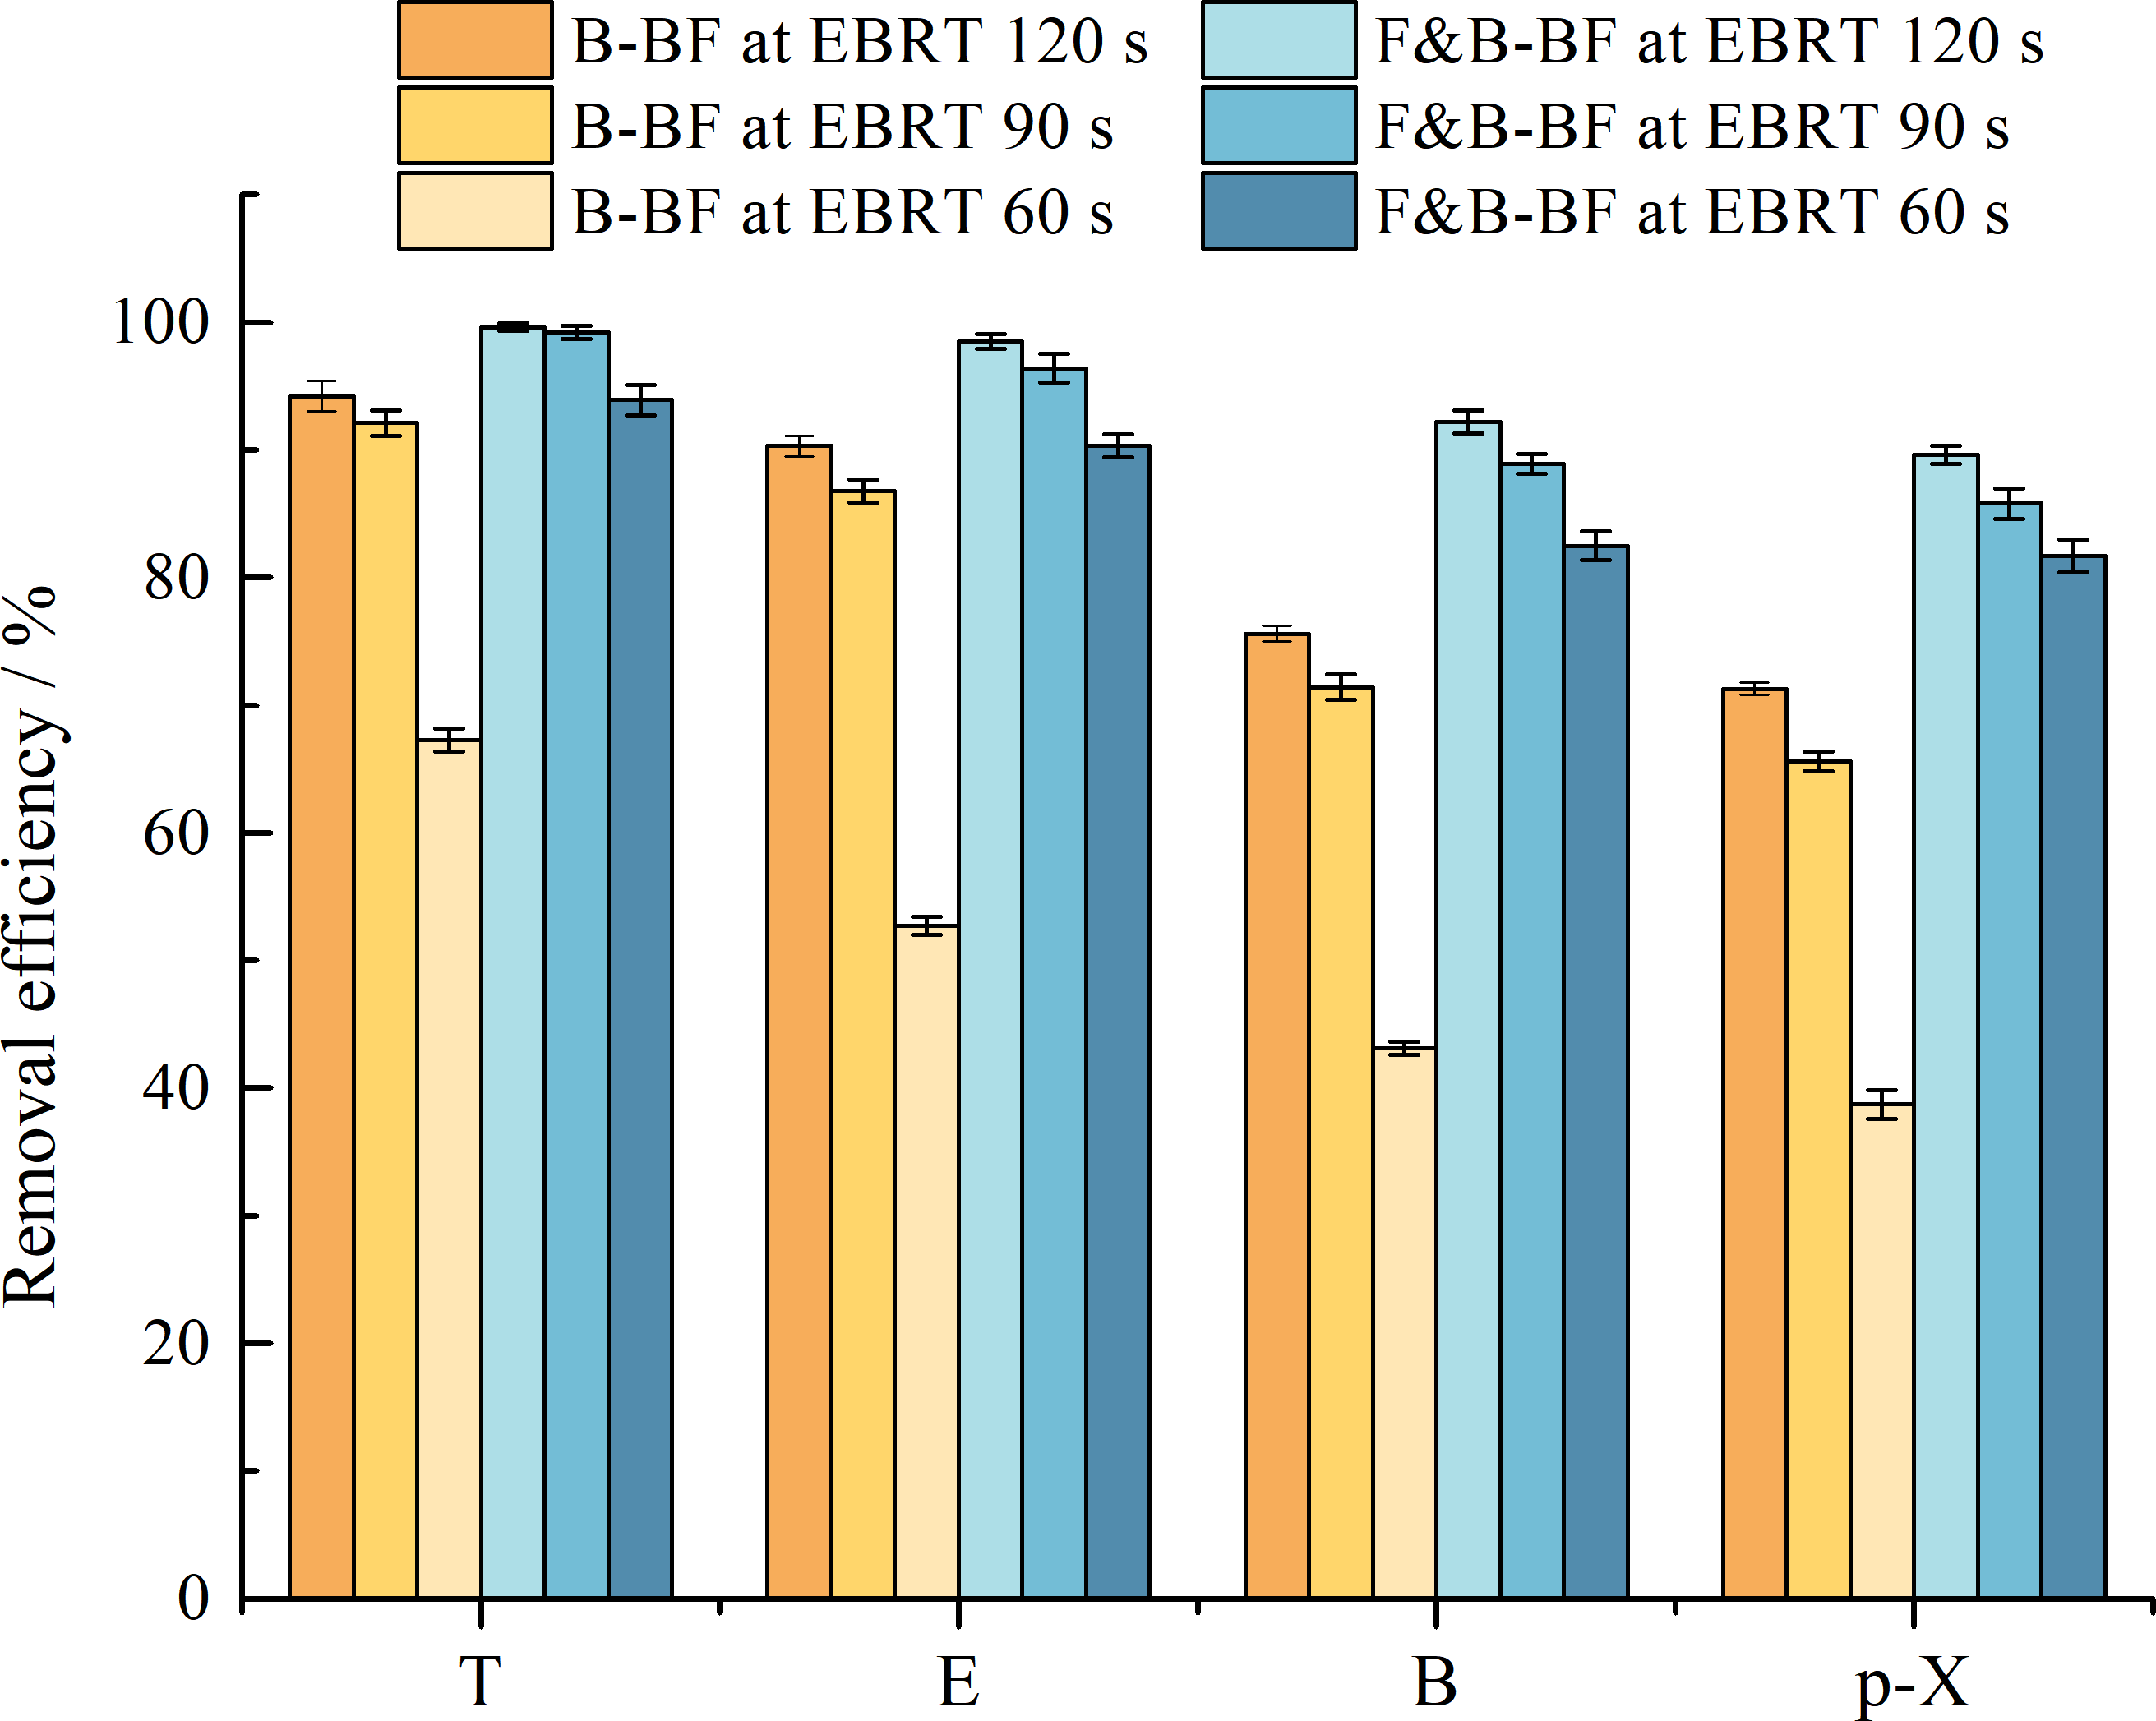
The removal performances of BTEp-X were compared between the B-BF and the F&B-BF at three different EBRTs, i.e., 120 s, 90 s and 60 s, respectively, with stable operation for 3 weeks. Figure 3 shows a reduction in the REs and MRs of the B-BF and the F&B-BF after the EBRT changed from 120 s to 60 s. For the B-BF, a sudden decrease in T, E, B, and p-X REs from approximately 94.2% to 67.3%, 90.3% to 52.7%, 75.6% to 43.1%, and 71.3% to 38.7%, respectively, was observed. Insufficient contact time between the gas-phase pollutants and the biofilm was the main reason for the low RET,E,B and p−X values. Substrate toxicity, competitive inhibition, and the formation of toxic intermediates by nonspecific enzymes may have also been responsible for the poor results (Bielefeldt & Stensel, 1999). Comparatively, a gradual decrease in the RET,E,B and p−X values of the F&B-BF was observed when the EBRT was reduced from 120 s to 60 s. Specifically, the values decreased from 99.6% to 93.9%, 98.5% to 90.3%, 92.2% to 82.5%, and 89.6% to 81.7%, respectively. Fungal-bacterial consortia were found to exhibit synergistic activity due to the large hyphal surfaces and greater number of mesopores in the fungal strains, which enhance the hydrophobic VOCs capture capacity of the F&B-BF (Cheng et al., 2017; Zhu et al., 2017). It is probable that the adsorption of BTEp-X by fungal mycelium increased the contact time between BTEp-X and their degrading strains to some extent. This helped to maintain a higher removal performance of the F&B-BF compared to the B-BF at a relatively short EBRT. In addition, the BTEp-X degrading bacteria might be uniformly distributed within the biofilms because of “Fungal highways”. This reduced the distance between the bacteria and their substrates, resulting in an increased the contact frequency between the biocatalysts and their hydrophobic substrates (Kohlmeier et al., 2005). Furthermore, fungi might rapidly consume intermediate metabolites that accumulate and inhibit bacterial growth. This resulted in higher REs and MRs for BTEp-X in a shorter EBRT (Cheng et al., 2017). In summary, the optimal EBRT for engineering applications was determined to be 90 s.
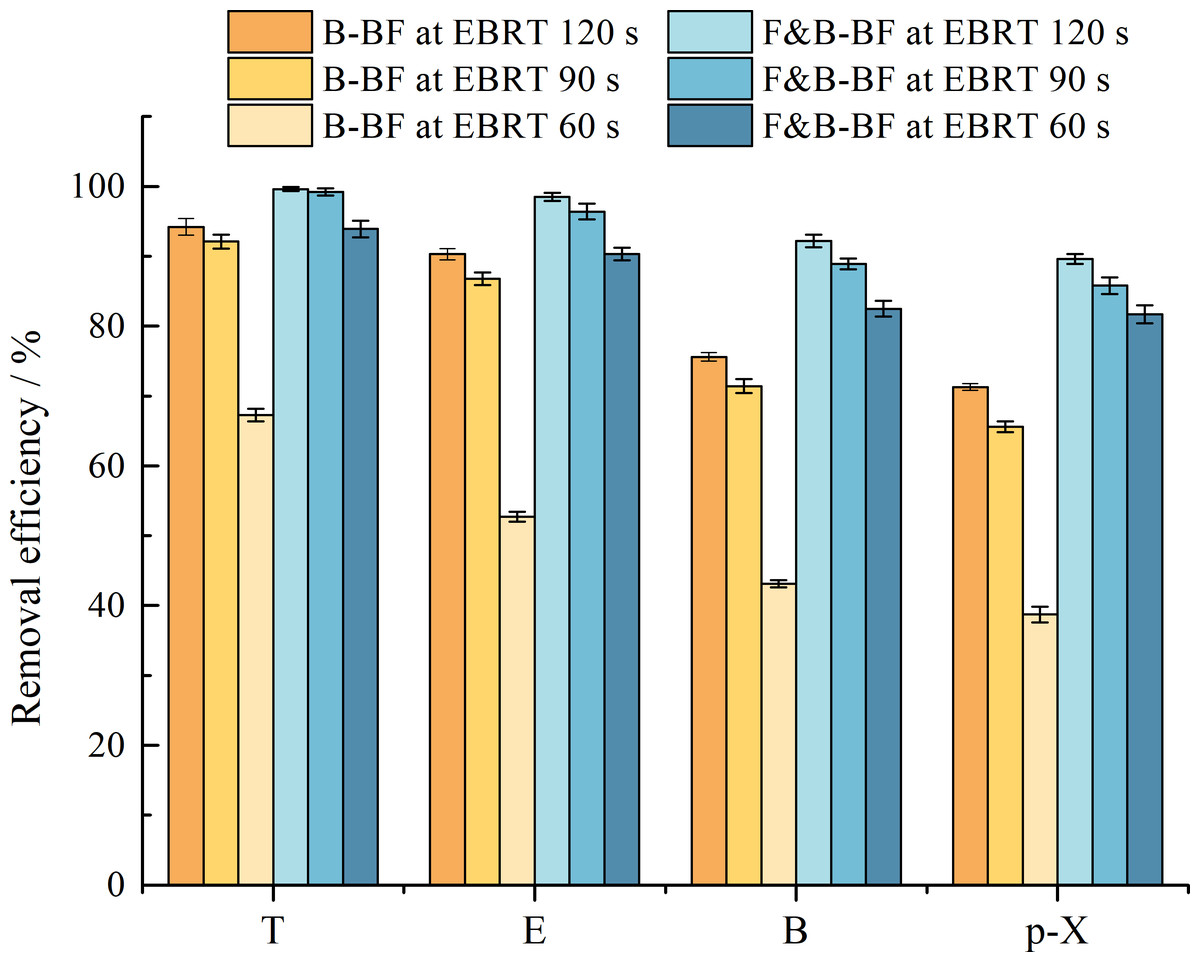
Figure 3: Comparison of the effect of different EBRTs in BTEp-X removal between the B-BF and F&B-BF.
Long-term stability comparison
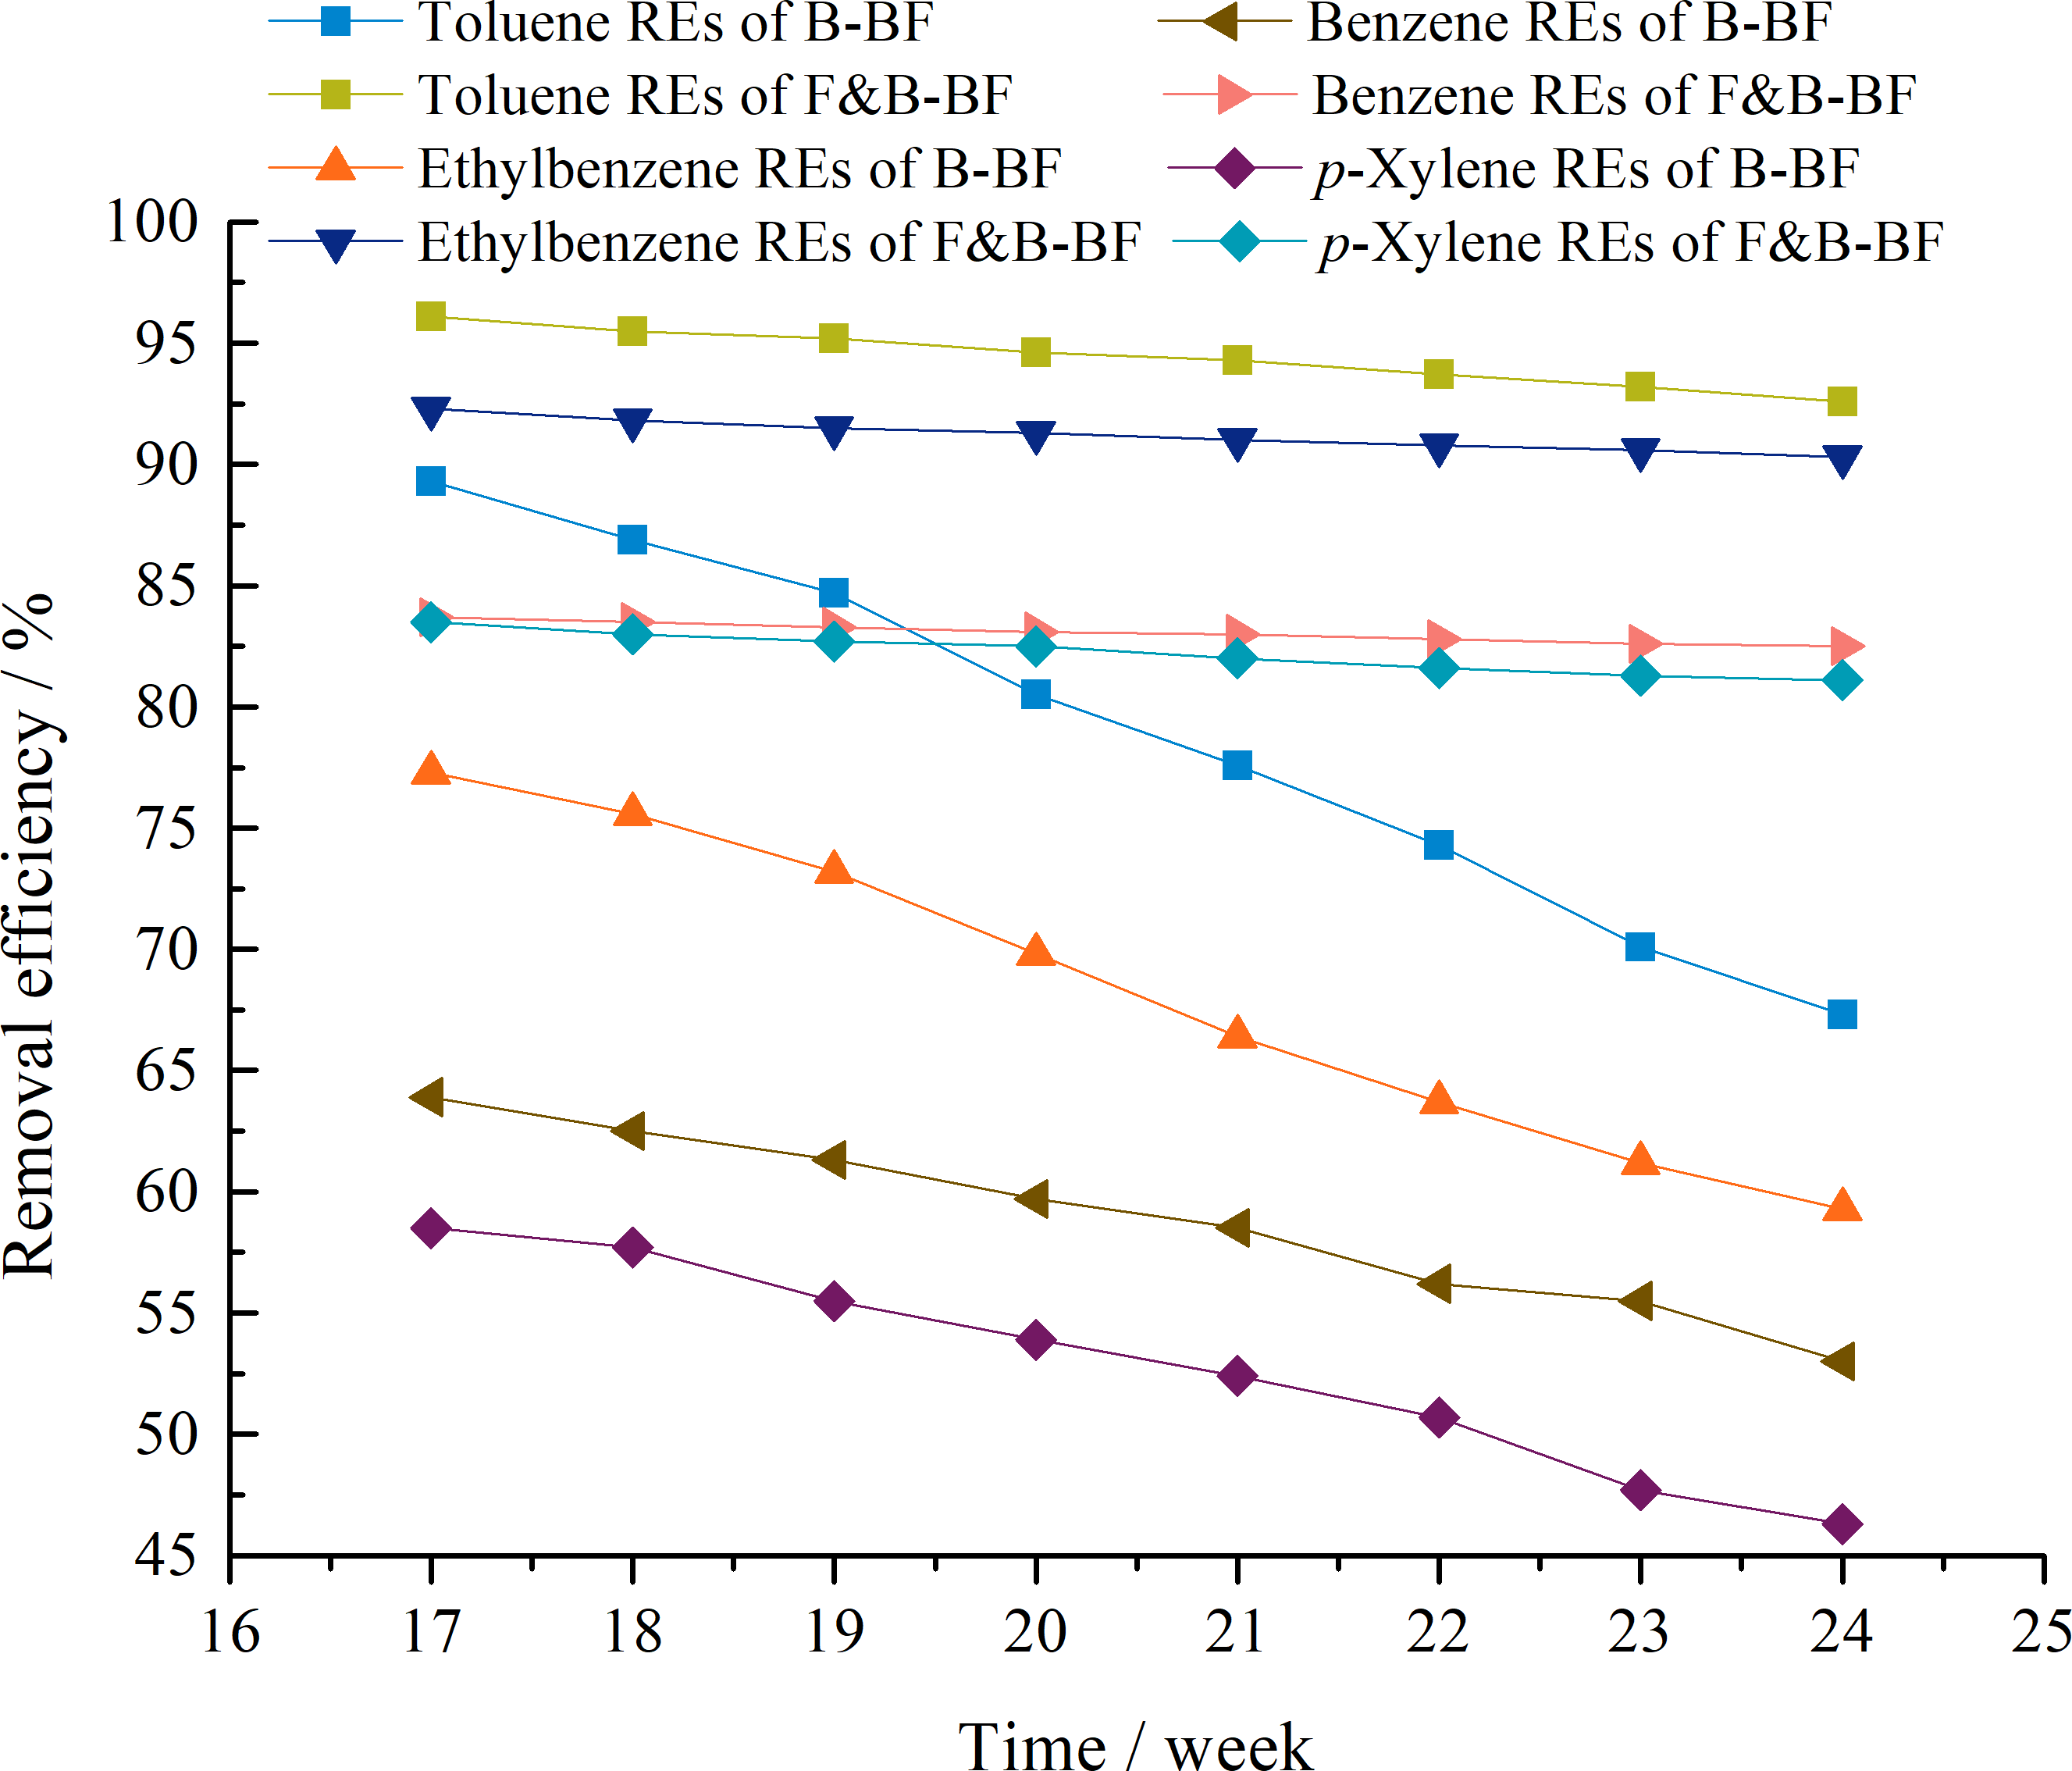
The long-term stability is very important for practical application of bioreactors. Figure 4 displays the removal performance of the B-BF and F&B-BF during the period from Day 113 to 168. The F&B-BF proved to be more stable than the B-BF when run at the same inlet BTEp-X concentrations with an EBRT of 90 s. During Days 113–168 of the F&B-BF, the RET,E values exceeded 90%, and the REB,p−X values were above 80%, whereas they were approximately 59–67% and 46–53% for the B-BF. These results suggest that the long-term operation of F&B-BF in BTEp-X removal was more stable than that of the B-BF.
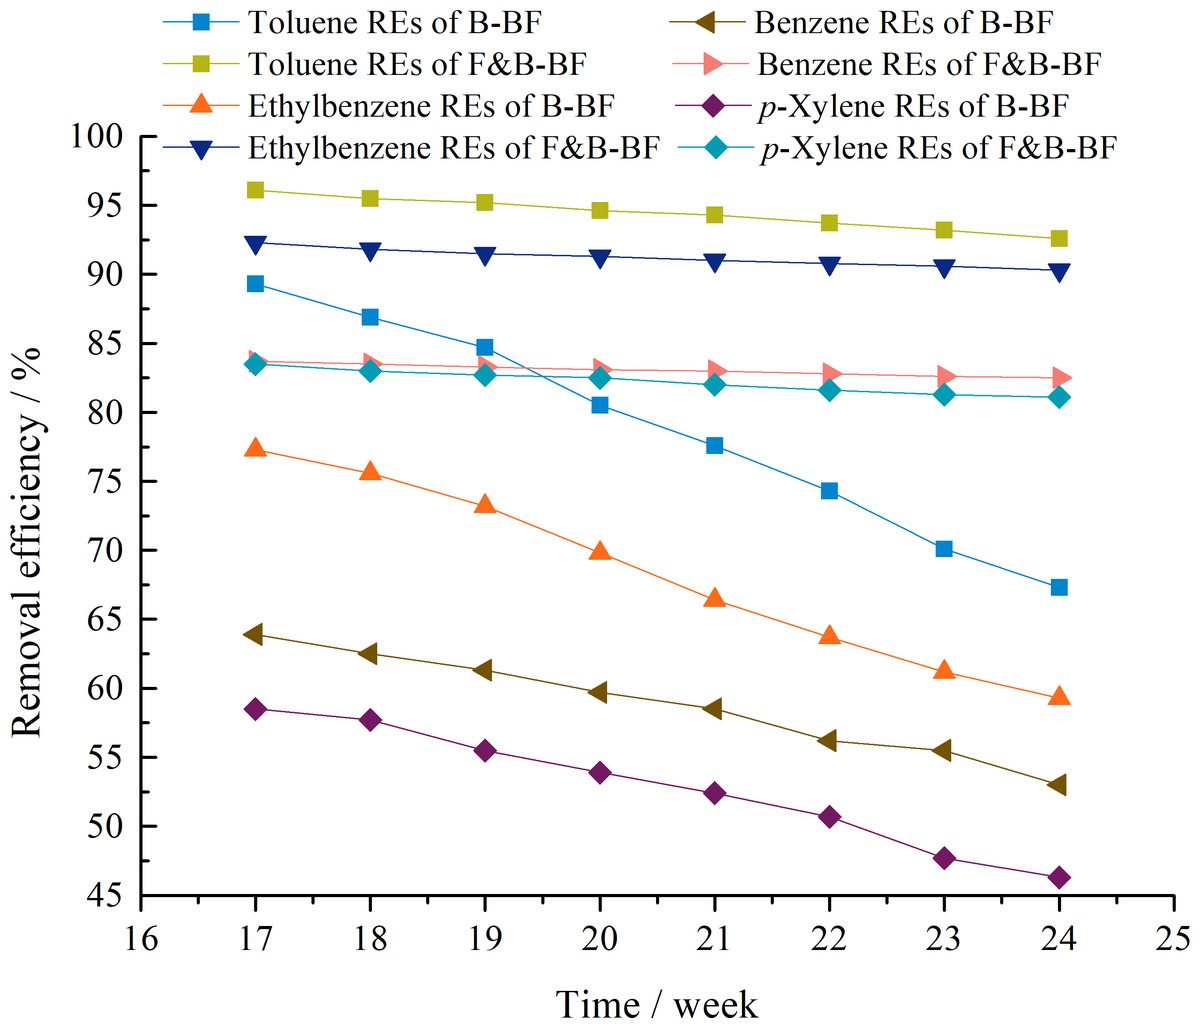
Figure 4: Comparison of the stability of long-term operation in BTEp-X removal between the B-BF and F&B-BF.
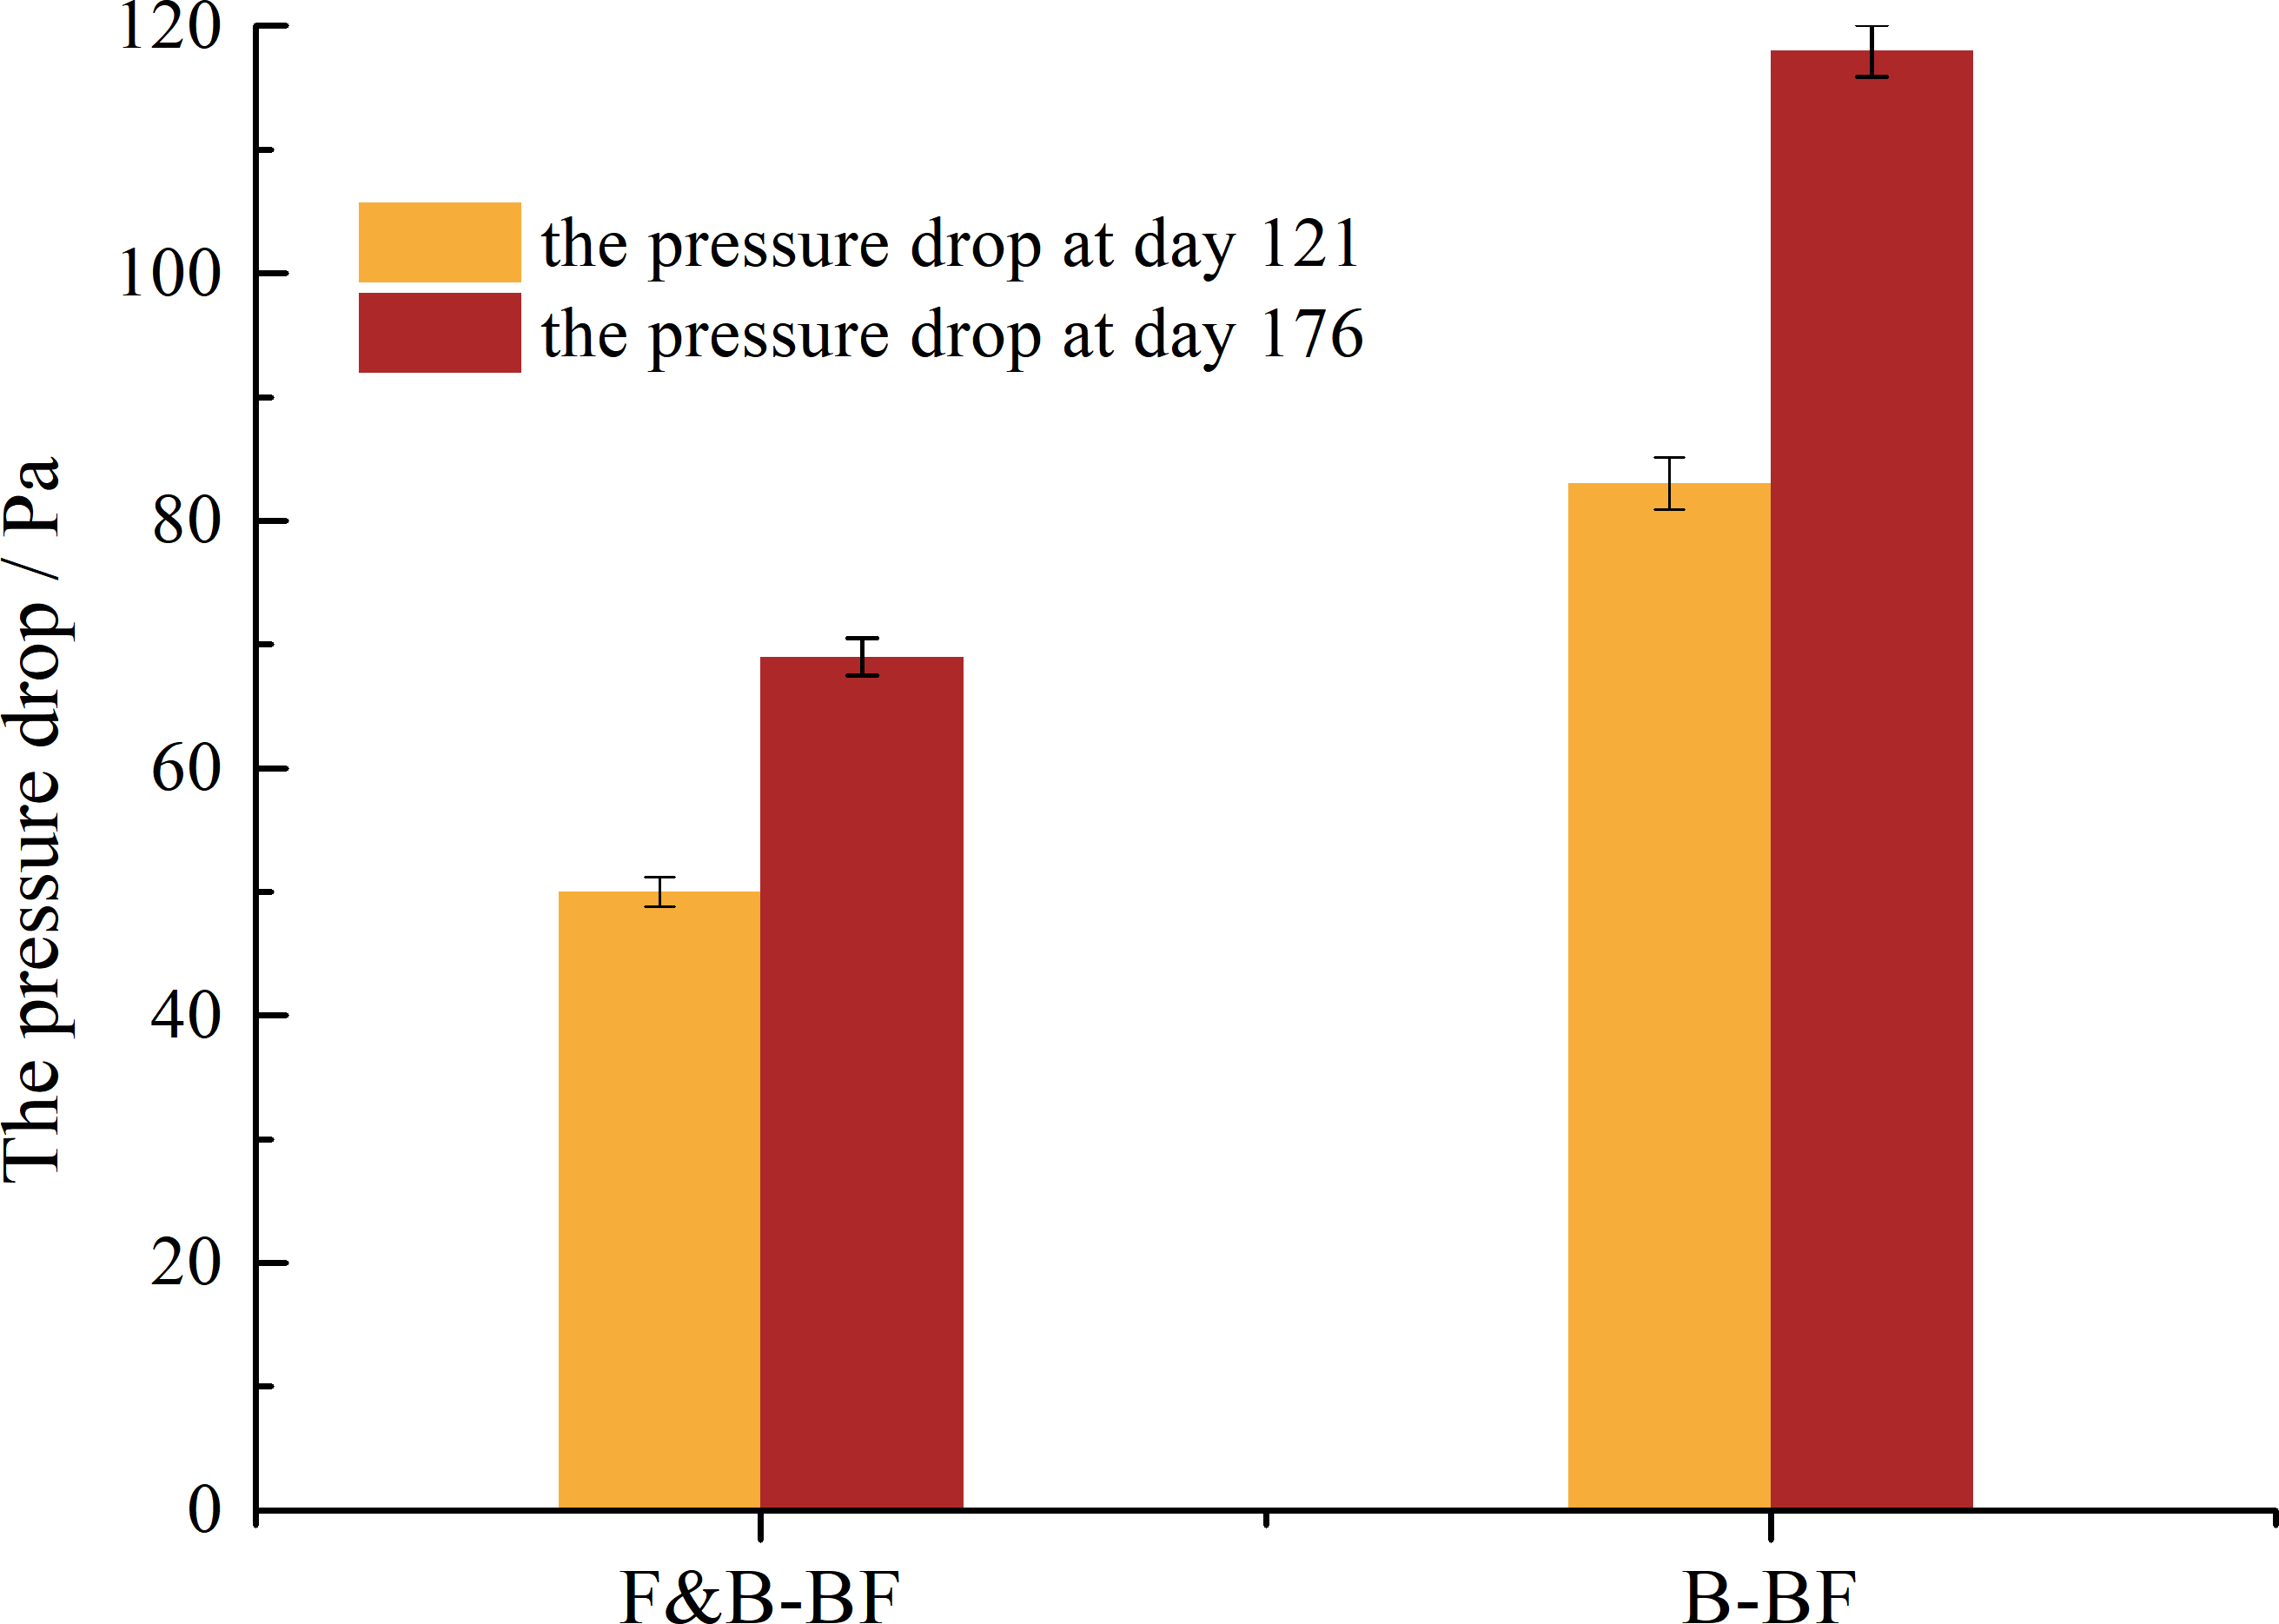
In general, the pressure drop is an important parameter of long-term stability that can be used to indirectly characterise biomass formation, packing cracking and gas flow channelling in biofiltration systems. As shown in Fig. 5, the pressure drop of the F&B-BF increased slowly from 50 Pa to 69 Pa, while for the B-BF, Δp changed more significantly from 83 Pa to 118 Pa. This indicates that less carbon was converted into biofilm in the F&B-BF and more carbon was oxidized to CO2 in BTEp-X removal than in the B-BF. Another reason for this is the lower growth rate of fungi (Cheng et al., 2017). Therefore, it can be inferred that the F&B-BF runs more stably and longer in BTEp-X removal than the B-BF.
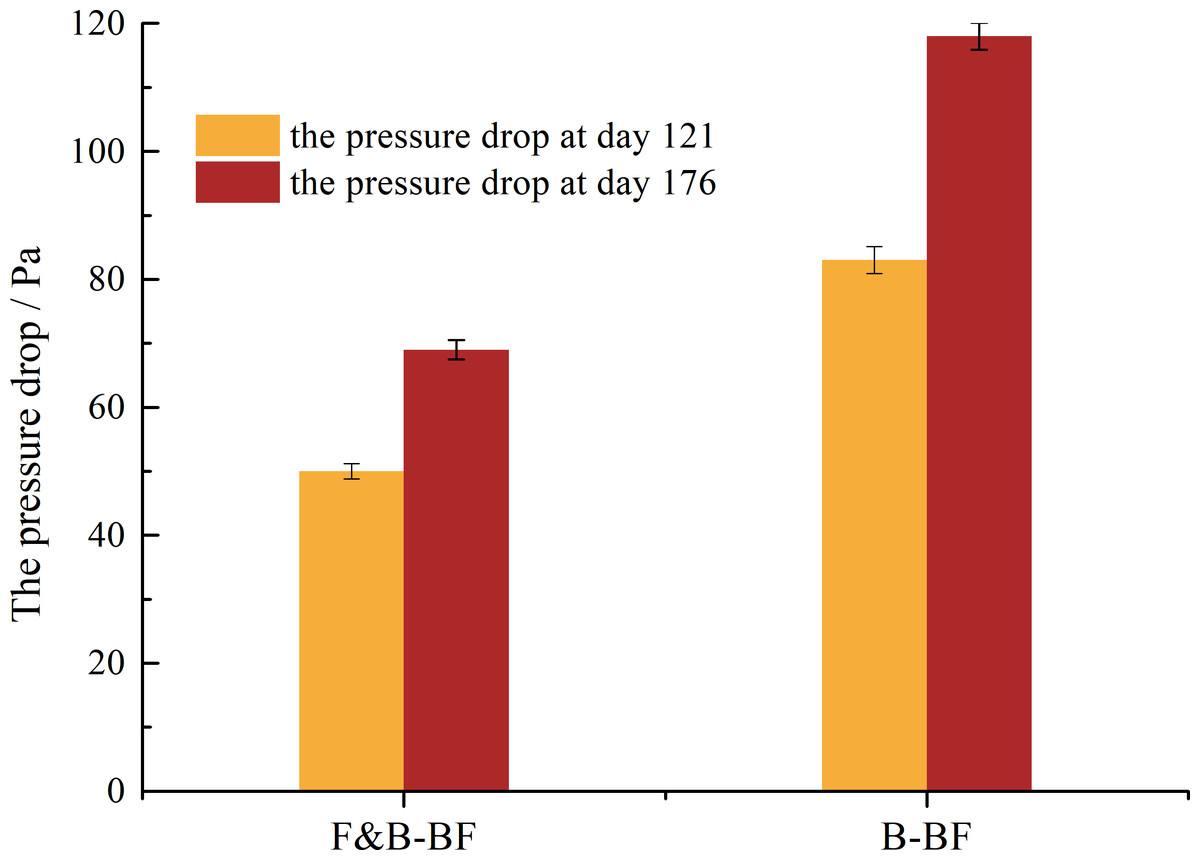
Figure 5: Comparison of the change of Δp in long-term operation between the B-BF and F&B-BF.
Recovery period comparison
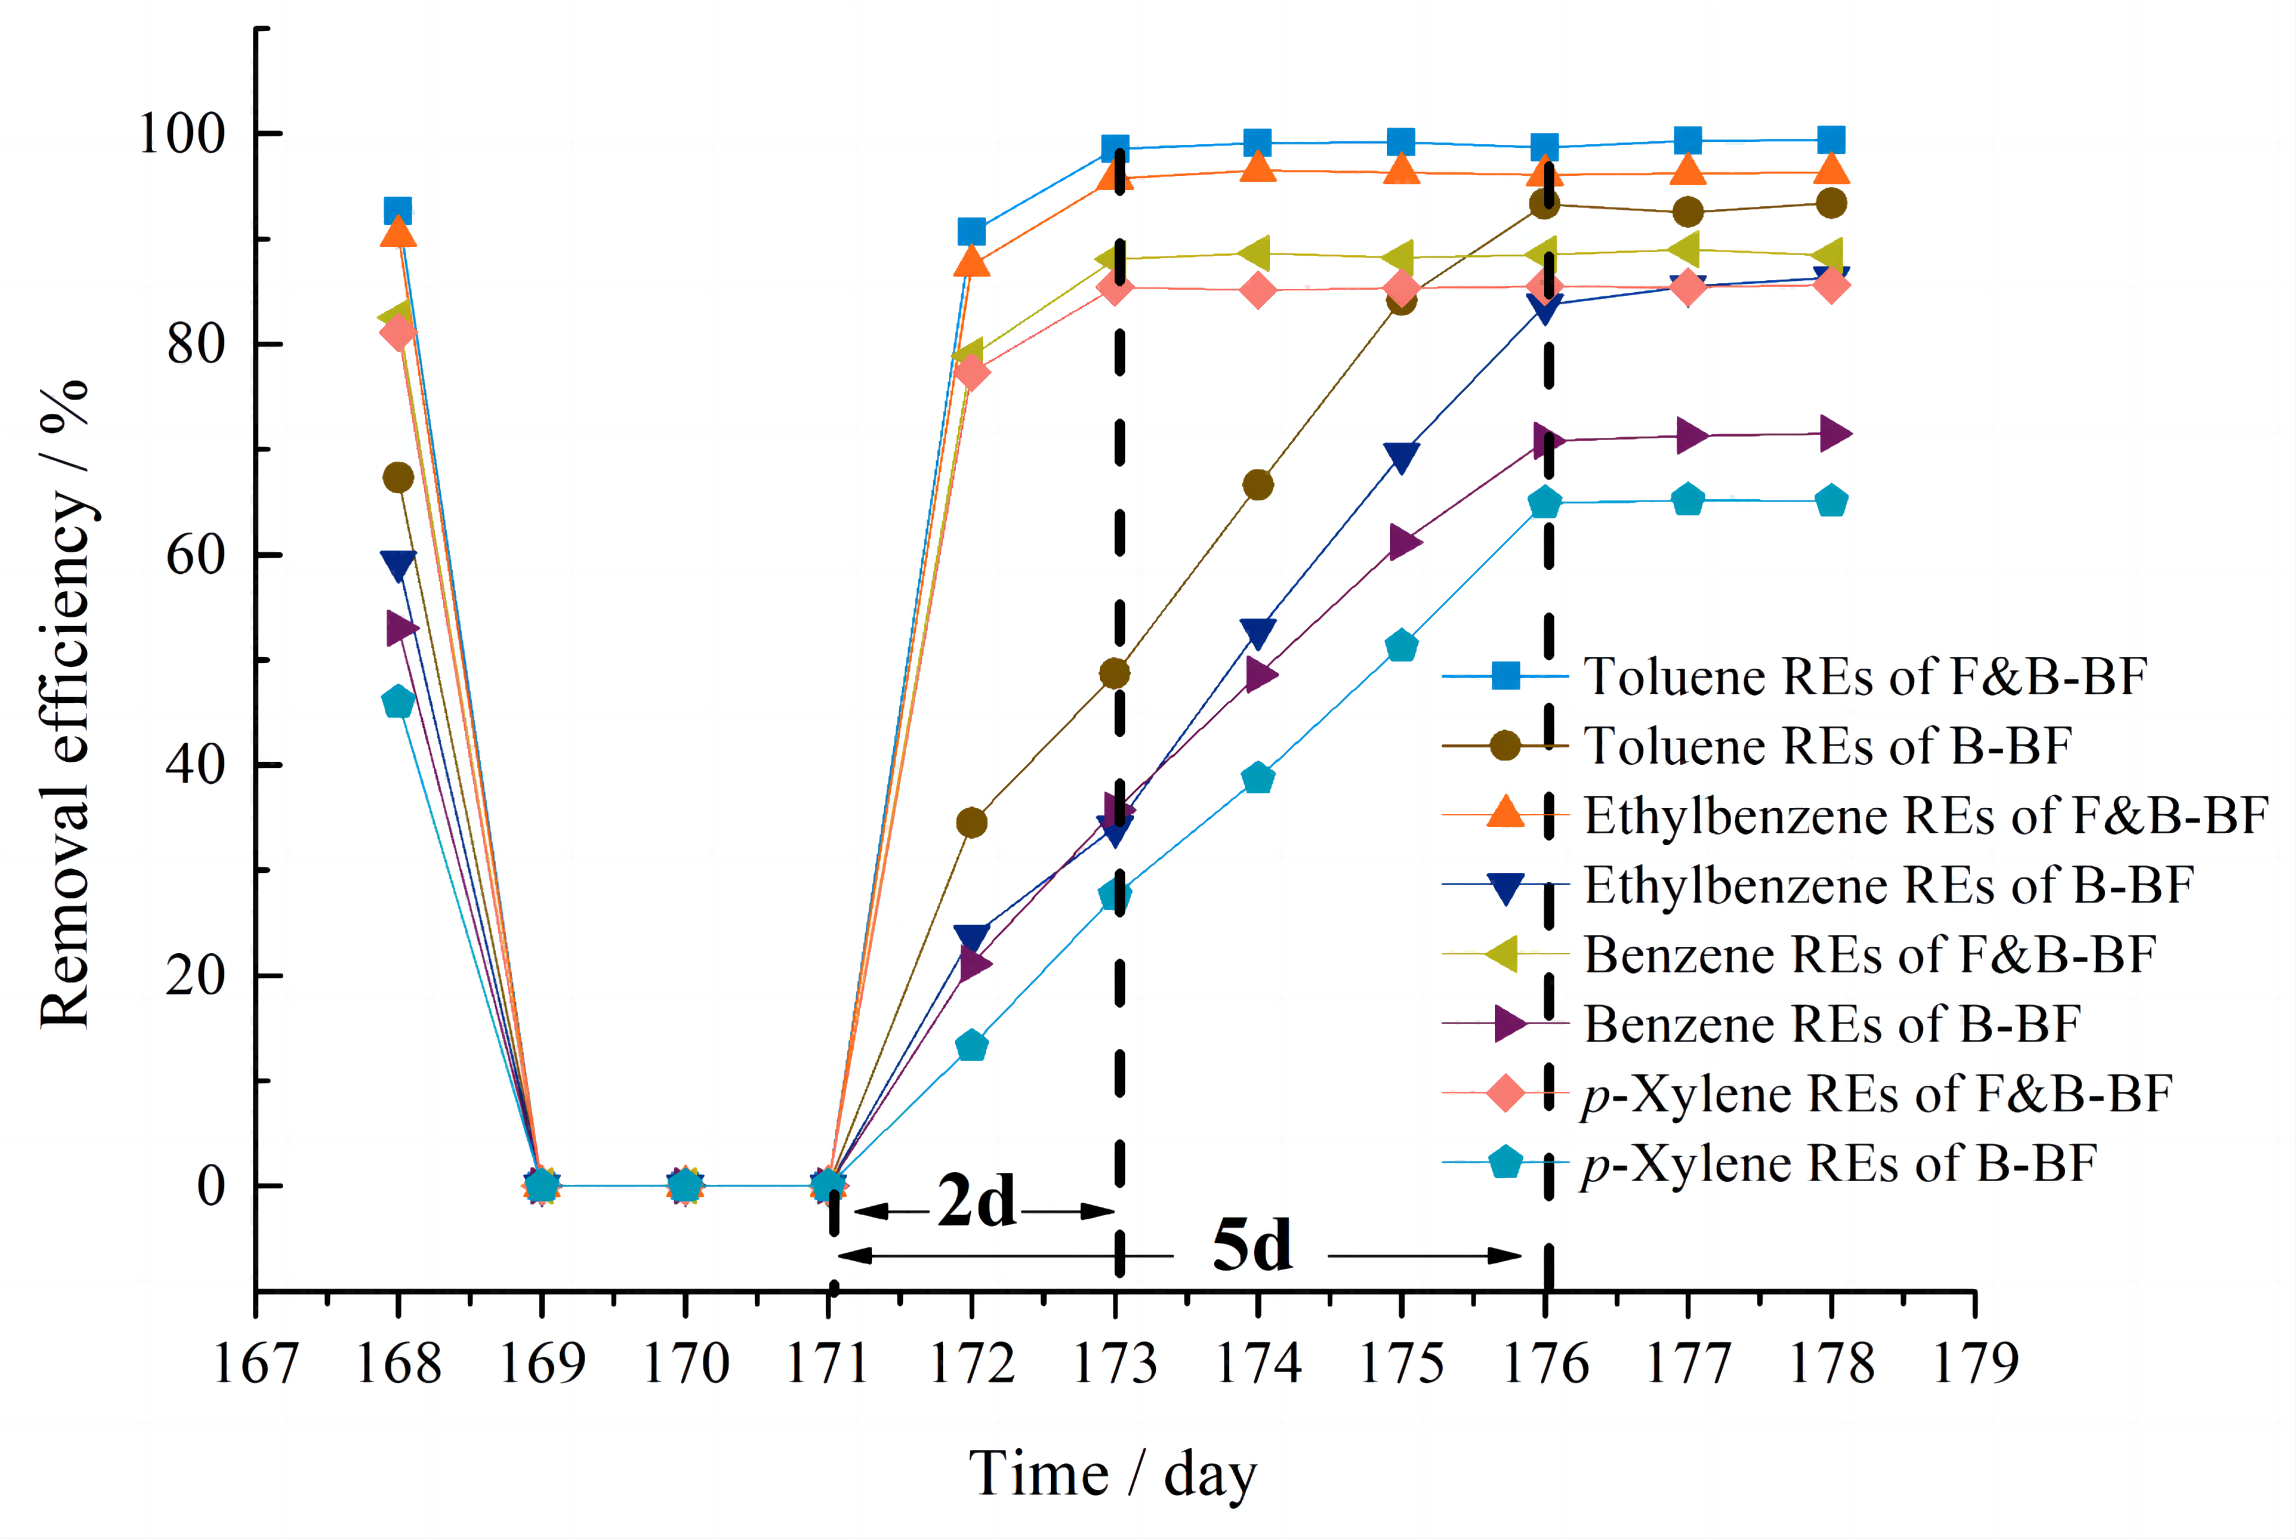
In real-world scenarios, biofiltration systems often experience periods of starvation during holidays, festivals, unexpected accidents, and maintenance closures. The ability of biofiltration systems to recover quickly is crucial for their employment in industrial settings. To compare the robustness of the systems, the effect of pollutant starvation was investigated on Day 169. After 3 days of starvation, the inlet BTEp-X concentrations were restored to their previous values. For the F&B-BF, the REs were 98.5% for T, 95.7% for E, 88.1% for B and 85.4% for p-X after 2 days, which then recovered to normal levels. However, the B-BF took 5 days to reach the values of RET-93.3%, REE-83.7%, REB-70.8% and REp-X-64.9%, respectively (Fig. 6). The results indicate that the F&B-BF can restore the removal performance more quickly than the B-BF after a period of interruption of gaseous BTEp-X supply. This is attributed to the fact that the fungi release the adsorbed BTEp-X and continuously supply carbon resources for their degrading strains in the F&B-BF (Zhai, Jiang & Long, 2020). During a supply interruption of gaseous BTEp-X, the F&B-BF can maintain a certain number and activity of the BTEp-X degrading strains. However, when the supply of BTEp-X was interrupted for the B-BF, the microorganisms had to undergo endogenous respiration due to insufficient carbon sources. The prolonged interruption time resulted in a significant decrease in the absolute number of the BTEp-X degrading bacteria, from 3.81 × 10⁷ copies µL−1 to 6.29 × 10⁵ copies µL−1. As a result, the removal performance of the B-BF in BTEp-X removal recovered more slowly than the F&B-BF. Additionally, the 3-day interruption resulted in a slight decrease in the pressure drop of the B-BF and the F&B-BF. This suggests that the starvation protocol could be an alternative measure for controlling the pressure drop and maintaining long-term stability.
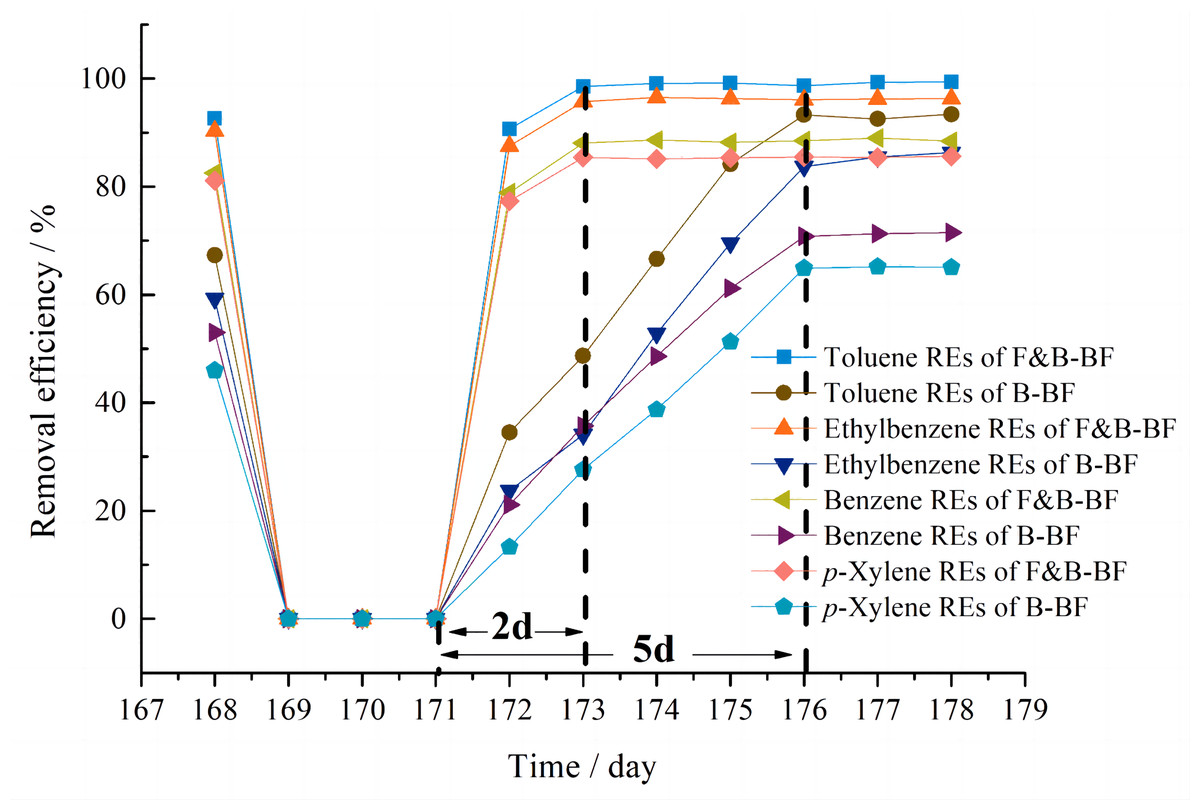
Figure 6: Comparison of the performance recovery cycle in BTEp-X removal between the B-BF and F&B-BF.
Microbial community diversity comparison
Biofilms, consisting of bacteria, fungi, actinomycetes, and algae, play a crucial role in breaking down pollutants in biofiltration systems. Typically, a B-BF contains 106–1010 cfu of bacteria and actinomycetes, and 103–106 cfu of fungi per gram of bed (Ottengraf, 1987). Degrading microbes usually account for 1–15% of the total microbial population in a B-BF (Pedersen et al., 1997; Delhomenie et al., 2001). The total bacterial and fungal counts in the samples were analyzed using qRT-PCR. The logarithmic value of the gene copy number of the samples collected at different steady-state stages (Days 112, 140 and 168) from the B-BF and F&B-BF was compared. The average copy number of 16S rRNA genes (bacteria) was 4.16 × 10⁷ copies µL−1 vs. 3.87 × 10⁶ copies µL−1, and the 18S rRNA genes (fungi) was 3.72 × 10⁵ copies µL−1 vs. 7.13 × 10⁶ copies µL−1 for the B-BF and F&B-BF, respectively. Thus, F/B ranged from 0.0089 to 1.84. These data suggest that the BTEp-X removal performance increased with the F/B in the biofilms.
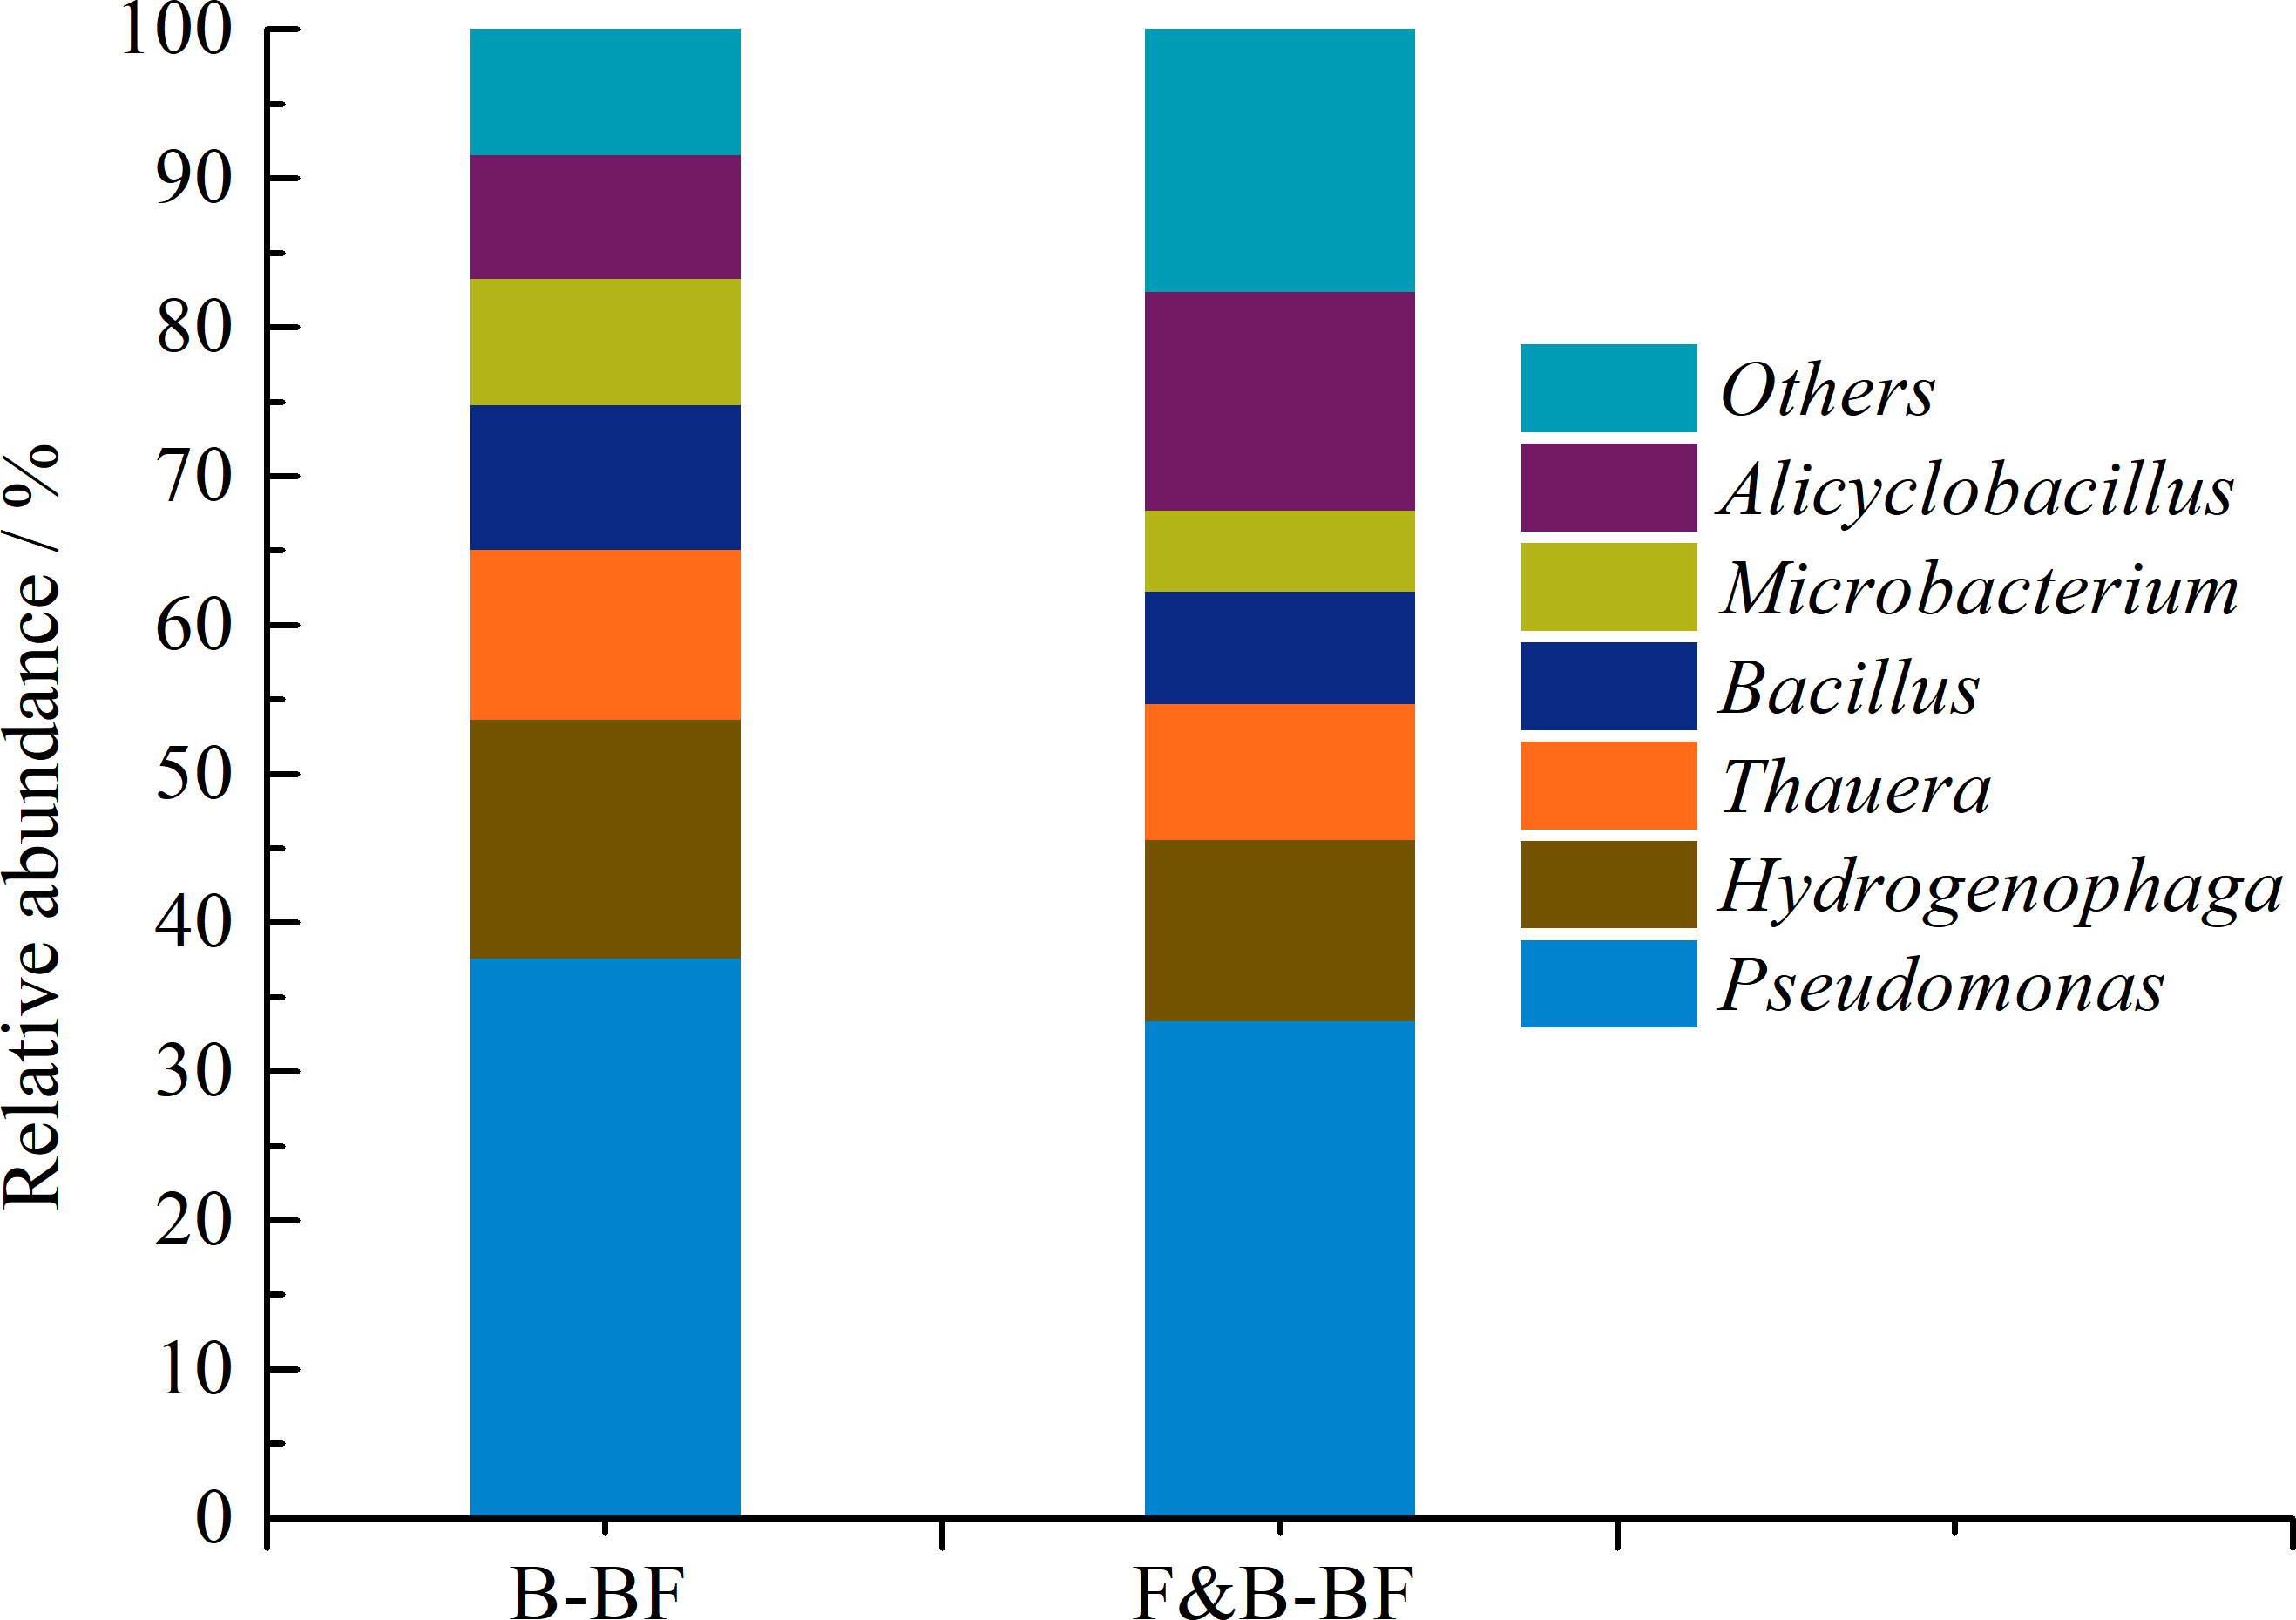
The structure of the microbial community, as well as the number of microbes, can significantly affect the operational performance of biofiltration systems (Guo et al., 2015). The characterisation of microbial diversity can provide insights into how the coexistence of fungi and bacteria enhances BTEp-X removal, aiding in the optimization of the design and operation of biofiltration techniques. To identify and compare the bacteria and fungi present in the biofilm on the surface of packing materials, Illumina high-throughput sequencing was utilized to investigate the microbial community diversity. As shown in Fig. 7, the major bacterial genus in the B-BF was Pseudomonas (37.6%), followed by Hydrogenophaga (16.1%), Thauera (11.4%), Bacillus (9.7%), Microbacterium (8.5%), and Alicyclobacillus (8.3%). Similarly, the bacterial community in the F&B-BF was mainly composed of Pseudomonas (33.4%), followed by Hydrogenophaga (12.2%), Thauera (9.1%), Bacillus (7.6%), Microbacterium (5.4%), and Alicyclobacillus (14.7%). There are differences in the relative abundance of bacterial genera between the B-BF and F&B-BF. The ability of the genus Pseudomonas to degrade BTEX has been reported (Attaway & Schmidt, 2002; Haque, De Visscher & Sen, 2012). Fahy et al. (2008) reported that strains of Hydrogenophaga and Pseudomonas can metabolize B, T, and p-X. Lin, Van Verseveld & Röling (2002) reported that members of the Thauera cluster can degrade BTEX in a denitrifying environment. Bacillus sphaericus can degrade BTEX at a faster rate and can be used to treat highly polluted air streams in biofilters (Kumar & Chandrajit, 2011). In addition, the bacterium Microbacterium has been reported to be nonpathogenic, rhizosphere-based, and capable of degrading BTEX and naphthalene, with a high level of tolerance for several hydrocarbons (Wongbunmak et al., 2017). Furthermore, the genus Alicyclobacillus has the ability to degrade phenol (Aston et al., 2016), which is a significant degradation byproduct of T, B and E (Cheng et al., 2016b; Olsen, Kukor & Kaphammer, 1994). The relative abundance of the genus Alicyclobacillus increased from 8.3% in the B-BF to 14.7% in the F&B-BF. This suggests that the intermediates of BTEp-X were more easily degraded furtherly by the F&B-BF than by the B-BF, which may explain why the BTEp-X MRs of the F&B-BF were significantly higher than those of the B-BF.
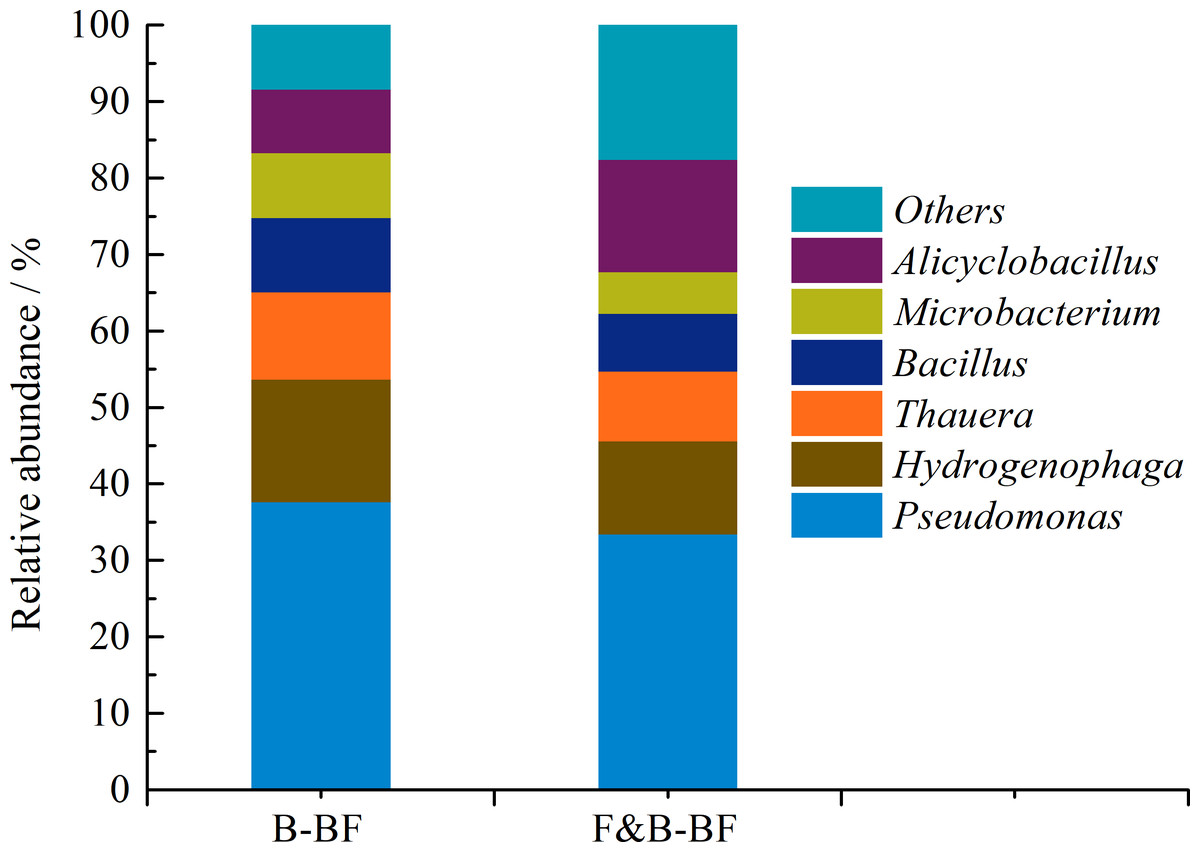
Figure 7: Comparison of the bacterial community structure and relative abundance at the genus level between the B-BF and F&B-BF.
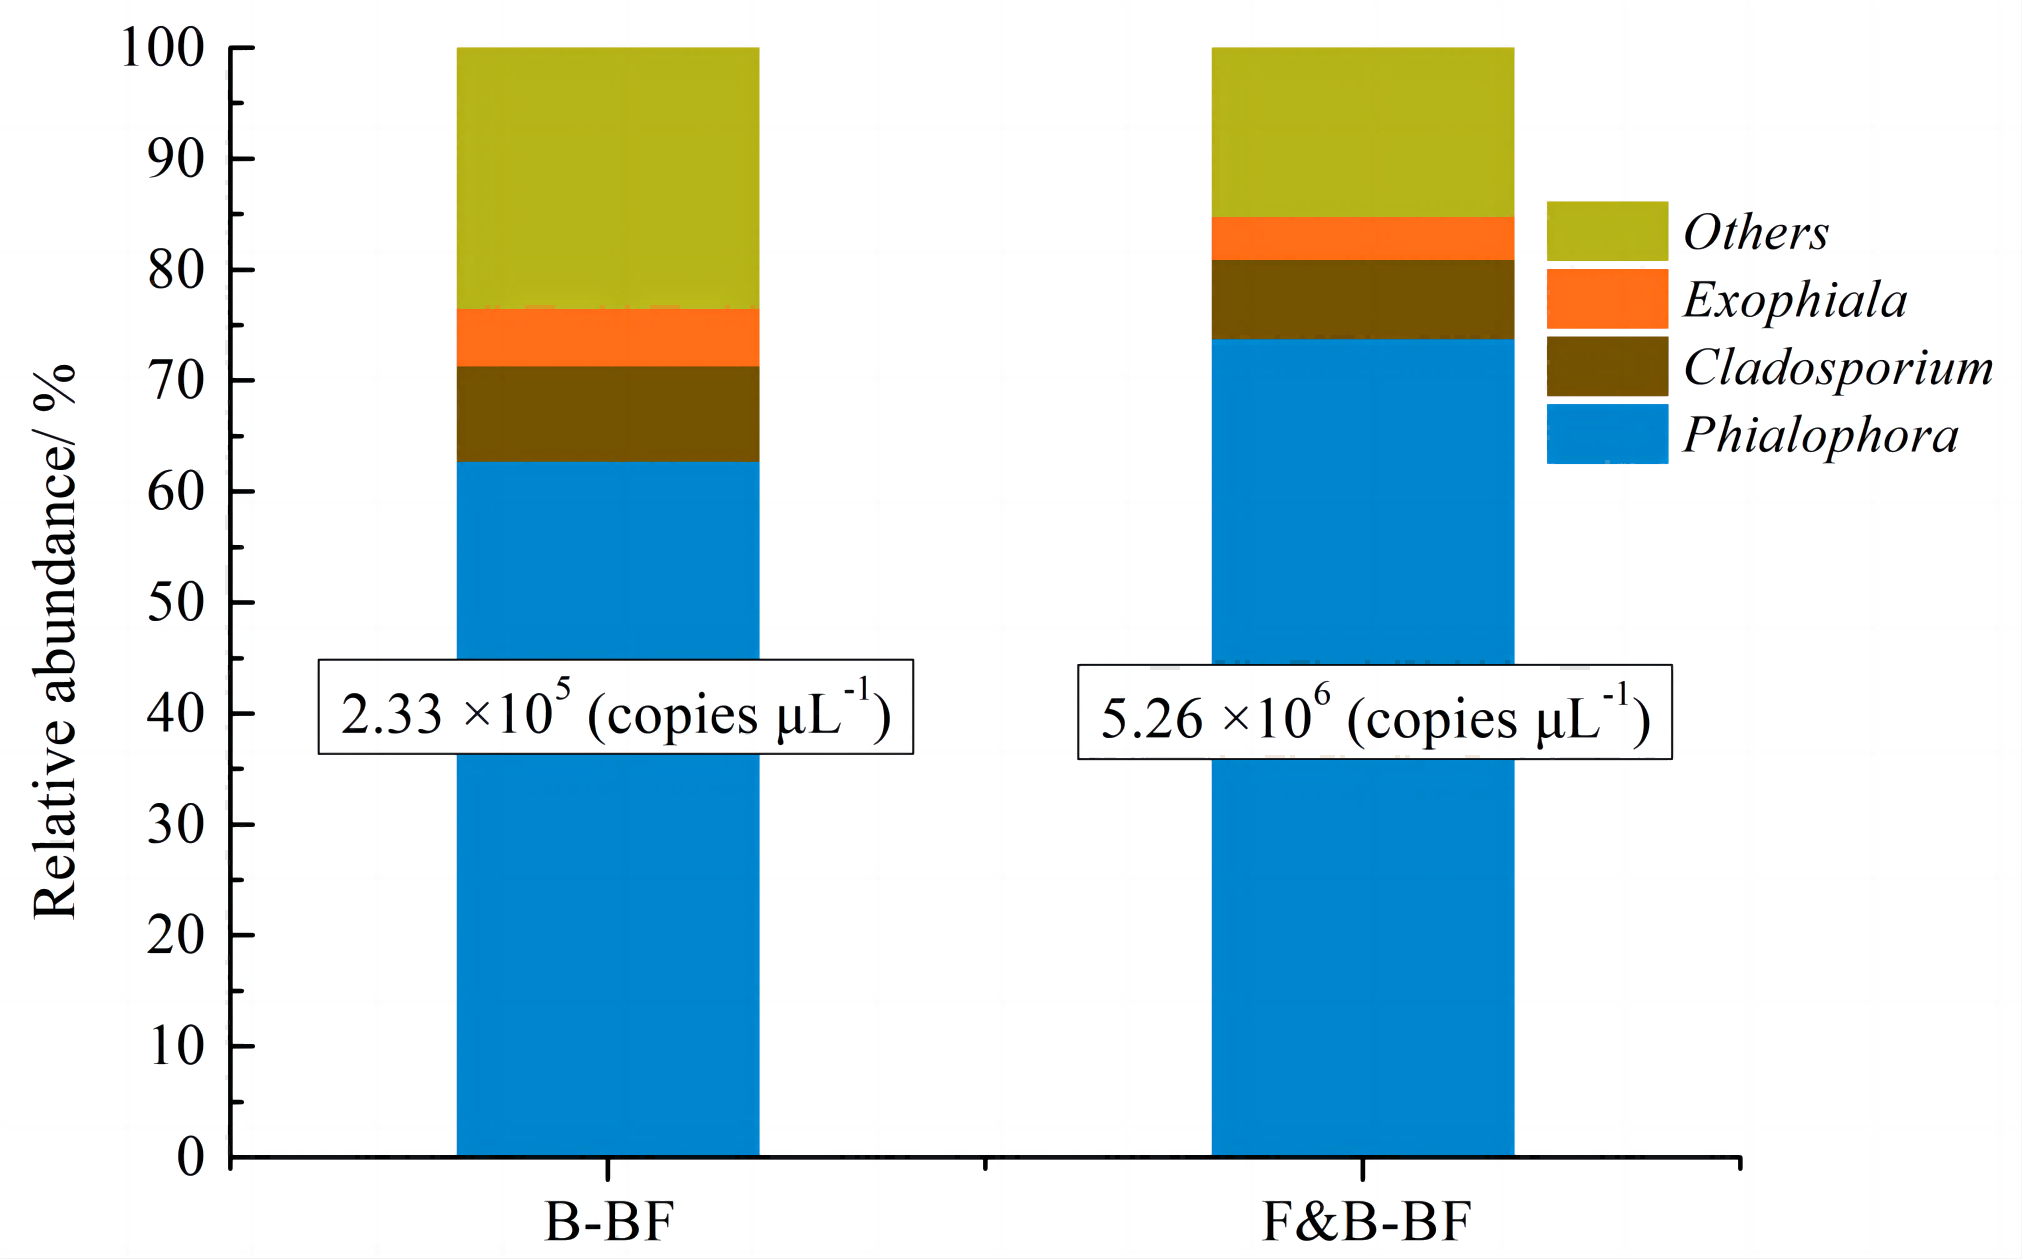
The results of high-throughput sequencing indicate that the fungal community is primarily composed of Phialophora, Cladosporium and Exophiala. Among these, Phialophora is the dominant fungus in the B-BF and F&B-BFs. As shown in Fig. 8, the relative abundance of Phialophora increased from 62.7% in the B-BF to 73.8% in the F&B-BF, and the absolute amount increased significantly from 2.33 × 10⁵ copies µL−1 (B-BF) to 5.26 × 10⁶ copies µL−1 (F&B-BF). The genus Phialophora belongs to the phylum Ascomycota, which is one of the few groups of fungi capable of transforming a wide range of organic pollutants (Harms, Schlosser & Wick, 2011). It is suggested that the genus Phialophora possesses a high capacity to directly transform BTEp-X from the gas phase to the biofilm. Additionally, it has been reported that this genus is capable of degrading T and other volatile aromatic compounds (Isola et al., 2013). It has a combined ability to adsorb and degrade BTEp-X. Cladosporium and Exophiala can also readily utilize B, E, T, and styrene as sole carbon and energy sources (Qi, Moe & Kinney, 2002). The study found a positive correlation between the removal performance of BTEp-X and the fungal quantity of biofilms in biofilters.
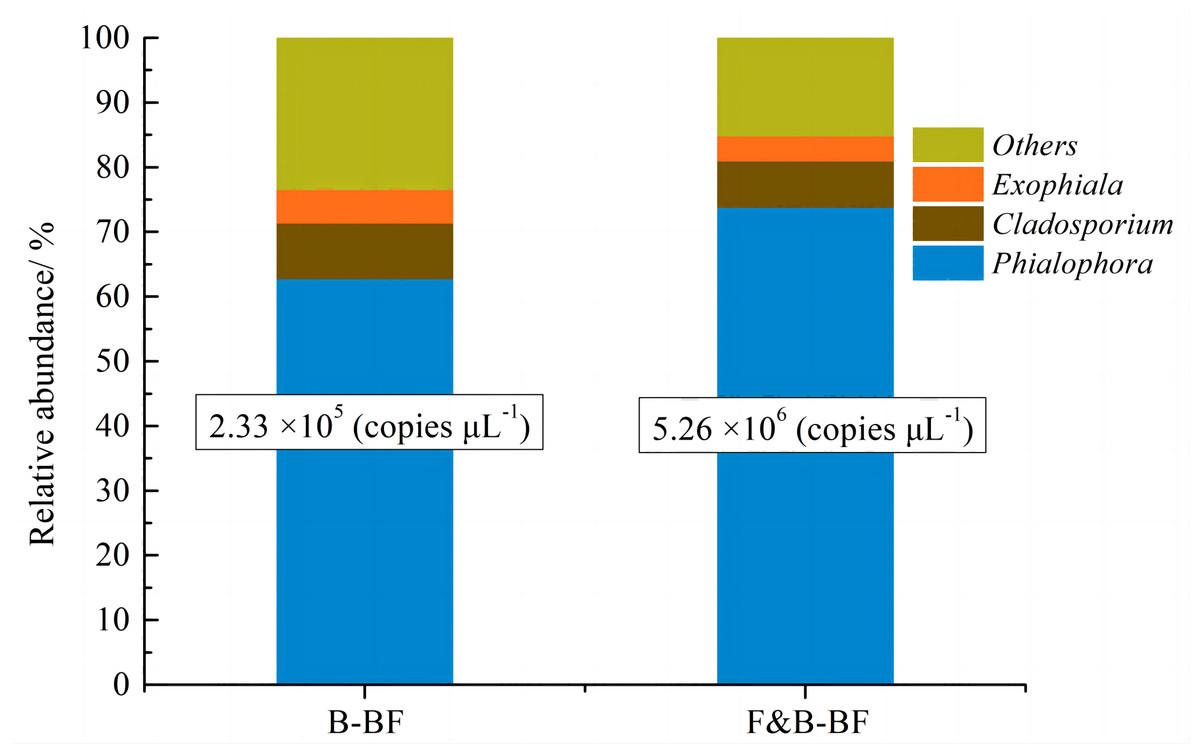
Figure 8: Comparison of the fungal community structure and relative abundance at the genus level between the B-BF and F&B-BF.
Conclusion
The F&B-BF outperformed the B-BF in terms of BTEp-X removal. The study also yielded the following specific observations in addition to the aforementioned general conclusion.
1. Under experimental conditions, the F&B-BF achieved RET,E,B and p-X values of 98.7%, 96.3%, 87.6% and 85.3%, respectively, at an EBRT of 90 s.
2. In the F&B-BF and the B-BF, T is the most biodegradable pollutant, followed by E, B and then p-X.
3. By comparison with the B-BF, the F&B-BF performed more efficiently in BTEp-X removal due to the fungal adsorption, the higher hydrophobicity and negative potential of the biofilms
4. The F&B-BF recovered faster, lasted longer, and operated with greater reliability than the B-BF in BTEp-X removal.
5. The fungal genus Phialophora contributed significantly to the mass transfer from the gas phase to the biofilm and the degradation of the BTEp-X. Meanwhile, the bacterial genus Pseudomonas and Alicyclobacillus were primarily responsible for the degradation of BTEp-X and its intermediate metabolites, such as phenol.