
Interspecific variation and phylogenetic relationship between mangrove and non-mangrove species of a same family (Meliaceae)—insights from comparative analysis of complete chloroplast genome
- Published
- Accepted
- Received
- Academic Editor
- Zarrin Basharat
- Subject Areas
- Evolutionary Studies, Genetics, Molecular Biology, Plant Science
- Keywords
- Phylogenetics, Mangroves, Coastal ecosystem, Chloroplast genome, Population genetics, Adaptation, Stress response
- Copyright
- © 2023 Tan et al.
- Licence
- This is an open access article distributed under the terms of the Creative Commons Attribution License, which permits unrestricted use, distribution, reproduction and adaptation in any medium and for any purpose provided that it is properly attributed. For attribution, the original author(s), title, publication source (PeerJ) and either DOI or URL of the article must be cited.
- Cite this article
- 2023. Interspecific variation and phylogenetic relationship between mangrove and non-mangrove species of a same family (Meliaceae)—insights from comparative analysis of complete chloroplast genome. PeerJ 11:e15527 https://doi.org/10.7717/peerj.15527
Abstract
The mahogany family, Meliaceae, contains 58 genera with only one mangrove genus: Xylocarpus. Two of the three species of the genus Xylocarpus are true mangroves (X. granatum and X. moluccensis), and one is a non-mangrove (X. rumphii). In order to resolve the phylogenetic relationship between the mangrove and non-mangrove species, we sequenced chloroplast genomes of these Xylocarpus species along with two non-mangrove species of the Meliaceae family (Carapa guianensis and Swietenia macrophylla) and compared the genome features and variations across the five species.
The five Meliaceae species shared 130 genes (85 protein-coding genes, 37 tRNA, and eight rRNA) with identical direction and order, with a few variations in genes and intergenic spacers. The repetitive sequences identified in the rpl22 gene region only occurred in Xylocarpus, while the repetitive sequences in accD were found in X. moluccensis and X. rumphii. The TrnH-GUG and rpl32 gene regions and four non-coding gene regions showed high variabilities between X. granatum and the two non-mangrove species (S. macrophylla and C. guianensis). In addition, among the Xylocarpus species, only two genes (accD and clpP) showed positive selection. Carapa guianensis and S. macrophylla owned unique RNA editing sites. The above genes played an important role in acclimation to different stress factors like heat, low temperature, high UV light, and high salinity. Phylogenetic analysis with 22 species in the order Sapindales supported previous studies, which revealed that the non-mangrove species X. rumphii is closer to X. moluccensis than X. granatum. Overall, our results provided important insights into the variation of genetic structure and adaptation mechanism at interspecific (three Xylocarpus species) and intergeneric (mangrove and non-mangrove genera) levels.
Introduction
Mangrove forests consist of an important group of woody plants occupying coastal zone habitats (Tomlinson, 2016). They are vital intertidal wetland ecosystems and directly impact the welfare of coastal communities in the tropics and subtropics (Ge & Sun, 1999). Their occupation of the tidal zone is manifested in a range of specialized attributes, such as viviparous embryos, tolerance for salt fluctuations and uncommon root systems (Tomlinson, 2016). Understanding their evolutionary history, molecular basis of the adaptation mechanisms across the coastal zone habitats, and genetic divergence from the non-mangrove species are some of the central themes of mangrove species research. The chloroplast DNA (cpDNA hereafter) is heavily used for evolutionary studies and phylogenetic analysis (e.g., Asaf et al., 2021). The cpDNA offers a highly conserved sequence due to uniparental inheritance, and haploid and non-recombinant nature (Daniell et al., 2016). Due to these properties, it has now become a powerful tool in accurate reconstruction of phylogenetic relationships (Li et al., 2019; Muellner et al., 2003).
In this study, we focused on the genus Xylocarpus, which has three species with accepted names (the name currently accepted as the one which should be used in preference to refer to a species): X. granatum J.Koenig, X. moluccensis (Lam.) M.Roem., and X. rumphii (Kostel.) Mabb. (https://powo.science.kew.org/taxon/urn:lsid:ipni.org:names:26860-1#children). Among these three species, X. granatum (also known as ‘cedar mangrove’, ‘cannonball tree’ or ‘puzzle nut tree’) is the most widespread species in East Africa, tropical Australia, Southeast Asia, and the Pacific Islands (Waratchareeyakul et al., 2017). This evergreen species is usually distributed in mangrove fringe or the nearby sandy shores, and can grow up to 15 m in height (Tomlinson, 2016). The second species, X. moluccensis (also known as ‘apple mangrove’) is distributed from the East-Africa to Philippines, Australia and the Pacific Islands (Haron, 2010). This small tree of 3–10 m height usually grows on sandy shores. The third species, X. rumphii, is a rare species of 4–15 m in height and its distribution is restricted to tropical Asia, Africa and Australia (Waratchareeyakul et al., 2017). This species does not grow in mangrove ecosystem, rather occurs above high-water level on cliffs, rocks, and sandy upland areas (Waratchareeyakul et al., 2017). Among the three species, X. granatum and X. moluccensis are considered as true mangrove species based on their occurrence only in mangrove environment (i.e., in tidal swamps), and possession of specialized morphological features (like aerial roots and vivipary of the embryo) and physiological mechanism for salt exclusion and/or excretion (Tomlinson, 2016).
The genus Xylocarpus is one of the 58 genera of the mahogany family, Meliaceae, and is the only genus that contains two mangrove species (Muellner-Riehl & Rojas-Andrés, 2022). Previous molecular marker assisted analysis based on three plastid DNA sequences (trnL-F, rbcL, and atpB) revealed that four non-mangrove species of the family Meliaceae, namely Carapa guianensis, Swietenia macrophylla, Swietenia mahagoni, and Khaya nasica, formed a cluster in a clade with Xylocarpus (Muellner-Riehl et al., 2016). However, the study only considered one Xylocarpus species (X. moluccensis). The phylogenetic pattern became different when all three Xylocarpus species and five other cpDNA loci (psbA-trnH, trnC-ycf6, trnH-trnK, trnS-trnG and trnT-trnL) were considered in another study (Guo et al., 2018). Overall, the phylogenetic relationship between the mangrove and non-mangrove species of Meliaceae remains inconsistent.
In this context, analysis of complete chloroplast genomes can provide important insights into the evolutionary relationships between phylogenetic clades, as observed for several plant genera (e.g., Huang et al., 2014) and families (e.g., Lin et al., 2018). In addition, comparative analysis of chloroplast genomes can reveal variation in genome sequences and structures, both within and between plant species. This information can be valuable for advanced understanding of the adaptive ability of species in face of different environmental conditions and biotic and abiotic stresses, which may facilitate conservation of valuable traits (Daniell et al., 2016). Given that complete chloroplast genome sequence can improve our understanding of plant evolution and have several translational applications, it is not surprising that about 4,000 chloroplast genomes have been sequenced to date (Singh et al., 2020).
This study was therefore formulated to characterize the complete chloroplast genomes of three Xylocarpus species (including two true mangroves and one non-mangrove species) and two non-mangrove species from the same family. We did not use nuclear markers (like 26S, or ITS), as these markers were found to be not sufficiently informative (like 26S) and contain saturated substitutions at family level (like ITS) for Sapindales (Muellner-Riehl et al., 2016). We selected C. guianensis and S. macrophylla as the two non-mangrove species, as they were found to be phylogenetically closest to the Xylocarpus species in the previous studies (Guo et al., 2018; Muellner-Riehl et al., 2016). We further compared the sequence genome features and variations between the true mangrove and non-mangrove species to provide the molecular insights into the adaptive mechanisms of the mangrove species. Although complete chloroplast genome information is available for C. guianensis in GenBank (NC_037442) and for X. moluccensis in CNSA (CNP0000567) (Shi et al., 2020), we characterized them in this study to avoid influence of different methodologies on the comparative analysis.
Materials & Methods
DNA extraction and sequencing
Young leaves of three Xylocarpus species, C. guianensis and S. macrophylla were collected from Singapore (sample collection was approved by the National Parks Board, Singapore, with the permit No: NP/RP14-023) and China, respectively, after confirming their taxonomic identities (Tomlinson, 2016). The voucher specimens were deposited in the herbarium of Sun Yat-sen University, and the collection information for these samples are listed in Table S1. The leaves were stored at −80 °C. Total DNA were extracted by CTAB protocol (Doyle & Doyle, 1990). The pair-end (PE) libraries with 150bp insert size were prepared in Vazyme Co. Ltd (Nanjing, China) and their sequences were conducted on the Illumina HiSeq X Ten platform. In total, 9.5G, 12.2G, 12.5G, 10.6G, 11.7G shorts sequences of X. granatum, X. moluccensis, X. rumphii, C. guianensis and S. macrophylla were respectively obtained.
Chloroplast genome assembling and annotation
Raw reads of the five Meliaceae species were filtered to remove the low-quality bases, and the clean reads were assembled to chloroplast genome in NOVOPlasty (Dierckxsens, Mardulyn & Smits, 2017). The chloroplast genomes of five species were annotated in the DOGMA program (Wyman, Jansen & Boore, 2004) using the whole chloroplast genome of C. guianensis (GenBank accession number: NC_037442.1) as a reference. Some unannotated genes were further manually adjusted by Geneious R version 10.1.3 (Biomatters Ltd., Auckland, New Zealand). To validate the accuracy of assembling, we designed four pairs of primers in four junctions between the large single-copy region (LSC hereafter), single small copy region (SSC hereafter), and two inverted repeats (IRA and IRB hereafter) (Table S2). PCR amplification was conducted followed by Sanger sequencing. We further verified the start-and-stop codons of the coding sequences (CDS hereafter) and exon boundaries through BLASTX in NCBI GenBank/DDBJ/EMBL database, and confirmed tRNA through online tRNAscan-SE web servers (Schattner, Brooks & Lowe, 2005). Finally, a circle chloroplast genome map was drawn by the online program OGDraw version 1.1 (Lohse, Drechsel & Bock, 2007). The annotated chloroplast genome sequences of all five species were deposited to GenBank with the following accession numbers: MH348115 (X. granatum), MH330688 (X. moluccensis), MH330687 (X. rumphii), MH396436 (C. guianensis), and MH348156 (S. macrophylla).
Identification of repeat sequences and simple sequence repeats
The repeat sequences in the chloroplast genomes of the five study species were identified in the online program REPuter (Kurtz et al., 2001). Palindromic, forward, and reverse sequences were identified with the setting of maximum repeat size 3 kb and minimum repeat size 30 bp, based on a Hamming distance of 3. To avoid redundancy, IRB regions of the genomes were removed. Overlapping repeats discovered in the same region were merged into one repeat when possible. SSRs are tracts of repetitive DNA with motif length from two to five base pairs, and are commonly used as genetic markers to assess genetic diversity and distinguish varieties within species (Ellegren, 2004). Identification of SSRs was performed by using the WebSat software (Martins et al., 2009) with the following settings: three repeats for hexa-nucleotide, three repeats for penta-nucleotide, three repeats for quad-, four repeats for tri-, five repeats for di-, and 10 repeats for mono-nucleotide SSRs.
Genome-wide sequence variations and gene selective pressure analysis
We used the Snippy program (https://github.com/tseemann/snippy) to analyze the SNPs and INDEL among five study species. The divergence among the species was visualized using the mVISTA viewer and the genome-wide sequence variation was computed using X. granatum as a reference. Variation percentages in coding regions and non-coding regions were calculated. By using the PAMLX version 1.3.1 (Xu & Yang, 2013), the relative evolution rate of the five chloroplast genomes was quantified based on dN, dS and their ratios (ω = dN/dS) (Yang & Nielsen, 2000) with the F 3 × 4 codon-based substitution model. After deleting the stop codons, 85 protein-coding genes were aligned using MEGA version 6.06 (Tamura et al., 2013). For each protein-coding genes, we estimated dN, dS and ω and compared between the five species.
Codon usage and RNA editing sites
The codon usage of 85 protein coding genes was identified by using codonW version 1.4.2 with RSCU ratio under default settings (http://codonw.sourceforge.net). We selected coding genes of at least 300 bp to avoid the codon bias index associated with short sequences. In addition, the repeat sequences were removed to avoid repetitive computation. A total of 85 CDS of every species were used in PREP suit (https://bio.tools/prep_suite) to predict possible RNA edit sites in PREP-cp (for chloroplast genes). The cutoff value was selected as 0.8 to ensure the accuracy of the prediction (Mower, 2009).
Phylogenetic analysis
Genome sequence of the five study species were aligned along with 18 other species using MAFFT version 7.310 (Katoh & Standley, 2013) with default settings, and then trimmed using trimAl version 1.4 (Capella-Gutiérrez, Silla-Martínez & Gabaldón, 2009). Out of the 18 species, 16 species were selected from the order Sapindales, whereas two species were selected from the related orders Brassicales and Malvales and were treated as outgroups following (Muellner-Riehl et al., 2016) (Table S2). The maximum likelihood phylogenetic tree was inferred in IQ-TREE version 2.0.3 (Nguyen et al., 2015) under TVM+F+I+G4 model with 1000 bootstraps. Bayesian inferences (BI) were conducted by the MPI version of ExaBayes version 1.5.1 (Aberer, Kobert & Stamatakis, 2014) under an automatically created model by the Program. By sampling every 1000 generations, four independent MCMC runs with two chains were carried out from parsimony starting topologies. Until the mean topological differences was met with at least 1,000,000 generations, the ExaBayes runs were continued. The ‘consense’ script with a 25% burn-in was used to summarize the posterior distributions of the trees. When the effective sampling sizes (ESS) of all the parameters were greater than 200, convergence was assumed. The convergence was tested with Tracer version 1.7 (Rambaut et al., 2018). The potential scale reduction factors (PSRF) close to 1 was estimated using the ‘postProcParam’ program in ExaBayes. Both ML and BI tree were visualized by using Figtree version 1.4.2 (Rambaut, 2014).
Results
Characteristics of the chloroplast genomes
The complete cpDNA length of the five Meliaceae species ranged from 159,276 bp of S. macrophylla of to 159,467 bp of C. guianensis (Table S3). All of them showed a typical quadripartite structure, containing a pair of inverted repeats (IRs: IRA and IRB) (26,967–27,052 bp), which were separated by one large single copy region (LSC) (86,958–87,381 bp) and one small single copy region (SSC) (17,967–18,276 bp). The cpDNA length of three Xylocarpus species were different: 159,282 bp of X. rumphii, 159,319 of X moluccensis and 159,410 of X. granatum. We found 429, 412 and 159 SNPs or INDEL between X. granatum vs. X moluccensis, X. granatum vs. X. rumphii and X. rumphii vs. X moluccensis, respectively (Table S4). The earlier accession of C. guianensis, collected from French Guiana, was sequenced by Malte Msder (2018, NCBI Accession number: NC_037442). In this study, we collected sample from Sungei Buloh Wetland Reserve, Singapore, which was planted from Cooperative Republic of Guyana on 28 December 1938. We found 12 SNPs or INDEL between the earlier accession and our sample (Table S4), which indicated that the two sequences were nearly identical.
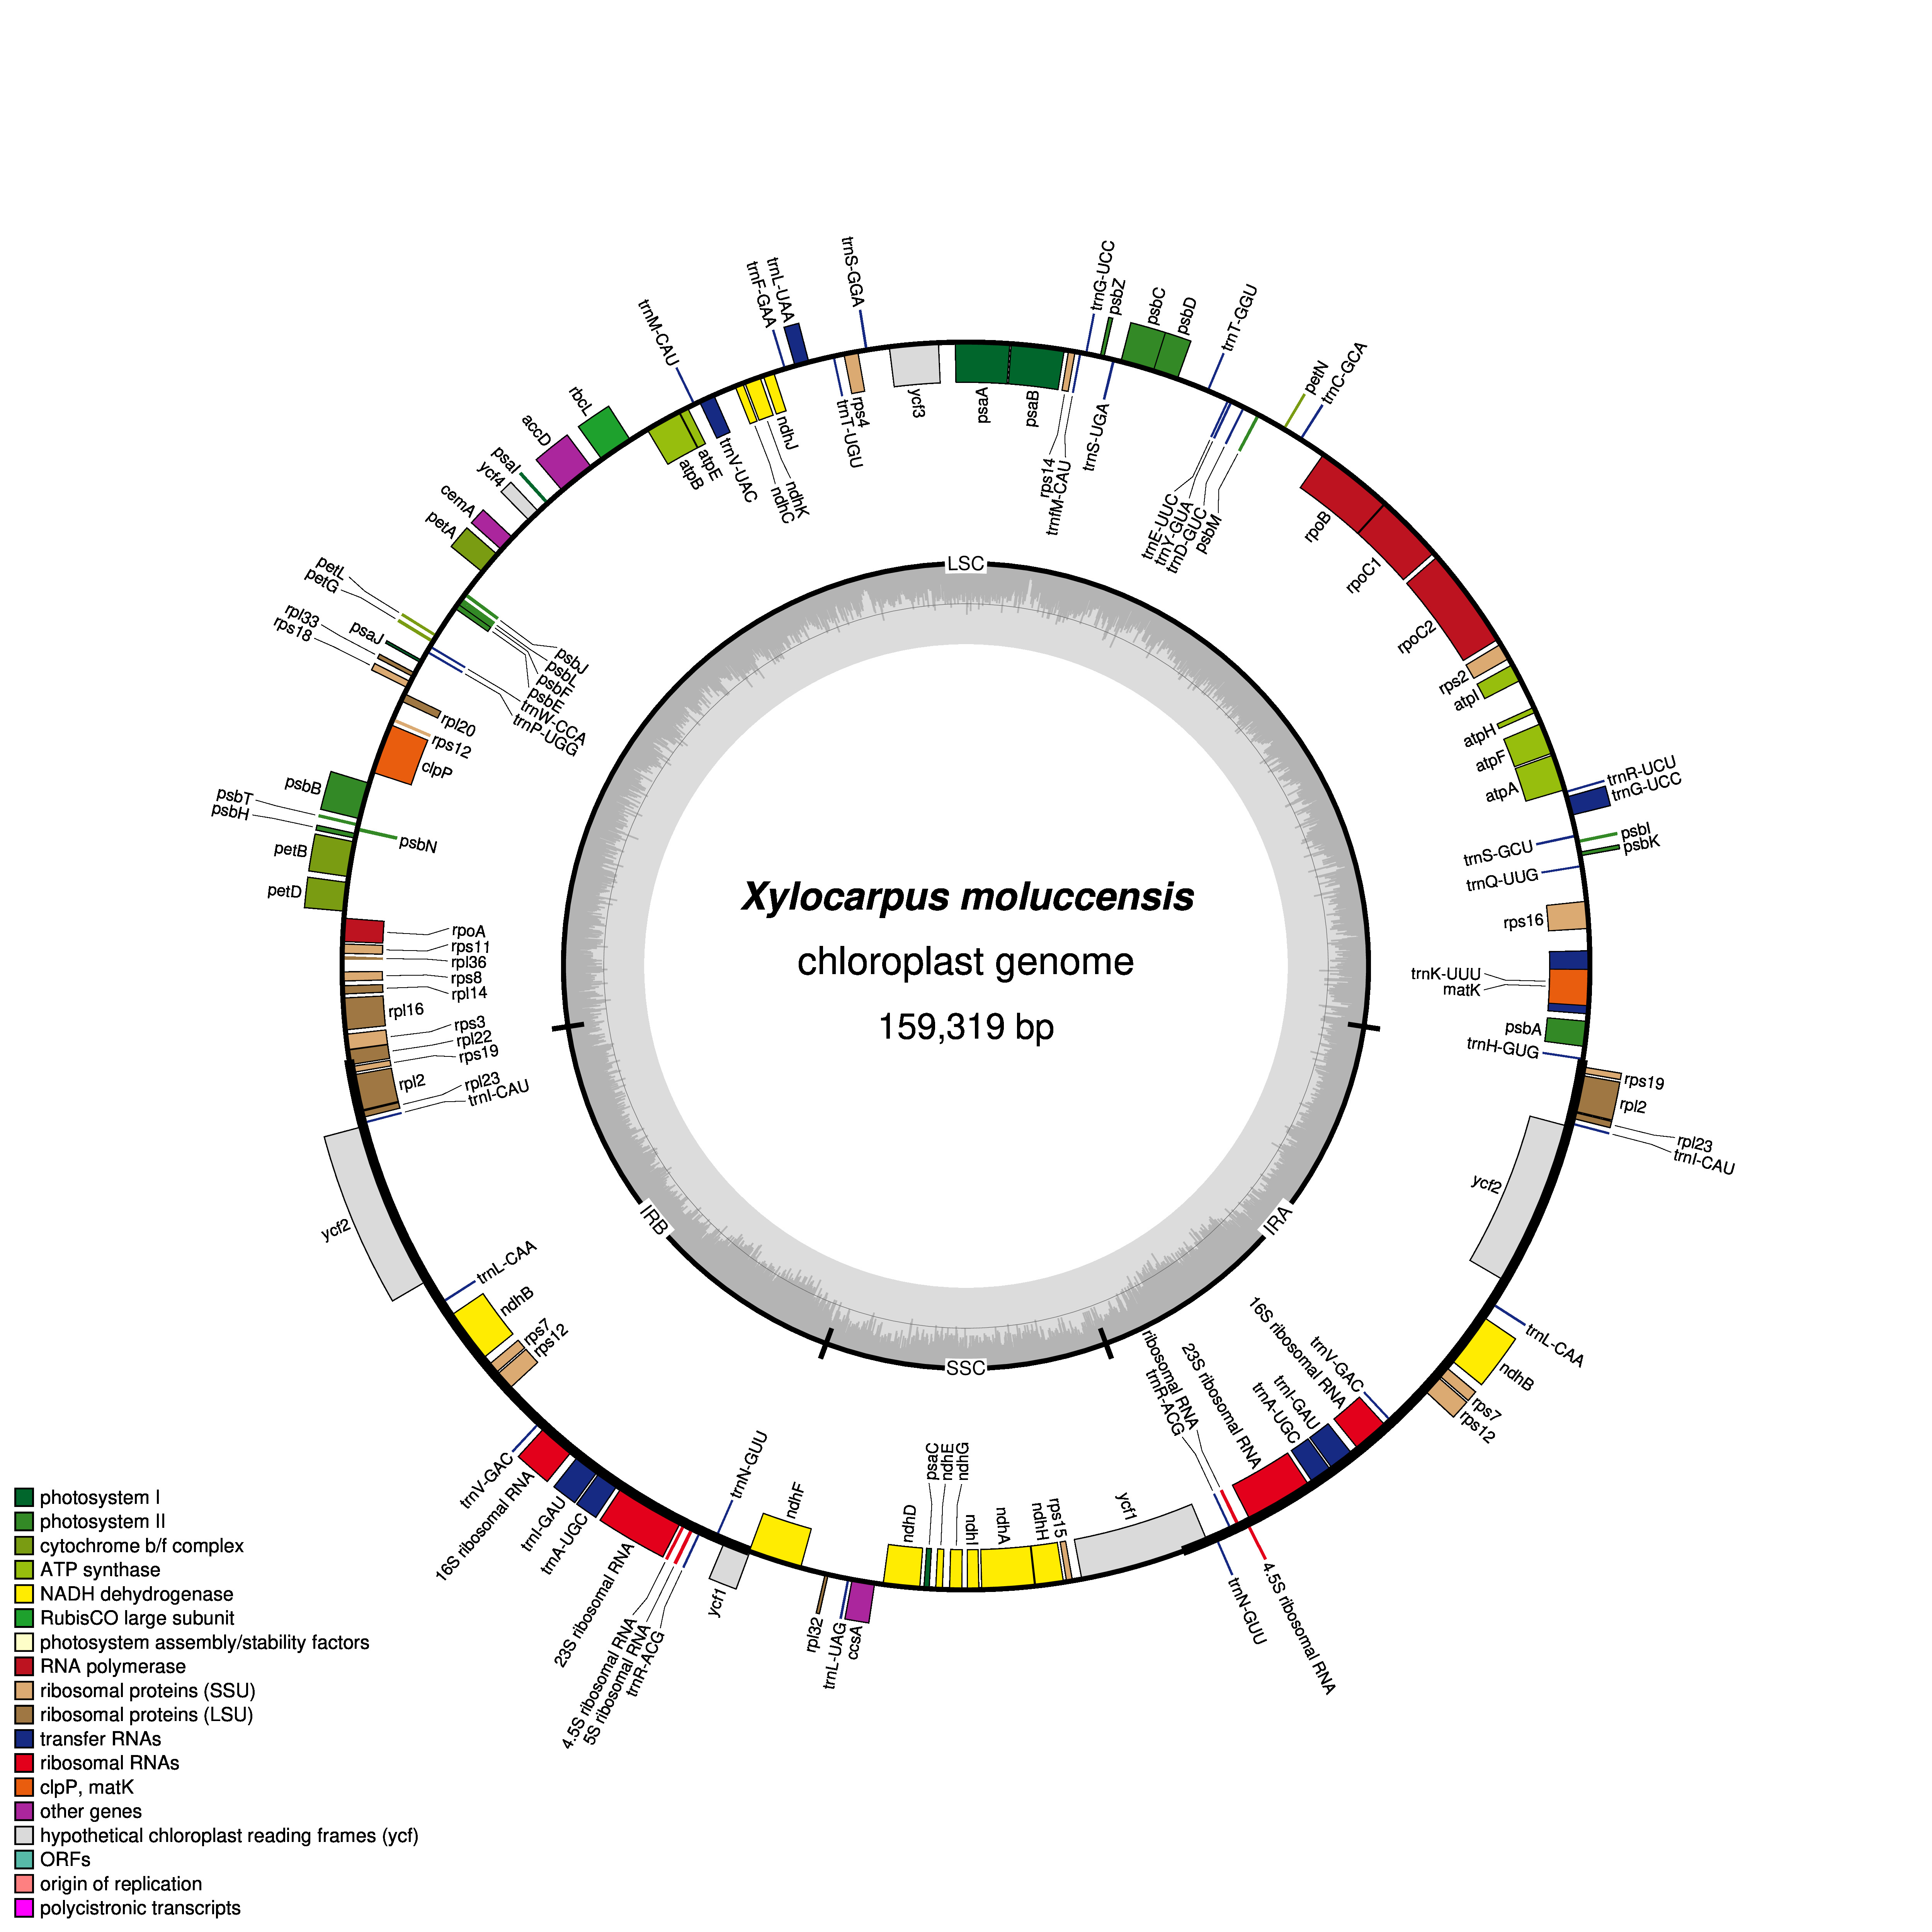
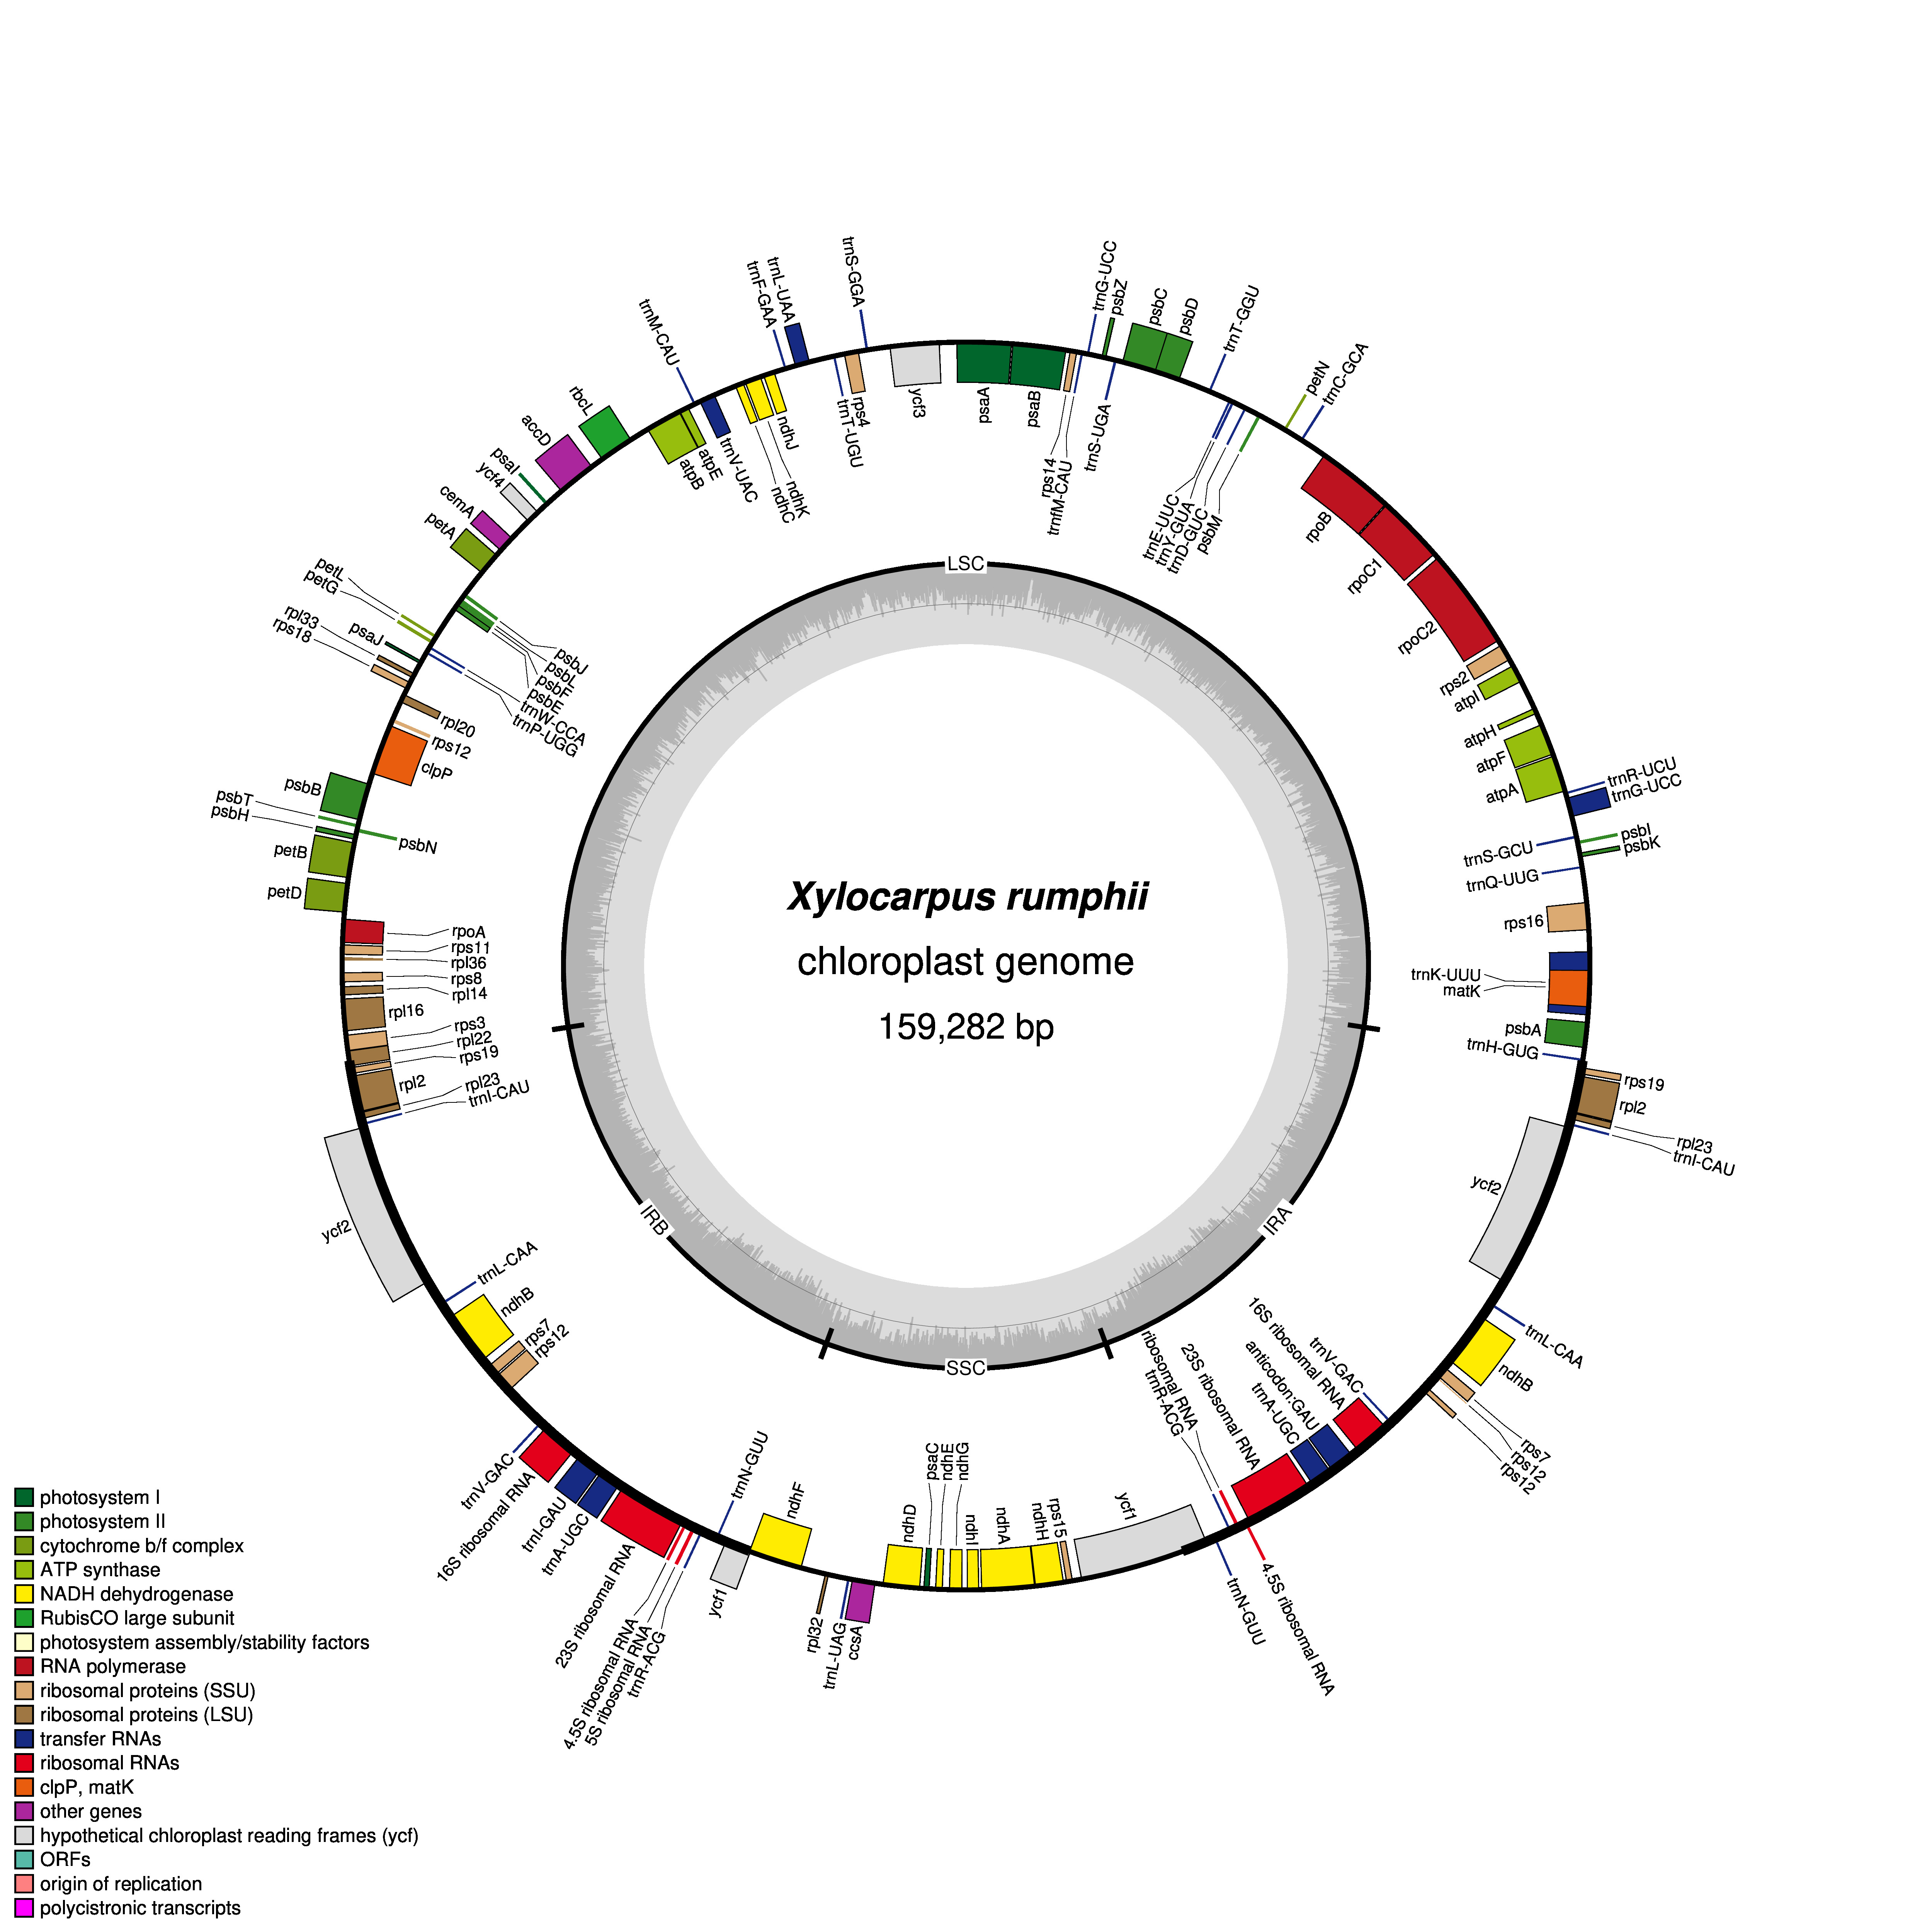
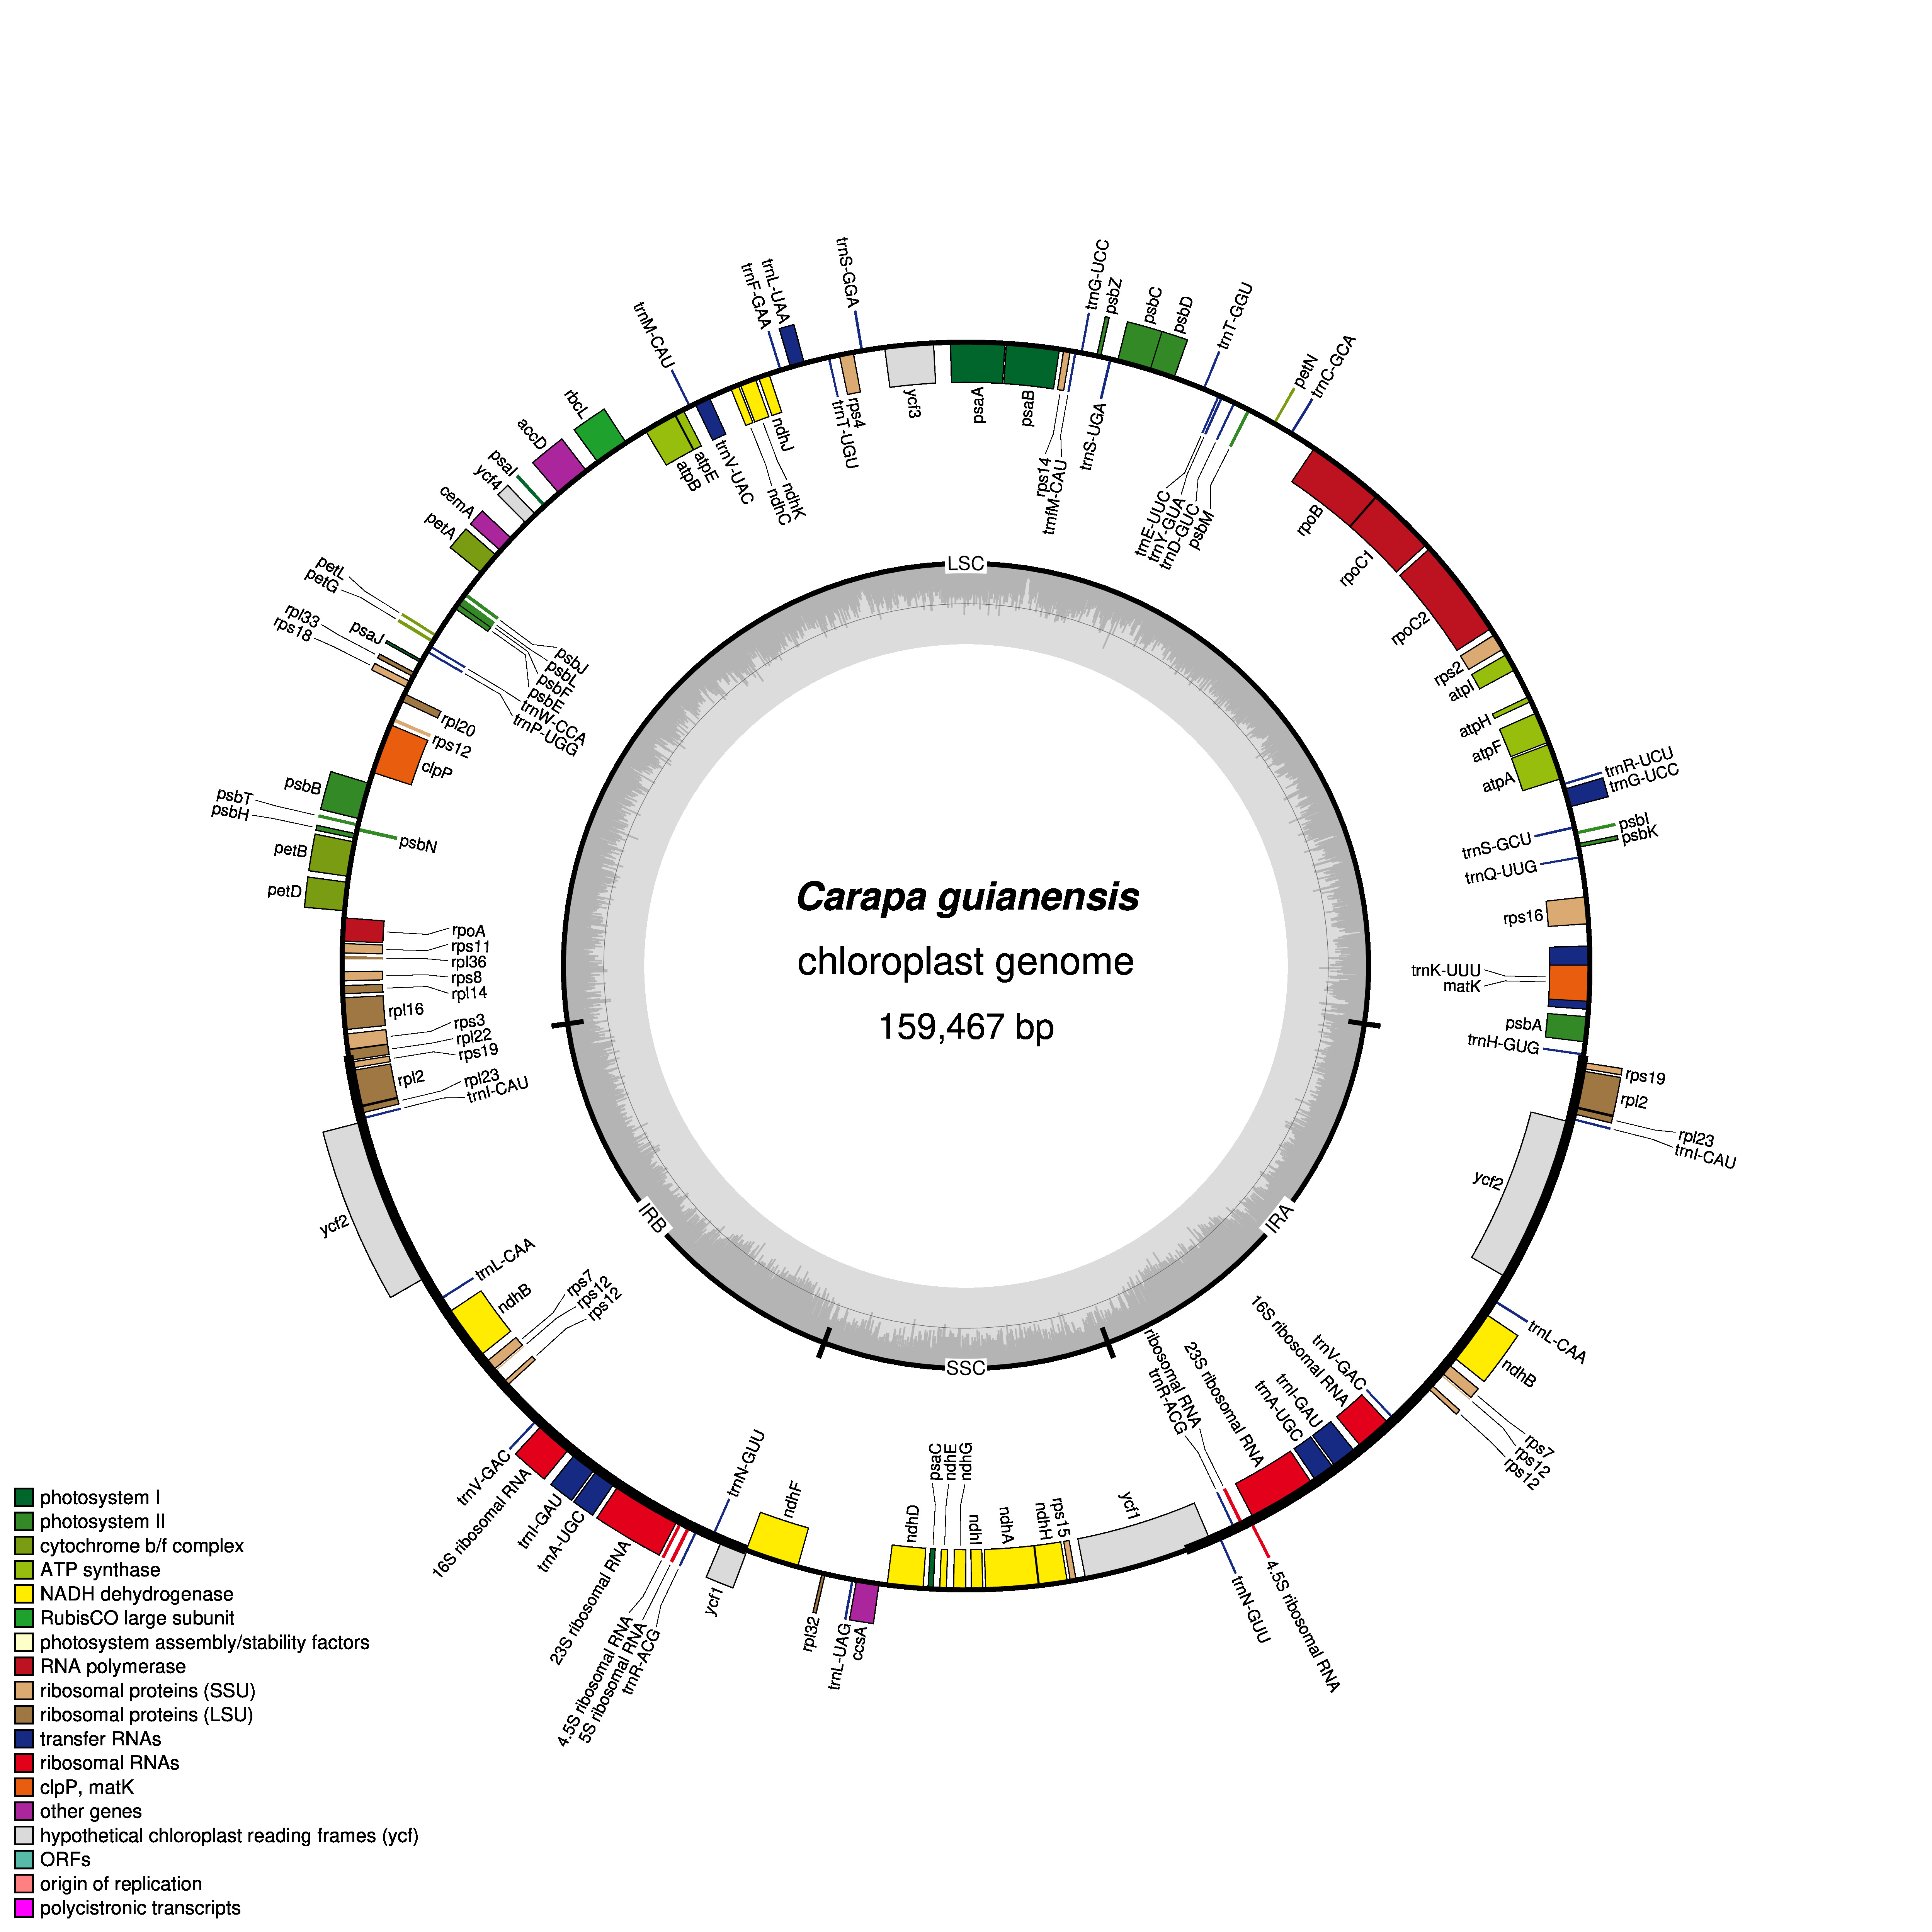
The GC contents of the three species were nearly identical (GC contents of X. moluccensis and X. rumphii were 37.87%, GC content of X. granatum was 37.86%). The other two species of the genus Meliaceae, namely S. macrophylla and C. guianensis, had 37.95% and 37.91% GC content, respectively. A total of 130 functional genes were found in each of the study species: 85 protein-coding genes (CDS), 37 tRNA and 8 rRNA (Table 1). Out of these, 81 genes were in LSC region, and 13 genes were found in SSC region. A total of 18 genes (seven protein-coding genes, seven tRNA and four rRNA) was duplicated in the IR regions (Fig. 1, Figs. S1–S4). Among the 130 genes, 15 genes included one intron and three genes (rps12, ycf3 and clpP) included two introns. The rps12 was a trans-spliced gene and had two directions with 5′ exon in LSC region and 3′ end exon in IR region. In addition, rps19 and ndhD genes contained unusual start codons—GTG and ACG, respectively. 58 genes (four rRNA, 25 protein-coding genes and 29 tRNA) were related to self-replication (Table 1). Out of the 46 genes associated with photosynthesis, 22 genes were related to the subunits of photosystem, 11 genes to NADH dehydrogenase, six genes to the subunits of cytochrome, six genes to the subunits of ATP synthase, and only one gene was related to the large subunit of rubisco. The rest of the genes encoded proteins (e.g., clpP encoding Protease, matK encoding Maturase, cemA encoding envelop membrane protein). The functions of some genes could not be deciphered (accD, ccsA, ycf1 and ycf2) (Table 1).
| Category | Group | genes |
|---|---|---|
| Self-replication | Ribosomal RNA genes | rrn4.5 (×2), rrn5 (×2), rrn16 (×2), rrn23 (×2) |
| Large subunit of ribosome (LSU) | rpl2 (×2)*, rpl14, rpl16*, rpl20, rpl22, rpl23 (×2), rpl32, rpl33, rpl36 | |
| small subunit of ribosome (SSU) | rps2, rps3, rps4, rps7 (×2), rps8, rps11, rps12**, rps14, rps15, rps16*, rps18, rps19 (×2) | |
| DNA dependent RNA polymerase | rpoA, rpoB, rpoC1*, rpoC2 | |
| Transfer RNAs genes | trnA-UGC(×2)*, trnC-GCA, trnD-GUC, trnE-UUC, trnF-GAA, trnG-UCC(×2)*, trnH-GUG, trnI-CAU(×2), trnI-GAU(×2)*, trnK-UUU*, trnL-CAA(×2), trnL-UAA*, trnL-UAG, trnM-CAU, trnfM-CAU, trnN-GUU(×2), trnP-UGG, trnQ-UUG, trnR-ACG(×2), trnR-UCU, trnS-GCU, trnS-UGA, trnS-GGA, trnT-UGU, trnT-GGU, trnV-GAC(×2), trnV-UAC*, trnW-CCA, trnY-GUA | |
| Photosynthesis | Subunits of photosystem I | psaA, psaB, psaC, psaI, psaJ, ycf3**, ycf4 |
| Subunits of photosystem II | psbA, psbB, psbC, psbD, psbE, psbF, psbH, psbI, psbJ, psbK, psbL, psbM, psbN, psbZ, psbT | |
| NADH dehydrogenase | ndhA*, ndhB(×2)*, ndhC, ndhD, ndhE, ndhF, ndhG, ndhH, ndhI, ndhJ, ndhK | |
| Subunits of cytochrome | petA, petB*, petD*, petG, petL, petN | |
| Subunits of ATP synthase | atpA, atpB, atpE, atpF*, atpH, atpI, | |
| Large subunit of rubisco | rbcL | |
| Other genes | ATP-dependent protease subunit p gene | clpP** |
| Maturase | matK | |
| Envelop membrane protein | cemA | |
| Unknown function | Subunit of acetyl-CoA-carboxylase | accD |
| c-type cytochrome synthesis gene | ccsA | |
| Hypothetical chloroplast reading frames | ycf1 (×2), ycf2 (×2) |
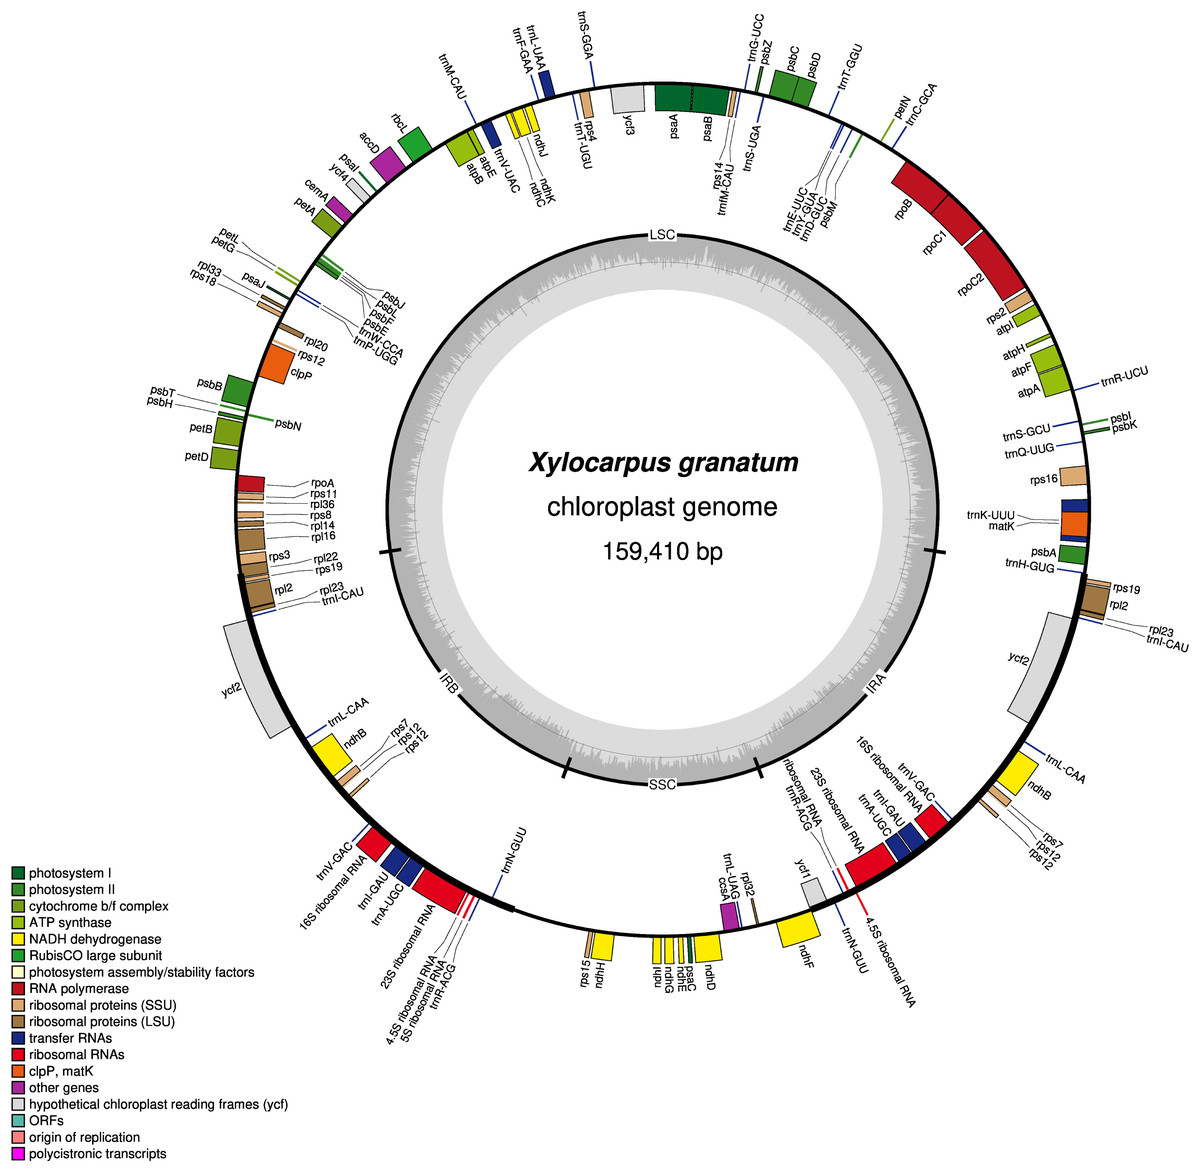
Figure 1: Gene map of chloroplast genomes of Xylocarpus granatum.
Genes showing outside of the outer layer circle are transcribed clockwise direction, whereas those inside genes are transcribed counterclockwise. Different functional groups are represented by the colored bars. The darker gray area lying in the inner circle indicates GC content of the complete chloroplast genome.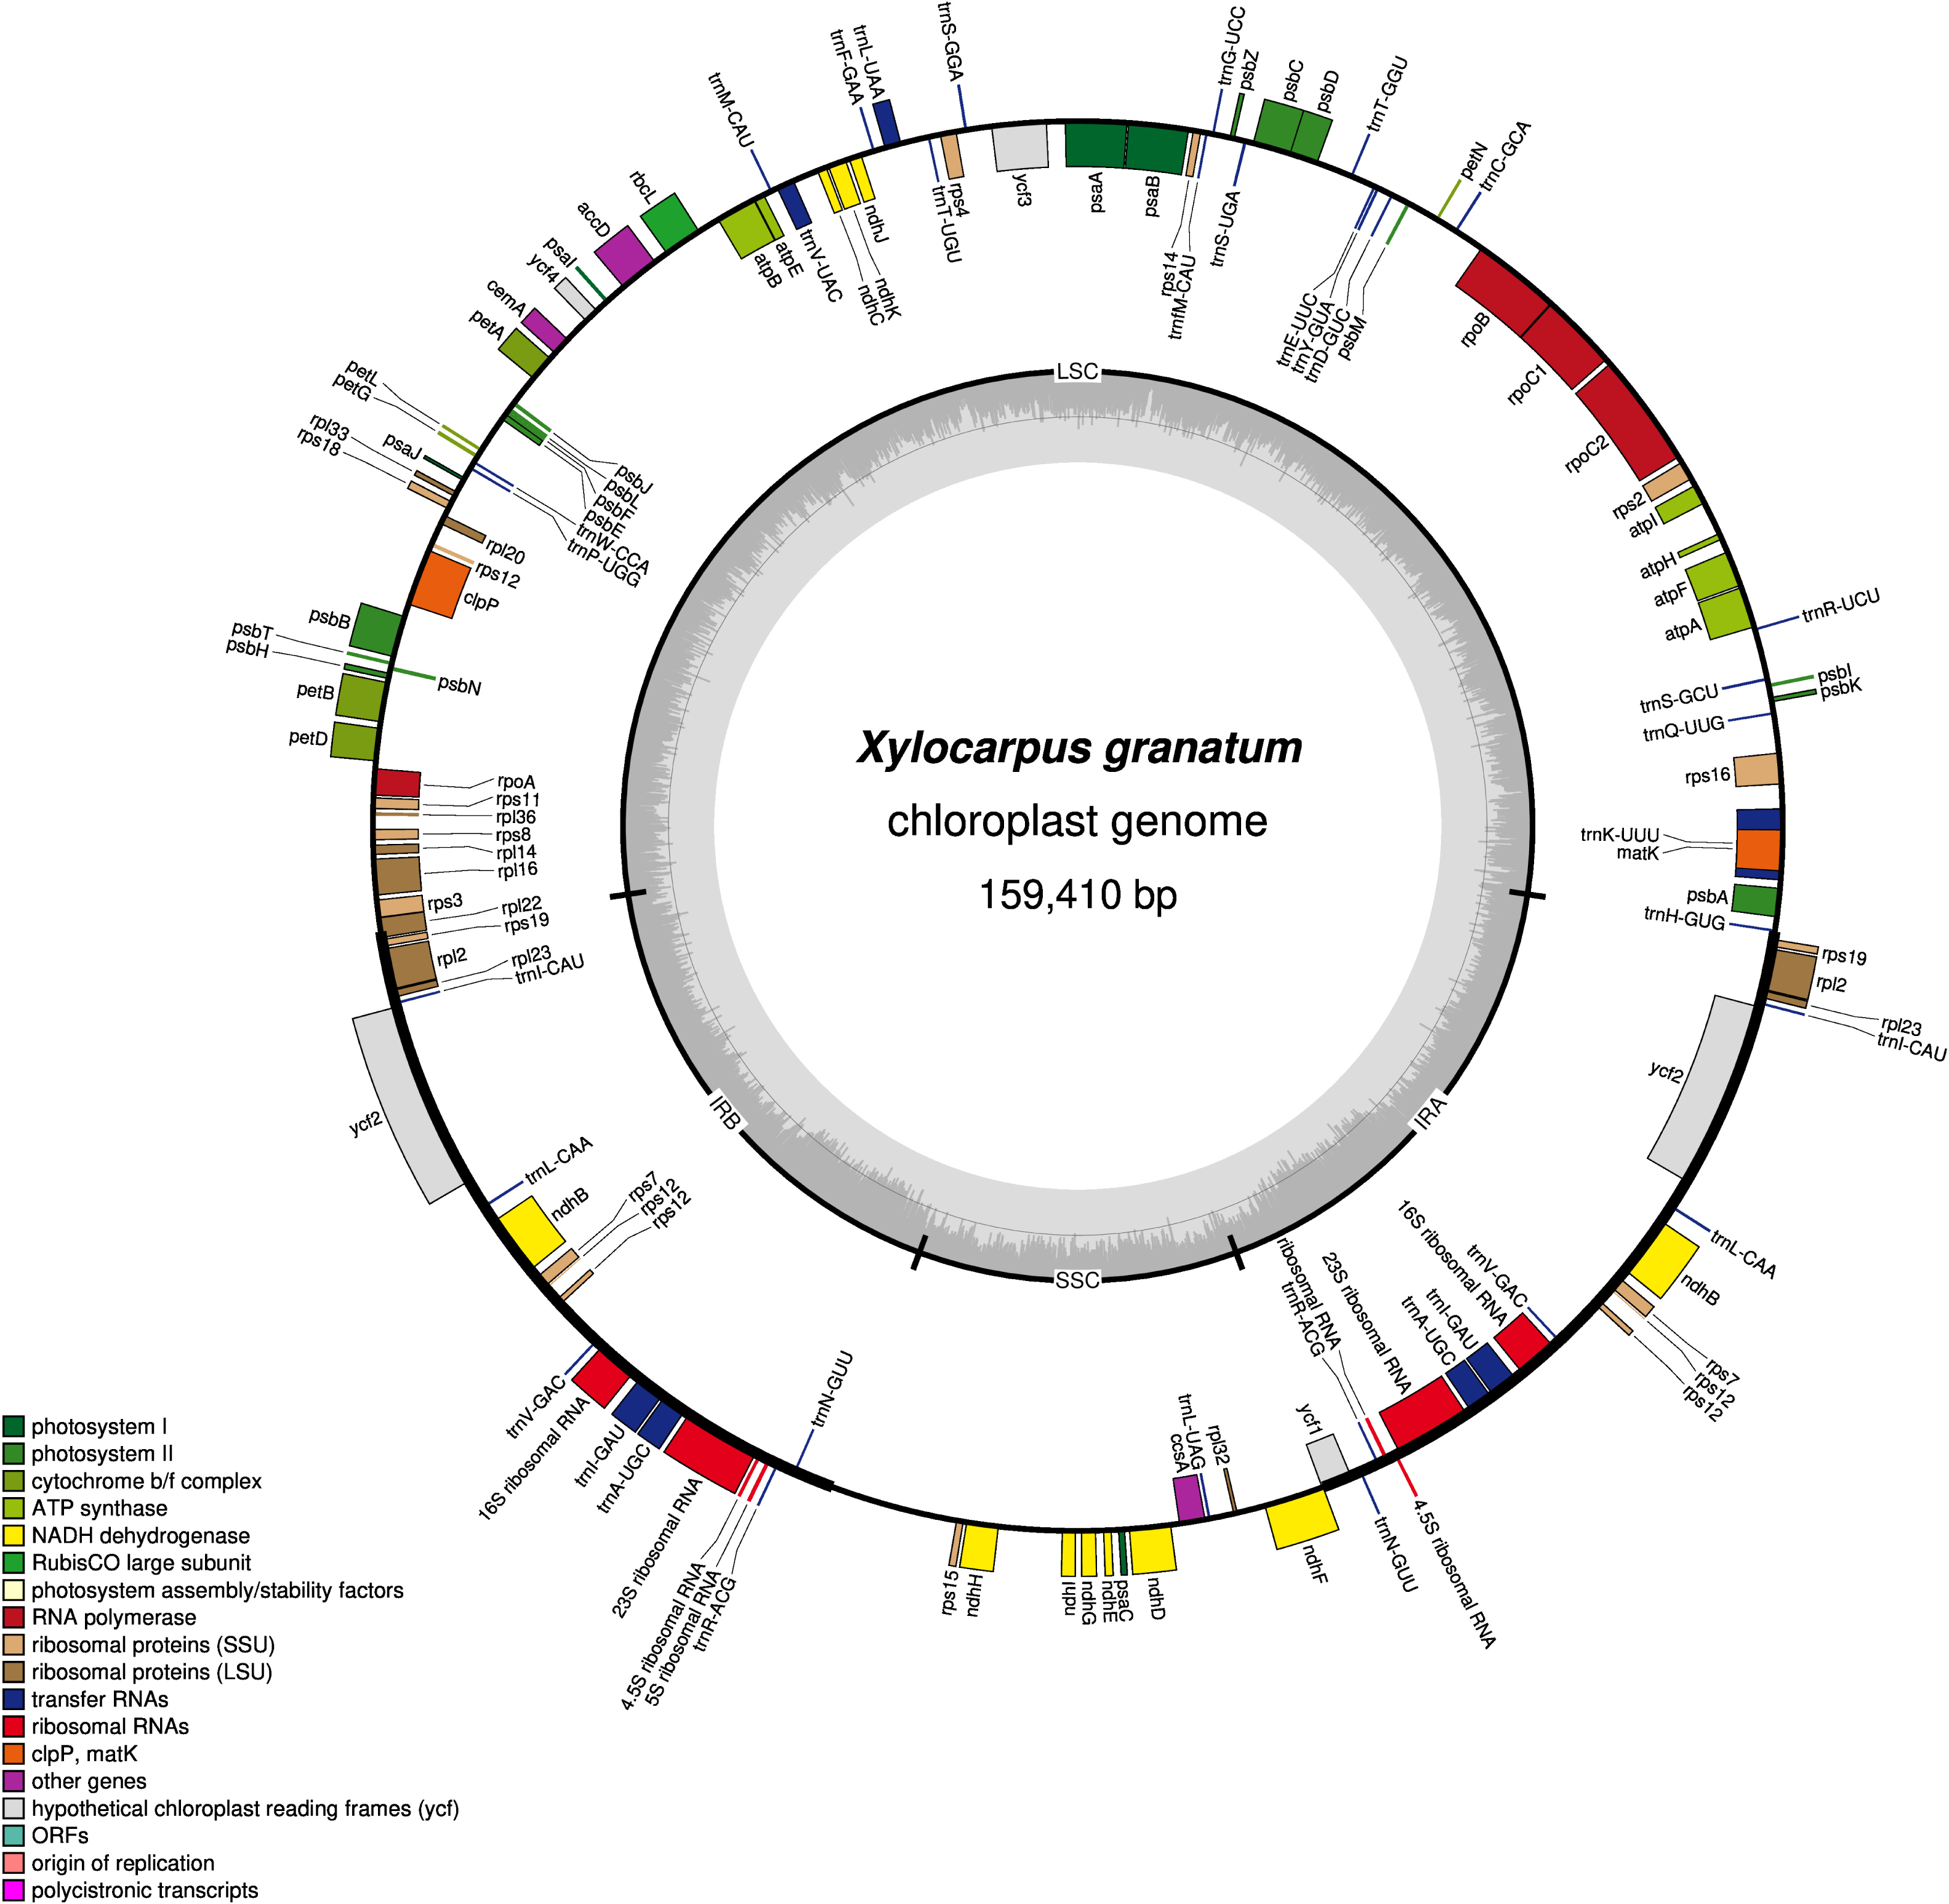
Repetitive sequences
Three types of repetitive sequences were identified in the five Meliaceae species. X. granatum possessed highest number of repetitive sequences (n = 24) among the five species studied here. X. moluccensis and X. rumphii contained equal number of reverse repeats (n = 3); however, quantities of forward and reverse types were different between the two species. We found 11 forward repeats and four palindromic repeats in X. moluccensis, and nine forward repeats and five palindromic repeats in X. rumphii. The two related species of this family, S. macrophylla and C. guianensis, had almost identical repeats distribution. Comparing all repeat type sequences, the figure for palindromic appeared to be almost stable among these five species. However, forward repeats ranged from 10 in C. guianensis to 18 in X. granatum, and reverse repeats ranged from 1 (X. granatum, S. macrophylla, C. guianensis) to 3 (X. moluccensis and X. rumphii). The distributions of three type of repeats were different in each region: approximately half of forward repeats located in the CDS region, while 27% and 16% of the repeats were distributed in the spacer region and intron region, respectively. In palindromic repeats, 44% repeats were situated in the intron region, while 30% and 26% repeats were identified in the spacer region and CDS region, respectively. No repeats were discovered in spacer region of reverse repeats, while 56% and 44% repeats were found in intron region and CDS region, respectively (Fig. 2, Table S5).
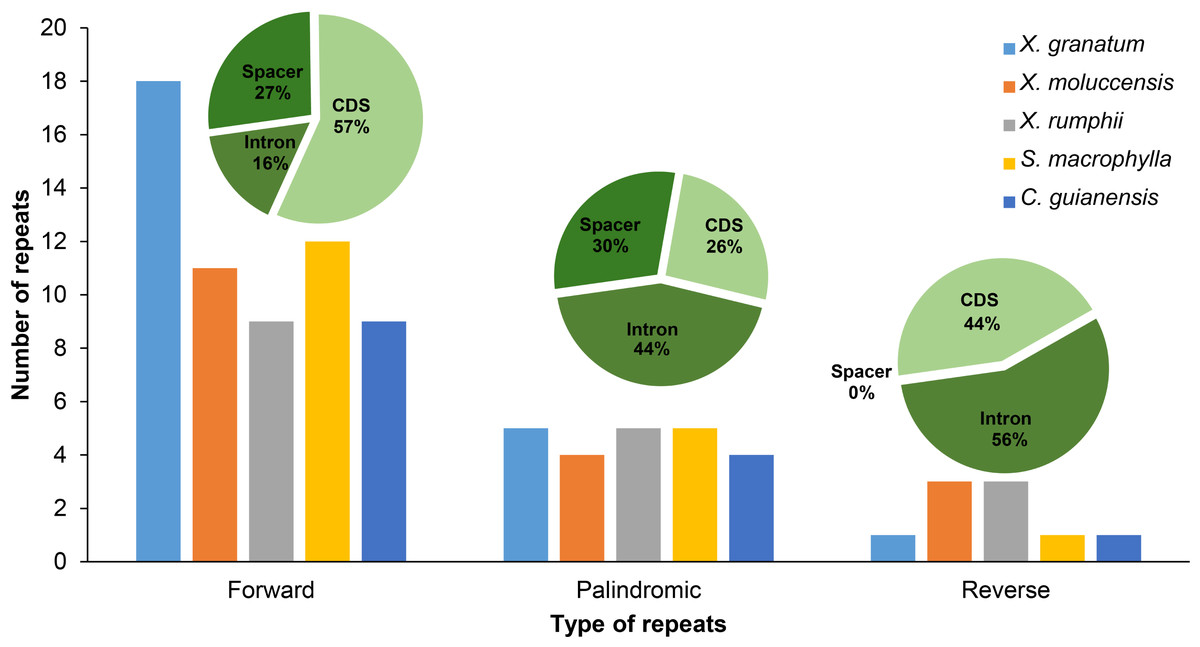
Figure 2: Number of three types of repeats (forward, palindromic and reverse) in five Meliaceae species in three different locations.
protein coding genes (cds), gene intron (intron) and intergenic spacer (spacer). Five species: Xylocarpus granatum, Xylocarpus moluccensis, Xylocarpus rumphii, Swietenia macrophylla, Carapa guianensi.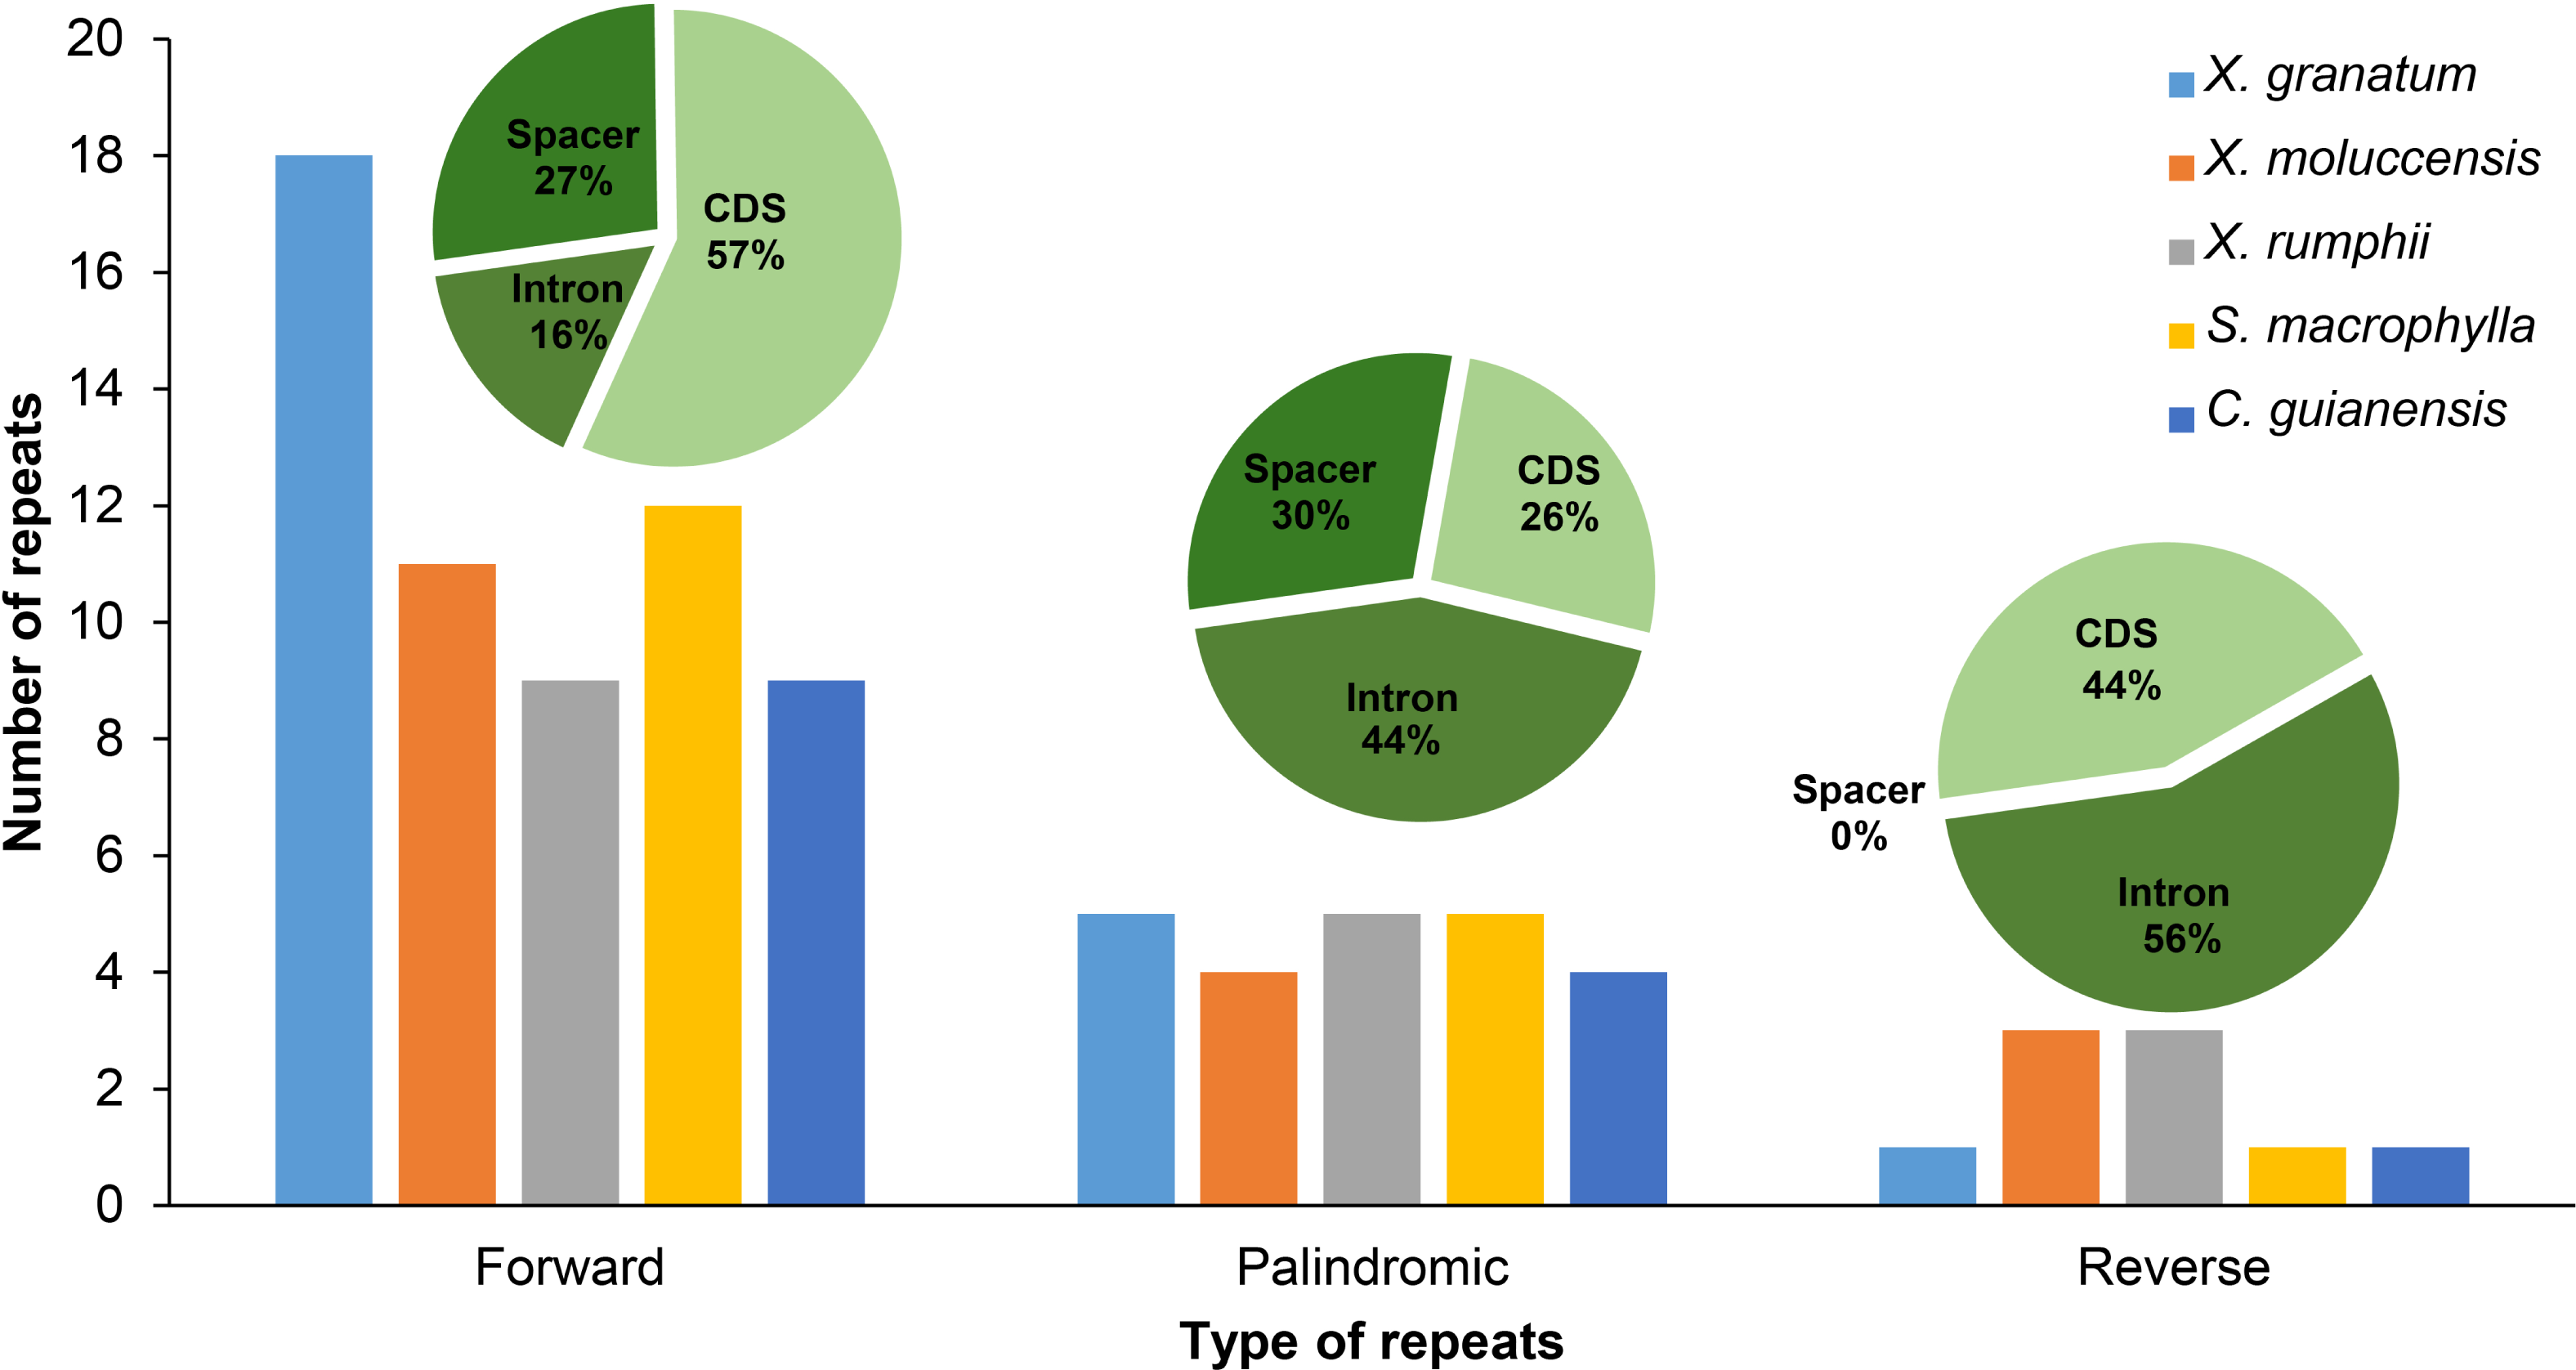
In X. granatum, nine repeats (64% of total CDS) were located in the rpl22 gene region, while in X. moluccensis and X. rumphii, the number of repeats in the rpl22 gene region were 2 and 1, respectively. No repeat was found in the rpl22 gene region for S. macrophylla and C. guianensis. At ycf2 gene, one repeat was founded for the three Xylocarpus species, while four and three repeats were observed in S. macrophylla and C. guianensis, respectively. We found variable number of repeats (three to four) in the ycf3 intron range among these five Meliaceae species. At accD gene, two reverse repeats were found in X. moluccensis and X. rumphii, and these repeats were not identified in other species. Majority of these repeats were found in the CDS of the genome. Maximum number of repeats was observed in X. granatum (14), followed by X. moluccensis (nine), X. rumphii (seven), S. macrophylla (seven) and C. guianensis (five). Palindromic repeats were discovered in CDS, gene intron (intron) and intergenic spacer (spacer) regions, while reverse repeats were only found at CDS and intron regions (Fig. 2, Table S5).
SSR analysis
A total of 467 simple sequence repeats (SSRs, also known as microsatellites) were identified across the five study species. The number of SSRs varied from 92 in X. moluccensis and S. macrophylla to 97 in C. guianensis (Table S6). In all the five species, the number of mononucleotide SSRs was maximum (ranging from 68 to 74, accounting for 74% to 77% in all repeats) (Figs. 3A–3B, Fig. S5). Other types of SSRs constituted a small part with 113 repeats comprising of 11-12 tetra-nucleotide SSRs, 5-6 di-nucleotide SSRs, 2-3 penta-nucleotide SSRs, and 1 hexa-nucleotide SSRs (only found in X. granatum). Most of these SSRs were located in the intergenic spacer region. We found 68 SSRs (72.3%), 64 SSRs (69.6%), 62 SSRs (66.0%), 64 SSRs (69.6%), 72 SSRs (74.2%) in the intergenic spacer regions of X. granatum, X. moluccensis, X. rumphii, S. macrophylla and C. guianensis, respectively (Fig. 3C). It is interesting to note that almost identical number of SSRs was observed in coding sequences (10-16) and intron sequences (12-16).
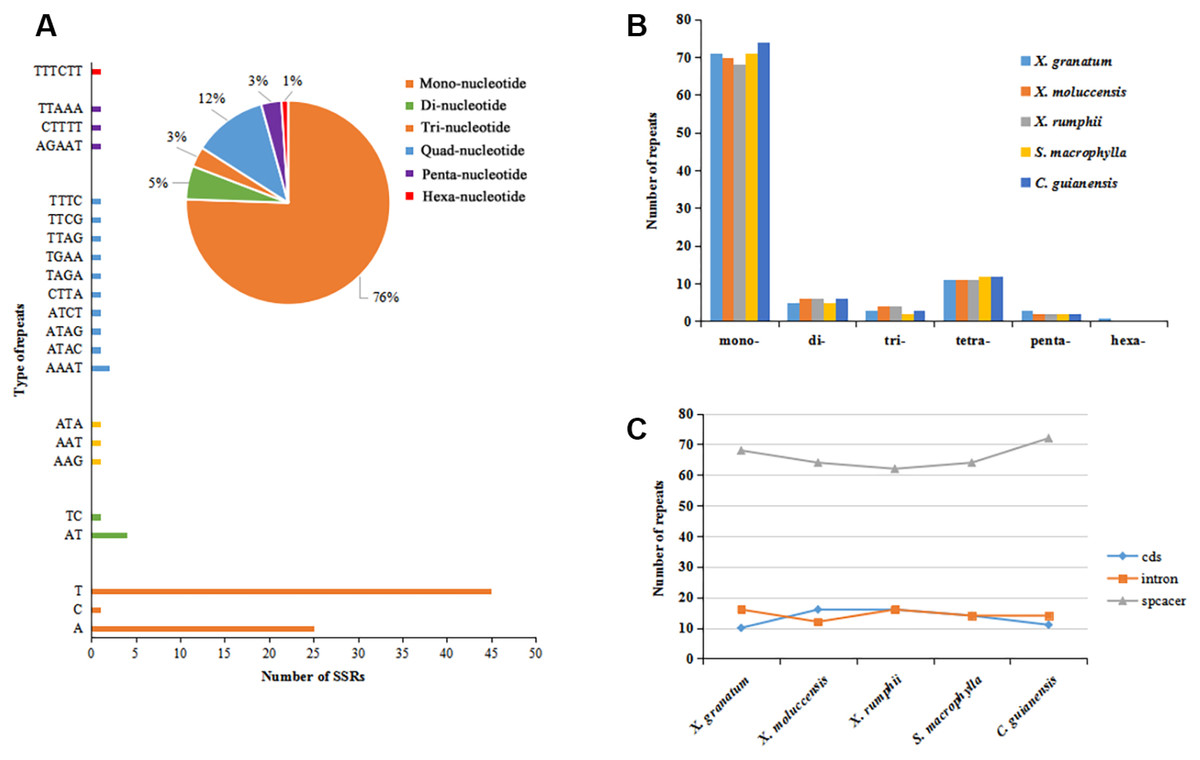
Figure 3: Analysis of simple sequence repeat (SSR) type.
(A) Distribution of different SSRs repeat units in Xylocarpus granatum, (B) number of repeats for six types of SSRs in five Meliaceae species (Xylocarpus granatum, Xylocarpus moluccensis, Xylocarpus rumphii, Swietenia macrophylla, Carapa guianensis), (C) variation in number of repeats among five Meliaceae species in three different locations: protein coding genes (cds), gene intron (intron) and intergenic spacer (spacer).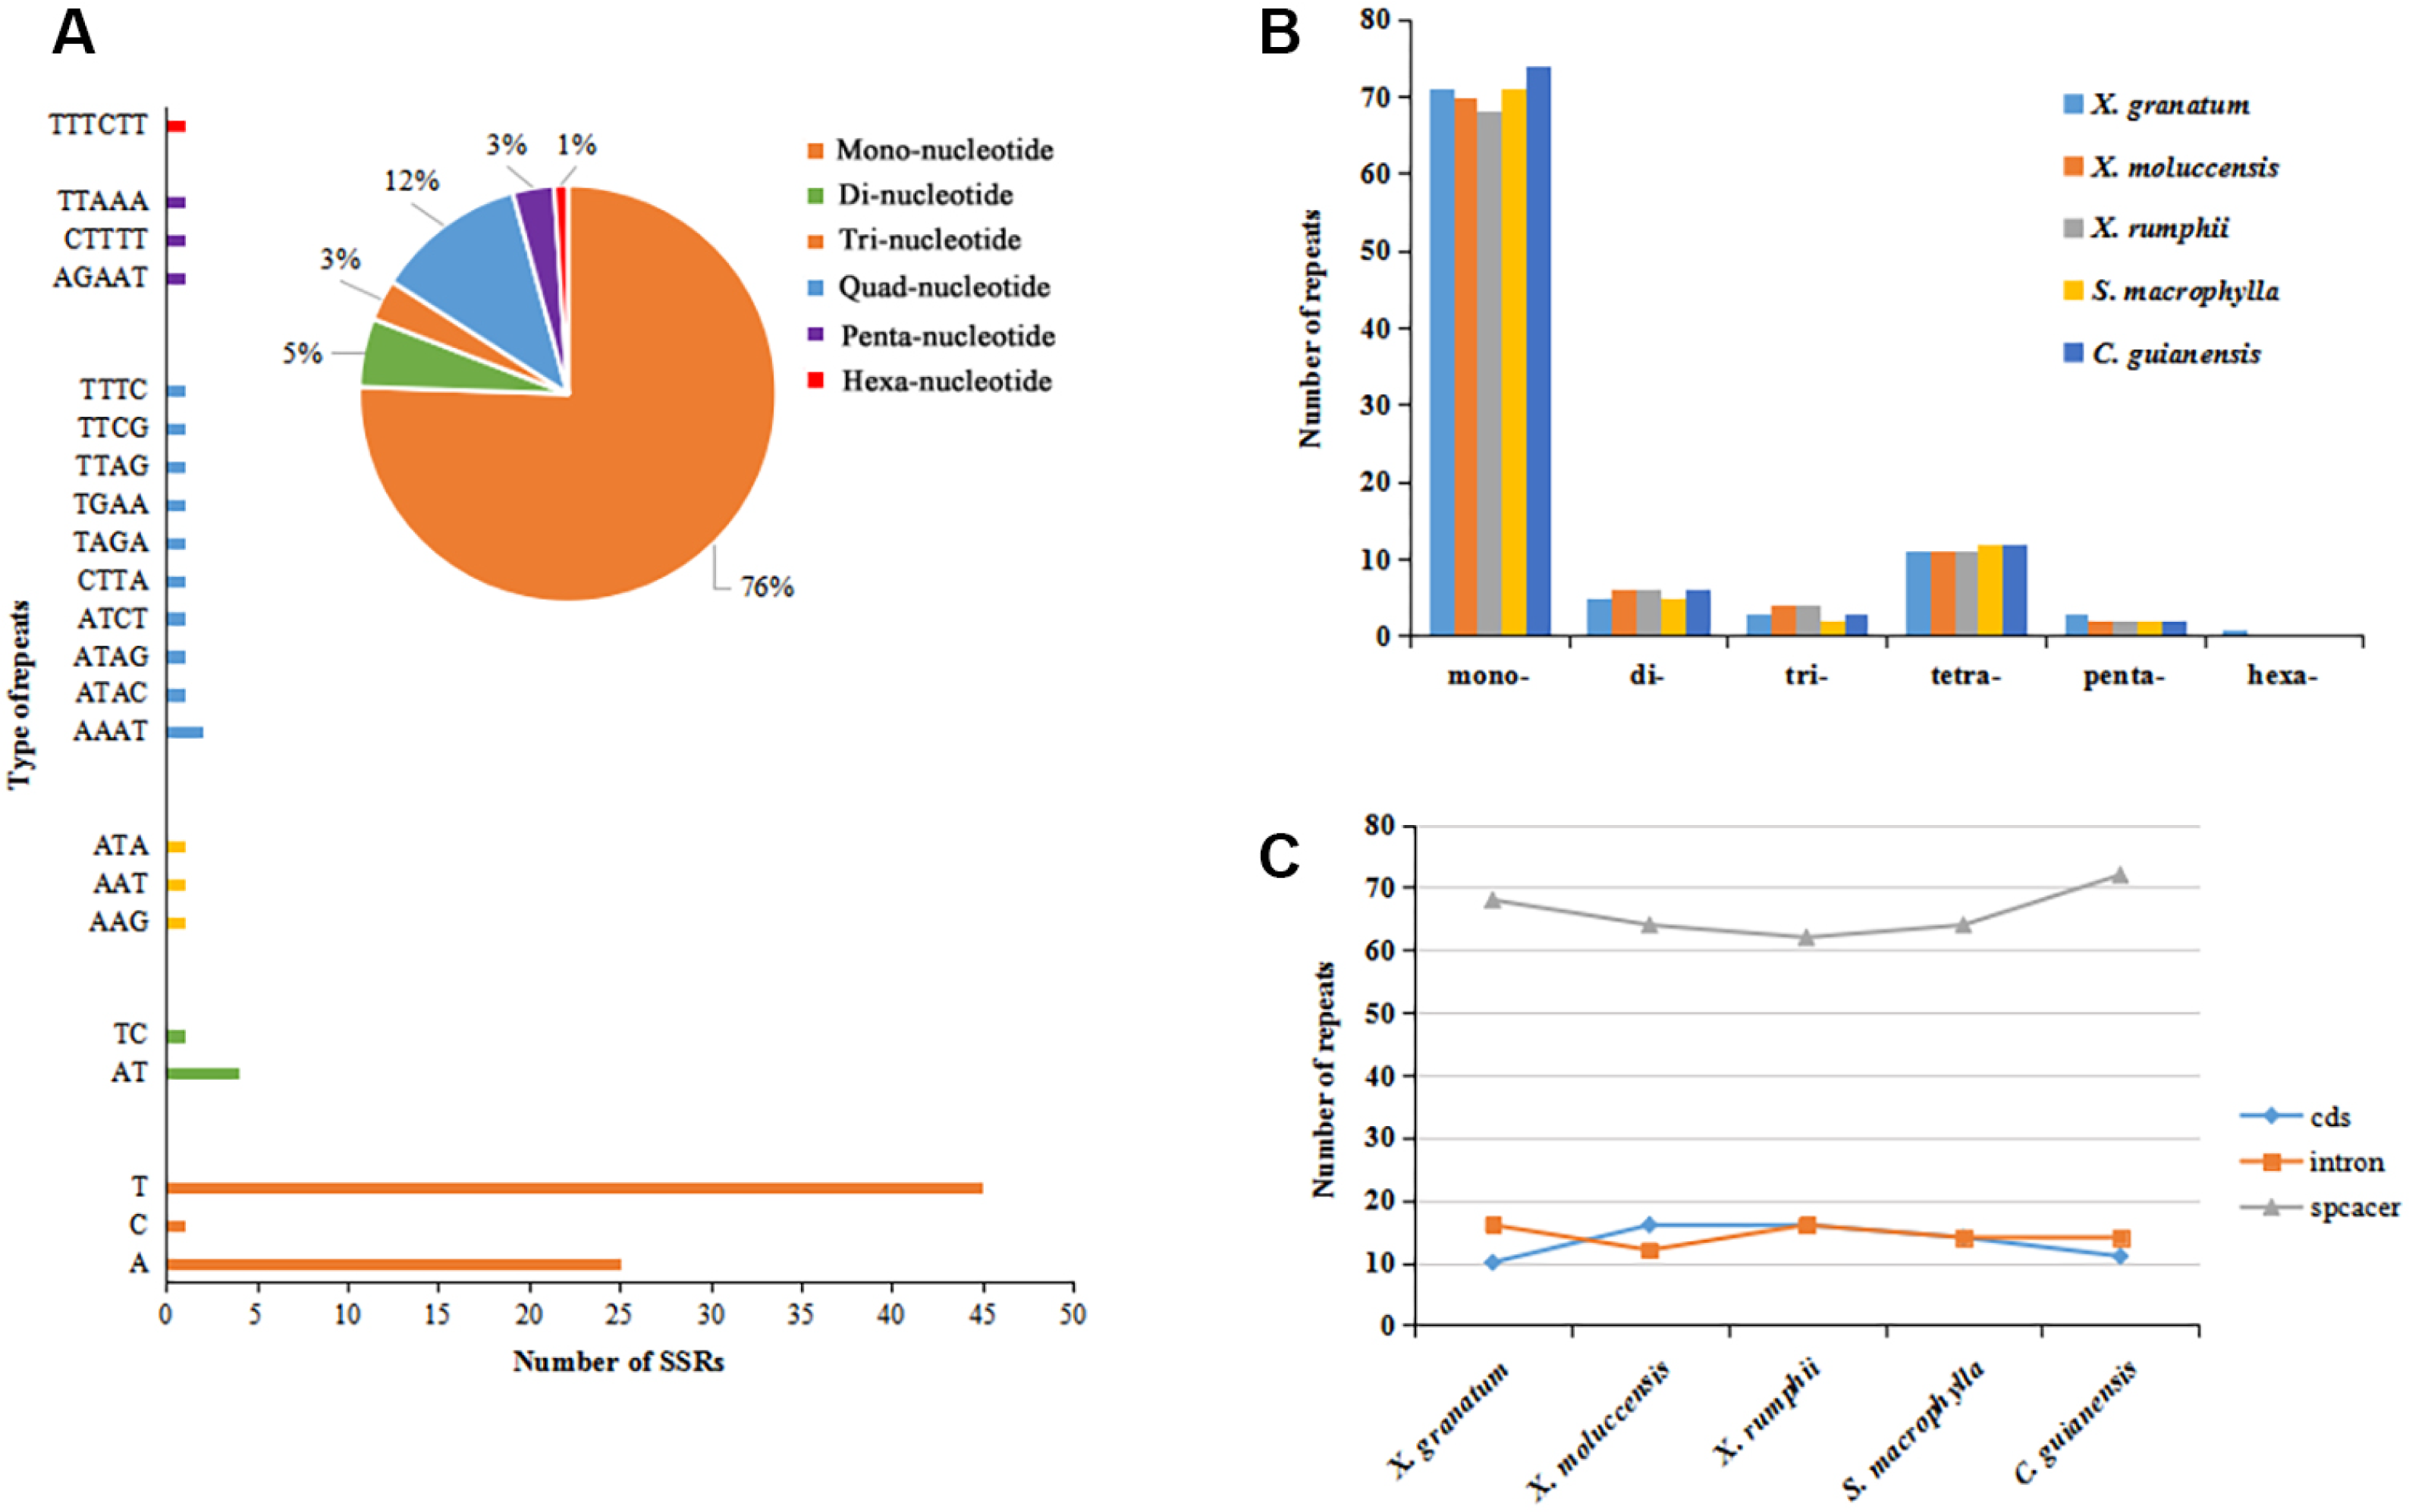
IR contraction and expansion
To identify contraction and expansion of the IR region, the IR boundaries were compared between these five Meliaceae species and one closely related species Ailanthus altissima of the family Simaroubaceae (GenBank accession number: MG799542). We observed highly conserved IR boundary regions with a little variation in length of the boundary genes (Fig. 4). For all the six Sapindales species, the LSC region started with trnH gene and ended in 3′ region of rpl22. The trnH gene of three Xylocarpus species and S. macrophylla started at position 3, whereas in C. guianensis and A. altissima, it started at position 7 and 21, respectively. IRA region started from 5′ region of rpl22 with 222 bp in X. granatum, X. rumphii and S. macrophylla, and with 216 bp in X. moluccensis, 218 bp in C. guianensis and 6bp in A. altissima. Two copies of rps19 were located in the start region of IRA and in the reverse region of IRB. The IRA/SSC junctions were situated within an overlap region between pseudogene ycf1 and ndhF in all five study species. The overlap regions ranged from 24bp in S. macrophylla to 67bp in X. granatum and C. guianensis. When compared with A. altissima, ndhF gene was not found to be located in the IRA/SSC junction and shared no nucleotide with ycf1 pseudogene. The ycf1 genes were situated in the 3′ region in SSC of the SSC/IRB border with 4263–4328 bp length, followed by the rps15 gene which was completely located in the SSC regions.
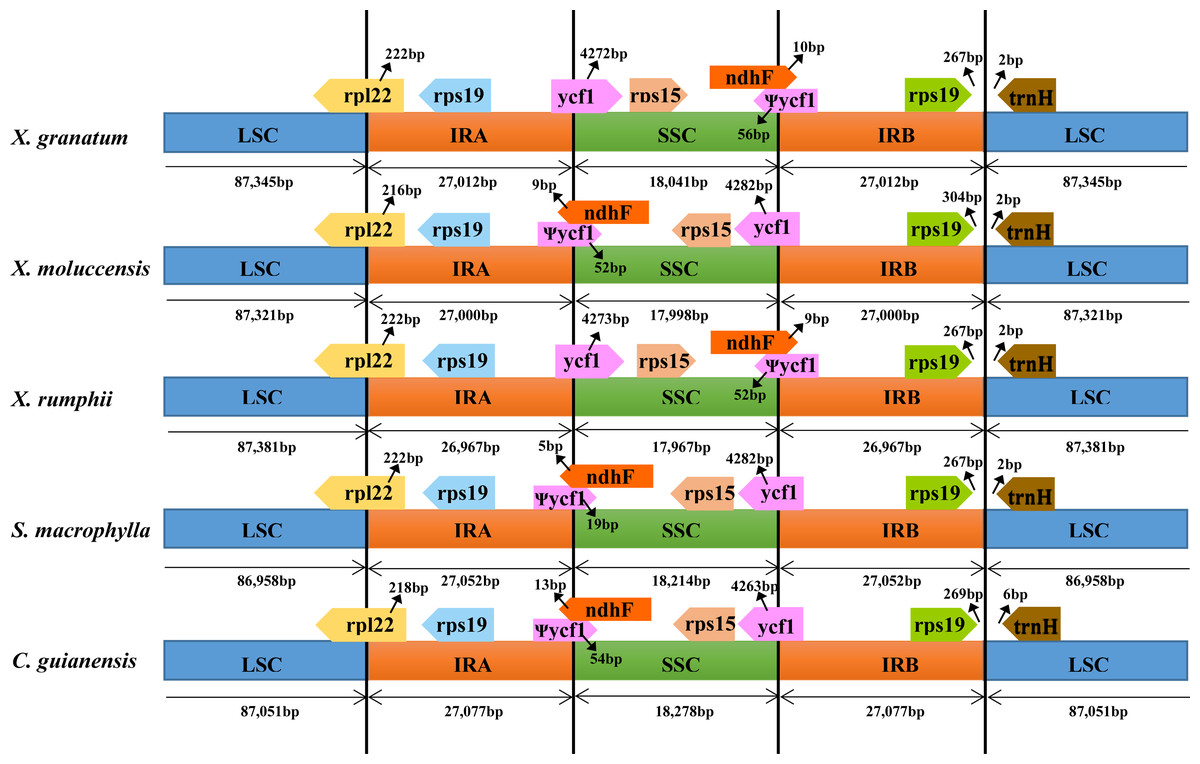
Figure 4: Comparison of large single-copy (LSC), small single-copy (SSC), and inverted repeat (IR) border regions among the chloroplast genomes of five Meliaceae species and one closely related species.
Five Meliaceae species: Xylocarpus granatum, Xylocarpus moluccensis, Xylocarpus rumphii, Swietenia macrophylla, Carapa guianensis, one closely related species: Ailanthus altissima in Simaroubaceae.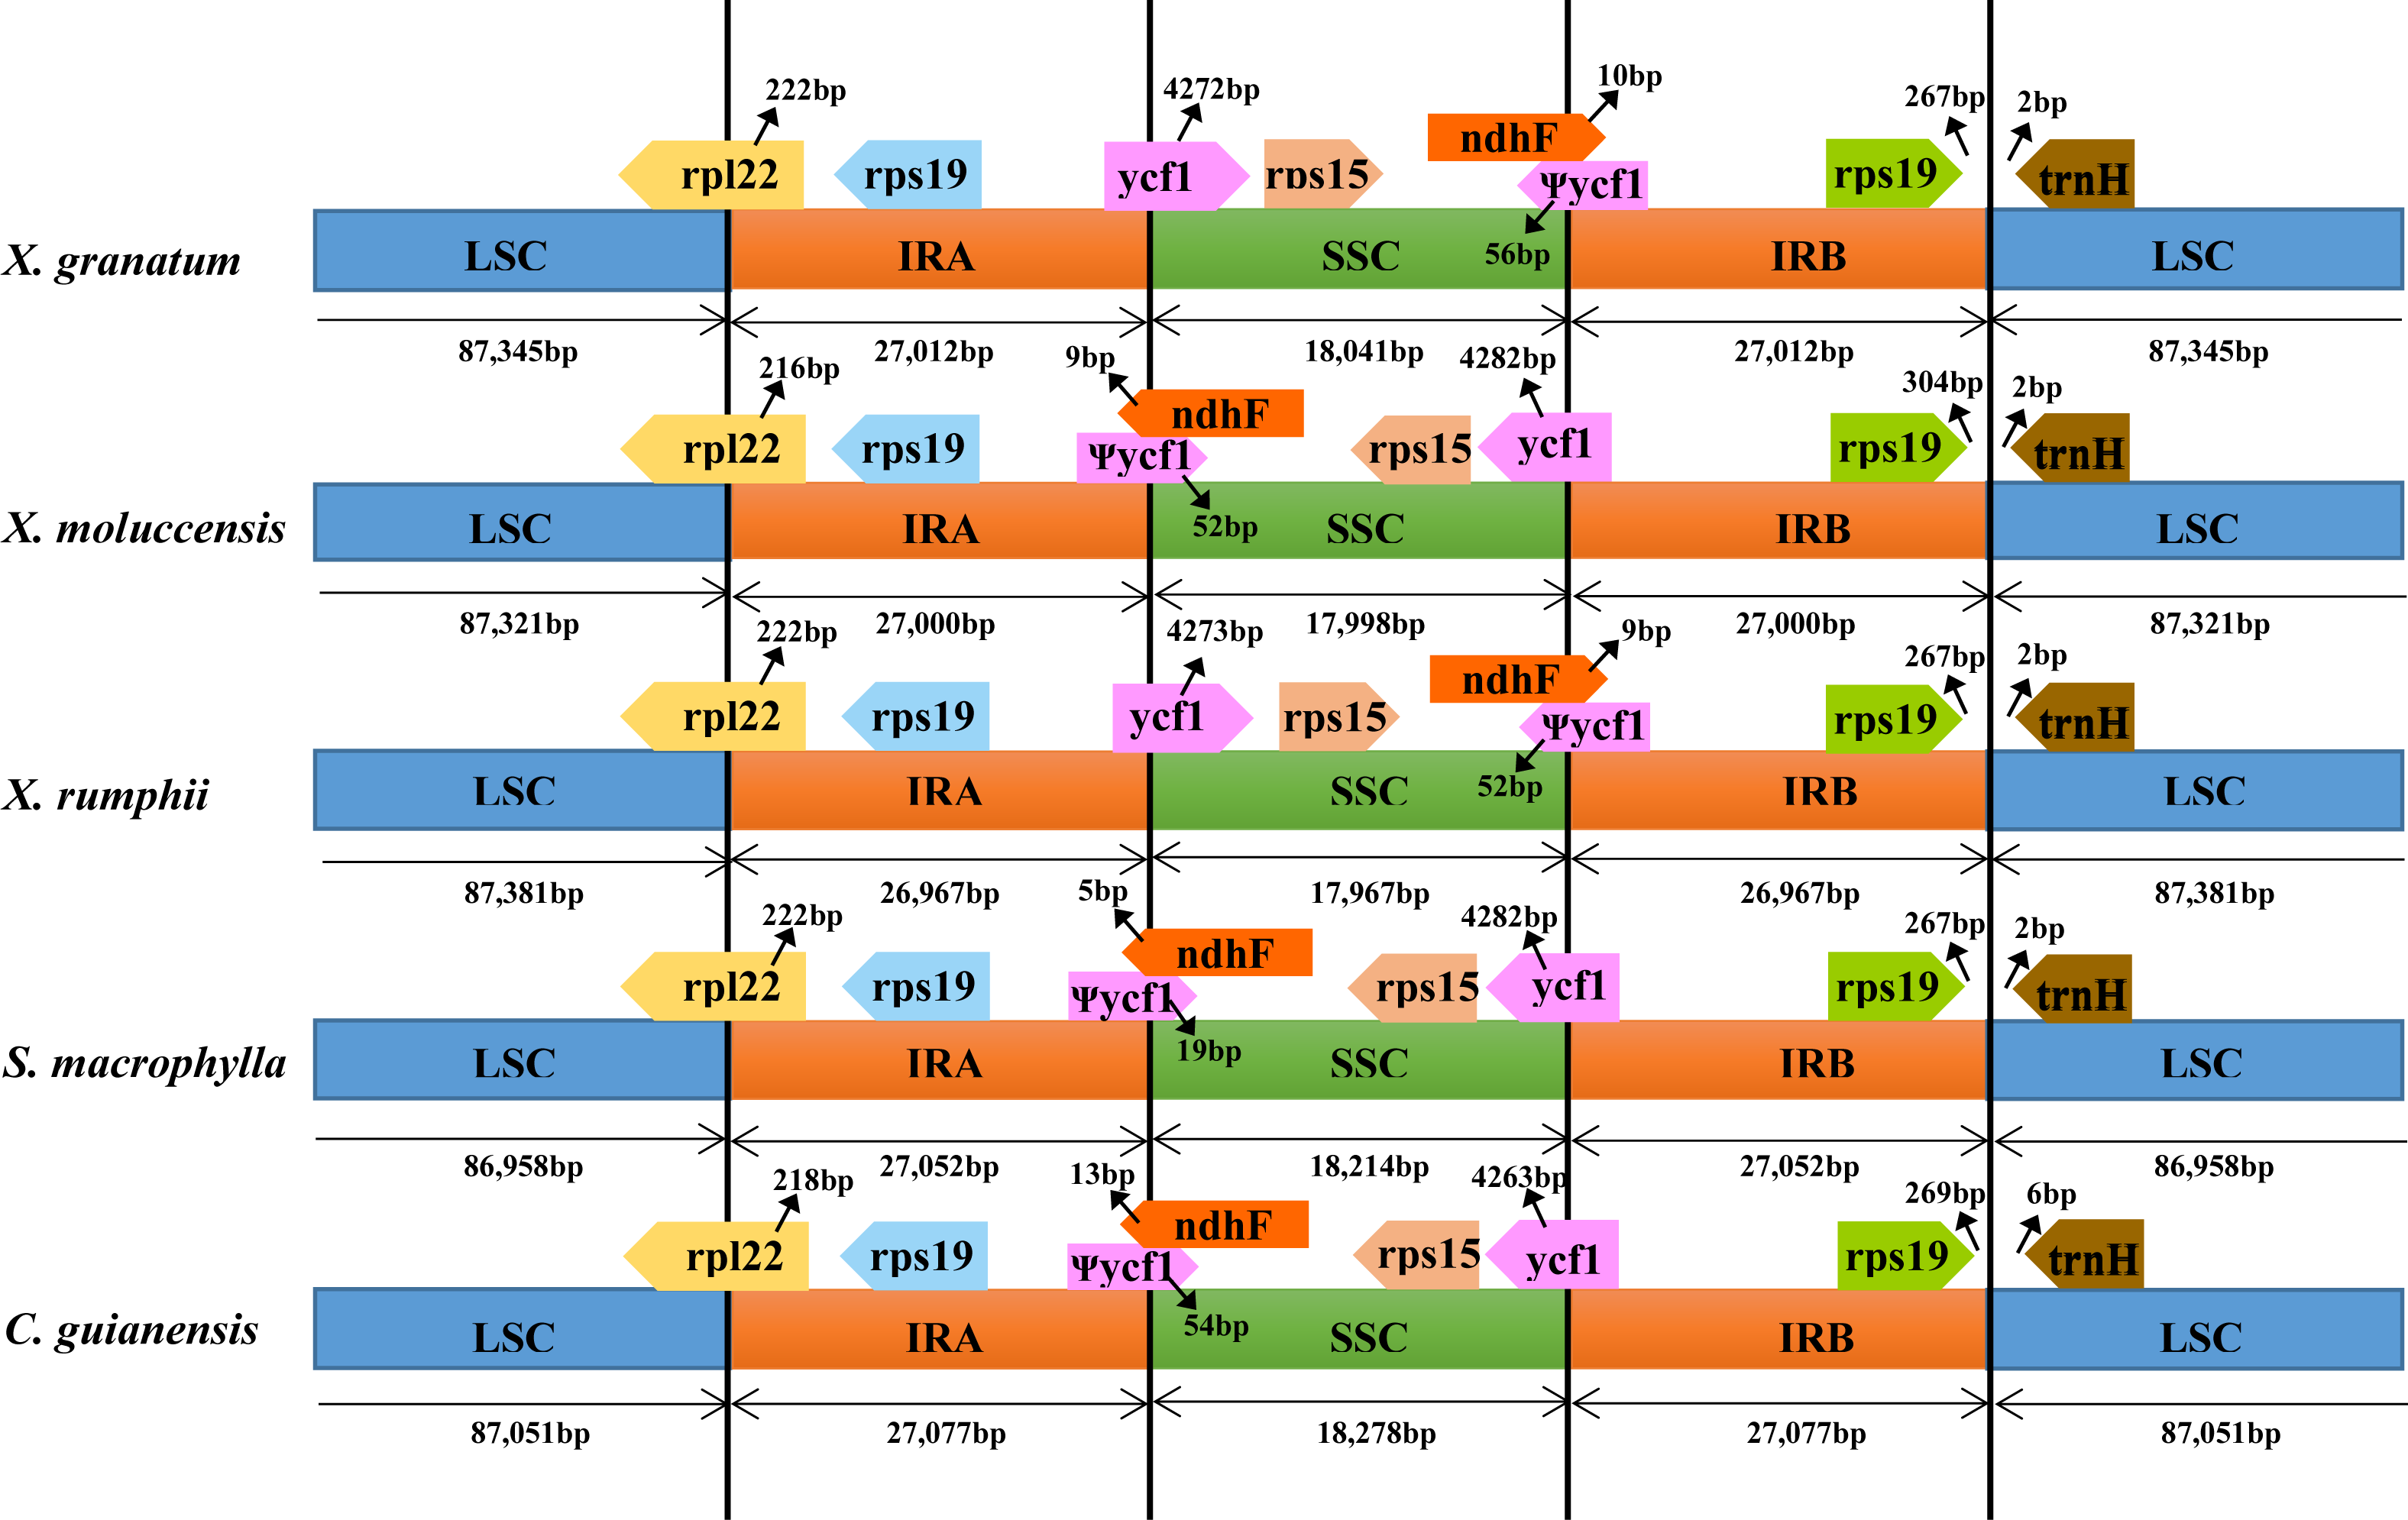
Genome-wide sequence variations and positive selection test
The analysis of genome divergence level between the five study species revealed that the sequences were highly conserved with only a few divergences in some regions (Fig. 5). The differences were mainly distributed in the LSC and SSC regions. One divergent hotspot in the LSC region (trnK-UUU - atpA) was shown with a red line in Fig. 5. Non-coding regions exhibited higher variability compared to that observed in the coding regions. Only three genes showed >3% variability in the coding regions with variability ranging from 3.90% between X. granatum and C. guianensis in trnH-GUG, 3.49% between X. granatum and X. moluccensis in rpl22, 3.09% between X. granatum and C. guianensis, and 3.14% between X. granatum and S. macrophylla in rpl32. On the other hand, four non-coding regions showed more than 4% variability: 4.24% between X. granatum and S. macrophylla in trnK-UUU—rps16, 7.27% between X. granatum and C. guianensis in atpA - atpF, 4.28% between X. granatum and S. macrophylla in psbB - psbT, and 4.35% between X. granatum and C. guianensis in ccsA-ndhD (Fig. 6, Table S7).
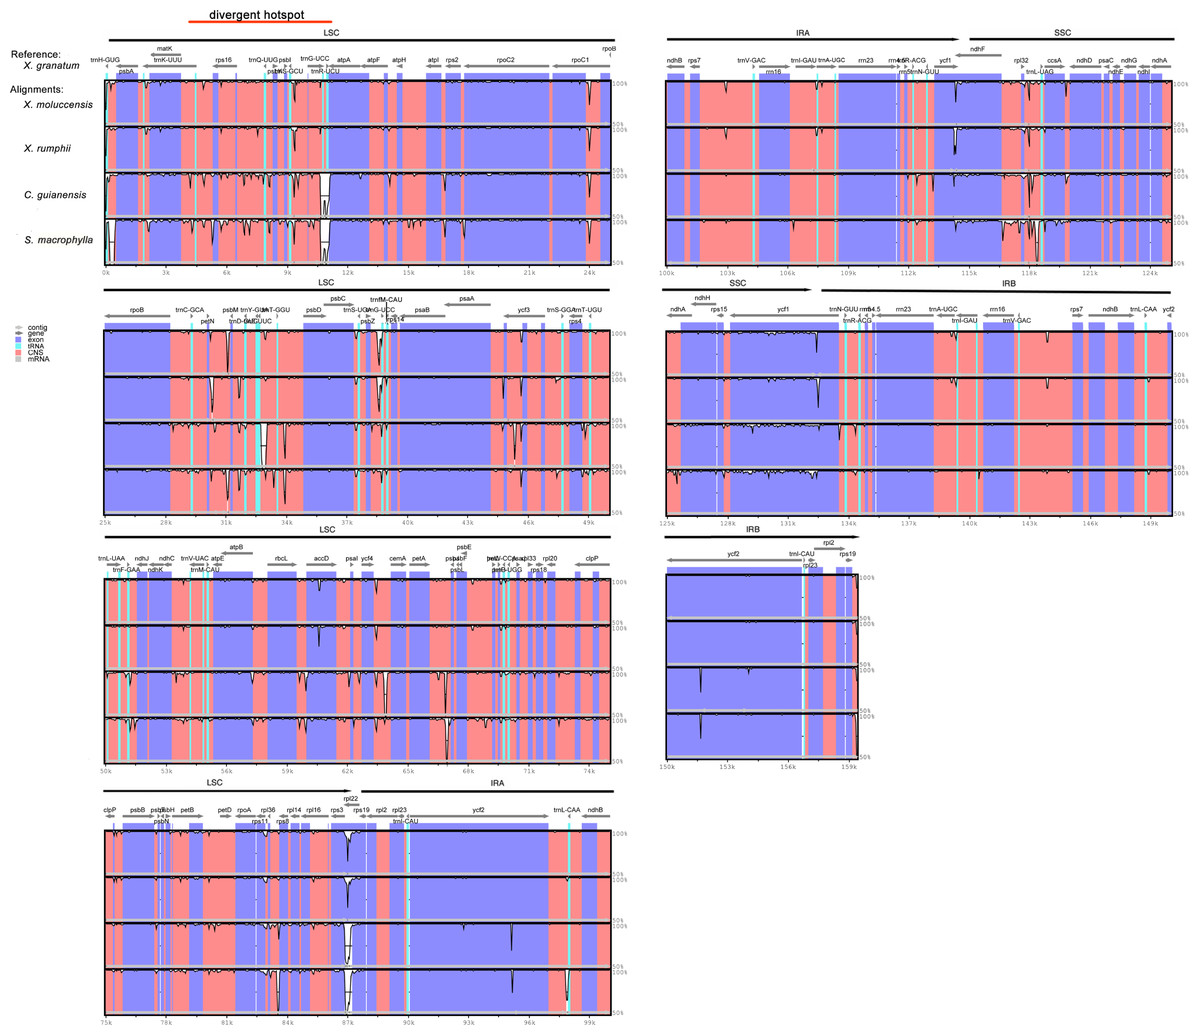
Figure 5: Visualization of complete chloroplast genome alignments of five Meliaceae species using Xylocarpus granatum as a reference.
VISTA-based identity plots showing the identity between five species on y-axis (between 50%–100%). X-axis showed the consensus sequences location of chloroplast genomes. Different colors represented different regions: protein coding genes (exon): purple, conserved noncoding sequences (CNS): red, tRNA coding regions (tRNA): blue.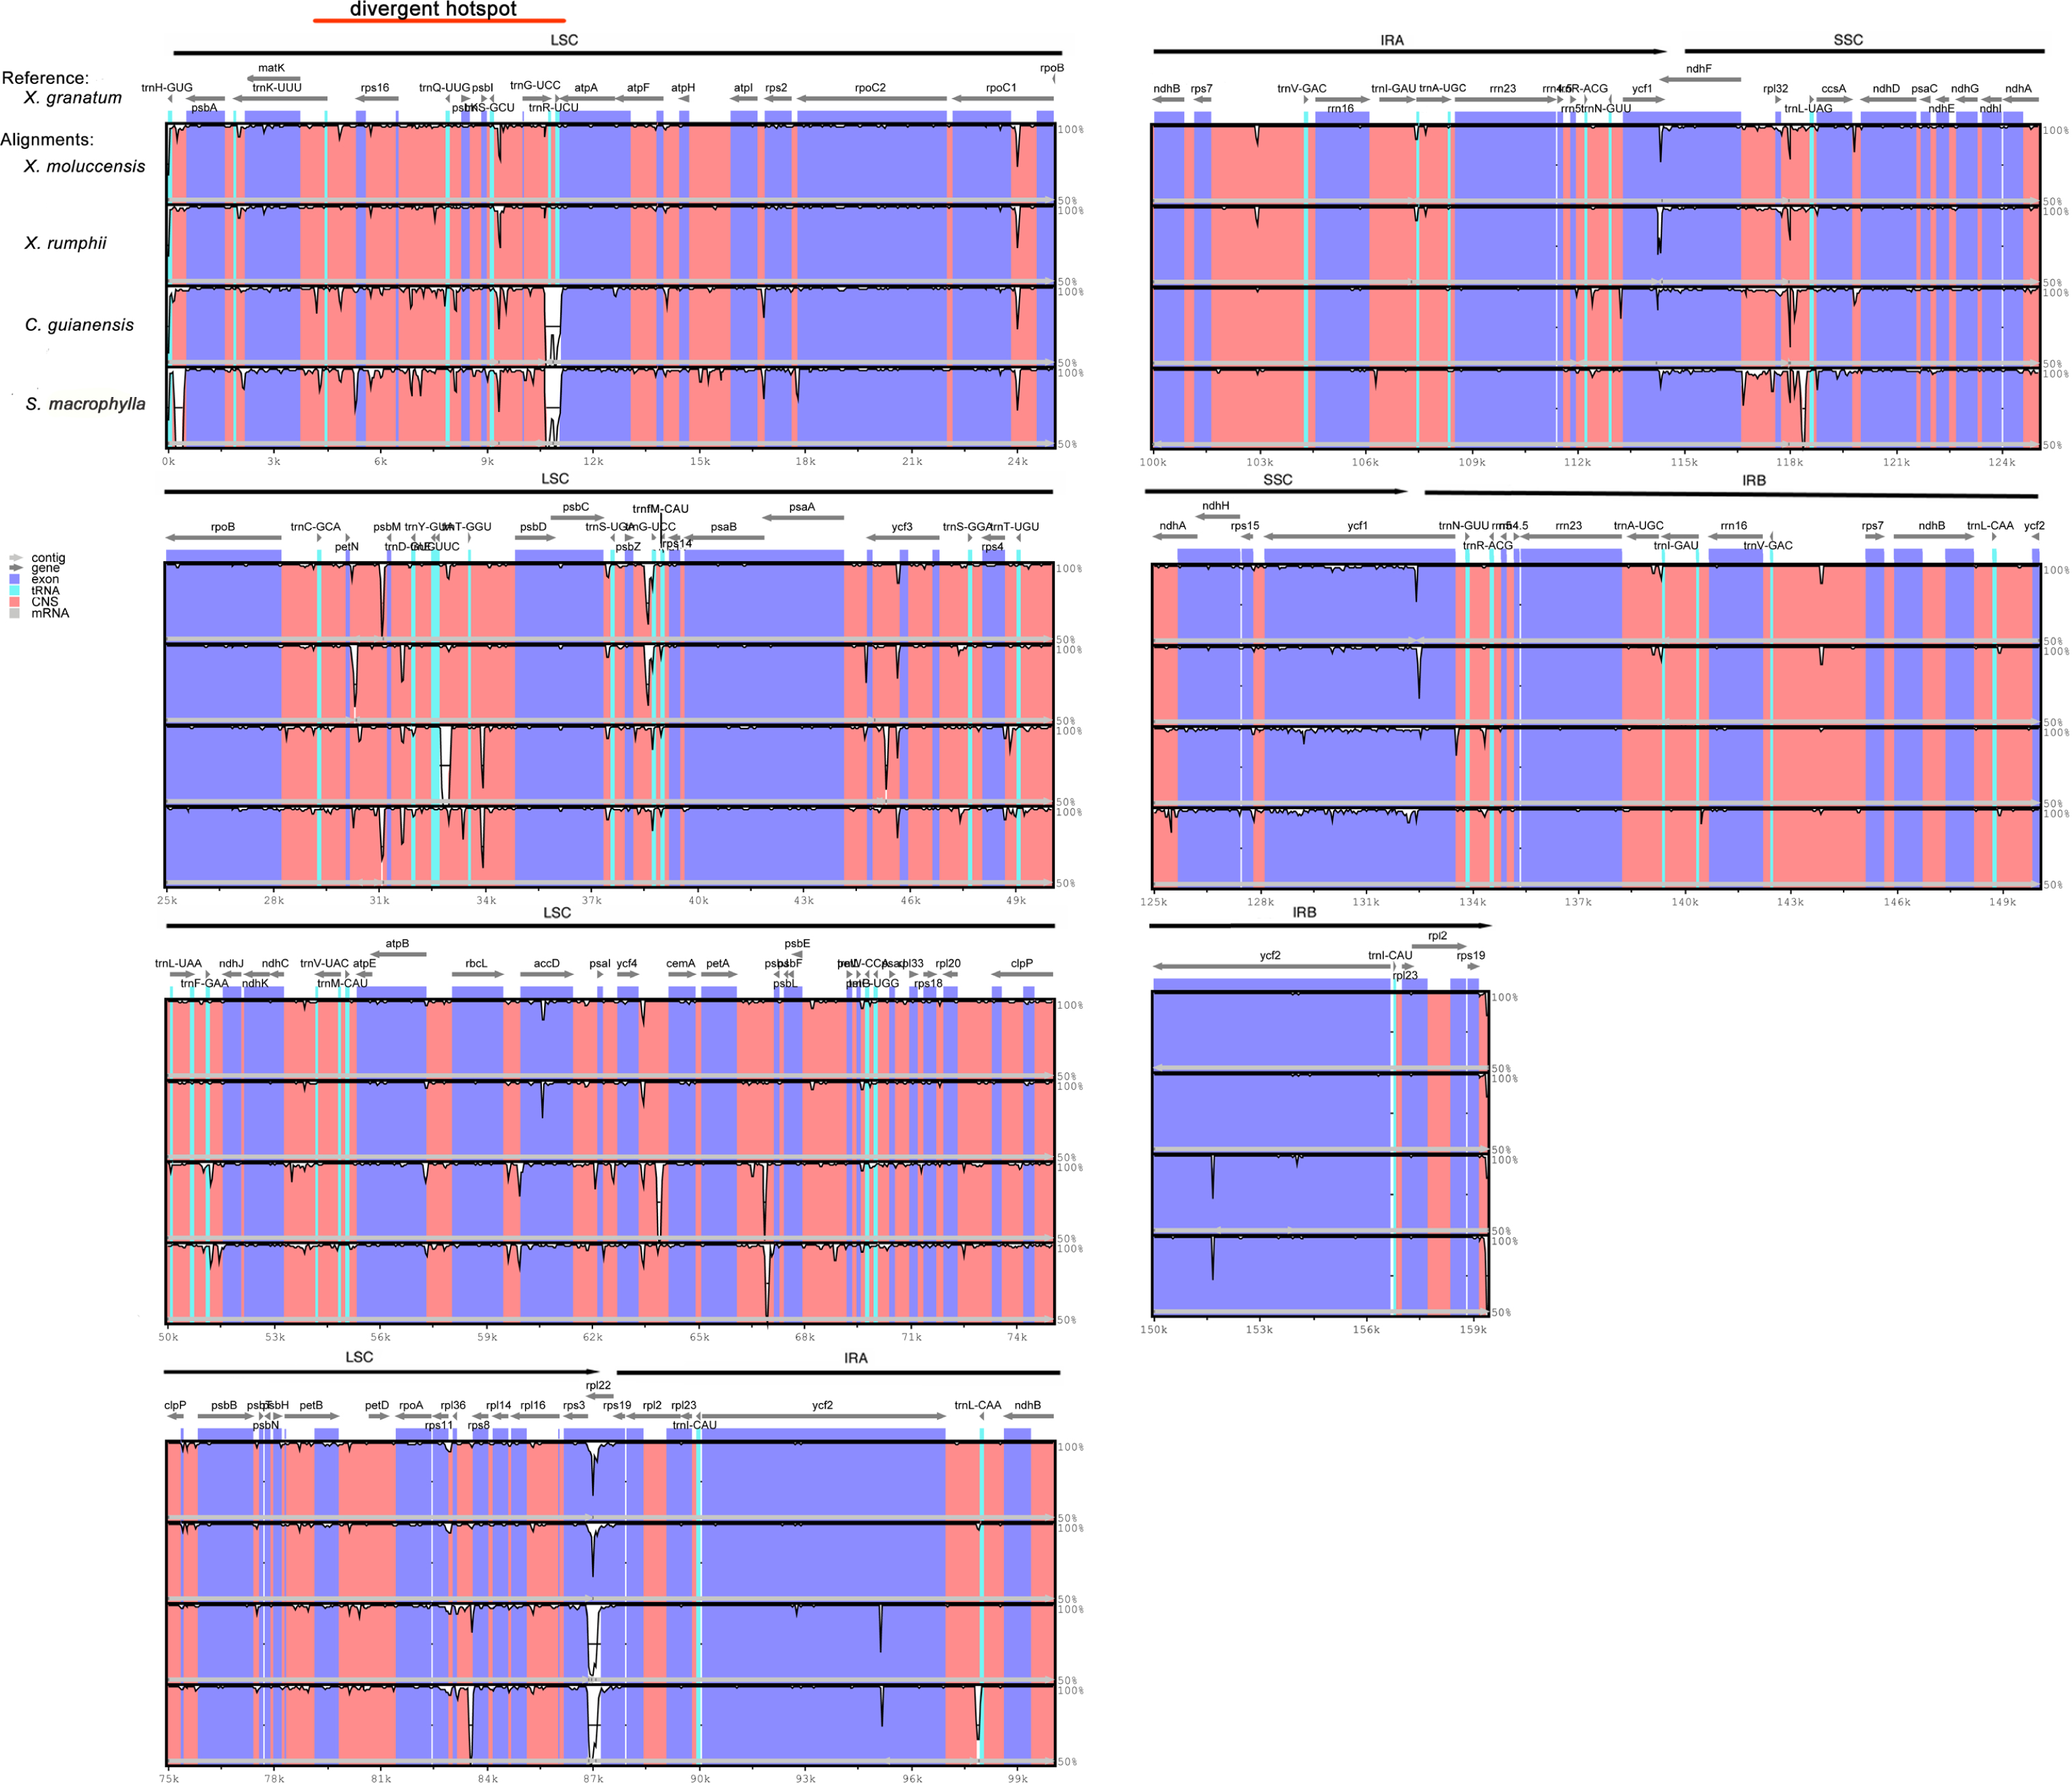
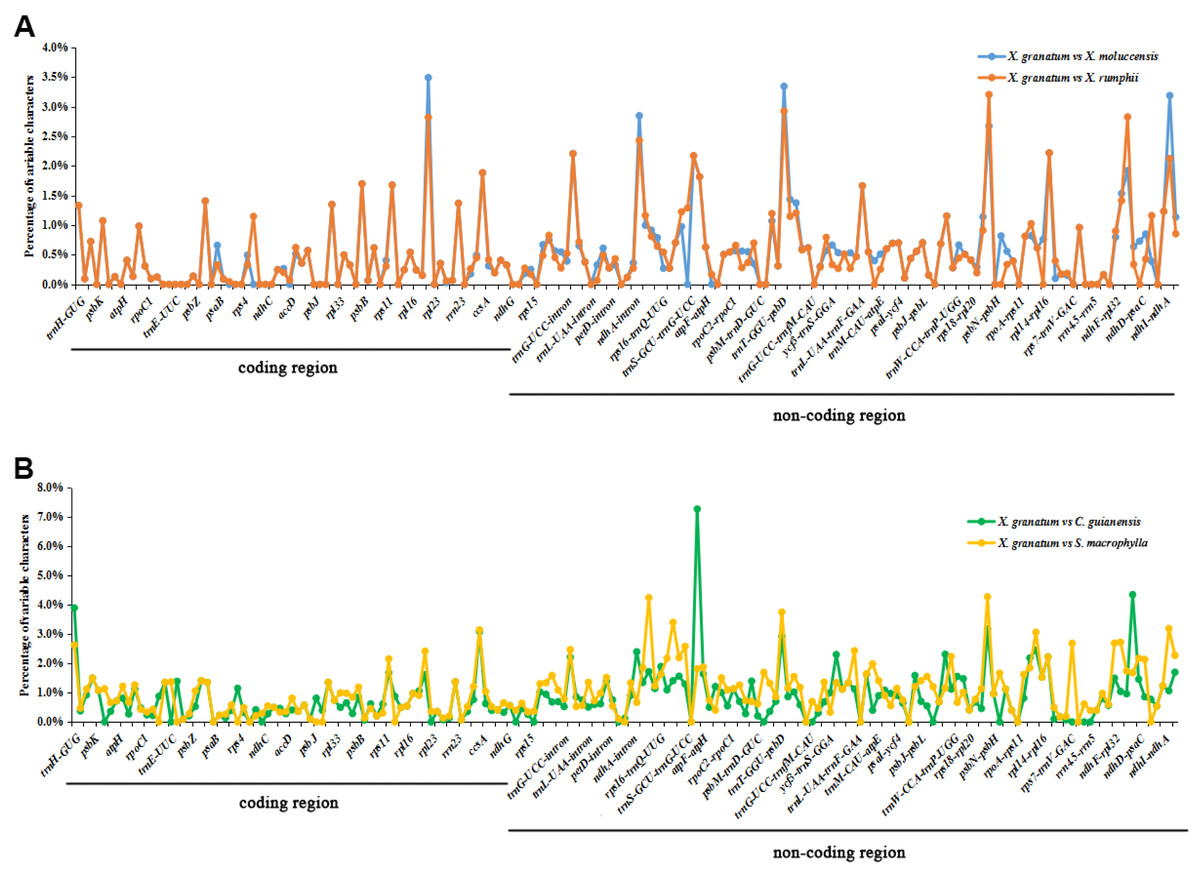
Figure 6: Percentages of variable characters in aligned regions between five Meliaceae species chloroplast genomes using Xylocarpus granatum as a reference.
(A) Variation between X. granatum and two mangrove species (Xylocarpus moluccensis and Xylocarpus rumphii), (B) variation between X. granatum and two non-mangrove species (Carapa guianensis and Swietenia macrophylla).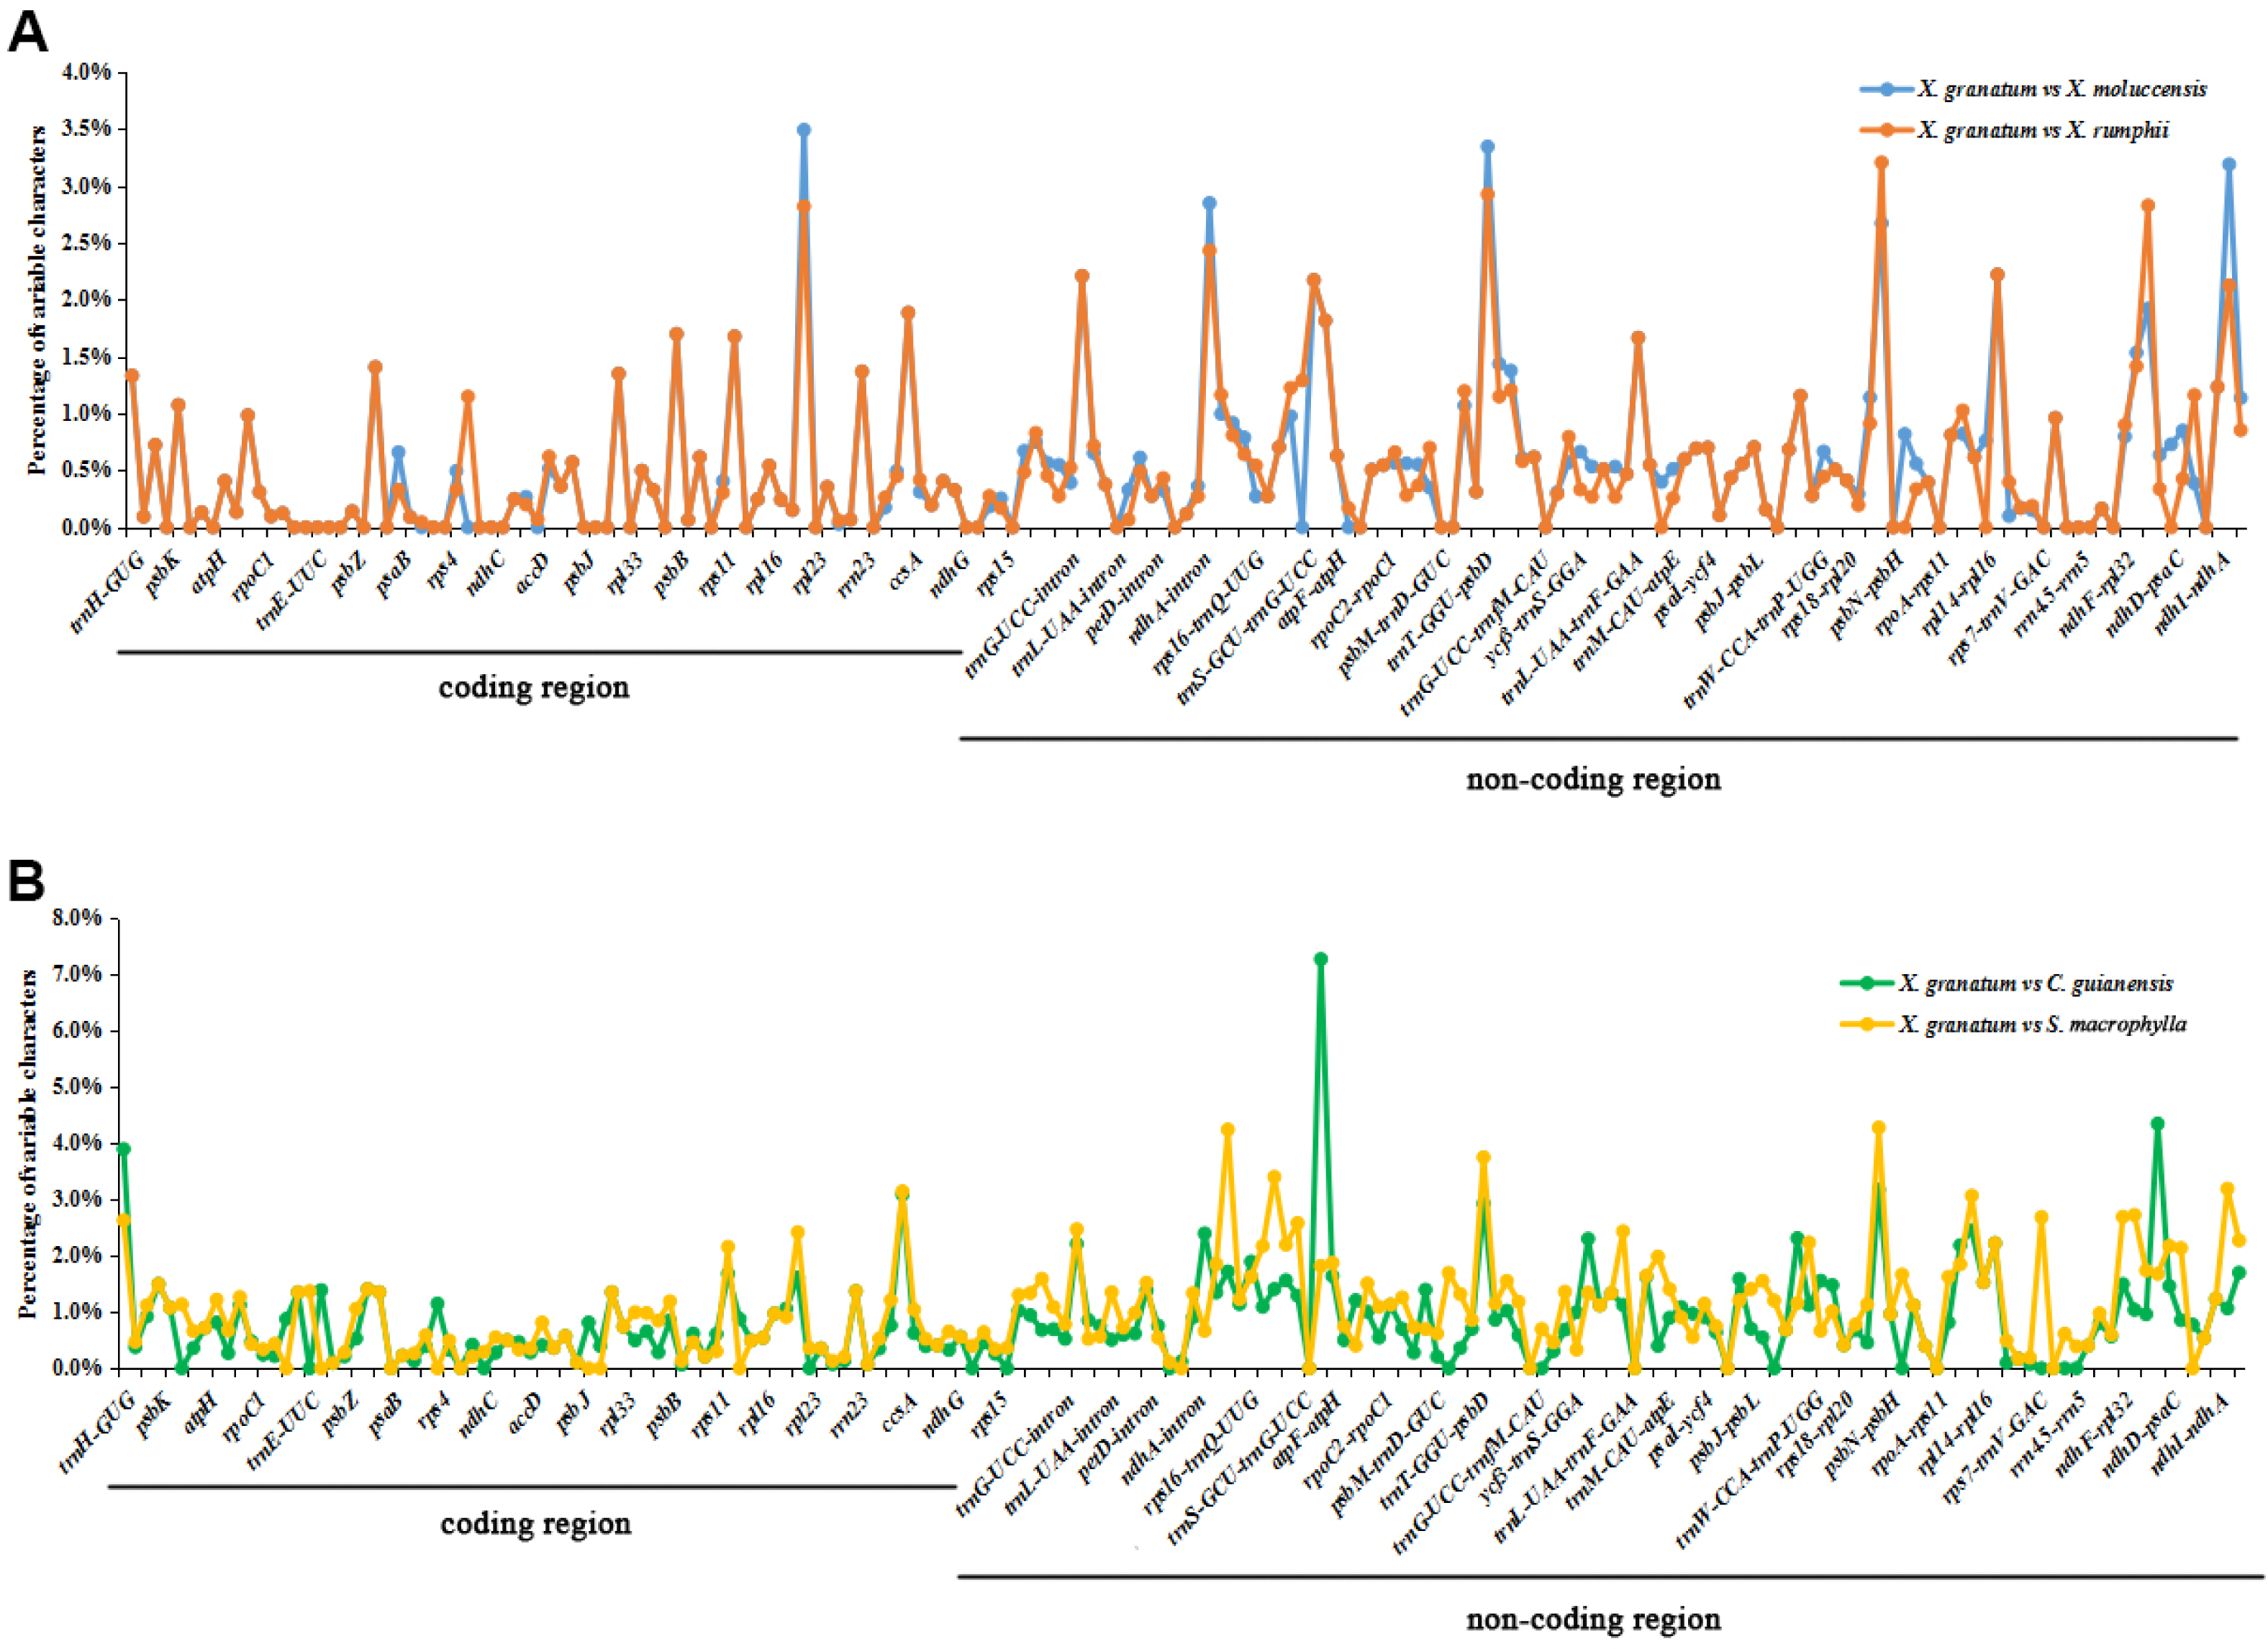
Analysis of the relative evolution rate revealed that only two genes (accD and clpP) showed positive selection between the three Xylocarpus species (Table S8). X. granatum vs. X. moluccensis showed ω = 1.1667 and ω = 7.0625 in accD and clpP, respectively. X. granatum vs. X. rumphii showed similar result with ω = 1.3333 and ω = 7.0625 in accD and clpP, respectively. Notably, all pairwise genes of X. moluccensis vs. X. rumphii showed ω<1.
Codon usage frequency and putative RNA editing sites analysis
All 85 protein coding genes were extracted and then combined into consecutive protein-coding genes for each of the five species (lengths varied from 21,554 to 21,706) (Table S9). Analysis of the codon usage frequency and relative synonymous codon usage of the five species revealed that all species allocated a similar share of the amino acids (Fig. 7, Table S9). The most abundant amino acid was Leucine (Leu) (10.5%), followed by Isoleucine (Ile) (8.5%) and Serine (Ser) (7.4%). The amino acid Cystine (Cys) constituted the minimum proportion (1.1%) (Fig. 7). For almost all A/U-ending amino acids, relative synonymous codon usage (RSCU) values exceeded 1, while the CUA (encode Leu) and AUA (encode Ile) values were less than 1 (Table S9). Conversely, RSCU values for most of the G/C-ending amino acids were always less than 1. Two amino acids, namely Threonine (Trp) and Methionine (Met), showed no codon bias.
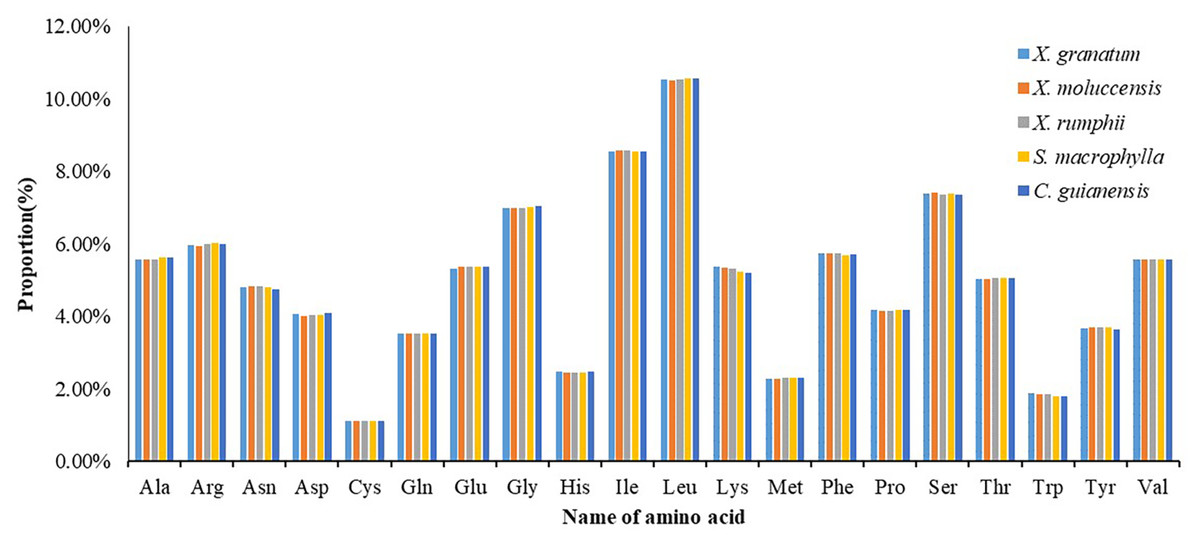
Figure 7: Numbers of genes under positive selection (ω > 1) among pairwise comparisons of five Meliaceae specie.
Xylocarpus granatum, Xylocarpus moluccensis, Xylocarpus rumphii, Swietenia macrophylla, Carapa guianensis.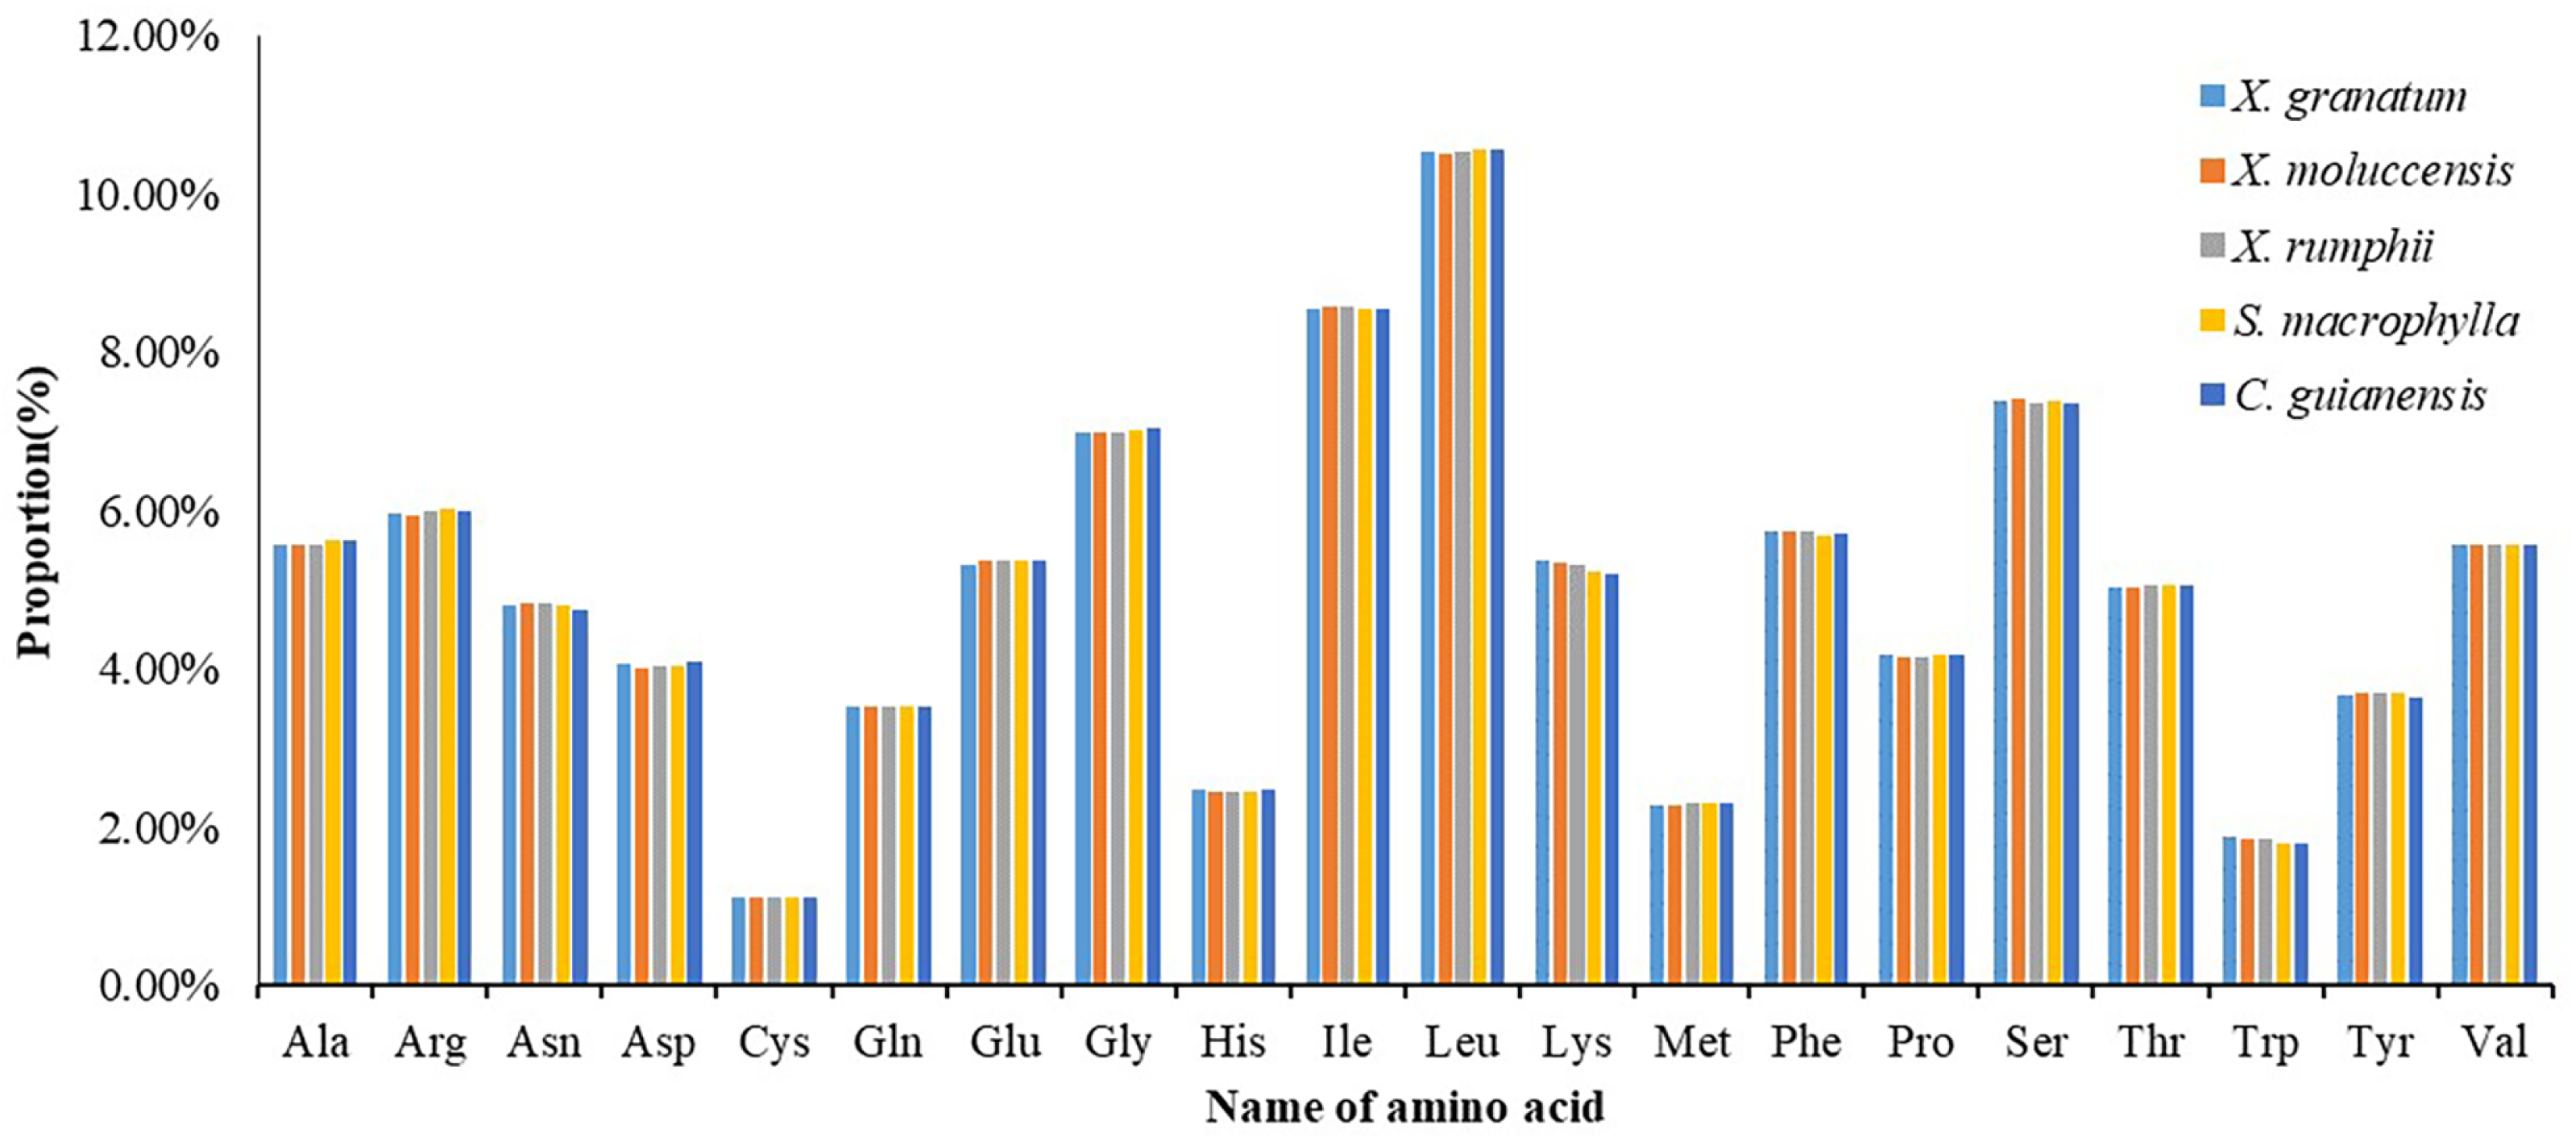
The comparative estimates of RNA prediction editing sites of the five study species were found to be similar to each other. All three species in genus Xylocarpus showed an identity prediction, implying that they were highly conserved (Table S9). Compared to the Xylocarpus species, the ndhF and rpoC2 genes lacked the GCC =>GTC sites in C. guianensis. Besides, S. macrophylla had two unique RNA editing events: one in ccsA gene: GCC =>GTC, and another in ndhF gene: CTT =>TTT. Except these disparities, all five study species were predicted with same RNA editing sites and scores. A total of 53 RNA editing sites in 20 genes were shared by the five chloroplast genomes (Table 2). Out of these 53 RNA editing sites, 40 occurred at the second position of these codons, while only 13 occurred at the first positions. No RNA editing site was found at the third position of these codons. It is notable that two genes, namely ndhB and ndhD, had 10 editing sites each (maximum number among these protein codon genes) (Table S10).
| Gene | Align collective position | Effect | Score |
|---|---|---|---|
| accD | 290 | T CG (S) =>T TG (L) | 0.8 |
| atpA | 264 | C CC (P) =>C TC (L) | 1 |
| atpB | 135 | CCA (P) =>TCA (S) | 0.86 |
| atpF | 31 | C CA (P) =>C TA (L) | 0.86 |
| clpP | 187 | CAT (H) =>TAT (Y) | 1 |
| matK | 165 | CAC (H) =>TAC (Y) | 1 |
| 196 | CAT (H) =>TAT (Y) | 0.86 | |
| 227 | CAT (H) =>TAT (Y) | 1 | |
| ndhA | 36 | C CT (P) =>C TT (L) | 1 |
| 114 | T CA (S) =>T TA (L) | 1 | |
| 189 | T CA (S) =>T TA (L) | 1 | |
| 358 | T CC (S) =>T TC (F) | 1 | |
| ndhB | 50 | T CA (S) =>T TA (L) | 1 |
| 156 | C CA (P) =>C TA (L) | 1 | |
| 196 | CAT (H) =>TAT (Y) | 1 | |
| 204 | T CA (S) =>T TA (L) | 0.8 | |
| 246 | C CA (P) =>C TA (L) | 1 | |
| 249 | T CT (S) =>T TT (F) | 1 | |
| 277 | T CA (S) =>T TA (L) | 1 | |
| 279 | T CA (S) =>T TA (L) | 1 | |
| 419 | CAT (H) =>TAT (Y) | 1 | |
| 494 | C CA (P) =>C TA (L) | 1 | |
| ndhD | 10 | A CG (T) =>A TG (M) | 1 |
| 114 | CGG (R) =>TGG (W) | 0.8 | |
| 137 | C CA (P) =>C TA (L) | 1 | |
| 234 | T CA (S) =>T TA (L) | 1 | |
| 302 | T CA (S) =>T TA (L) | 1 | |
| 305 | C CT (P) =>C TT (L) | 1 | |
| 368 | G CT (A) =>G TT (V) | 1 | |
| 442 | T CA (S) =>T TA (L) | 0.8 | |
| 446 | T CA (S) =>T TA (L) | 0.8 | |
| 478 | CTT (L) =>TTT (F) | 0.8 | |
| ndhF | 347 | A CT (T) =>A TT (I) | 1 |
| 648 | G CT (A) =>G TT (V) | 0.8 | |
| ndhG | 56 | CAT (H) =>TAT (Y) | 0.8 |
| 107 | A CA (T) =>A TA (I) | 0.8 | |
| psbF | 26 | T CT (S) =>T TT (F) | 1 |
| rpl20 | 103 | T CA (S) =>T TA (L) | 0.86 |
| rpoA | 279 | T CA (S) =>T TA (L) | 1 |
| rpoB | 113 | T CT (S) =>T TT (F) | 1 |
| 185 | T CA (S) =>T TA (L) | 1 | |
| 190 | T CG (S) =>T TG (L) | 1 | |
| 662 | G CT (A) =>G TT (V) | 0.86 | |
| 827 | T CA (S) =>T TA (L) | 0.86 | |
| rpoC1 | 21 | T CA (S) =>T TA (L) | 1 |
| rpoC2 | 584 | CAT (H) =>TAT (Y) | 0.86 |
| 862 | A CT (T) =>A TT (I) | 1 | |
| 959 | CGG (R) =>TGG (W) | 1 | |
| 1288 | CTT (L) =>TTT (F) | 0.86 | |
| rps14 | 27 | T CA (S) =>T TA (L) | 1 |
| 53 | T CA (S) =>T TA (L) | 1 | |
| rps16 | 71 | T CA (S) =>T TA (L) | 0.83 |
| rps2 | 83 | T CA (S) =>T TA (L) | 1 |
Phylogenetic analysis
Identical phylogenetic positions of the five study species were obtained from maximum likelihood (ML) and Bayesian inference (BI) methods. Each of the 22 species from six families of the order Sapindales clustered within their own families and each clade was highly supported by both phylogenetic analysis methods. Majority of the nodes in the ML tree were well supported with bootstrap value higher than 95%, except the most recent common ancestor (MRCA) of Burseraceae, namely Anacardiaceae and Sapindaceae. In BI tree, each node was supported with posterior probability of 1. In both phylogenetic trees, three Xylocarpus species were clustered together, X. moluccensis and X. rumphii clustered as one clade, while X. granatum was sister to this clade (Fig. 8). The Xylocarpus species clade formed cluster with C. guianensis. Swietenia macrophylla was found to be the sister branch of Khaya senegalensis with 100% bootstrap support and clustered with the Xylocarpus and Carapa clade. The topologies in genus level were consistent with the previous research (Lin et al., 2018). In addition, the Meliaceae clade was sister to the clade of two families, namely Simaroubaceae and Rutaceae.
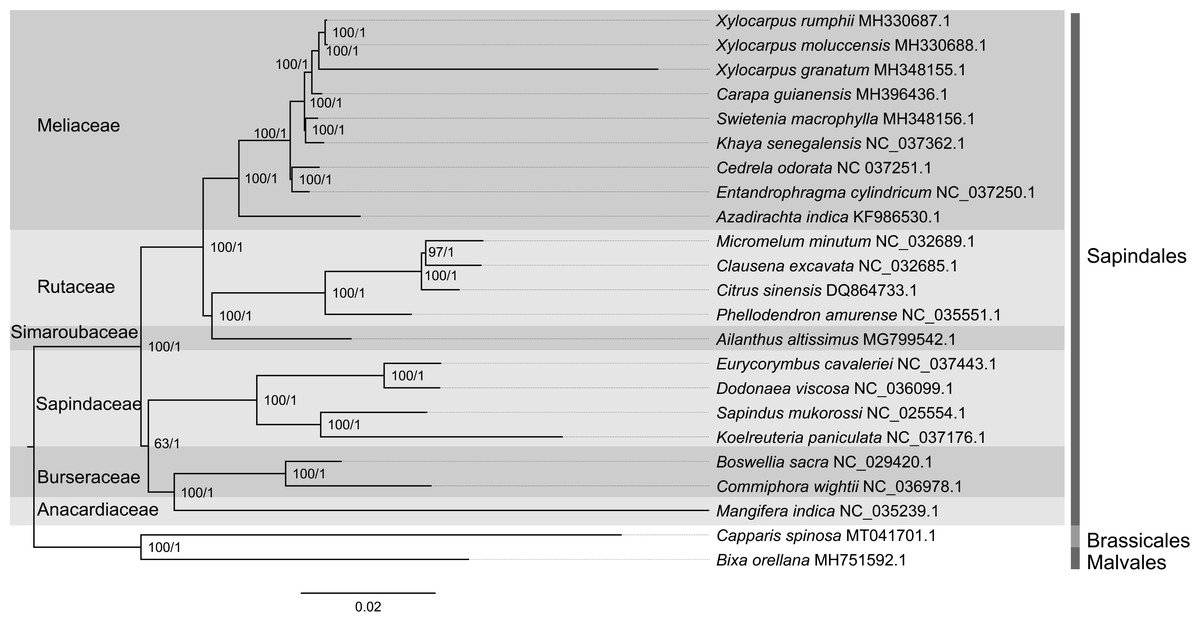
Figure 8: Phylogenetic relationship of 21 species in the order Sapindales and two outgroup species based on whole chloroplast genomes.
Support values are showed at each node: the former is maximum likelihood bootstrap and the latter is Bayesian inference posterior probability.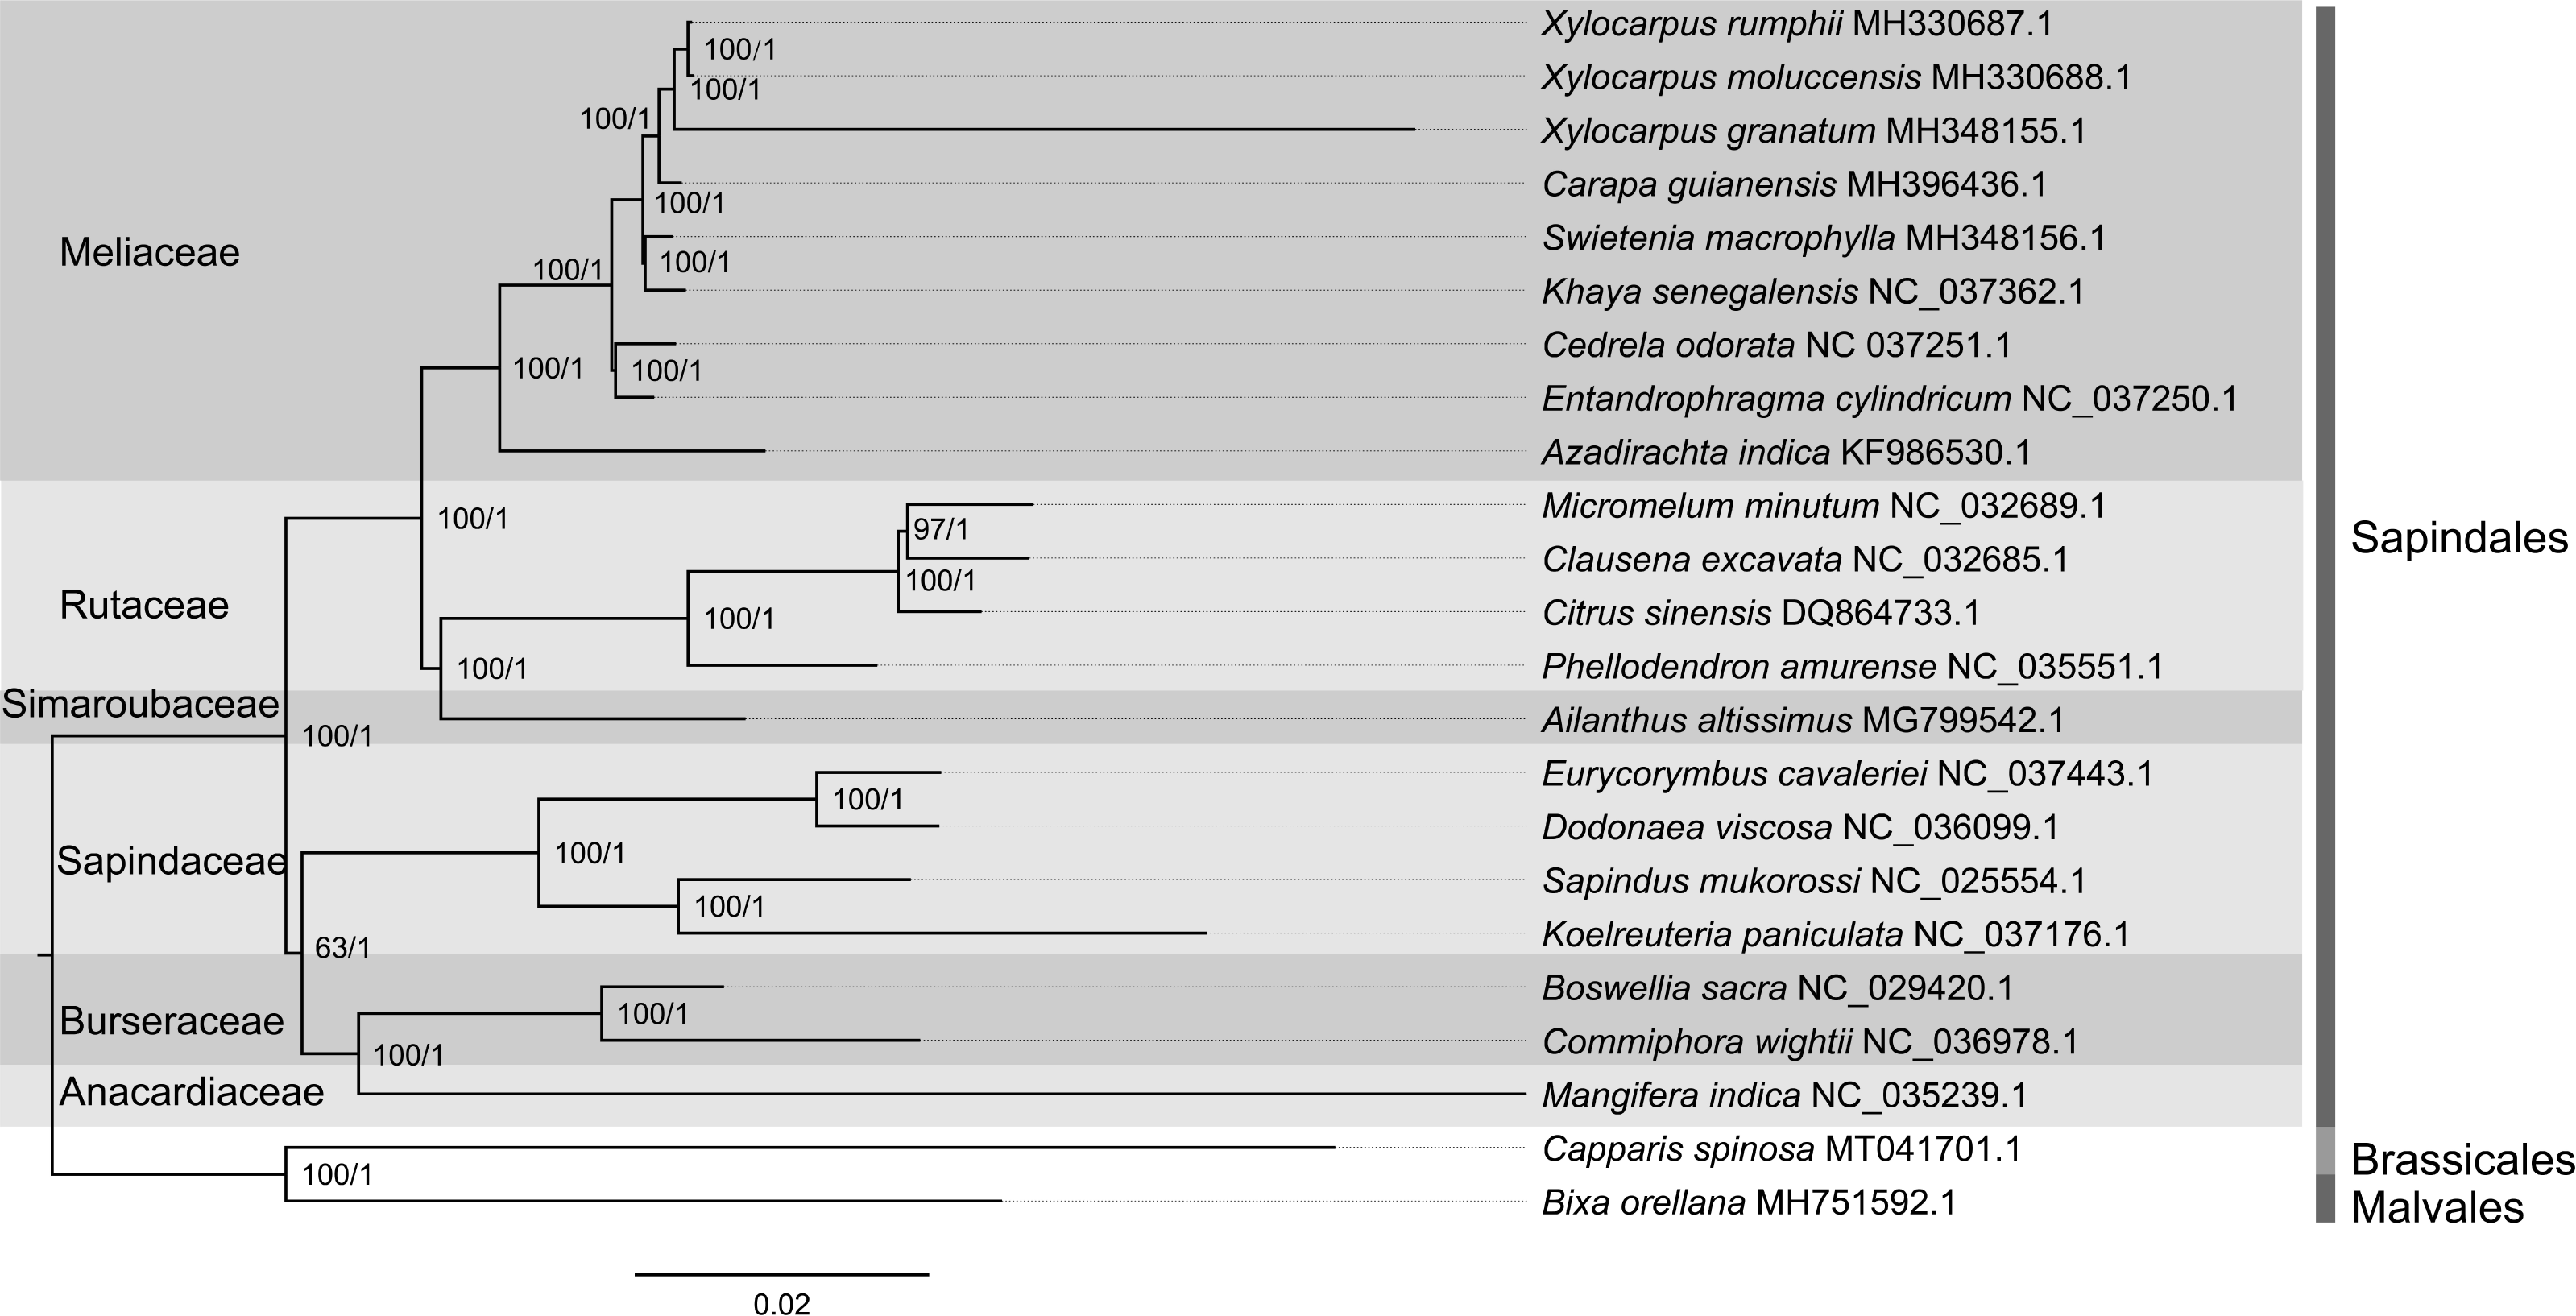
Discussion
This is the first study which reported the whole chloroplast genome sequences of three Xylocarpus species, including the rare non-mangrove species X. rumphii and two true mangrove species. In addition, the study also reported the genome sequences of two closely related non-mangrove species of Xylocarpus, among which S. macrophylla is considered as a vulnerable species (https://www.iucnredlist.org/species/32293/9688025; accessed on 12 April 2023). Our study, therefore, adds novel information to the whole genome sequences of the order Sapindales and family Meliaceae.
Analysis of the interspecific variation in chloroplast genome sequences revealed that the five Meliaceae species showed similarity in GC contents and gene features. All genes shared identical direction and order, with only a few variations in intergenic spacer sequences. The chloroplast genomes in Meliaceae were highly conserved and no obvious contraction or expansion were found in IR borders.
Intraspecific variation based on repeat sequences
While the GC contents and gene features showed the conservatism of chloroplast genomes in Meliaceae, the distribution pattern of repeat sequences explained the divergence of Xylocarpus from the other two species and between the three Xylocarpus species themselves. Our study identified presence of three repetitive sequences across five Meliaceae species. Based on the similar proportion of repeats among the three species of Xylocarpus, high similarity of chloroplast genomes among these species became evident.
However, X. granatum was found to have the highest number of repeats in rpl22, while only two repeats and one repeat were found in X. moluccensis and X. rumphii, respectively. No repeats were observed in C. guianensis and S. macrophylla. It has been reported that rpl22 gene was more likely to be transferred to nuclear genome from chloroplast genome (Gantt et al., 1991), which could increase genomic variation and diversity and consequently, enhance the adaptability of a species to adverse environmental conditions. Comparing the niche width (i.e., a metric to ascertain the adaptability of species to tolerate environmental conditions) between 29 species from the mangrove ecosystem of the Bhitarkanika sanctuary (Odisha, India), Upadhyay & Mishra (2014) showed that X. granatum had larger niche width (2.15) than X. moluccensis (1.15). The existence of more repetitive sequences in rpl 22, therefore, might explain the wide distribution of X. granatum, compared to the other two Xylocarpus species, and might also account for the divergence between X. granatum and other four Meliaceae species (two Xylocarpus species and two non-mangrove species) studied here.
Finally, we observed similar repeat sequences in acc D in X. moluccensis and X. rumphii. The gene acc D is associated with leaf form and photosynthetic efficiency, since presence of acc D in plastids promotes gene expression in light-harvesting organs (Kode et al., 2005). Similar repeat sequences in this gene in X. moluccensis and X. rumphii may cause similar leaf appearances in these two species (Li, Su & Wang, 2018). Overall, our findings provided strong support to the previous studies which indicated that repeat sequences may play an important role in rearranging and recombination of chloroplast genomes (Asano et al., 2004; Zeng et al., 2017). The phylogenetic analysis also revealed clustering of the five study species into three clades (one Xylocarpus clade and other two relative clades) with the relationship between X. moluccensis and X. rumphii being closer than X. granatum.
In addition to providing insights into the divergence pattern of the five species of Meliaceae, the repeat sequences, especially the simple sequence repeats (SSRs), provided powerful genetic resources for investigating population diversity. In this study, we identified 467 SSR loci, most of which showed polymorphisms among the five study species. These loci, therefore, could act as molecular markers for investigating population genetics and biogeography in Meliaceae family. The advantage of using cpDNA SSR marker is that it allows for the detection of population genetic structure and gene flow at the maternal level, which may be informative for understanding the demographic history and evolutionary relationships of these species. Moreover, in terms of feasibility, the use of cpDNA SSR markers, or cpDNA markers as a whole, is relatively straightforward and cost-effective, as it requires amplification and sequencing of a single locus. However, using only one marker may not provide a complete picture of the population genetics of a species or group, as different markers may capture different aspects of genetic diversity and evolutionary history.
Intraspecific variation based on coding and non-coding regions
The analysis of genome divergence revealed >3% variability in the coding regions and >4% variability in four non-coding regions between X. granatum and other four Meliaceae species (two Xylocarpus species and two non-mangrove species) studied here. Two out of three coding genes, namely rpl22 and rpl32, are associated with the large subunit of ribosome. Previous studies have identified that ribosomal proteins of the large subunit 22 and 23 are essential under heterotrophic conditions (Fleischmann et al., 2011). This genomic divergence pattern may explain the enhanced adaptability of X. granatum to a wide range of environmental conditions. In addition, these gene spacer regions can be used as genetic markers in future phylogenetic and molecular taxonomy studies of mangrove species.
A number of genes under positive selection were also identified in this study which highlighted the evolutionary aspects of these species. Among these genes, notable was the clpP gene, which showed a positive ω value for all three Xylocarpus species. Earlier studies reported that ATP-dependent Clp protease is essential for acclimation to different stress factors like temperature, radiation and salinity (Ostersetzer & Adam, 1996; Porankiewicz, Schelin & Clarke, 1998; Porankiewicz, Wang & Clarke, 1999; Zheng et al., 2002). A previous study based on near-chromosome-scale genome analysis also revealed signals of positive selection in genes related to salt tolerance and root development in the three species of Xylocarpus (Guo et al., 2022). Our finding, therefore, might explain the wide adaptability of the Xylocarpus species to tropics and subtropical coastal zone habitats, which are continuously subjected to physiological stresses caused by fluctuating environmental conditions (e.g., inundation, sudden alteration of salinity and temperature levels) (Fusi et al., 2022).
In coding sequences of the five study species, the usage frequencies of the most A/U-ending amino acids were higher than that of the G/C-ending amino acids. In addition, all the putative editing sites were C-to-U transitions, and majority of these sites were found to be situated in the second positions of these codons. These findings provide evidence of certain biasness in codon editing of chloroplast genomes. Our codon usage frequency results are consistent with previous studies, which showed the similar amino acids distribution among coding sequences of Sapindales members (e.g., Saina et al., 2018).
Most editing sites variation may convert the original amino acids to hydrophobic amino acids, which may be conducive to the formation of protein stable structure and provided a certain basis for the plants in adapting to the environment. The number of editing sites of ndhB and ndhD genes was found to be maximum in all five Meliaceae species, which might be because they participate in multiple biological processes, and their expression and regulatory activity were stronger than others. In coding sequences of the five Meliaceae species, the most abundant amino acid was Leu, a plant growth promoter having photosynthetic and regulating effect. In addition, differences in editing sites were found between the three Xylocarpus species and the two non-mangrove species (C. guianensis and S. macrophylla), which might contribute to the divergence between the mangrove and non-mangrove species of Meliaceae.
Phylogenetic analysis
The two phylogenetic analysis methods (ML and BI) revealed identical topological structure. Interestingly, the phylogenetic tree showed closer relationship of the mangrove species X. moluccensis to the non-mangrove species X. rumphii, rather than another mangrove species X. granatum. This finding is in line with the previous phylogenetic pattern based on specific cpDNA and nDNA loci sequences (Guo et al., 2018). One possible explanation could be drawn from the recently proposed pre-adaptation framework based on near-chromosome-scale genome analysis, which also revealed similar phylogenetic pattern for Xylocarpus (Guo et al., 2022). According to this framework, the common ancestor of Xylocarpus lived close to the coasts; X. granatum and X. moluccensis were subsequently adapted to the intertidal habitat due to the mangrove-specific adaptive features like preferential retention of duplicated genes and intolerance of pseudogenization, while X. rumphii retained the pre-adaptive features and were adapted to the terrestrial habitat (Guo et al., 2022). However, chloroplast genomes are more conserved than the nuclear genome and therefore, frequency of changes in chloroplast genomes are lower compared to the nuclear genomic changes. Therefore, we observed positive selection in only two genes, namely accD and clpP, showed positive selection between the three Xylocarpus species, and no genes were found under positive selection in X. moluccensis vs. X. rumphii.
Conclusions
To the best of our knowledge, this is the first study that characterized complete chloroplast genomes for five Meliaceae species and identified the intraspecific variations between genomes of two mangrove and three non-mangrove species. Based on the distribution pattern of repetitive sequences, variability in coding and non-coding regions, differences in editing sites in coding sequences and phylogenetic analysis, our study identified the divergence pattern between the three Xylocarpus species (two mangroves and one non-mangrove species) and two related non-mangrove species of Meliaceae and supported the previous observations. Our study also highlighted the importance of repetitive sequences and genes under positive selection in stress response and adaptation of the three Xylocarpus species, especially that of the X. granatum, in fluctuating environmental conditions. Finally, the polymorphic simple sequence repeats and gene regions identified in this study can act as genetic markers in future molecular taxonomy research for other members of the Meliaceae family.