
Precipitation extremes observed over and around the Taklimakan Desert, China
- Published
- Accepted
- Received
- Academic Editor
- Qiang Wang
- Subject Areas
- Natural Resource Management, Environmental Impacts
- Keywords
- Precipitation extremes, High-impact, Climate change, Taklimakan desert, Arid region
- Copyright
- © 2023 Li and Yao
- Licence
- This is an open access article distributed under the terms of the Creative Commons Attribution License, which permits using, remixing, and building upon the work non-commercially, as long as it is properly attributed. For attribution, the original author(s), title, publication source (PeerJ) and either DOI or URL of the article must be cited.
- Cite this article
- 2023. Precipitation extremes observed over and around the Taklimakan Desert, China. PeerJ 11:e15256 https://doi.org/10.7717/peerj.15256
Abstract
The Taklimakan Desert (TD) is the largest desert in China located in the Tarim Basin (TB) in China’s arid region. This study is a review of the change in precipitation and its extremes since 1961 and the high-impact extreme precipitation events in 2012–2021, particularly in 2021, with a focus on the TD along with the surrounding oases and mountainous regions.The TB has experienced significantly warmer and wetter trends since 1961, and extreme rainfall has increased significantly in the TD and its surrounding areas during the 2000s. In the TB, the year 2021 was identified as the 4th warmest for 1961–2021, and was remembered for unprecedented extreme events. Three high-impact extreme events that occurred in 2021 are highlighted, including extreme heavy rainfall over Hetian in mid-June. The earliest extreme rainfall event occurred over North Bazhou in early spring, and the strongest heavy snowfall over Baicheng in April. In addition, we also discussed the underlying physical mechanisms of extreme events over the TB and proposed novel perspectives and unresolved questions on the sciences of heavy rainfall in arid regions. Our results provide a reference for the physical mechanism, attribution, and high-resolution modeling of extreme events.
Introduction
The Tarim Basin (TB), located in southern Xinjiang, is the largest interior basin in China. Within the basin is the largest desert of the Taklimakan Desert (TD), an extremely arid region (Yang et al., 2021). The TB is located north of the Qinghai-Tibet Plateau and is surrounded by the Kunlun Mountains, Tianshan Mountains, and Pamir Plateau. Its topography is a “C” type mountain-basin pattern (Xu et al., 2014). In conjunction with its large topography and atmospheric circulation, it has a complex moisture transport path and atmospheric water circulation structure; thus, precipitation in the TB is extremely unstable (Chen et al., 2013; Yao et al., 2020).
The TB has a dry climate and experiences low annual rainfall (Chen et al., 2013). The annual total precipitation is between 30 to 70 mm in the plain and desert areas, and its ecological environment is very fragile. Thus, the region is one of the main global sources of dust (Yang et al., 2021). In contrast, the plateau and mountainous areas are characterized by glaciers and snow cover, and the annual total precipitation is more than 400 mm (Chen et al., 2019; Yao et al., 2019a; Yao et al., 2019b; Yao et al., 2022). This mountainous area is the source of the Tarim River, Syr Darya River, Amu Darya River, and other important rivers in Central Asia, and is known as the water tower of the arid area (Chen et al., 2016; Guan, Yao & Schneider, 2022). The region has complex climate and hydrological patterns and is the most obvious region where the South Asian monsoon and westerly winds meet and interact with each other (Xu et al., 2014; Zhao et al., 2014; Zhao et al., 2019).
Extreme precipitation is one of the most serious meteorological disasters in the China. It is the leading contributor to flash flooding and geological hazards, and resulting in huge economic losses and casualties (Yin et al., 2023). Studies have shown that heavy rainfall events frequently occur in Northern China during the warm season, commonly affected by unique terrain and complex underlying surface (Zhao & Sun, 2019; Li et al., 2015; Yin et al., 2023). Compared to East Asian monsoon region, the heavy rainfall events in arid region cause more severe geological disasters due to the bare surface and fragile ecological environment. As such, they have garnered more attention in recent decades, such as the heavy rainfall events in the TB. In the context of a warmer and wetter climate, precipitation in the TB has shown an increasing trend, and the frequency and intensity of extreme rainfall events have increased significantly over the past 30 years (Hu et al., 2021; Guan et al., 2022). During 2011–2020, the number of rainstorm days in the TB increased by 94.4% and extreme events increased by 113.3% compared with those in the 1960s (Lv et al., 2014). An extreme rainfall event that reaches or exceeds the annual total precipitation in the TB region can cause severe mountain flood disasters and is one of the most serious extreme events causing disasters (Deng et al., 2014; Lv et al., 2014; Chen et al., 2019).
Substantial studies have been conducted on the thermal and dynamic conditions and mechanisms of extreme rainfall formation and change in south, north, northeast, southwest China, and globally have produced valuable results (Liu, Ding & Zhang, 2017; Ding, 2019; Du & Chen, 2018; Luo et al., 2017; Luo, Xia & Chan, 2020a; Luo et al., 2020b; Du et al., 2019; Du et al., 2022). For extreme rainfall in the TB, the heavy-rainfall weather system mainly includes the south branch trough, Central Asia vortex, Central Asia low trough, and low trough of Lake Balkhash moving southeast (Zhang, Su & Sun, 1986; Zhang & Deng, 1987; Yang & Zhang, 2007; Yang, Li & Zhang, 2011; Yang & Zhang, 2017; Yao et al., 2019a; Yao et al., 2019b). The Central Asia Vortex and Tashkent Vortex are important influencing systems for heavy rainfall in the TB region (Zhang & Deng, 1987; Qin, Yang & Zhang, 2013; Yang & Zhang, 2017). In addition, the South Asia High (SAH) duplex is a large-scale circulation system for the formation of heavy rainfall (Yang, 2003).
The sixth warmest period between 1880 and 2021 was observed in 2021 (Zhou et al., 2022). The annual mean temperature in China for 2021 was 1.0 °C above the average for 1981–2010, and was the warmest year recorded since 1961 (China Meteorological Administration, 2022). In 2021, unprecedented high-impact extreme events were observed worldwide, including sandstorms, droughts, heatwaves, extreme rainfall, and floods. For China, record-breaking extreme rainfall occurred over Henan Province between July 17 and 24, torrential rainfall over Hubei Province from August 10 to 14, and persistent heavy rainfall over northern China in early autumn (Zhou et al., 2022). The arid region of China has also experienced record-breaking rainfall events in 2021, particularly in the TB region. In the spring of 2021, the TB region experienced record-breaking extreme rainfall events, such as extreme rainfall over the northern TB from March 28 to 30, which broke the record for the earliest rainstorm since 1961.
Compared with the East Asian monsoon region, systematic research on the change and mechanism of heavy rainfall in arid regions is still lacking. In recent years, extreme rainfall has occurred frequently in the arid region of China and has attracted extensive attention from the public (Wang et al., 2017; Yao et al., 2022; Guan et al., 2022). However, there is only limited basic information on extreme rainfall in the arid regions of China, especially a review of the latest high-impact events. Therefore, the objective of the present study is to investigate the change in extreme rainfall observed over the TD and its surroundings, and presente a review of selected high-impact extreme rainfall events that occurred during 2012–2021, but especially in 2021. This study provides a reference for studies on the physical mechanism, attribution, and high-resolution modeling of extreme rainfall events.
Materials
Study region
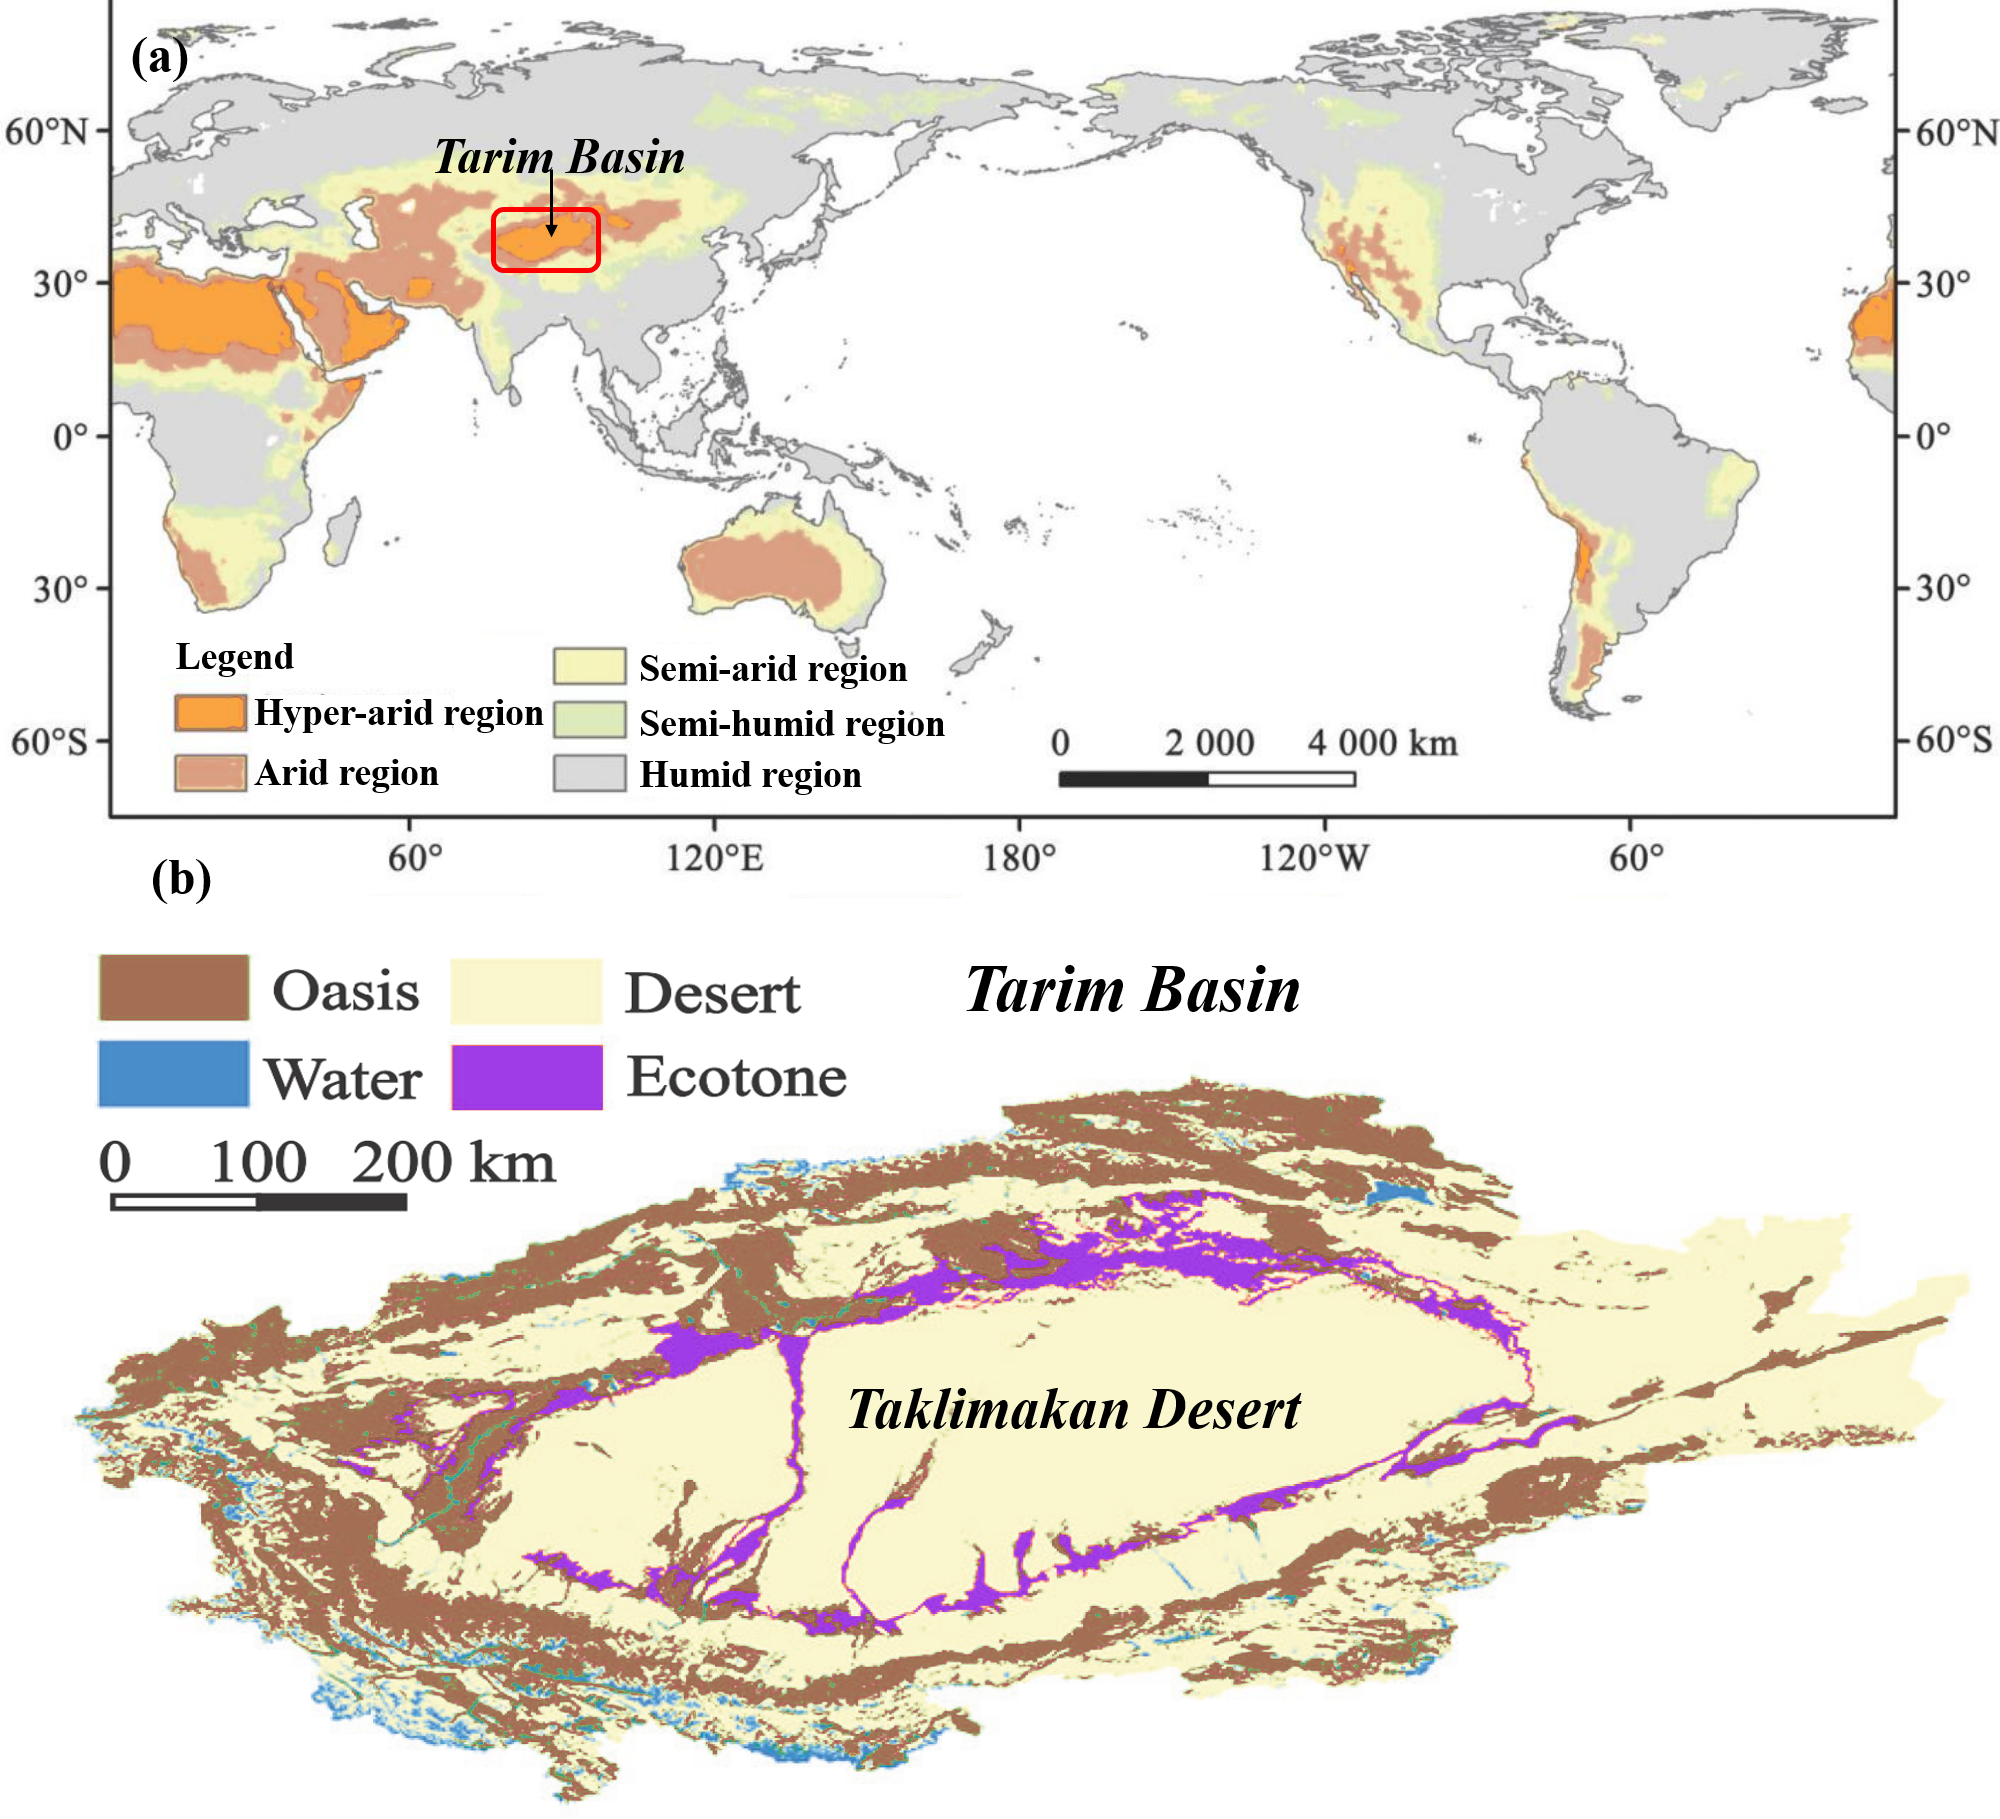
The TD, considered as the “Big Desert” (Hanhai), is situated in the center of the Tarim Basin (TB), in the arid region of northwest China (Figs. 1A–1B). The TD is the largest desert in China and the second largest shifting sand desert in the world, with an area of approximately 3.376 ×10⁵ km2 (Alim et al., 2021; Yang et al., 2021). The TB is the largest interior basin in China, with an area of approximately 5.3 × 10⁵ km2 (Alim et al., 2021) and spans approximately 1,500 km from the Pamir Plateau to the Gobi Desert and 600 km from the Tianshan Mountains to the Kunlun Mountains. The oasis region is distributed at the edge of the TD, with a total area of approximately 0.79 ×10⁵ km2, which accounts for 53.5% of the oasis in Xinjiang. The TB and surrounding regions are typical arid regions, and their climate is mainly affected by the westerly weather system and downflow over the Qinghai-Tibet Plateau, which is significantly different from that of the eastern monsoon region (Zhang & Deng, 1987). The TB has the driest climate in China, with an annual total precipitation of less than 50 mm.
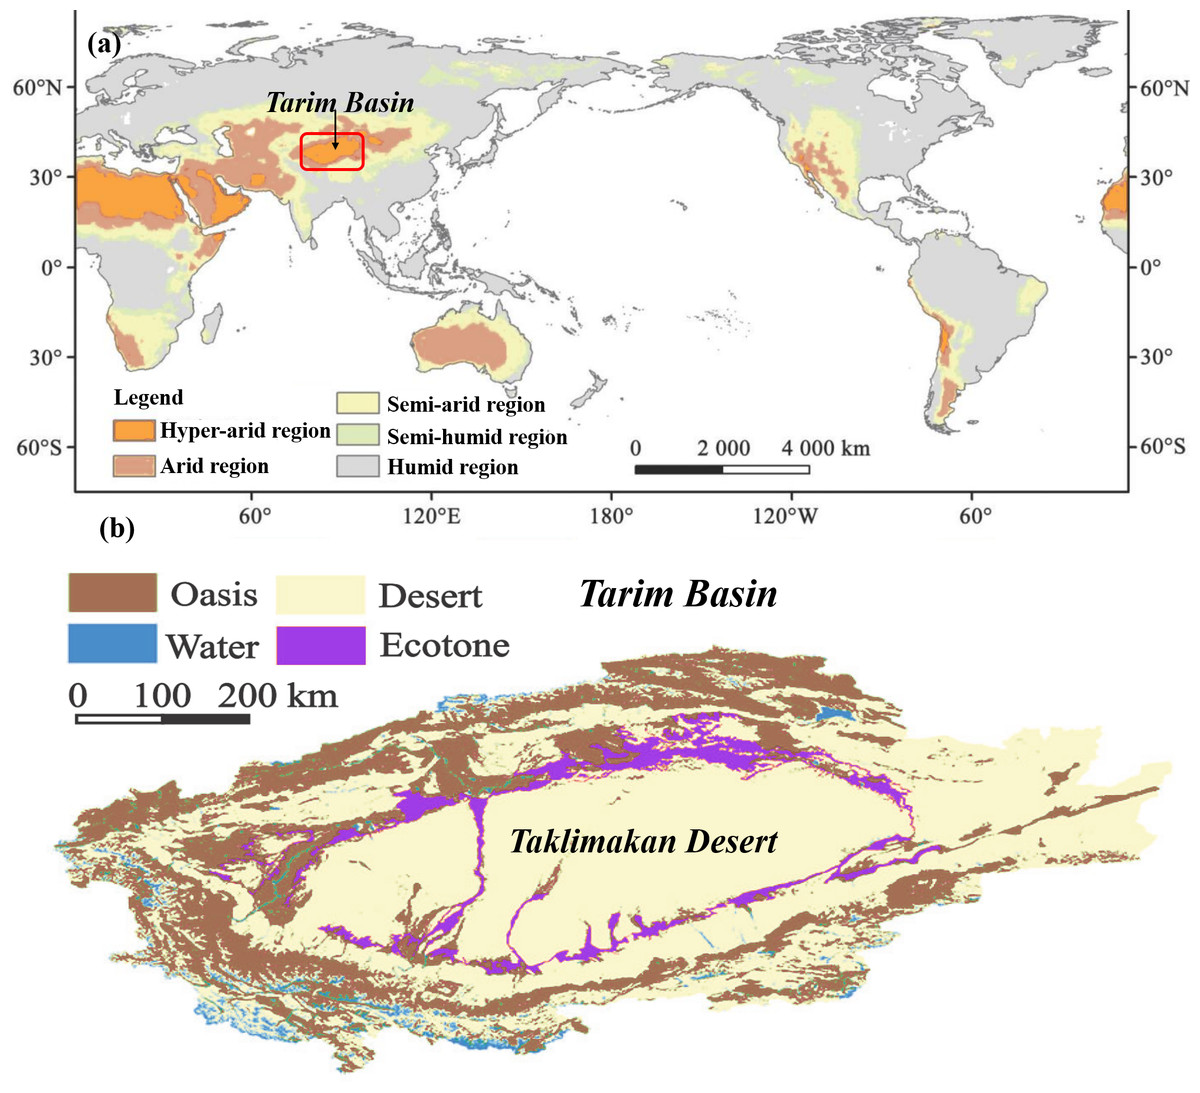
Figure 1: (A) Distribution of hyper-arid and arid regions in the world. (B) Study area of the Tarim Basin, China.
Data
Daily air temperature and precipitation records were obtained from the China Meteorological Administration (CMA) (http://data.cma.cn/, accessed on May 1, 2022) for 1961-2021. The hourly precipitation data also used from ground weather stations in TB during 2000–2020. Thirty-eight climatic stations within the TD and its surroundings were selected. All climatic records were controlled for quality and tested for homogeneity using the multiple analysis of series for homogenization (MASH) and RHtestsV4 tests, respectively. For Xinjiang, heavy rainfall is defined as daily precipitation exceeding 24 mm (Yao et al., 2018). The number of precipitation days (R0.1) was defined as the annual total number of days with the daily precipitation exceeded 0.1 mm, and the number of heavy rainfall days (R24) was defined as the annual total number of days with the daily precipitation exceeded 24 mm in Xinjiang. In addition, a short-term heavy rainfall is issued when the expected amount of precipitation is over 10 mm in 1 h.
Climatological precipitation distribution
The mean annual total precipitation over the TB was 66.2 mm for 1961–2021, and gradually decreased in mountainous area to desert areas from approximately 400 mm to less than 10 mm, respectively. The highest precipitation was observed in the southern Tianshan Mountains, especially in the Aksu River Basin, followed by the Pamirs Plateau and Kunlun Mountains. The lowest precipitation was observed at the Tazhong station, and the total precipitation was 26.7 mm in 1999–2021. The Tazhong station is the only long-term desert weather station that penetrates the desert hinterland by more than 200 km (Yang et al., 2021). There was no precipitation in the hinterland of the shifting desert.
Results and Analysis
Climate background and precipitation change
Rapid warming
The results indicate that the TB experienced rapid warming since the early 1960s. The warming rate was 0.26 °C/decade, based on data from the 38 stations for 1961 to 2018 (Fig. 2A), and is substantially higher than that in the Northern Hemisphere. A sudden warming occurred during the late 1980s, and the most rapid warming occurred during the 1990s, with a warming rate of 0.35 °C/decade from 1990 to 2018 compared with the warming rate of 0.08 °C/decade during 1961–1989. This indicates that the TB has been experiencing rapid warming when compared with eastern China (Yao et al., 2022). In addition, warming trends in the TB are equal to those in the Third-Pole region (Yao et al., 2019a; Yao et al., 2019b).
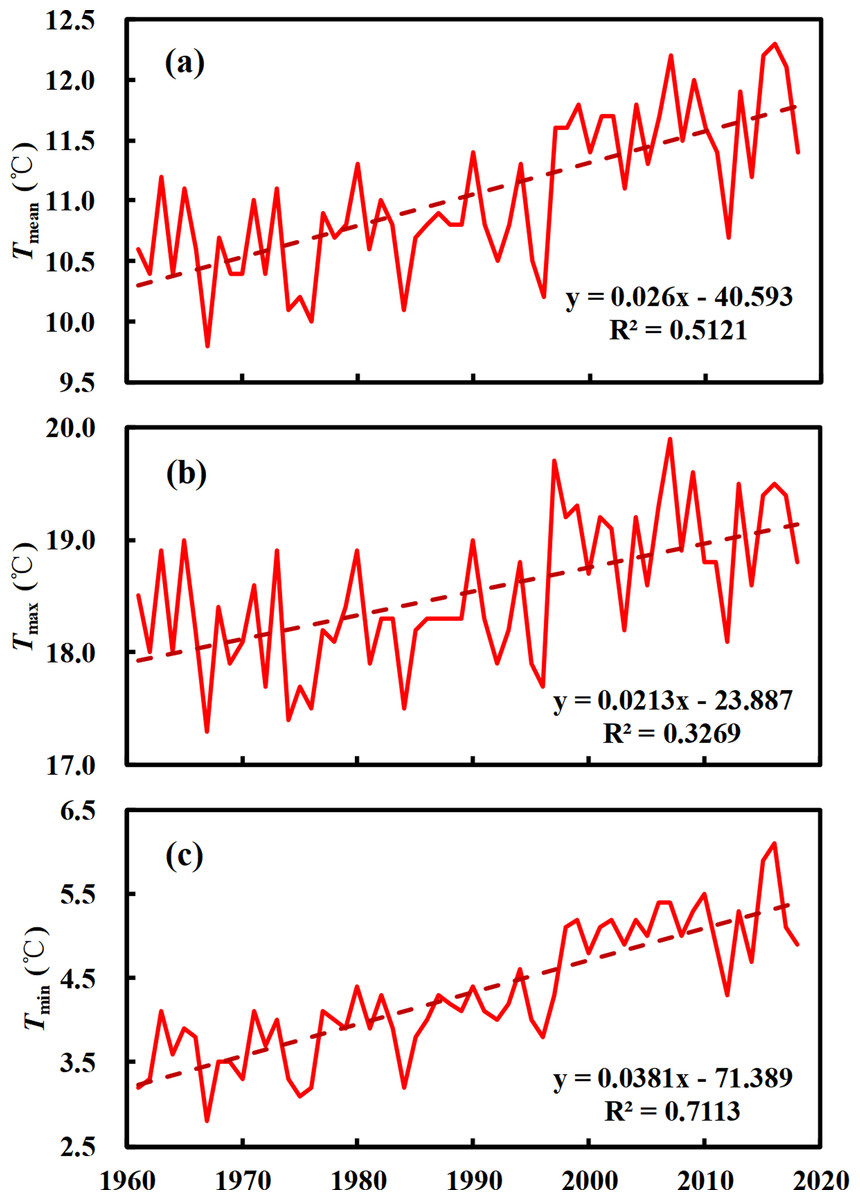
Figure 2: Change in temperature observed over the Taklimakan Desert and surrounding areas in China during 1961–2018.
(A) Tmean, annual mean air temperature; (B) Tmax, annual mean maximum temperature; and (C) Tmin, annual mean minimum temperature.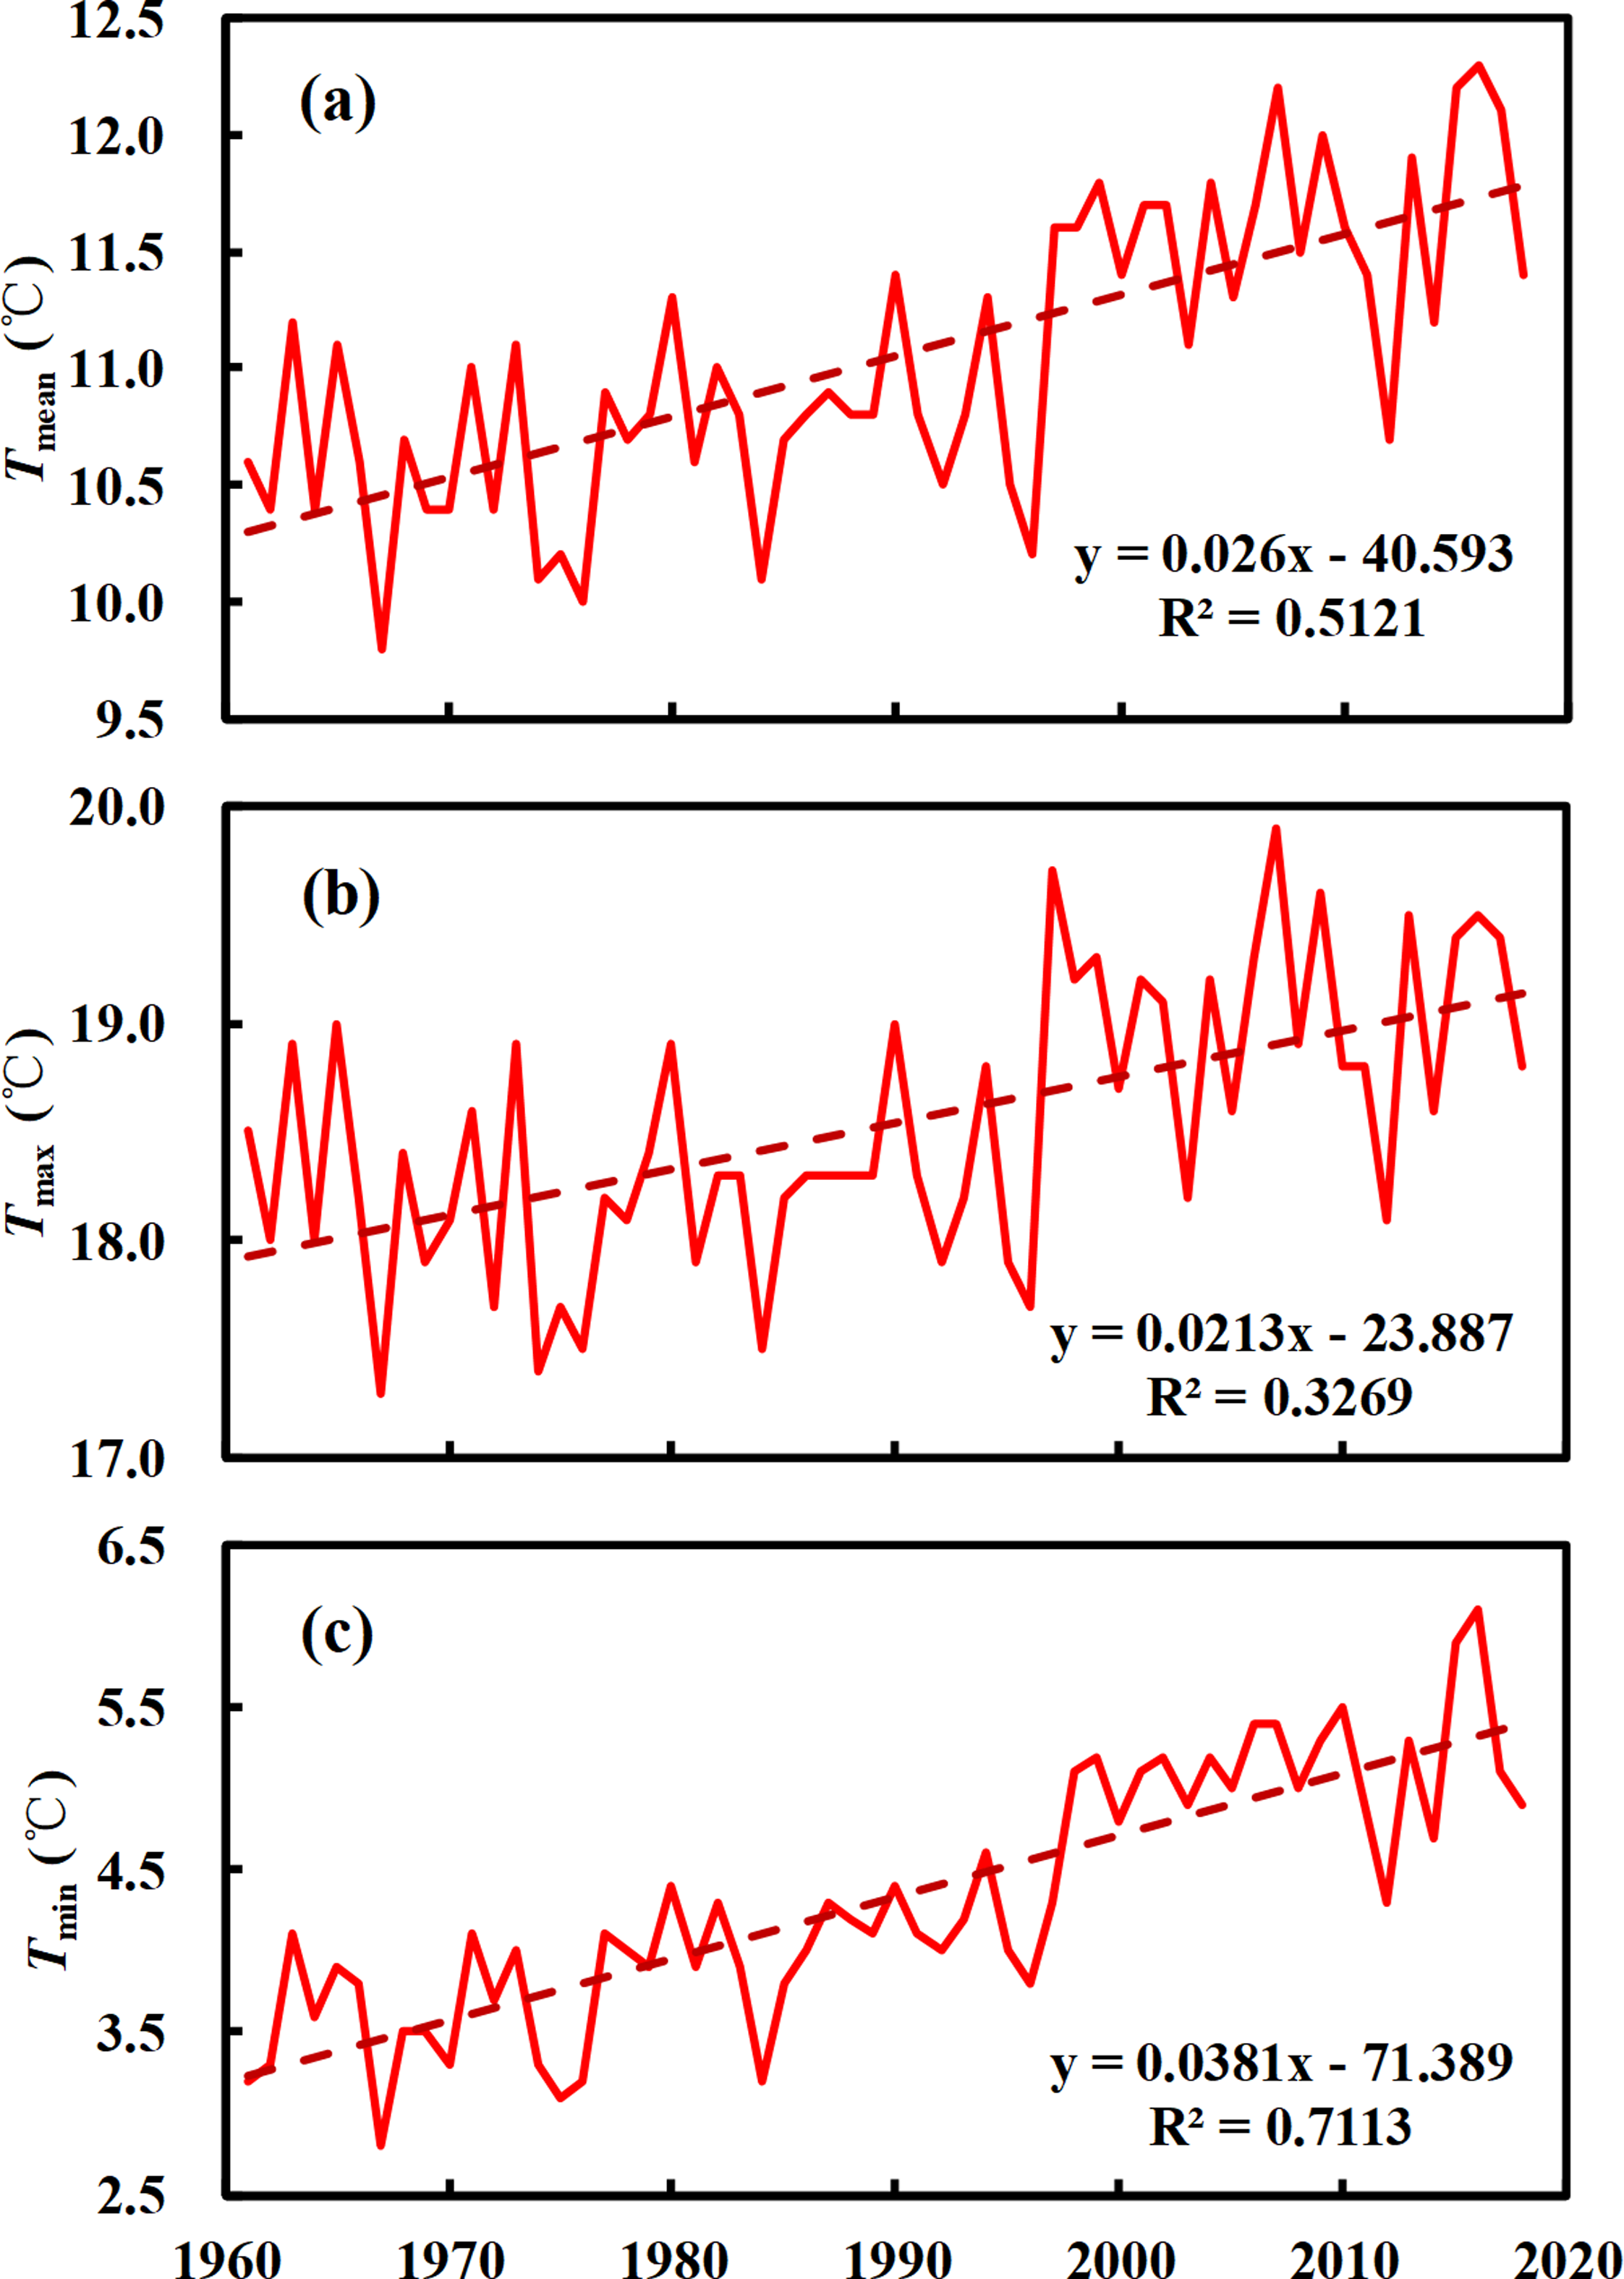
During 1961–2018, both the minimum and maximum air temperature records for the TB indicated significant increasing trends, with a rate of 0.38 °C/decade and 0.21 °C/decade (p < 0.01), respectively (Figs. 2B–2C). This implies an asymmetric warming rate in the TB, with higher increasing trends in the minimum air temperature than in maximum air temperature.
Precipitation and heavy rainfall increase
The annual total precipitation in the TB increased by approximately 5.5 mm/decade (p < 0.05) during 1961–2018 (Fig. 3A). Spatially, the increasing precipitation trends increased from southeast to northwest, and the greatest increase occurred in the western region of the TB. The R0.1 and R24 experienced an insignificant increasing trend during 1961–2018, with a rate of 1.07 day/decade and 0.67 day/decade, respectively (Figs. 3B–3C). The largest heavy rainfall day increase occurred after 2000, with a rate of 3.18 day/decade from 2000 to 2018, which contrasts with the decreasing trend of the precipitation days (slight decrease by −1.86 day/decade). In addition, the total precipitation and heavy rainfall had larger inter-annual variability in the 2000s.
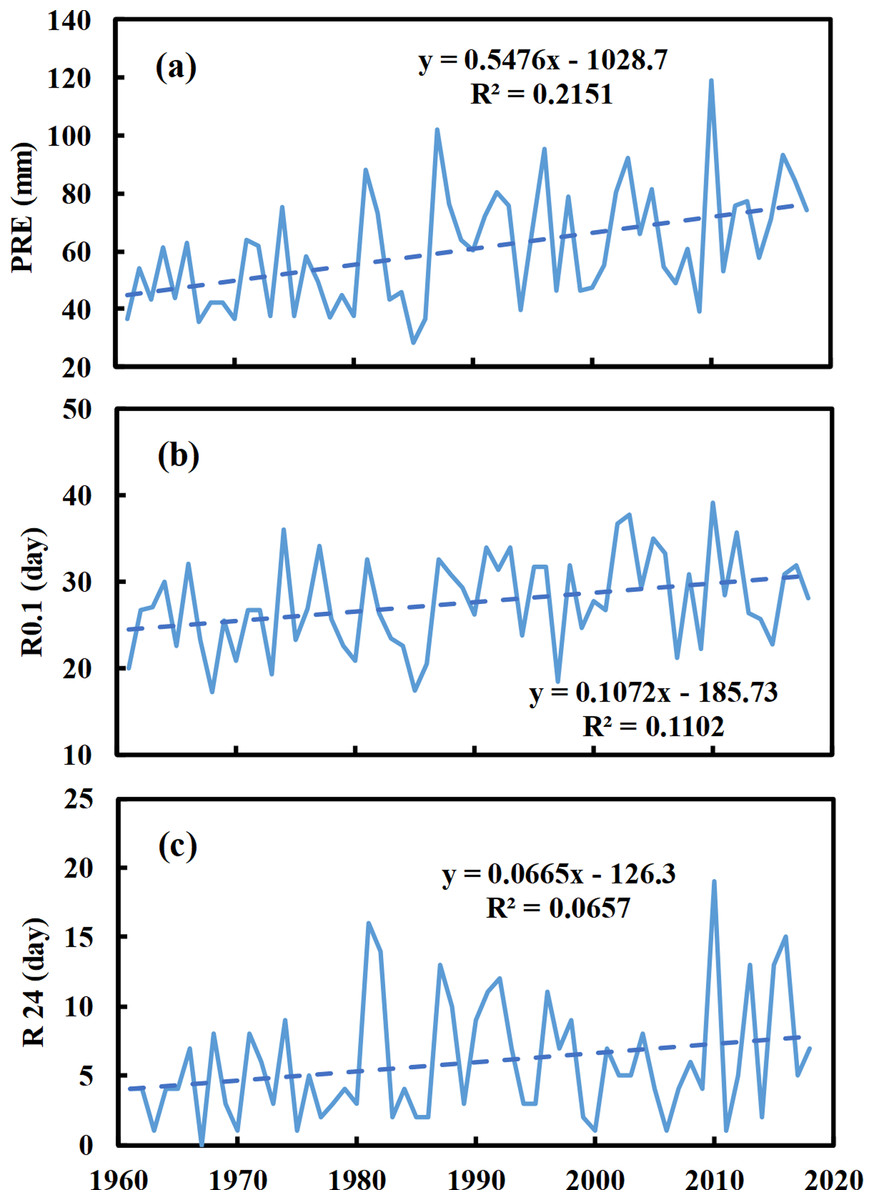
Figure 3: Change in precipitation and extreme events observed over the Taklimakan Desert and surrounding areas in China during 1961–2018.
(A) Mean annual total precipitation; (B) R0.1, the number of precipitation days; and (C) R24, number of extreme precipitation days.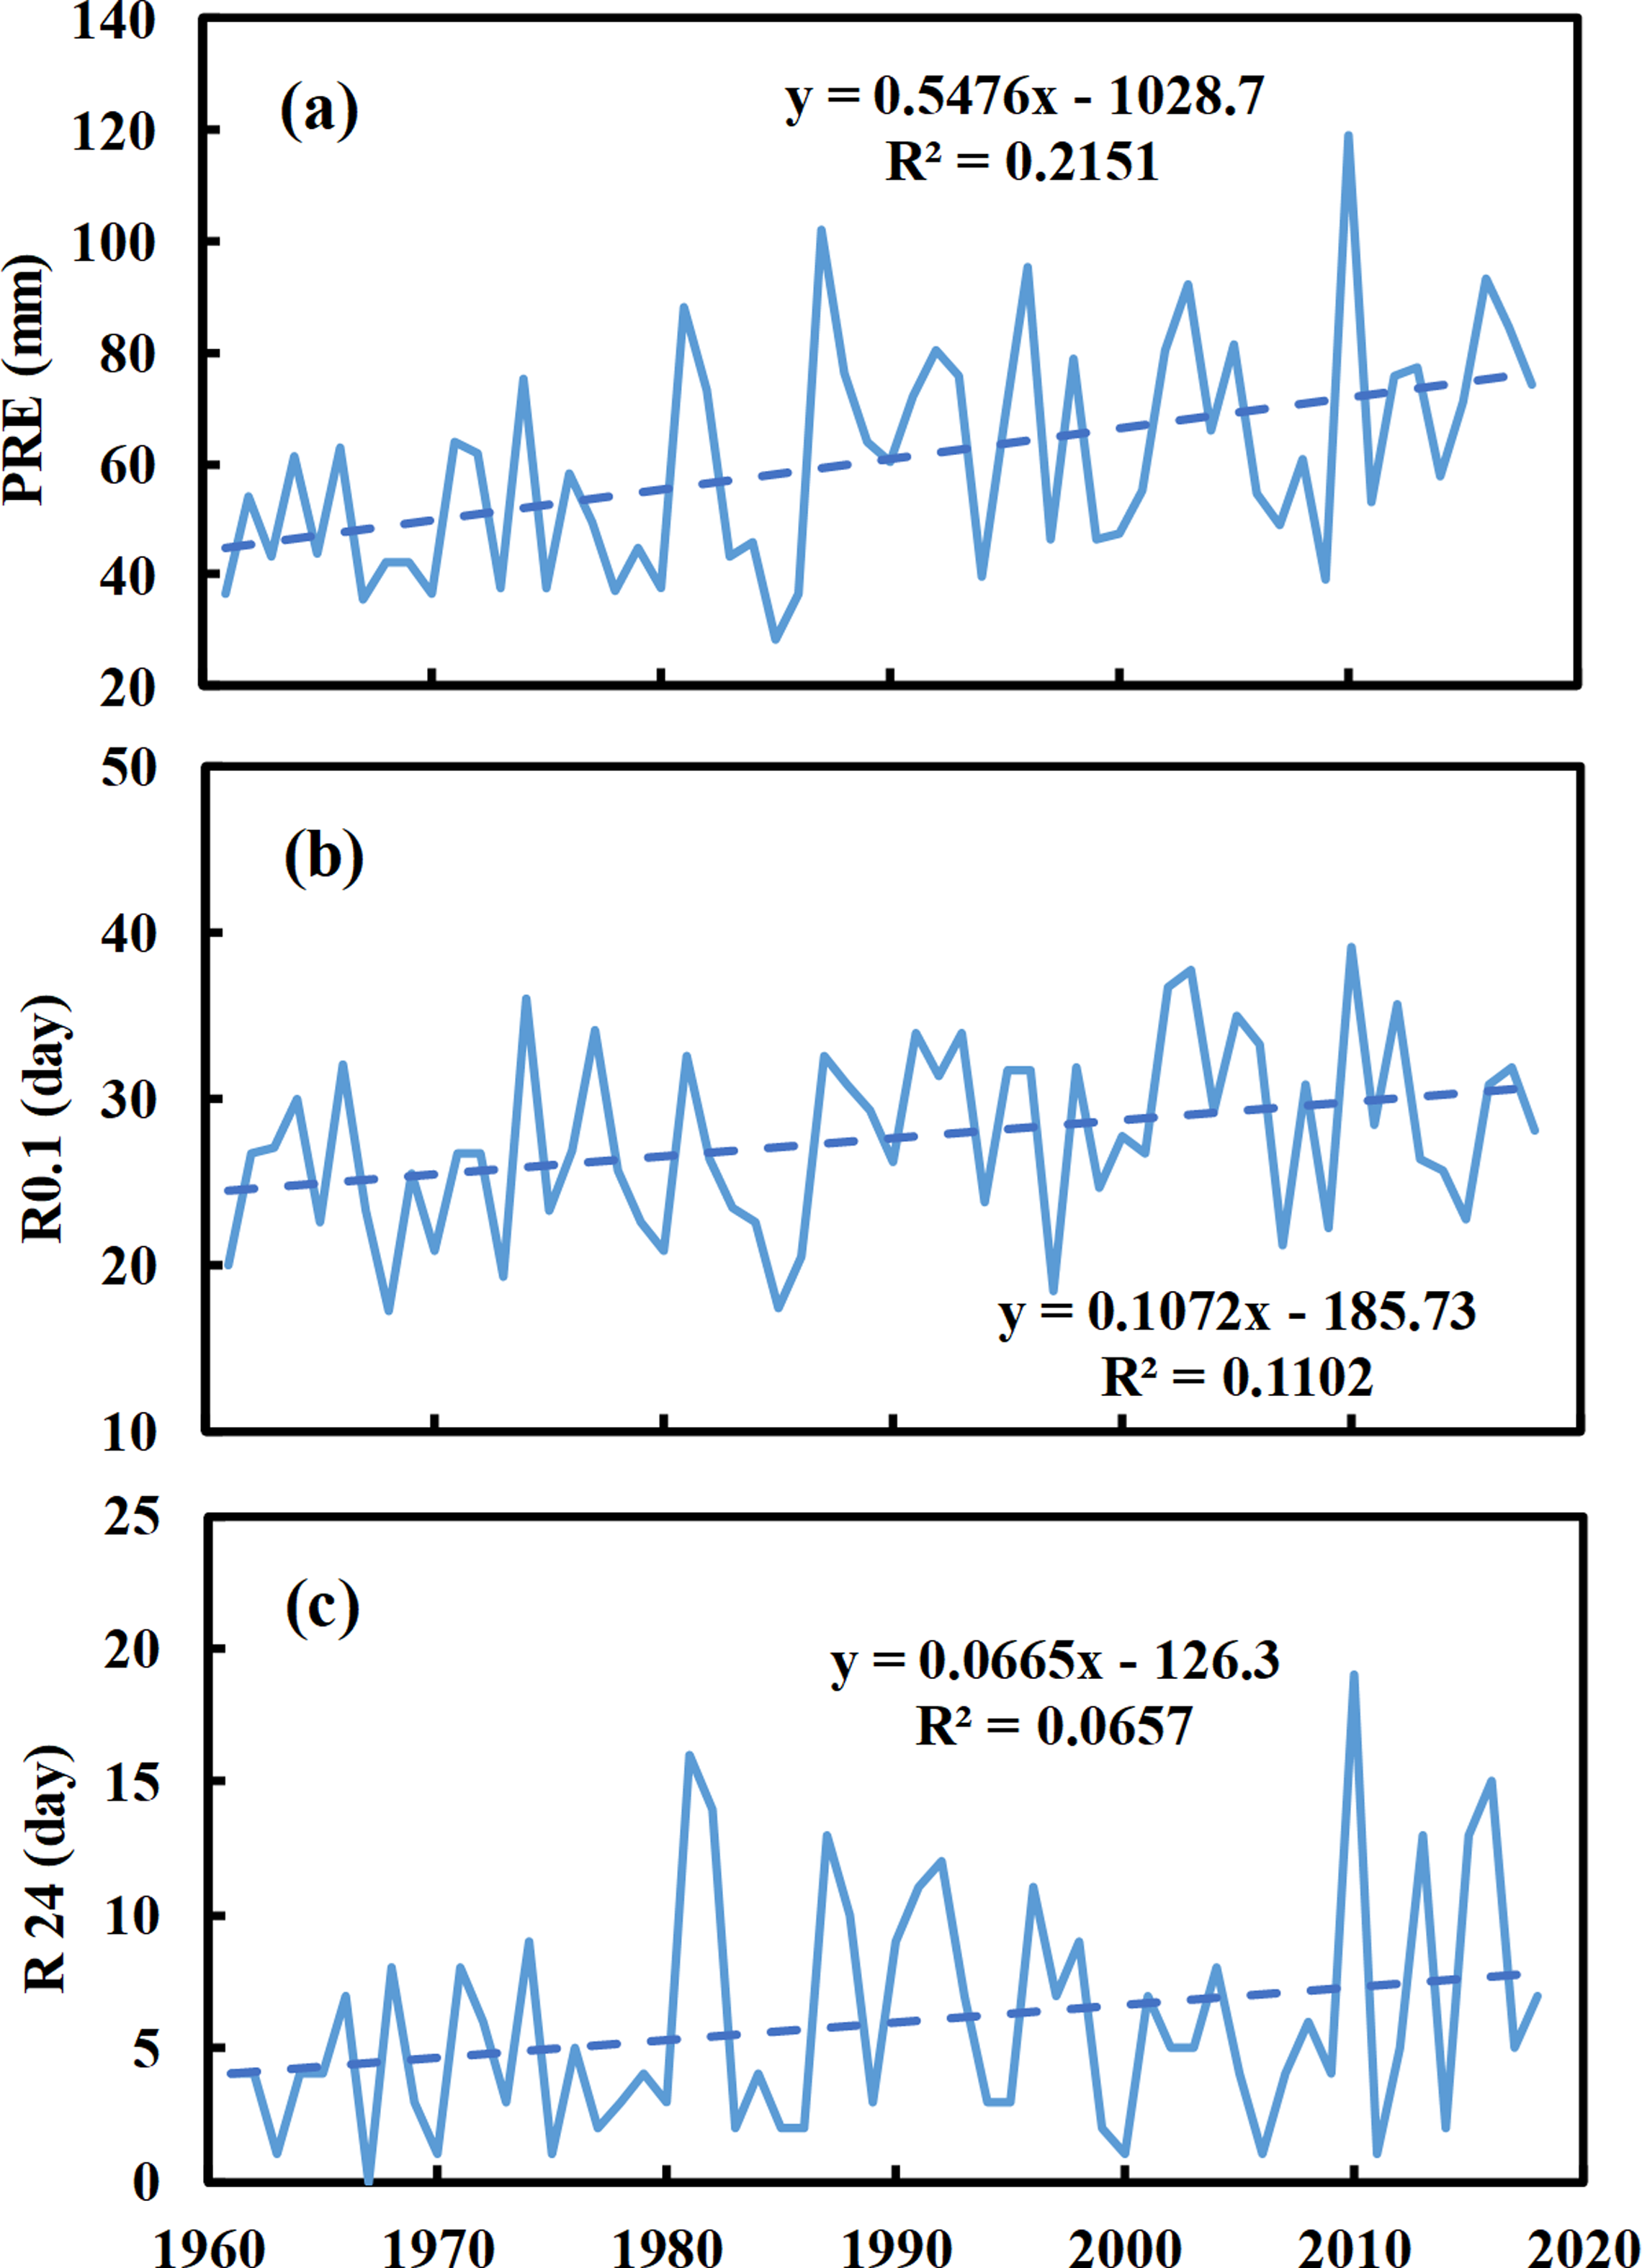
To further understand the phase change in precipitation over and around the TD, we investigated the changes and trends in total precipitation during different climate periods. Generally, the mean of 30-year periods was used to investigate the climatic state. Thus, we investigated the climatic means and trends in annual precipitation and R24 during seven climate periods (Fig. 4):1961–1990, 1966–1995, 1971–2000, 1976–2005, 1981–2010, 1986–2015, and 1991–2020. Precipitation increased during all climate periods, and the linear increasing trend was within a range of 1.4–11.4 mm/10a. However, the trends showed an interdecadal weakening in the three recent climate periods, and R24 had a similar tendency (Fig. 4). Thus, the precipitation and heavy rainfall over TD revealed nonlinear enhancement characteristics during the three recent climate periods.
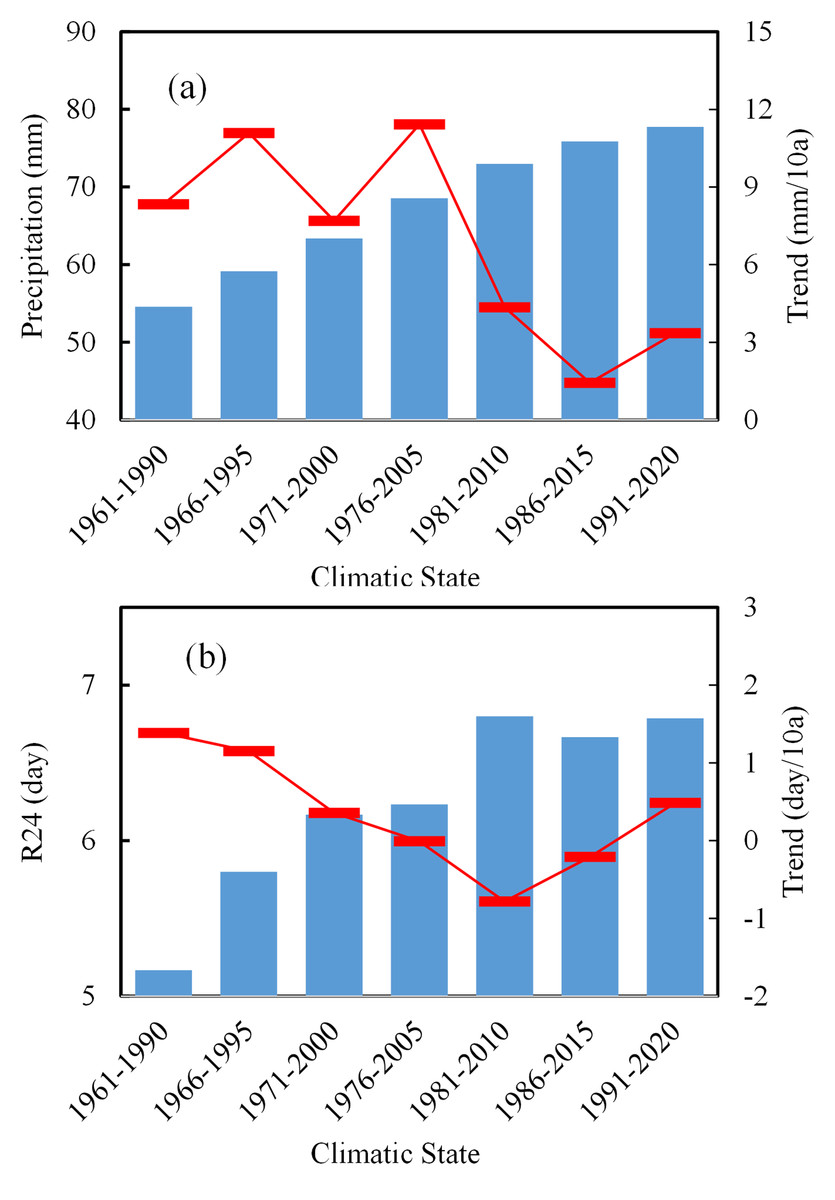
Figure 4: Mean and trends in precipitation (A) and heavy rainfall days (R24) (B) over the Taklimakan Desert and surrounding areas in China, in different 30-year time periods.
The blue barrel represents the mean annual precipitation and extreme during 30-year and red rectangle represents the trends in annual precipitation and extreme during the corresponding 30-year time.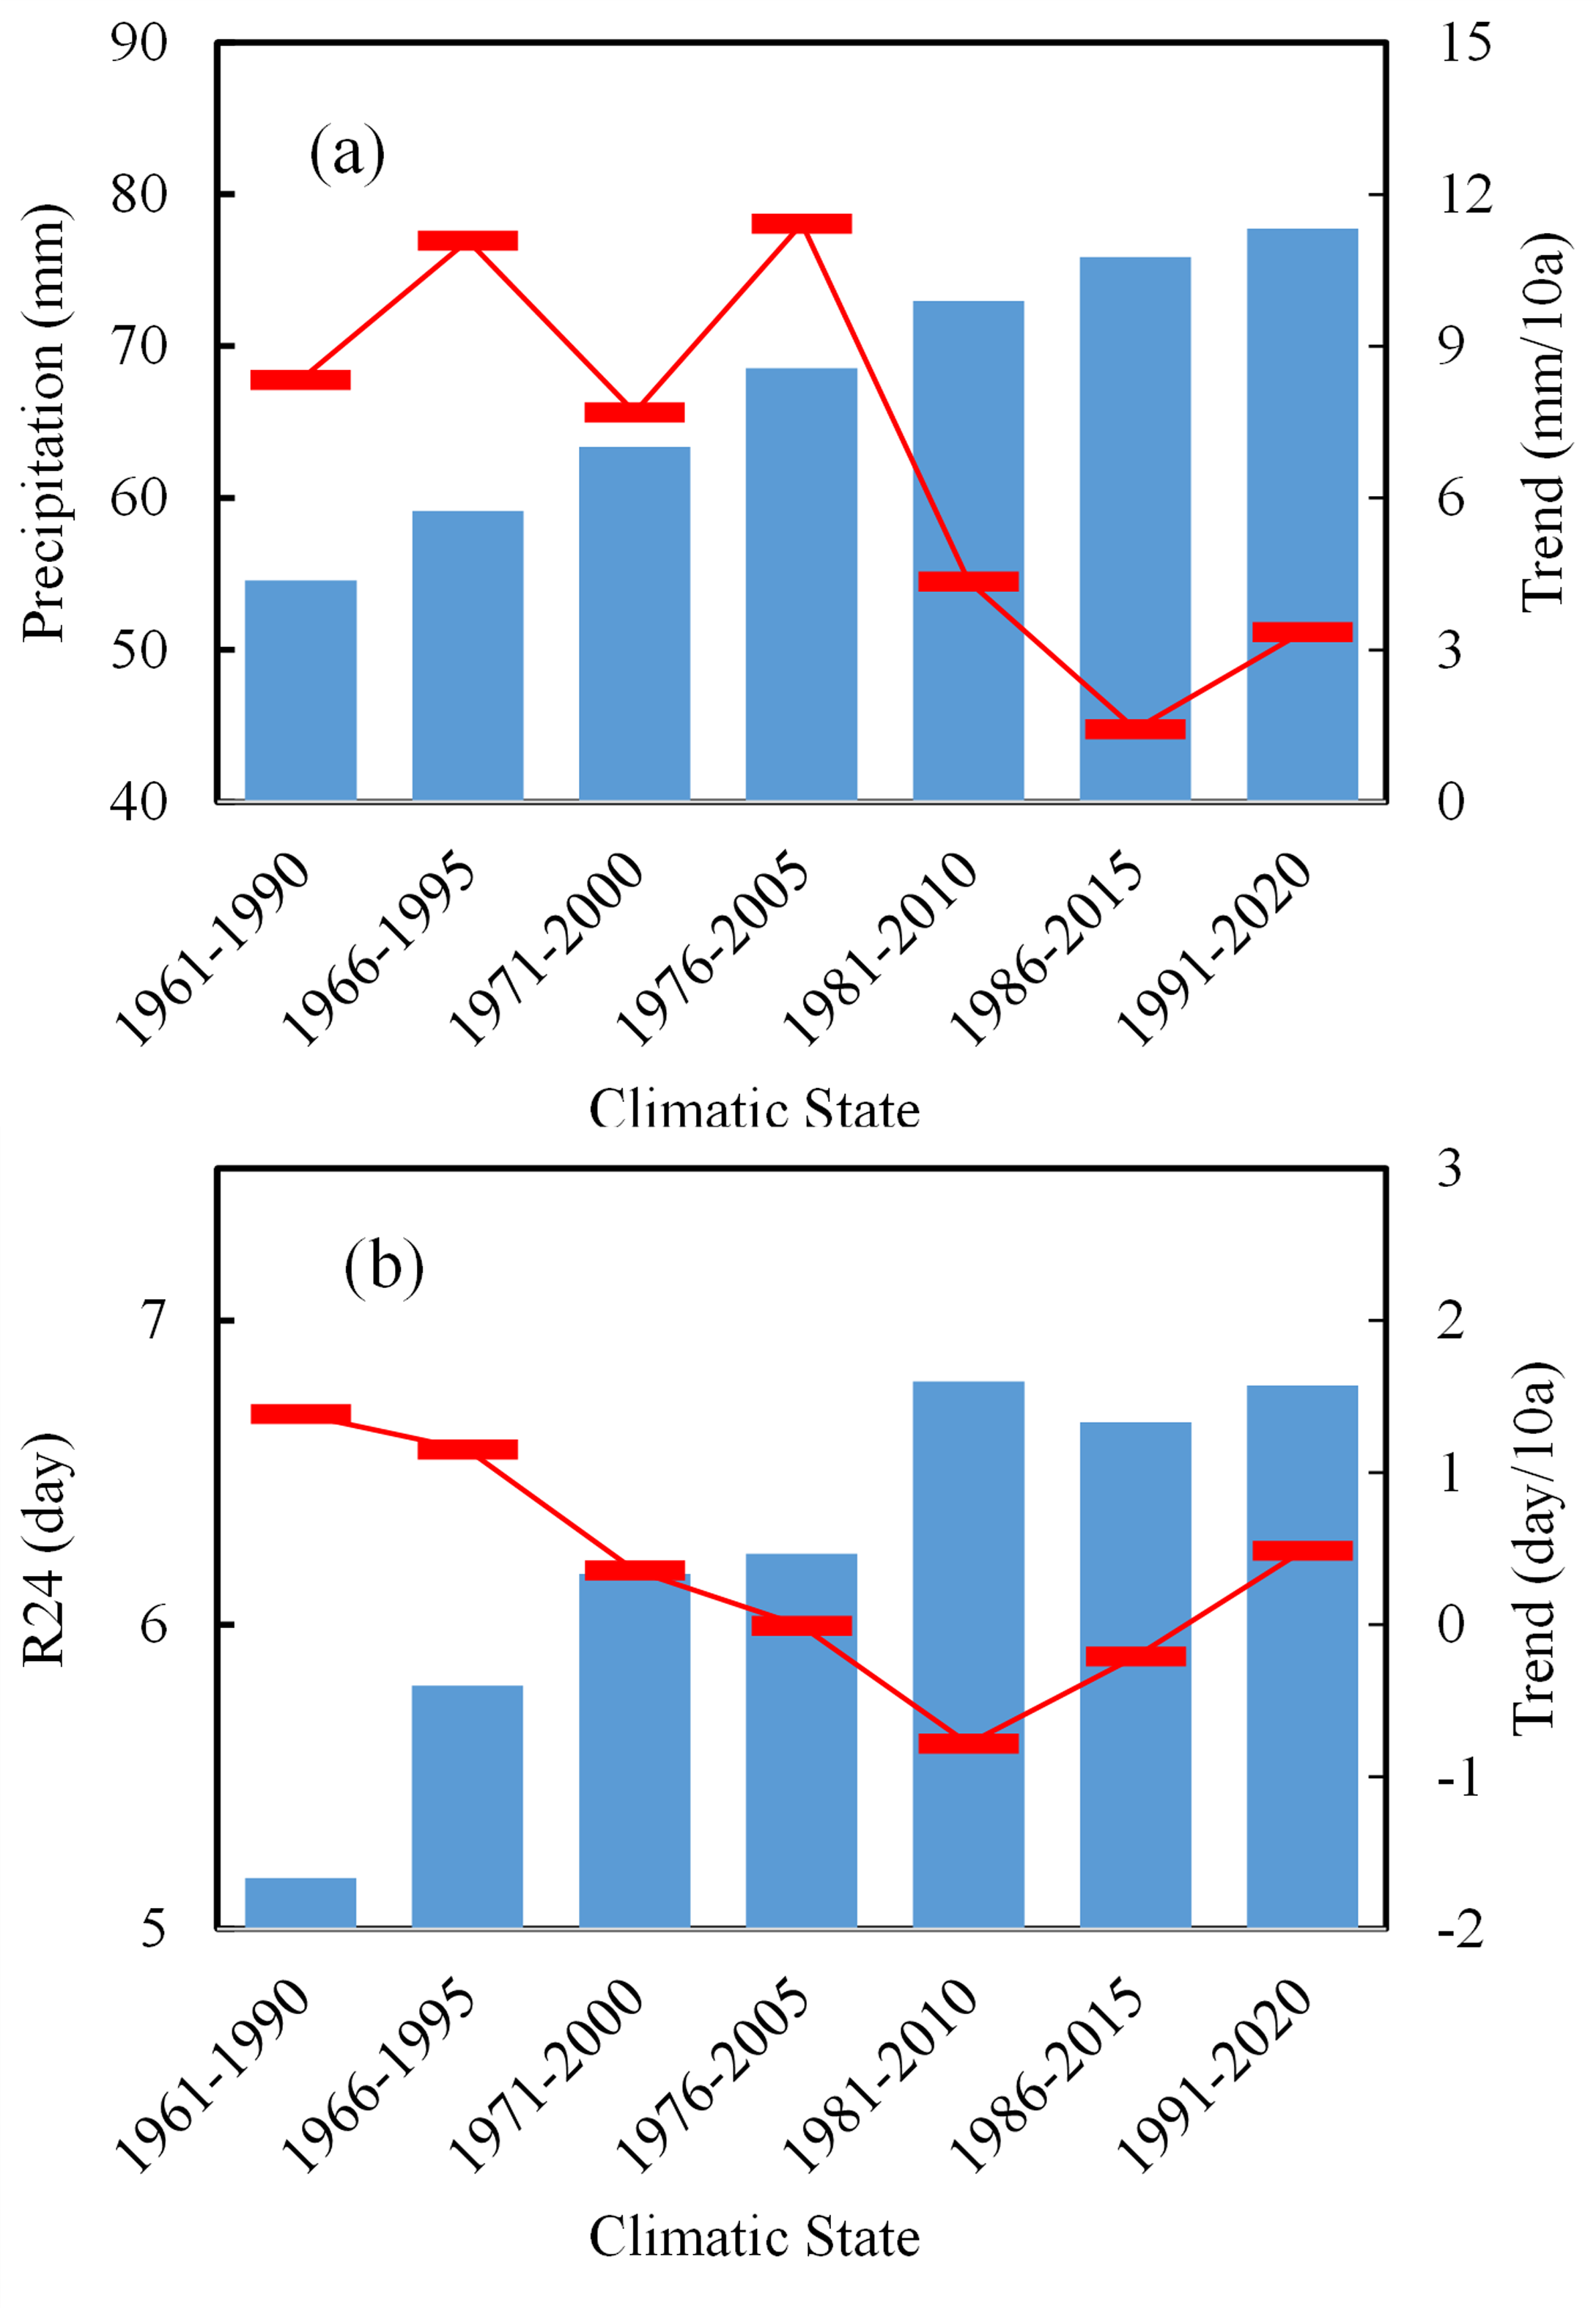
Heavy rainfall characteristics
Compared with the eastern monsoon region, heavy rainfall has unique regional and seasonal characteristics in the TB. Heavy rainfall in the TB had three main characteristics.
Extreme rainfall was mainly concentrated in the summer. Summer precipitation accounted for 54.4% of the annual total precipitation, with the most frequent heavy rainfall occurring in August. For the diurnal scale, heavy rainfall was mainly concentrated in the early and late afternoon, whereas in summer it was mainly concentrated between 1700 and 1900 local standard time (LST; LST = UTC+8h). In addition, summer heavy rainfall mainly occurred during the night over the western TB, which accounts for more than 80% of the total heavy rainfall. In the eastern TB, heavy rainfall was mainly concentrated during the daytime, accounting for more than 70% of the total extreme precipitation.
Heavy rainfall had a relatively lower frequency but had a larger rainfall intensity, shorter duration, and stronger extremes. Although heavy rainfall is a small probability event in the TB, regional extreme events does occur every year. The average annual occurrence of heavy rainfall was 34.6 days in the TB during 2013–2019, and short-term heavy rainfall was 28.7 days. The proportion of short-term heavy rainfall days in the total number of heavy rainfall days was 83.7%. In summer, more than 70% of the stations experienced short-term heavy rainfall events on heavy rainfall days. The average precipitation duration was less than 6 h on heavy rainfall days at approximately 50% of the stations, which reflected the short duration of heavy rainfall in the TB. Compared with the heavy rainfall of the monsoon region, the quantity, frequency, and duration heavy rainfall in the TB was less. However, the relative rainfall intensity was high, and extreme events reached or exceeded the local annual total precipitation. For example, on May 21, 2018, the Pishan County of Hetian received 53.8 mm of rainfall in one hour and exceeded the annual climatological total rainfall, and the daily rainfall reached 86.2 mm in Luopo County of Hetian on June 15, 2021, which is twice the historical daily maximum rainfall. During 2011–2020, a daily maximum precipitation of 30% at the stations broke the historical extreme records from 1961 in the TB (Fig. 5). The direct economic loss caused by rainstorms and its derived geological disasters, ranks first among meteorological disasters, accounting for 32.2% of the total economic loss (Xinjiang Meteorological Administration, 2023).
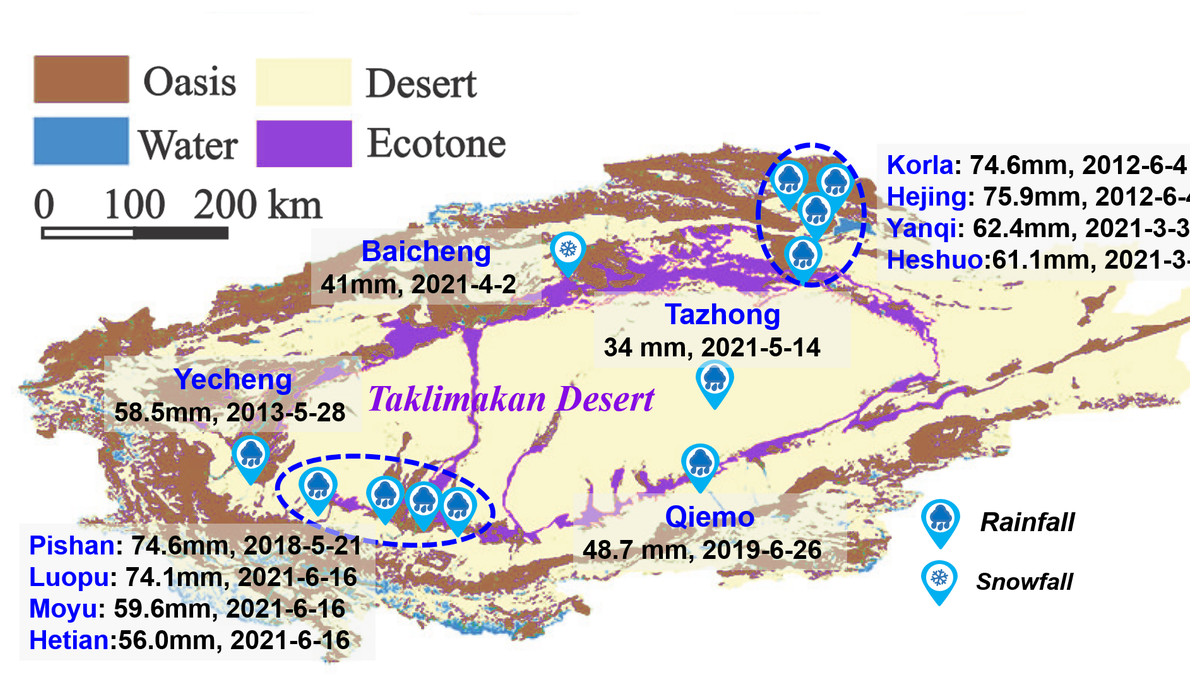
Figure 5: Record-breaking daily maximum rainfall observed over the Taklimakan Desert and surrounding areas during 2012–2021.
The heavy rainfall distribution was extremely uneven and was mainly distributed in mountainous areas and influenced by local topography. The largest rainstorm frequency and daily maximum precipitation were located in the piedmont and forest belts. In the TB, heavy rainfall increased with increasing altitude, including rainfall amounts, heavy rainfall days, the number of heavy rainfall stations, and short-term heavy rainfall days. The number of heavy rainfall days above 2,500 m was 4.3 times of that at an altitude below 1,000 m, and the number of stations with heavy rainfall was 5.5 times of that. Short-term heavy rainfall mainly occurred in areas with an altitude below 2,000 m in the TB. Although heavy rainfall is rare in vast desert areas, it does occur occasionally. For example, the Tazhong station in the hinterland of the desert received 34 mm of rainfall in 12 h, thereby breaking the record since being observed and exceeded the annual climatological rainfall.
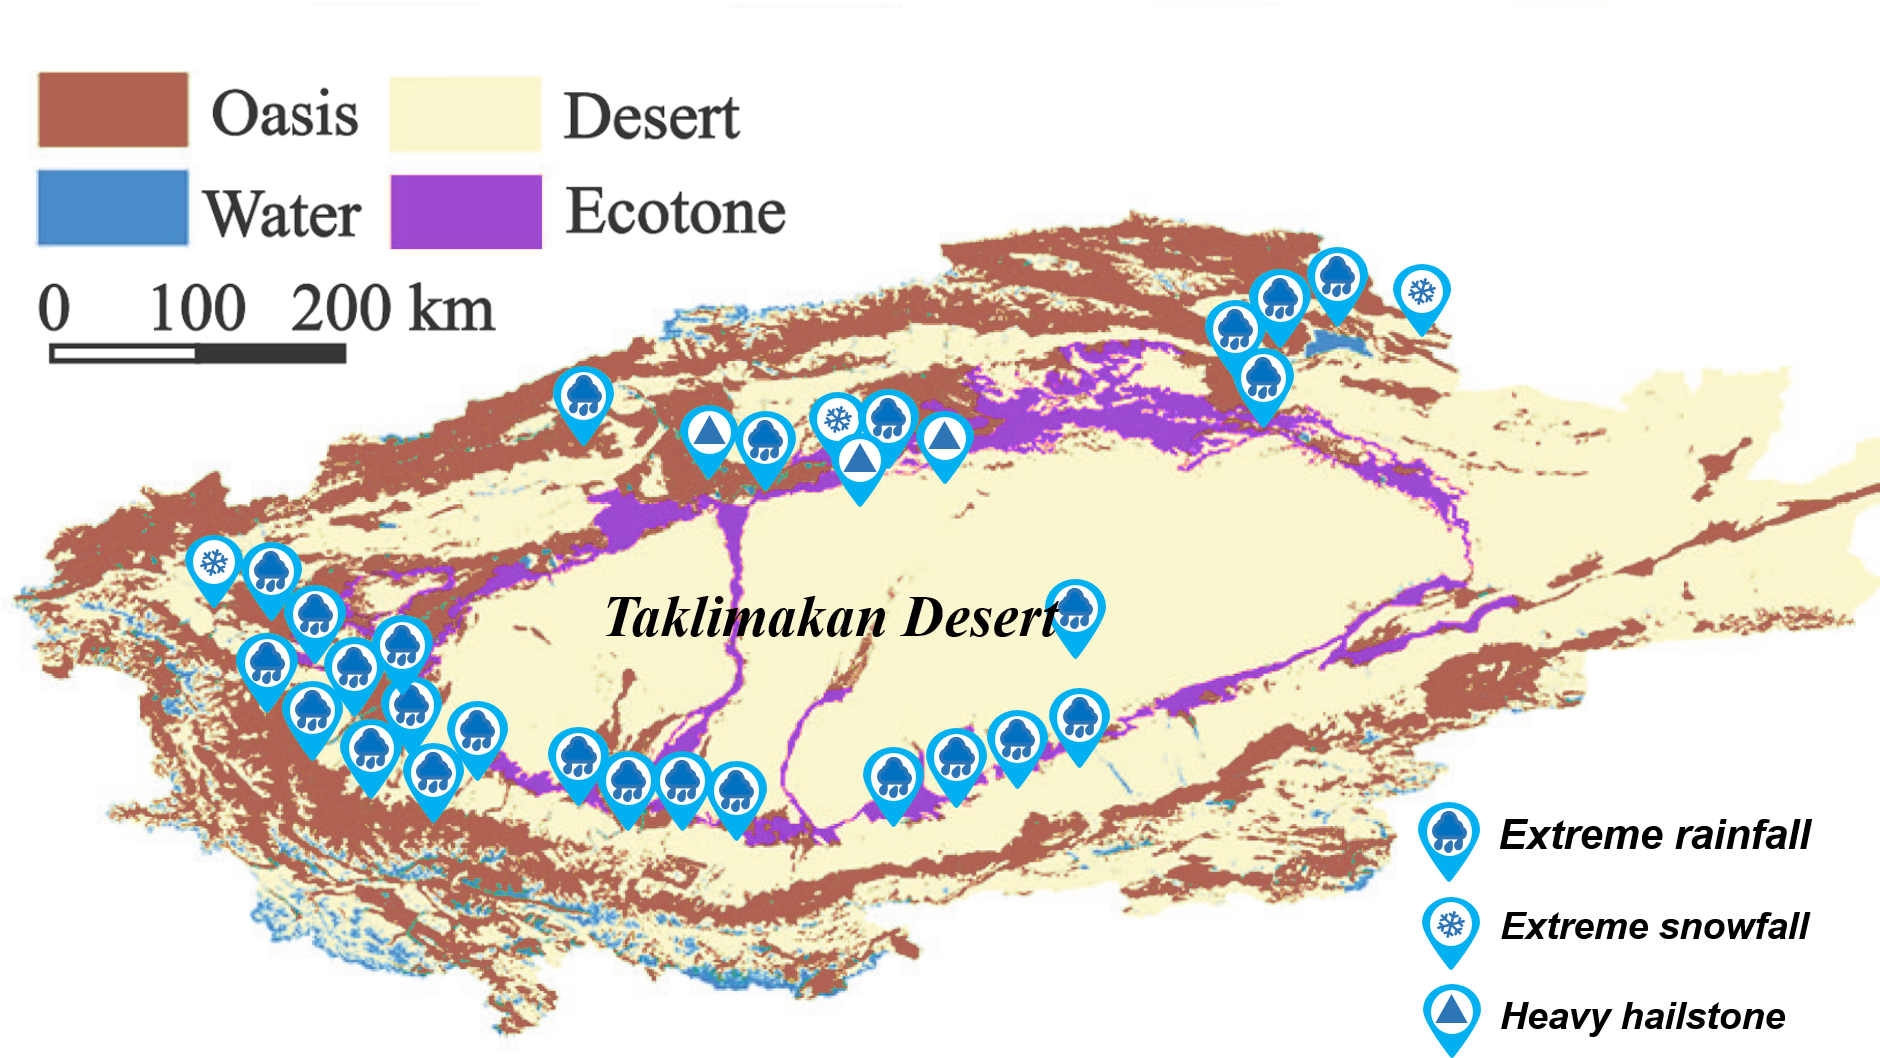
High-impact precipitation extremes observed in the Taklimakan Desert and surrounding areas
Figure 6 shows the spatial distribution of precipitation extremes observed over the TD and surrounding areas during the recent decade (2012–2021). The TD and its surroundings frequently experienced extreme precipitation events, mainly affecting the Kaidu River, Aksu River, Yarkant River, and Hetian River basins. Extreme precipitation events occurred in the desert hinterland and southwest of the TD. In addition to heavy rainfall, extreme snowfall and heavy hailstorms also occurred over and around the TD. Extreme snowfall mainly occurred in the mountainous regions, and heavy hailstorms mainly occurred in the Aksu area.
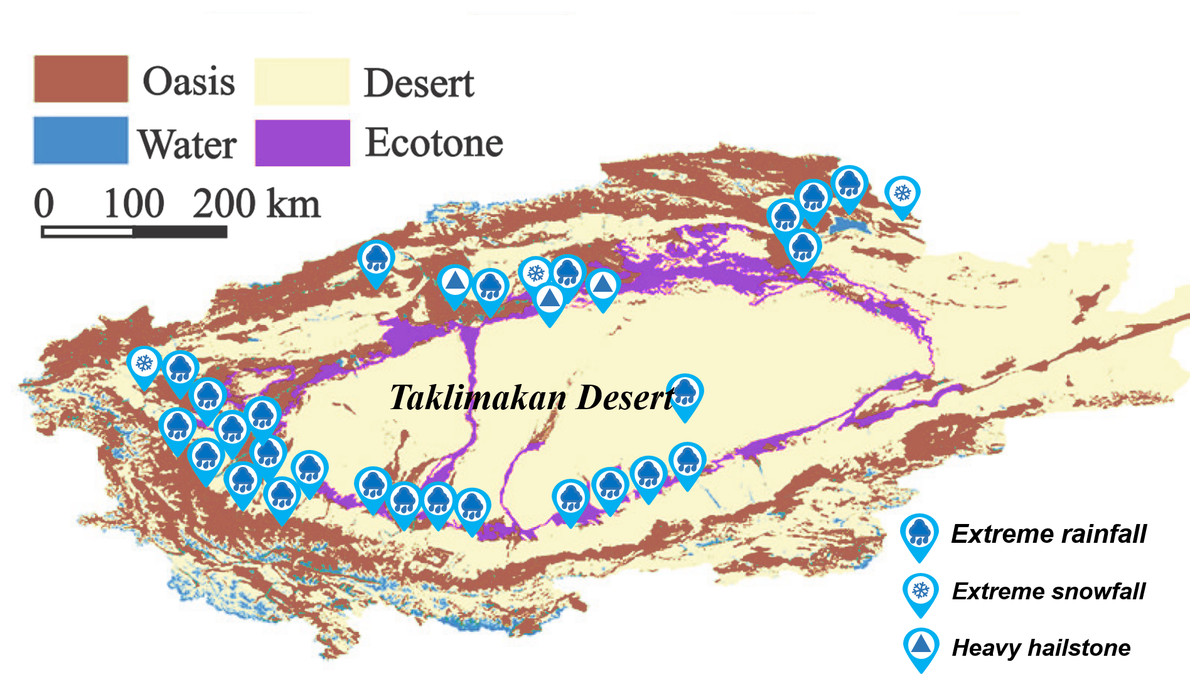
Figure 6: Precipitation extremes observed in the Taklimakan Desert and surrounding areas during 2012–2021.
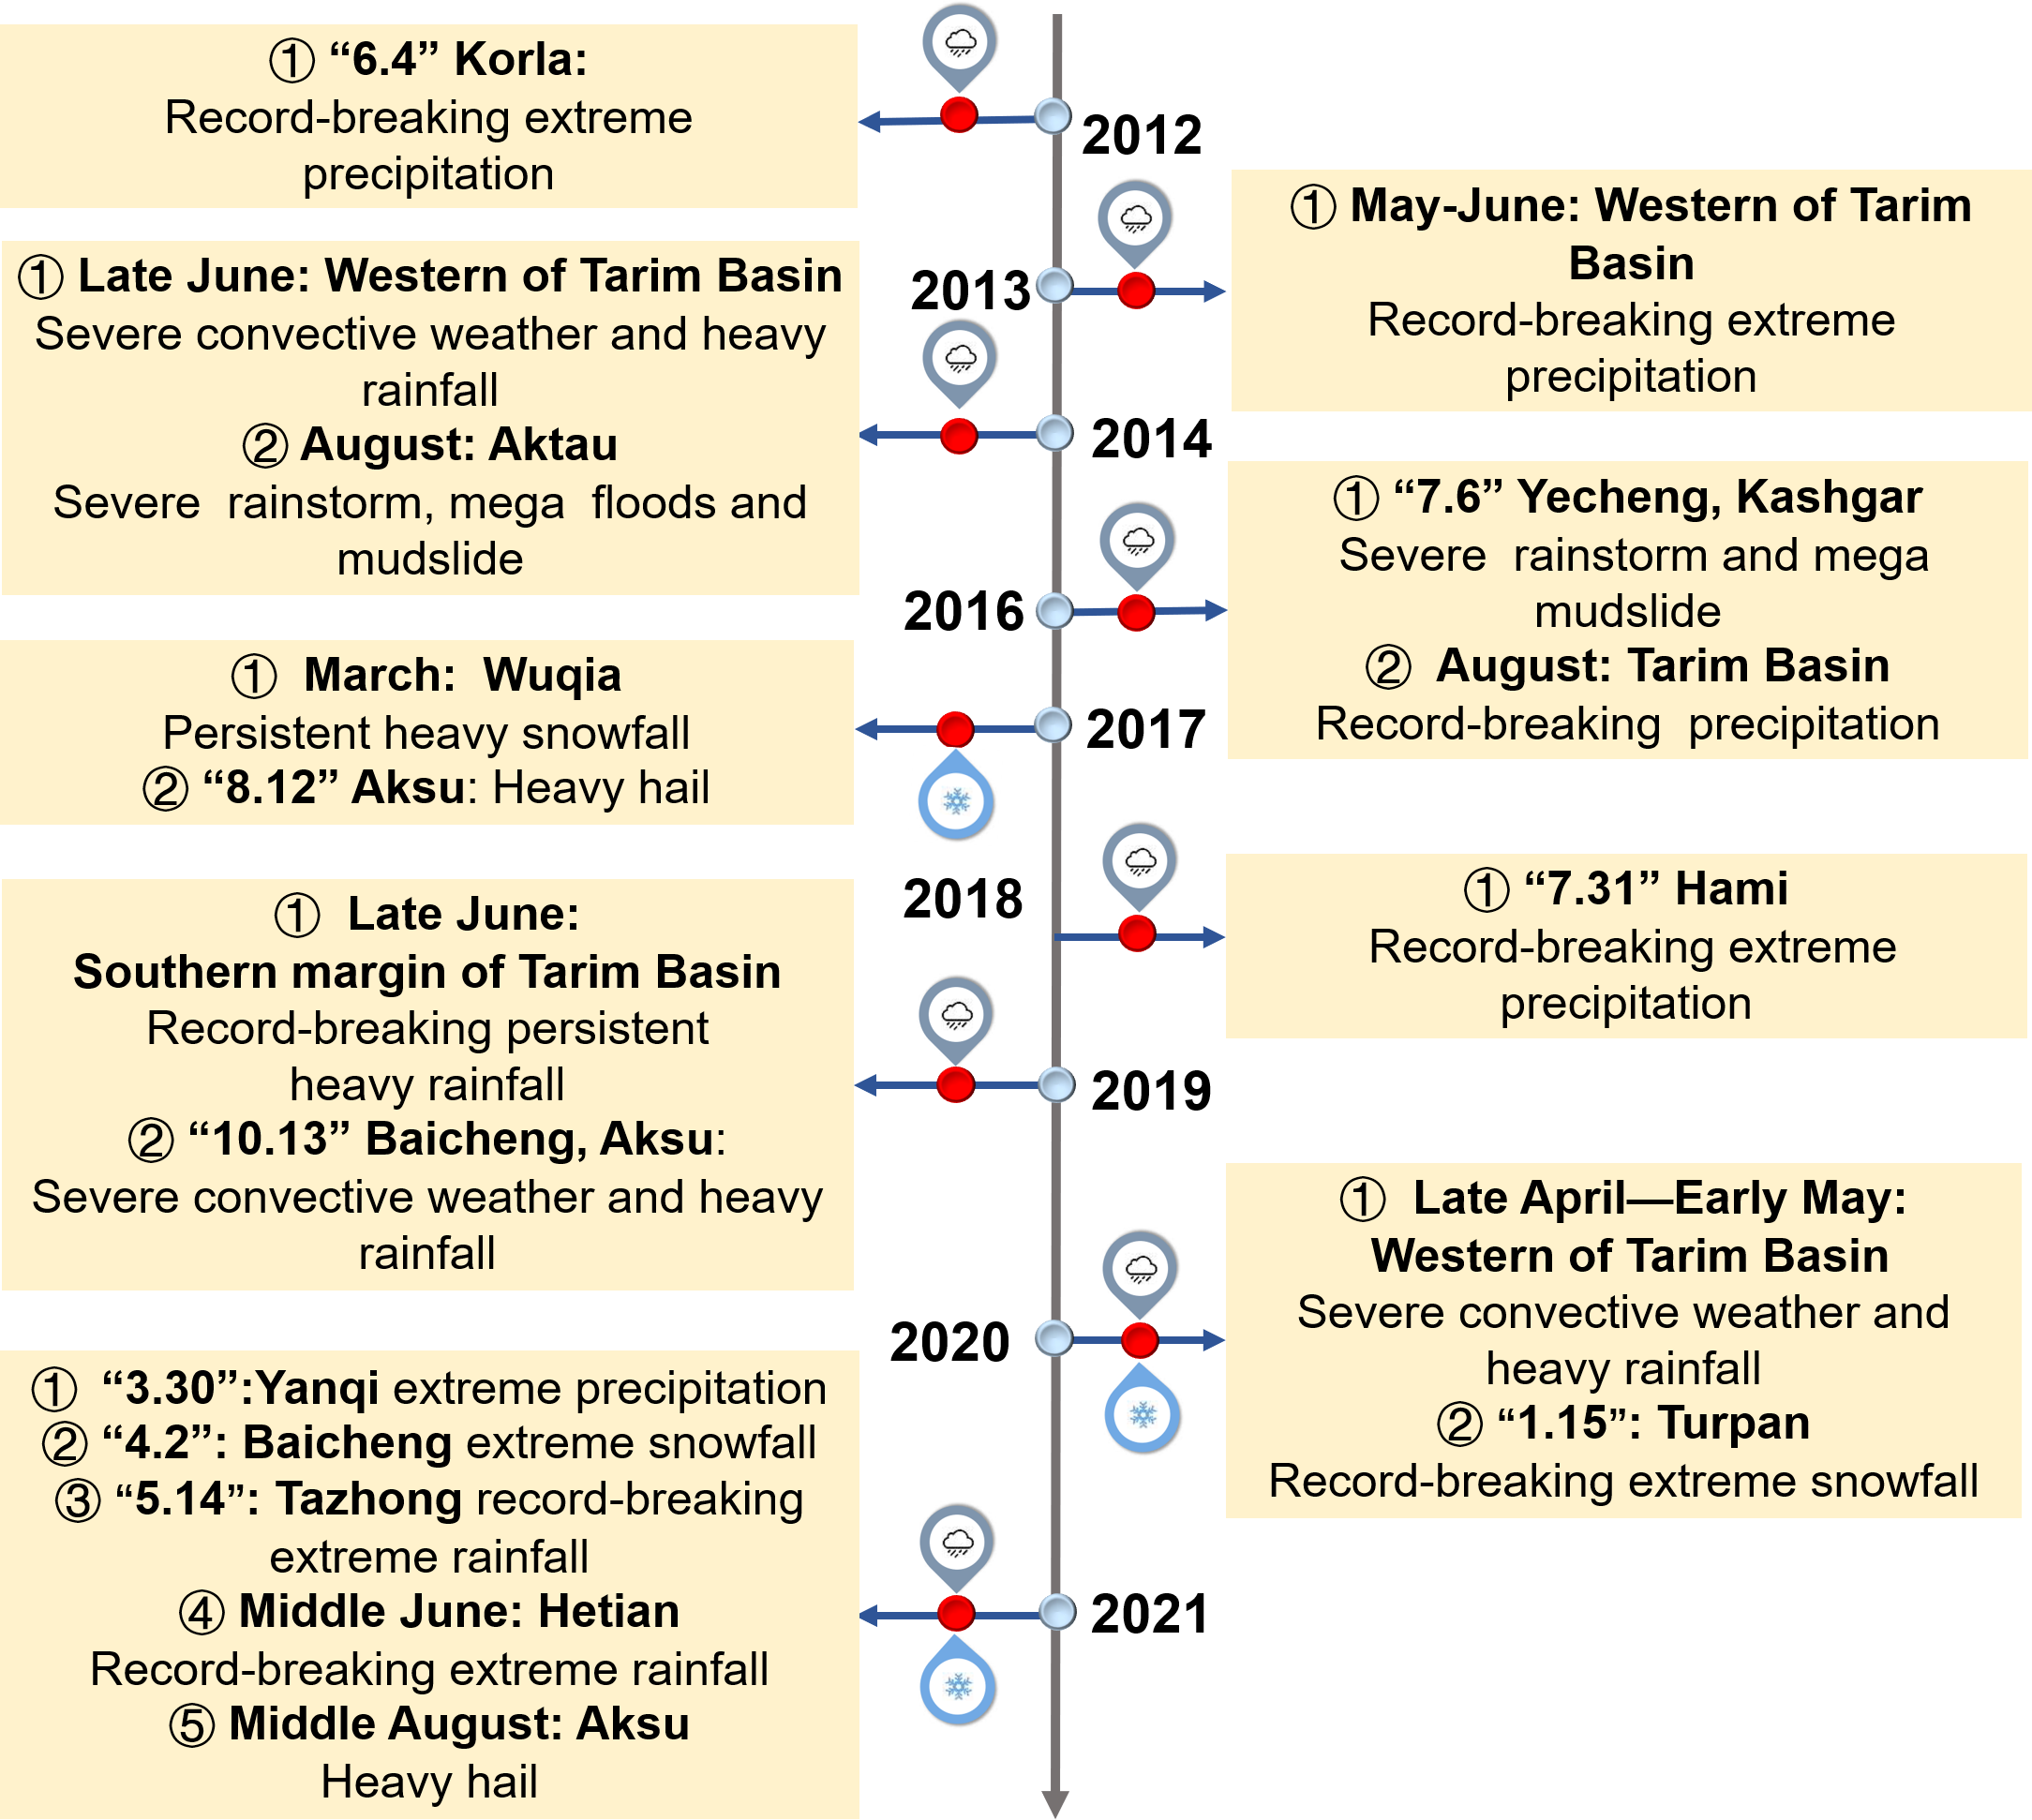
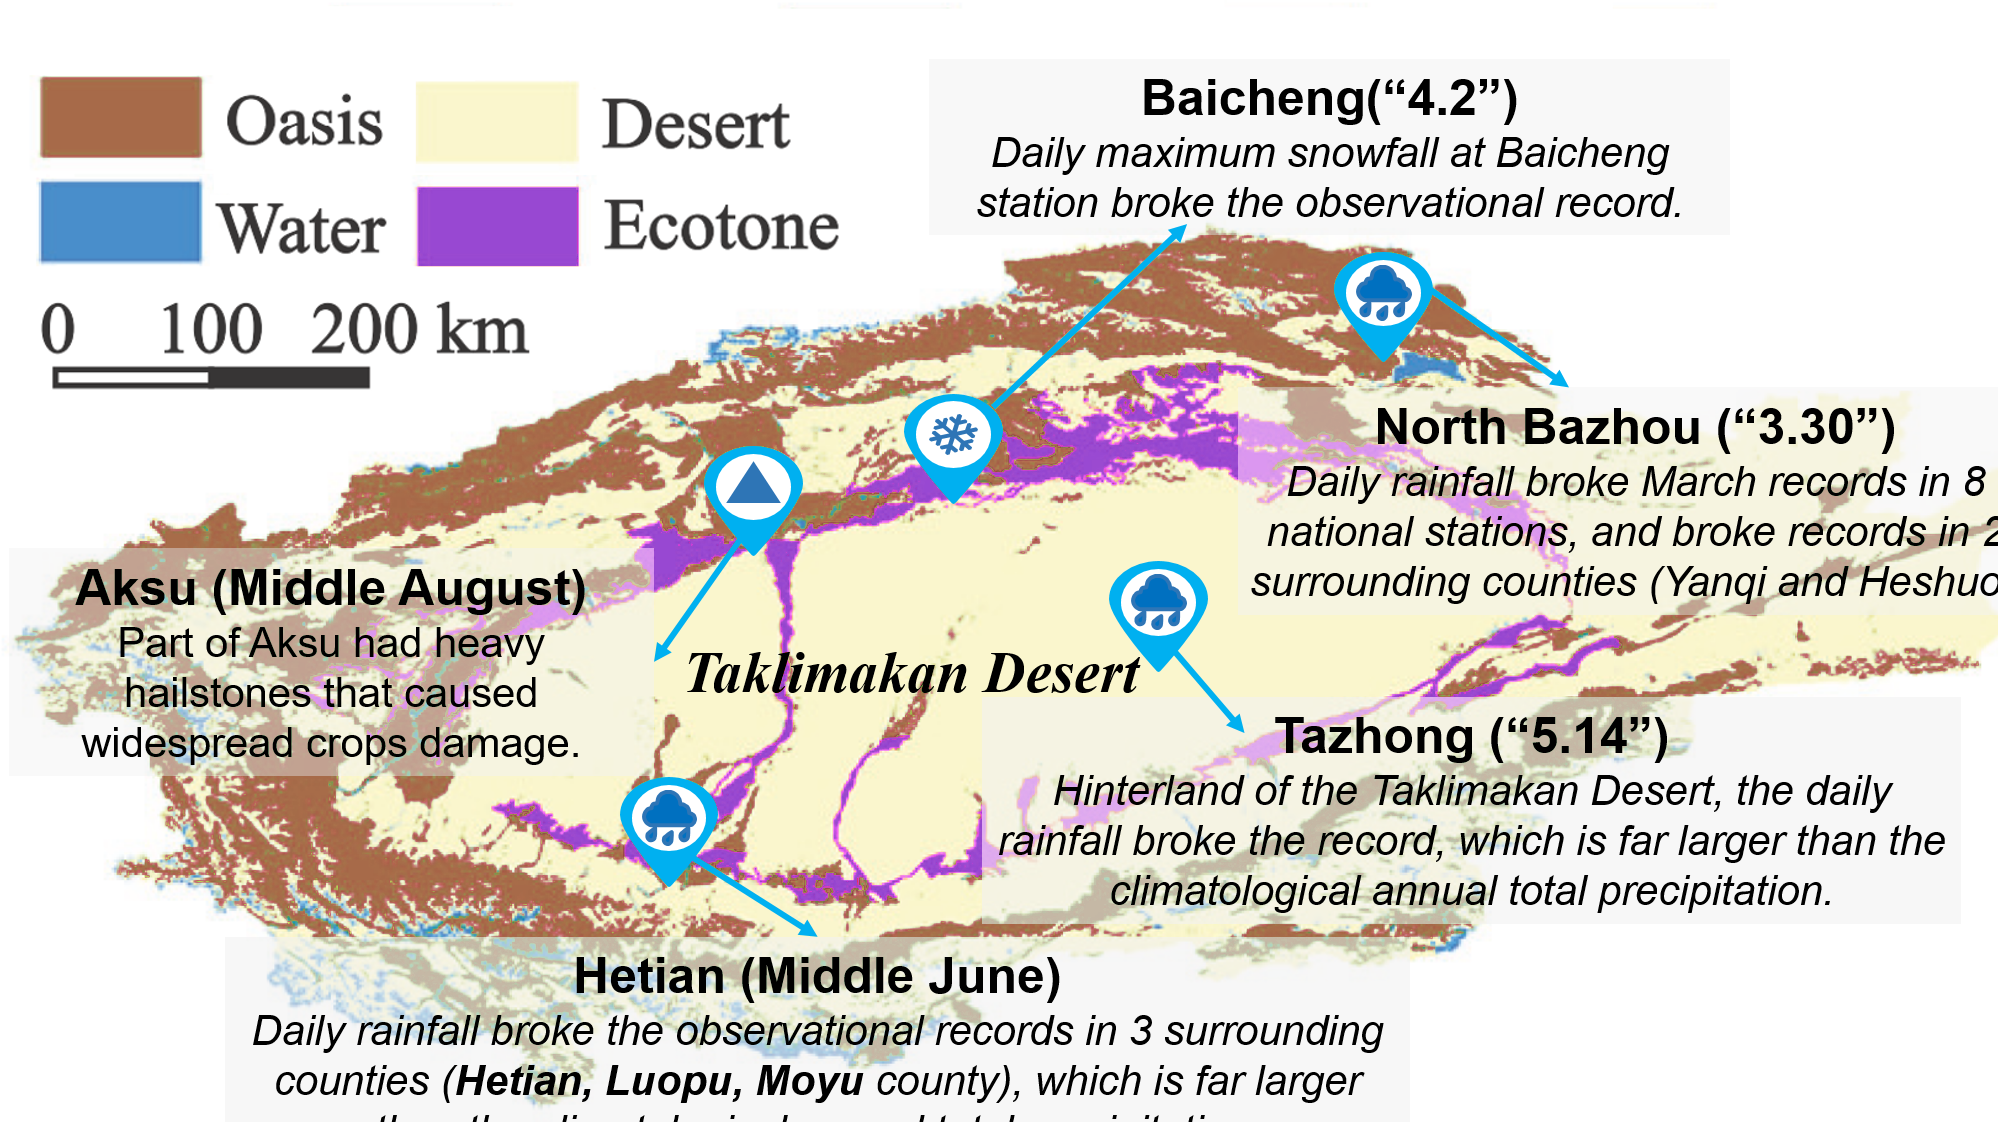
We also summarized the high-impact extreme precipitation events from a time-sequence perspective during 2012–2021, with a focus on the TD along and surrounding desert oases and mountainous regions. As shown in Fig. 7, 17 extreme precipitation events were highlighted. In the context of the warming trend, 2021 was remembered for its unprecedented extreme events, such as heavy rainfall, cold waves, heatwaves, and hailstorms, which were recorded in the TD and surrounding areas. We highlighted five high-impact extreme events that occurred in 2021 in the TD and surrounding areas, including extreme heavy rainfall in North Bazhou in spring, extreme heavy rainfall over Hetian and Tazhong, heavy hailstorms over Aksu and Bazhou, and extreme heavy snowfall over Baicheng during the summer (Fig. 8).
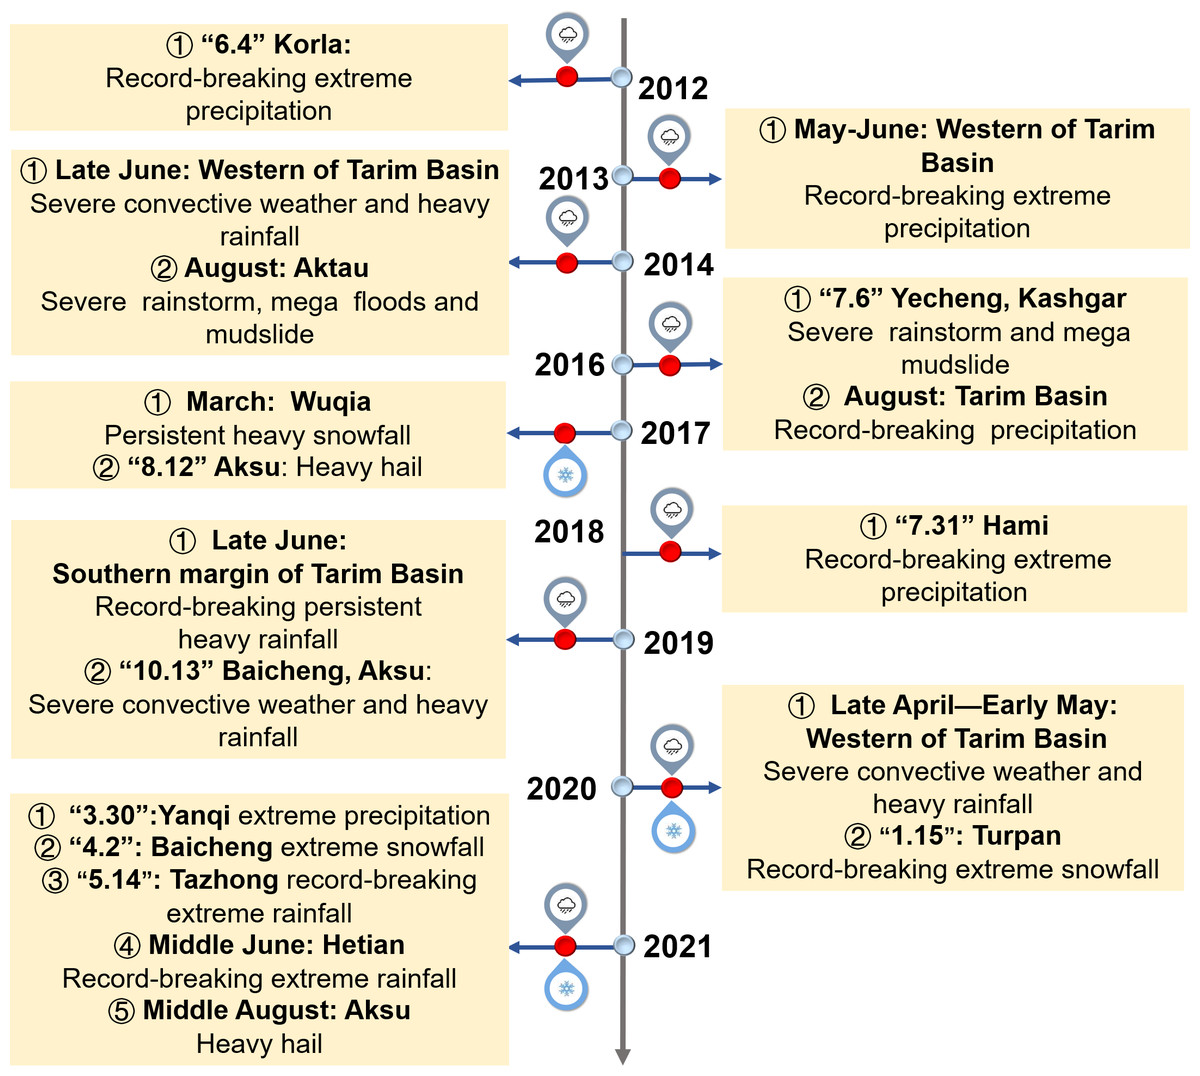
Figure 7: Extreme precipitation events during 2012–2021 listed in temporal sequence.
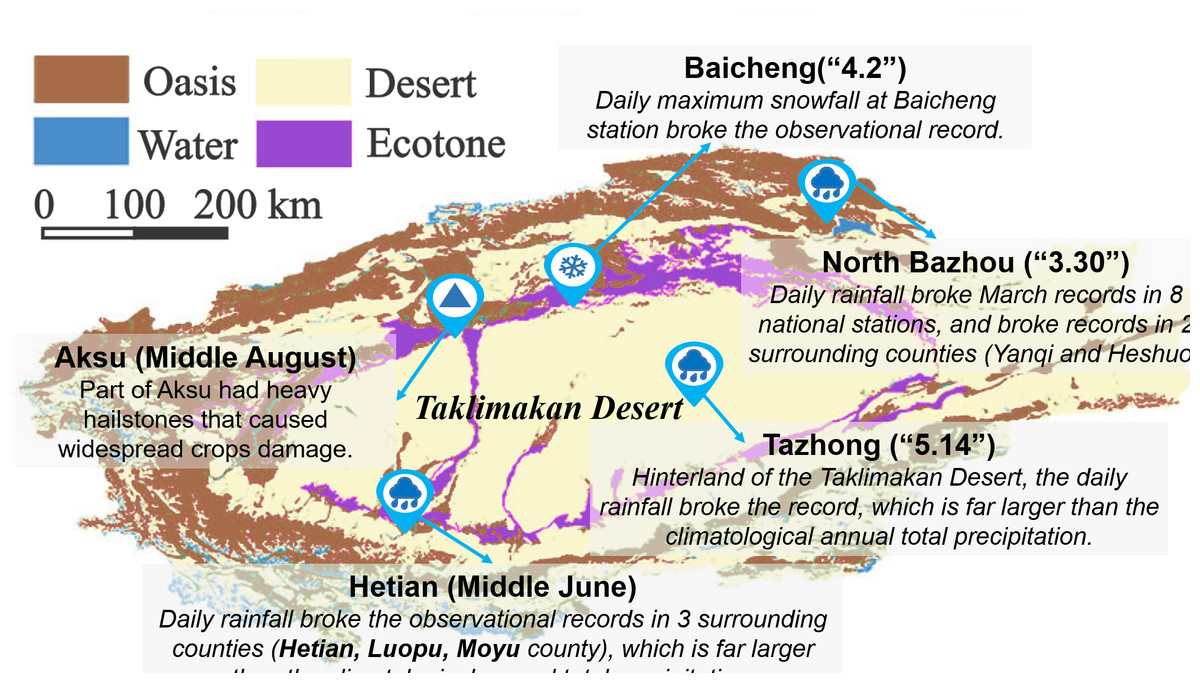
Figure 8: High-impact precipitation extremes observed in the Taklimakan Desert and surrounding areas during 2021.
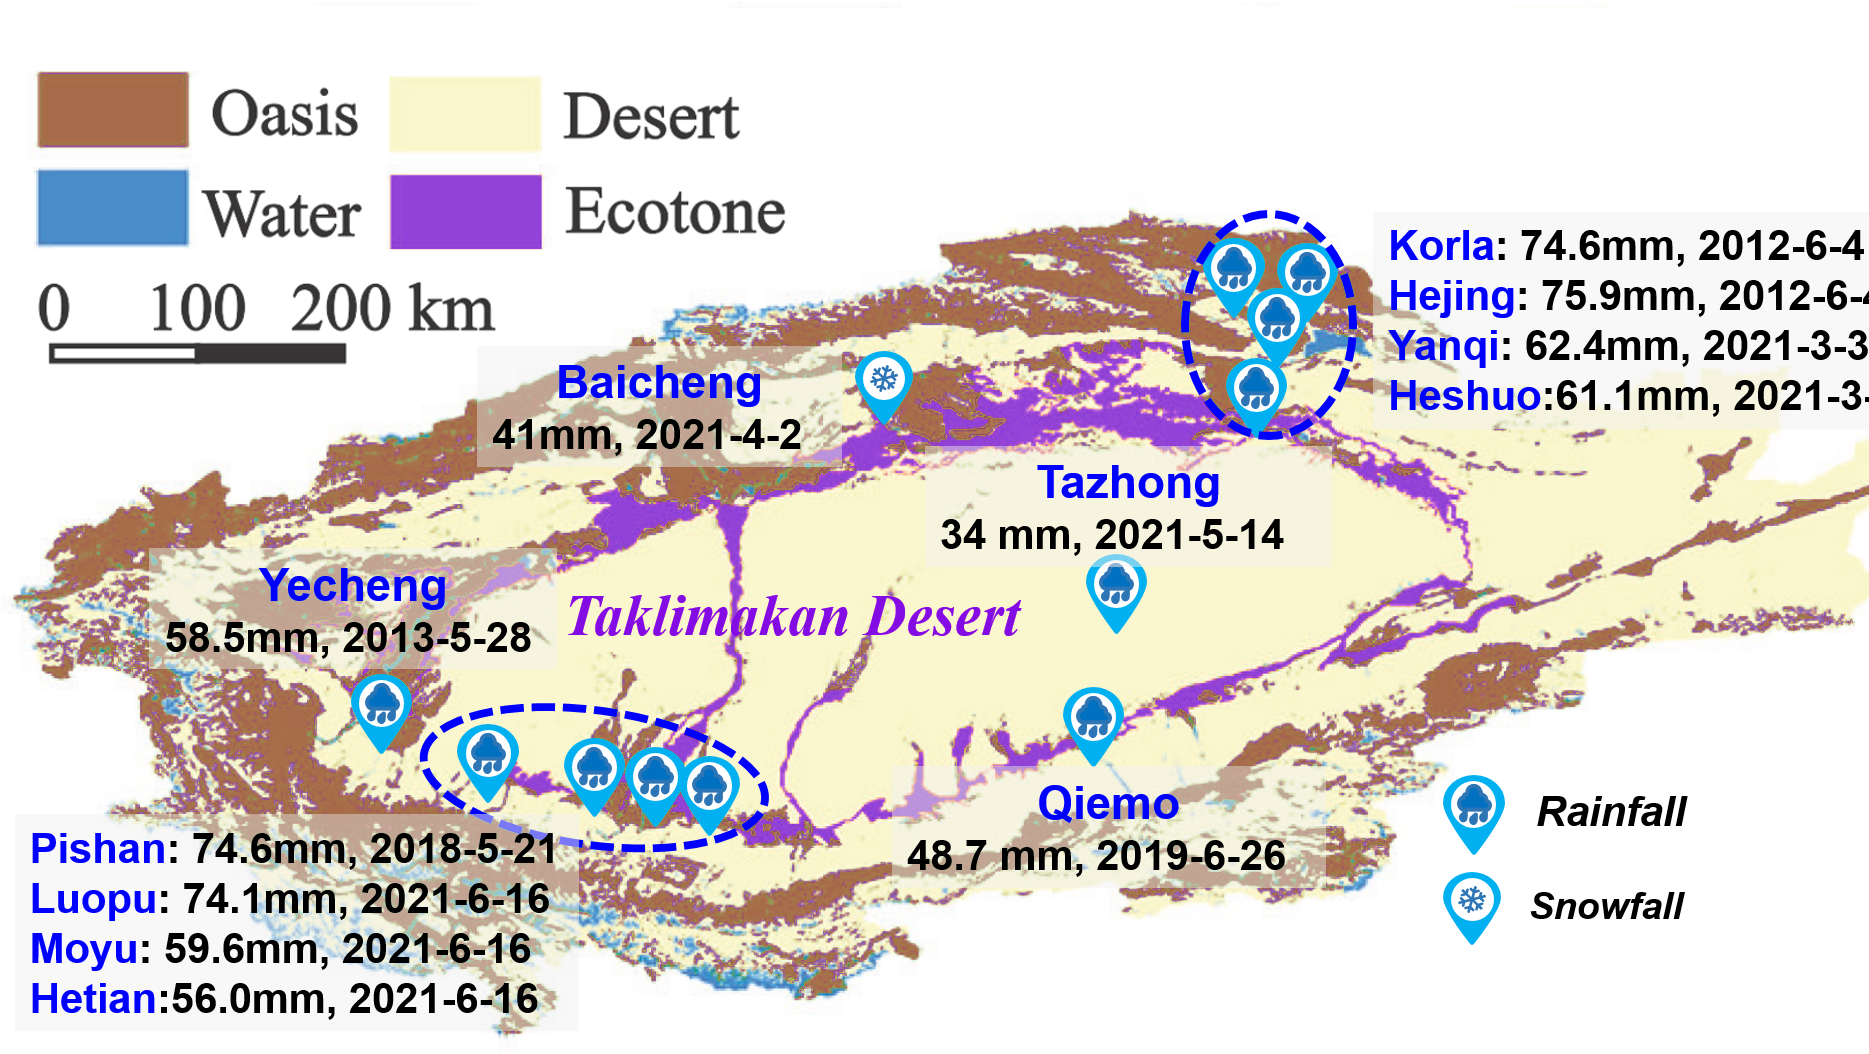
Extremely heavy rainfall over Hetian in mid-June 2021
Vast areas of the TB received heavy rainfall in mid-June 2021. During June 14 and 17, heavy rainfall occurred in the western TB region, including the Kashgar and Hetian regions of Xinjiang (Fig. 9A). The maximum rainfall accumulated was recorded in Shanpulu Town, Luopu County of the Hetian Region, with a total rainfall amount of 121.6 mm during this period. Luopu County observed an accumulated rainfall amount of 97.6 mm, which is 2.7 times larger than the annual climatological total amount (1971–2000) of 35.5 mm (Fig. 9B). The daily maximum rainfall in Luopu County (74.1 mm), Moyu County (59.6 mm), and Hetian County (56.0 mm) on June 16, broke the observed records and exceeded the annual climatological rainfall. The daily rainfall in Pishan County (56.6 mm) also broke the summer records. In addition, the daily rainfall in Shache County (37.1 mm), Yingjisha County (28.2 mm), and Yecheng County (23.7 mm) in the Kashgar region broke the June record. The heavy rainfall in Luopu County decreased at night from 2000 LST on June 15 to 0200 LST on June 16. The maximum hourly rainfall reached 29.4 mm, the three-hourly rainfall reached 60.1 mm, and even reached 75.4 mm for six hourly rainfall events during this period in Shanpulu Town of Luopu County (Fig. 9C). The sudden torrential rainfall resulted in floods, landslides, debris flows, and waterlogging and exacerbated socioeconomic losses. The extreme event affected 126,000 people in the Hetian region, with 11,200 people having to be relocated. The direct economic loss amounted to 108 million RMB in the Hetian region.
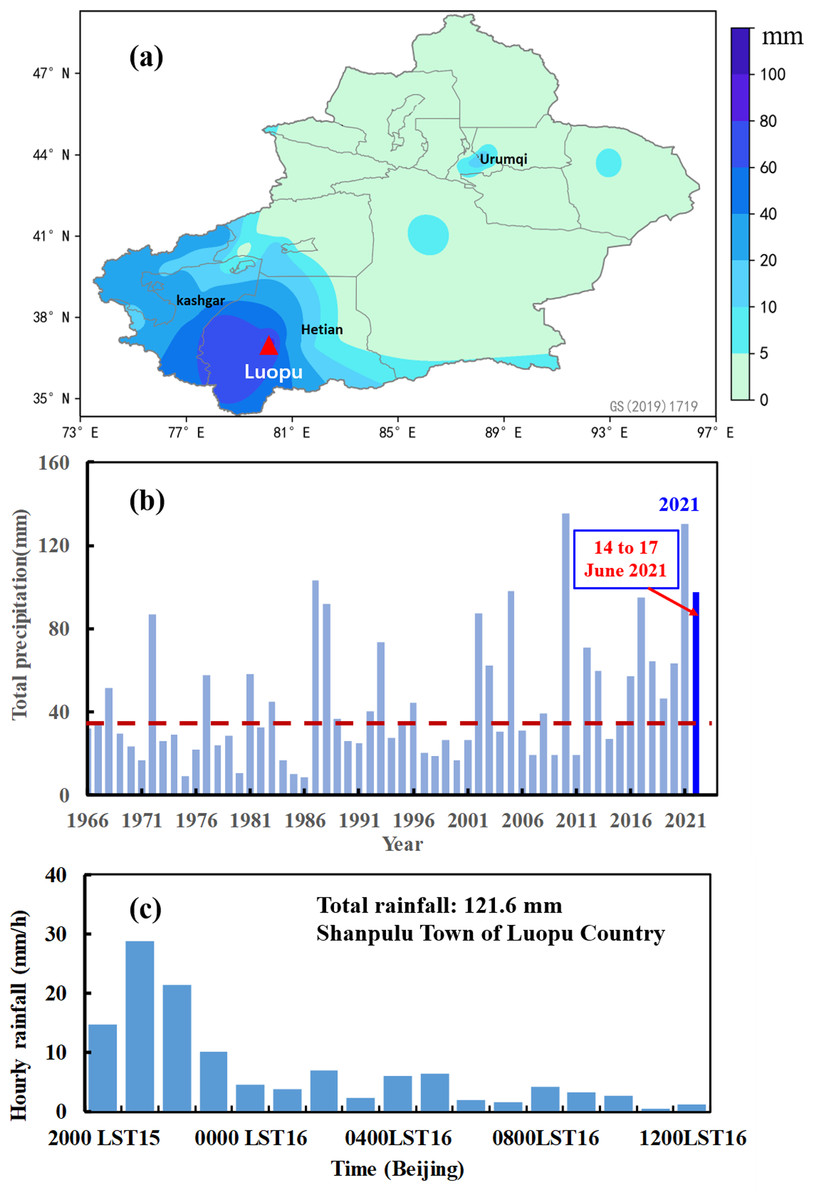
Figure 9: (A) Accumulated precipitation (mm) from June 14 to 17, 2021. (B) Time series of annual total precipitation over the Luopu station during 1966–2021. (C) Change in hourly rainfall over Shanpulu Town in Luopu County from 2000 LST on June 15 to 1200 L.
The dotted-redline represents the total annual climatological amount (1971–2000).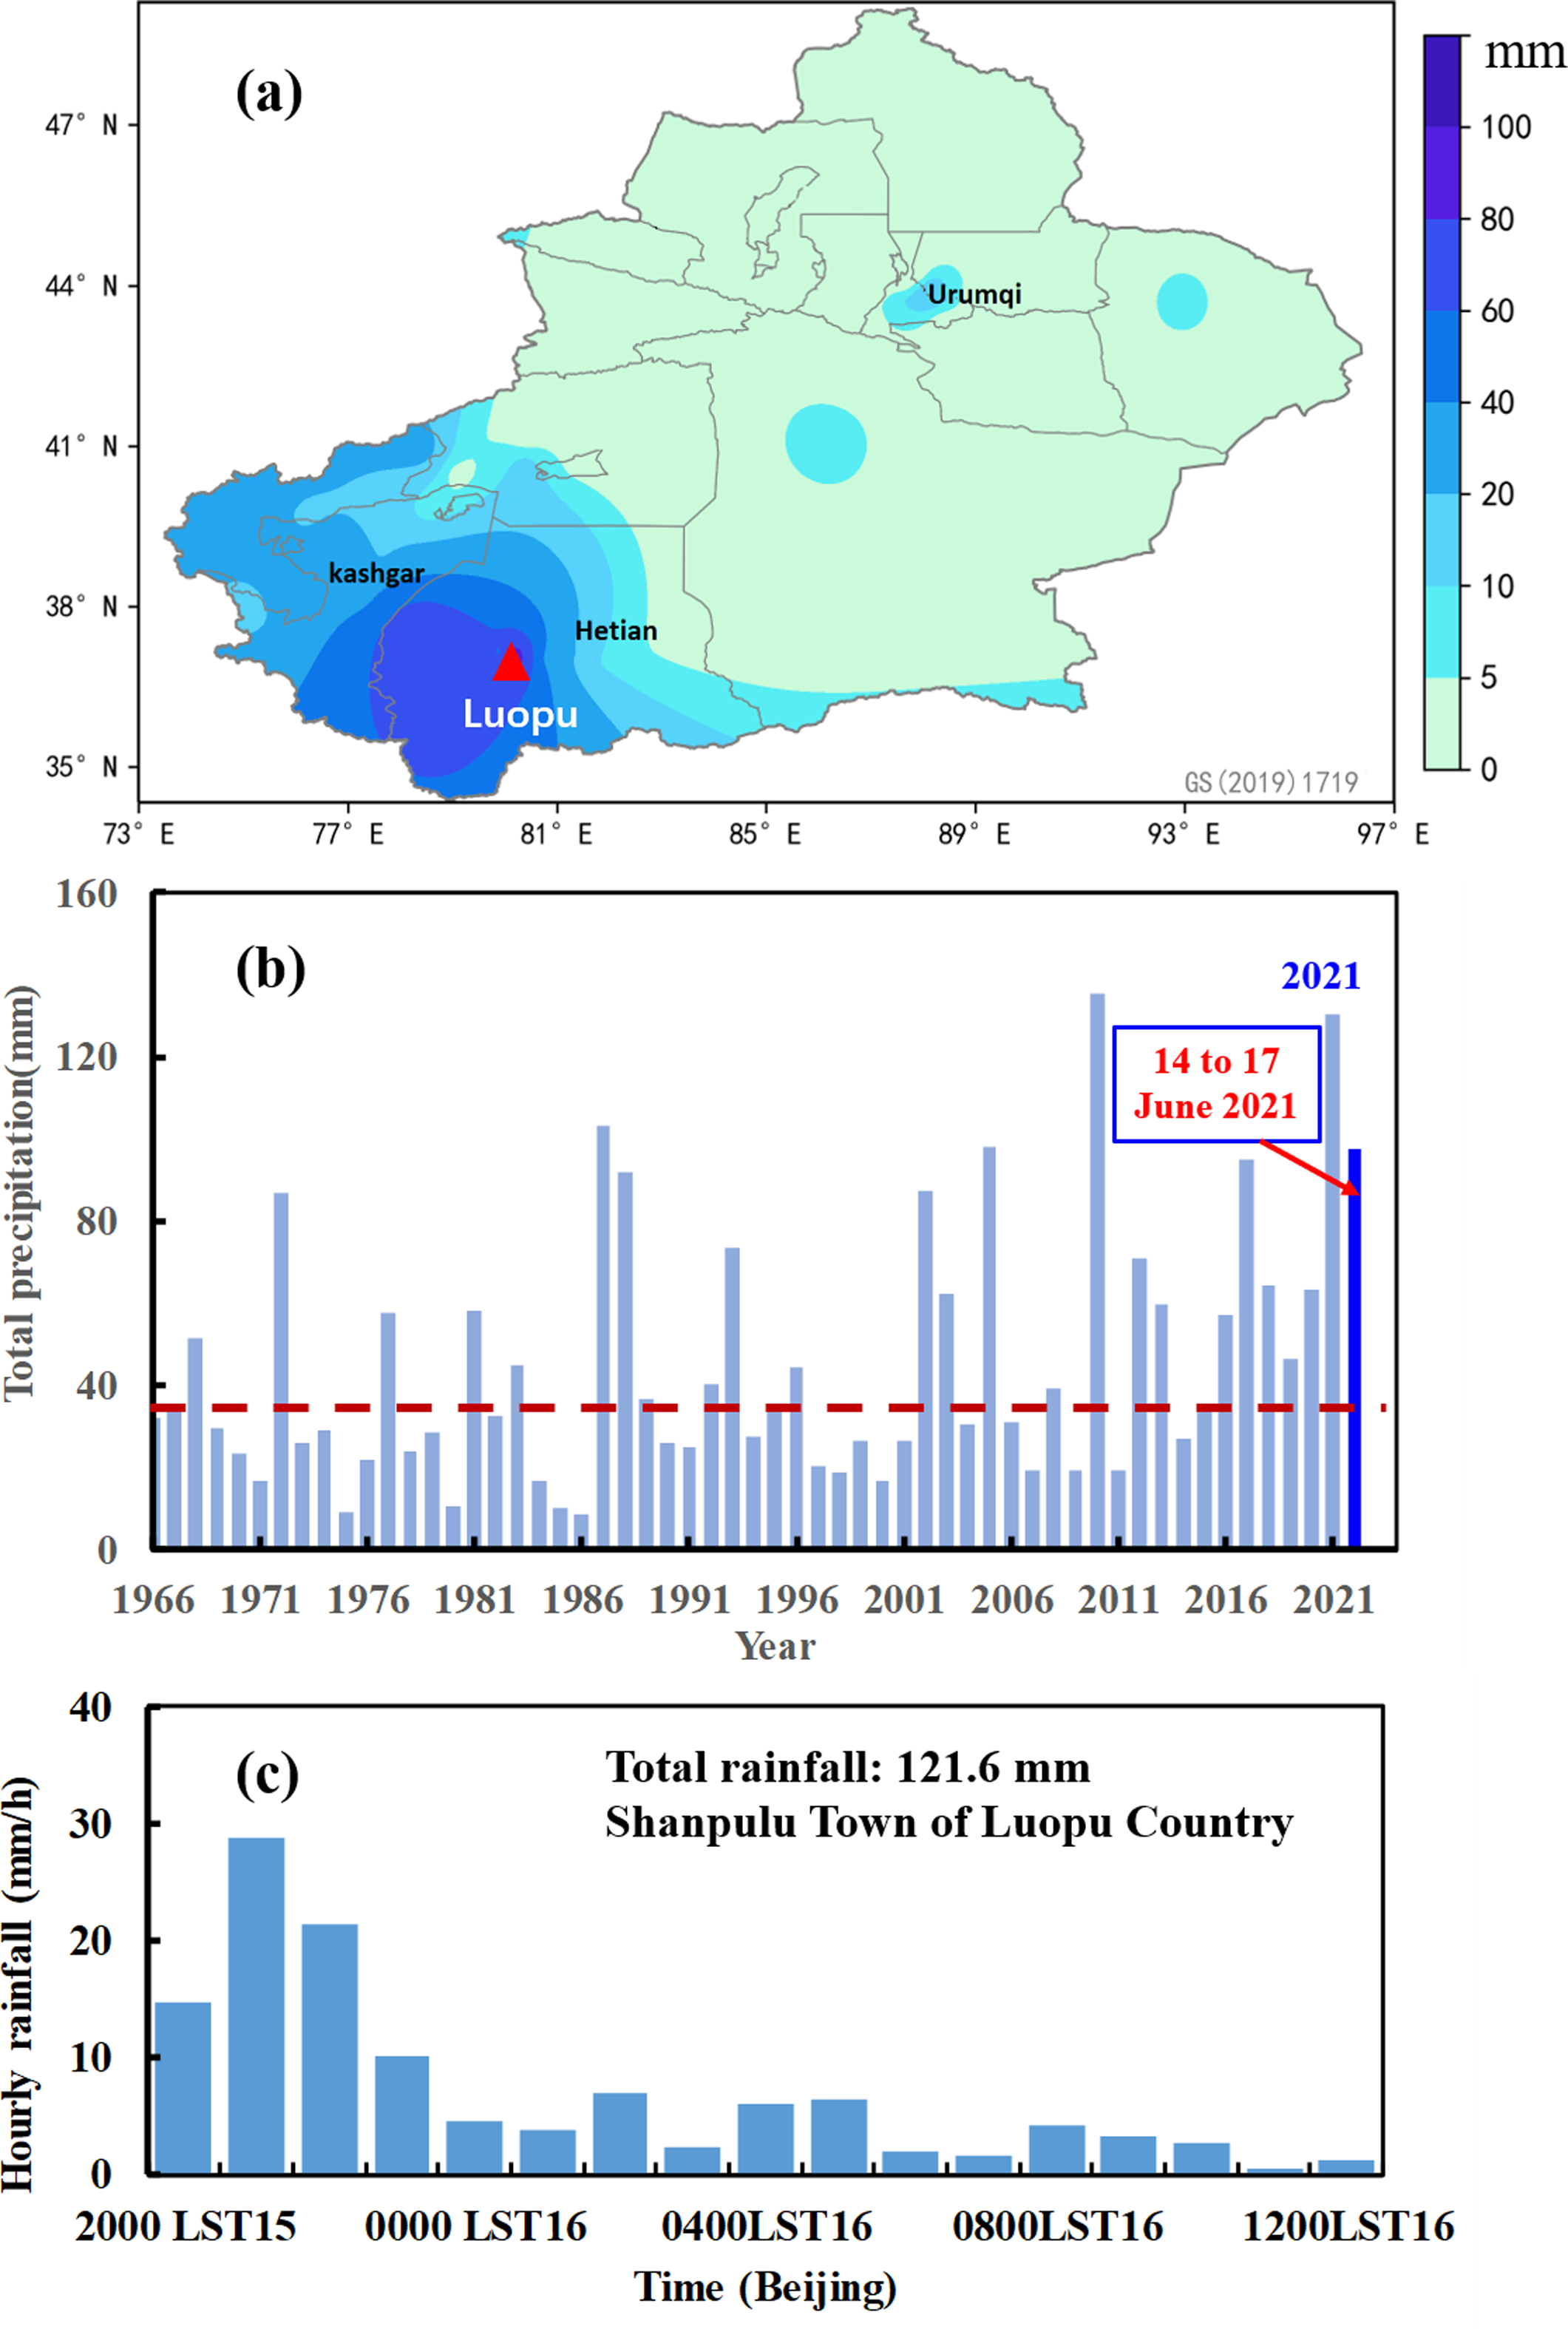
This extreme heavy rainfall event was controlled by a stable atmospheric circulation configuration. During this extreme event period, the 100 hPa South Asia High was divided into a two-center pattern: Xinjiang was in the subtropical trough area, and the western TB was in the divergence area of the southwest jet stream (Fig. 10A). The 200 hPa westerly jet was located over the TB. Due to the 500 hPa north ridge south vortex circulation pattern, the low vortex over the western TB was stable and persisted for this period (Fig. 10B). In addition, the 700–850 hPa easterly flow was stable. The southwesterlies on the east side of the Indian low-pressure system and southeasterlies at the outer part of the low vortex, transported water vapor to Hetian and converged there. The moisture inflows into the western TB occurred mainly via the southern boundary at 500 hPa, and the east boundary transport at 700 hPa at ground level. The contribution of water vapor transport in the southern and eastern boundaries was large, and the contribution of water vapor inflows through the southern boundary during the heavy rainfall period was 78%. In addition, orographic lifting of the Kunlun Mountains enhanced torrential rainfall. This underlying mechanism is essential for understanding and forecasting extreme events in arid regions.
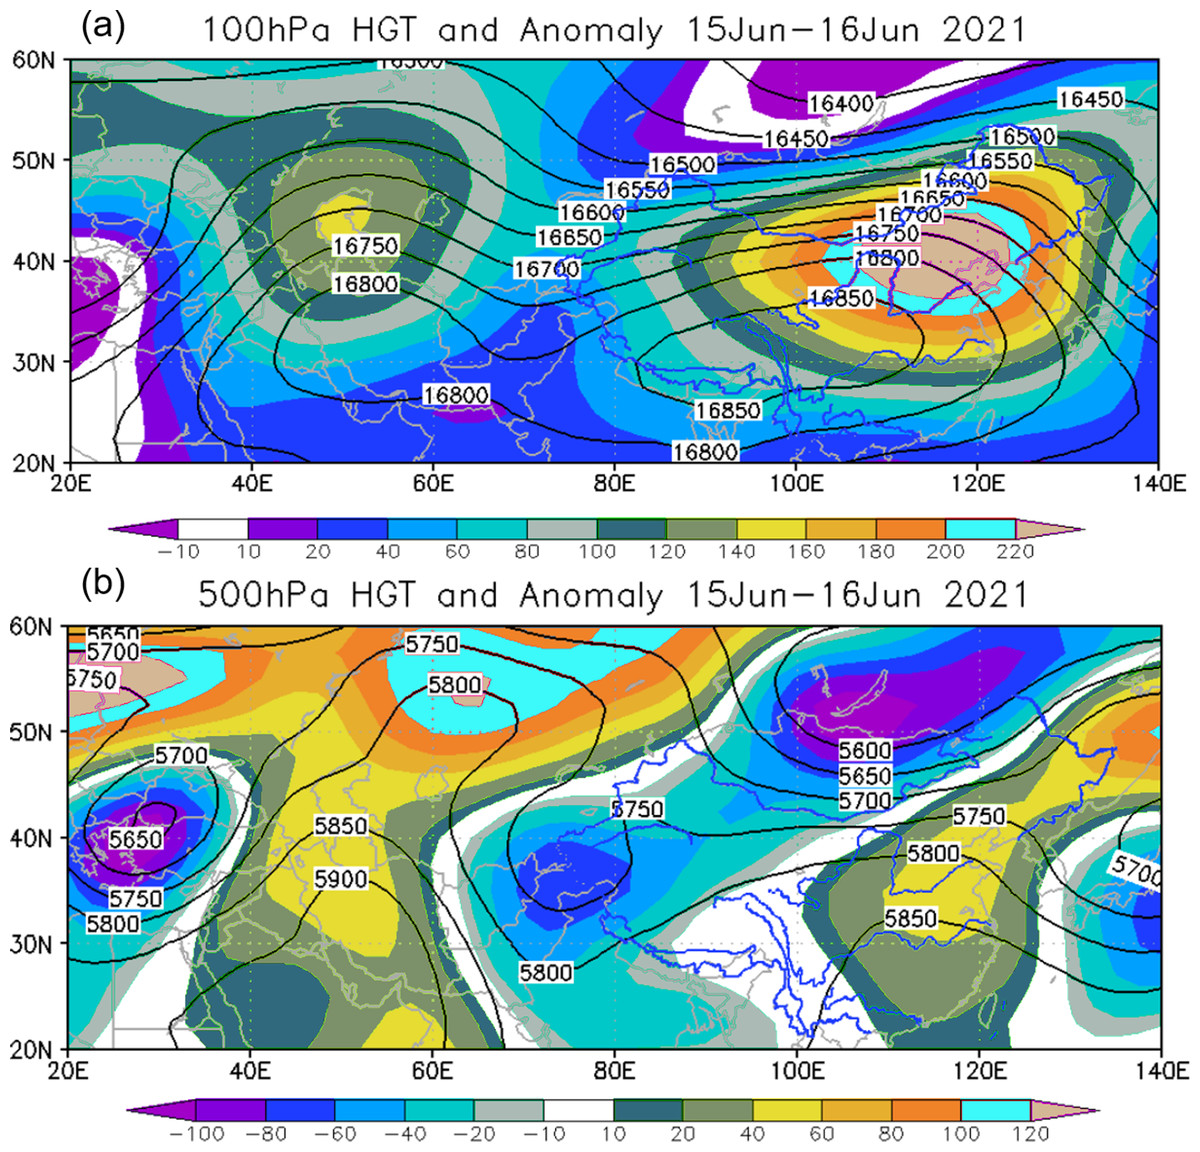
Figure 10: 100 hPa (A) and 500 hPa (B) geopotential height anomaly (unit: dagpm) from 15 to16 June 2021.
The shaded area is the anomaly field and the contour line is the mean field.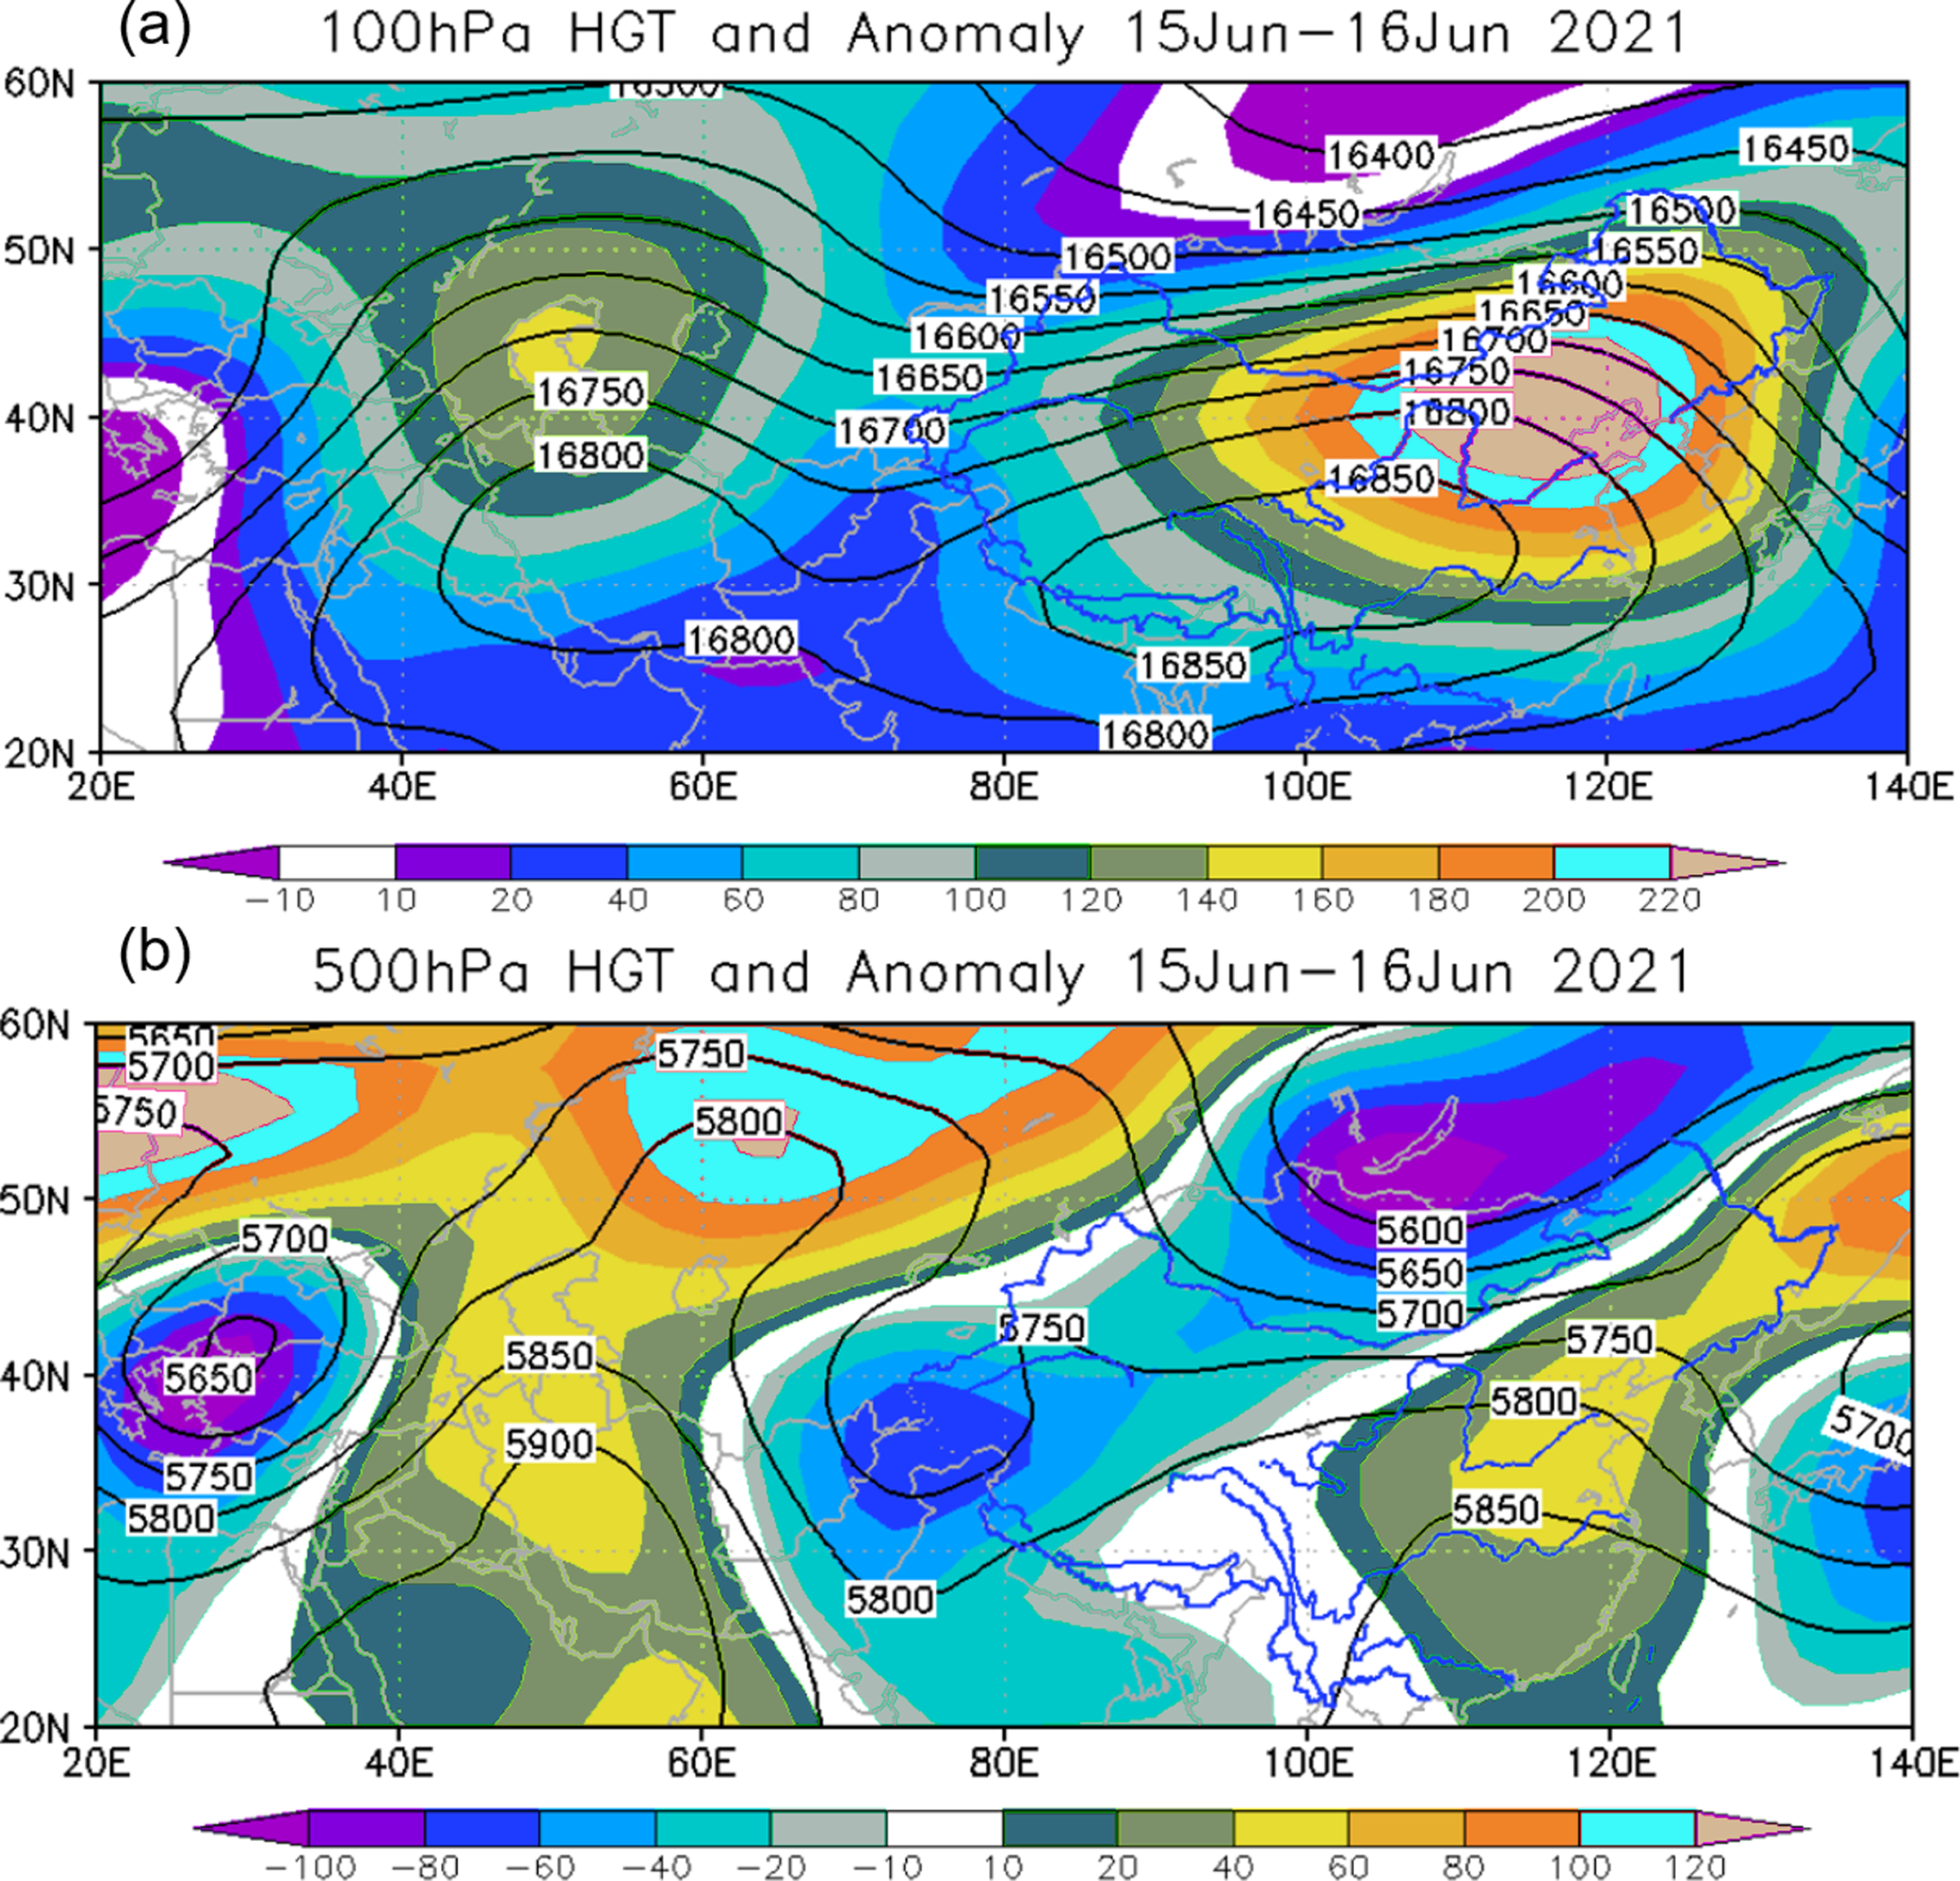
The strongest heavy snowfall over Baicheng in April 2021
A large part of western Xinjiang received heavy snowfall and rainfall in early April 2021. During April 1 and 2, heavy snowfall occurred in the western TB, including the Aksu and Kashgar regions of Xinjiang. The most heavy snowfall was recorded in Tiereke Town in the Baicheng County of the Aksu region, with a total snowfall amount of 89 mm during this period. The daily maximum snowfall in Baicheng County (41.0 mm) and Xinhe County (14.3 mm) on April 2, broke the April record. In particular, heavy snowfall at the Baicheng Station occurred within 13 h from 0200 LST on April 2 until 1400 LST on April 2. The heavy snowfall was concentrated and occurred within in hours, with the maximum hourly snowfall reaching 5.6 mm/h, and the hourly snowfall received two mm/h, except at 0300 LST and 12 LST on April 2.
During this extreme event, the South Asia high-pressure system, trough in the subtropical, subtropical westerly jet, and transect line of the Tibetan Plateau, formed a saddle-type large-scale circulation pattern. Owing to this large-scale pattern, the Central Asian low vortex remained stable and persisted over Xinjiang. The water vapor was mainly transported by the westerlies at the front of the Central Asian low vortex, the easterlies along the Tianshan anticyclone in northern Xinjiang, and the easterlies along the Hexi Corridor in the east of the Qinghai-Tibet Plateau and converged in western Xinjiang (Fig. 11). The anomalous cyclones of Central Asia and the anomalous anticyclones in eastern China, and strengthened the moisture transport from the South China Sea, Bay of Bengal and northwest Pacific Ocean. In addition, the local moisture in the basin also contributed to the heavy snowfall. The orographic lifting of the Tianshan Mountains located to the north of Baicheng is also favorable for heavy snowfall.

Figure 11: (A–D) The integrated water vapor flux from ground to 300 hPa (black vector: kg (m s)−1) and the integrated water vapor flux divergence (colored area: 105 kg m−2 s−1) from 1 to 2 April 2022.
The red dots represent Baicheng County, Xinjiang.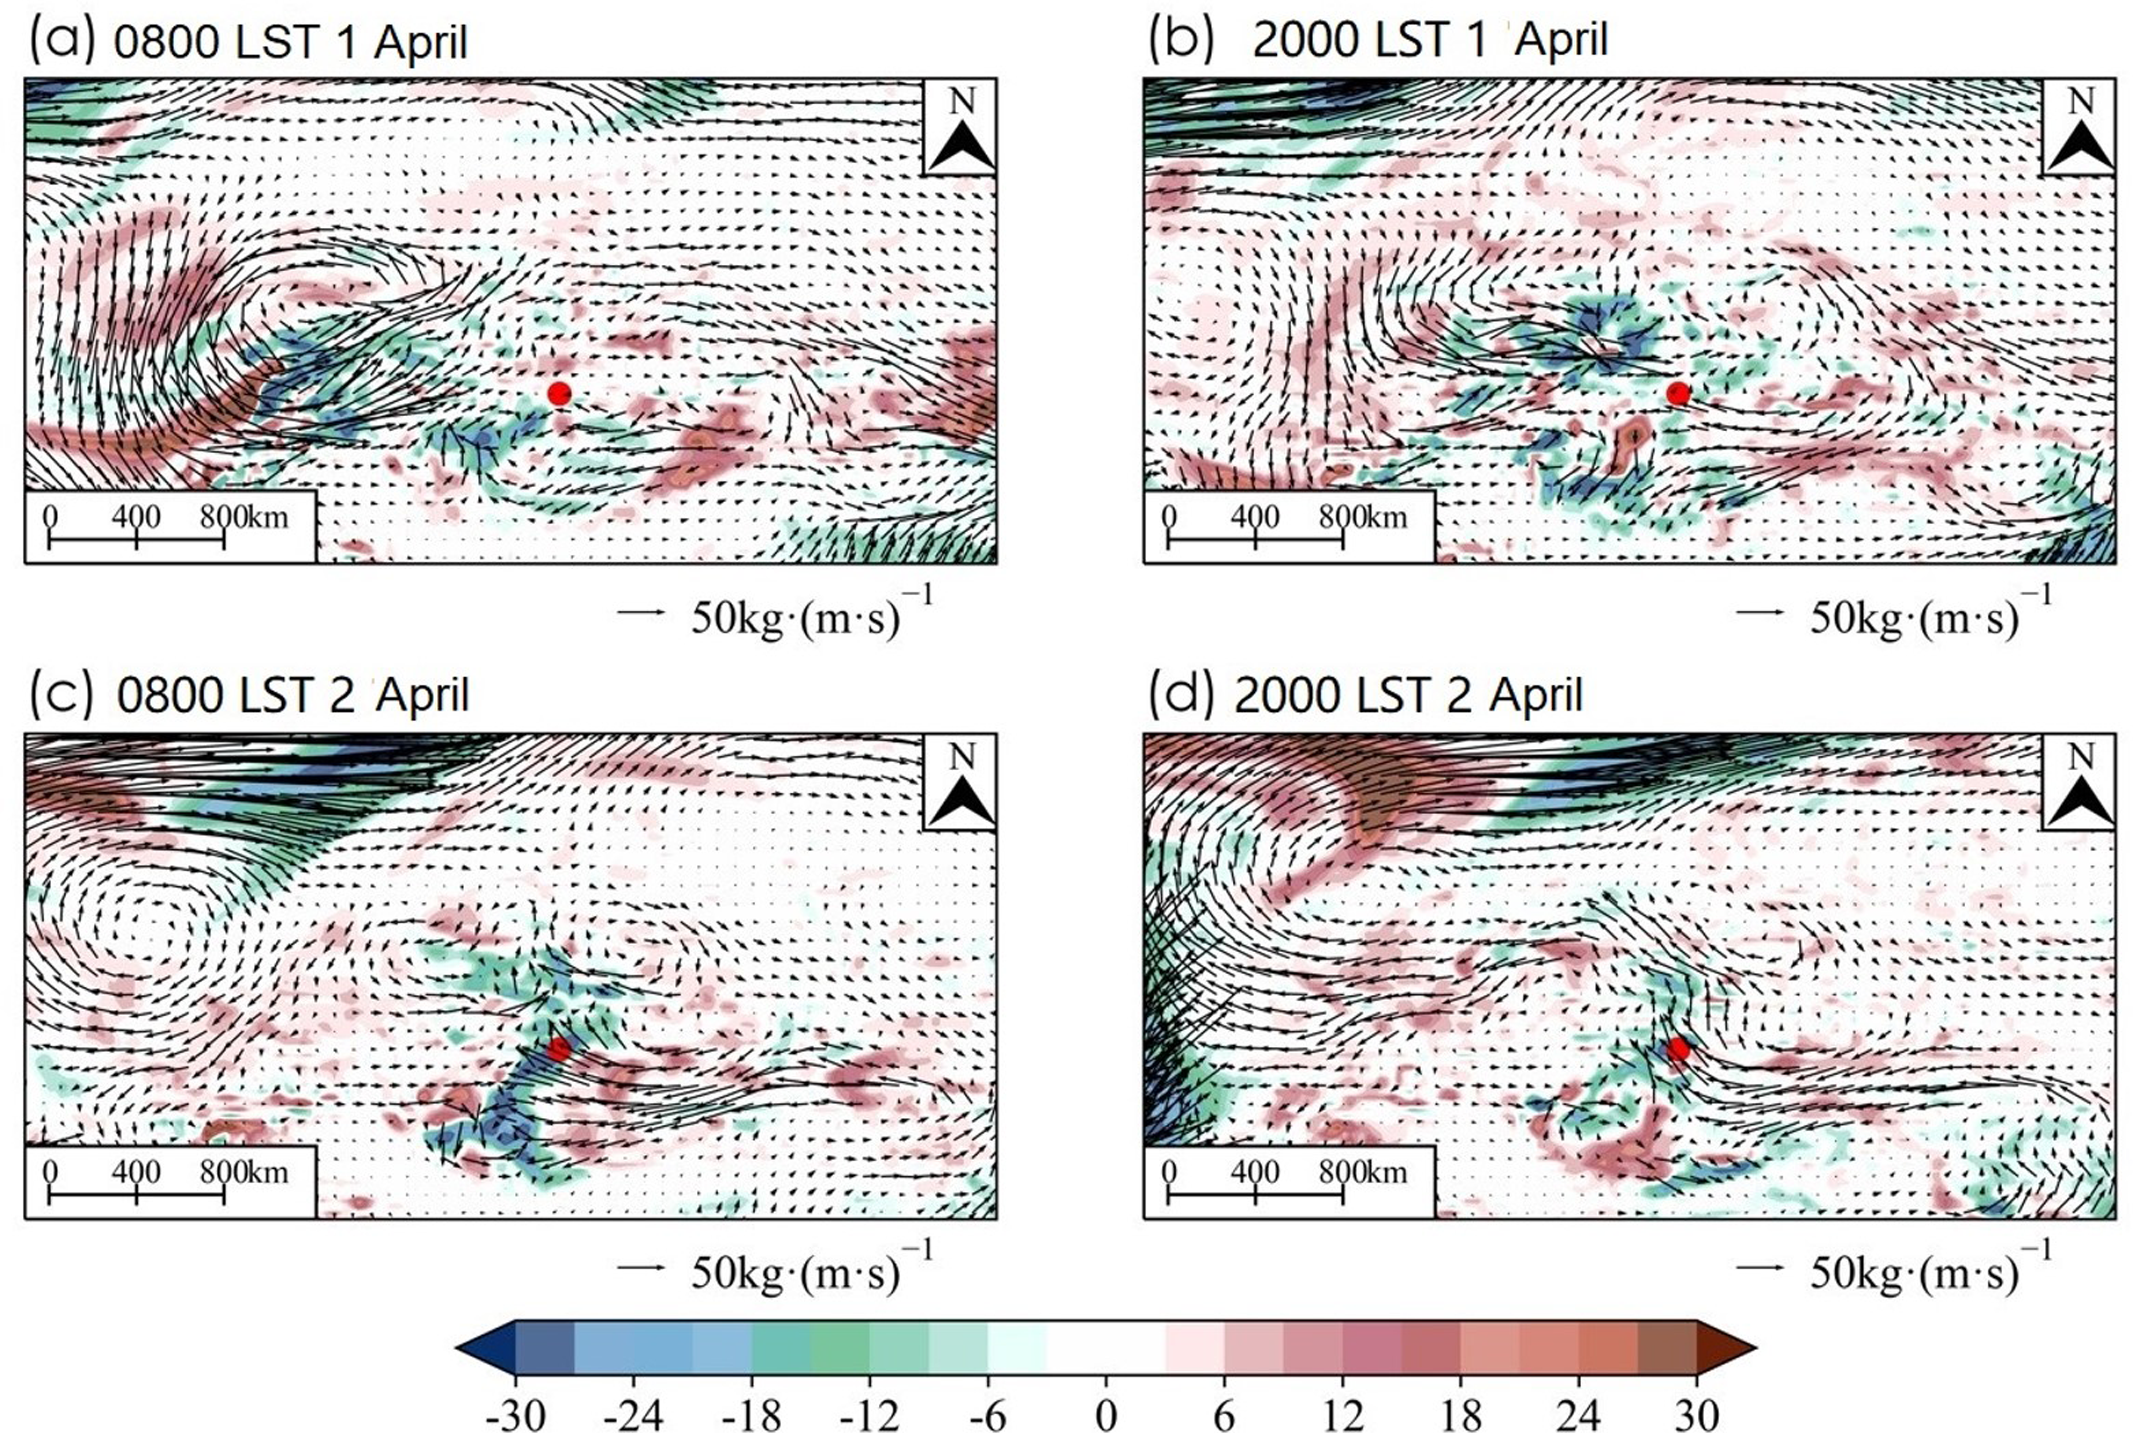
Although the entire TB is controlled by the cyclone system, the moisture convergence is regional, and is mainly located in Aksu region. Thus, the small-scale system is the main reason for the local snowstorm. The vertical wind shear of 500-300 hPa affected the starting and ending time of snowfall, and the threshold value was approximately 16 m/s. The increasing moisture flux of lower layer is related to the strengthen easterlies. The wet potential vortex anomaly of high level is mainly affected by the vertical potential temperature gradient and the westerlies anomaly, while the low level is mainly caused by the development of wet baroclinic instability. In addition, the stability of mesoscale clouds plays an important role in the maintenance and strengthening of heavy snowfall.
Extremely heavy rainfall over north bazhou in early spring 2021
A large part of northern Xinjiang and eastern TB received excessive rainfall in the early spring of 2021. Extreme rainfall occurred north of the Bazhou and Yanqi Basin on March 30, which was the earliest rainstorm recorded on meteorological records. After this event, accumulated rainfall at 17 weather stations had recorded the rainstorm, of these, the maximum accumulated rainfall occurred in 27th regiment of Tiemenguan County, with an accumulated 75.2 mm during this period. The daily maximum rainfall in Yanqi County and Heshuo County was 62.4 mm and 61.1 mm, respectively, which broke the historical record. In addition, the daily rainfall in Yuli and Korla County reached 43.4 mm and 24.2 mm, respectively, which broke the spring record. During this extreme event, the beginning of systematic precipitation occurred during the night and was of a mixed precipitation type. The hourly maximum rainfall was between 4 and 15.3 mm/h with convective precipitation. Extreme flash flooding inundated many roads, highway bridges, rail lines, and caused urban waterlogging that resulted in power and water cuts.
During this extreme event, a southwest jet of 200 hPa was maintained over the Tianshan Mountains, and the Yanqi Basin was located at the jet exit, which was conducive to the development of low-level convection. There is a meridional circulation of two ridges and one trough from Europe to Siberia at a mid-high latitude of 500 hPa. There is a ridge of high pressure in Eastern Europe and Lake Baikal, and a low trough active region from West Siberia to the Caspian Aral Sea, and a short-wave trough continuously enters the TB.
Water vapor from the extreme rainfall was mainly transported by the west and southwest path that originated from the Mediterranean Sea, Caspian Sea, Arabian Sea, Bay of Bengal, European region, and Central Asia region. The moisture in the southwest path and the east path converged and gathered north of Bazhou. In addition, evaporation of water vapor from the Bosten Lake during the daytime and strengthening of the east wind during the night, brought moisture to the center of the rainstorm. The TB atmospheric precipitable water increased from March 27 to 30, based on the GPS/met data, and received precipitable water that exceeded the monthly average by 1.8–3.3 times. The precipitable water at the Korla County exceeded 22 mm on March 29.
Concluding Remarks
According to the report on the WMO State of the Global Climate 2021, 2021 is identified as the 6th warmest period in 1880–2021 globally (World Meteorological Organization, 2021). Unprecedented extreme events were recorded in different areas of the world throughout 2021. For China, 2021 was the warmest year observed during 1961–2021 (Zhou et al., 2022), and in which devastating extreme events occurred (China Meteorological Administration, 2022). The TD and surrounding areas were the hottest regions in China, and the annual mean surface temperature in 2021 was the 4th warmest from 1961–2021, at a calculated temperature of 1.4 °C above normal state (1961–1990).
In this study, we investigated the recent change in precipitation and its extremes since 1961 over the TB. We also provided a review of high-impact extreme precipitation events during 2012–2021 and focused on unprecedented extremes events that occurred in 2021 over the TB. The TB has experienced significantly “warmer and wetter” trends since 1961, and heavy rainfall has increased significantly in the TD and its surrounding areas during the 2000s. For the heavy rainfall in the TB, it was mainly concentrated in the summer, and had a relatively lower frequency but had a larger rainfall intensity, shorter duration, and stronger extremes. Spatially, heavy rainfall distribution was extremely uneven and was mainly distributed in mountainous areas and influenced by local topography. In addition, the year 2021 was identified as the 4th warmest for 1961–2021, and was remembered for unprecedented extreme events, such as “21.6” Hetian extreme heavy rainfall, “21.5” Tazhong heavy rainfall, and “21.4” Baicheng extreme heavy snowfall. Our results provide a reference for the physical mechanism, attribution, and high-resolution modeling of extreme events. In the context global warming, the intensity and frequency of heavy rainfall events increased significantly in the TB, which could exacerbate the loss and impact of rainstorm-induced disasters. Therefore, it is necessary to further strengthen the scientific understanding and prediction technology of heavy rainfall and its impact over the TD and its surrounding areas.
(1) Heavy rainfall science is a typical experimental science, and heavy rainfall field scientific experiments have directly developed the heavy rainfall science and operational forecasting (Ding, 2019). At present, no field scientific experiments have been carried out on heavy rainfall in arid regions of China. Therefore, it is urgent to carry out heavy rainfall field scientific experiments in arid regions, especially in the northern slope of the Qinghai-Tibetan Plateau.
(2) Using data from heavy rainfall field experiments, the dynamic and thermodynamic structure of mesoscale systems of heavy rainfall, as well as the macroscopic characteristics and microphysical changes of rainstorms system in arid region can be analyzed. In addition, this kind of data can be used to explore the triggering mechanism of heavy rainfall caused by steep terrain and complex boundary-layer physical processes of desert-oasis system, to reveal the mechanism of heavy rainfall formation and organization affected by Plateau weather system, Central Asian vortex, and jet and moisture accumulation, and to develop a comprehensive heavy rainfall physical model for arid regions.
(3) Extreme heavy rainfall events are strongly affected by internal climate variability. Thus, an urgent need exists to explore the multi-time scale evolutionary characteristics and physical mechanism of heavy rainfall, to reveal the energy and water cycle characteristics of heavy rainfall process, and explore the interaction between westerlies and Asian monsoon, dynamic and thermal effects of desert underlying surface, and the separate and coupled effects of dust aerosol on heavy rainfall in arid areas. In addition, the detection and attribution of extremes events are challenging.
(4) There is pressing demand by the public for authorities to provide timely warmings for extreme events. Thus, an urgent need exists to develop a short-term probability prediction method for extreme rainfall in arid regions and establish a near- and short-term seamless numerical prediction system to improve the accuracy of extreme rainfall forecast and early warning.