
Comparative transcriptome analysis of Armillaria gallica 012m in response to ethephon treatment
- Published
- Accepted
- Received
- Academic Editor
- Sushanta Deb
- Subject Areas
- Bioinformatics, Genomics, Microbiology, Mycology
- Keywords
- RNA-Seq, ET, ETH, Response, Differential expression genes, ET receptor
- Copyright
- © 2023 Yang et al.
- Licence
- This is an open access article distributed under the terms of the Creative Commons Attribution License, which permits unrestricted use, distribution, reproduction and adaptation in any medium and for any purpose provided that it is properly attributed. For attribution, the original author(s), title, publication source (PeerJ) and either DOI or URL of the article must be cited.
- Cite this article
- 2023. Comparative transcriptome analysis of Armillaria gallica 012m in response to ethephon treatment. PeerJ 11:e14714 https://doi.org/10.7717/peerj.14714
Abstract
Background
Gastrodia elata, known as a rootless, leafless, achlorophyllous and fully mycoheterotrophic orchid, needs to establish symbionts with particular Armillaria species to acquire nutrition and energy. Previous research findings had approved that ethylene (ET) played an important role in plant-fungi interaction and some receptors of ET had been discovered in microorganisms. However, the molecular mechanisms underlying the role of ET in the interaction between G. elata and Armillaria species remain unknown.
Methods
Exiguous ethephon (ETH) was added to agar and liquid media to observe the morphological features of mycelium and count the biomass respectively. Mycelium cultured in liquid media with exiguous ETH (0.1 ppm, 2.0 ppm, 5.0 ppm) were chosen to perform whole-transcriptome profiling through the RNA-seq technology (Illumina NGS sequencing). The DEGs of growth-related genes and candidate ET receptor domains were predicted on SMART.
Results
ETH-0.1 ppm and ETH-2 ppm could significantly improve the mycelium growth of A. gallica 012m, while ETH-5 ppm inhibited the mycelium growth in both solid and liquid media. The number of up-regulated or down-regulated genes increased along with the concentrations of ETH. The growth of mycelia might benefit from the up-regulated expression of Pyr_redox (Pyridine nucleotide-disulphide oxidoreductase), GAL4 (C6 zinc finger) and HMG (High Mobility Group) genes in the ETH-0.1 ppm and ETH-2 ppm. Therefore, the growth of mycelia might be impaired by the down-regulated expression of ZnF_C2H2 and ribosomal protein S4 proteins in the ETH-5 ppm. Seven ET receptor domains were predicted in A. gallica 012m. Based on cluster analysis and comparative studies of proteins, the putative ETH receptor domains of A. gallica 012m have a higher homologous correlation with fungi.
Conclusions
The responses of A. gallica 012m to ETH had a concentration effect similar to the plants’ responses to ET. Therefore, the number of up-regulated or down-regulated genes are increased along with the concentrations of ETH. Seven ET receptor protein domains were predicted in the genome and transcriptome of A. gallica 012m. We speculate that ETH receptors exist in A. gallica 012m and ethylene might play an important role in the plant-fungi interaction.
Introduction
Armillaria species (Basidiomycota, Physalacriaceae) are well-known as plant pathogens that cause serious root diseases on woody plants in forests and plantations (Sipos et al., 2017; Gasic et al., 2021). However, several species of Armillaria have been confirmed to engage in symbiotic associations with various plants, insects and other fungi (Koch & Herr, 2021; Liang et al., 2021). Gastrodia elata, known as a rootless, leafless, achlorophyllous and fully mycoheterotrophic orchid (Kikuchi & Yamaji, 2010), needs to establish symbionts with particular Armillaria species to acquire nutrition and energy (Cha & Igarashi, 1995; Guo et al., 2016; Yuan et al., 2018). The plant-fungi interaction has long attracted the interest of botanists and microbiologists. Previous research findings had approved that phytohormones played an important role in plant-fungi interaction (Chanclud & Morel, 2016; Eichmann, Richards & Schäfer, 2021).
ET is often recognized as the senescence hormone involved in many aspects of plant physiology and development (Carlew, Allen & Binder, 2020). In the same time, ET seems to be an early plant defense factor in infected plants and influences both the plant and the plant pathogen (Chague et al., 2006). In addition to plants, several bacteria and fungi can produce and perceive ET (Arshad & Frankenberger, 1991; North et al., 2017). The response of fungi to ET is multifarious depending on the characteristics of the species and ET concentration (Chague et al., 2006). Previous studies showed exogenous ET improved spore germination and mycelium growth of Alternaria alternate, Penicillium digitatum, P. italicum and Thielaviopsis paradox, while inhibiting spore germination and hyphae elongation of Botrytis cinerea (El-Kazzaz, 1983; Flaishman & Kolattukudy, 1994; Kępczyńska, 1994; Carlew, Allen & Binder, 2020). In other cases, exogenous ET influence the colonization of mycorrhizal fungi and the formation of nodules (Foo et al., 2016; Bedini et al., 2018; Carlew, Allen & Binder, 2020).
ETH was used as an ethylene-generating agent (Lee, Holdo & Muzika, 2021). During our cultivation of A. gallica 012m, a low concentration of exogenous ETH improved the growth of mycelia, while a high concentration of exogenous ETH inhibited the growth of mycelia in both solid and liquid media. In our previous work, the draft genome of Armillaria strain 012m had been investigated (Zhan et al., 2020). This work provides the genome-wide transcriptional profiling to investigate the responses of A. gallica 012m to ETH, and discusses the role of ET in the plant-fungi interactions.
Materials and Methods
Fungi growth and culture conditions
A. gallica 012m was derived from G. elata in our previous research. The stock strain was routinely grown on modified Czapek-Dox medium agar (MgSO4, 0.5 g; FeSO4, 0.01 g; KCl, 0.5 g; NaNO3, 3 g; K2HPO4, 1 g; sucrose, 30 g; malt extract, 10 g; yeast extract, 10 g; ethanol, 20 g) in the dark at 25 °C for 15 days (Zhan et al., 2020). Exiguous ETH (0.1 ppm, 2.0 ppm, 5.0 ppm) were added to the medium of broth and ager; and set up the BK (blank control) groups. Setting three parallel repeats for each different treatment condition.
The mycelium of A. gallica 012m was grown on liquid media in a 160 r/min shaker at 25 °C for 15 days. Then, the pellets were filtrated with a Buchner funnel, washed with pure water, collected in beaker and weighted with electronic balance. By utilizing independent sample T-test, the data analysis was performed with IBM SPSS v23 (Tanner-Smith & Tipton, 2014). The mycelium was preserved under liquid nitrogen conditions.
RNA extraction and sequencing
The method was as same as our previous work (Cao et al., 2022). RNA was extracted from fungi pellets using the RNeasy mini kit (Qiagen, Hiden, Germany) following the manufacturer’s instructions. The cDNA library was sequenced on the Illumina HiSeq platform (Caporaso et al., 2012) with a double-end sequencing strategy in Novogene Bioinformatics Technology, Beijing, China. The original data were deposited in the National Center for Biotechnology Information database with the accession number PRJNA759758.
Transcriptome sequences data quality control and comparison
To obtain clean transcriptome data, low-quality sequences of RNA-seq were removed with Trimmomatic v0.36 (Bolger, Lohse & Usadel, 2014). Then, the data quality control was evaluated with FastQC v0.11.9 (Brown, Pirrung & McCue, 2017). The reads of RNA-Seq was aligned with the A. gallica 012m genome sequences (https://www.ncbi.nlm.nih.gov/genome/57439?genome_assembly_id=853036) by using Hisat2 v2.1.0 (Kim et al., 2019) to obtain the SAM data.
Differentially expressed gene analysis
Gene expression values were performed according to the reads per kilobase per million mapped reads (RPKM) method. The read count matrix was obtained for expression qualification with StringTie v2.1.0 (Pertea et al., 2015). The read count matrix was imported into R 3.6.3. The read count matrix was imported into R 3.6.3, and the differential gene analysis was carried out with edgeR of R package under an FDR<0.05 and —log2FC—>2. Next, RNASeqPower (DOI: http://dx.doi.org/10.18129/B9.bioc.RNASeqPower), a power analysis calculation software, was used to calculate the statistical power of this experimental design, and the statistical power is 0.81. Then, all transcripts and their corresponding genes were compared by emapper v2.1.3 for functional annotation and classification (Huerta-Cepas et al., 2017). The result of the GO function analysis was performed by using TBtools V0.66836 (Chen et al., 2020). Go terms visualization of DEGs was executed with WEGO (https://wego.genomics.cn/).
Functional analysis of growth-related genes of DEGs
To analyze the function of protein domain, the gene sequences involved biological process functions were extracted and their protein domains were annotated by using the SMART platform (http://smart.embl-heidelberg.de/).
Screened candidate ethylene receptors
Those existing ET receptor protein sequence of fungi were downloaded the from NCBI (https://www.ncbi.nlm.nih.gov/) and compared with the genome protein sequences of A. gallica 012m. Those expressed sequences with E-value ≤ le-5 were selected and detected their conserved domain on SMART (Letunic, Khedkar & Bork, 2021).
Construction of receptor sequence evolutionary tree
An evolutionary tree was constructed with downloaded receptor sequences and screened sequences of A. gallica 012m. ClustalW2 of MEGA7 was used for multiple amino acid sequences alignment (Kumar, Stecher & Tamura, 2016). The phylogenetic tree was constructed by neighbor-joining method and the number of calculations was 1,000.
Results
Morphological characteristics of A. gallica grown under ETH
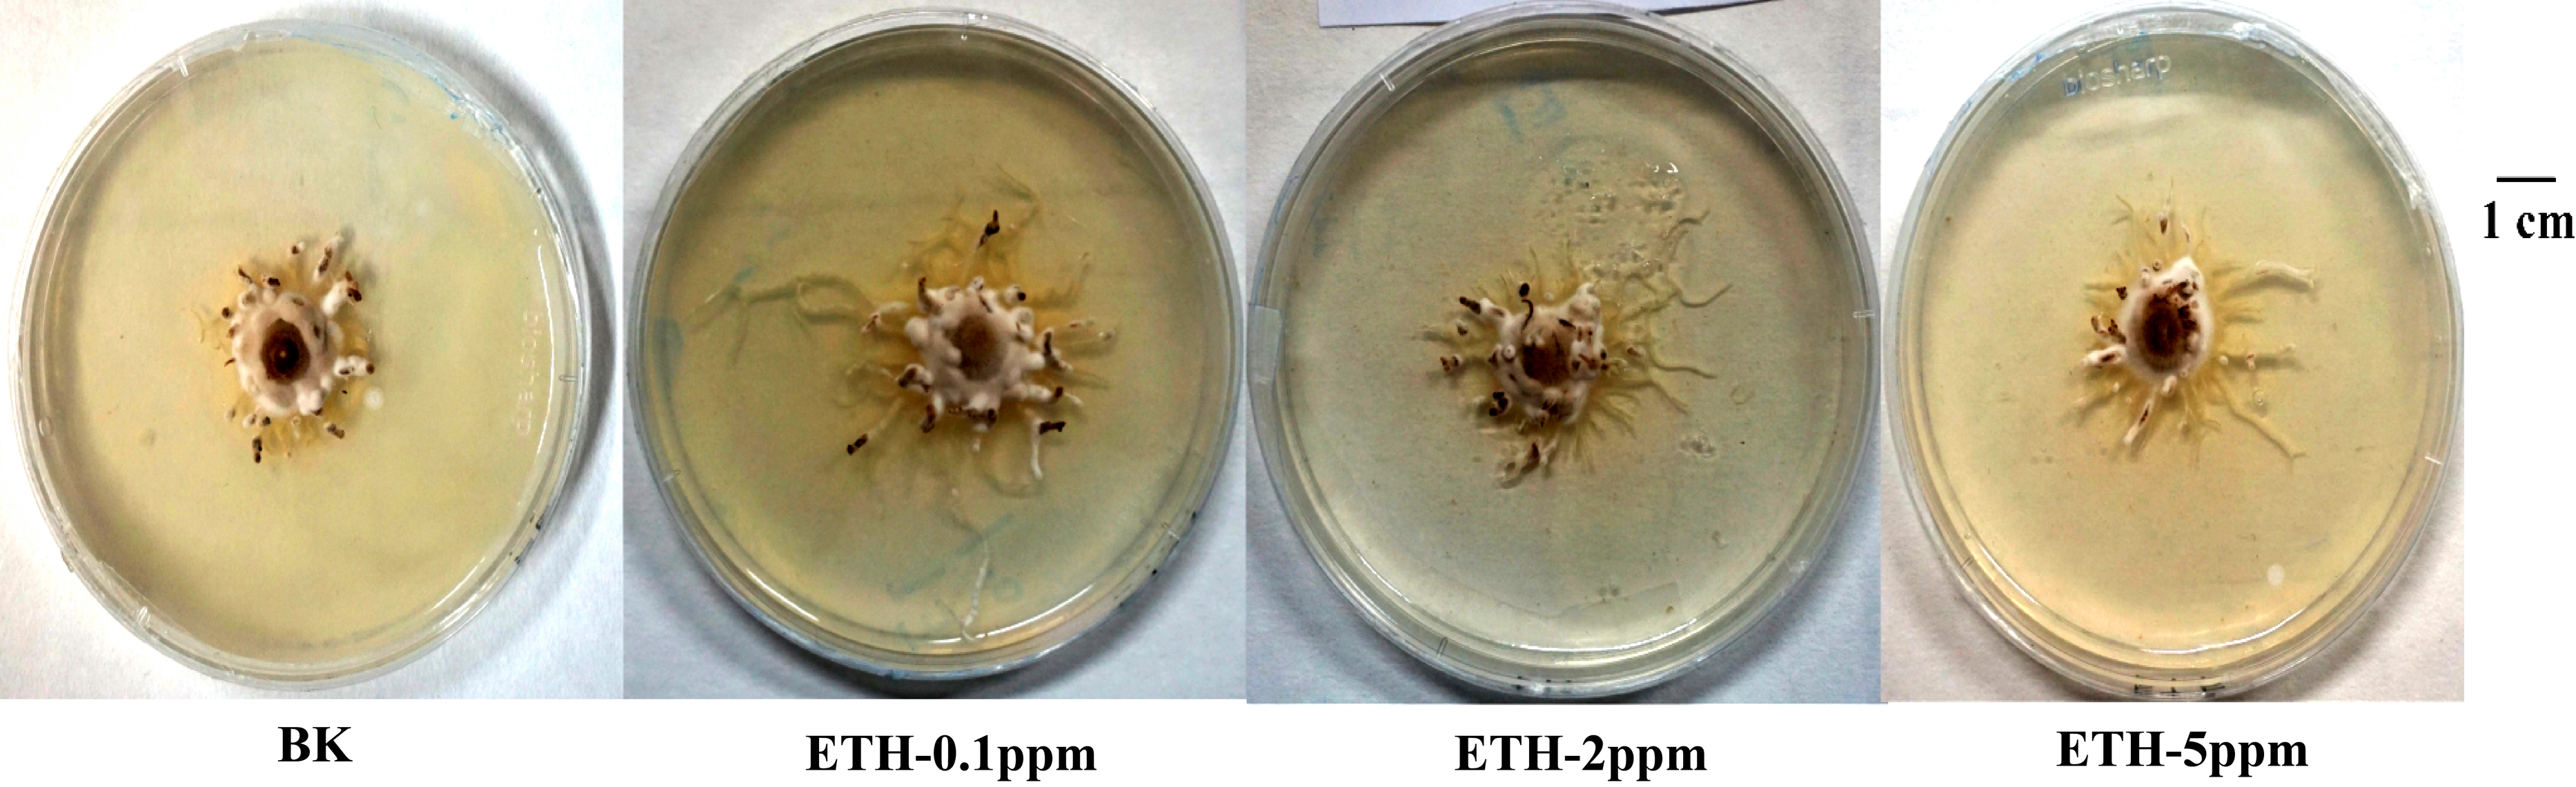
As shown in Fig. 1, ETH stimulated the mycelial growth of A. gallica 012m in solid media. Moreover, lower concentrations of ETH present better effect on mycelium elongation of A. gallica 012m. The order of influence of mycelium elongation were ETH−0.1 ppm>ETH-2 ppm>ETH-5 ppm.
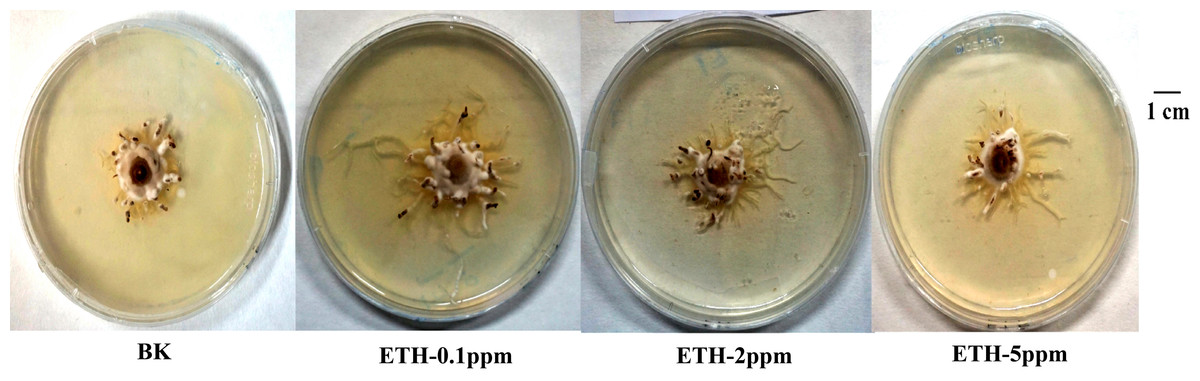
Figure 1: Growth status of A. gallica 012 m in ETH (0.1 ppm, 2.0 ppm, 5.0 ppm) and BK.
Effects of plant growth substances on the biomass of A. gallica 012m
The liquid culture was carried out to explore whether or not ETH affected the biomass of A. gallica 012m. As shown in Fig. 2 and Table S1, the biomass of mycelium increased by 88.0 ± 9.1% under ETH−0.1ppm, the biomass of mycelium increased by 66.1 ± 7.9% under ETH-2ppm, the biomass of mycelium decreased by 86.8 ± 5.0% under ETH-5ppm. By utilizing independent sample T-test, it can be considered that the biomass of A. gallica 012m were increased extremely significant (p < 0.01) under ETH−0.1 ppm and ETH-2ppm, while decreased extremely significant (p < 0.01) under ETH-5ppm.
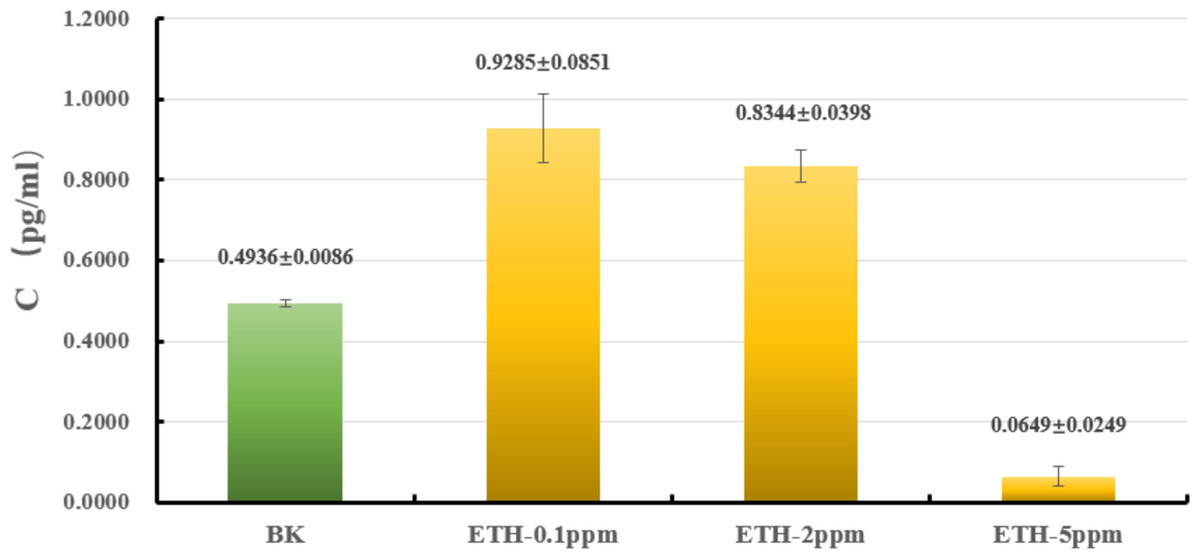
Figure 2: Effects of ETH on biomass of A. gallica 012m.
The error line represents the standard deviation.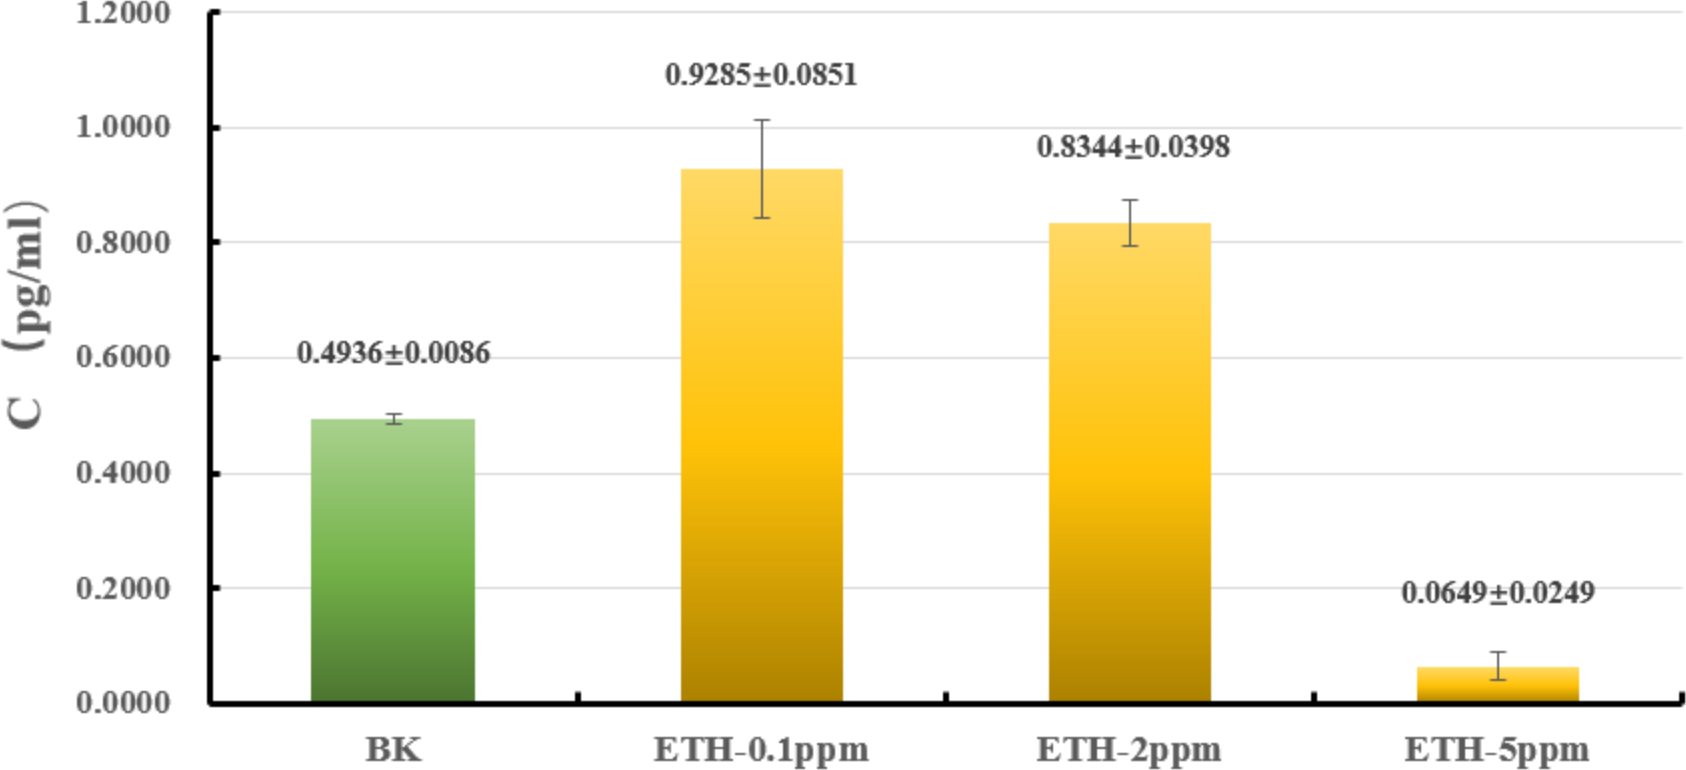
Evaluation of transcriptome sequencing data
Above 10.0 Gb of raw data per sample was obtained by transcriptome sequencing on the Illumina HiSeq platform and could be used to further expression level analysis after quality control. In addition, twelve transcriptome samples of ETH and BK were sequenced by Illumina HiSeq platform to obtain 21,016,459; 25,437,814; 22,314,980; 26,576,772; 24,979,536; 23,865,405; 30,433,600; 21,398,103; 22,659,153; 22,659,153; 27,395,065; 28,784,179 and 26,125,609 pairs of PE reads (Table 1).
| Sample_name | Clean_reads | Read mapped (%) | Total mapped | Multiple mapped | Uniquelymapped |
|---|---|---|---|---|---|
| ETH-0.1 ppm-1 | 21,016,459 | 92.73 | 20,029,878 | 763,543 | 19,266,335 |
| ETH-0.1 ppm-2 | 25,437,814 | 92.85 | 24,371,998 | 735,341 | 23,636,657 |
| ETH-0.1 ppm-3 | 22,314,980 | 92.89 | 21,296,185 | 611,455 | 20,684,730 |
| ETH-2 ppm-1 | 26,576,772 | 93.64 | 25,535,583 | 686,444 | 24,849,139 |
| ETH-2 ppm-2 | 24,979,536 | 93.82 | 23,963,179 | 670,682 | 23,292,497 |
| ETH-2 ppm-3 | 23,865,405 | 92.58 | 22,673,985 | 729,855 | 21,944,130 |
| ETH-5 ppm-1 | 30,433,600 | 93.76 | 29,253,416 | 872,677 | 28,380,739 |
| ETH-5 ppm-2 | 21,398,103 | 93.64 | 20,536,212 | 670,720 | 19,865,492 |
| ETH-5 ppm-3 | 22,659,153 | 93.69 | 21,758,215 | 703,163 | 21,055,052 |
| BK-1 | 27,395,065 | 93.06 | 25,970,049 | 871,066 | 25,098,983 |
| BK-2 | 28,784,179 | 93.24 | 27,459,809 | 780,605 | 26,679,204 |
| BK-3 | 24,916,601 | 93.27 | 23,812,273 | 645,411 | 23,166,862 |
After removing the reads with adapter sequences of low quality, an average of 21,916,601 to 30,433,600 pairs of clean reads were retained from ETH and BK, respectively. Read mapped percentage of clean data from all sample were higher than 92.73%, and reads mapped percentages of ETH-2ppm-2 was the highest. What’s more, 92.73% ∼93.82% pure readings were successfully mapped to the reference genome of A. gallica 012m.
Enriched GO terms of up-regulatedand down-regulated at DEGs
In the ETH−0.1 ppm vs. BK comparison, a total of 118 genes were differentially expressed, including 15 up-regulated genes and 103 down-regulated genes (Fig. 3, Table S2). In the ETH-2 ppm vs. BK comparison, a total of 341 genes were differentially expressed, including 224 up-regulation genes and 117 down-regulation genes (Table S3). In the ETH-5 ppm vs. BK comparison, a total of 696 genes were differentially expressed, including 314 up-regulated genes and 382 down-regulated genes (Table S4). Interestingly, the total number of DEGs in the experimental group increased along with ETH concentration.
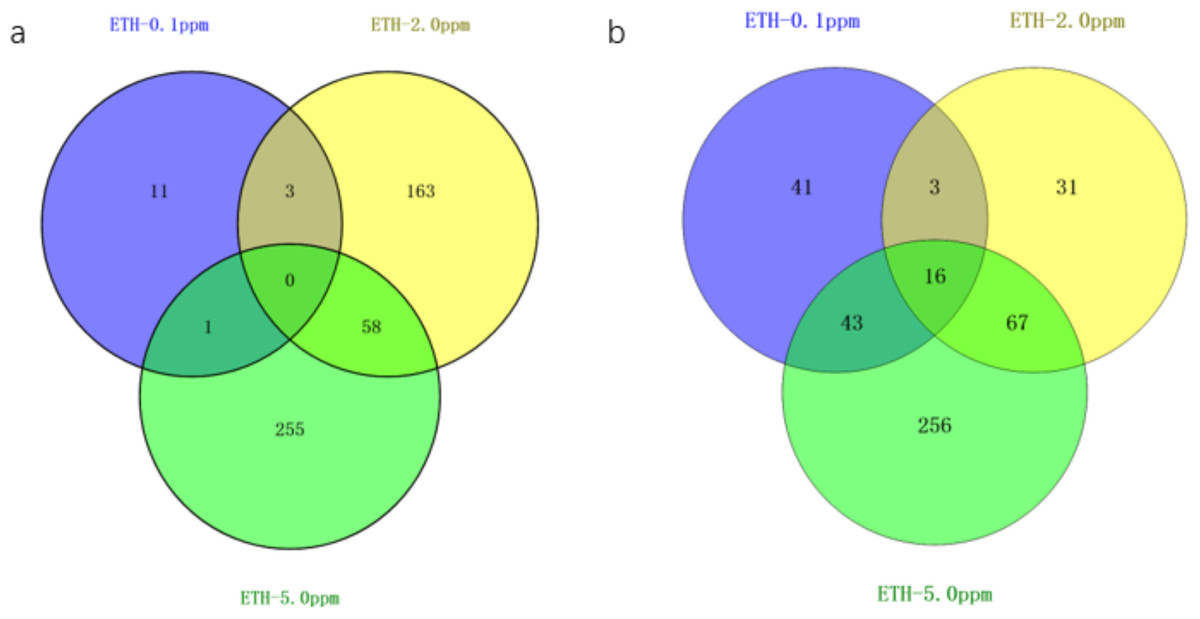
Figure 3: Venn diagram of differentially expressed genes ETH (0.1 ppm, 2.0 ppm and 5.0 ppm).
(A) Venn diagram showing overlapping DEGs up-regulated in response to ETH (0.1 ppm, 2.0 ppm and 5.0 ppm). (B) Venn diagram showing overlapping DEGs down-regulated in response to ETH (0.1 ppm, 2.0 ppm and 5.0 ppm).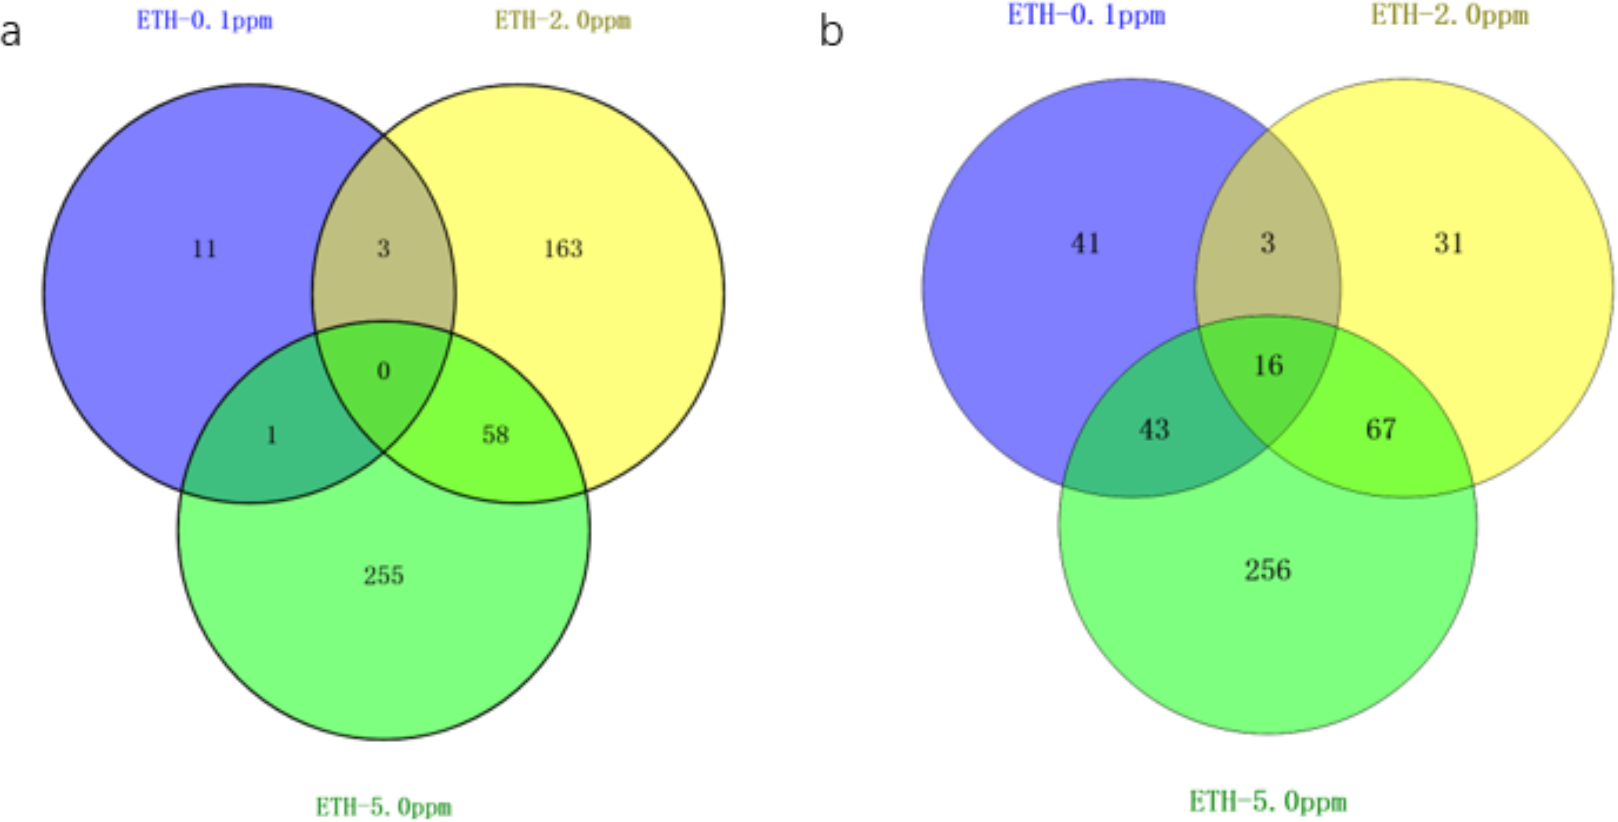
The gene expression of A. gallica 012m with ETH−0.1 ppm vs. BK, ETH−2.0 ppm and ETH−5.0 ppm vs. BK was analyzed. In the up-regulated genes, the results showed that there were three differential genes shared by ETH−0.1 ppm and ETH−2.0 ppm, and 58 differential genes shared by ETH−2.0 ppm and ETH−5.0 ppm, 11 DEGs in ETH−0.1 ppm group alone, 163 DEGs in ETH−2.0 ppm group alone, and 255 DEGs in ETH−5.0 ppm group alone. In down-regulation genes, the DEGs of the ETH−0.1 ppm group were the same as the ETH−2.0 ppm group more than 15% (Fig. 4).
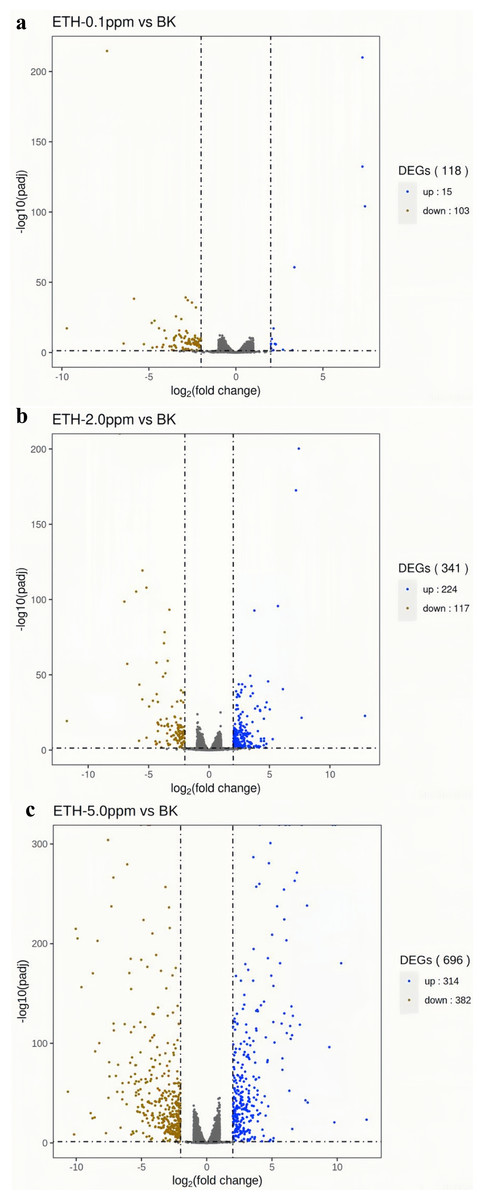
Figure 4: (A–C) Volcano map of differentially expressed genes.
Differentially expressed genes (DEGs) were defined by edgeR with an FDR < 0.05 and —log2FC—>2 and corrected p value (padj) < 0.05.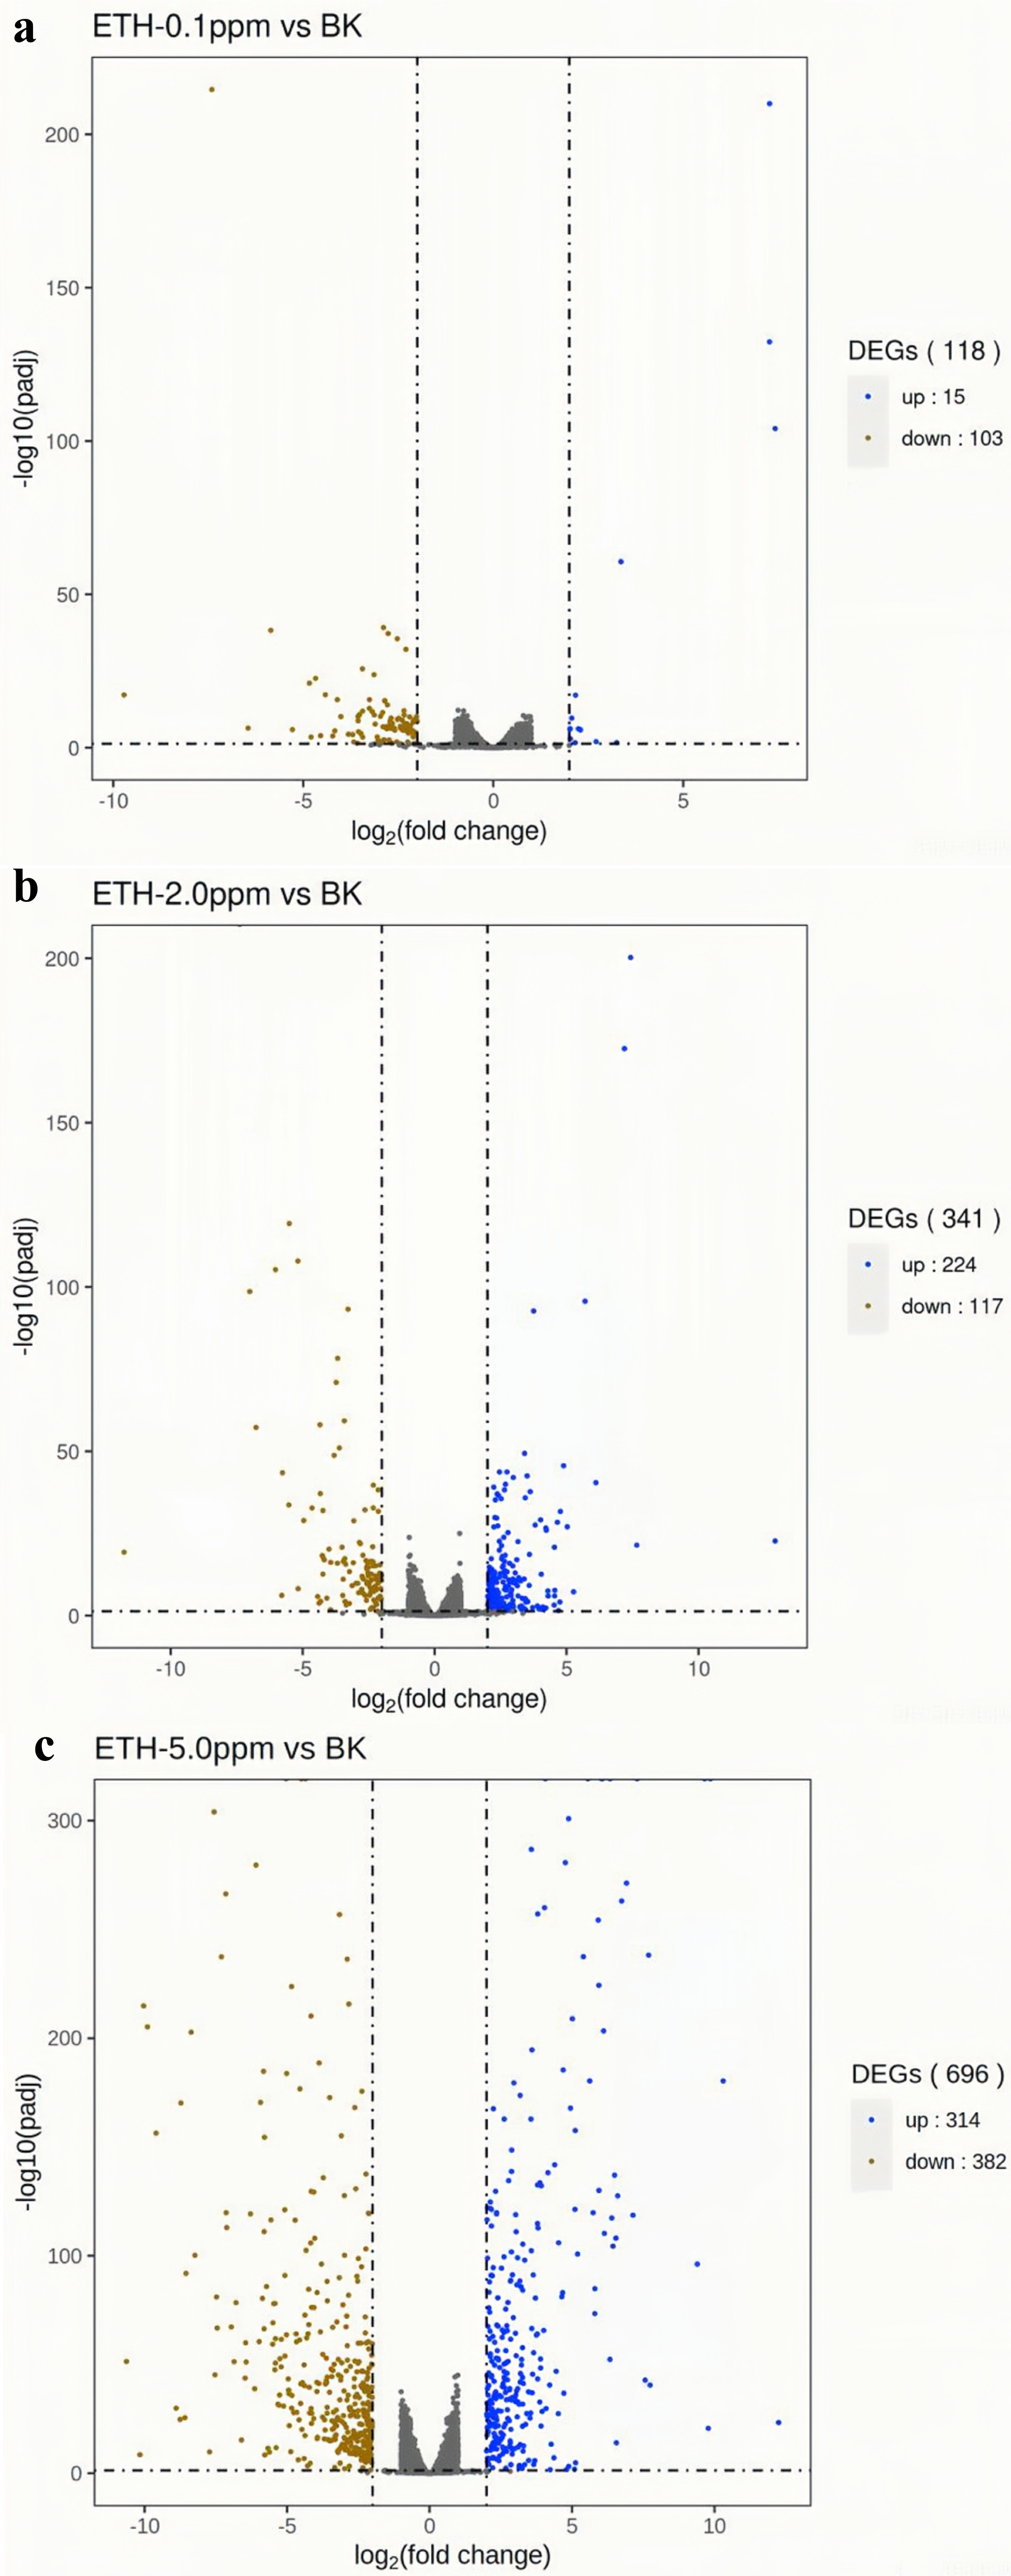
Enriched GO terms of up-regulated and down-regulated at DEGs
Comparing with the GO database, classification and functional analysis of DEGs were performed for better visualization. The result of the annotation of Level 2 for the GO database was shown in Fig. 5.
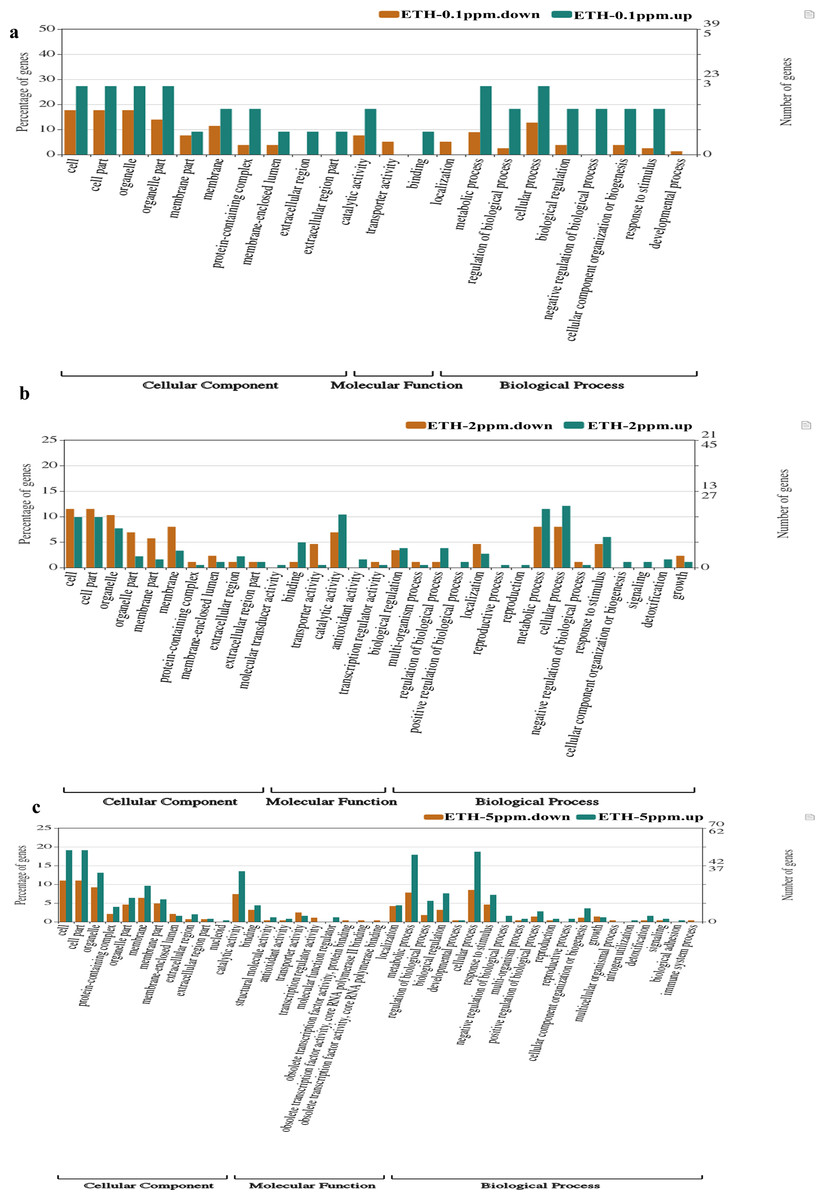
Figure 5: (A–C) Gene Ontology (GO) enrichment analysis of differentially expressed genes (DEGs).
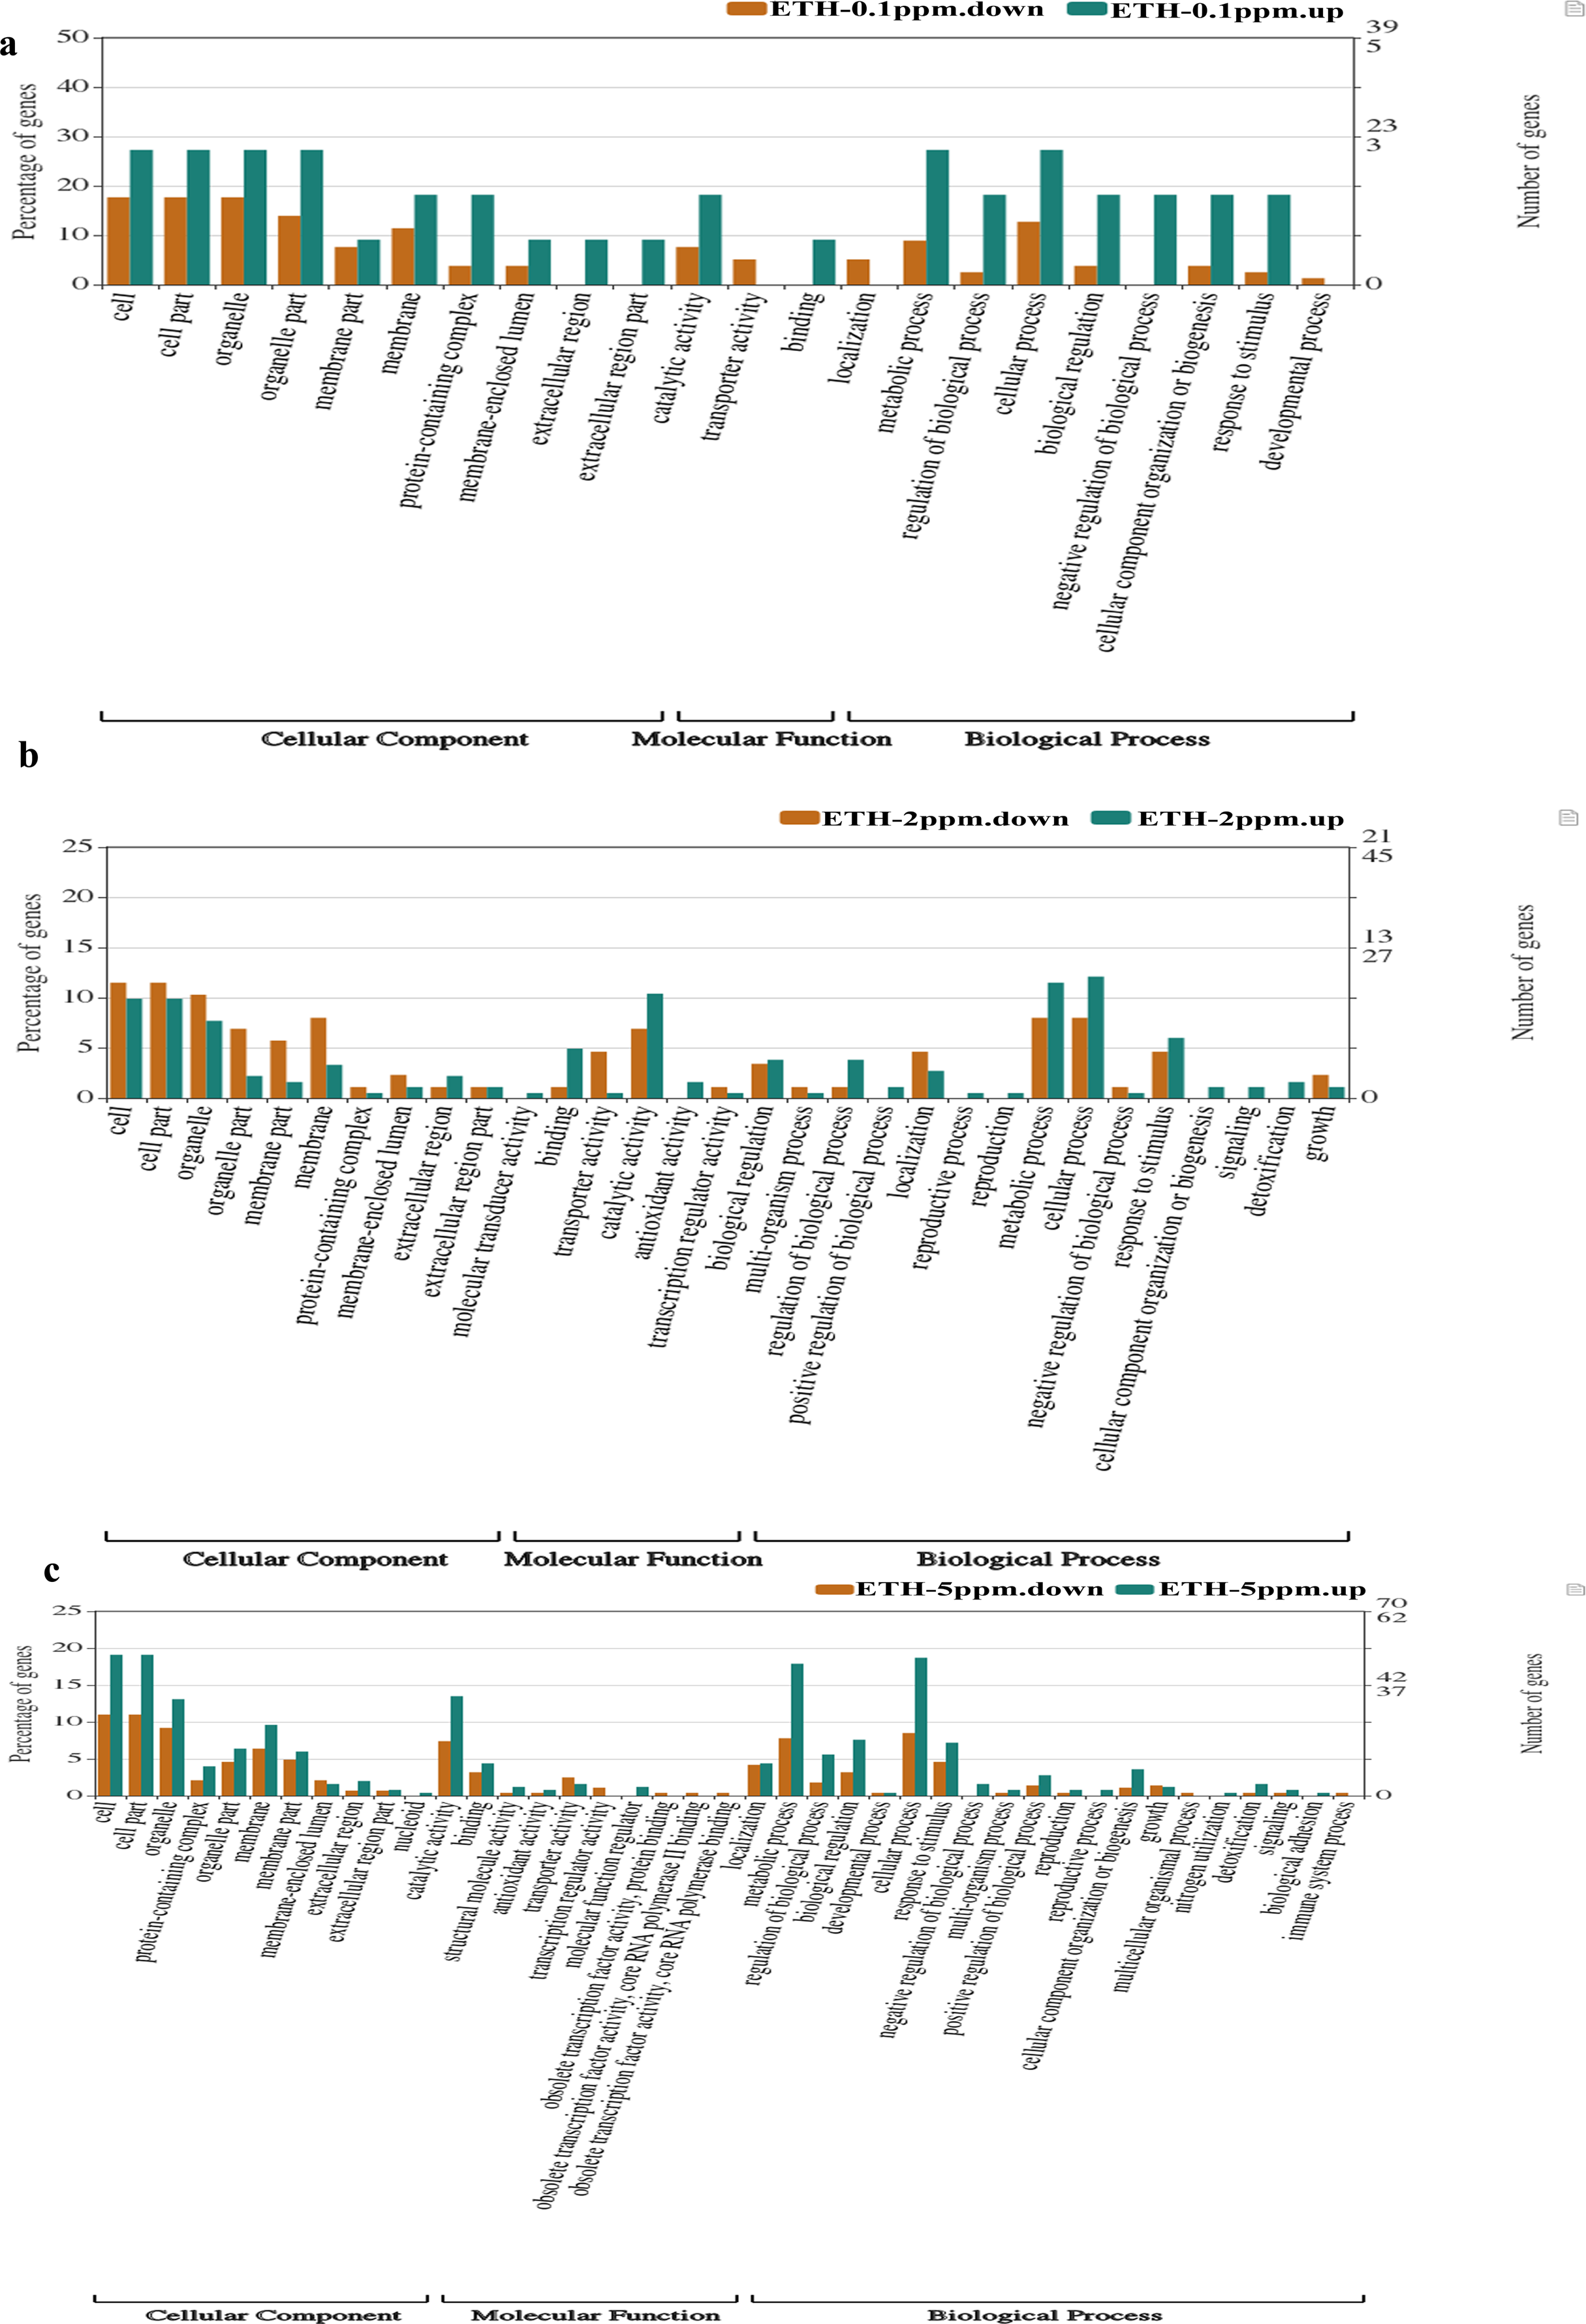
At ETH−0.1 ppm vs BK, a total of 90 DEGs were categorized into 22 functional groups under CC (10 functional groups), MF (three functional groups) and BP (nine functional groups). In the CC category, the major terms included ‘cell’ (upregulation: downregulation = 3: 14), ‘cell part’ (upregulation: downregulation = 3: 14), ‘organelle’ (upregulation: downregulation = 3: 14), ‘organelle part’ (upregulation: downregulation = 3:11) and ‘membrane’ (upregulation: downregulation = 2: 9). In the MF category, the GO terms only included three functional groups, which were ‘catalytic activity (upregulation: downregulation = 2: 6), ‘transporter activity (upregulation: downregulation = 0: 4) and ‘binding’ (upregulation: downregulation = 1: 0). In the BP category, the representative GO terms included ‘cellular process’ (upregulation: downregulation = 3: 10), ‘metabolic process’ (upregulation: downregulation = 3: 7), ‘biological process’, ‘response to stimulus’ (upregulation: downregulation = 3: 2) and ‘regulation of biological process’ (upregulation: downregulation = 3: 2).
At ETH-2 ppm vs BK, a total of 269 DEGs were categorized into 34 functional groups under CC (10 functional t groups), MF (nine functional groups) and BP (15 functional groups). In the CC category, the dominant GO terms included ‘cell’ (upregulation: downregulation = 18: 10), ‘cell part’ (upregulation: downregulation = 18: 10), ‘organelle’ (upregulation: downregulation = 14: 9), ‘organelle part’ (upregulation: downregulation = 4: 7) and ‘membrane’ (upregulation: downregulation = 6: 7). In the MF category, the major GO terms included ‘catalytic activity (upregulation: downregulation = 19: 6), ‘transporter activity’ (upregulation: downregulation = 4: 1), ‘binding’ (upregulation: downregulation = 9: 1) and ‘antioxidant activity’ (upregulation: downregulation = 3: 0). In the BP category, the major GO terms included ‘metabolic process’ (upregulation: downregulation = 21: 7), ‘cellular process’ (upregulation: downregulation = 22: 7), ‘response to stimulus’ (upregulation: downregulation = 11: 4), ‘localization’ (upregulation: downregulation = 5: 4) and ‘biological regulation’ (upregulation: downregulation = 7: 3).
At ETH-5 ppm vs. BK, a total of 534 DEGs were categorized into 41 functional groups under CC (11 functional groups), MF (10 functional groups) and BP (20 functional groups). In the CC category, the major GO terms included ‘cell’ (upregulation: downregulation = 48: 31), ‘cell part’ (upregulation: downregulation = 48: 31), ‘organelle’ (upregulation: downregulation = 33: 26), ‘organelle part’ (upregulation: downregulation = 16: 13) and ‘membrane’ (upregulation: downregulation = 24: 18). In the MF category, the representative GO terms included ‘catalytic activity (upregulation: downregulation = 34: 21), ‘transporter activity’ (upregulation: downregulation = 4: 7), ‘binding’ (upregulation: downregulation = 11: 9) and ‘antioxidant activity’ (upregulation: downregulation = 2: 1). In the BP category, the main GO terms included ‘metabolic process’ (upregulation: downregulation = 45: 22), ‘cellular process’ (upregulation: downregulation = 47: 22), ‘biological regulation’ (upregulation: downregulation = 19: 9) and ‘regulation of biological process’ (upregulation: downregulation = 14: 5). These result demonstrated that the main biological functions of the genes expressed in the A. gallica 012m transcriptome.
Identification of genes involved in the growth of A. gallica 012m
To further explore the mechanism of effects on the growth of A. gallica 012m, we respectively compared the biological regulation process of DEGs. The result can be shown as follows: in the ETH−0.1 ppm vs BK, Pyr_redox (pyridine nucleotide-disulphide oxidoreductase) domain was predicted in Armga012mGene24786 which showed up-regulation expressed. This domain is actually a small NADH binding domain within a larger FAD binding domain. This domain exists in NADH oxidases, peroxidases, class I and class II oxidoreductases. In the ETH-2 ppm vs. BK, HMG (High Mobility Group) and GAL4 (C6 zinc finger)/Fungal_trans domain were predicted in Armga012mGene25682 and Armga012mGene16364, respectively and showed up-regulation expressed. HMG-box domains form a large, diverse family involved in the regulation of transcription, replication and strand repair. Gal4 is a positive regulator for the gene expression of the galactose-induced genes of S. cerevisiae. This domain is found in various fungal transcription factors, which regulate cellular and metabolic processes. In the ETH-5 ppm vs. BK, ZnF_C2H2 (C2H2 zinc finger) and ribosomal protein S4 domain were predicted in Armga012mGene07208 and Armga012mGene07627 which showed down-regulation expressed. Znf-containing proteins function in gene transcription, translation, mRNA trafficking, cytoskeleton organisation, epithelial development, cell adhesion, protein folding, chromatin remodelling and zinc sensing. Ribosomal protein S4 is a kinds of small proteins that may be involved in translation regulation.
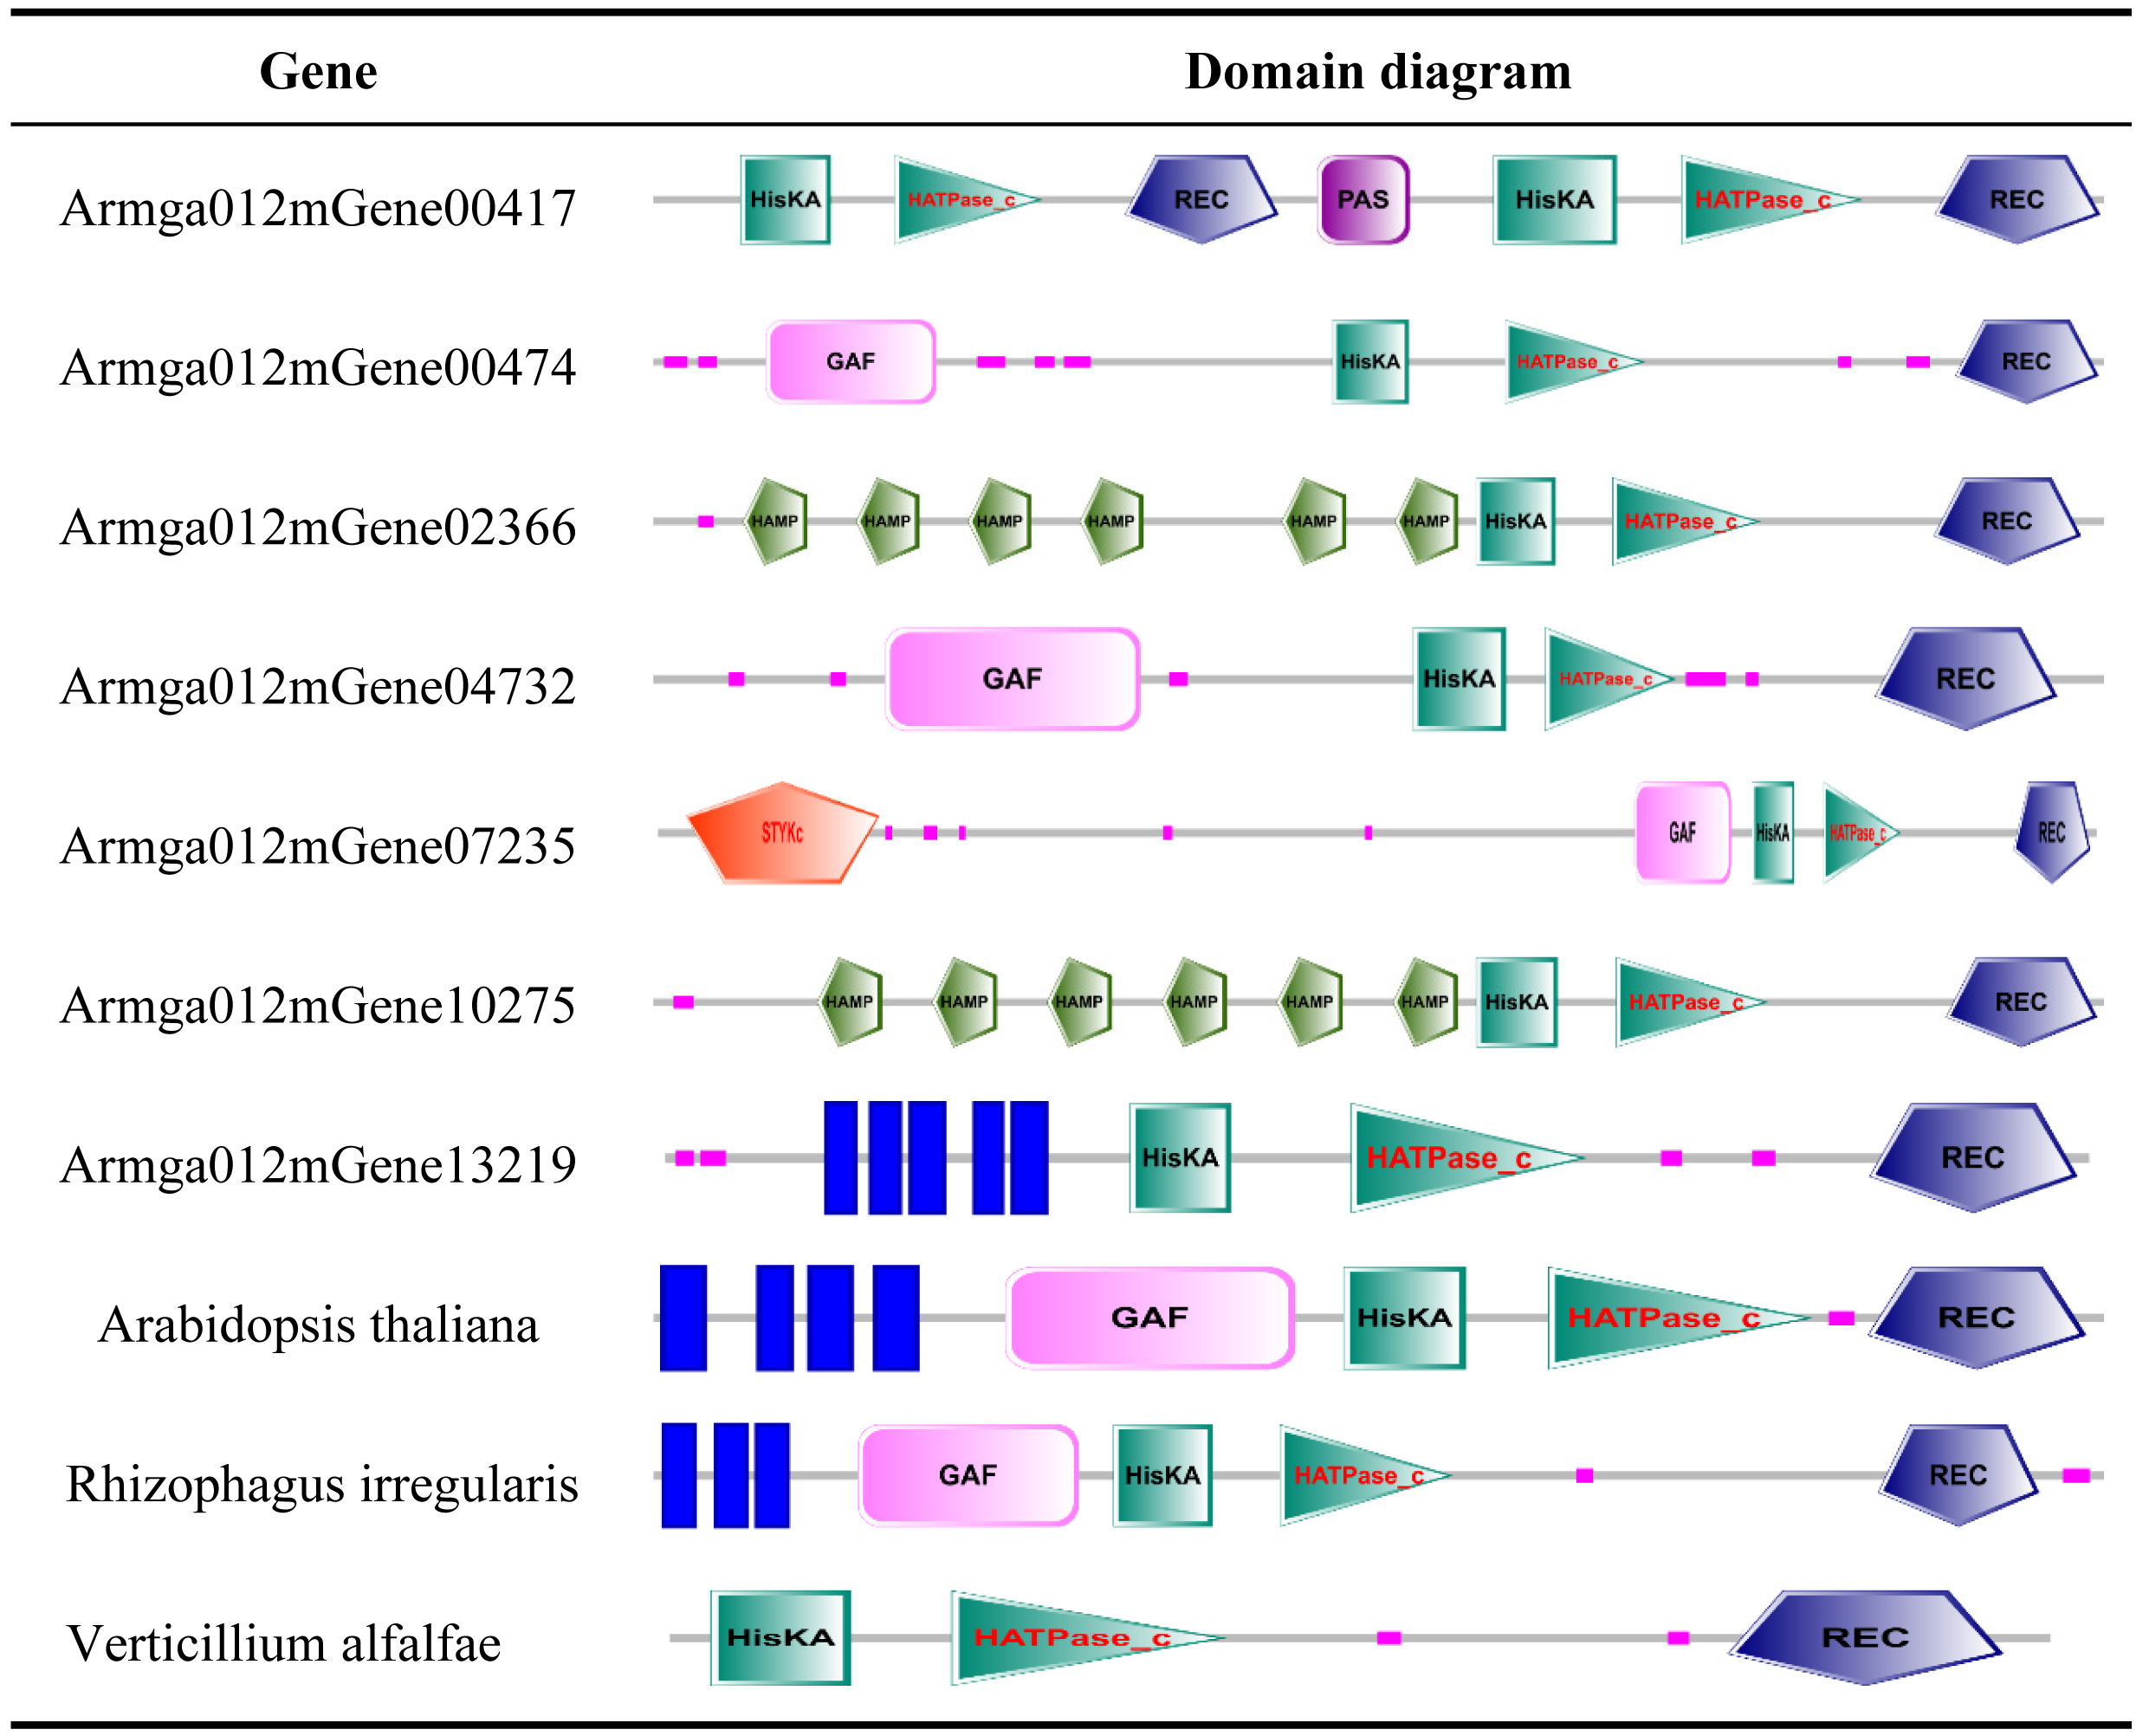
Prediction and expression of ET receptors in A. gallica 012m
ET receptor is the first element of the ethylene biological effect, and its binding with ethylene can activate downstream ethylene signal transduction. We downloaded the sequence information of ET receptors of fungi from GenBank with a total of 54 sequences, compared it with the genome protein sequence of A. gallica 012m. A total of seven speculated ET receptor domains of A. gallica 012m were predicted by using SMART (Table 2) and expressed. The predicted ET receptor proteins were annotated, and only Armga012mGene13219 has transmembrane region domains. Those predicted ET proteins have similar domain as determined ethylene receptor proteins, and the expression levels of candidate ethylene receptor protein sequences were different (Fig. 6) in A. gallica 012m. Thus, we speculated that exogenous ethylene affected the growth of A. gallica 012 m through ET receptors.
|
Notes:
- ER
-
endoplasmic reticulum
- HisKA
-
Histidine Kinase A (dimerisation and phosphoacceptor) domain
- HATPase_c
-
Histidine kinase-like ATPase catalytic (Histidine kinase-, DNA gyrase B-, phytochrome-like ATPases) domain
- GAF
-
cGMP-phosphodiesterase, adenylyl cyclase, FhIA domain
- P
-
PAS/PAC (Per-period circadian protein; Arnt-Ah receptor nuclear translocator protein Sim-single minded protein/PAS C terminus)
- REC
-
Receiver domain
- GGDEF
-
diguanylate cyclase domain
- EAL
-
c-di-GMP phosphodiesterase
- STYKc
-
protein kinase–unclassified specificity.
Genes containing ET receptor domain in A. gallica 012m
We downloaded the sequence information of ET receptors in fungi, bacteria, Arabidopsis thaliana from GenBank with a total of 10 sequences (File S3). Finally, by comparing 7 species with the ET receptor domain of A. gallica 012m, an analysis of the phylogenetic relationship is shown in Fig. 7. The result showed that A. gallica 012m (Armgao012mGene04732) had a high homology correlation with Verticillium alfalfae VaMs.102 (GenBank: XP_003000814.1, EEY23199.1). What’s more, A. gallica 012m (Armgao012mGene00417) had homology with Purpureocillum lilacinum (GenBank: XP_018174038.1). The phylogenetic tree analysis inferred that A. gallica 012m might possess ET receptor domains.
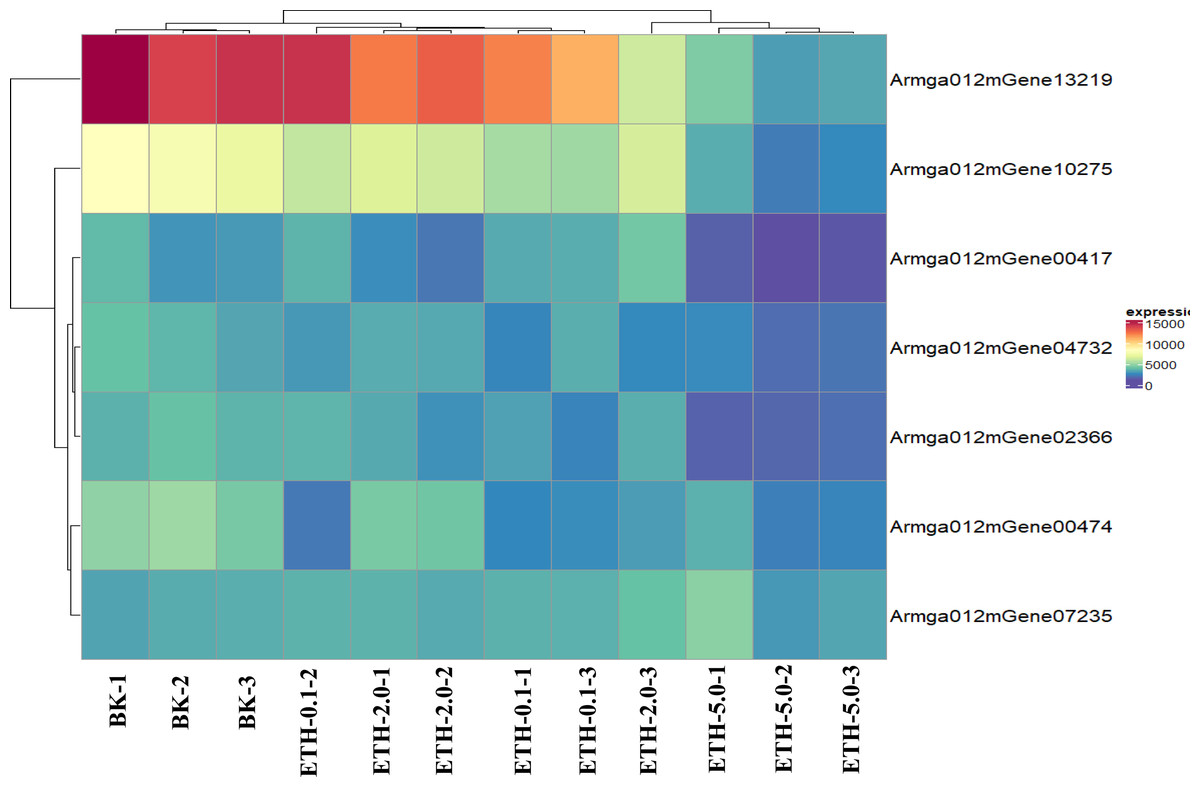
Figure 6: Expression pattern of selected clusters of genes containing ET receptor domain.
The color intensity of each gene is based expression of genes containing ET receptor domain in BK samples and ETH (0.1 ppm, 2.0 ppm and 5.0 ppm) samples.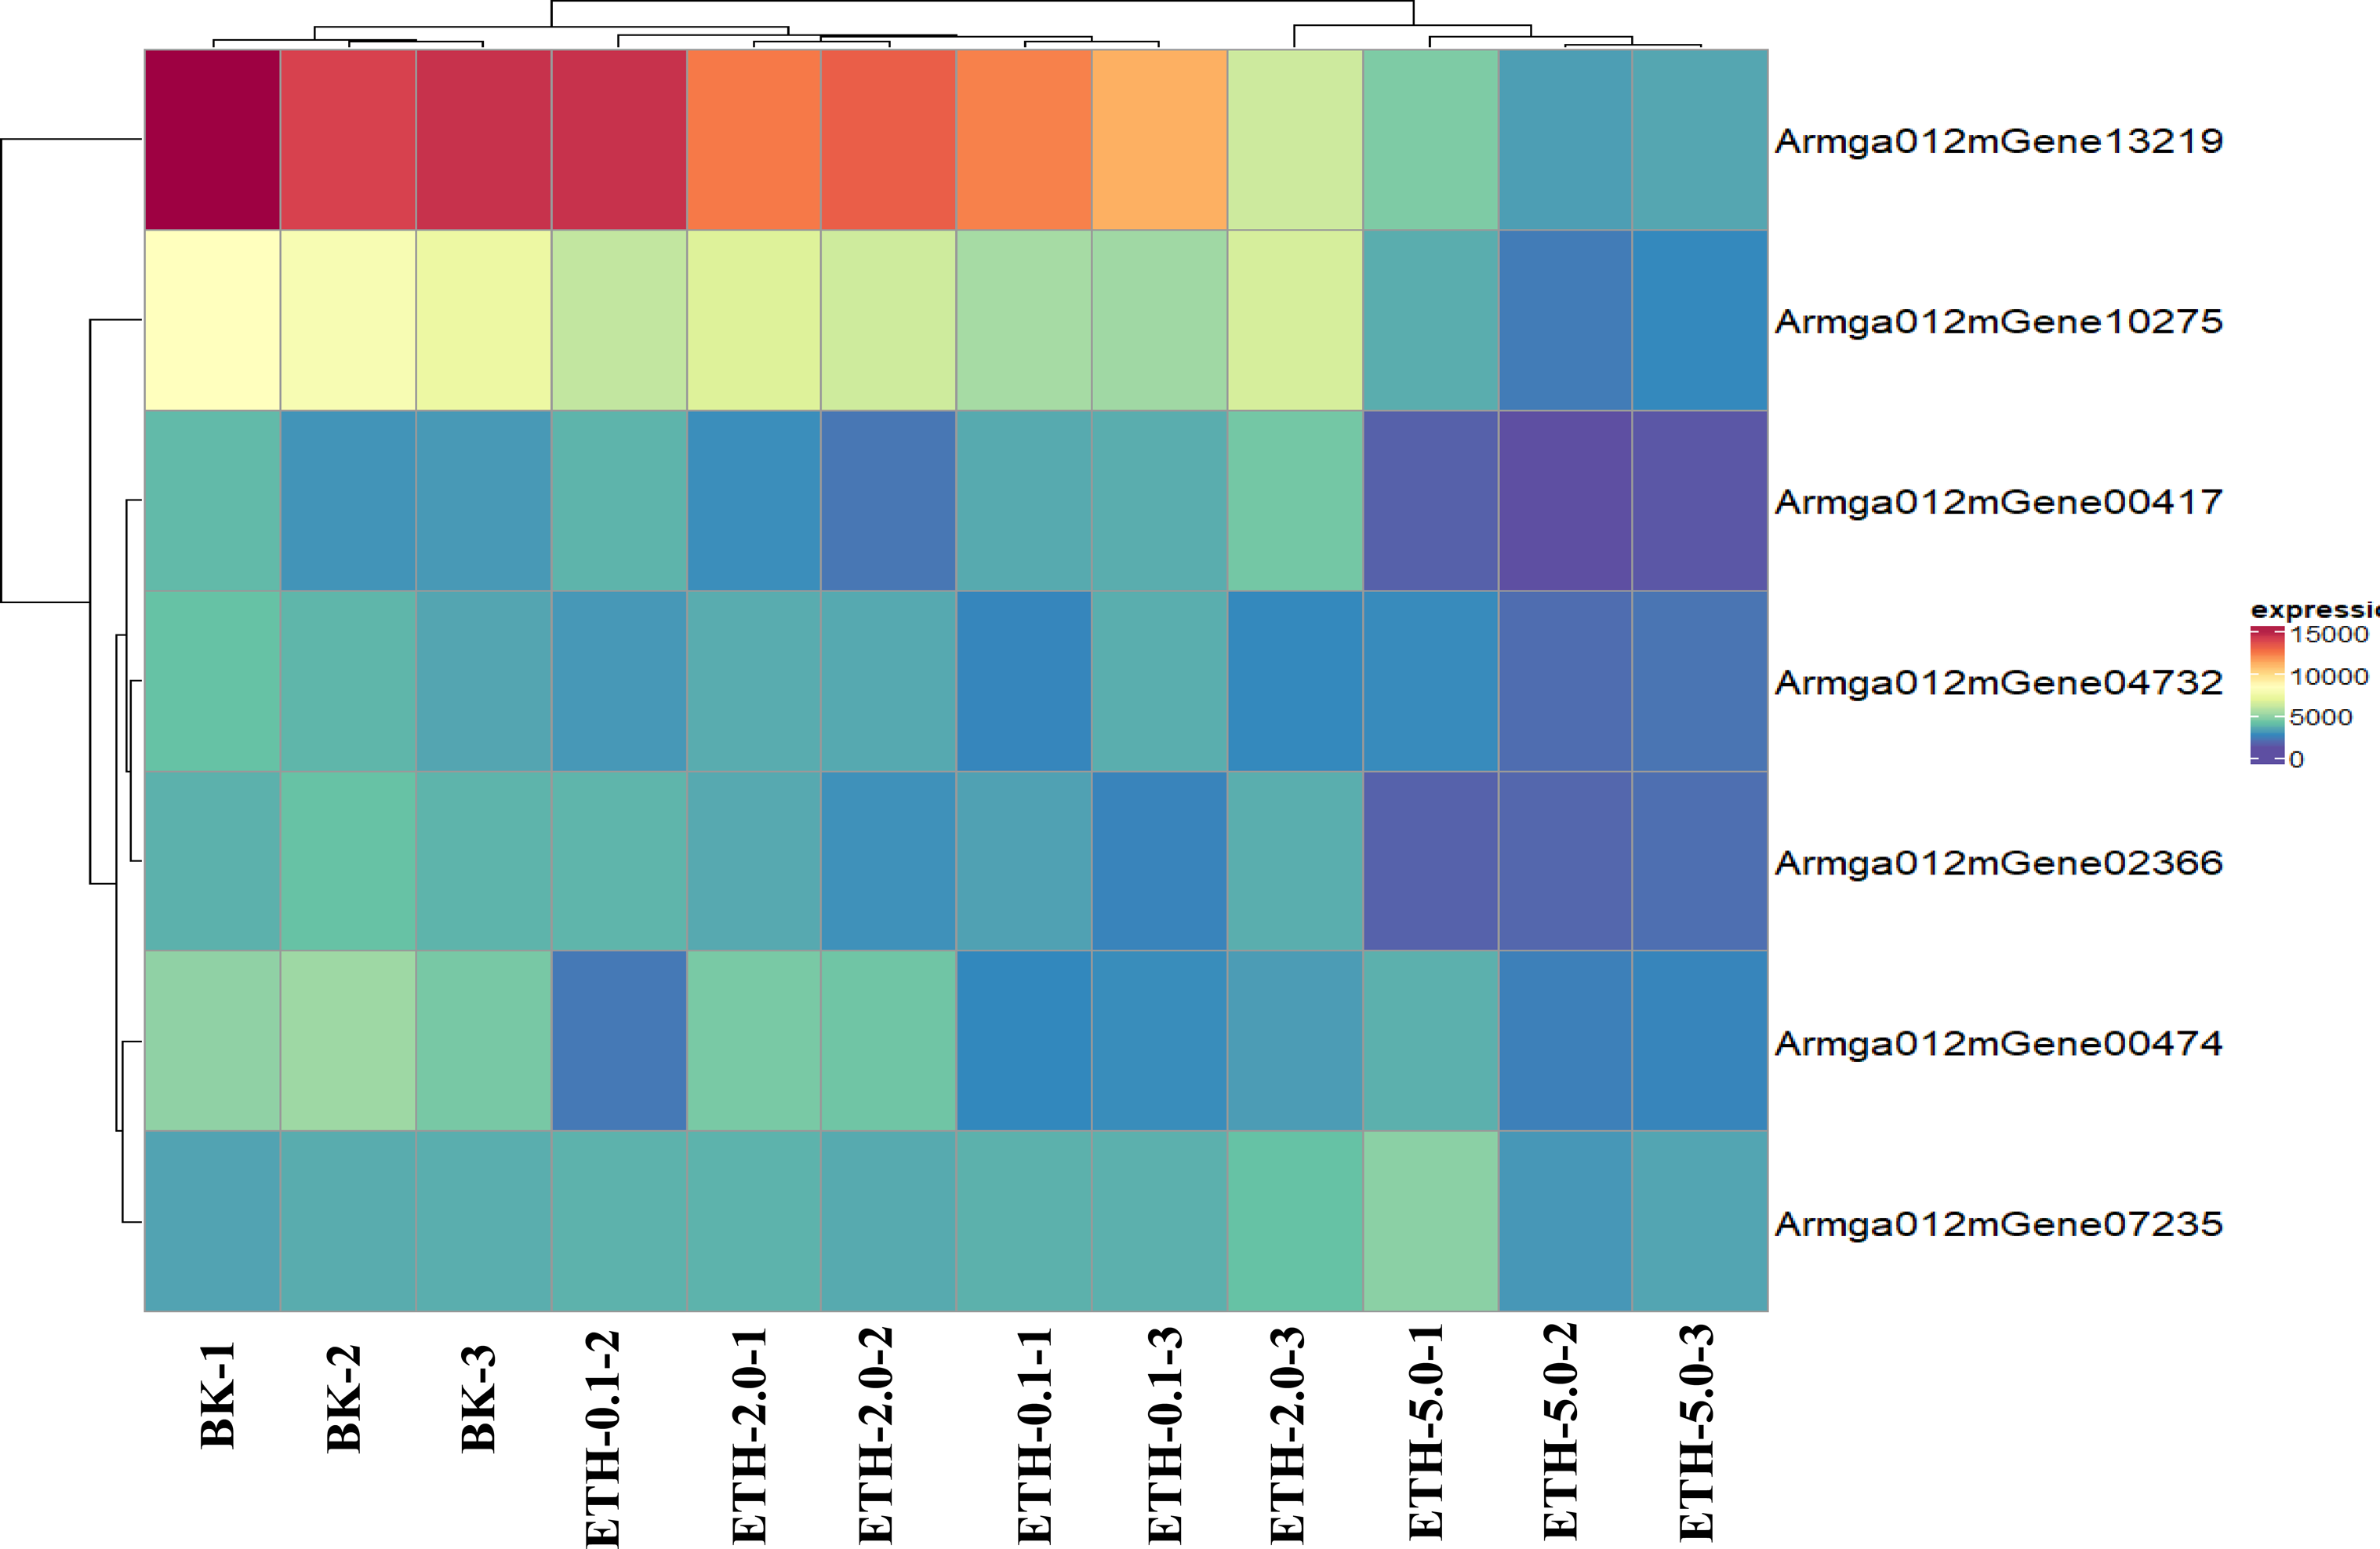
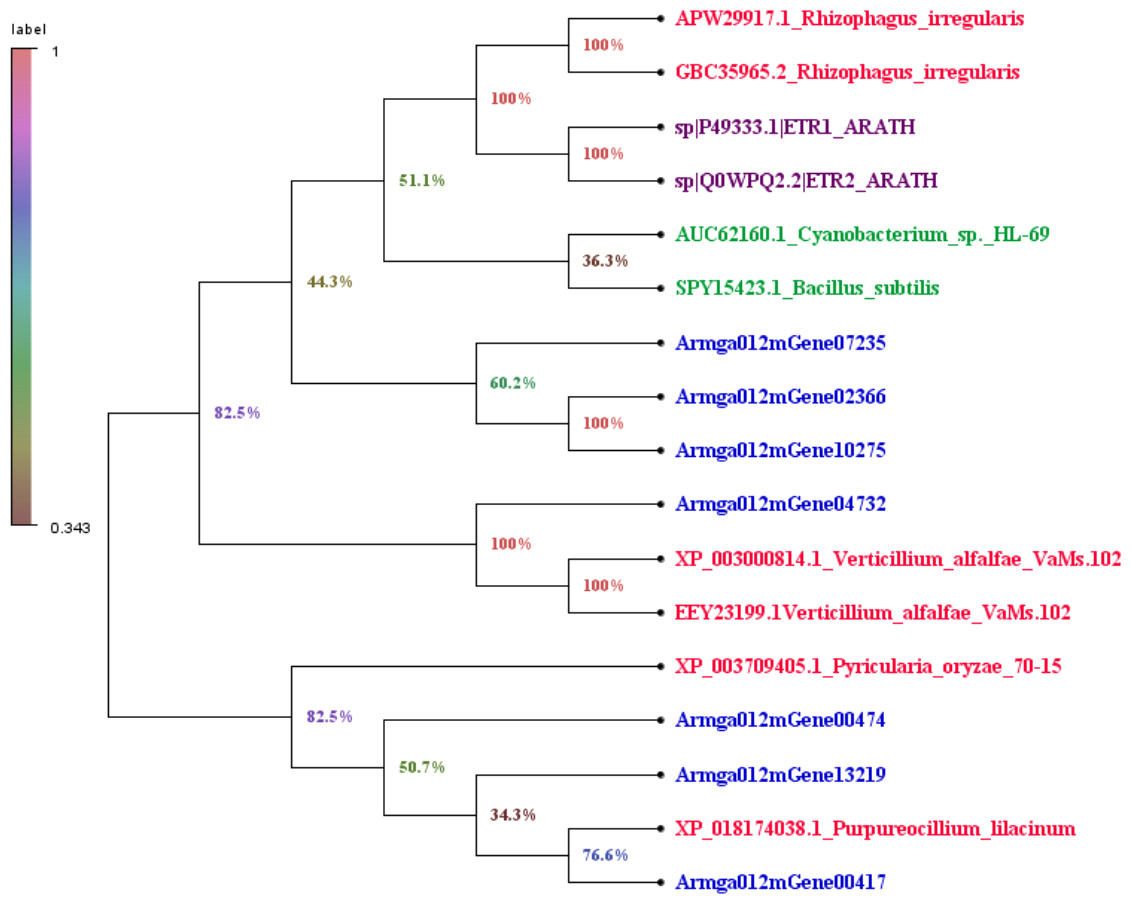
Figure 7: Phylogenetic tree of genes containing ET receptor domain in A. gallica 012m with other seven species.
The topology of the phylogenetic tree was constructed by the maximum likelihood method.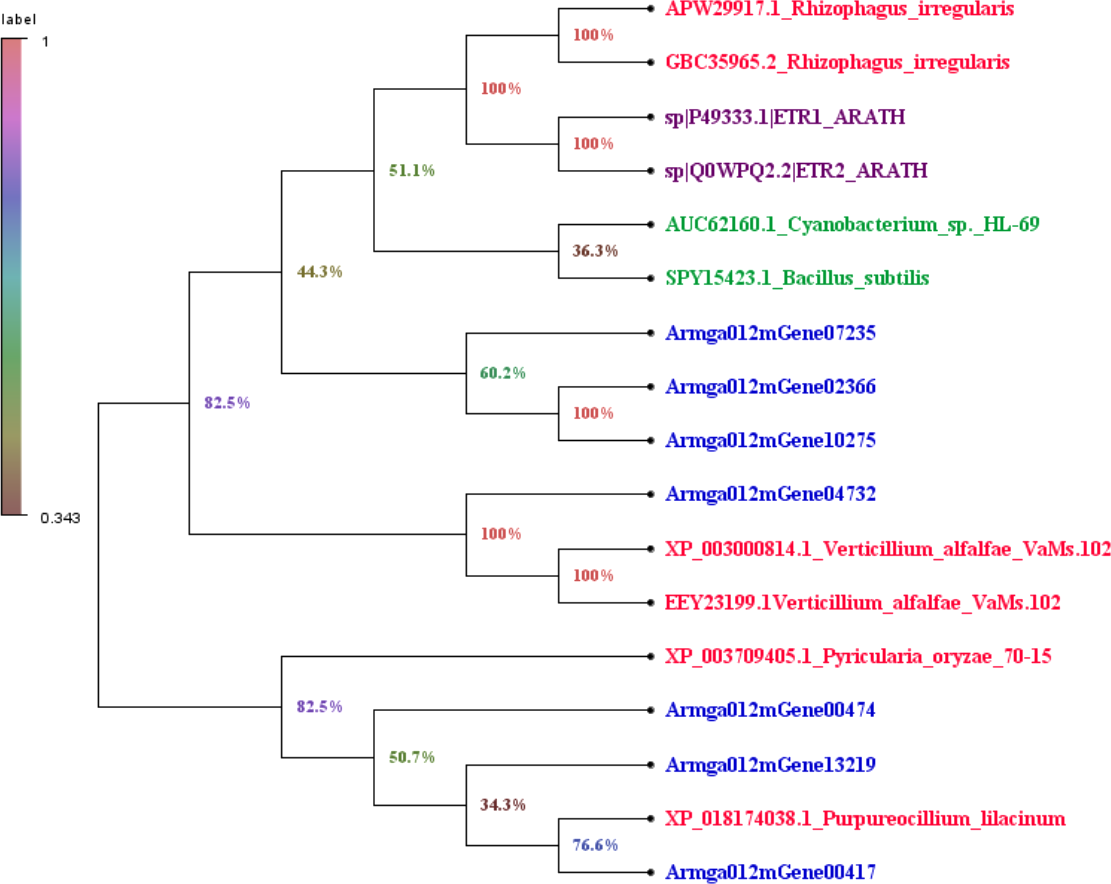
Discussion
ET is generally considered as the senescence plant hormone, and inhibits the growth process of plants (Chague et al., 2006; Pierik et al., 2006). However, ET has inhibitory and stimulatory effects on plant growth depending on the concentration (Iqbal et al., 2017). ET is reported to inhibit root elongation through interaction with auxins (Muday, Rahman & Binder, 2012), while root elongation of some plants including rice, rye, tomato and white mustard were stimulated by low levels of ET. Abts etc. reported that ET regulated early root growth in a dose-dependent manner (Abts et al., 2014). Khan etc. reported that ETH could increase the leaf area of mustard at a lower concentration, while inhibiting at higher concentration (Khan et al., 2008). In the liquid culture of A. gallica 012m, ETH-5 ppm decreased the biomass of mycelium extremely significantly, while ETH−0.1 ppm enhanced the biomass of mycelium extremely significantly and ETH-2 ppm enhanced the biomass of mycelium significantly. On the solid plate, ETH−0.1 ppm and ETH-2 ppm improved the mycelial growth, while ETH-5 ppm inhibit it. Altogether A. gallica 012m showed similar dose-dependent responses to ET like the way of plants above. Different transcriptional profiles of mycelia cultured in exiguous ETH and non-ETH media were carried out. The results showed that the number of up-regulated or down-regulated genes are increased along with the concentrations of ETH. Half of up-regulated or down-regulated genes of ETH−0.1 ppm and ETH-2 ppm coincided with ETH-5 ppm. However, it is hard to explain the great difference of DEGs between ETH−0.1 ppm and ETH-2 ppm.
Several DEGs related to the growth of A. gallica 012m were predicted by by using SMART platform. The up-regulated Pyr_redox gene had been found in bacteria, fungi and yeast as TRX (thioredoxin) system, which is one of the main antioxidant systems responsible for maintaining cellular redox homeostasis and essential for cellular viability (Missall & Lodge, 2005; Oliveira et al., 2010; Marshall et al., 2019). Budding yeast contains TRR1, which encodes the cytoplasmic thioredoxin reductase that reduces the oxidized disulfide form of TRX for the protection of yeast cells against oxidative and reductive stress (Singh, Kang & Park, 2008). The up-regulated HMG domains are known as members of the HMG superfamily and typically bind to DNA (Štros, Launholt & Grasser, 2007). Some HMG box proteins have been identified in fungi, including Saccharomyces cerevisiae (Ray & Grove, 2012), Aspergillus nidulans (Karácsony et al., 2014), Schizosaccharomyces pombe (Albert et al., 2013) and Podospora anserine (Dequard-Chablat & Alland, 2002), which have various functions. Yoshihara etc. had proposed that the new N. crassa KO strain mhg1KO, which is a protein with HMG domain, showing a short-lifespan. Therefore, its hyphal growth ceased after about two weeks of cultivation, while the wild-type continuing for over two years (Yoshihara et al., 2017). The results implied up-regulated HMG gene might improve the growth of mycelia. GAL4p (C6 zinc finger proteins) belong to the zinc cluster family, which is the largest fungal-specific TF (transcription factors) family (Ekaterina, 2017; Cho & Park, 2022). AflR, as a Gal4p, plays essential roles in fungal development and regulates secondary metabolism in A. flavus. RosA, a GAL4-like Zn2Cys6 transcription factor, inhibits sexual development in A. nidulans (Vienken, Scherer & Fischer, 2005). In the ETH−0.1 ppm and ETH-2ppm, the growth of mycelia might benefit from the up-regulated expression of Pyr_redox, GAL4P and HMG genes.
ZnF_C2H2 (C2H2 zinc finger) proteins, as a major class of transcription factors, have been functionally validated in fungal growth, development, stress responses, metabolism, sexual reproduction and virulence (Xiong et al., 2015). In Metarhizium acridum, MaNCP1 (metarhizium acridum nitrate-related conidiation pattern shift regulatory factor 1), as a C2H2 zinc finger protein, was involved in governing nitrogen utilization and conidial yield (Li, Xia & Jin, 2022). Ribosomal protein S4 is a protein of the small ribosomal subunit involved in protein synthesis (Lu et al., 2015). In S. cerevisiae, mutant of S4 ribosomal proteins lead to telomere length (Askree et al., 2004), hydrogen peroxide sensitivity and modified neomycin sulfate sensitivity (Parsons et al., 2006). In the research of Candida albicans, cDNA microarray analysis of null mutants showed that carbohydrate and nitrogen metabolic processes were repressed. In the ETH-5 ppm, the growth of mycelia might be impaired by the down-regulated expression of ZnF_C2H2 protein which affects the transcription process and ribosomal protein S4 protein which inhibits the carbohydrate and nitrogen metabolic processes.
Those DEGs are more likely to explain the significant effect with different concentrations of ETH on the growth of A. gallica 012m to some extent. We still feel regrettable that the mechanism of A. gallica 012m response to ET could not be fully elucidated because many top 10 DEGs cannot be annotated properly. What is the role ET in the interaction between G. elata and A. gallica 012m? It was presumed that G. elata need some kinds of signaling molecules to guide the A. gallica growth towards itself for energy and nutrition. We speculated that ET is a kind of signaling molecule, which help A. gallica capture mycelia. On the other hand, ET is the signaling molecule, which guides A. gallica to live plant.
The RNA-seq analysis indicated that ETH treatment influenced the gene expression of A. gallica 012 m significantly, and implied that ET could be the signaling molecule of A. gallica 012m. As signaling molecule, ET receptors and its signaling pathway in plants had been well studied (Merchante, Alonso & Stepanova, 2013; Shakeel et al., 2013; Bakshi et al., 2015). In bacteria, most of the researches concerning ethylene receptors were obtained from studies on the Cyanobacterium synechocytis (Bidon et al., 2020; Carlew, Allen & Binder, 2020). Lacey & Binder (2016) first demonstrated that Synechocystis Ethylene Response1 (SynEtr1) from Synechocystis sp. PCC6803, as a biofunctional receptor responses to light and ethylene, contains ET binding domains. Recent genomic data revealed many putative ET receptors in nonplant species including bacteria, fungi and animals (Carlew, Allen & Binder, 2020). There were three transmembrane helices with seven conserved amino-acids including GAF, HK, HA, PAS/PAC, R, P, and STYKc (Papon & Binder, 2019). ET receptors homologs were also predicted in genomes of early diverging fungi which used to be symbiont with plant or colonize decaying plant (Herivaux et al., 2017). Seven ET receptors of A. gallica 012m were predicted based on RNA-seq and genome. There were 7 conserved amino-acids including GAF, Hiska, HATPase_c, PAS, HAMP, REC and STYKc. However, only Armga012mGene13219 possessed five transmembrane helices. We speculated that there were ET receptors in A. gallica 012m.
It had been demonstrated that ET involved in the plant-fungi interaction. Therefore, some early diverging fungi, known to behave as plant symbionts, were found in ET receptors homologs (Papon & Binder, 2019). Our work provided a new perspective of the hormonal communication that might operate in these symbioses, and ET might play an important role in the process.
Conclusions
In conclusion, a low concentration of exogenous ETH improved the growth of mycelia, while a high concentration of exogenous ETH inhibited the growth of mycelia in both solid and liquid media. The RNA-seq analyses showed that the number of up-regulated or down-regulated genes are increased along with the concentrations of ETH. Based on the structure prediction of DEGs, the growth of mycelia might benefit from the up-regulated expression of Pyr_redox, GAL4 and HMG genes in the ETH−0.1 ppm and ETH-2 ppm. Therefore, the growth of mycelia might be impaired by the down-regulated expression of ZnF_C2H2 and ribosomal protein S4 proteins. Those DEGs are more likely to explain the significant effect with different concentrations of ETH on the growth of A. gallica 012m to some extent.We speculated that A. gallica 012m contains seven ET receptor protein domains. Based on cluster analysis and comparative studies of proteins, the result showed that putative ET receptor domains of A. gallica 012m have a higher homologous correlation with fungi. Eventually, we speculate that ET receptors exist in A. gallica 012m.