
Physical and chemical properties of the soils in selected communal property associations of South Africa
- Published
- Accepted
- Received
- Academic Editor
- Amanullah Khan
- Subject Areas
- Agricultural Science, Soil Science
- Keywords
- Soil type, Soil minerals, Livestock, Grazing, Vegetation cover
- Copyright
- © 2022 Ntalo et al.
- Licence
- This is an open access article distributed under the terms of the Creative Commons Attribution License, which permits unrestricted use, distribution, reproduction and adaptation in any medium and for any purpose provided that it is properly attributed. For attribution, the original author(s), title, publication source (PeerJ) and either DOI or URL of the article must be cited.
- Cite this article
- 2022. Physical and chemical properties of the soils in selected communal property associations of South Africa. PeerJ 10:e13960 https://doi.org/10.7717/peerj.13960
Abstract
Communal Property Associations (CPAs) rangeland users need more knowledge on the state of their respective grazing lands and also the interaction of soil properties with grazing management implemented. This study aimed to investigate the effect grazing has on the physical and chemical properties of four different soil types found in selected CPAs of the Bela-Bela municipality, they are as follows: Mawela (Hutton-clay loam: HCL), Bela-Bela (Hutton-clay: HC), Moretele (Hutton-loamy sand: HLS) and Ramorula (Ecca sand-clay loam: ESCL).The macro and micro minerals, pH, nitrate-nitrogen, ammonium-nitrogen, organic carbon, soil particle size distribution, acidity and resistance were all measured. All data were subjected to two-way factorial analysis of variance (SAS, 2010). The topsoil was sampled at a depth of 300 mm at an interval of 100 m (100 and 200 m) from the same transect used for woody species data collection resulting in a total of 18 samples per CPA. In each CPA, three camps were selected. In each camp, three transects 200 m apart at the length of 200 m were set. In each transect, soils were drawn at 0, 100 and 200 m making a total of nine soil samples per each camp. The highest (P < 0.05) pH (7.14) recorded on the sub-soil was in HLS. Nitrate nitrogen (2.4 mg/kg) concentration on the topsoil was high (P < 0.05) in HC soil type. Soil organic carbon for both topsoil (0.66%) and subsoil (0.41%) was significantly lower (P < 0.05) in HLS soil type and ESCL soil type respectively. Phosphorus concentration was significantly high (P < 0.05) in ESCL soil type for both topsoil (12.86 mg/kg) and sub-soil (1.59 mg/kg). Iron concentration was high in both topsoil (11.8 mg/kg) and sub-soil (7.3 mg/kg) in ESCL soil type. Sub-soil manganese concentration was found to be higher (P < 0.05) in ESCL soil type (7.58 mg/kg). Soil resistance (2880 Ω ) measured in topsoil was high (P < 0.05) in HCL soil type compared to other soil types. Moreover, for the sub-soil the highest (P < 0.05) resistance (least salts) (3640 Ω) was recorded in ESCL soil type. For most of the soil types, the mineral concentration was higher in topsoil than in sub-soil, this trend explains that the uptake of these minerals by plants took place due to the inconsistencies of grazing management employed in these selected CPA farms. It is of colossal significance to properly manage rangelands, to allow a fair-to-good herbaceous layer in the presence of minerals in the soils and farmer should prioritize having enclosures and keeping N-fixing tree species in the rangelands to achieve the above mentioned conditions.
Introduction
The essential function of Communal Property Associations (CPAs) in resource governance is increasingly being recognized in previously conducted studies (Ghate & Nagendra, 2005; Sebola & Mamabolo, 2020). Moreover, in communal property associations individuals have authority over resources and therefore common property organizations vary considerably from open access, which lack resource use rights (Agrawal, 2001). The management of grazing in CPAs is crucial for the maintenance of rangeland production and health. Studies have shown that there is a dynamic relationship that exists between the rangeland vegetation and soil properties (Herrick & Wander, 2018; Egeru et al., 2019). The features of any soil type play a role in the widely recognized resilience in semi-arid grazing lands, because they provide a degree of flexibility to the soil, in the notion that they provide pliancy to the soil, thus preventing disturbances in the biological system (Dougill, Heathwaite & Thomas, 1998; Walker & Meyers, 2004; Vetter, 2013). Rangeland health is predominantly dependent on the interaction between the soil and plant communities (Balestrini et al., 2015). Continuous grazing by livestock on the rangeland leads to poor physical, chemical and biological properties of soil, resulting in a dramatic change in vegetation and nutrient cycling (Lavado, Sierra & Hashimoto, 1996; Bolo et al., 2019). When such a problem is encountered in rangeland, the growth of perennial decreaser grasses will decline, and change in the herbaceous layer species and woody species establishment will occur (Ash et al., 2011). Undesirable land changes in livestock production as noted in studies conducted by Ash, Smith & Abel (2002), Holecheck et al. (2003) and Munyai (2012) give rise to constrains in management, this is due to the unavailability of instant drive grazing strategies.
The variation in soil properties influence the growth and development of both grasses and trees, soil depth impacts how deep or shallow roots of these plants can grow (Stichler, 2002). Furthermore, vegetation change and soils’ reaction to grazing pressure can be used as the most reliable indicator of rangeland degradation (Wang & Wesche, 2016a; Wang & Wesche, 2016b; Cao et al., 2018). Several studies highlighted the impact that grazing had on soil fertility (Wang & Batkhishig, 2014; Rahmanian et al., 2019). In the experiment run by Selemani (2015), soil organic matter, nitrate nitrogen, soil organic carbon and exchangeable calcium were both lower by 30–60% when compared to that of enclosures. Schrama et al. (2013) also highlighted that, other factors such as nutrients addition from dungs and urine during grazing can also alter the condition of the soil. Moreover, even on physical properties overgrazing increased topsoil’s temperature and increasing bulk and particle density, which all can be attributed to animal pressure to the rangeland. The increased densities and loss of moisture from the topsoil will make it less suitable for seed germination, thus a decline in species composition will occur and paving way for invasive species (MacLachlan, 2013). However, in enclosures (in rotational grazing) species composition is enriched, less bare areas that will be prone to erosion and leaching away of important soil nutrients vital for plant growth and development (MacLachlan, 2013). Communal property association rangeland users need more knowledge on the state of their respective grazing lands and also the interaction of soil properties with grazing management implemented. Acquiring this in-depth knowledge is of paramount importance to these farmers in developing suitable and sustainable grazing management strategies that will promote livestock production. Research is silent on how grazing management in South African CPAs affect soil productivity, thus this study aimed to explore how grazing management implemented in the CPAs of Bela-Bela affect the soil productivity. It was hypothesized that soils under these CPAs had been negatively affected by grazing in both physical and chemical properties. Therefore, the objective of the study was to assess the effect of grazing management (continued grazing) on the available soil minerals in the four different soil types found in selected CPAs of South Africa.
Materials & Methods
Study site description
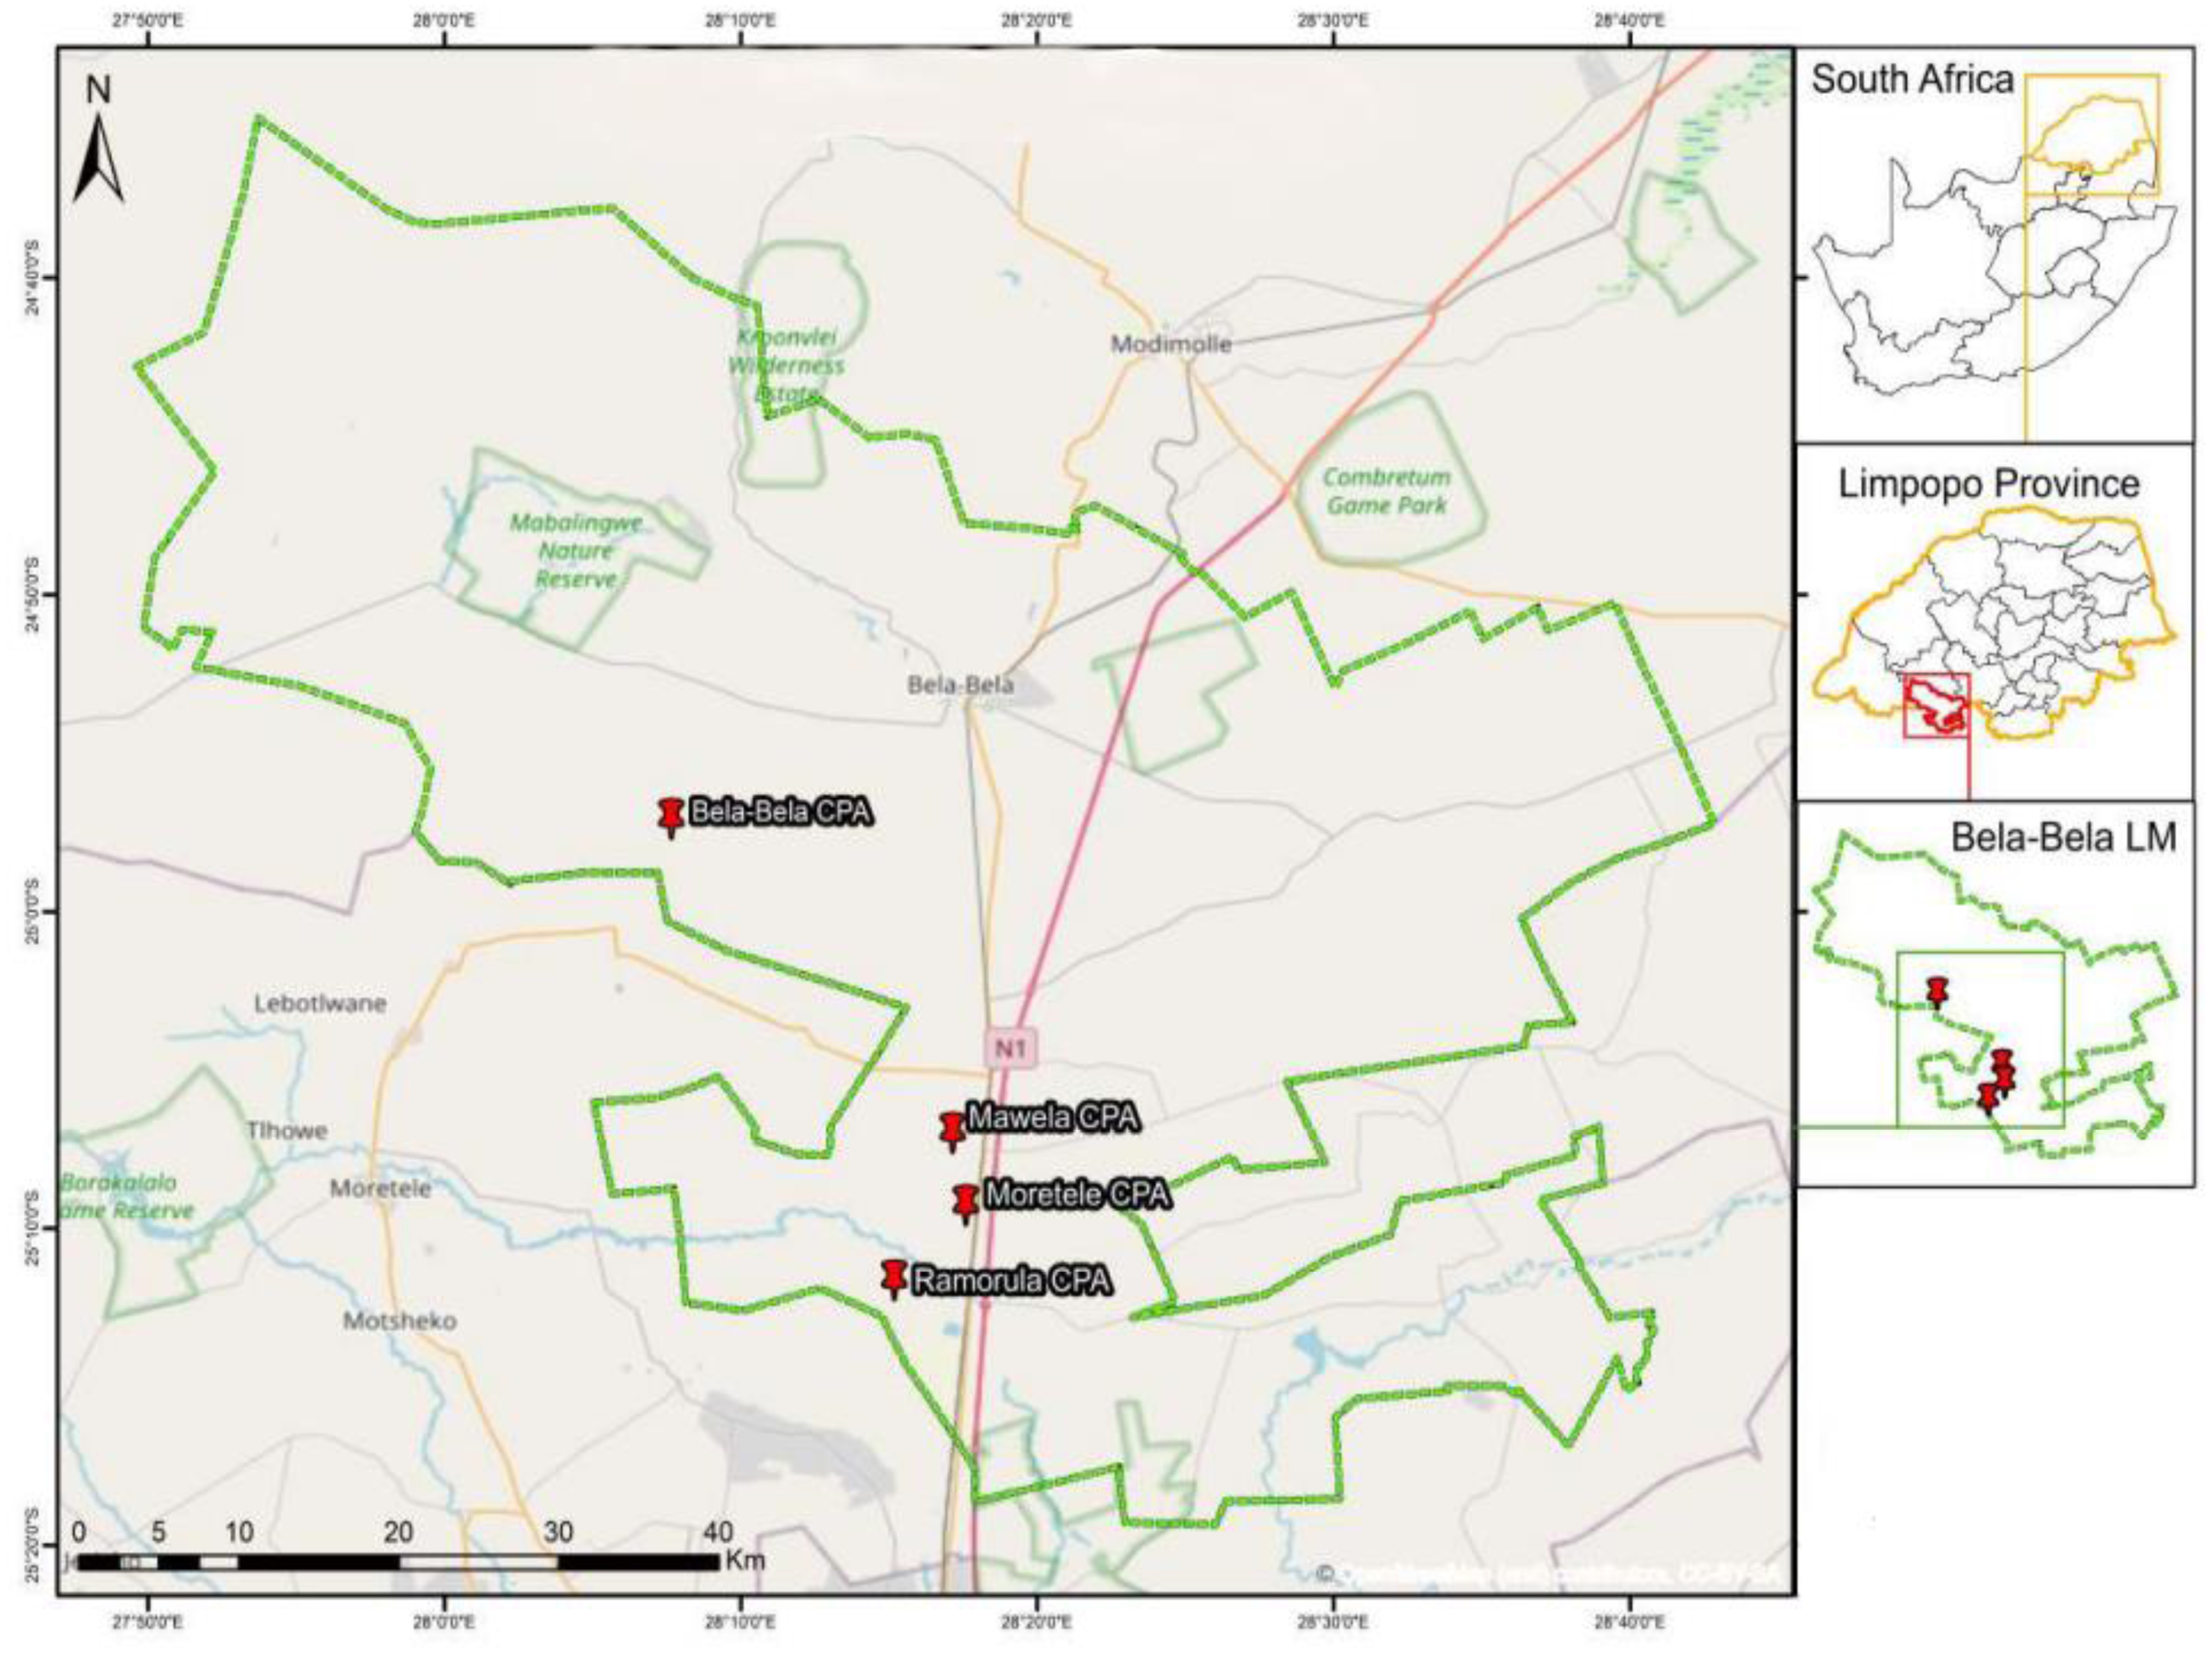
This study was conducted in Bela-Bela local municipality at four CPAs namely, Mawela, Bela-Bela, Ramorula and Moretele (Table 1) located at the following altitude and coordinates: 1082 m; 25°6′54.30″S, 28°16′52.96″E; 1118 m; 24°57′2.49″S, 28°7′38.03″E, 1036 m; 25°11′36.55″S, 28°14′54.25″E, 1063 m; 25°9′14.78″S, 28°17′34.06″E, respectively. The Bela-Bela local municipality (Fig. 1) is located in the southern part of the Limpopo province. The veld type is springbokvlakte thornveld, open to dense thorn savannah with low shrub layer mainly dominated by acacia species. The geology of the area shows Hutton and Ecca soils with high calcium carbonate content and gilgai micro-relief. Bela-Bela receives an average of 500 to 600 mm of rainfall per year, and the mean daily temperature varies from 5−35 °C throughout the year (Mucina & Rutherford, 2006). The study area is dominated by both some grass and woody species such as Cymbopogon pospischilii, Aristida cogesta, Cynodon dactylon, Digitaria eriantha, Dichrostachys cinerea (N-fixer), Grewia flava (N-fixer), Senegalia mellifera (N-fixer) and Ziziphus mucronata. The sites were assessed for carrying capacity in order to determine grazing capacity (ha/LSU) following the assessment guideline as per (Van Oudtshoorn, 2015). The following equation was used for grazing capacity: Grazing capacity (ha/LSU): d/(DM/r); d: number of days in a year; DM: dry matter weight in kg (biomass); r: utilisation factor (2.5% of 450 kg body weight). These farms are occupied by cattle, goats, sheep and some game animals. Among the CPAs, Ramarula is the oldest and was obtained in 1998 (24 years ago).
| Mawela | Bela-Bela | Moretele | Ramorula | |
|---|---|---|---|---|
| Year obtained | 2008 | 2007 | 2003 | 1998 |
| Farm size | 1457 ha | 600 ha | 2000 ha | 850 ha |
| Soil type | Hutton-clay loam | Hutton-clay | Hutton-loamy sand | Ecca-sand clay loam |
| Vegetation type | The veld type is springbokvlakte thornveld, open to dense thorn savannah with low shrub layer (Mucina & Rutherford, 2006) | |||
| Altitude and coordinates | (1082 m) 25°6′54.30″S 28°16′52.96″E | (1118 m) 24°57′2.49″S 28°7′38.03″E | (1063 m) 25°9′14.78″S 28°17′34.06″E | (1036 m) 25°11′36.55″S 28°14′54.25″E |
| Rainfall and temperature | An average of 500 to 600 mm per year, and the mean daily temperature varies from 5–35 °C throughout the year | |||
| Biomass (kg/ha) | 658.9 | 823.3 | 265.6 | 488.9 |
| Basal cover (%) | 42.39 | 55.75 | 28.37 | 37.22 |
| Grazing capacity (ha/LSU) | 7.02 | 5.82 | 20.64 | 8.65 |
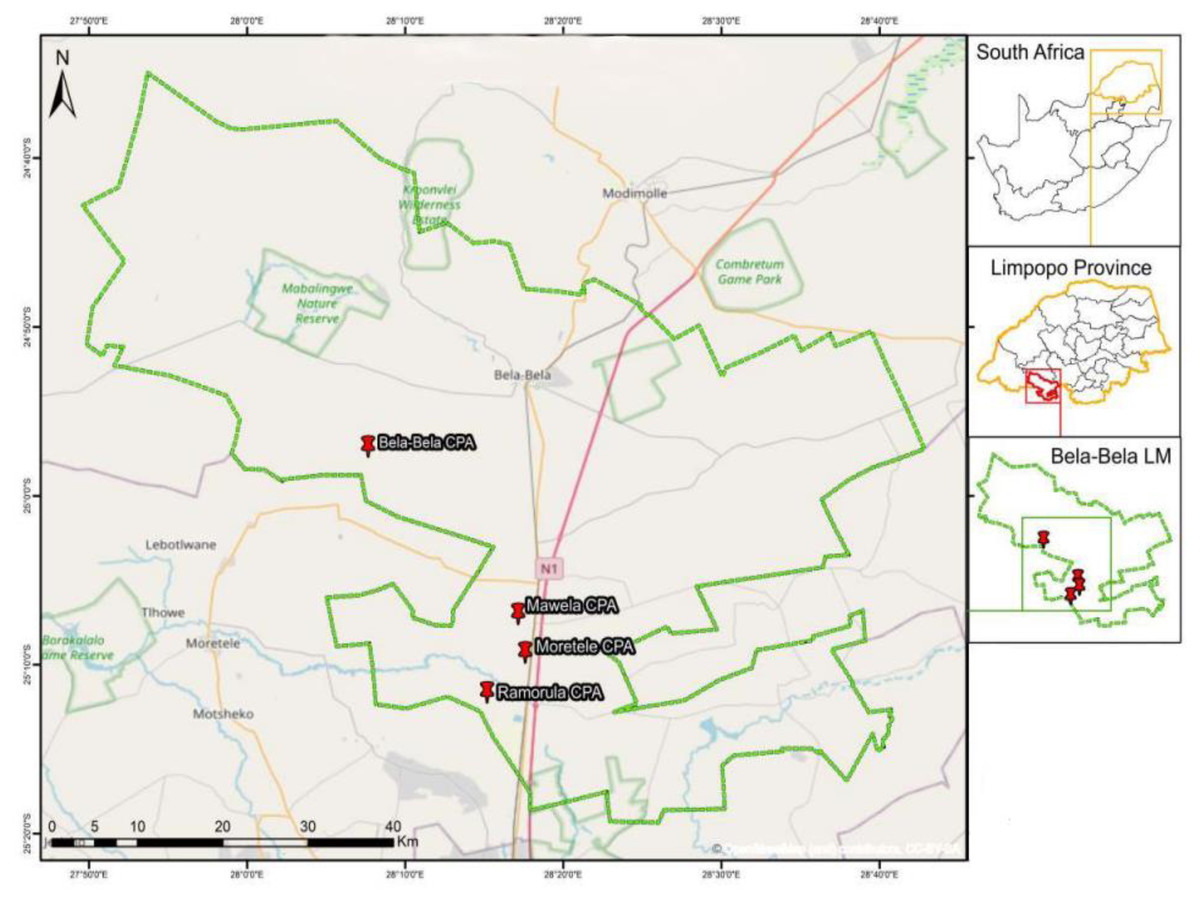
Figure 1: Map location of four selected CPAs.
The lab soil analysis of the study was done at the North-West University experimental farm (Molelwane), Mafikeng (25°47′27″S and 25°37′18″E), North-West province of South Africa, with an altitude of about 1290 m above sea level. All farms were geo-referenced using GPS.
Soil sampling and analysis
Soil data collection was done between January to February 2021. Topsoil was sampled at a depth of 0 to 150 mm whereas subsoil was sampled from 150 to 300 mm at an interval of 100 m (100–200 m) from the same transect used for woody species data collection resulting in a total of 18 samples per CPA. A 102 mm auger was used when collecting the soil. In each CPA, three camps were selected. In each camp, three transects 200 m apart at the length of 200 m were set. In each transect, soils were drawn at 0,100 and 200 m making a total of nine soil samples per each camp. Sub-samples were bulked per CPA, air-dried, and sieved through a two-millimetre mesh screen pending analysis. Soil pH was analysed as described by McLean (1983), soil organic carbon (OC) was determined by wet oxidation methods of Walkley & Black (1934). Soil (Hutton-clay loam: HCL; Hutton-clay: HC; Hutton-loamy sand: HLS and Ecca sand-clay loam: ESCL) samples from all CPA farms were analyzed for both macro and micro minerals following the guidelines provided by the Agri-Laboratory Association of South Africa (AgriLASA, 1998) and N-NO3, N-NH4 were determined by the Kjeldahl method. The pH of the soil was determined using a 1:2.5 soil water relation extraction method. Magnesium, Ca, Zn, Cu, Na, Fe, Mn were all determined by atomic absorption spectroscopy, while K was determined by the emission spectroscopy. Ultraviolet spectrophotometer was used to determine P (Olsen & Sommers, 1982). Using an ion chromatograph, the amounts of chloride and sulfate in the soil were determined according to Dick & Tabatabai (1979) and Tabatabai & Dick (1983) methods. Soil texture (particle size) was determined employing the standard Bouyoucos (hydrometer) method (Day, 1965). The soil was also classified according to structure and texture.
Resistance analysis
Soil resistance measures were used in a field method for measuring soil salinity. The US Bureau electrode cup was filled with soil, which was then moistened with de-ionised water while being stirred with a spatula until a homogenous mixture was obtained. The mixture was consolidated by tapping the container on the workbench from time to time, then testing for the properties of a saturated paste and adding more water if necessary was done (US Salinity Laboratory, 1954). After an hour, it was checked to see if the paste still retained saturated qualities. The sample was allowed to stand for 4 h before determining the electrical resistance of the paste in ohms using a resistance bridge corrected for a temperature of 25 °C. It should be noted that the determination reported by the US Salinity Laboratory corrects the resistance (Ω) to a temperature of 15.5 C.
This study was approved by the North-West University Ethics Committee standards: Ethical Clearance No: NWU-01732-20-A9.
Statistical analysis
Two-way factorial analysis of variance (SAS, 2010) was used to test the effect of soil depth and soil type in all measured parameters in studied CPA farms. The following model was used for statistical analysis:
where Yij was the dependent variable (physical and chemical soil properties), µwas the overall mean, P was the soil depth effect, S was the effect of soil type (different CPAs), and ɛ was the random error associated with observation i j assumed to be randomly distributed. Statistical difference was acknowledged at P < 0.05. Tukey’s test was used to separate the means. n = 3 for each subgroup.
Results
Soil pH, nitrate-nitrogen, ammonium-nitrogen and organic carbon
Results on the effect of soil type and depth on soil pH, nitrate-nitrogen (N-NO3), ammonium-nitrogen (N-NH4) and organic carbon concentration in four different soil types of Bela-Bela municipality are presented in Figs. 2 and 3. There was a statistical significant difference of soil type, depth and the interaction between the two. There was no significant (P > 0.05) difference observed in pH of topsoil across the different soil types. The highest (P < 0.05) pH (M ±SE: 7.14 ± 0.41) recorded on the sub-soil was in HLS. Nitrate nitrogen (2.4 ± 0.018 mg/kg) concentration on the topsoil was high (P < 0.05) in HC soil type when compared to other soil types. In sub-soil, soil nitrate-nitrogen (1.98 ± 0.018 mg/kg) was greater (P < 0.05) in HLS soil type compared to other soil types. Soil N-NH4 (4.48 ± 0.022 mg/kg) in HC soil type was more (P < 0.05) on the top soil than in sub-soil. All soil types had more organic matter on top soil when compared to sub-soil.
Soil macro minerals
There was a statistical significant difference of soil type, depth and the interaction between the two in the macro minerals in all selected CPAs (Table 2). Calcium concentration was highest (P < 0.05) in the topsoil and sub-soil of HC soil type (1420 mg/kg) and HLS soil type (1630 mg/kg), respectively. Phosphorus concentration was significantly high (P < 0.05) in ESCL soil type in both the topsoil (12.86 mg/kg) and sub-soil (1.59 mg/kg). A significantly higher (P < 0.05) concentration of potassium was observed in topsoil as compared to the sub-soil in ESCL soil type. Sulfate ions concentration was significantly high (P < 0.05) in HC soil type (82.9 mg/kg) when compared to other soil types. For both topsoil and sub-soil magnesium concentration was significantly higher (P < 0.05) in HC soil type.
Soil trace/ micro minerals
Results on the effect of soil type and depth on micro mineral concentration in four different soil types of Bela-Bela municipality are presented in Table 3. There was a statistical significant difference of soil type, depth and the interaction between the two. Iron concentration in both topsoil (11.8 mg/kg) and sub-soil (7.3 mg/kg) was significantly high (P < 0.05) in ESCL soil type when compared to other soil types. In sub-soil, manganese concentration was found to be higher (P < 0.05) in ESCL soil type (7.58 mg/kg). Copper concentration was high (P < 0.05) in HC soil type for both the topsoil (2.61 mg/kg) and sub-soil (3.54 mg/kg). The highest (P < 0.05) concentration of chlorine (42.2 mg/kg) was observed in the topsoil of ESCL soil type, whereas in the subsoil the highest (P < 0.05) concentration (66 mg/kg) was found in HCL soil type.

Figure 2: Soil pH and nitrate-nitrogen (mg/kg) found in four soil types of Bela-Bela municipality (n = 3).
(HCL, Hutton clay-loam; HC, Hutton-clay; HLS, Hutton sandy-loam; ESCL, Ecca sandy clay-loam).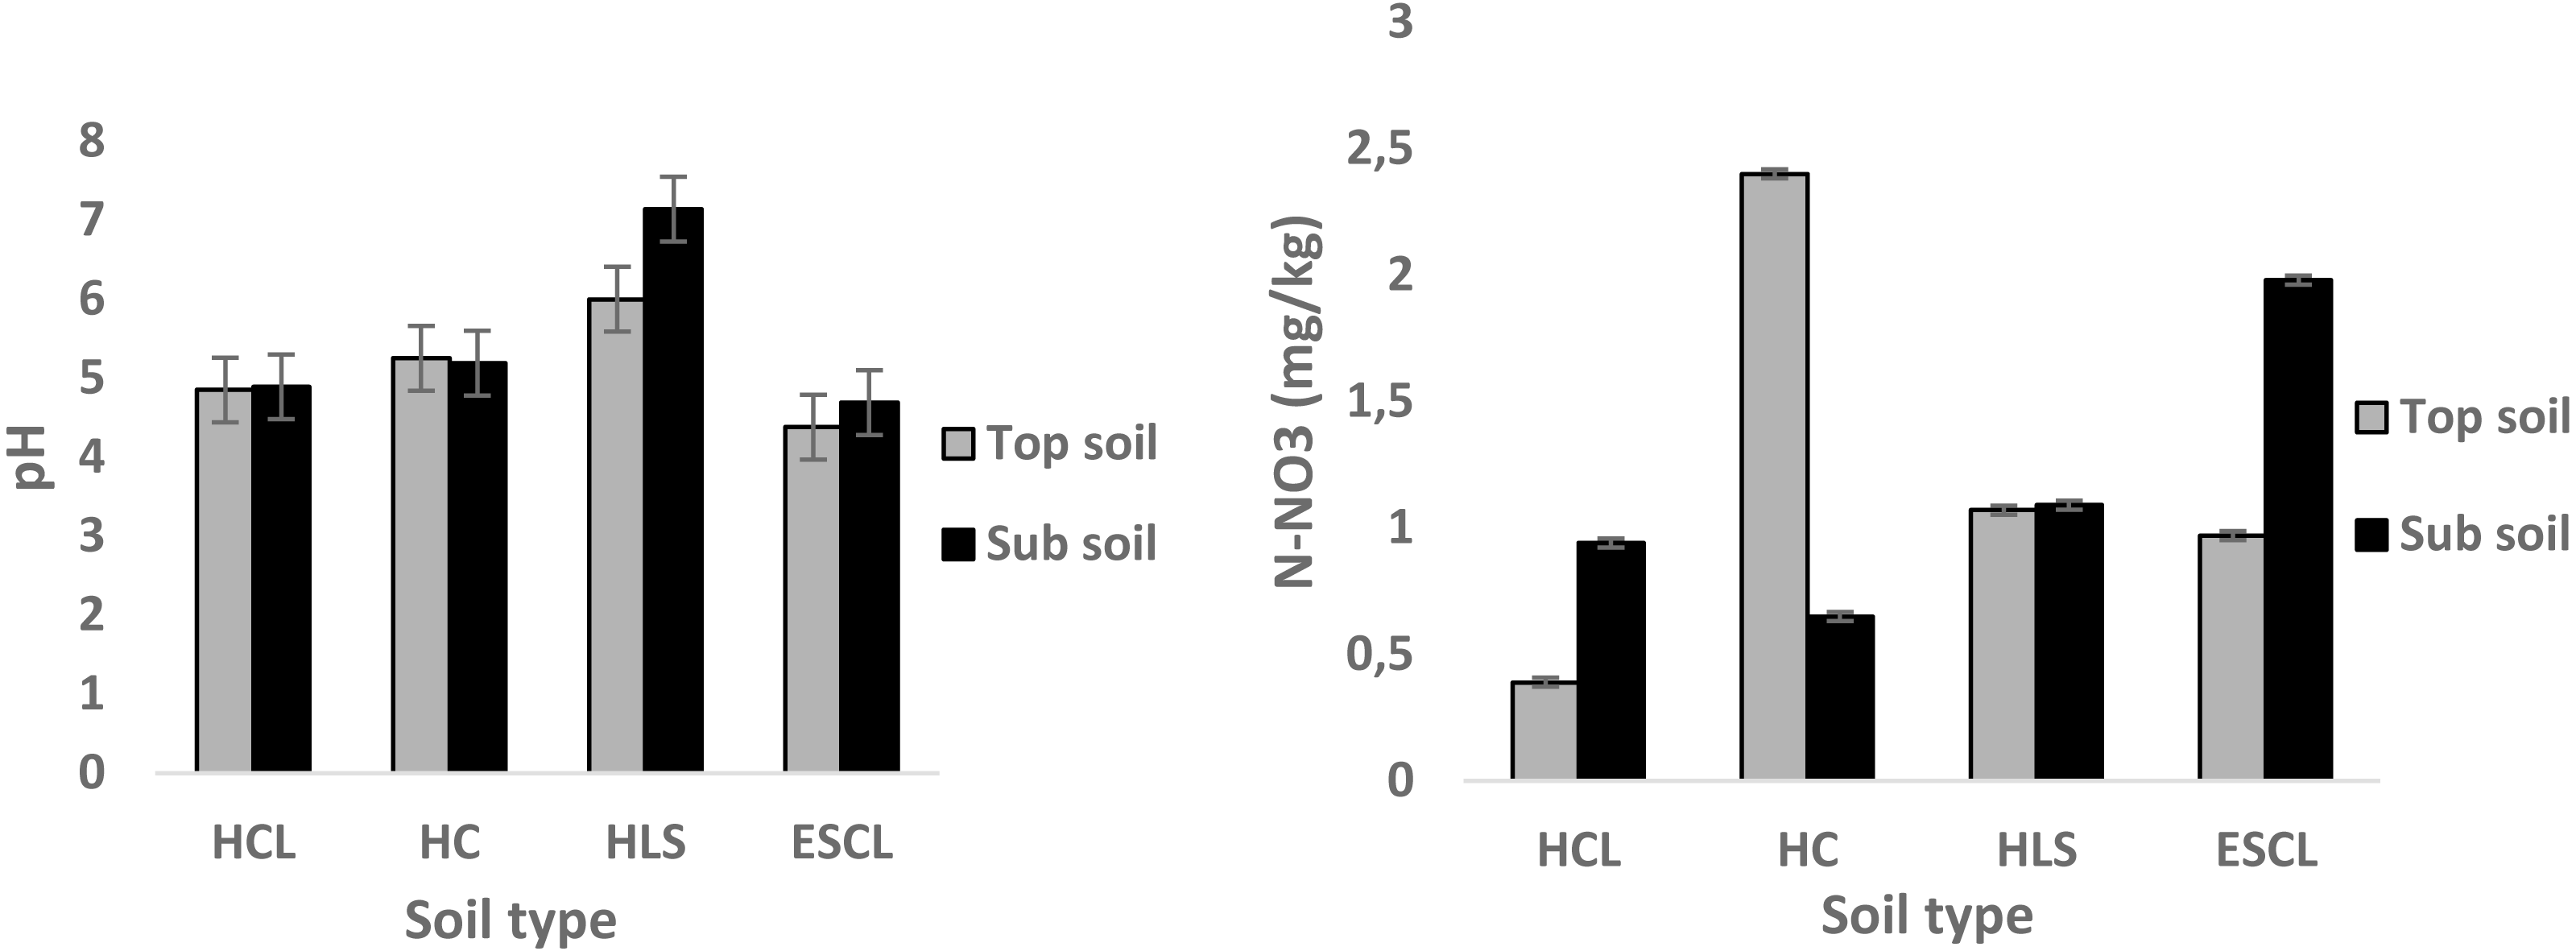
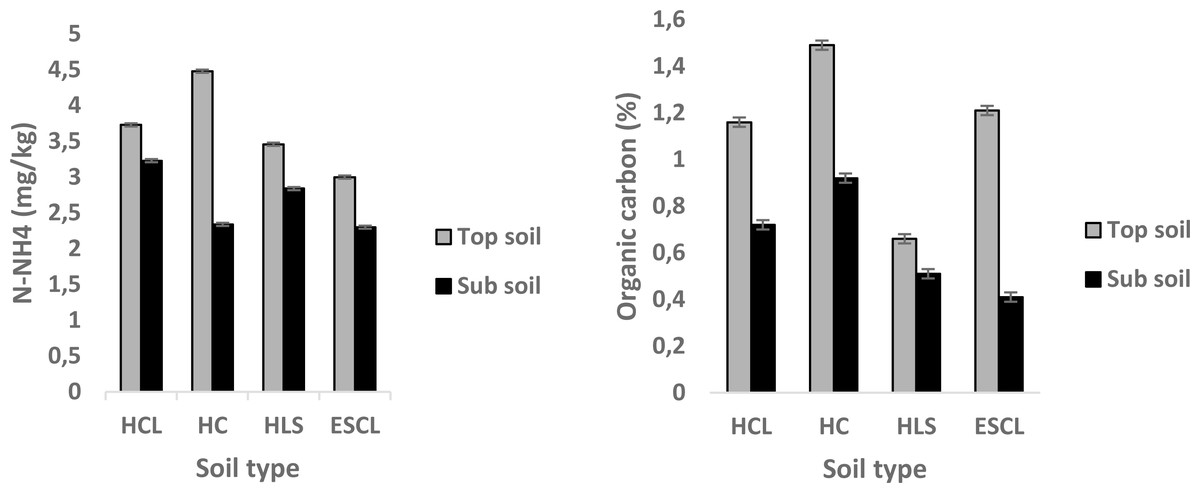
Figure 3: Soil ammonium-nitrogen (mg/kg) and organic carbon (%) found in four soil types of Bela-Bela municipality (n = 3).
(HCL, Hutton clay-loam; HC, Hutton-clay; HLS, Hutton sandy-loam; ESCL, Ecca sandy clay-loam).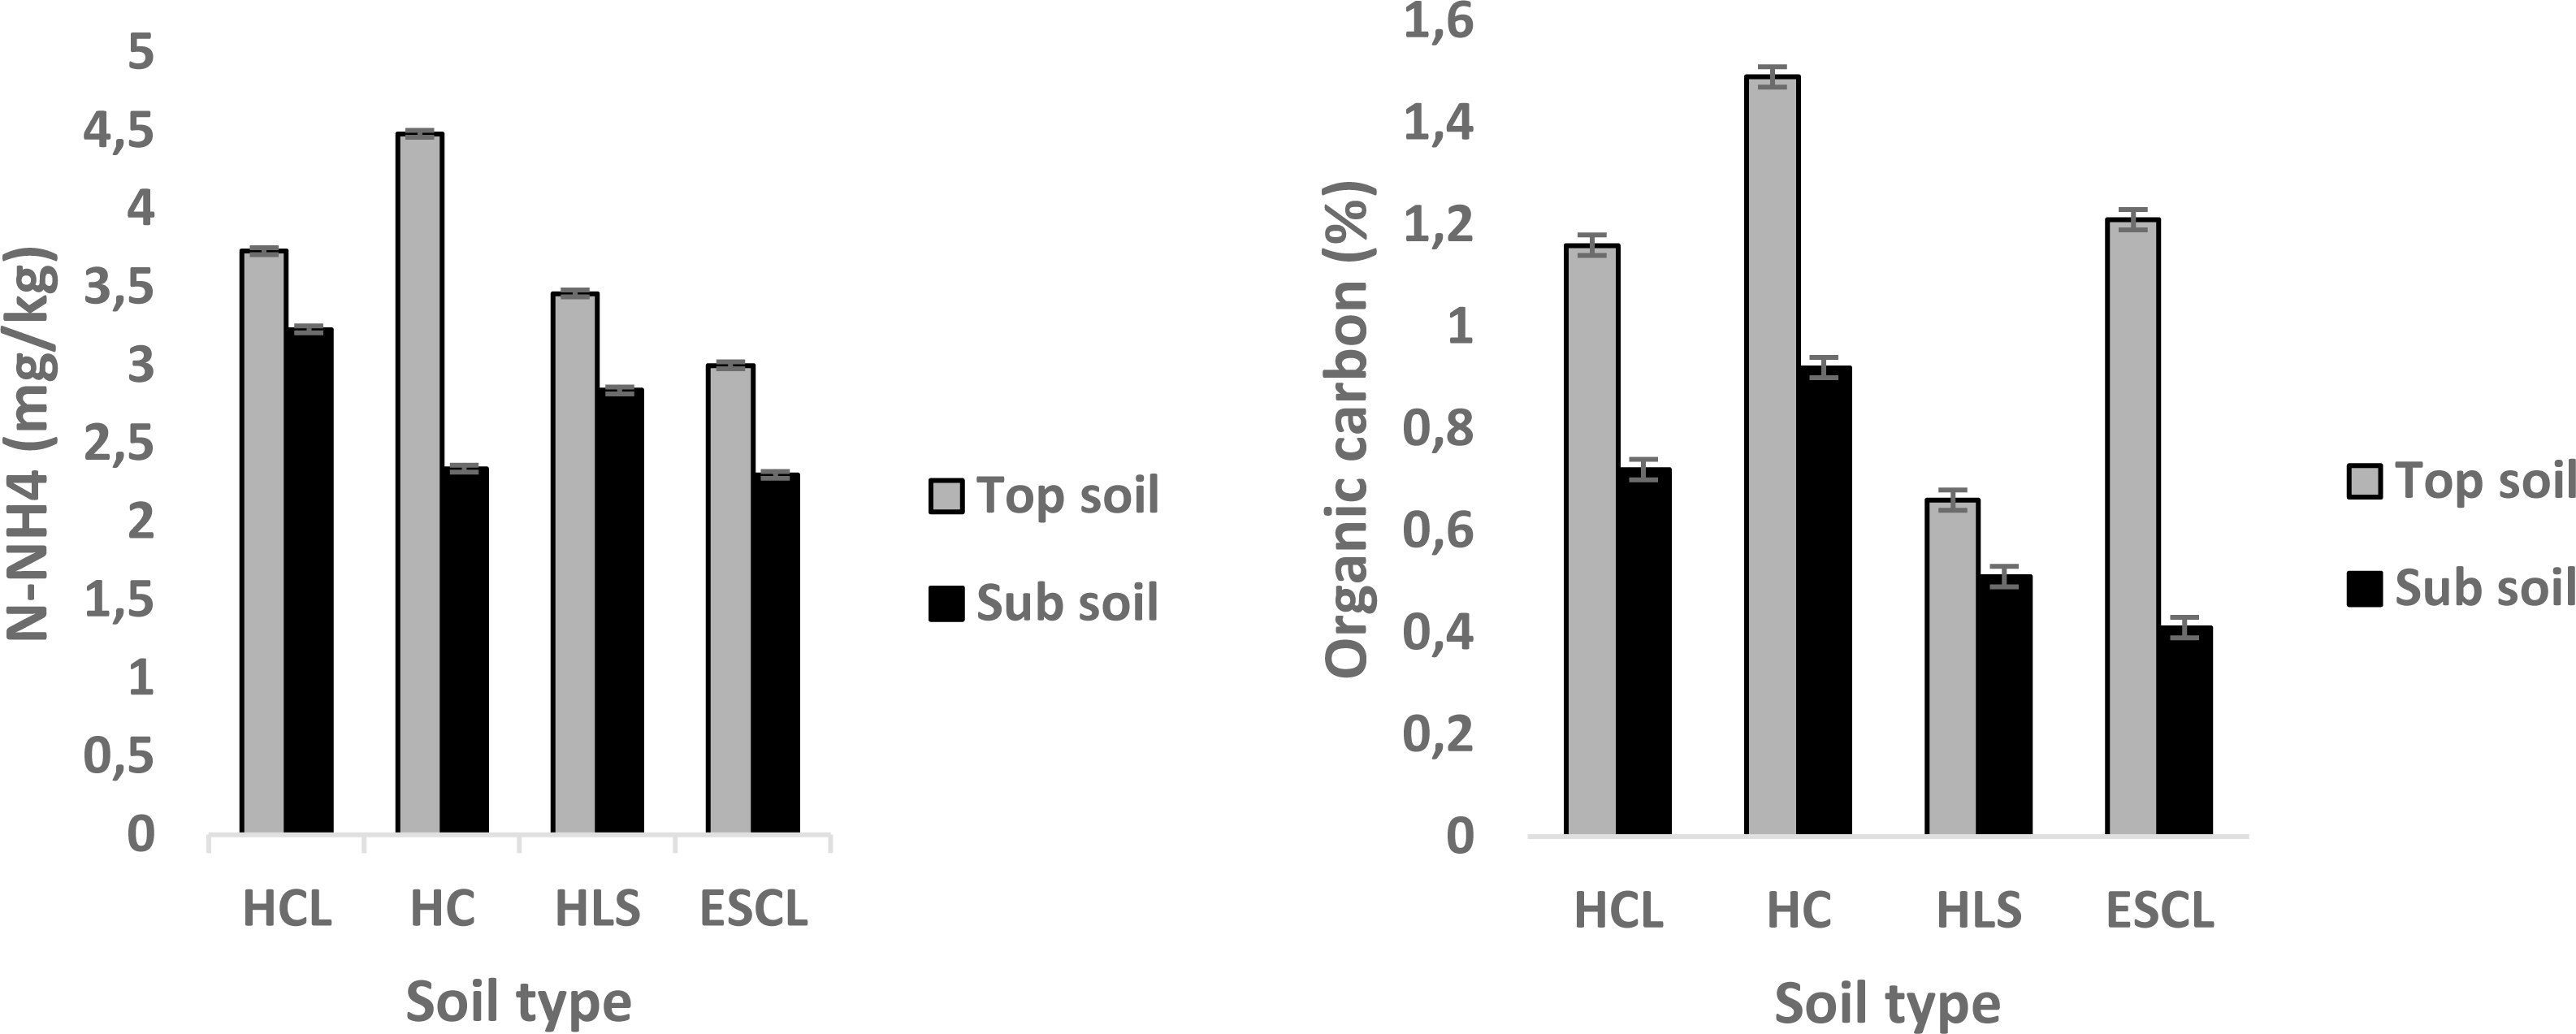
| Ca | P | K | Na | SO4 | Mg | |||||||
|---|---|---|---|---|---|---|---|---|---|---|---|---|
| Soil type | Top | Sub | Top | Sub | Top | Sub | Top | Sub | Top | Sub | Top | Sub |
| HLC | 679.0cA | 618.0cB | 2.57dA | 0.32cB | 221.0bA | 144.0bA | 5.78cB | 7.84bA | 35.3cB | 85.9aA | 288.0bA | 288.0bA |
| HC | 1420.0aB | 1340.0bA | 8.74bA | 0.14dB | 394.0aA | 302.0aB | 7.39bA | 7.39cA | 82.9aA | 76.2bA | 480.0aA | 359.0aB |
| HLS | 845.0bB | 1630.0aA | 5.21cA | 1.12bB | 120.0cA | 149.0bB | 4.95dB | 7.21cA | 32.2cB | 84.5aA | 98.0dB | 138.0dA |
| ESCL | 333.0dB | 353.0dA | 12.86aA | 1.59aB | 125.0cA | 109.0cB | 8.49aB | 14.90aA | 72.9bB | 41.6cA | 129.0cB | 156.0cA |
| S.E | 2.28 | 0.018 | 1.72 | 0.074 | 1.08 | 2.65 | ||||||
Notes:
- Ca
-
Calcium
- P
-
Phosphorus
- K
-
Potassium
- Na
-
Sodium
- SO4
-
Sulfate
- Mg
-
Magnesium
- HCL
-
Hutton-clay loam
- HC
-
Hutton-clay
- HLS
-
Hutton-loamy sand
- ESCL
-
Ecca sandy-clay loam
- SE
-
Standard error
| Fe | Mn | Cu | Cl | Zn | ||||||
|---|---|---|---|---|---|---|---|---|---|---|
| Soil type | Top | Sub | Top | Sub | Top | Sub | Top | Sub | Top | Sub |
| HCL | 5.22bA | 3.37cB | 22.60bA | 4.34cB | 2.03bB | 2.26bA | 18.0bcB | 66.0aA | 1.83aA | 0.44bB |
| HC | 5.43bA | 3.90bB | 40.80aA | 7.27abB | 2.61aB | 3.54aA | 41.0aA | 41.2bA | 3.28aA | 1.37aB |
| HLS | 2.09cA | 1.48dB | 14.60cA | 6.23bB | 0.31dB | 0.43dA | 16.0cB | 41.1bA | 0.94dA | 0.44bB |
| ESCL | 11.80aA | 7.30aB | 21.50bA | 7.58aB | 0.74cA | 0.79cA | 42.2aA | 26.2cB | 1.10cA | 0.42bB |
| S.E | 0.078 | 0.23 | 0.016 | 0.90 | 0.097 | |||||
Notes:
- Fe
-
Iron
- Mn
-
Manganese
- Cu
-
Copper
- CL
-
Chlorine
- Zn
-
Zinc
- HCL
-
Hutton-clay loam
- HC
-
Hutton-clay
- HLS
-
Hutton-loamy sand
- ESCL
-
Ecca sandy-clay loam
- SE
-
Standard error
Particle size distribution of different soil types
Results of the particle size distribution of sand, clay, and silt found in four different soil types and depth of Bela-Bela municipality are presented in Table 4. There was a statistical significant difference of soil type, depth and the interaction between the two. Sand particles (84%) on the topsoil were more (P < 0.05) distributed in HLS soil type compared to other soil types. There was a significant (P < 0.05) increase in clay particle size (24%) distribution in topsoil of HC soil type compared to other soil types. In sub-soil, the highest (P < 0.05) distribution of clay particles (30%) was observed in HC soil compared to other soil types. For both the topsoil (0.14) and sub-soil (0.09), the acidity was significantly high (P < 0.05) in the ESCL soil type.
| Sand | Silt | Clay | Acidity | |||||
|---|---|---|---|---|---|---|---|---|
| Soil type | Top | Sub | Top | Sub | Top | Sub | Top | Sub |
| HCL | 72.0abA | 68.0aA | 6.0aA | 8.0aA | 22.0aA | 24.0abA | 0.03bA | 0.03bA |
| HC | 68.0bA | 60.0bA | 8.0aA | 10.0aA | 24.0aA | 30.0aA | 0.02cA | 0.02cA |
| HLS | 84.0aA | 80.0aA | 4.0aA | 6.0aA | 12.0bA | 14.0cA | 0.01dB | 0.04bA |
| ESCL | 76.0abA | 76.0aA | 4.0aA | 4.0aA | 20.0abA | 20.0bcA | 0.14aA | 0.09aB |
| S.E | 2.72 | 1.31 | 1.97 | 0.0016 | ||||
Notes:
- HCL
-
Hutton- clay loam
- HC
-
Hutton- clay
- HLS
-
Hutton- loamy sand
- ESCL
-
Ecca sandy-clay loam
- SE
-
Standard error
Resistance of four different soil types
Figure 4 depicts the mean resistance of four different soil types and depth of Bela-Bela municipality CPAs. There was a statistical significant difference of soil type, depth and the interaction between the two. Soil resistance (M ±SE: 2880 ± 1.67 Ω) measured in topsoil was high (P < 0.05) in HCL soil type compared to other soil types. Moreover, for the sub-soil, the highest (P < 0.05) resistance (3640 ± 1.67 Ω) was recorded in ESCL soil type.
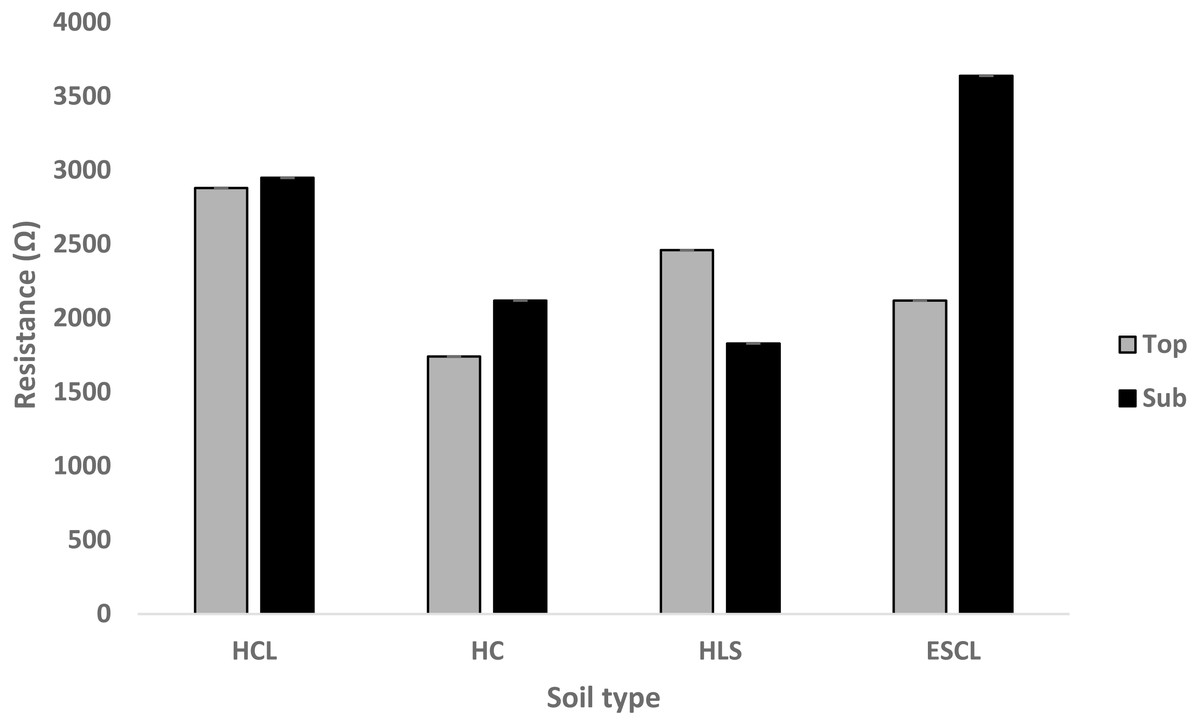
Figure 4: Mean values for resistance (Ω) of four different soil types in the Bela-Bela Municipality (n = 3).
(HCL, Hutton clay-loam; HC, Hutton-clay; HLS, Hutton sandy-loam; ESCL, Ecca sandy clay-loam).
Discussion
Soil pH, nitrate-nitrogen, ammonium nitrogen and organic carbon
Grazing alters both physical and chemical properties of the soil by removing biomass and trampling it (Wang & Wesche, 2016a; Wang & Wesche, 2016b). Moreover, pH under uncontrolled or heavy grazing tends to rise (Steffens et al., 2008; Wang & Wesche, 2016a; Wang & Wesche, 2016b). The acidity and alkalinity of a soil solution are measured by its pH, which is altered by both acid and base-forming ions in the soil (McCauley, Jones & Jacobsen, 2009). Furthermore, Minasny et al. (2016) and Neina (2019) highlighted that the pH of the soil does indeed have a huge impact on soil biological processes in the natural environment. As a result, soil pH is referred to as the “chief soil factor”, influencing a wide range of biological, chemical, and physical processes that affect plant development and vegetative growth. In the current study, the highest pH (7.14) was recorded in the HLS soil type. As per the explanation by Lauber et al. (2009) and Tripathi et al. (2012), pH around neutral to alkaline indicates richness in the bacterial community in the soil as they thrive well in these pH ranges. Furthermore, the observed highest pH reading (7.14) is within the range reported by Tripathi et al. (2012) who studied forest and open-land sites. pH either positively or negatively affects plant growth, Macdonald et al. (2014) noted that plant growth is limited in acidic soils. The low productivity of such soil points out the need of finding a better way to alleviate such constraints in plant production under acidic soils. Studies by Raiesi & Riahi (2014) and Ebrahimi, Khosravi & Rigi (2016) conducted on natural over grazed rangelands revealed that the presence of livestock increased soil pH essentially by the hydrolysis of urine urea in the grazing area, hence the current study pH result can also be attributed to the continuous grazing practiced in these farms.
Acidic soils also limit plants from accessing very important nutrients for development such as Mg, N, P, Mn and S (Macdonald et al., 2014), instead, these soils promote the availability of potentially toxic (Al and Bo) nutrients when in excess (Zhao, Chen & Shen, 2014). Land degradation is a worldwide problem for rangeland ecologists, and it is caused by factors such as long-term drought and erosion, but overgrazing is deemed the principal contributing factor to rangeland degradation. Studies by Li et al. (2014) and Raiesi & Riahi (2014) revealed that degraded lands have high pH values, as shown by a shift in pH values from a pre-degradation state (8.7) to a post-degradation state (9.42). Both acidity and alkalinity can promote toxicity, high pH increases osmotic stress and ion toxicity (Shi & Wang, 2005).
Nitrogen is an essential nutrient that is found in the largest proportion of plants and can sometimes hinder plant development and yield. Nitrogen is found quite often in soils as a portion of organic matter (Miller & Sonon, 2014). Abril & Bucher (1999), noted that soil compaction, reduced water retention, increased salinity, and the loss of certain soil nutrients, especially nitrogen, are all consequences of overgrazing. Even though the highest nitrate-nitrogen in the present study was recorded in the HC soil type, but still, fell below 10 mg/kg (Waller & Kookana, 2009), the recommended minimum level for plant growth. In a study by Šimek & Cooper (2002), it was revealed that denitrification was quick in soils with a pH greater than 5.8 than those with a pH range of 3.6 to 4.1. Indeed, the low amount of nitrate-nitrogen than the standard recommendation for plant growth might be attributed to denitrification taking place in these soils.
Chartier, Rostagno & Pazos (2011) reported that low content of nitrogen, nitrate and ammonium are characteristics of degraded rangelands due to prolonged overgrazing. Furthurmore, Bisigato, Laphitz & Carrera (2008) and Schiettecatte et al. (2008) also alluded that soil nitrogen is vastly correlated to carbon. Visual observation and farmers’ responses during data collection confirms that these farms have been heavily grazed in the past 10 years. Contrary to what was expected and obtained in the current study, Northup, Starks & Turner (2019a, 2019b) who studied the USDA-ARS grazing lands at Oklahoma reported that nitrogen increased with continuous and high stocking rates, especially near watering points and some corners of occupied paddocks. Ammonium (NH4+) fixation and release can also have a significant impact on the availability of nitrogen (Steffens & Sparks, 1999; Juang et al., 2001) because it instigates the available nitrogen (N) for uptake by the plants after defixation has taken place. In the current study, the concentration of ammonium-nitrogen was observed to be less in topsoil than in subsoil, these can be attributed to the high demand of N by plants when recovering in response to defoliation, hence ammonium fixation takes place to make N available to plant. As Liu et al. (2008) alluded that an increase in the fixation of NH4+ does help build up the accessible amount of N in the soil, allowing plants to recover rapidly and halting the loss of nitrogen to the environment.
Livestock has a vital role to play in soil properties through trampling that increase the bulkiness (Rapti et al., 2016). Moreover, Noellemeyer, Quiroga & Estelrich (2006) highlighted that heavy grazing, on the other hand, can lead to rangeland degradation which will drastically decrease the herbaceous vegetation and further instigate soil erosion. Soil is indeed the biggest terrestrial carbon and nitrogen storehouse, soil can store three times much more carbon and nitrogen than the atmosphere (Stuart Chapin III et al., 2009), primarily in the form of decayed plant litter and residues (Lal, 2004; Yusuf, Treydte & Sauerborn, 2015). Several researchers have highlighted that even grazing does influence the available organic carbon in the soil (Reeder & Schuman, 2002; Shrestha & Stahl, 2008; Yusuf, Treydte & Sauerborn, 2015).
Grazing by livestock does affect soil organic carbon, overgrazing is considered to reduce soil carbon and nitrogen by the removal of the aboveground herbaceous vegetation cover directly from the soil, reducing potential carbon dioxide fixation in photosynthetic plants tissues. Furthermore, carbon dioxide belowground will be reduced through the shortfalls of root development and higher root litter turnover (Reeder et al., 2004; Semmartin, Di Bella & De Salamone, 2010).
Soil organic carbon (SOC) (0.41–1.21) in this study is lower than the reported range (1.43–2.1%) by Yusuf, Treydte & Sauerborn (2015), Abule, Smit & Snyman (2005), and Belay & Kebede (2010) who all conducted studies in semi-arid rangelands. Wang et al. (2018) reported higher (6.92%) SOC than the present study, and it was noted that the variation amongst SOC was caused by particle size distribution, altitude and rainfall as the main contributors in semi-arid rangelands. Subsequently, Somenahally et al. (2020), also reported 1.6% and 25.1% of soil organic carbon for both top and subsoil respectively under high grazing pressure, these results are higher than those obtained in the current study. The variation in the reported organic carbon could be explained by the different woody species encroaching and grazing management employed by these farms. Another key restriction on the decomposition rate is the quality of carbon sources, which are generally determined by their lignin content (Jobbágy & Jackson, 2000). Woody species are said to have high lignin content than grasses, due to (their woody plants) being slowly decomposable can increase the storage of SOC. Woody species might contribute more to the SOC content, but also dead grass biomass does increase SOC (Dinakaran, Mehta & Krishnayya, 2011). Indeed, the current results agree on the relationship between HC soil type biomass and the SOC content found in the same soil type. Moreover, good basal cover and high biomass of the rangeland will promote more storage of SOC (Shiferaw, Yimer & Tuffa, 2019).
Macro and micro minerals
The presence of macronutrients, as well as the amount in which they are available, plays a huge role in plant development, plant vigor and yield (Northup, Starks & Turner, 2019a and Northup, Starks & Turner, 2019b). According to Baron et al. (2001), generally, every grazing management strategy employed will have an impact on the nutrient cycle and the net nutrient reservoirs throughout the soil. In the current study, there was a significant difference observed amongst macronutrients across all soil types. Chlorine was significantly higher in both top and subsoil in ESCL and HCL respectively. Hook & Burke (2000); Briske, Fuhlendorf & Smeins (2005); Northup, Starks & Turner (2019a) and Northup, Starks & Turner (2019b) stressed that the type of plant community, location within the landscape, and temperature all influence macronutrients abundance and distribution. These characteristics tend to produce varied distributions that cannot be traced back to grazing impacts (Oades, 1993; Northup, Starks & Turner, 2019a; Northup, Starks & Turner, 2019b). As noted by Neina (2019) plants can access some nutrients at different pH values, for instance, magnesium and calcium their highest value (top soil and sub soil) were recorded in both HC (pH 5.25) and HCL (pH 4.89) soil types. Moreover, Penn & Camberato (2019) noted that phosphorus (P) solubility normally occurs around the pH of 4.5 to 6.5. However, although the exact P solubility will vary in terms of soil type, geographical location, and climate, the range close to neutral is the most sound, as it is regarded as the best pH range for optimum plant growth. This is comparable to the assertion by McCauley, Jones & Jacobsen (2009), that these macronutrients are most accessible to plants at pH range of 6 to 8. The good basal cover in the HC soil type might be due to the nutrients being available to the plants accompanied by good grazing management employed in this soil type. However, inconsistencies of soil nutrients in these soil types might be caused by uncontrolled or heavy grazing practiced in these farms. Large quantities of mineralization increased nutrient uptake by stressed plants (Crovo et al., 2021; Abdalla et al., 2018), and this can play part in lowering the available macro nutrients in the soil. Moreover, Ragimov et al. (2020) also alluded that high grazing intensity does decline in the net productivity of the rangeland, resulting in the defeat of palatable species and soil chemical properties. Contrary to the aforementioned, Rutherford & Powrie (2010) and Al-Rowaily, El-Bana & Al-Dujain (2012) found that short-term grazing improved the concentration of some of soil minerals such as SOC, N, K and P in a depth of 0–30 cm.
The current study recorded the lowest pH values in both HCL and ESCL soil types, meaning that these soils are acidic. Acidic soils (with pH <5.5), due to different contributing factors are known to hinder plant growth and the toxicity of aluminium (Al) is thought to be the principal limiting factor of plant growth in acidic soils (Kochian, Pineros & Hoekenga, 2005; Zhao, Chen & Shen, 2014). To counteract such a problem in plant production, in plants under Al stress, the availability of phosphorus (P) and ammonium has been noted to ameliorate Al toxicity and diminishes the release of organic acids from plant roots (Sun et al., 2008; Chen, Zhao & Shen, 2010; Zhao, Chen & Shen, 2014). This suggests that if both HCL and ESCL soil types were to accumulate more of both Al and P that would aid in increased toxicity and the betterment of the soil’s pH respectively.
Variation in phosphorus (P) concentration obtained from ESCL soil type might be explained by the time (summer) the soil samples were collected. During, the growing season plants when grazed continuously due to mismanagement, respond by up taking more minerals from the soil and the results from the current study revealed lower P concentration in the subsoil than that of topsoil. Complementary to the abovementioned, the same was observed with potassium, as it was more on the topsoil than in subsoil. The vegetation layer especially herbs (Fujita et al., 2010) might have taken much of the top soil P and K which lead to reduced concentration of these minerals in the top soil (Van der Salm et al., 2012). Moreover, environmental conditions such as runoff and erosion might have contributed to the leaching of these soil minerals (Andersson et al., 2013), and these can normally take place in overgrazed areas. Sulfur (S) is consistently being cycled amid inorganic and organic forms in soil and the release of SO4 from organic S forms is particularly of colossal significance to plants (Kertesz & Mirleau, 2004; Wilhelm, 2009). In the current study, sulfate ions were significantly high in both HC and HCL soil types. The high levels of sulfate ions in the two soil types might be attributed to sulphur that is deposited on the ground as urine and dung from livestock. As explained by Whitehead (2000); Northup, Starks & Turner (2019a) and Northup, Starks & Turner (2019b), livestock retains around 25% of the S in the forage they consume, with the rest eliminated from the body as dung and urine. Sulfur availability to plants can be achieved by making a couple of water points in the paddocks where livestock graze, as it has been reported that sulphur concentration tends to increase close to water points (Haynes & Williams, 1993). The proper accumulation of macro minerals in the soil will sure elevate biomass and vegetation cover when proper grazing management is deployed.
Micronutrients are commonly regarded as important plant nutrients that are taken by plants from the soil in fewer quantities and they play a vital role in plant growth, plant metabolism, and development (Tavakoli et al., 2014). Furthermore, with them being deficient, plants can be easily attacked by diseases (Monreal et al., 2016). Concerning micronutrients, there was a significant variation across soil types for both topsoil and subsoil. According to Shrivastav et al. (2020), the majority of micronutrients such as copper (Cu), zinc (Zn), and iron (Fe) are mostly available to plants within the pH range of five to seven. Any variation from the ideal range of this pH will slow and reduce nutrient availability, making them less accessible to plants. The current study results were lower when compared to those reported by Márquez-Madrid et al. (2017) who conducted a study in grassland sites of Zacatecas, this might be attributed to the low pH range of the above-mentioned one and also pH varies with location, soil texture and soil structure. (Goulding, 2016). Bradl (2004) and Neina (2019) alluded that at low pH micronutrients are normally soluble due to high desorption and low adsorption. Under certain assumptions, this can be construed as the reason behind the low content of micronutrients in the soil, plants might have been responding to grazing by livestock.
Manganese (Mn) is one of the trace elements that are required for plant growth. It is indeed partaking in some enzymatic reaction that helps in photosynthesis (Michopoulos et al., 2021). Concerning, manganese concentration in the current study, it was recorded to be high in topsoil than in subsoil in ESCL soil type. The low concentration of Mn in subsoil might be attributed to the uptake by plants (Michopoulos et al., 2021), as the low pH enhances the Mn uptake and the pH range of this soil type is suitable for Mn to be more available to plants. Furthuremore, Gandois & Probst (2012) (373 mg/kg) and Michopoulos et al. (2021) (95.4–148 mg/kg) both reported a high concentration of soil Mn when compared to the present study. The fair basal cover in ESCL soil type might have been influenced by the Mn uptake.
Soil particle size, acidity and resistance
According to Su et al. (2004a, 2004b) soil is classified in different ways and particle size distribution (PSD) is the most frequently used technique to estimate a lot of soil-related properties. PSD has a huge impact on how water, ion movements, heat and air movement are retained in the soil. Losses of soil minerals such as organic carbon and other minerals will cause a decline in the water holding capacity, altering soil structure as well as some biotic qualities which are all coupled by partial dissolution of small particle size fractions in rangeland soils (Su et al., 2004a; Su et al., 2004b; Bronick & Lal, 2005). Particle size distribution play a vital role in agricultural land productivity. In addition, Amakor et al. (2014) and Mandal et al. (2015) alluded that to manage land resources sustainably, accurate and exact salinity measures are essential and need to be accessed, particularly in terms of soil quality and rangeland productivity. Hutton and Ecca soil types contained clay and sandy-loam content in them (Mengistu, Mavimbela & Van Rensburg, 2019). It has been reported by Bennie & Hensley (2001) and Mengistu, Mavimbela & Van Rensburg (2019) that clay and silt fine particles in the sandy soils play a major role in the drainage and water holding capacity. Moreover, as displayed in Table 4, the most dominant PSD across all soil types was sand particles with clay particles coming in second. This suggests that these tiny sand particles can be easily removed by the wind in grazing lands that have large bare areas, slowly causing the rangelands to be degraded with time. However, according to Parwada & Van Tol (2017), clay material provides the necessary bonding between the various soil particles (sand, silt and clay), bringing about the production of more stable aggregates that are less prone to erosion. Species (both grasses and browse) are adapted to different habitats. The high presence of sand particles in HLS soil type allowed the dominance of grasses and woody species such as Cynodon dactylon, Digitaria eriantha; Grewia flava and Senegalia mellifera (Van Wyk, Van Wyk & Van Wyk, 2012; Van Oudtshoorn, 2020) as these species were noted to be present in the study area. While on the other hand clay particles in the HCL soil type permitted the growth of species such as Cymbopogon pospischilii, Aristida cogesta, Dichrotachys cinerea, and Grewia flava as mentioned by the same authors (Van Wyk, Van Wyk & Van Wyk, 2012; Van Oudtshoorn, 2020).
Land deterioration owing to soil acidity is one element of land degradation that limits rangeland productivity worldwide (Abate et al., 2017). In addition, soil acidity is caused by land degradation owing to overgrazing, deforestation, and continuous cultivation (Dejene, 2003; Taddese, 2001). The pH is a parameter used to measure soil acidity, in agreement with the current study pH readings in ESCL soil type recorded the most acidity in the soil. The current study results of acidity are low, and as highlighted by Abate et al. (2017), acid soils are predominant in high rainfall areas as compared to those with low rainfall. At this stage of understanding, one would not expect acid soils in these farms where the current study was done.
The electrical resistance of a saturated soil paste is a function of the soil salt concentration and is inversely proportional to salt concentration (US Salinity Laboratory, 1954). Ideally, the most commonly used method for determining salinity is to test electrical conductivity in saturated paste extracts. In the current study soils HCL, HC and ESCL their resistance in the subsoil is higher than in the topsoil meaning there is less salts in subsoil than topsoil. Whereas soil HLS resistance in the topsoil is higher than in the subsoil meaning there is less salts in the topsoil than in the subsoil. Continuous grazing does encourage salinization in soils (Chaneton & Lavado, 1996), which also promotes high temperatures and evaporation. In agreement with the with the current study results, Chaneton & Lavado (1996) and Sepehry et al. (2012) found that the top soil in continuously grazed camps had high salinity levels when compared to lightly grazed camps. With that being said, such soils in continuously grazed rangelands will retain a lot of salts (Van Rensburg et al., 2011) if there is not much rainfall to leach them out, thus decreasing the resistivity. The resistance obtained in the study is high, giving insight or suggesting that the soils in the current study have low salts concentration. Furthermore, the high levels of soluble salts will surely hinder the growth of salt sensitive plants leading to reduced plant yields in these soil types.
Conclusions
The objective of the study was to assess how grazing management affected the available soil mineral of these four different soil types found in the Bela-Bela municipality. Grazing management in these selected CPAs is critical for maintaining rangeland productivity and sustainability as grazing by livestock plays a vital role in the nutrient cycle in the soil. Hutton loamy-sand soil type had an intermediate pH that permits the availability of most macro and micronutrients. This suggests that this soil type would perform well given a good grazing management strategy is used making soil nutrients available to plants thus eventually increasing the basal cover and biomass production. All soil types had more concentration of soil nutrients on the topsoil than subsoil. Both macro- and micronutrients analysed from the soil type, nitrogen (N), chlorine (Cl), iron (Fe) and copper (Cu) were all found to be deficient to support plant growth, as they were below 6.4 g/kg (Hengl et al., 2021). Given the deficiency of nitrogen in the soils, farmers in these CPAs should prioritize more enclosures and keep some leguminous plants as they will aid in restoring N content. As far as acidity is concerned, all these soil types are not acidic, as this was expected because these soil types (CPA farms) are not situated in high rainfall areas. From the above results, emerging key findings boils back to the type of grazing management employed in these farms as it accounts for a wide range of things happening in the soil from basal cover to erosion which will lead to poor soil. In short, improved grazing management will surely positively affect the rangeland productivity, health, and sustainability.