
Stable nitrogen and carbon isotope compositions in plant-soil systems under different land-use types in a red soil region, Southeast China
- Published
- Accepted
- Received
- Academic Editor
- Douglas Burns
- Subject Areas
- Ecosystem Science, Soil Science, Forestry
- Keywords
- Soil organic nitrogen, δ15N composition, 15N enrichment factor, Land-use types, Red soil
- Copyright
- © 2022 Liu and Han
- Licence
- This is an open access article distributed under the terms of the Creative Commons Attribution License, which permits unrestricted use, distribution, reproduction and adaptation in any medium and for any purpose provided that it is properly attributed. For attribution, the original author(s), title, publication source (PeerJ) and either DOI or URL of the article must be cited.
- Cite this article
- 2022. Stable nitrogen and carbon isotope compositions in plant-soil systems under different land-use types in a red soil region, Southeast China. PeerJ 10:e13558 https://doi.org/10.7717/peerj.13558
Abstract
Background
Stable N isotope compositions in plant-soil systems have been widely used to indicate soil N transformation and translocation processes in ecosystems. However, soil N processes and nitrate () loss potential under different land-use types are short of systematic comparison in the red soil region of Southeast China.
Methods
In the present study, the stable N and C isotope compositions (δ15N and δ13C) of soil and leaf were analyzed to indicate soil N transformation processes, and the soil to plant 15N enrichment factor (EF) was used to compare soil loss potential under different land-use types, including an abandoned agricultural land, a natural pure forest without understory, and a natural pure forest with a simple understory.
Results
The foliar δ15N value (−0.8‰) in the abandoned agricultural land was greater than those of the forest lands (ranged from −2.2‰ to −10.8‰). In the abandoned agricultural land, δ15N values of soil organic nitrogen (SON) increased from 0.8‰ to 5.7‰ and δ13C values of soil organic carbon (SOC) decreased from −22.7‰ to −25.9‰ with increasing soil depth from 0–70 cm, mainly resulting from SON mineralization, soil organic matter (SOM) decomposition, and C4 plant input. In the soils below 70 cm depth, δ15N values of SON (mean 4.9‰) were likely affected by microbial assimilation of 15N-depleted . The variations in δ15N values of soil profiles under the two forests were similar, but the EF values were significant different between the pure forest with a simple understory (−10.0‰) and the forest without understory (−5.5‰).
Conclusions
These results suggest that soil to plant 15N enrichment factor have a great promise to compare soil loss potential among different ecosystems.
Introduction
Nitrogen (N) cycling is regarded as one of the most vital processes in terrestrial ecosystems, which is closely associated with vegetation growth and soil organic carbon (SOC) sequestration (Bae et al., 2015; Currie, Nadelhoffer & Aber, 2004; Galloway et al., 2008; Garten et al., 2007; Gogoi, Ahirwal & Sahoo, 2021; Kalinina et al., 2019; Li et al., 2017; Lin et al., 2019; Liu et al., 2017). However, since the Industrial Revolution, large exogenous N inputs, including the application of chemical N fertilizer and atmospheric N deposition, has caused N saturation in ecosystems in many tropical and subtropical regions (Galloway et al., 2008; Muhammed et al., 2018; Song et al., 2021). At present, many environmental problems, such as soil nitrate () loss and N2O emissions are of great concern, because of the resulting N pollution to aquatic ecosystems and atmospheric ecosystems (Dai et al., 2020; Choi et al., 2017). Thus, research focused on N processes and N loss potential have important implications for environmental management.
With the wide application of stable isotope technology in earth surface environments (Li et al., 2022; Zeng et al., 2022), the stable N isotope ratio (15N/14N, δ15N) has been also widely applied to evaluate soil N cycling patterns in various ecosystems (Kayler et al., 2011; Lim et al., 2015; Pardo et al., 2007). Soil δ15N composition can be affected by different N sources and a series of transformation processes, such as symbiotic N fixation with mycorrhiza (Hobbie & Ouimette, 2009; Taylor, Chazdon & Menge, 2019), atmospheric N deposition (Currie, Nadelhoffer & Aber, 2004; Liu, Yeh & Sheu, 2006), plant uptake and microbial assimilation (Fowler et al., 2013; Waser et al., 1998), soil organic nitrogen (SON) mineralization (Liu et al., 2017; Zhang et al., 2015), nitrification and denitrification (Robinson, 2001; Galloway et al., 2008), and ammonia (NH3) volatilization (Choi et al., 2017). In agricultural ecosystems, there are many challenges to evaluate soil N dynamics using δ15N composition because the application of N-fertilizer affects soil N pool composition and N transformation processes, as well as δ15N abundance (Baggs et al., 2003; Jia et al., 2018; Zhu, Deng & Shangguan, 2018). Crop N is mainly derived from synthetic fertilizer and manure with significantly differing δ15N abundance of 0.3 ± 0.2‰ and 7.8 ± 0.6‰, respectively (Choi et al., 2005). These N fertilizers indirectly affect soil δ15N composition by straw turnover (Baggs et al., 2003; Corre et al., 2007). Furthermore, a series of N transformation and translocation processes in soils can cause substantial δ15N fractionation (Robinson, 2001). For example, applying manure with a low C/N ratio enhances the SON mineralization rate, which produces 15N-depleted ammonium () and causes 15N enrichment in residual organic matter and microbes (Choi et al., 2017; Koopmans et al., 1997). Applying fertilizer accelerates nitrification and NH3 volatilization, which causes 15N enrichment in residual and produces 15N-depleted and NH3, respectively (Choi, Matushima & Ro, 2011). Applying fertilizer affects denitrification and increases -N leaching loss. Denitrification causes 15N enrichment in residual and produces 15N-depleted NOX and N2 (Choi et al., 2017). Although δ15N fractionation does not occur in the process of -N leaching, the effect on the whole soil δ15N composition is significant (Corre et al., 2007). Microbial assimilation preferentially absorbs rather than due to the higher energy requirement in utilizing as an N source, except when the supply of is insufficient (Choi, Matushima & Ro, 2011). Thus, the application of N fertilizer alters the original soil N cycling patterns, as well as the δ15N composition of different N pools (Choi et al., 2017). Theoretically, soil N transformation processes can be inferred when the δ15N composition and the flux of N sources are known, and vice versa (Lim et al., 2015). However, it is incorrect to assume a single soil δ15N abundance to indicate soil N sources or processes in agricultural ecosystems (Kayler et al., 2011; Koopmans et al., 1997). In the present study, we used the soil δ15N and δ13C composition combined with the C/N ratio to provide more effective information about soil N sources and processes in agricultural land.
In forest ecosystems, the natural 15N-abundance of plants and organic soil horizons have been widely used to compare N saturation status at different sites within a basin (Boeckx et al., 2005; Koopmans et al., 1997; Shan et al., 2019). In many tropical and subtropical N-saturated forests, the δ13C compositions of plants and soils are gradually elevated along a gradient of increasing nitrification and loss (Li et al., 2017; Osborne et al., 2017; Ross, Lawrence & Fredriksen, 2004; Soper et al., 2018). The continuous loss of 15N-depleted leads to 15N enrichment in soils, ultimately causing 15N-enriched foliage by plant uptake (Kahmen, Wanek & Buchmann, 2008). However, the δ13C values of plants or soils do not always show excellent corresponding relationships with net nitrification rate and the quantity of loss (Pardo et al., 2007). Soil δ13C composition is affected by multiple N processes and litter δ13C abundance, and plant δ13C composition is affected by species and rooting depth (Liu, Yeh & Sheu, 2006; Pardo et al., 2007; Ross, Lawrence & Fredriksen, 2004). Thus, the absolute values of foliar or soil 15N-abundance alone are, sometimes, not adequate to compare the N status saturation at different sites within a basin. The soil to plant 15N enrichment factor (EF) greatly optimizes these deficiencies, in which the δ15N value of the surface soil is used to calibrate foliar 15N enrichment at specific sites (Garten & Van Miegroet, 1994; Garten et al., 2007; Pardo et al., 2007). In the present study, we further optimize the EF method to facilitate comparison of soil N loss potential under different land-use types within a basin.
In Southeast China, red soils cover 11.8% of the country’s land surface but provide a food supply for 22.5% of the population (Lin et al., 2012). The red soil is a typical acid soil that does not readily hold nutrients under strong leaching (Zhang et al., 2013), including available inorganic N. Considering the demand for crop production and cross-ecosystem N pollution, soil N transformation processes and loss potential are important topics of study in the red soil region. Furthermore, high levels of atmospheric N deposition occur in the subtropical red soil region, resulting in N-saturated ecosystems (Lin et al., 2012; Zhou et al., 2010). However, differences in soil N transformation processes and loss potential under different land-use types have not been systematically compared in this area. In the present study, we attempt to (1) compare δ15N and δ13C compositions, and SOC/SON ratios in soil profiles and analyze soil N processes under different land-use types; and (2) compare soil to plant 15N EF values and evaluate soil loss potentials under different land-use types. This research can improve understanding of soil N use efficiency under land-use types, which has important implications for environmental management in the red soil region of Southeast China.

Figure 1: The distribution of land-use types in the Jiulongjiang River basin and the location of soil sampling sites.
AAL, abandoned agricultural land; PF, natural pure forest without understory; PFU, natural pure forest with a simple understory.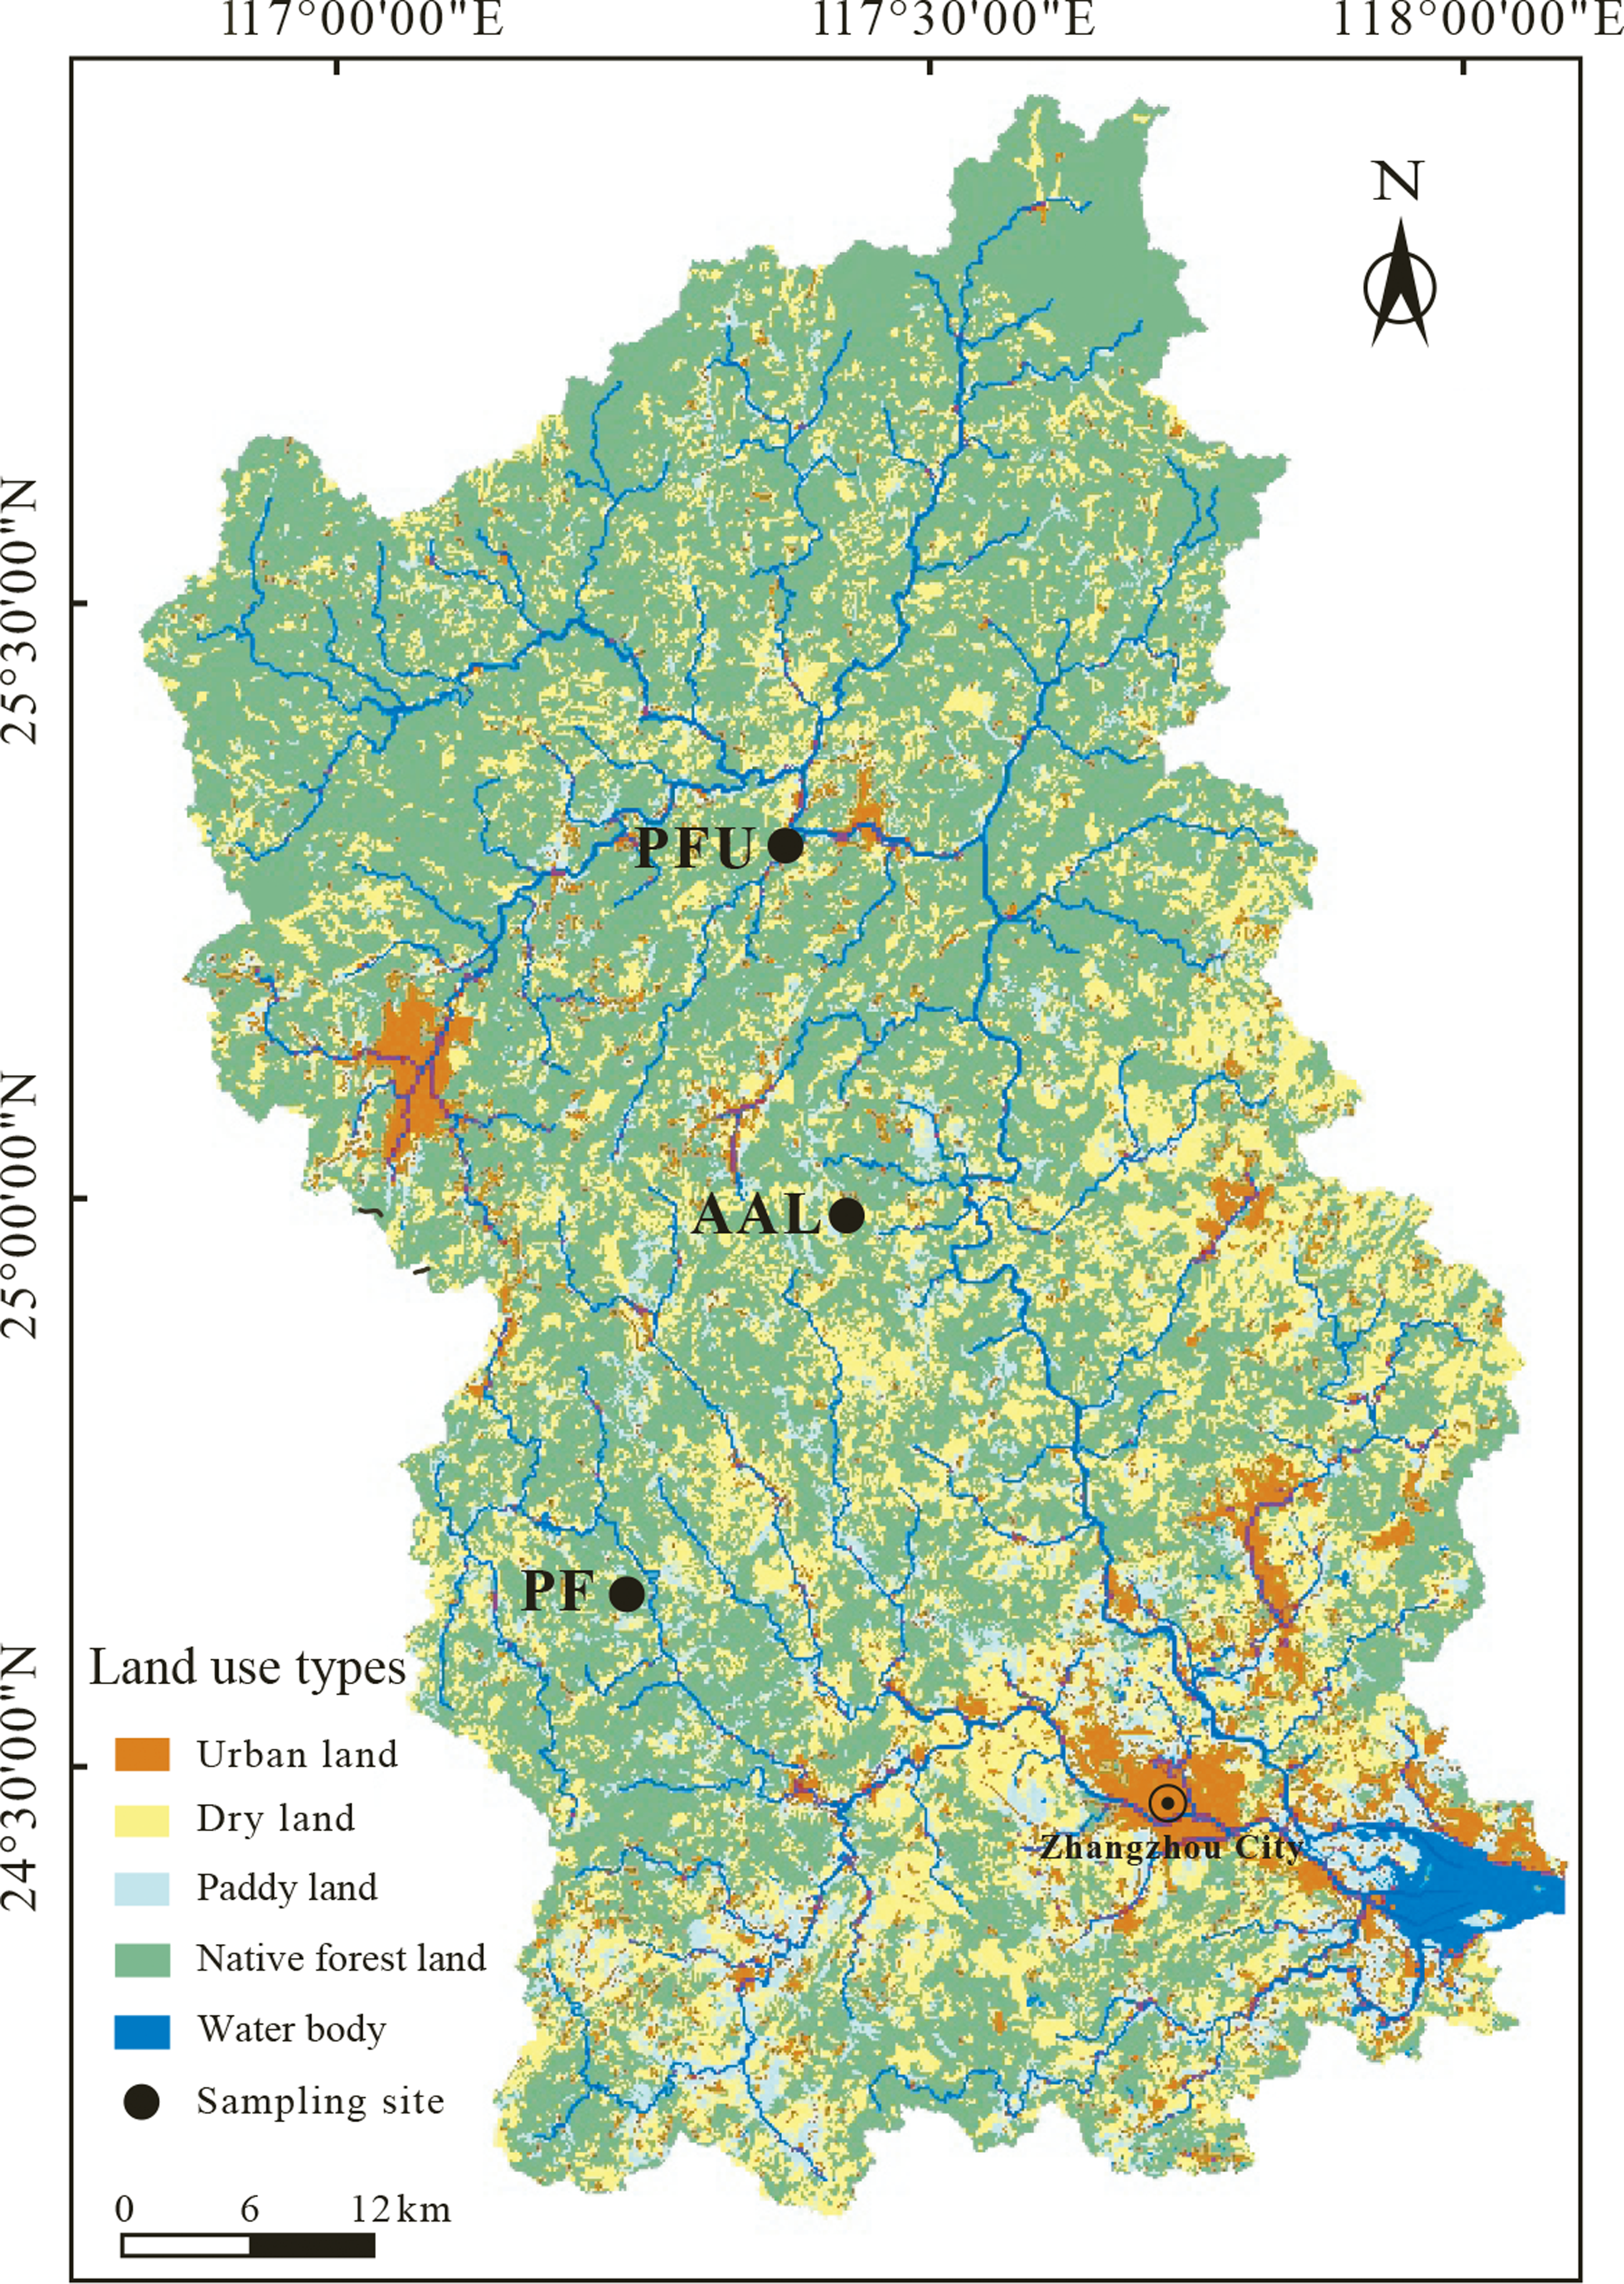
Materials and Methods
Study area
The study area is located in the Jiulongjiang River basin (24°18′–25°88′N, 116°78′–118°03′E, Fig. 1) of Fujian province, Southeast China. This basin has a drainage area of 14,741 km2. The average elevation is less than 200 m (above sea level). The terrain of the basin transits from mountain to plain along a north to south transect (Liu & Han, 2021). The basin experiences a subtropical oceanic monsoon climate, with annual precipitation of 1,400–1,800 mm and annual temperature of 19.9–21.1 °C. In this humid climate, the red soils, classified as Ultisols in the soil taxonomy of the United States Department of Agriculture (USDA) (Soil Survey Staff, 2014), are widely developed in the basin. The red soils are strongly acid with a range of soil pH from 2.8 to 5.1 (Table 1). Furthermore, the soils mainly consist of silt-sized particles with a range of 54% to 77% (v/v%), sand-sized particles account for 5–31%, and clay-sized particles account for 7–22% (Table 1). The soils are silt loams, according to the soil taxonomy of the USDA (Soil Survey Staff, 2014). Native forests account for over 60% of the basin area, and other lands are used for agriculture and residential area (Liu & Han, 2021).
| Sampling site | Longitude and latitude | Elevation | Slope aspect and slope gradient | Soil pH | Soil texture and different-sized particle proportion | Land-use type and vegetation structure |
|---|---|---|---|---|---|---|
| AAL | 117°30′9.49″E; 24°59′39.7″N | 128 m | South-facing slope; <5° | 3.8–4.7 (4.1 ± 0.3) | Silty loam Clay: 10–17% (13 ± 2%) Silt: 62–72% (68 ± 2%) Sand: 16–27% (19 ± 3%) | Abandoned agricultural land: the tea garden (Camellia sinensis, C3) has been abandoned for 6 years. Goose-grass (Eleusine indica, C4) sporadically grows on the ground now. Chemical N-fertilizer were applied during crop planting. |
| PF | 117°14′5.16″E; 24°39′6.33″N | 131 m | South-facing slope; <5° | 4.3–5.1 (4.7 ± 0.1) | Silty loam Clay: 10–22% (16 ± 3%) Silt: 54–77% (65 ± 5%) Sand: 5–31% (20 ± 6%) | Natural pure forest without understory: tall sandalwood (Dalbergia odorifera, C3) almost entirely occupied the canopy without understory plants. |
| PFU | 117°25′28.11″E; 25°16′21.08″N | 221 m | South-facing slope; <5° | 4.1–4.6 (4.3 ± 0.1) | Silty loam Clay: 7–14% (11 ± 1%) Silt: 59–69% (64 ± 2%) Sand: 19–31% (25 ± 3%) | Natural pure forest with a simple understory: pine (Pinus tabuliformis, C3) occupied the canopy and fern (Pteridium aquilinum, C3) occupied the understory. |
Notes:
Soil pH and the proportion of different-sized particles are expressed as Minimum–Maximum (Mean ± SD).
Sampling
According to the main land-use types in the basin (Fig. 1), the three sampling sites representing abandoned agricultural land (AAL), natural pure forest without understory (PF), and natural pure forest with a simple understory (PFU) were selected. The abandoned agricultural land at the AAL site underwent a conversion from tea garden (Camellia sinensis, C3 plant) to wasteland 6 years ago. During the tea planting period from 1985 to 2012, chemical N-fertilizer, including urea, ammonium sulfate, and ammonium bicarbonate, provided 45 kg N per year to support 100 kg tea production. Six years ago, the land was cleared of all tea trees. At present, the land is sporadically covered by goose-grass (Eleusine indica, C4 plant), and N-fertilizer is no longer applied. Average vegetation coverage of growing season at this site is approximately 45% and distribution of goose-grass roots focus on the depth of 0–10 cm. The pure forest at the PF site without understory consists of a single tree species, tall sandalwood (Dalbergia odorifera, C3 plant) trees occupy the canopy. Average vegetation coverage of growing season at this site is approximately 90% and 75% of underground biomass is in the layer of 0–30 cm. In contrast, the pure forest at the PFU site with a simple understory consists of two plant species, pines (Pinus tabuliformis, C3 plant) occupy the canopy, and ferns (Pteridium aquilinum, C3 plant) mainly occupy the understory (Table 1). Average vegetation coverage of growing season at this site is 100% and the roots of ferns and pines mainly distribute in the depth of 0–10 cm and 0–30 cm, respectively.
In January 2018, all sampling sites were selected at the section of building excavation and three parallel soil profiles were set up at each site. Considering the strong spatial heterogeneity of soil physicochemical properties in the horizontal and vertical direction, the average result of the parallel soil profiles easily causes incorrect information if the distance among the three parallel soil profiles is extremely distant. Thus, to fully consider both repeatability and representativeness of sampling sites, the distance between every two parallel soil profiles was set up in 50–100 m. A total of nine soil profiles with a thickness of 3 m were selected to collect soil samples. Soil samples were systematically collected from the bottom to the top of the profile at five cm-intervals. In each soil profile, three parallel samples with a horizontal distance of 1 meter were collected at each depth. To ensure representativeness of soil samples, three parallel samples were mixed to form a single sample.
Foliage samples were collected from the dominant vegetation near the soil profiles. The leaves of the dominant vegetation species were randomly collected without distinguishing between young and old leaves and mixed to form one sample. A total of three samples of goose-grass were collected at the AAL site, three samples of tall sandalwood were collected at the PF site, and three samples of pine and three samples of fern were collected at the PFU site.
Sample analysis
Foliage samples were immediately preserved in a box filled with carbon dioxide ice and treated in the laboratory as quickly as possible. The foliage samples were washed with purified water to remove surface dust then freeze-dried and ground into powder (<75 µm). Soil samples were air-dried after removing gravel and fresh roots, then passed through a two mm sifter. Soil pH (soil/water: 1/2.5) was determined using a pH meter (Leici, Shanghai, China) with a precision of ± 0.05. For obtaining free soil mineral particles, soil samples (<2 mm) were digested with 10% hydrogen peroxide (H2O2) to remove organic bonding agents and with 2 mol/L hydrochloric acid (HCl) to remove calcareous cement, respectively (Yu et al., 2020; Liu, Han & Li, 2021a). Soil particle distributions were determined by a laser particle size analyzer (Mastersizer 2000, Malvern, England), with a precision of ± 1%. The sizes of soil particles were classified as: clay particles (<0.002 mm), silt particles (0.002–0.05 mm), and sand particles (0.05–2 mm) by Soil Survey Staff (2014).
Soil samples (<2 mm) were ground by an agate mortar and then passed through a 200-mesh (75 µm) sifter. For removing carbonates, inorganic N (mainly including and ), and dissolved organic carbon and nitrogen (DOC and DON), soil samples (<75 µm) were soaked in 0.5 mol/L HCl for 24 h (Midwood & Boutton, 1998) and in 2 mol/L potassium chloride (KCl) for 24 h (Meng, Ding & Cai, 2005), respectively. The treated samples were washed with purified water until neutrality, then dried in an oven at 55 °C until constant weight and ground into powder. The mass of samples before and after treatment was recorded. The foliar N content and SON content were measured by a multi-element analyzer (Vario TOC Cube, Elementar, Germany) in the Surficial Environment and Hydrological Geochemistry Laboratory, China University of Geosciences (Beijing). Standard soil substances (OAS B2152) were repeatedly measured to monitor the reproducibility. The precision of N content was better than ± 0.02%. The actual SON contents in the original soil samples were obtained after calibration by multiplying the measured value by the ratio of the sample mass after treatment to that before treatment (Liu, Han & Zhang, 2020).
The stable N isotope ratio (15N/14N) of SON and stable C isotope ratio (13C/12C) of SOC in soil and leaf samples were determined utilizing an isotope mass spectrometer (Thermo, MAT-253, USA) in the Center Laboratory for Physical and Chemical Analysis, Institute of Geographic Sciences and Natural Resources Research, Chinese Academy of Sciences. The measurements are expressed in standard δ notation (‰) to indicate the differences between the stable isotope ratio of the samples and accepted standard materials (atmospheric N2 and Vienna Pee Dee Belemnite (VPDB)), where: (1) (2)
Standard substance (GBW04494, δ15NAir: −0.24‰ ± 0.13‰; δ13CV PDB: −45.6‰ ± 0.08‰) was used as reference material. The reproducibility was determined through replicate measurements of reference material, which was better than 0.1‰.
Two end-member mixing model
Vegetation in the abandoned agricultural land (AAL site) suffered a conversion from tea tree (C3 plant) to goose-grass (C4 plant). The δ15N and δ13C values of SOM in soils mainly depend on the mixed results of these stable isotope compositions of organic matter derived from tea tree and goose-grass when δ15N and δ13C fractionations during SON mineralization and SOC decomposition processes are negligible or unconsidered. The contributions of organic matter derived from tea tree and goose-grass to total SON or SOC are calculated by the two end-member mixing model (Boutton et al., 1998; Guo et al., 2020; Liu, Han & Li, 2021b), as follows: (3) (4) where δ15Ntea and δ13Ctea indicate the stable N and C isotope compositions of the end-member of tea tree source; δ15Ngrass and δ13Cgrass indicate the stable N and C isotope compositions of the end-member of goose-grass source. The f (%) is proportion of organic N or C derived from tea tree in total SON or SOC.
Soil to plant 15N enrichment factor calculation
Plant N is mainly derived from available N in soils by uptake, thus plant 15N natural abundance is generally affected by the soil δ15N composition (Liu, Yeh & Sheu, 2006; Ross, Lawrence & Fredriksen, 2004). The soil to plant 15N enrichment factor (EF) is proposed to calibrate foliar 15N enrichment at the soil site with specific δ15N composition, the formula is shown as follows (Garten et al., 2007; Pardo et al., 2007): (5) where δ15Nleaf is the δ15N composition of foliage samples of dominant species, δ15Nsoil is determined by the δ15N composition in soils. However, it is not always clear what soil depth should be considered at a specific site. The principal soil layer where the fine roots are distributed is believed to provide most of the available N for plant uptake. Thus, the appropriate soil depth should depend on the root distribution of the corresponding plant, rather than a conventional definition such as 0–20 (or 30) cm. In this study, for the goose-grass at the AAL site and fern at the PFU site, the depth of soil was 0–10 cm; while for the sandalwood at the PF and pine at the PFU site, the depth of soil was 0–30 cm, as shown in Table 2. Generally, foliage δ15N values are less than those of soil δ15N (Baggs et al., 2003; Corre et al., 2007), thus the EF is typically a negative value. In an N-saturated ecosystem, the EF is positively correlated with net nitrification and loss (Garten & Van Miegroet, 1994). Thus, the EF can be employed to compare N cycling patterns at different sites within a basin (Pardo et al., 2007). When the EF approaches 0, high soil N loss potential at a site is indicated.
Statistical analysis
Scatter plots of C/N ratios vs δ15N values and δ13C values vs δ15N values in the abandoned agricultural land at the AAL site were used to determine the distribution of soil samples relative to different end-members. Moreover, the relationships between them in the soils at the 0–80 cm depth were determined by the general linear model, and coefficients of R2 and P-value were exhibited. All statistical analyses were performed by SPSS 18.0 software (SPSS Inc., Chicago, IL, USA) and all figures were generated by SigmaPlot 12.5 software package (Systat Software GmbH, Erkrath, Germany) and Adobe Illustrator CS2 software (Adobe Systems Inc., San Jose, CA, USA).
Results
Distribution of SON contents and SOC/SON ratios in soil profiles
The SON contents in the three soil profiles at 0–60 cm depth intensively decreased with increasing soil depth, with a range from 0.88 g/kg to 0.44 g/kg at the AAL site, from 0.81 g/kg to 0.16 g/kg at the PF site, and from 0.91 g/kg to 0.25 g/kg at the PFU site (Fig. 2A). The SON contents in the three soil profiles below 60 cm depth slightly fluctuated, but they under the abandoned agricultural land (mean 0.45 g/kg) were 2–3 times greater than those under the forest land. Moreover, SON contents at the PFU site (mean 0.22 g/kg) were significantly greater than those at the PF site (mean 0.16 g/kg).

Figure 2: Distribution of SON content (A) and SOC/SON ratio (B) in soil profiles under different land-use types.
Error bar is determined by standard error. AAL, abandoned agricultural land; PF, natural pure forest without understory; PFU, natural pure forest with a simple understory.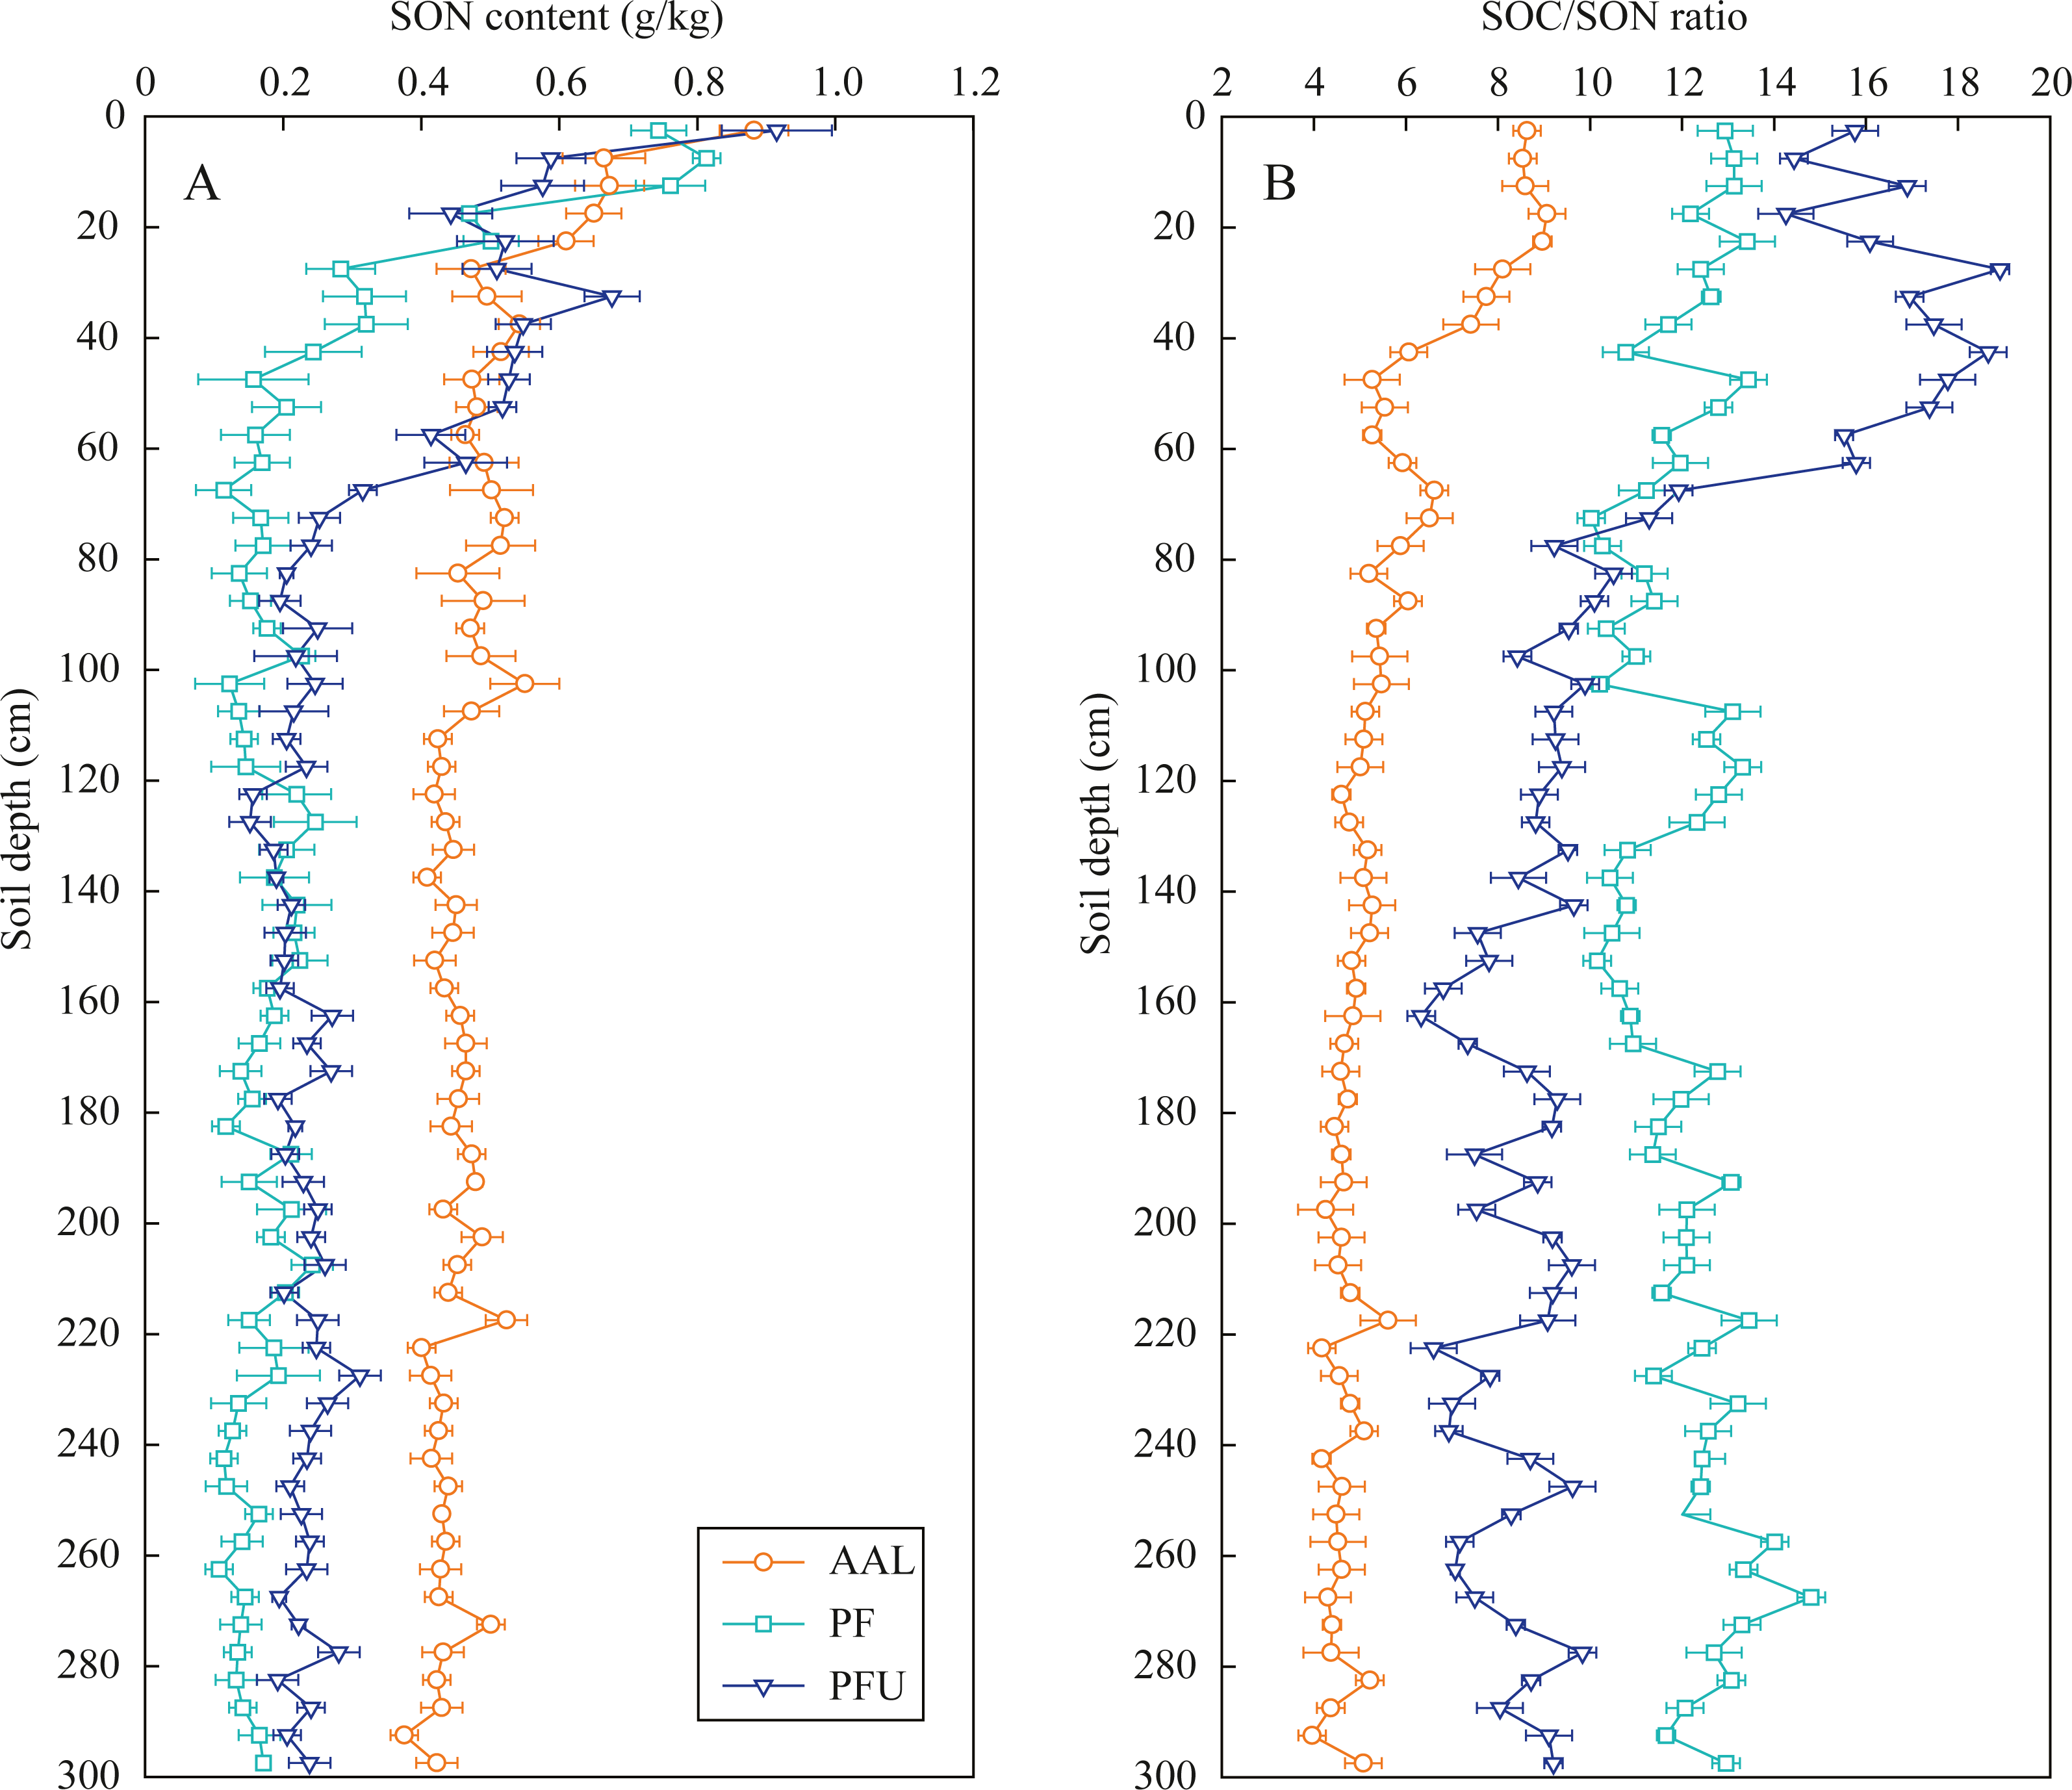
The SOC/SON ratios under the abandoned agricultural land slowly decreased from nine to four with increasing soil depth, and the ratios at all depths were the lowest among the three land-use types (Fig. 2B). In the forest lands, SOC/SON ratios at the PF site (10–13) were lower than those at the PFU site (10–16) in the 0–70 cm depth soils, while the ratios at the PF site (10–15) were higher than those at the PFU (6–10) site in the soils below the 70 cm.
Distribution of δ15N and δ13C values in soil profiles
In the abandoned agricultural land at the AAL site, the δ15N values of SON increased from 0.8‰ to 5.7‰ with increasing soil depth at the 0–70 cm depth and then slightly fluctuated near 4.9‰ below the 70 cm depth (Fig. 3A). In the forest land, the δ15N values in the soils at the 0–35 cm depth increased from 2.9‰ to 5.3‰ at the PF site and increased from −0.8‰ to 4.8‰ at the PFU site, with high variation in the soils below the 35 cm depth (mean 2.5‰ at the PF site and mean 2.8‰ at the PFU site).
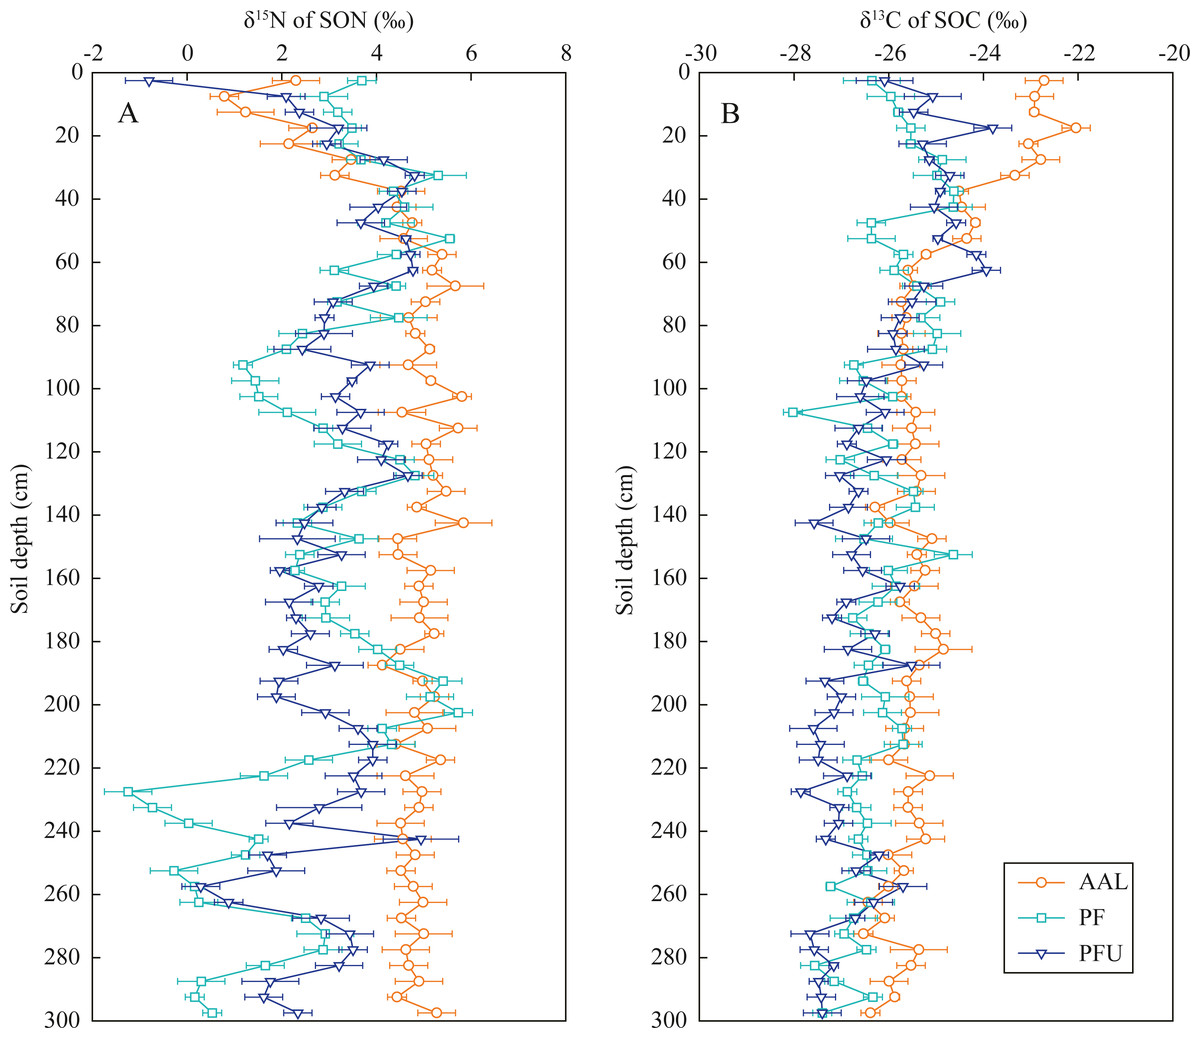
Figure 3: Distribution of δ15N values in SON (A) and δ13C values in SOC (B) in soil profiles under different land-use types.
Error bar is determined by standard error. AAL, abandoned agricultural land; PF, natural pure forest without understory; PFU, natural pure forest with a simple understory.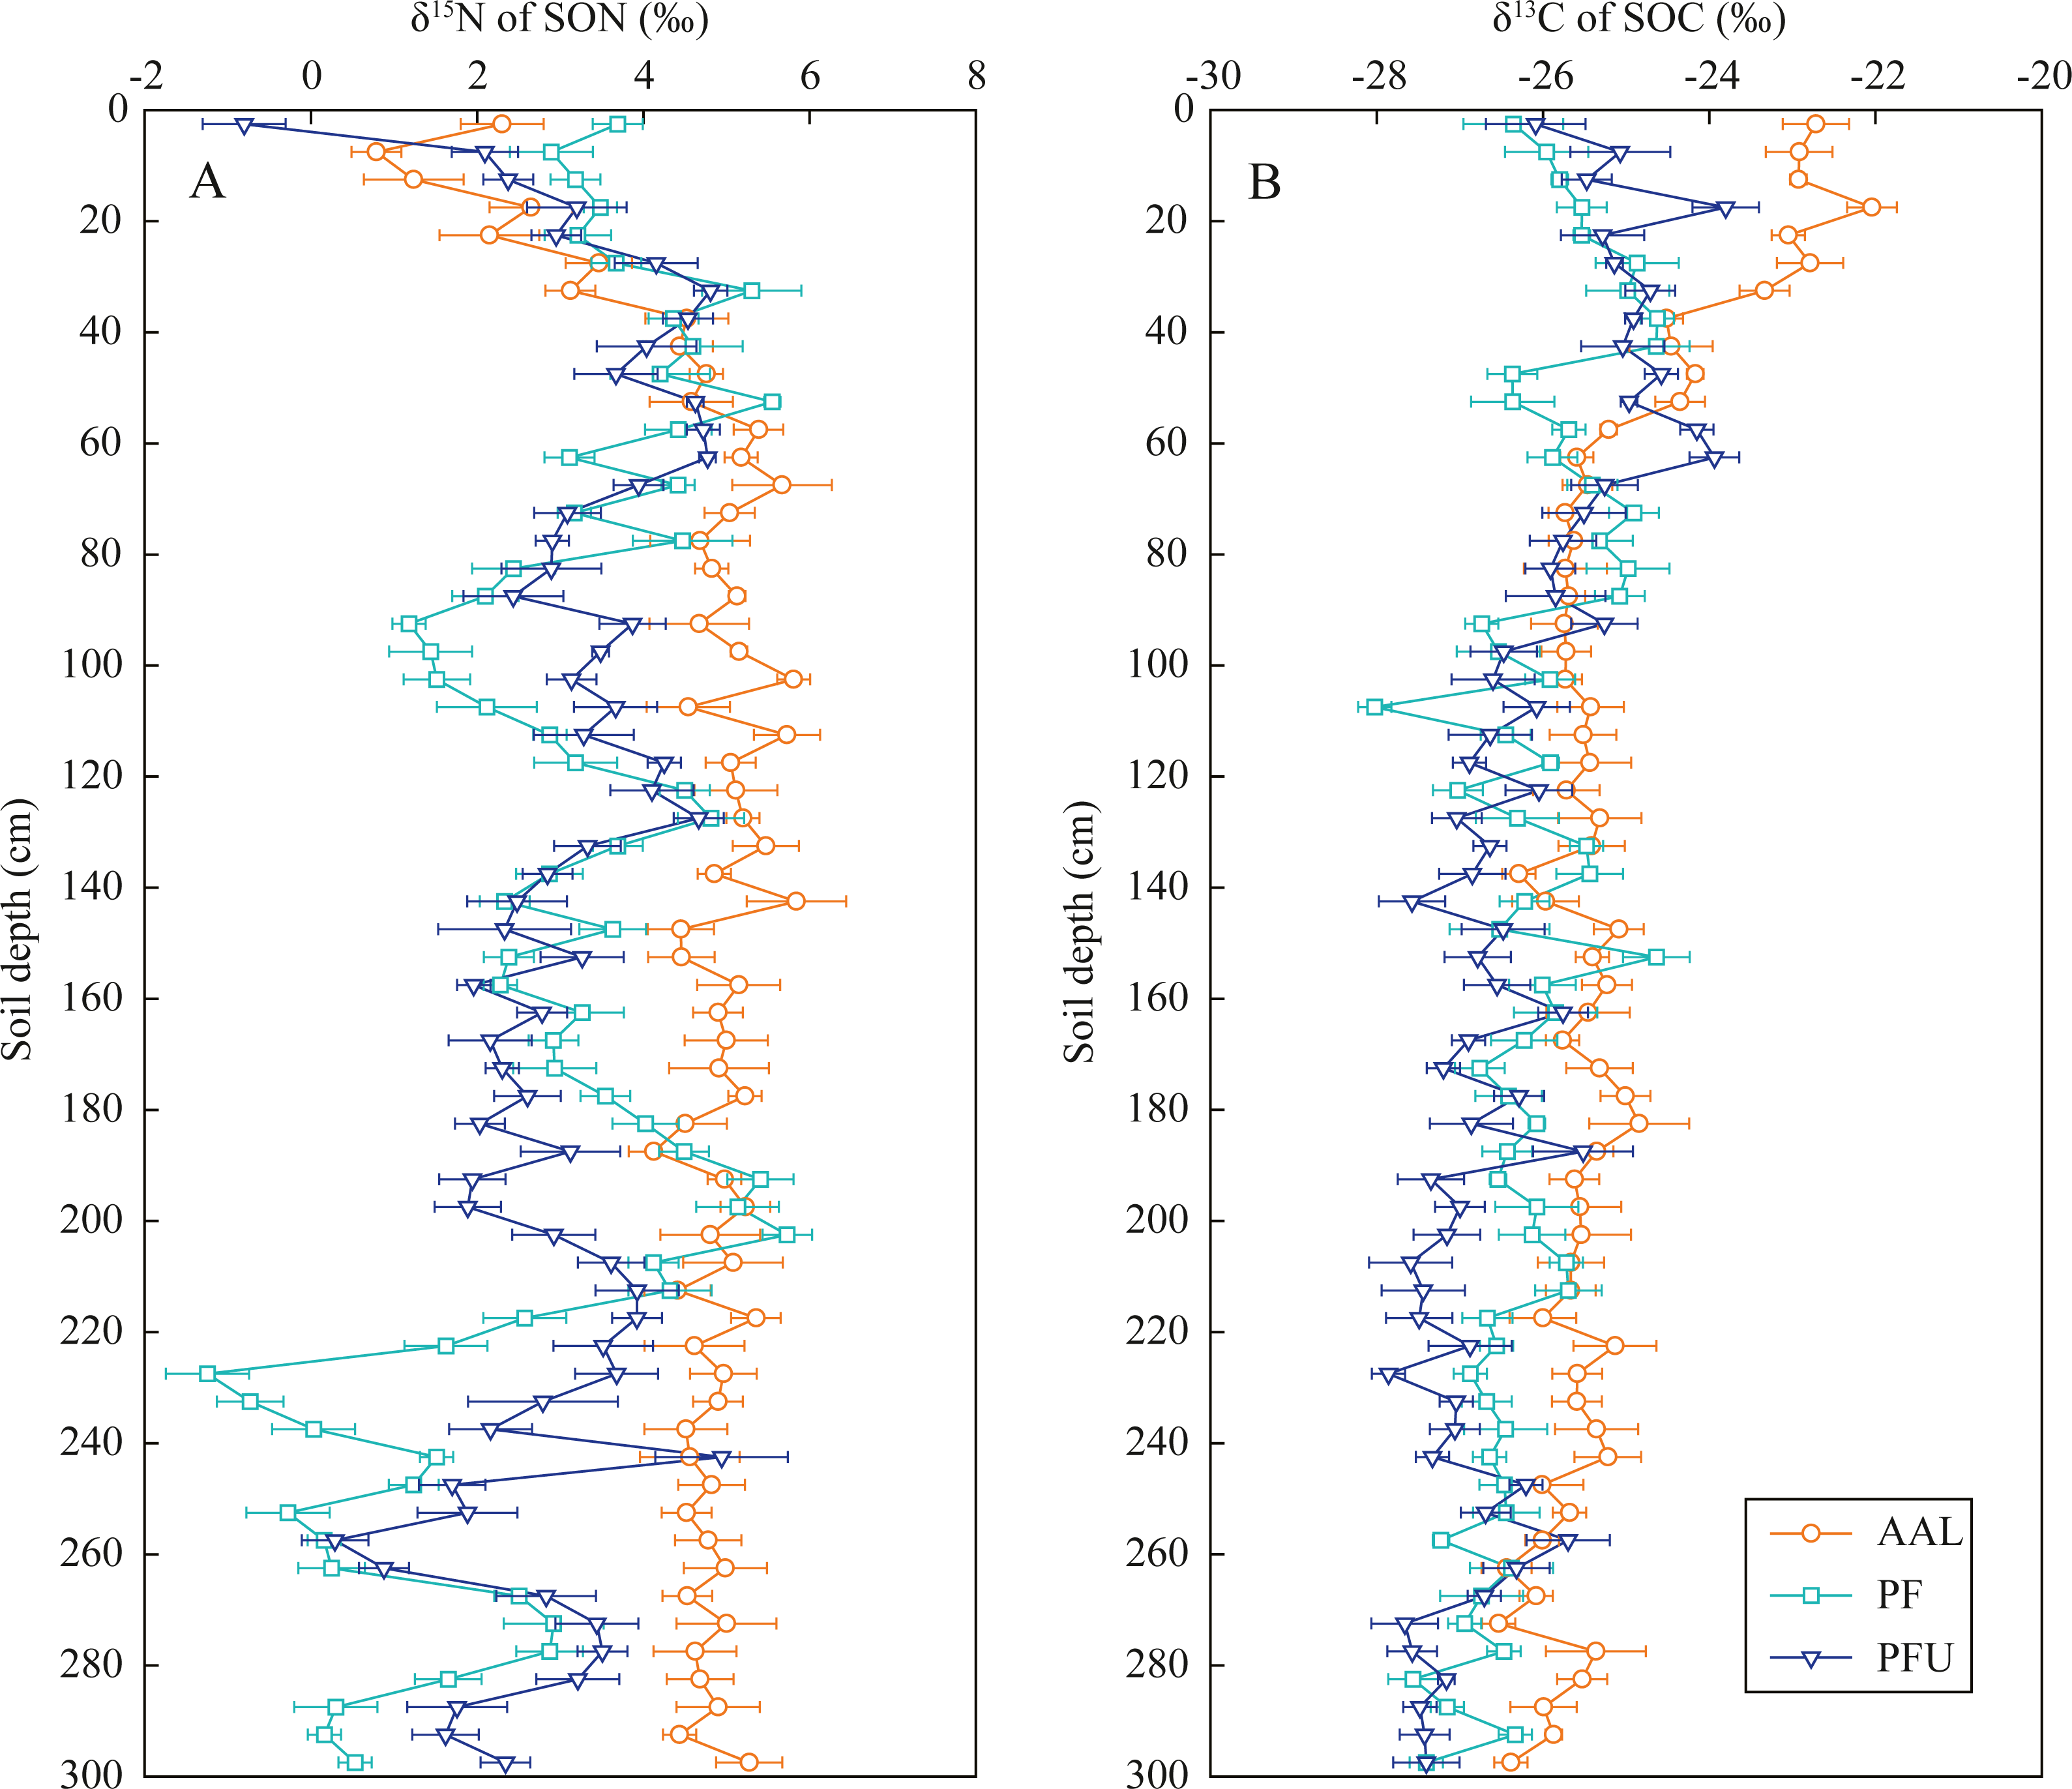
In the soils at the 0–35 cm depth, the δ13C values of SOC increased with increasing soil depth at the PF site (from −26.4‰ to −24.6‰) and PFU (from −26.1‰ to −24.7‰), but decreased with increasing soil depth at the AAL site (from −22.7‰ to −23.3‰) (Fig. 3B). However, the δ13C values in the soils below the 35 cm depth at all sites showed slightly decreasing trends (generally by 1–2‰) with increasing soil depth (mean −25.6‰ at the AAL site, mean −26.4‰ at the PF site, and mean −26.8‰ at the PFU site).
Soil to plant 15N EF under different land-use types
Soil to plant 15N EF was employed to compare N cycling patterns under different land-use types in the Jiulongjiang River basin (Table 2). The same EF value (−10.0‰) in the fern-soil and pine-soil systems at the PFU site provided confidence in applying the EF to pure forest with a simple understory. In tea plantation period, the input of chemical N-fertilizer significantly affects crop δ15N composition because it is the dominant source of crop N. Moreover, this effect can be further transmitted to the SON of surface soil through straw turnover and microbial assimilation. However, the available N absorbed by goose-grass (an annual herbage) in the abandoned agricultural land at the AAL site is mainly derived from SON mineralization and nitrification because N-fertilizer was not applied for 6 years. Thus, the EF is also applicable in the abandoned agricultural land in this study. We suggest that the EF can be employed to indicate N cycling in some special abandoned agricultural land, in which N-fertilizer is not applied or the application of N-fertilizer has been stopped for several years. The mean EF value at the PFU site (−10.0‰) was less than that at the PF site (−5.5‰), and much less than that at the AAL site (−3.1‰) (Table 2).
| Site | Dominant vegetation | Foliar δ15N (‰) | Foliar δ13C (‰) | Foliar N content (%) | Foliar C content (%) | Foliar C/N ratio | Soil δ15N (‰) | EF value (‰) |
|---|---|---|---|---|---|---|---|---|
| AAL | Goose-grass (C4) | −0.8 ± 0.3 | −14.2 ± 0.3 | 0.88 ± 0.21 | 52.1 ± 1.6 | 59.3 ± 1.2 | 2.3 ± 0.5 | −3.1 ± 0.4 |
| PF | Sandalwood (C3) | −2.2 ± 0.2 | −30.9 ± 0.5 | 1.46 ± 0.13 | 52.7 ± 1.2 | 36.0 ± 0.8 | 3.4 ± 0.3 | −5.5 ± 0.2 |
| PFU | Fern (C3) | −10.8 ± 0.5 | −28.8 ± 0.4 | 1.15 ± 0.09 | 53.3 ± 0.8 | 46.2 ± 1.3 | −0.8 ± 0.3 | −10.0 ± 0.4 |
| Pine (C3) | −7.3 ± 0.1 | −28.6 ± 0.2 | 1.53 ± 0.12 | 58.7 ± 0.5 | 38.3 ± 0.9 | 2.7 ± 0.4 | −10.0 ± 0.2 |
Notes:
The values are expressed as Mean ± SD; EF = δ15Nleaf − δ15Nsoil. Soil depth of goose-grass root is 0–10 cm (total samples, n = 6) at the AAL site; for, soil depth of main sandalwood root is 0–30 cm (total samples, n = 18) at the PF site; soil depths of fern root and main pine root are 0–10 cm (total samples, n = 6) and 0–30 cm (total samples, n = 18) at the PFU site.
- AAL
-
abandoned agricultural land
- PF
-
natural pure forest without understory
- PFU
-
natural pure forest with a simple understory
Discussion
Analyzation of soil N processes under different land-use types
Soil N dynamics in abandoned agricultural lands are extremely complex because the interrupted application of chemical N-fertilizers changes the soil N pool composition and transformation processes (Baggs et al., 2003; Pardo et al., 2007). Soil N transformation processes can be identified by analyzing soil δ15N composition and stoichiometric SOC/SON ratio if N sources are known, and vice versa (Guo et al., 2020; Lim et al., 2015). In the abandoned agricultural land at the AAL site, the covered plant underwent a conversion from tea tree (C3) to goose-grass (C4) (Table 1). The average δ13C value of SOM in the deep soils was −25.6‰ (Fig. 4B), indicating the source of the C3 plant (tea tree). While the 13C-enriched (δ13C: −23.2‰) SOM in the organic matter layer was mainly attributed to the mixing of old SOM from past tea tree and new SOM from present goose-grass (δ13C: −14.2‰). According to the estimated results by a two end-member mixing model (Boutton et al., 1998), 94% of SOC in the surface soils was derived from past tea tree, while only 6% of SOC was derived from present goose-grass. The δ15N value of SON (0.01‰) in the organic matter layer was close to the foliar δ15N value of goose-grasses (−0.8‰), likely resulting from the effects of the application of chemical N-fertilizer (mean δ15N value: 0‰, Choi et al., 2017) during the tea plantation period. Long-term N-fertilizer application led to the δ15N value of tea tree and surface soil close to 0‰. The SON mineralization and nitrification in the surface soil provide available N (slightly lower than 0‰), which also affects the δ15N composition of goose-grass at present.
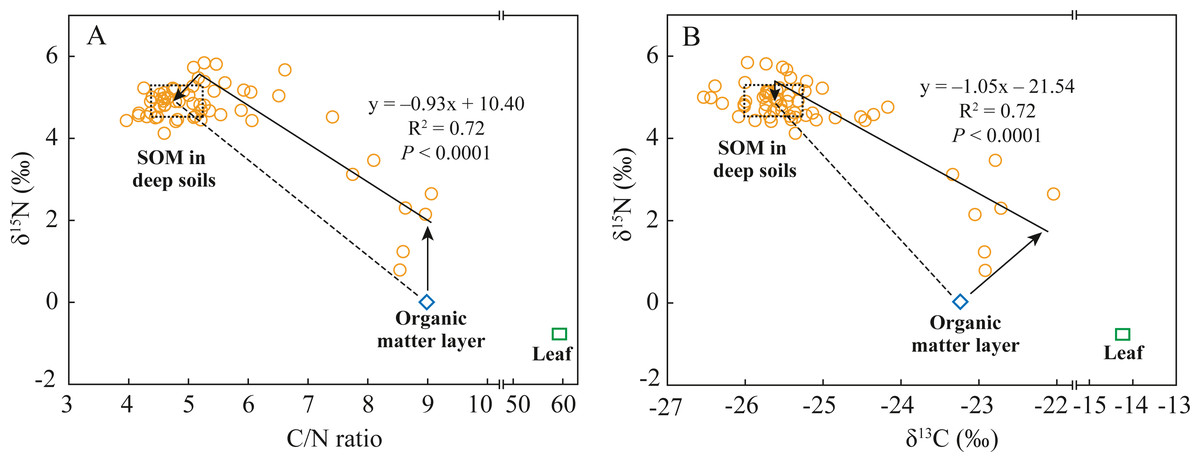
Figure 4: Relationships between C/N ratios and δ15N values (A) and between δ13C values and δ15N values (B) in soil and leaf under the abandoned agricultural land.
The C/N ratios, δ15N values, and δ13C values in soil are SOC/SON ratios, δ15N values of SON, and δ13C values of SOC, respectively. The dashed rectangular box indicates the end-member values of C/N ratios, δ15N values, and δ13C values in the deep soils, which are determine by the Mean ± SD of these values. Dashed lines indicate the theoretical distribution region of these points in two end-member mixing model. Solid lines indicate the practical relationships of δ15N values with C/N ratio and δ13C values in soil, which are determined by the general linear model.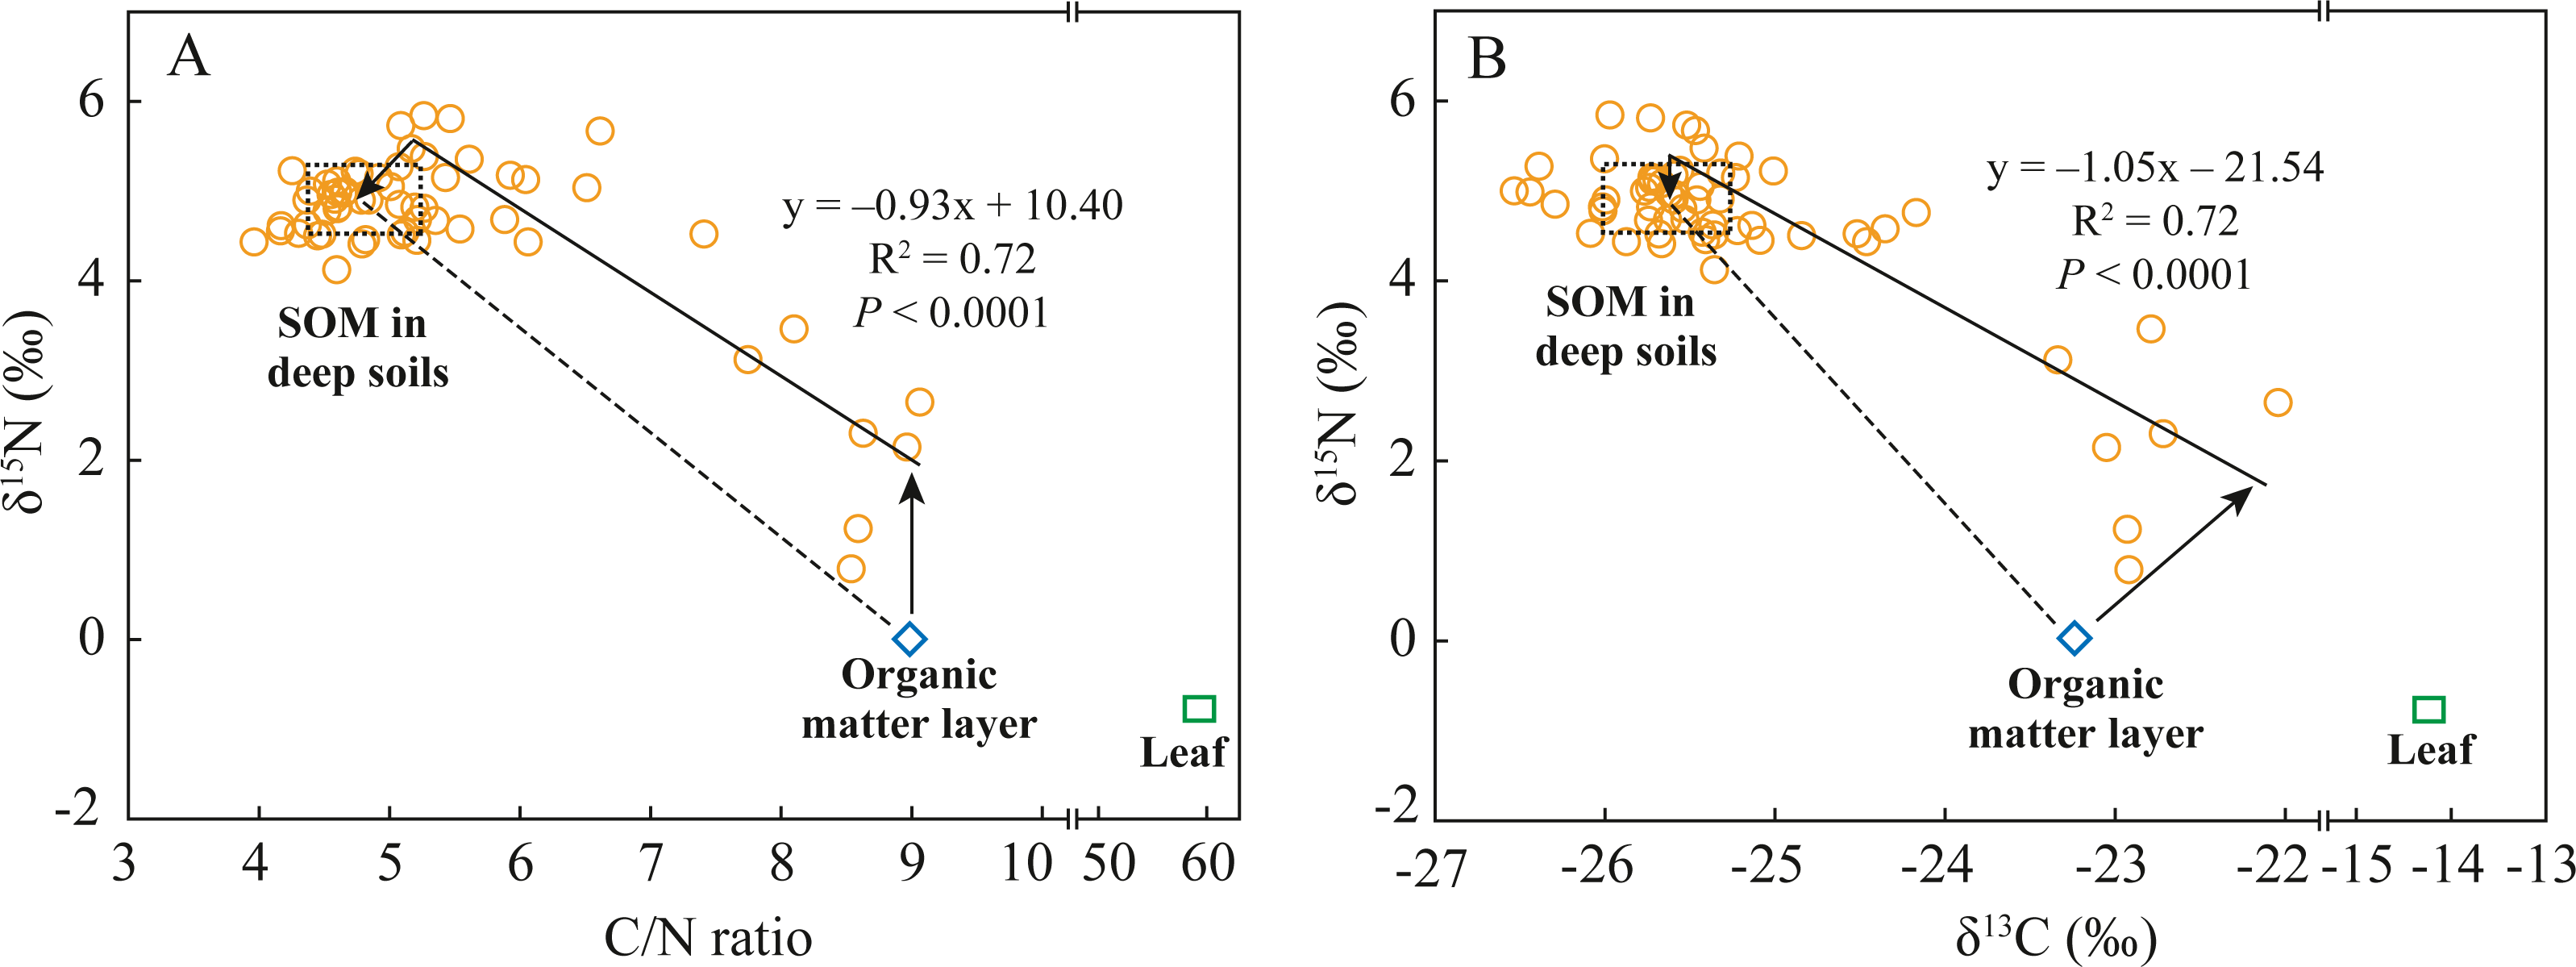
If the fractionation of δ13C and δ15N during SOM decomposition and soil N transformation processes were not considered, the distributions of δ15N values of SON, δ13C values of SOC, and SOC/SON ratios in the soils at the 0–80 cm depth conformed to the two end-member mixing model, as shown by the dashed lines in Fig. 4. The differences between the theoretical mixing line (dashed line) and the practical distribution line (solid line) could help to analyze soil N transformation processes in surface soils and deep soils. The δ15N value of SON and δ13C value of SOC in the organic matter layer were 2‰and 1.2‰ lower than those at the related end of the practical distribution line, respectively, while the SOC/SON ratios were almost the same (Fig. 4). In surface soils, organic matter decomposition generally causes a decrease in the SOC/SON ratio and causes 13C enrichment in SOC (Han et al., 2020). Goose-grass has a higher C/N ratio and δ13C value compared to the C3 plant (Table 2), thus δ13C value and SOC/SON ratio should increase with inputs of organic matter derived from C4 grasses. The difference in δ13C value is mainly attributed to SOM decomposition and C4 plant input. In surface soils, SON mineralization consumes organic N to increase SOC/SON ratio and causes 15N enrichment in organic residues (Choi et al., 2017; Koopmans et al., 1997). Thus, the difference in δ15N value is mainly attributed to SON mineralization. While no difference in SOC/SON ratios between them were likely a coincidental result of the combined influence of SOM decomposition, C4 plant input, and SON mineralization. The δ15N value of SON in the deep soils were 0.3‰ lower than those at the related end-member of the practical distribution line (Fig. 4). The difference in δ15N value of SON between them indicated that some N process cause 15N depletion of SON in deep soils. In the deep soils with an anoxic condition, denitrification and microbial assimilation of inorganic N are the two most common N processes (Baggs et al., 2003). However, microbial N (which is an important component of SON) is 15N-enriched during denitrification (Choi et al., 2017). Thus, it can be speculated that microbial assimilation of 15N-depleted inorganic N is likely the dominant N transformation process in deep soils.
Soil N processes in the forest ecosystems are less complex compared to those of the abandoned agricultural land. The δ15N values of SON and δ13C values of SOC in surface soils increased, while SOC/SON ratios decreased with increasing soil depth, these are closely associated with SON mineralization and SOM decomposition processes (Choi et al., 2017; Koopmans et al., 1997). The δ15N values of SON in the 0–20 cm layer at the PFU site were greater than those at the PF site (Fig. 3A), which is mainly affected by the δ15N composition of the above vegetation (Table 2). While the δ15N values were almost the same in the 20–80 cm layer at the two sites, indicating the same SON mineralization rate under pure forest.
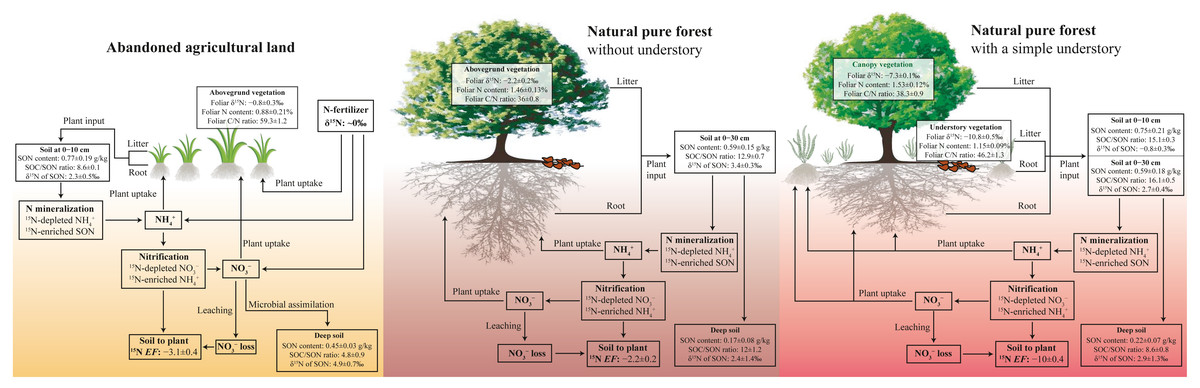
Figure 5: Conceptual figure of N processes in soil-plant system under different land-use types.
The EF is soil to plant 15N enrichment factor, EF = δ15Nleaf − δ15Nsoil.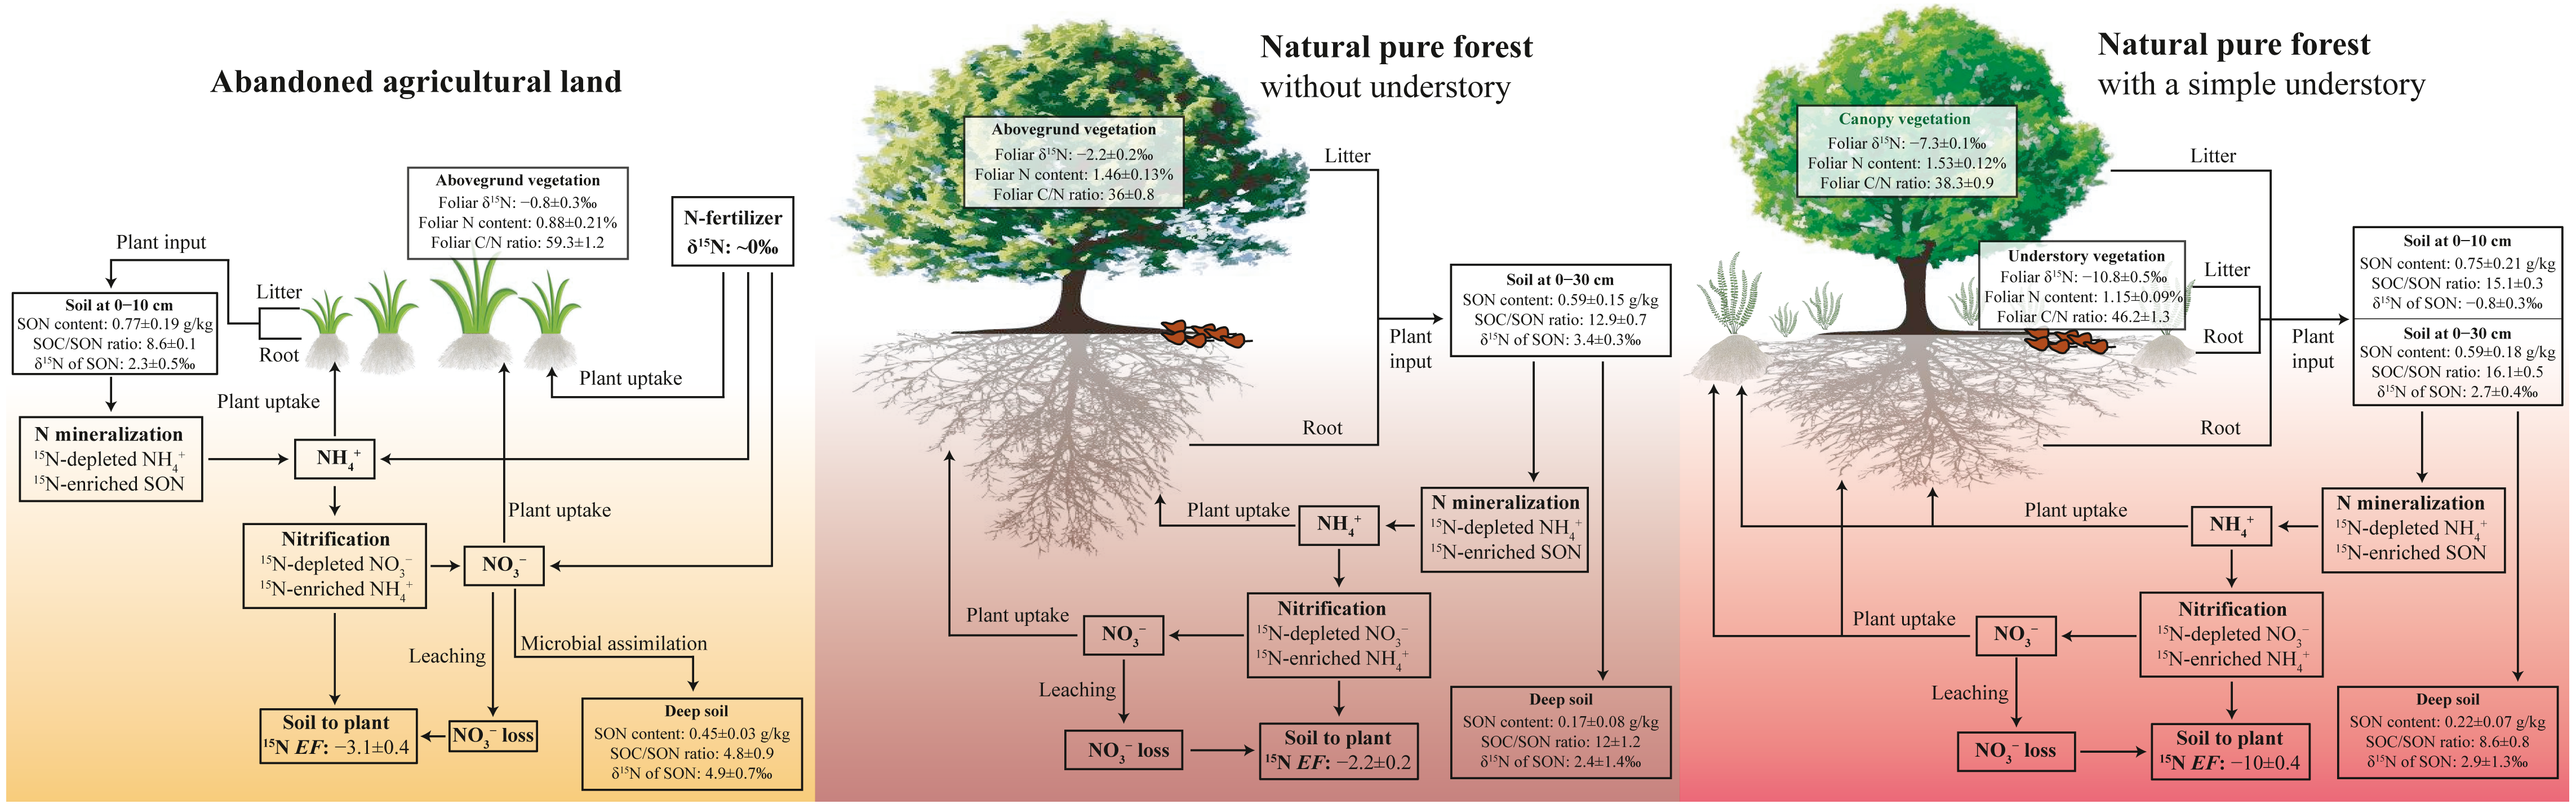
Evaluation of soil N loss potential under different land-use types
In the pure forest with a simple understory at the PFU site, foliar δ15N of fern (−10.8‰) is less than that of pine (−7.3‰) (Table 2), likely associated with plant species and the depth of root distribution (Pardo et al., 2007). Foliar δ15N composition can differ between among plant species due to preferential absorption of or because is 15N-enriched compared to during nitrification (Choi et al., 2017; Currie, Nadelhoffer & Aber, 2004; Koopmans et al., 1997). Soil δ15N of SON increases with increasing soil depth, accordingly, available N produced from SON mineralization is also more positive with increasing soil depth (Han et al., 2020; Liu, Han & Li, 2021b). The influence of plant species and root depth on foliar δ15N will restrict the comparison of the N cycling patterns at different sites within a basin (Corre et al., 2007; Koopmans et al., 1997). However, our study proves that the soil to plant 15N EF is a more useful tool instead of foliar and soil δ15N in various and complex ecosystems. The EF value at the PFU site (−10.0‰) was less than that at the PF site (−5.5‰) (Table 2), indicating a lower loss potential in the pure forest land with a simple understory. Compared to the forest land without understory at the PF site, the additional ferns in the understory at the PFU site enhance the production of leaf litter, root exudates and residues, as well as plant uptake of available N (Fig. 5). The same soil net nitrogen mineralization rate indicates the same production rate of in soils under the two pure forests. However, more (and ) is absorbed by plants in the forest land with a simple understory, which results in less remaining in soils. The low content restricts nitrification to produce , which means less loss. The EF value under abandoned agricultural land (−3.1‰) was greater than that under the two pure forests (Table 2), indicating a higher loss potential in abandoned agricultural land. Compared to the forest lands, in abandoned agricultural land is not sufficiently absorbed by the plant due to the lower root density. The high content promotes production by nitrification, which increases the risk of loss. Although soil to plant 15N EF can roughly indicates soil loss potential in different ecosystems, quantitative measurement of soil loss rate is needed to confirm EF result in future work.
Conclusions
Soil N processes were analyzed and loss potential was estimated under different land-use types in the Jiulongjiang River basin. In the abandoned agricultural land, the δ15N values of leaf and SON record the signal from chemical N-fertilizer, even though fertilization has ceased for several years. The δ15N values of SON in the surface soils were mainly controlled by SON mineralization under all land-use types. The soil to plant EF value in the pure forest with a simple understory is greater than that in the pure forest without understory, indicating a lower loss potential. In the pure forest with a simple understory, plant species and the depth of root distribution affected foliar δ15N values of understory plants and canopy plants, but the EF value was not affected. The greatest EF value in the abandoned agricultural land indicated the highest loss potential compared to the two pure forests. These results suggest that soil to plant 15N EF have a great promise to indicate soil N loss potential in various ecosystems. But actual measurement of soil loss rate under different land-use types within a basin is needed to confirm EF result in future work.