
Communities of T4-like bacteriophages associated with bacteria in Lake Baikal: diversity and biogeography
- Published
- Accepted
- Received
- Academic Editor
- Mya Breitbart
- Subject Areas
- Biogeography, Ecology, Molecular Biology, Virology, Freshwater Biology
- Keywords
- G23, Bacteriophage, Lake Baikal, Freshwater, Viral ecology, Diversity, Biogeography
- Copyright
- © 2022 Potapov et al.
- Licence
- This is an open access article distributed under the terms of the Creative Commons Attribution License, which permits unrestricted use, distribution, reproduction and adaptation in any medium and for any purpose provided that it is properly attributed. For attribution, the original author(s), title, publication source (PeerJ) and either DOI or URL of the article must be cited.
- Cite this article
- 2022. Communities of T4-like bacteriophages associated with bacteria in Lake Baikal: diversity and biogeography. PeerJ 10:e12748 https://doi.org/10.7717/peerj.12748
Abstract
Lake Baikal phage communities are important for lake ecosystem functioning. Here we describe the diversity of T4-bacteriophage associated with the bacterial fraction of filtered water samples collected from the pelagic zone, coastal zone and shallow bays. Although the study of the diversity of phages for the g23 gene has been carried out at Lake Baikal for more than ten years, shallow bays that comprise a significant part of the lake’s area have been neglected, and this gene has not previously been studied in the bacterial fraction. Phage communities were probed using amplicon sequencing methods targeting the gene of major capsid protein (g23) and compared phylogenetically across sample locations and with sequences previously retrieved from non-bacterial fractions (<0.2 um) and biofilms (non-fractionated). In this study, we examined six water samples, in which 24 to 74 viral OTUs were obtained. The sequences from shallow bays largely differed from those in the pelagic and coastal samples and formed individual subcluster in the UPGMA tree that was obtained from the comparison of phylogenetic distances of g23 sequence sets from various ecosystems, reflecting differences in viral communities depending on the productivity of various sites of Lake Baikal. According to the RefSeq database, from 58.3 to 73% of sequences of each sample had cultivated closest relatives belonging to cyanophages. In this study, for phylogenetic analysis, we chose the closest relatives not only from the RefSeq and GenBank NR databases but also from two marine and one freshwater viromes: eutrophic Osaka Bay (Japan), oligotrophic area of the Pacific Ocean (Station ALOHA) and mesotrophic and ancient Lake Biwa (Japan), which allowed us to more fully compare the diversity of marine and freshwater phages. The identity with marine sequences at the amino acid level ranged from 35 to 80%, and with the sequences from the viral fraction and bacterial one from Lake Biwa—from 35.3 to 98% and from 33.9 to 89.1%, respectively. Therefore, the sequences from marine viromes had a greater difference than those from freshwater viromes, which may indicate a close relationship between freshwater viruses and differences from marine viruses.
Introduction
Viruses are obligate intracellular parasites consisting of a single-stranded or double-stranded RNA or DNA molecule enclosed within a protein capsid; enveloped viruses have an additional membrane envelope (supercapsid). Viruses are distinguished by their high abundance and high genetic diversity (Suttle, 2007), thereby representing an inexhaustible pool for research. To date, according to ICTV Master Species List (ICTV, 2019), 3973 species belong to DNA viruses and 2,617 species to RNA viruses, but most of the sequences obtained to date from viromes are known to be “viral dark matter“ (Krishnamurthy & Wang, 2017), and there are much more real biological species of viruses (Gregory et al., 2019). The bulk of the sequences obtained by metagenomic sequencing of DNA-containing viruses in aquatic ecosystems, which can be identified from databases, belong to the order Caudovirales (Cai et al., 2016; Garin-Fernandez et al., 2018; Gong et al., 2018; Taboada et al., 2018; Gregory et al., 2019; Wu et al., 2020). Due to the rapid transformation of viral taxonomy, the order Caudovirales has expanded to 14 families. Among them, the family Myoviridae is the best known and most studied. It includes eight subfamilies and 153 genera (https://talk.ictvonline.org/taxonomy/).
The family Myoviridae contains DNA phages that are genetically and morphologically similar to the well-studied coliphage T4 (Ackermann & Krisch, 1997). At the same time, myoviruses can have a relatively wide range of hosts; they can infect hosts belonging to various species or sometimes even various genera of bacteria (Sullivan, Waterbury & Chisholm, 2003).
Due to the lack of universal genes in viruses, signature genes for specific groups are targeted using group-specific primers. The g23 gene fragment encoding major capsid protein is the most reliable marker for the analysis of the biodiversity of T4-like phages of the family Myoviridae (Tetart et al., 2001; Adriaenssens & Cowan, 2014). Based on the analysis of g23 sequences, T4-like phages are divided into several groups: “true” T-evens represented by bacteriophage T4 and closely related phages infecting enterobacteria (e.g., T2, T6), Pseudo T-evens and Schizo T-evens (phages of the genera Aeromonas, Vibrio, etc.) as well as more distant Exo T-evens (cyano- and pelagiphages, etc.) (Desplats & Krisch, 2003).
In the aquatic environment, viruses are an important factor in the regulation of the number and structure of microbial communities (Kutter & Sulakvelidze, 2005). As a result of the viral lysis of bacteria, a significant amount of organic matter does not enter higher trophic levels but is reused by the bacterial community (Suttle, 2007). Viruses are also capable of horizontal gene transfer (Zhang & Gui, 2018). Moreover, viruses can have auxiliary metabolic genes that modulate the metabolism of host cells during infection, making phage replication more efficient (Warwick-Dugdale et al., 2019). In freshwater ecosystems such as Lake Biwa (Japan), the percentage of daily bacterial production destroyed by viruses was estimated as high and accounted for 52.7 ± 16.2% in the upper layer and 13.6 ± 5.2% in the deeper layer (Pradeep Ram et al., 2010). In Lake Pavin (France), the average seasonal contribution from bacteriophages to bacterial lysis reached 16.2% (Sime-Ngando et al., 2016).
This article describes the diversity of T4-like viruses based on the gene of the major capsid protein (g23) in various ecotopes of Lake Baikal. Previously, a high diversity of planktonic T4-like viruses was detected in the pelagic zone of Lake Baikal, and their difference from bacteriophages of other ecosystems was demonstrated (Butina et al., 2010). Later, this signature gene provided an estimation of the composition of phages in eutrophic Lake Kotokel located close to Lake Baikal, 3 km from the east coast of the lake, and having a direct water connection with it (Butina et al., 2013). Unifrac analysis has revealed that the viral community in Lake Kotokel is closely related to the phages from Lake Donghu in China characterized by a similar trophic state. Subsequently, we have shown that the sequences of the g23 major capsid protein gene from the eutrophic lakes Kotokel (Russia) and Donghu (China) are rather more similar to the sequences from the shallow Maloye More Strait of Lake Baikal than to the sequences from the pelagic zone of the lake (Potapov et al., 2013). In 2018, using high throughput sequencing for the first time, we studied the diversity of phages in the deep southern basin of Lake Baikal. The array of reads yielded 141 OTUs that differed from other ecosystems and, at the same time, were similar to the sequences from the alpine lakes Bourget and Annecy (Potapov et al., 2018). Comparative study of the g23 gene sequences of phages from biofilms formed on stones and sponges in the littoral zone of the lake (viriobenthos), as well as from its surface microlayer (virioneuston), has revealed that benthic and previously obtained planktonic bacteriophages from the pelagic zone of Lake Baikal form a shared Baikal cluster (Potapov et al., 2020). In general, the communities of T4-like bacteriophages from different ecotopes of Lake Baikal are more similar to each other than to the communities from other ecosystems. They are also grouped depending on the biotope and physicochemical parameters of the habitat.
For lytic phages, including myoviruses, three states of life cycle were described: (i) free during extracellular search; (ii) located in a certain space with no host, which is, for example, associated with an inert particle; (iii) actively infects bacteria (Kutter & Sulakvelidze, 2005). T4-like viruses having strong lytic properties likely experience rapid exchange of intracellular and free phages. For instance, phages T4 and λ have latent periods of 20 min and 50 min, respectively (De Paepe & Taddei, 2006). However, in natural ecosystems, the latent period can be up to 8 h in cyanophage (Mruwat et al., 2021) or up to 24 h in myopelagiphages (Zhao et al., 2013).
The study of a bacterial fraction can reveal the relationship between bacteria and bacteriophages infecting them, this will provide an understanding about the phages that are in the propagation stage.
Currently, the diversity of T4-like phages in the viral fraction (less than 0.4 and 0.2 µm) has been mainly studied (Parvathi, Zhong & Jacquet, 2012; Goldsmith et al., 2015; Wang et al., 2015; Millard, Pearce & Zwirglmaier, 2016; Liu, Cai & Zhang, 2017). Organisms larger than 0.2 or 0.4 µm (bacterial fraction) are removed using various methods because it is methodologically more preferable to work with a viral fraction that does not contain bacterial cells. Information about the composition and role of viruses within the microbial fraction is scarce and discussed mainly in metagenomic studies (De Cárcer et al., 2016; Zeigler Allen et al., 2017; Aylward et al., 2017; Palermo et al., 2019; Okazaki et al., 2019; Coutinho et al., 2020). Previously, it was shown that the filtration of samples through filters with a pore size of 0.2 µm reduces the number of phages in the filtrate by an average of two-thirds (transmission electron microscopy counting method) (Paul, Jiang & Rose, 1991). In a later study, the proportion of viruses retained on a 0.2 µm filter did not exceed 15% of the overall number of virus-like particles (epifluorescence microscopy counting method) (Auguet, Montanié & Lebaron, 2006).
Currently, the littoral zone of Lake Baikal and its shallow bays with a high recreational load are under pressure from the impact of human activities (Timoshkin et al., 2018). Therefore, it is very important to conduct research during this period. In this study, we have compared the pelagic station extremely detached from the anthropogenic impact, the coastal station located near the settlement and shallow bays having a developed recreational zone. Physicochemical and biological aspects of Lake Baikal are heterogeneous due to the great number of bays and shoals adjacent to the estuaries of the large rivers. The heterogeneity is associated with the compositional features, the growth level, spatial distribution and the nature of seasonal and interannual fluctuations. There are two peaks in the seasonal development of Baikal phytoplankton: spring under-ice peak of diatom algae and summer-autumn bloom of picocyanobacteria (Popovskaya, 2000). Long-term observations revealed that a higher level of phytoplankton growth is typical of the shallow bays of the lake. For example, in Posolsk Sor, the phytoplankton biomass reaches 64 g m3, in the pelagic zone, it is less than 1 g m3. Based on the specific composition and quantitative characteristics of the blooms of blue–green algae in summer, the shallow bays of the lake are classified as eutrophic water bodies (Popovskaya, 2000).
This study aims to reveal the diversity of phages for the g23 major capsid protein gene in shallow bays, at the coastal area and the pelagic part of Lake Baikal and to analyse the obtained data in terms of regional and global biogeography by comparing them with the sequences obtained previously from Lake Baikal and other ecosystems.
Materials & Methods
Sampling sites
Lake Baikal is the oldest (25 million years), the deepest lake in the world. It is of tectonic origin and is located in the Baikal rift depression. The length of the lake is 636 km; the width in the widest part of the lake opposite the estuary of the Barguzin River reaches 80 km, and in the narrowest area opposite the delta of the Selenga River–about 25 km. The lake is situated in the northeastern part of Central Asia at an altitude of 455.6 m above sea level. The area of the lake with islands is 31,500 km2, the length of the coastline without islands is approximately 2000 km. The greatest depth of the lake (1637 m) is recorded in its central basin; the maximum depth in the southern basin is 1432 m, and that in the northern basin is 889 m (Galaziy, 1993).
Lake Baikal is also the world’s largest freshwater body that stores 20% of the land surface waters. The volume of the lake is 23,000 km3. Constant temperature (∼4°C) below the thermocline throughout the year is one of the main hydrophysical characteristics of the lake. Deep-water renewal does not exceed 19 years (Hohmann et al., 1997). Additionally, hydrochemical characteristics include high levels of dissolved oxygen (more than 80%) and low concentrations of mineral nitrogen and phosphorus as well as of organic carbon (Khodzher et al., 2018). Geological, geographical and hydrological characteristics of the lake reflect its uniqueness and high endemism of aquatic organisms (Kozhova & Izmest’eva, 1998).
For this study, we took samples from two shallow bays of Lake Baikal (Mukhor Bay and Posolsk Sor), one coastal zone (near the Turka settlement) and one pelagic zone (in the middle of the Listvyanka settlement—the Tankhoy settlement section). Samples were collected in August 2019. The shallow bay of Posolsk Sor (maximum depth 3.5 m) is located on the southeast coast of Lake Baikal, about 20 km south of the Selenga River delta. Mukhor Bay is one of the warmest and shallowest bays (average depth 5 m) located in the Maloye More Strait that is situated between the mainland and Olkhon Island. Both bays warm up well in July and August and are the most visited tourist sites of Lake Baikal.
Coordinates and names of sampling sites are as follows: Mukhor Bay near the Kuchelga River–MK (53.020244 N, 106.753739 E), a centre of Mukhor Bay–MC (53.044278 N, 106.798343 E), Posolsk Sor Bay–Posol_S (51.96556 N, 106.17181 E), a coastal zone near the Turka settlement–Turk (52.9384 N, 108.21304 E), and the central station of the Listvyanka settlement—the Tankhoy settlement section–LT_05, LT_1015 (51.721883 N, 104.993283 E). Figure 1 shows the sampling map.
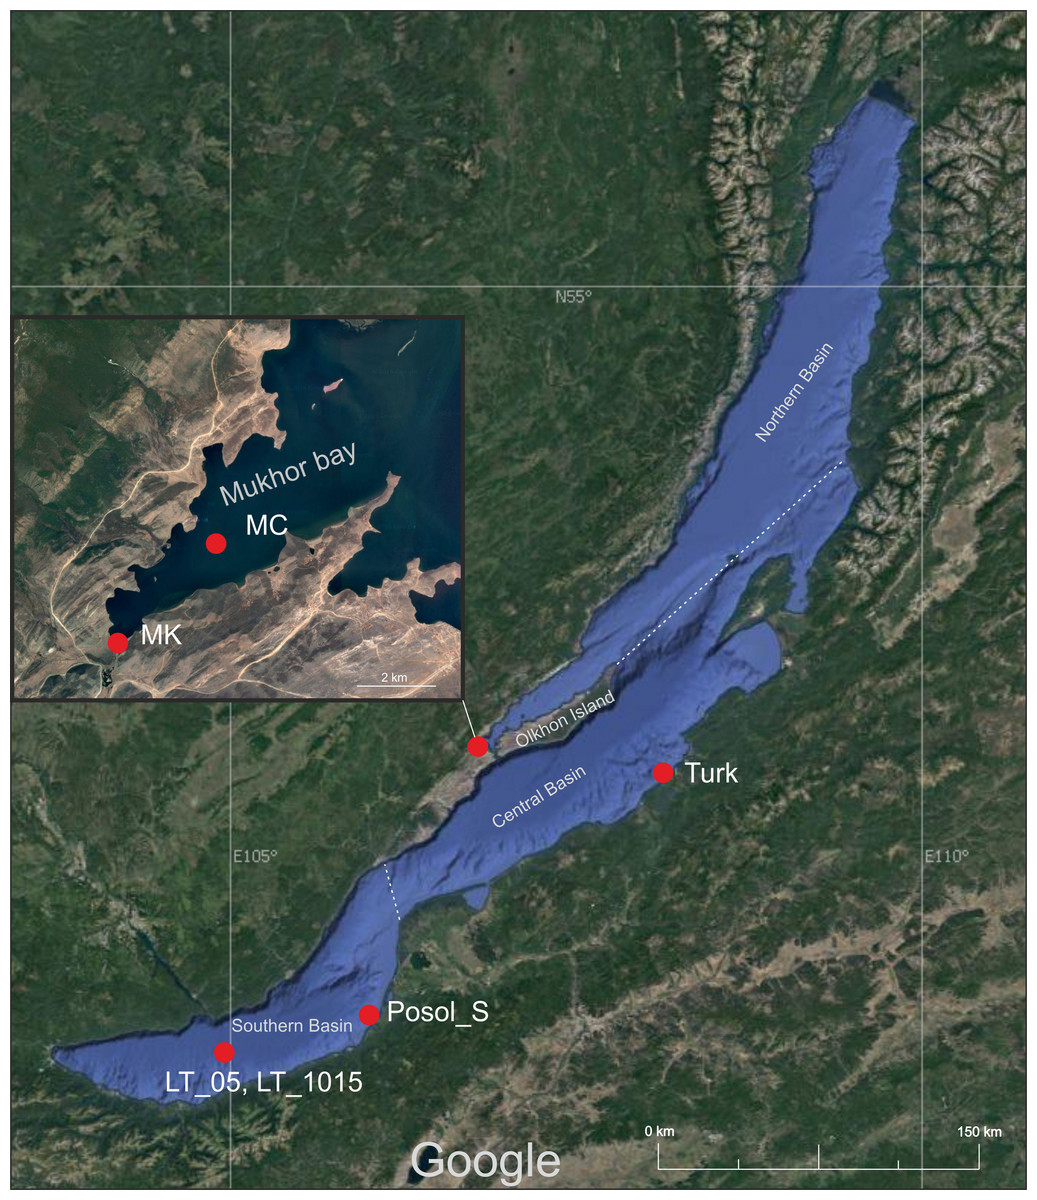
Figure 1: Map of the sampling area.
Imagery ©2021 NASA, TerraMetrics, Map data ©2021 INEGI. MK, Mukhor Bay near the Kuchelga River; MC, center of Mukhor Bay; Turk, coastal zone near the Turka; Posol_S, Posolsk Sor Bay; LT_05, central station of the Listvyanka settlement–the Tankhoy settlement section, sampling was carried out in the layer from 0 + 5 m, LT_1015–central station of the Listvyanka settlement–the Tankhoy settlement section; sampling was carried out in the layer from 10 + 15 m.
In the bays and the coastal zone, samples of a 1 L volume were taken from the water surface using sterile bottles. At the pelagic station, samples of a 500 mL volume were taken using a Niskin bathometer from depths of 0, 5, 10, and 15 m. Thereafter, the 500 mL samples from the layers of 0, 5, 10, and 15 m were combined, and two integral samples were obtained: 0 to 5 m and 10 to 15 m.
Cyanobacteria were identified on an Axio Imager M1 microscope (Zeiss, Germany) equipped with HBO 100 W mercury lamp and AxioCam camera. The identification was carried out according to the manuals (Komárek & Anagnostidis, 2008; Komárek, 2013).
DNA extraction and preparation of amplicons
Water samples (1 liter) from each site (MK, MC, Turk, Posol_S, LT_05, and LT_1015) were filtered through sterile polycarbonate filters with a pore size of 0.2 µm (Sartorius, Germany) without using prefilters, and they were frozen on board the research vessel during the expeditions. DNA was extracted by the standard phenol-chloroform method in the laboratory. Briefly, filters from each sample were cut and placed into separate test tubes with 300 µl 1 ×TE buffer. Then, lysozyme (Thermo Fisher Scientific, Waltham, MA, USA) was added (final concentration 1 mg/ml) and left for 1.5 h at 37 °C in a thermostat. After that, proteinase K (Thermo Fisher Scientific) (final concentration 1 mg/ml) and sodium dodecyl sulfate (SDS) were added followed by incubation at 37 °C for 1.5 h. The next stage was freezing at −70 °C for 12 h; after thawing, 500 µl of phenol and chloroform, isoamyl alcohol (24:1) were added to the mixture, kept for 10 min and centrifuged for 5 min at 13,400 rpm. The supernatant was transferred to a new tube, and the extraction was repeated with chloroform and isoamyl alcohol. Thereafter, 1/10 of the CH3COONa (3M) volume and 2 volumes of ethanol (96%) were added to the extracted supernatant and left overnight at −20 °C. Then, it was centrifuged for 20 min at 13,400 rpm and washed twice with 70% ethanol each time for 1 min. The residue was dried and dissolved in 50 µl of deionized water. Primers MZIA1bis and MZIA6 were used (Filée et al., 2005). The PCR mixture consisted of the following components: Master mix 2x Taq M (Alkor Bio, Russia), 0.1 µM primers, nuclease-free water, and DNA template. PCRs were performed with the following PCR cycle parameters: denaturation at 95 °C for 15 min, 30 cycles of denaturation at 95 °C for 30 s, annealing at 50 °C for 30 s, extension at 72 °C for 1 min, and a final extension at 72 °C for 10 min. DNA was purified from the PCR mixture using a suspension of magnetic particles CleanMag DNA (Evrogen, Russia). Library preparation and sequencing on Illumina MiSeq 2*300 were performed in the “Genomics Core Facility” (ICBFM SB RAS, Novosibirsk, Russia).
Bioinformatic analysis
Sequence quality analysis was carried out using the FastQC software tool (Andrews, 2010). Trimming was performed using the Trimmomatic v. 0.36 tool (Bolger, Lohse & Usadel, 2014) with the following parameters: SLIDINGWINDOW:4:20 LEADING:3 TRAILING:3 MINLEN:50. Further processing was performed using the Usearch v. 11.0.667 tool (Edgar, 2010). Paired-end reads were combined using the -fastq_mergepairs command. Then unique sequences (-derep_fulllength) were sorted out. The next step was clustering at the 97% identity level, UPARSE-OTU algorithm (-cluster_otus) as well as the removal of chimeras, singletons and doubletons. Thus, all six sets of sequences were processed separately. The chosen level was used after the analysis of rarefaction curves. Additionally, we were guided by previous publications (Millard, Pearce & Zwirglmaier, 2016; He et al., 2017) where the clustering at the 97% level was also chosen. For further analyses, the primers were removed. The annotation was performed using the online blastp analysis (https://blast.ncbi.nlm.nih.gov/Blast.cgi) with default expected threshold based on the RefSeq (Release 207) and GenBank non-curated (NR) (Release 243) databases.
Nucleotide diversity values were calculated using DNASP v. 6.12 (Rozas et al., 2017). The sequences were aligned by the ClustalW, Mega 7 software (Kumar, Stecher & Tamura, 2016) with default settings. Each set of the g23 sequences was tested separately. From this study the sequences were analysed individually for each sample based on the resulting OTUs.
The network was built using the QIIME v. 1.9.1 scripts (Caporaso et al., 2010). At the first step, all sets (566 sequences) obtained from lakes Baikal and Kotokel (nucleotide level) were clustered at the 97% level (pick_otus.py). The second step was the OTU table (make_otu_table.py). Next, two files were created for the network (make_otu_network.py: real_edge_table and real_node_table), which are required for the analysis in Cytoscape v. 3.7.0 (Shannon, 2003).
Nucleotide sequences from this study were translated to amino acid ones using the BioEdit v. 7.0.9.0 program (Hall, 1999). Based on the blastp analysis, the nearest neighbours were selected for phylogenetic analysis. These data were supplemented with the g23 sequences from the sampling site of the Hawaii Ocean Time-series (HOT) program (Luo et al., 2020), Osaka Bay (Japan) (Nishimura et al., 2017) and Lake Biwa (Japan) (Okazaki et al., 2019).
Viromes from Lake Biwa were obtained from epilimnion and hypolimnion and from two fractions (bacterial and viral). Datasets available in the SRA archive were combined by fractions into two metagenomes: three (epilimnion) from the bacterial fraction and 12 from the viral fraction. Thereafter, quality filtration using Trimmomatic v.0.36 with the following parameters: SLIDINGWINDOW:4:20 LEADING:3 TRAILING:3, was carried out separately for the viral fraction and the bacterial fraction. Reads were assembled using the metaSPAdes program (Bankevich et al., 2012). The assembled contigs from Lake Biwa and the contigs available for downloading in NCBI, which were obtained from the sampling site of the Hawaii Ocean Time-series (HOT) program, station ALOHA (PRJNA352737) and Osaka Bay virome (OBV) (PRJDB4437), were translated into CDS using GeneMarkS v. 3.36 (Besemer, 2001). Nucleotide sequences were annotated in DIAMOND (Buchfink, Xie & Huson, 2014) with the following settings: database–RefSeq, blastx, min-score–50, more-sensitive. The sequences having less than 60% amino acid identity with the sequences from the RefSeq database were removed. Short sequences of less than 250 nucleotides were also removed. Clustering of the sequences at the 100% level using CD-HIT (Li & Godzik, 2006) allowed us to exclude identical sequences. Then, the sequences were translated into amino acids, and, on their basis, local databases were created for blastp analysis (e-value 10−3) with the studied sequences. For each set, the search was carried out independently. Unique sequences that were assigned as the closest relatives were included in the phylogenetic analysis. Each sequence was manually checked for the length and g23 gene. Amino acids were aligned in the Mega 7 software using the ClustalW algorithm. A phylogenetic tree was constructed through Bayesian analysis using the MrBayes software (v. 3.2.6) (Huelsenbeck & Ronquist, 2001). Two independent Markov chain Monte Carlo (MCMC) analyses were launched for 25 million generations with 25% burn-in (rejection of initial generations) and four chains (one cold and three hot ones), amino acid model (Blosum). Analysis was completed with an average standard deviation of split frequencies: 0.02; parameter potential scale reduction factor (PSRF+) was 1.000. All calculations were performed on HPC-cluster “Akademik V.M. Matrosov” (“Irkutsk Supercomputer Center of SB RAS, http://hpc.icc.ru”).
To assess the β-diversity of the sequences, Unweighted Pair Group Method with Arithmetic Mean (UPGMA) (Sneath & Sokal, 1973) was performed. The datasets were taken from those available in the GenBank NR database. Based on the amino acid sequences, the distance matrix was obtained through the unweighted UniFrac metric (multiple sequence alignment–ClustalW, model - Blosum62, normalized =TRUE) followed by a hierarchical cluster analysis (hclust) (Murtagh, 1992) method “average” (=UPGMA) using phyloseq (v. 1.21.0), vegan (v. 2.5-7) and phangorn (v. 2.2.0) packages implemented in the R software (v. 3.2.4).
The raw sequencing data were deposited in the Sequence Read Archive (SRA) of the National Center for Biotechnology Information (NCBI) under the project accession number PRJNA770749; all 250 g23 sequences (OTUs) were deposited in GenBank NR under accession numbers MW690662–MW690911.
Water chemistry analysis
Chlorophyll a concentration was determined as described previously (Bondarenko et al., 2019). Total phosphorus content was determined using a KFK-2 photoelectric colorimeter (ZOMZ, Zagorskii optiko-mekhanicheskii zavod (Zagorskii optical mechanics factory), Russia) after persulfate oxidation. Total nitrogen concentration was determined by persulfate oxidation in an alkaline medium according to R. G. Wetzel & G. E . Likens (Wetzel & Likens, 2000) using a PE−5300 VI spectrophotometer (Ekroskhim (the former ”Ekohim”), Russia).
Results
Microscopy
Microscopy of the water samples from the coastal station and the pelagic station (LT_05, LT_1015 and Turk) revealed that picoplanktonic cyanobacteria of Synechococcus/Cyanobium cluster predominated in water; the species of the genus Dolichospermum prevailed in the water sample from Mukhor Bay (MK and MC), and Gloeotrichia echinulata dominated plankton from Posolsk Sor (Posol_S).
Environmental parameters
According to the indicators given in the table, the productivity of shallow bays corresponds to the mesotrophic status, and the productivity of the waters of the pelagic station and coastal station corresponds to the oligotrophic status according to G. E. Likens (Likens, 1975). Table 1 shows the results of the physicochemical analysis. Hydrochemical indicators and chlorophyll a concentration are among the range of values observed in summer in Lake Baikal (Belykh et al., 2007; Khodzher et al., 2018).
Analysis of g23 sequences
Overall, we obtained 250 representative viral sequences (OTU) of the g23 gene fragment based on the 97% clustering. The lengths of the sequences at the nucleotide level, taking into account the primers, ranged from 355 to 547 nucleotides (average length 439 nucleotides). The main data obtained from processing during the preparation of sequences are shown in Table S1.
Nucleotide diversity of the g23 gene fragment
To assess alpha diversity, we conducted a comparative analysis of sequences based on nucleotides (nucleotide diversity, π) (Table 2). In addition to the sequences from this study, the sequences were taken from various sources available in the NCBI database. Based on microdiversity data, among the sequences obtained in this study, Posol_S is the least diverse g23 community in Lake Baikal, and MK is the most diverse one. In contrast, the sequences from the polar Lake Limnopolar, dairy water (Ireland) and Lake Baikal (LS, 2D4) were distinguished by a larger nucleotide diversity.
| MK shallow bay |
MC shallow bay |
Turk coastal zone |
Posol_S shallow bay |
LT_05 pelagic zone |
LT_1015 pelagic zone |
|
|---|---|---|---|---|---|---|
| Sampling horizon, m | 0 | 0 | 0 | 0 | 0–5 | 10–15 |
| Water temperature, °C | 19.6 | 21.5 | 17.3 | 19 | 12 (average) | 6.2 (average) |
| pH | 8.2 | 8.6 | 8.3 | 8.2 | 8.2 | 8.2 |
| Ptotal, µg/l | 12.8 | 13.5 | 10 | 12 | 7.8 | 8.2 |
| Ntotal, mg/l | 0.23 | 0.26 | 1.3 | 2 | 0.11 | 0.13 |
| Chl a, µ/l | 4.8 | 4.8 | 1.1 | 25 | 1.8 | 2.1 |
| Sample | Nucleotide diversity, π | References |
|---|---|---|
| Lake Baikal, LS | 0.38 | Potapov et al. (2020) |
| Lake Limnopolar (Antarctica) | 0.37 | López-Bueno et al. (2009) |
| Dairy water (Ireland) | 0.37 | Knapik & Prentice (2012) |
| Lake Baikal, 2D4 | 0.37 | Potapov et al. (2020) |
| MK | 0.36 | This study |
| MC | 0.35 | This study |
| Turk | 0.35 | This study |
| Paddy field (China) | 0.35 | Li et al. (2019) |
| Lake Baikal, 2a | 0.35 | Potapov et al. (2020) |
| LT_1015 | 0.34 | This study |
| Lake Proglacial (Svalbard) | 0.34 | Bellas & Anesio (2013) |
| Lake Kotokel (Russia) | 0.34 | Butina et al. (2013) |
| LT_05 | 0.33 | This study |
| Kongsfjorden (Svalbard) | 0.33 | Bellas & Anesio (2013) |
| Lake Baikal (South basin) | 0.33 | Butina et al. (2010) |
| Paddy field (Japan) | 0.33 | (Cahyani et al., 2009) |
| Wetland, water (China) | 0.32 | Zheng et al. (2013) |
| Posol_S | 0.31 | This study |
| Lake Donghu (China) | 0.31 | Huang, Cheng & Xu (2011) |
| Lake Baikal, 2D2 | 0.30 | Potapov et al. (2020) |
| Hydrothermal vent (East Scotia Ridge) | 0.30 | Millard, Pearce & Zwirglmaier (2016) |
| Lake Baikal (North basin) | 0.30 | Butina et al. (2010) |
| Chesapeake Bay (USA) | 0.29 | Jamindar et al. (2012) |
| Lake East (China) | 0.29 | Wang et al. (2015) |
| Wetland sediments (China) | 0.29 | Li et al. (2018) |
| Lake Baikal, pelagic water (South basin) | 0.28 | Potapov et al. (2018) |
| Lake Annecy and Bourget (France) | 0.28 | Zhong & Jacquet (2014) |
| Sediments of Pearl River Estuary (China) | 0.28 | He et al. (2017) |
| Lake Baikal, Neuston | 0.27 | Potapov et al. (2020) |
| Coral colony (Orpheus Island) | 0.23 | Buerger et al. (2019) |
| Lake Baikal, 2D1 | 0.14 | Potapov et al. (2020) |
| Lake Baikal, 1D3Tp | 0.03 | Potapov et al. (2020) |
Blast analysis of the g23 gene (amino acid level)
Among the cultivated bacteriophages, the highest identity is at amino acid level (from 64.4 to 77.9%), and the minimum e-value was with cyanophages: Synechococcus phage S-SSM7, Synechococcus phage S-SM2, Synechococcus phage Bellamy, and Synechococcus phage S-CAM1. The bulk of the sequences were annotated as belonging to cyanophages (58.3 to 73%). A summary of the identified cultivated closest relatives can be found in Table S2.
Pelagibacter phage HTVC008M was also dominant among the closest relatives (34 to 70.1% amino acid identity) in terms of the frequency of occurrence: MK–13.7%, MC–29.2%, Turk–20%, Posol_S–10.8%, LT_05–16.7%, and LT_1015–14.3%.
Moreover, Serratia phage BF (YP_009599751) with identity of 65.8 to 68%, Agrobacterium phage Atu_ph07 (YP_009611880) with identity of 63.7%, Caulobacter phage Cr30 (YP_009098938) with identity of 58.8 to 61.5%, Sinorhizobium phage phiN3 (YP_009212304) with identity of 34.8 to 62.34%, and Acidovorax phage ACP17 (YP_009609699) with identity of 56.9% were among the closest relatives. There were no sequences with 100% identity with the studied sequences among the cultivated closest relatives.
The protein sequences had uncultivated relatives from various ecosystems (Table 3), and most relatives from the GenBank database were similar to the Baikal sequences that had been previously obtained from biofilms (from 19.6 to 28.6%; identity from 67.9 to 100%) and the pelagic zone (from 6.8 to 30%; identity from 75.2% to 100%) of Lake Baikal. The largest number of the closest relatives for samples LT_05, LT_1015 and Turk was from lakes Bourget and Annecy (from 10.8 to 25.7%; identity from 83.9 to 100%). An interesting result is the identity of a large number of sequences from shallow eutrophic bays (MK, MC and Posol_S) with sequences from wetland sediments (from 18.9 to 25.5%; identity from 59.4 to 97.9%) (Li et al., 2018), whereas pelagic representatives from samples Turk, LT_05 and LT_1015 had only from 2.8 to 3.3% of similar sequences with sequences from wetland sediments.
| Isolation source | MK | MC | Turk | Posol_S | LT_05 | LT_1015 | Reference |
|---|---|---|---|---|---|---|---|
| Biofilms, Lake Baikal (Russia) | 19.6 | 20.8 | 20 | 27 | 27.8 | 28.6 | Potapov et al. (2020) |
| Pelagic water, Lake Baikal (Russia) | 9.8 | 12.5 | 30 | 6.8 | 25 | 22.9 | Potapov et al. (2018) |
| Lakes Bourget and Annecy (France) | 17.6 | 16.7 | 23.3 | 10.8 | 22.2 | 25.7 | Zhong & Jacquet (2014) |
| Lake Donghu (China) | 3.9 | 4.7 | 3.3 | 2.7 | 8.3 | 5.7 | Huang, Cheng & Xu (2011) |
| Lake East (China) | 9.8 | 8.3 | 6.7 | 8.1 | 5.6 | 5.7 | Wang et al. (2015) |
| Wetland sediment (China) | 25.5 | 20.8 | 3.3 | 18.9 | 2.8 | 2.9 | Li et al. (2018) |
| Borehole water (South Africa) | 2 | 4.2 | 3.3 | 4.1 | 2.8 | 2.9 | (Mabizela & Litthauer, 2016) |
| Dairy wastewater (Ireland) | – | – | 3.3 | 2.7 | 2.8 | 2.9 | Knapik & Prentice (2012) |
| Paddy water (China) | – | – | – | 1.4 | 2.8 | 2.9 | Zheng et al. (2013) |
| Rimov reservoir (Czech Republic) | 2 | – | 3.3 | 4.1 | – | – | (Kavagutti et al., 2019) |
| Marine environment | – | – | 3.3 | – | – | – | (Sandaa & Kristiansen, 2016) |
| Wetland water (China) | 5.9 | 4.2 | – | 1.4 | – | – | Zheng et al. (2013) |
| Sediments of Pearl River Estuary (China) | 2 | 4.2 | – | 1.4 | – | – | He et al. (2017) |
| Lake Kotokel (Russia) | 2 | 4.2 | – | 5.4 | – | – | Butina et al. (2013) |
| Lake Limnopolar (Antarctica) | – | – | – | 2.7 | – | – | López-Bueno et al. (2009) |
| Paddy field soil (Japan) | – | – | – | 1.4 | – | – | (Fujihara et al., 2010) |
| Surface soil of rice field (Japan) | – | – | – | 1.4 | – | – | (Jia et al., 2007) |
Among uncultivated closest relatives, two sequences from other ecosystems were identified with 100% identity: from wetland water (BAL45773), Posol_S-Otu35, and Lake Annecy (AHU87275), LT_05-Otu22 and LT_1015-Otu25.
In marine viromes, 34 (HOT) and 11 (OBV) g23 gene sequences that were the closest relatives for our OTUs were detected. The identity with the sequences from HOT varied from 36.2% to 79.8%; the highest identity of the amino acid sequence from the HOT201114979 contig corresponded to the sequence from the shallow Posolsk Sor Bay (Posol_S-Otu58). The Baikal sequences, LT_05-Otu31 and LT_1015-Otu29, were closely related to sequences OBV (from 35.1% to 77.3%), with the highest identity of the amino acid sequence from OBV-Vall-contig_N000719. The coverage for all sequences was 100%. Based on blastp analysis, HOT201114979 had Escherichia phage 121Q as the closest relative with an identity of 65.7% and coverage of 95%; for OBV-Vall-contig_N000719, the closest relative was Synechococcus phage S-CAM1 with the identity of 96.2% and 100% coverage.
The identity of the g23 sequences from the viral fraction of Lake Biwa with the sequences from this study ranged from 35.3 to 98%, and the coverage–from 88 to 100%. Overall, eight unique sequences were identified, which were the closest relatives. The highest identity was with the MK-Otu49 sequence and a fragment from the Node_13864 contig. In the bacterial fraction from Lake Biwa, 18 sequences were detected with the identity ranging from 33.9 to 89.1% and the coverage from 75 to 100%. The highest identity was with the Node_42706 fragment and the Posol_S-Otu49 sequence. The most identical g23 fragments in the RefSeq database (blastp analysis) belonged to Pelagibacter phage HTVC008M (YP_007517957), the Node_13864 contig (identity 61.3% and coverage 99%) and Escherichia phage 121Q–Node_42706 (identity 60.1% and coverage 100%).
Phylogenetic analysis
Phylogenetic analysis of the amino acid g23 sequences with the cultivated representative T4-like viruses of the family Myoviridae and with the sequences from various natural sources revealed that the sequences from this study were mixed in the tree, and 46.4% of them had <90% amino acid sequence identity with the g23 sequences from the RefSeq and GenBank NR databases (Fig. 2). Furthermore, 19 clusters (except for groups T-, Pseudo T- and Schizo T-events) were obtained. Only the sequences from Posol_S formed five monophyletic groups consisting of two or three OTUs. The bulk of the clusters contained the g23 sequences of phages from natural sources, whose hosts are still unknown because there are no cultivated representatives and, hence, the confirmation of phylogenetic affiliation.
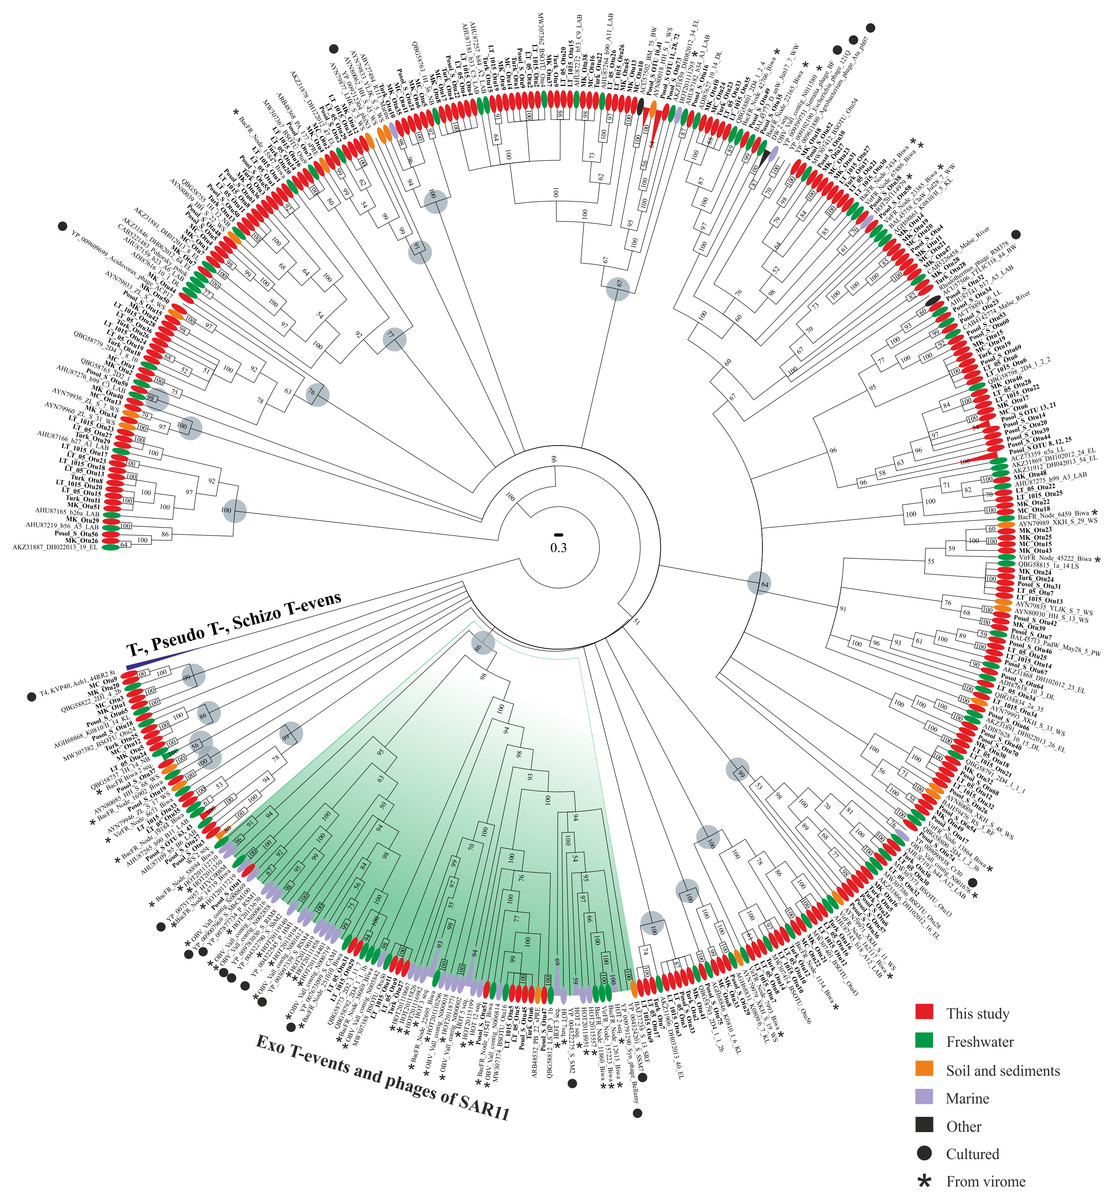
Figure 2: Bayesian phylogenetic tree based on the alignment of 438 g23 major capsid protein sequences.
LAB, Lake Bourget and Annecy; WS, wetland sediments; EL, East Lake; sPRE, sediments of Perl River estuary; BW, Borehole water; DL, Donghu Lake; WW, wetland water; DW, dairy wastewater; PW, paddy water; RF, rice field; SRF, the soil of rice field; LL, Lake Limnopolar; KL, Lake Kotokel; LS, 2D1, 2D2, 2D4, 2a, biofilms (Lake Baikal); NB, Neuston Lake Baikal; OBV, Osaka Bay; HOT, sampling site of the Hawaii Ocean Time-series program; BacFR, Lake Biwa (bacterial fraction); VirFR, Lake Biwa (viral fraction). Gray circles represent 19 clusters.
Most sequences from this study were similar to the sequences from freshwater ecosystems. None of the sequences was included in groups T-, Pseudo T- and Schizo T-events. Twelve sequences from this study were included in group Exo T-evens containing cultivated cyanophages and the HTVC008M pelagiphages. Also, this group included most of the g23 sequences from viromes (94.4%).
In addition to the sequences from marine viromes, the cluster with 100% support included one sequence from the uncultivated marine bacteriophage (ABV27494) and, based on blastp analysis, it had the maximum identity of 75% with one OTU from the Turk sample (Turk_OTU-10).
Biogeography of g23 sequences
Regional level
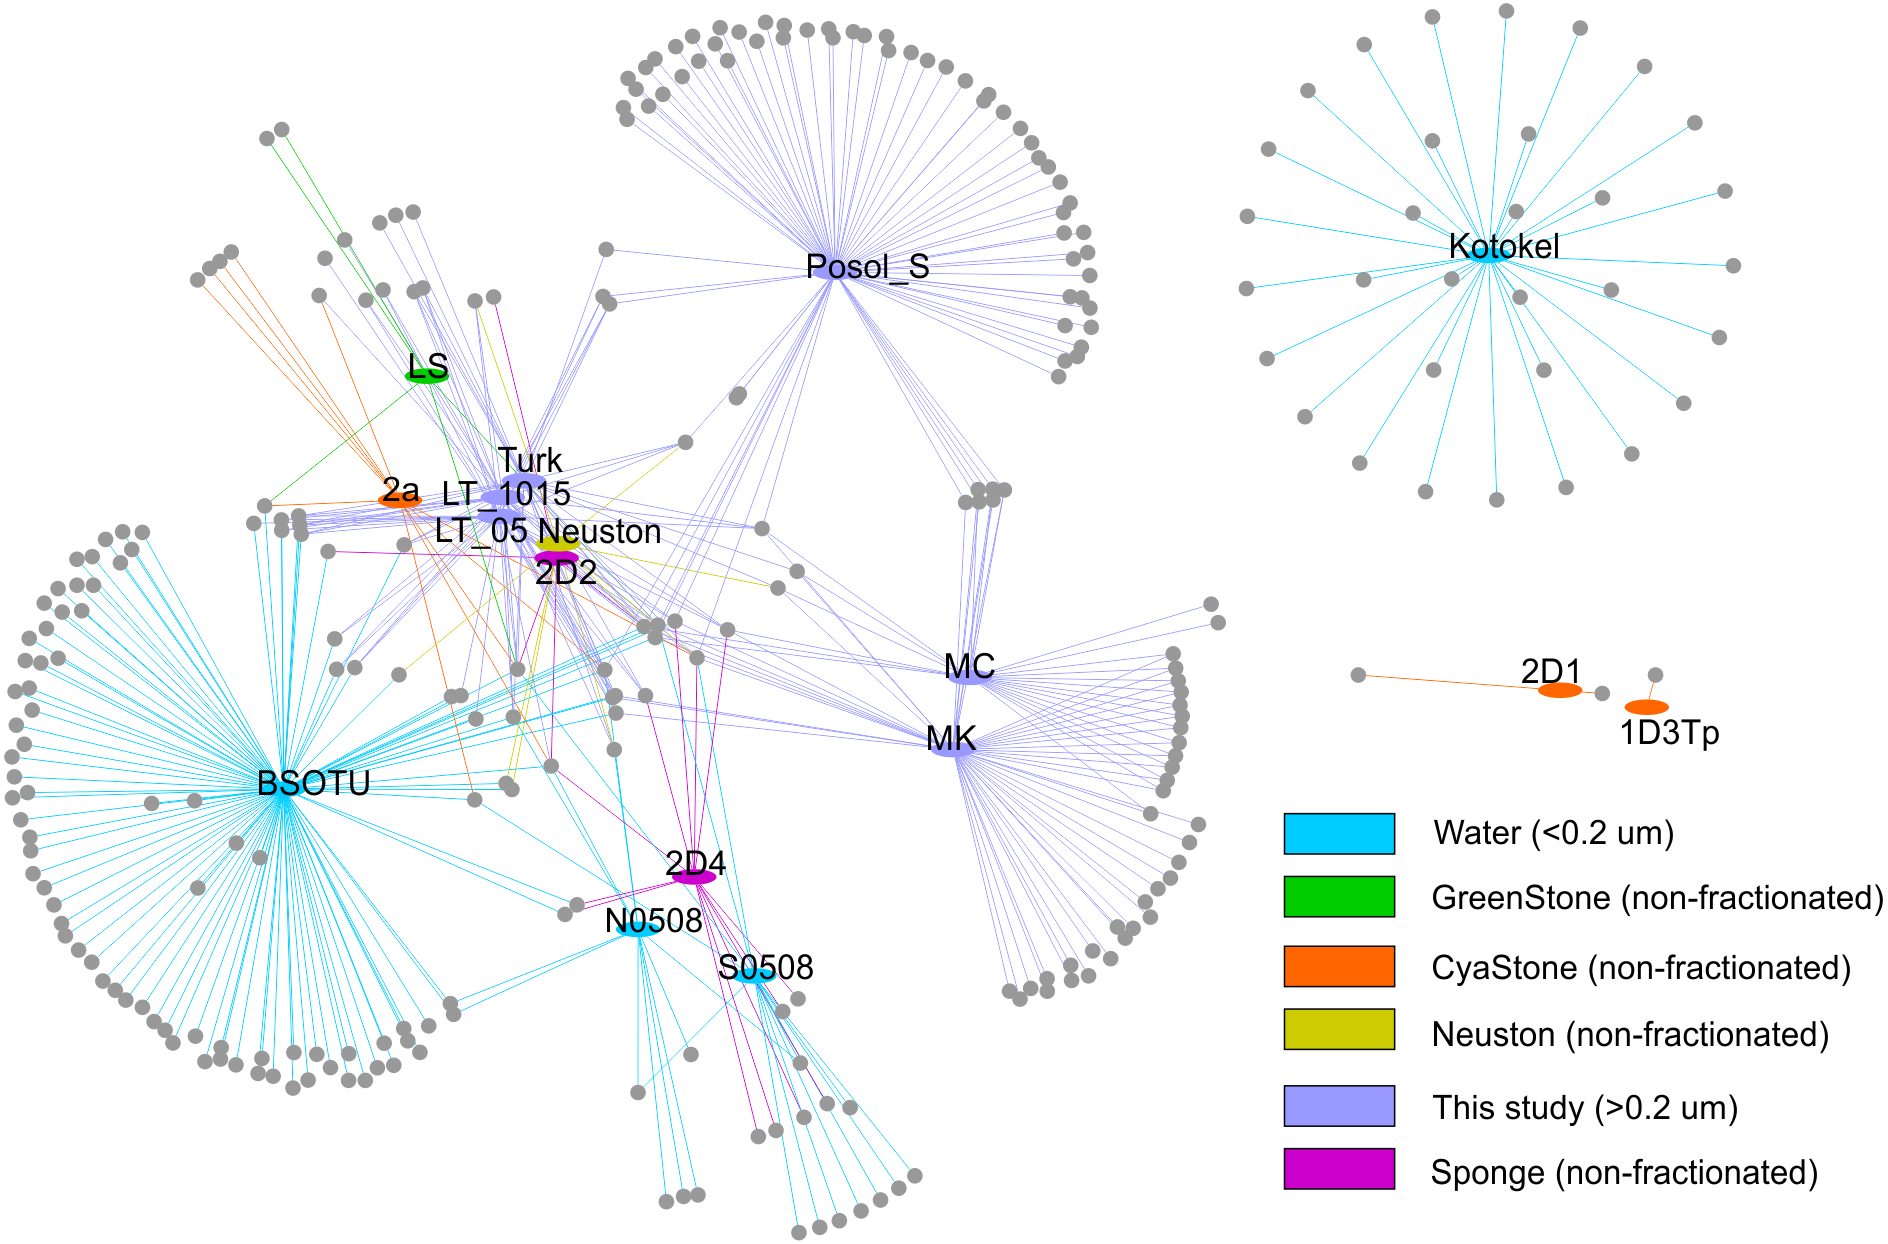
To analyse relationships of the g23 sequences at the local level in the Baikal region, we built the network that included various biotopes in Lake Baikal and plankton of Lake Kotokel (Fig. 3). Based on the analysis, clusters from Lake Kotokel and biofilms of stone substrates, 2D1 and 1D3Tp, of Lake Baikal are remote from other Baikal clusters. These clusters do not have shared OTUs (clustering of nucleotide sequences at 97% level) with other samples. As mentioned above, the sequences from the eutrophic Lake Kotokel were more similar to the sequences from Lake Donghu (China) than to the sequences from Lake Baikal (Butina et al., 2013). Sequences from the biofilm samples, 1D3Tp and 2D1, taken in the southern basin of Lake Baikal from depths of 9 and 36 m, which consisted mainly of cyanobacteria, formed separate clusters in the tree (Potapov et al., 2020).
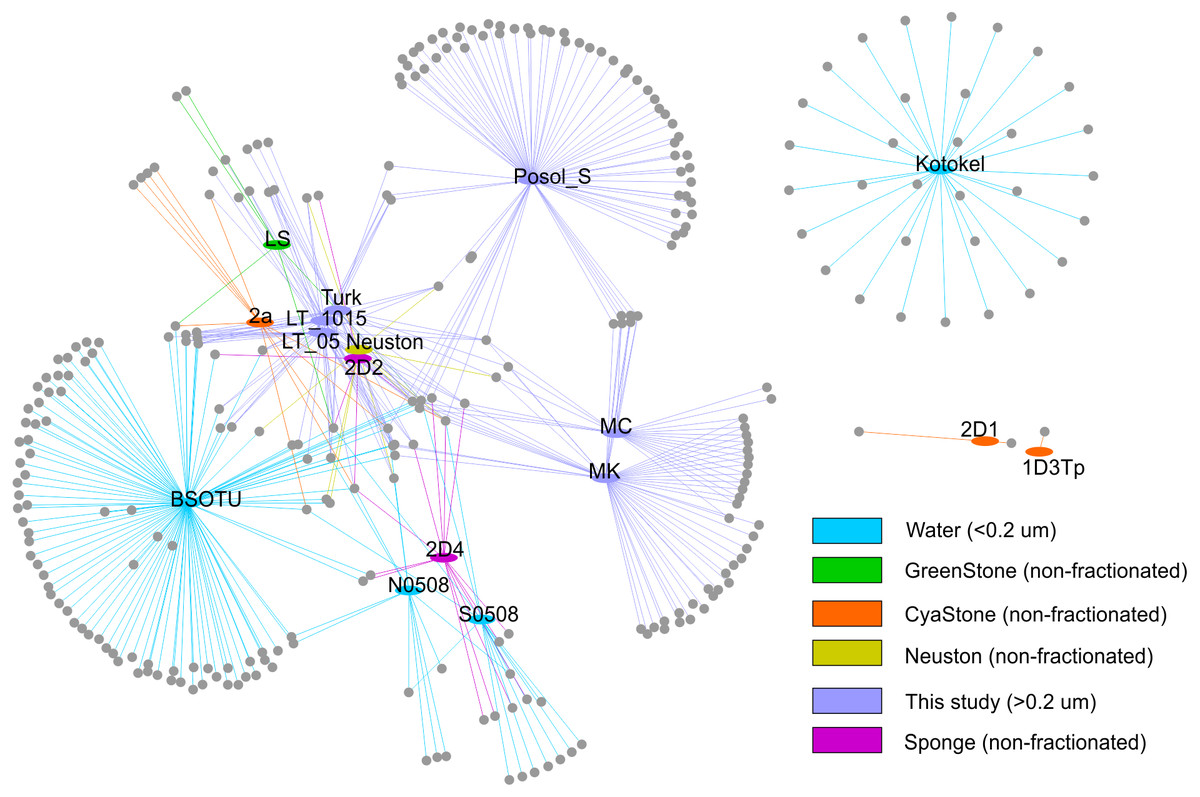
Figure 3: Network demonstrating the relationship of the studied OTUs with other previously obtained sequences: S0508 and N0508 (Butina et al., 2010); 2D1, 1D3Tp, 2D2, 2D4, and Neuston (Potapov et al., 2020); Lake Kotokel (Butina et al., 2013).
Samples MK and MC from Mukhor Bay (Maloye More Strait, the west coast) taken at nearby stations with similar hydrochemical and hydrophysical parameters are close to each other and have more shared OTUs than with sample Posol_S taken from Posolsk Sor Bay on the east coast of the lake.
Samples from the coastal site (Turk) and the pelagic station (LT_05 and LT_1015) cluster together and have more shared OTUs with the sequences from the pelagic water (BSOTU).
Samples LT_05 and LT_1015 have more similar OTUs (ten shared OTUs) with previously obtained pelagic samples BSOTU, S0508 (southern basin) and N0508 (northern basin) than with samples from the shallow bays, MC and MK (three shared OTUs), the coastal site, Turk (six shared OTUs), and biofilms, 2D1, 1D3Tp, 2D2, 2D4, 2a, LS, and Neuston (seven shared OTUs).
Global level
For comparative biogeographical analysis, we selected sequences available in the GenBank NR database (Table 4). All of them were obtained using primers MZIA1bis and MZIA6. The geography of the samples in the databases covers a wide range of climate zones and habitats, ensuring a rather large-scale analysis of phages for the g23 gene fragment. Sampling sites are shown in Fig. 4.
| Isolation source | Localization | Accession number | Reference |
|---|---|---|---|
| Kongsfjorden, proglacial lake | Svalbard, Norway | JQ996772–JQ996789 JQ996716–JQ996736 |
Bellas & Anesio (2013) |
| Coral colony | Orpheus Island, Australia | AYH52385–AYH52406 | Buerger et al. (2019) |
| Hydrothermal vent | East Scotia Ridge | AMN08847–AMN08920 | Millard, Pearce & Zwirglmaier (2016) |
| Chesapeake Bay | USA | AFV99049–AFV99127 | Jamindar et al. (2012) |
| Lake Baikal | Russia | ADJ57308–ADJ57325 ADA61131–ADA61153 |
Butina et al. (2010) |
| Lake Baikal, BSOTU | Russia | MW307359–MW307499 | Potapov et al. (2018) |
| Lake Baikal | Russia | QBG58752–QBG58836 | Potapov et al. (2020) |
| Lake Annecy and Bourget, LAB | France | AHU87093–AHU87277 | Zhong & Jacquet (2014) |
| Wetland | China | BAL45733–BAL45791 | Zheng et al. (2013) |
| Lake Kotokel | Russia | AGH68825–AGH68878 | Butina et al. (2013) |
| Lake Donghu | China | ADI87605–ADI87650 | Huang, Cheng & Xu (2011) |
| Lake East | China | AKZ31833–AKZ31924 | Wang et al. (2015) |
| Lake Limnopolar | Antarctica, Livingston Island | ACZ73354–ACZ73383 | López-Bueno et al. (2009) |
| Dairy wastewater | Ireland | AFN85671–AFN85714 | Knapik & Prentice (2012) |
| Wetland sediments | China | AYN79829–AYN80090 | Li et al. (2018) |
| Sediments of the Pearl River estuary | China | ARB48299–ARB48753 | He et al. (2017) |
| Paddy field | China | BAW82012–BAW82092 | Li et al. (2019) |
| Paddy field | Japan | BAF91499–BAF93227 | Wang et al. (2009) |
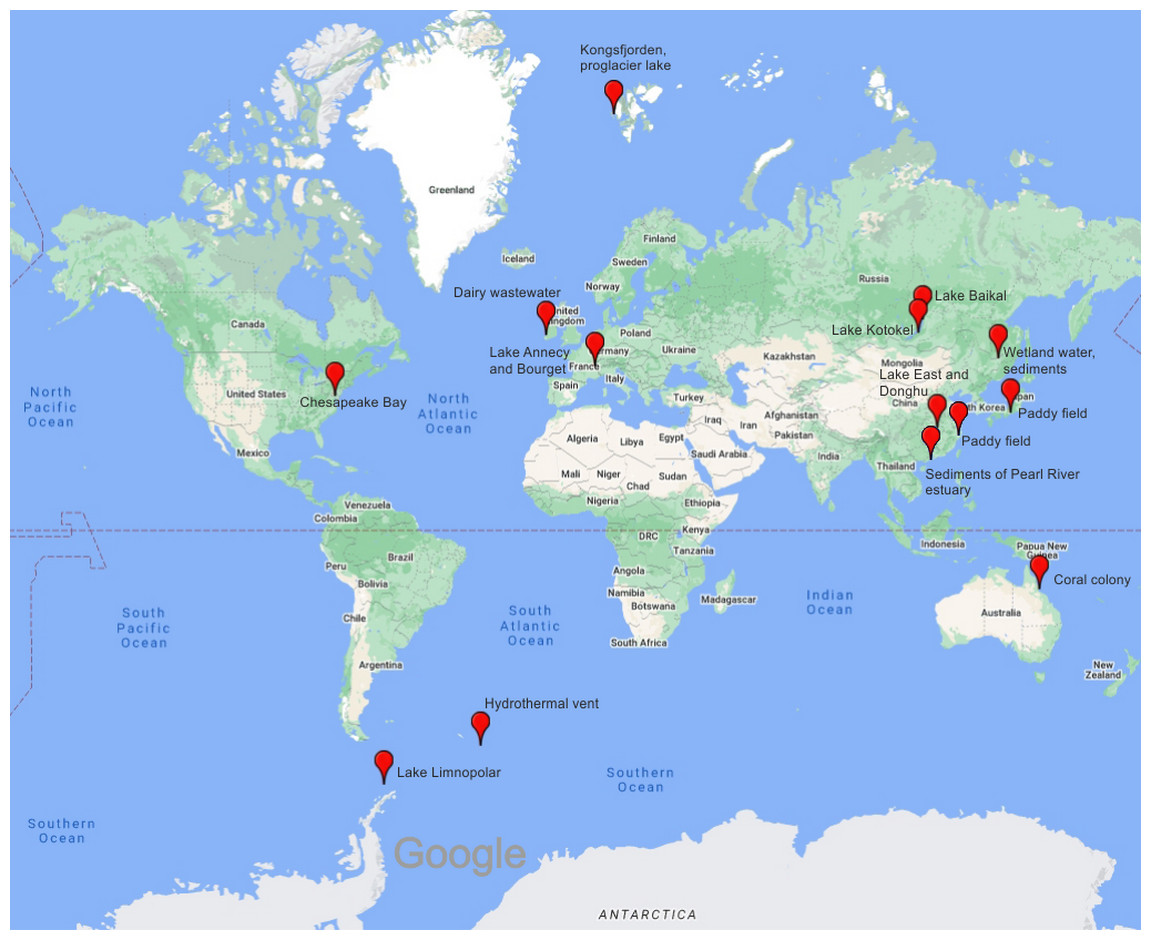
Figure 4: Map showing the samples included in the analysis for this study.
Map data ©2021 Google, INEGI.
The g23 sequences in this study and those represented in the GenBank NR database formed groups on the dendrogram: marine, Baikal cluster, Baikal subcluster, soil, and sediments (Fig. 5).
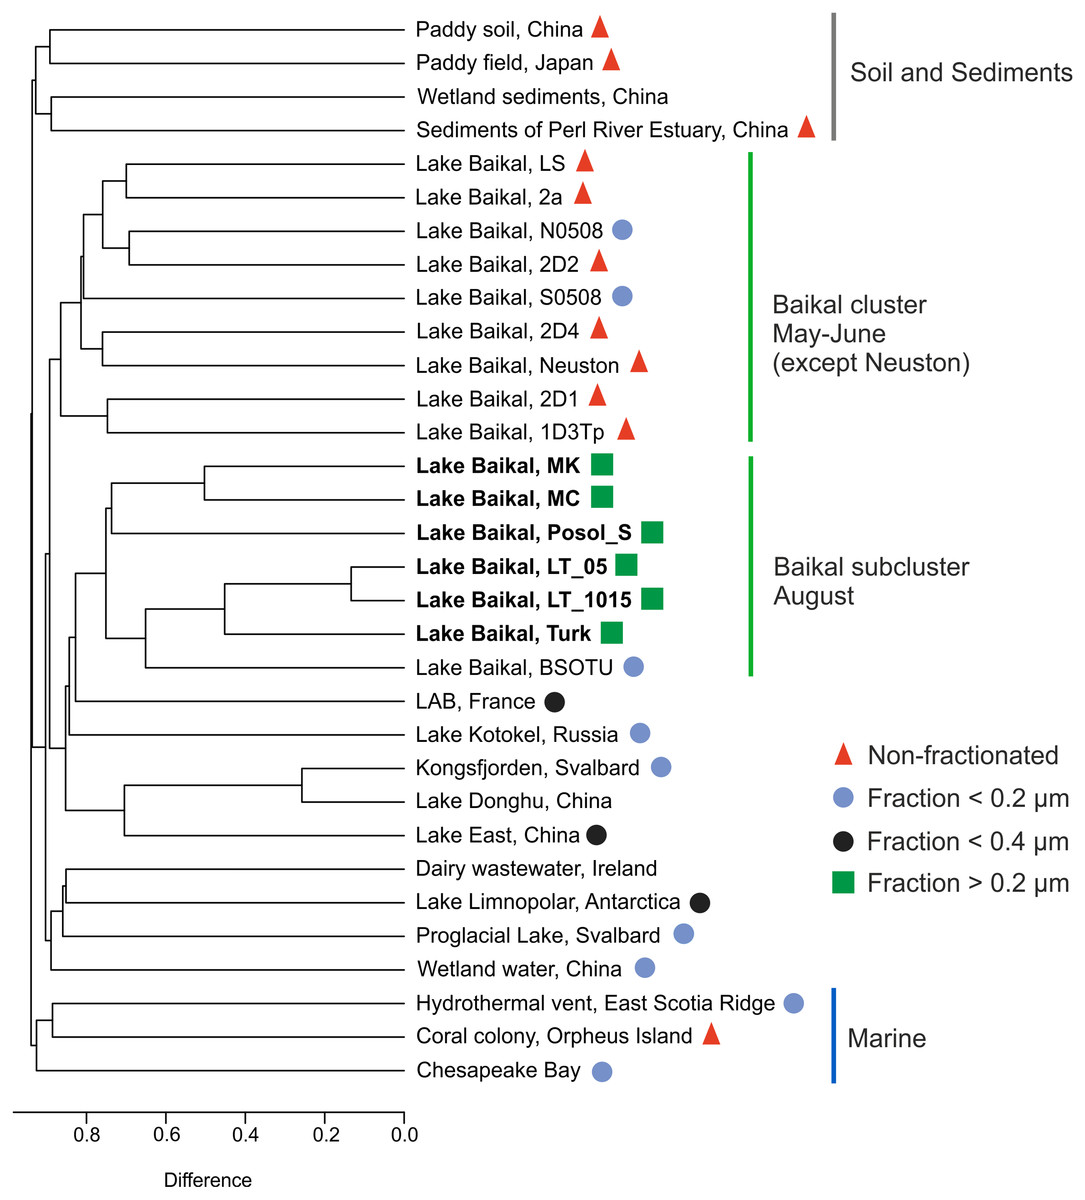
Figure 5: Cluster dendrogram (UPGMA).
Samples from this study are marked in bold S0508–southern basin, Lake Baikal, N0508–northern basin, Lake Baikal, BSOTU–Baikal OTU samples, LAB–lakes Bourget and Annecy. Untagged samples are either unpublished or have no open access articles.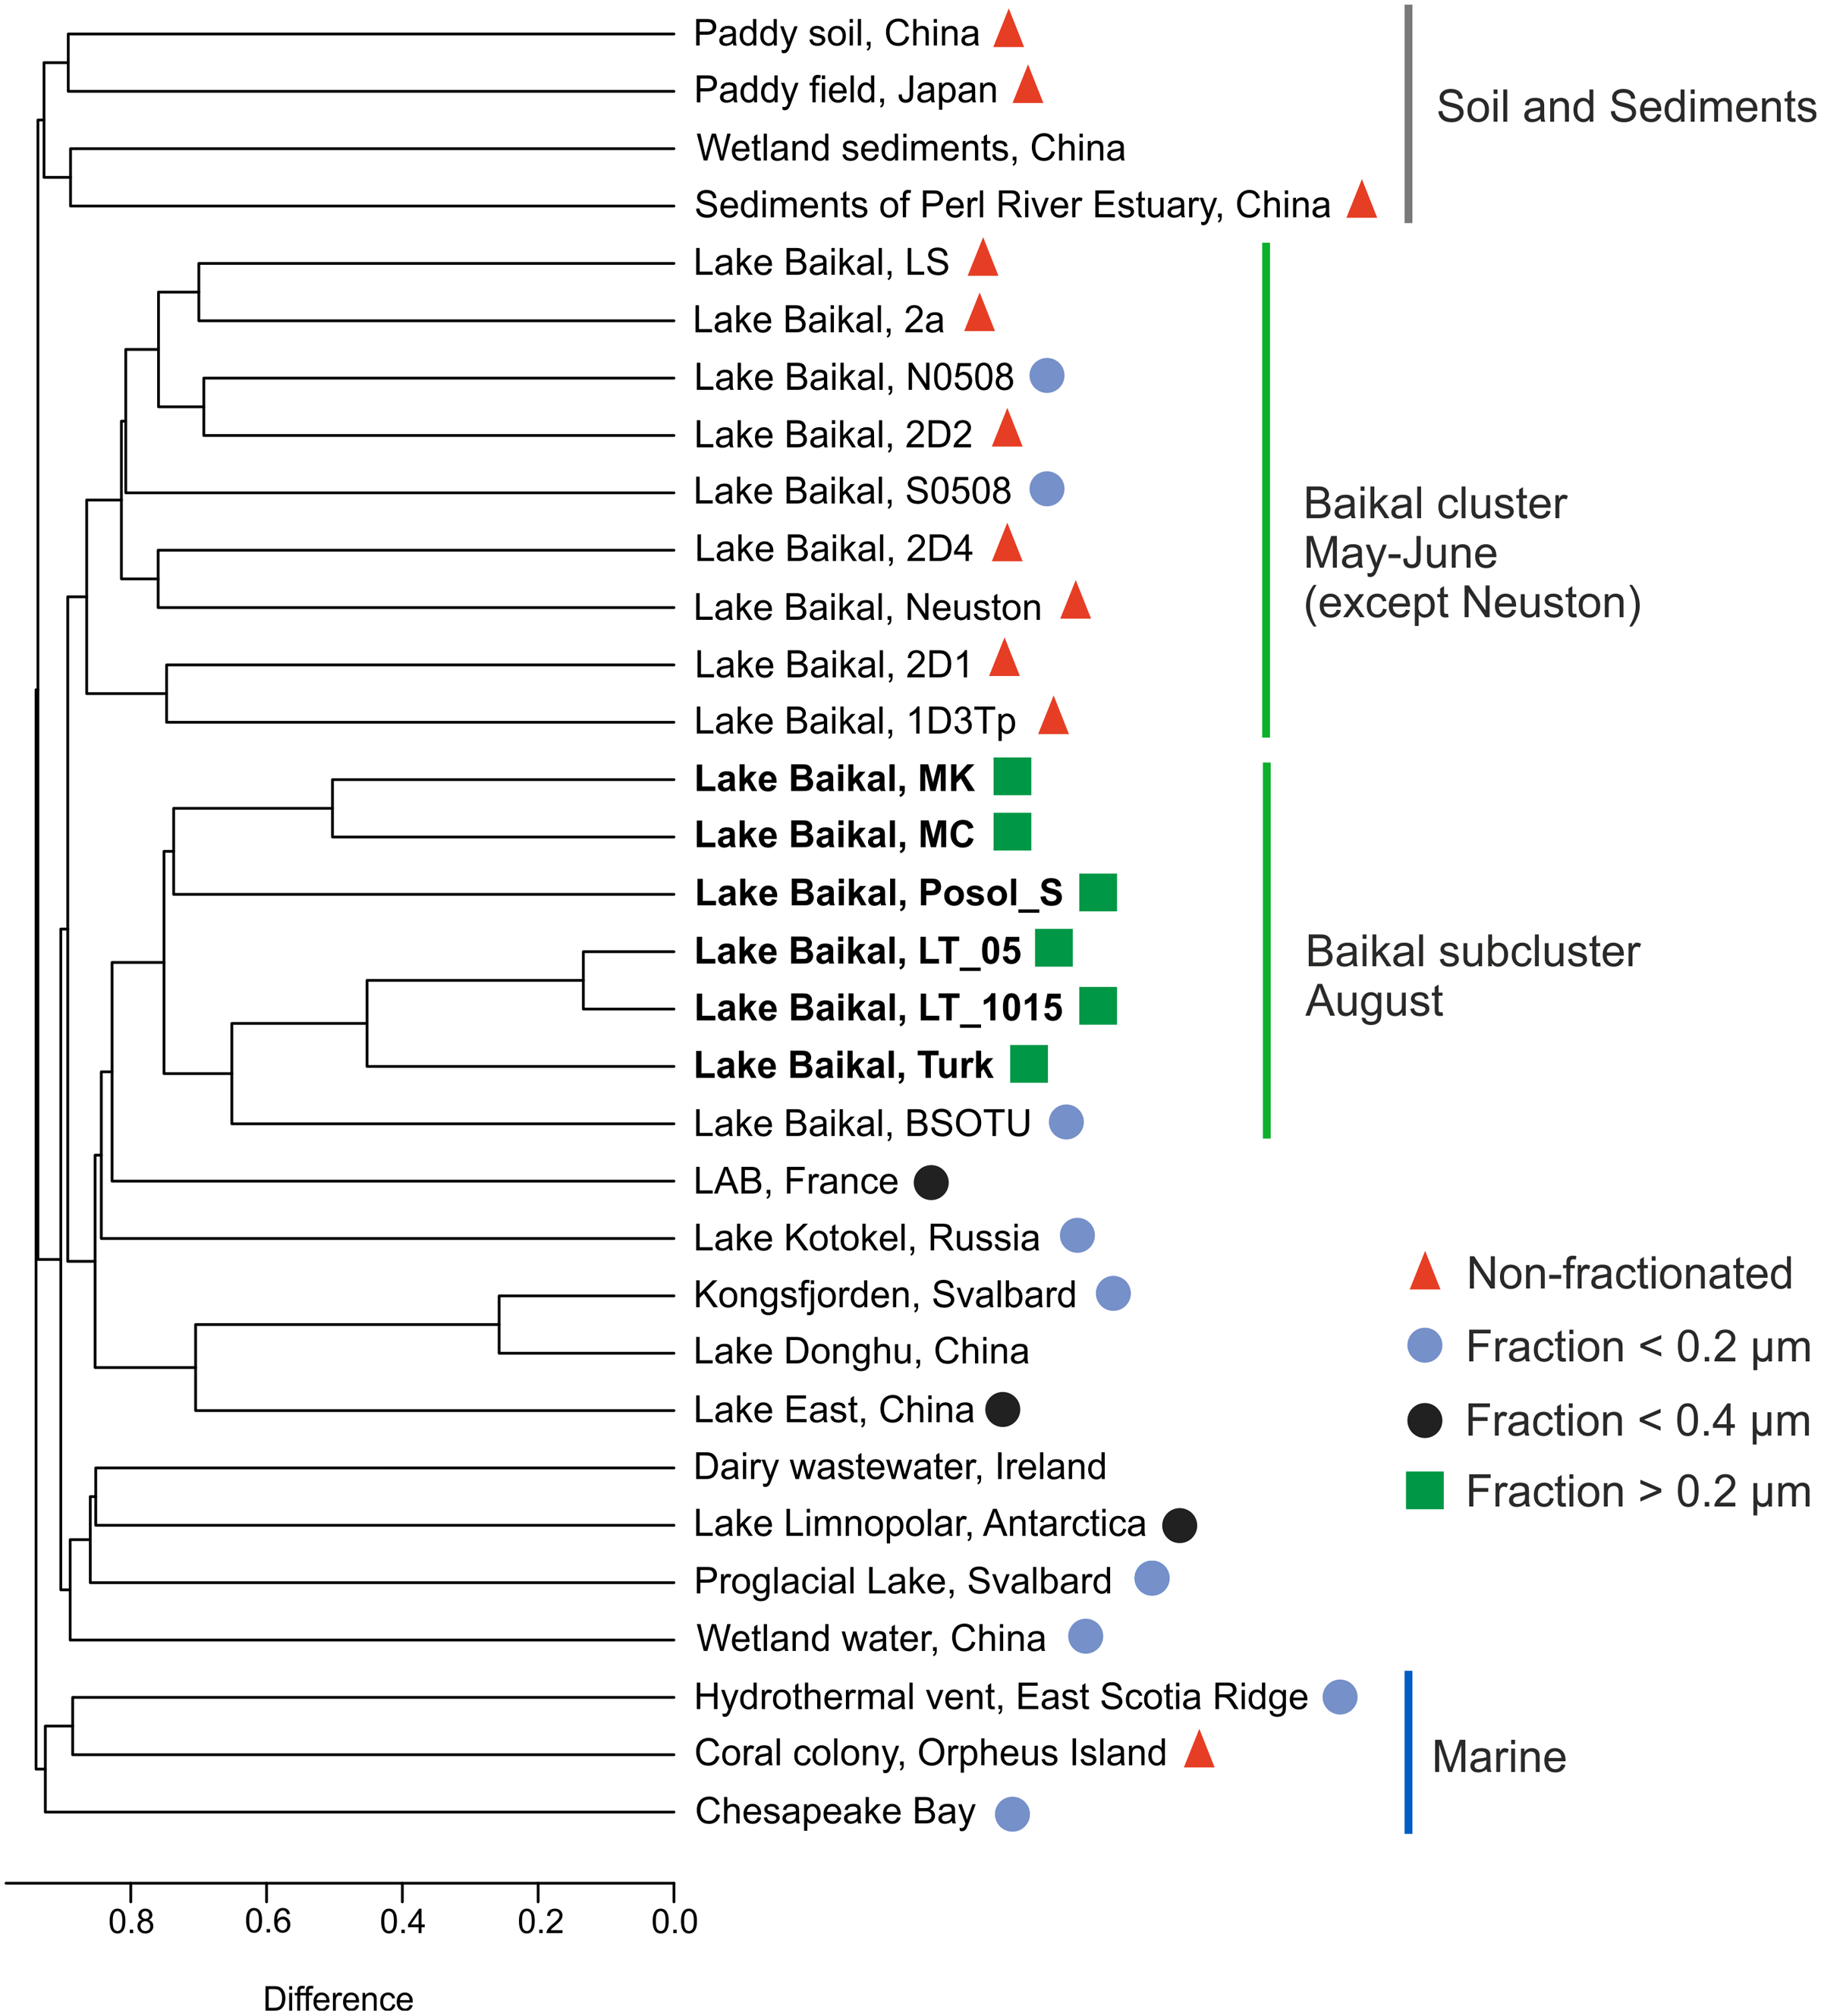
LT_05 and LT_1015, sequences from the samples collected at the central station of the Listvyanka settlement–the Tankhoy settlement section, layer from 0 + 5 m and from 10 + 15 m, are located closer to the site with the sequences from sample Turk as mentioned above, which is due to the mixing with pelagic waters. LT_05, LT_1015 and Turk form a shared cluster together with the sequences previously obtained from the pelagic zone of Lake Baikal (BSOTU) (Potapov et al., 2018). Three samples from shallow Baikal bays (MK, MC and Posol_S) group together, confirming clustering by the similar trophic conditions within the Baikal group.
The sequences from biofilms inhabiting stones (LS, 2a, 2D1, and 1D3Tp), neuston and sponges (2D2 and 2D4) (Potapov et al., 2020) form a shared cluster with planktonic g23 sequences from the pelagic zone of the southern and northern basins of Lake Baikal. Samples from Lake East, Lake Donghu and Kongsfjorden also form a shared cluster.
The greatest identity of the Baikal g23 is observed with the sample from the subalpine lakes Bourget (oligo-mesotrophic) and Annecy (oligotrophic) (Zhong & Jacquet, 2014), which we also previously indicated in our study (Potapov et al., 2018).
The sequences from the Arctic proglacial lakes and Lake Limnopolar are closer to the sequences from the dairy water (Ireland) and wetland water of China.
Discussion
Here, we studied bacteriophages associated with bacteria in a fraction greater than 0.2 µm from shallow bays, coastal zone and pelagic zone of Lake Baikal based on the analysis of the g23 gene. The sampling sites were chosen not only to carry out a comparative analysis in terms of geographical distance but also to reveal the differences in the pools of the g23 sequences selected in separate zones of Lake Baikal with varied trophic states.
The highest concentration of the total phosphorus, total nitrogen and chlorophyll a has been documented in shallow bays, which is expected for Lake Baikal because the maximum rate of formation of organic matter occurs here due to a large number of primary producers (cyanobacteria) (Watanabe & Drucker, 1999; Belykh & Sorokovikova, 2003). Temperature, in turn, is an important factor, influencing the growth rate of bacteria and having a significant positive effect on bacterial production (Straškrábová et al., 2005). An increase in temperature stimulates the development of phytoplankton, as well as enhances its photosynthetic activity, and the water body is enriched with dissolved organic matter. Previously, it has been shown that temperature controls the number of viruses, their diversity and the activity of hosts reviewed in Danovaro et al. (2011).
The pH level is slightly shifted to the alkaline side, which is typical for the waters of Lake Baikal. According to long-term observations, the pH value of water in Lake Baikal varies from 7.7 to 8.3, and during the intense vegetation of picoplanktonic cyanobacteria, it rises to 8.7 (Votintsev, 1961; Khodzher et al., 2018). As shown previously, a key factor in determining the infectivity of a virus is the pH value. For example, a low pH (<4) significantly reduces phage survival (Jurczak-Kurek et al., 2016).
In the network analysis, the sequences from Posolsk Sor occupy an intermediate position between planktonic (LT_05 and LT_1015) and coastal sites (Turk) as well as from shallow Mukhor Bay (MK and MC). The distribution pattern can be explained both by the dilution of water in Posolsk Sor with waters of rivers flowing into it and by its closed nature: two sandy spits separate the bay from the lake, and, in contrast to the well-flowing Mukhor Bay, it is connected with the lake only by a narrow 700 m long channel. With this connection, the sequences from Posolsk Sor are separated from the sequences from the Mukhor Bay, despite the close trophic state of these bays. At the same time, in the UPGMA analysis, they are rather included in the shared cluster with the samples from Mukhor Bay than with the sequences from the pelagic and coastal sites.
Late July and early August is a period of bloom of both pico- and nanoplanktonic cyanobacteria in Lake Baikal. Picocyanobacteria are found in huge numbers in Lake Baikal, reaching an abundance of 1.5 million cells/mL (Belykh & Sorokovikova, 2003). In August 2019, there was a mass development of diazotrophic cyanobacteria in the waters of the bays: Gloeotrichia echinulata bloomed in Posolsk Sor Bay, and the species of the genus Dolichospermum–in Mukhor Bay. Intensive vegetation of Dolichospermum species has been documented for a long time from June to September in all parts of Lake Baikal, with the maximum concentration of up to 10 million cells/L in bays (Popovskaya, 2000). In this regard, it is logical to assume the presence of cyanophages, natural regulators of the number of cyanobacteria. As mentioned above, many sequences belonged to cyanophages according to RefSeq, but phylogenetic analysis revealed only 12 sequences included in the Exo T-evens group (cyano- and pelagiphages). In addition to cyanophages, Pelagibacter phage HTVC008M (the family Myoviridae) infecting Candidatus Pelagibacter ubique (Alphaproteobacteria, freshwater SAR11) was the closest relative of the Baikal representatives of T4-phages. Previously, high synteny with Candidatus Pelagibacter ubique of the Baikal sequences was determined (Cabello-Yeves et al., 2018).
To assess the similarity of the Baikal sequences with marine phages, we added the g23 sequences of phages from station ALOHA (Luo et al., 2020), the sequences from viromes obtained from the coastal water of the eutrophic Osaka Bay and viromes (viral and bacterial fraction) of mesotrophic freshwater Lake Biwa. These sequences are absent in the NR and RefSeq databases, which narrows the range of geographic representation of virome communities in aquatic ecosystems. None of these sequences had 100% identity with OTUs obtained from the bacterial fraction of Lake Baikal, although, in general, the maximum identity was higher with the representatives from the ancient Lake Biwa (up to 89.1% identity in the bacterial fraction and up to 98% identity in the viral fraction) than with marine ones from station ALOHA and Osaka Bay (the maximum of 79.8% identity). This was expected because phages of freshwater ecosystems are more closely related to each other than to marine phages. The sequences from the ancient lakes Biwa and Baikal also did not form separate clusters in the phylogenetic tree but demonstrated high diversity, distributing throughout the tree. The arithmetic means percentage of the sequences from different ecotopes of Lake Baikal ranged from 56 to 66% with the sequences from viromes. We still cannot reliably answer the question of what ecotope is closer to these of that sequences. Perhaps, this may be due to the method of obtaining the sequences or to low numbers.
Overall, at this stage, it is difficult to identify, with which fraction the studied sequences are more similar: (i) the median identity at the amino acid level was slightly higher with the bacterial fraction from Lake Biwa (data not shown); (ii) slightly more unique sequences were detected from the bacterial fraction; (iii) based on blastp analysis, the highest level of identity was identified with the sequence from the viral fraction. In the future, to elucidate the similarities between the sequences from the ancient lakes, it is necessary to carry out a detailed comparison with other ancient lakes and obtain the g23 sequences by one method.
Noteworthy is a great number of similar sequences in samples from shallow areas of Lake Baikal (from 18.9 to 25.5%) and wetland sediments, which is much greater than in the samples from the pelagic zone of Lake Baikal and wetland sediments (from 2.9 to 3.3%). This possibly indicates the similar composition and conditions for the existence of bacterial communities from the Baikal bays (shallow water, high productivity and elevated temperature) and the shallow well-warmed productive wetland sediments.
A large number of the g23 sequences from lakes Bourget and Annecy similar to the studied Baikal sequences is likely owing to the identity of hydrophysical and hydrochemical parameters (altitude above sea level, total P, total N, nitrates and pH) of the lake, as we previously indicated in the analysis of the g23 sequences from the pelagic zone of Lake Baikal (Potapov et al., 2018). Only two sequences had 100% identity with the Baikal sequences (from Lake Annecy (France) and wetland water (China)), which casts doubt on the “everything is everywhere, but the environment selects” theory, probably, because viruses quickly mutate.
According to Chow & Suttle (2015), four models define biogeography of marine microbiomes and can be applied to viruses: (i) local or regional factors do not determine the community composition; (ii) the conditions of the local habitat determine the community structure where differences in taxa determine the changes in the community structure (i.e., everything is everywhere but the environment selects for the viability of a community structure); (iii) community structure is determined by the extent, to which taxa can migrate to a particular location (i.e., dispersal limitation); (iv) dispersal limitation and environmental conditions co-regulate community composition. The UPGMA analysis has revealed that viral diversity does not follow the latitudinal and longitudinal gradients, and the geographical distance does not influence the composition of bacteriophages. In our case, the fourth model, “the limitation of distribution and environmental conditions determine the community composition”, is the most applicable. Because Lake Baikal was formed separately for many millions of years, determining the composition and the structure of aquatic organisms, this conclusion confirms the separate formation of the viral g23 communities in Lake Baikal and, possibly, endemism of bacteriophages in the Earth’s oldest lake. Subcluster Baikal (August), irrespective of the fractions (bacterial or viral), includes the samples taken in August, which coincide with the cyanobacterial bloom period and likely testify to the seasonal division of the clusters. Cluster Baikal (May to June), in addition to neuston, consisted of the samples taken during the spring homothermy when the water column of the lake is actively mixing, and diatoms dominate the plankton (Bondarenko et al., 2019). Neuston is a very specific biotope, and its bacterial and viral composition differs significantly from the water column (Galach’yants et al., 2017; Drucker et al., 2020). Perhaps, for this reason, it was not included in Baikal subcluster. Notably, subcluster consists of the sequences obtained by high throughput sequencing, and Baikal cluster–of the sequences obtained by Sanger sequencing. Possibly, a method of obtaining sequences to some extent affects the results; however, we believe that it does not determine the nature of clustering. The marine sample taken from Kongsfjorden appeared to be in the clade with eutrophic freshwater lakes. Kongsfjorden is exposed to the fresh water influx from several fronts of glaciers of the Svalbard archipelago (Hagen et al., 2003), causing its desalination and likely bringing bacteria and viruses from the land along with meltwater. Previously, it has been shown that some bacterial sequences from glaciers demonstrate a close identity with those from soils of the temperate zone and humic lakes, i.e., represent cosmopolitan taxa (Edwards et al., 2011). The sample was taken from the glacier’s surface 2 km from the shore, and the mixing of phage communities between glacial and marine habitats was expected, taking into account their close relationship (Bellas & Anesio, 2013). In general, the main characteristic of the ecosystem (marine, soil or freshwater) substantiates the pattern of distribution of the samples in the UPGMA analysis. We did not include the sequences from viromes in the UPGMA analysis because they were compared to our sequences via blastp analysis and, perhaps, the most distant ones were not detected, i.e., they may not represent the full range of diversity.
In the future, to confirm the “uniqueness” of the Baikal g23 sequences, the diversity of T4-bacteriophages in lakes close in age and origin should be compared, for example, Lake Hovsgol (Mongolia) that is close to Lake Baikal, whose age is ca. 5 million years, or geographically very remote Lake Tanganyika (Africa), the age of which is ca. 12 million years (Padilla, 2007; Hampton et al., 2018). Analysis of viral diversity can elucidate the evolution and formation of viral diversity in the lakes that have been isolated for many millions of years.
Conclusions
In this study, we obtained the g23 sequences of planktonic bacteriophages from two shallow bays, as well as coastal and pelagic sites of Lake Baikal, which are part of the bacterial fraction. The g23 sequences were highly diverse and differed from those in other ecosystems. Most sequences from this study had the cultivated closest relatives (RefSeq database) among cyanophages based on blastp analysis. In the network analysis, the sample from Posolsk Sor occupied the intermediate position between the pelagic and coastal samples as well as the sample from Mukhor Bay, again indicating a close relationship between viruses and hosts because different species of cyanobacteria were present in these bays. The sequences from marine viromes differed more than those from the freshwater Lake Biwa, which testifies to the close relationship of freshwater viruses and their difference from marine ones. The formation of clusters in the UPGMA analysis allowed us to conclude that the g23 sequences of phages from shallow bays are rather similar to each other than to the sequences from the coastal and pelagic sites of Lake Baikal, i.e., they cluster by the productivity of the sites. In the global UPGMA analysis, all sequences from Lake Baikal formed two clusters depending on the season and were different from the sequences obtained from the seas, soil and sediments, which may indicate the separate formation of viral community in the ancient lake.