
Characterization and expression analysis of the SPL gene family during floral development and abiotic stress in pecan (Carya illinoinensis)
- Published
- Accepted
- Received
- Academic Editor
- Fabio Nogueira
- Subject Areas
- Agricultural Science, Bioinformatics, Developmental Biology, Molecular Biology, Plant Science
- Keywords
- Carya illinoinensis, SPL gene, Phylogenetic analysis, Gene promoter, Flower development, Abiotic stress
- Copyright
- © 2021 Wang et al.
- Licence
- This is an open access article distributed under the terms of the Creative Commons Attribution License, which permits unrestricted use, distribution, reproduction and adaptation in any medium and for any purpose provided that it is properly attributed. For attribution, the original author(s), title, publication source (PeerJ) and either DOI or URL of the article must be cited.
- Cite this article
- 2021. Characterization and expression analysis of the SPL gene family during floral development and abiotic stress in pecan (Carya illinoinensis) PeerJ 9:e12490 https://doi.org/10.7717/peerj.12490
Abstract
SQUAMOSA promoter binding protein-like (SPL) genes are a type of plant-specific transcription factors that play crucial roles in the regulation of phase transition, floral transformation, fruit development, and various stresses. Although SPLs have been characterized in several model species, no systematic analysis has been studied in pecans, an important woody oil tree species. In this study, a total of 32 SPL genes (CiSPLs) were identified in the pecan genome. After conducting phylogenetic analysis of the conserved SBP proteins from Arabidopsis, rice, and poplar, the CiSPLs were separated into eight subgroups. The CiSPL genes within the same subgroup contained very similar exon-intron structures and conserved motifs. Nine segmentally duplicated gene pairs in the pecan genome and 16 collinear gene pairs between the CiSPL and AtSPL genes were identified. Cis-element analysis showed that CiSPL genes may regulate plant meristem differentiation and seed development, participate in various biological processes, and respond to plant hormones and environmental stresses. Therefore, we focused our study on the expression profiles of CiSPL genes during flower and fruit development. Most of the CiSPL genes were predominantly expressed in buds and/or female flowers. Additionally, quantitative real time PCR (qRT-PCR) analyses confirmed that CiSPL genes showed distinct spatiotemporal expression patterns in response to drought and salt treatments. The study provides foundation for the further exploration of the function and evolution of SPL genes in pecan.
Introduction
SQUAMOSA promoter binding protein-like (SPL) genes make up a unique transcription factor family that widely exists in green plants and plays a key role during floral development and stress response. Two SPLs originally isolated from snapdragon (Antirrhinum majus) were named SBP1 and SBP2 (Klein, Saedler & Huijser, 1996). With the recent completion of the whole genome, many members of the SPL gene family have been identified in various species such as rice, Arabidopsis, Chinese cabbage, tomato, soybean, citrus, apple, grape, jujube, and chestnut (Yang et al., 2008; Salinas et al., 2012; Tripathi et al., 2017; Hou et al., 2013; Tan et al., 2015; Shalom et al., 2015; Shao et al., 2017; Li et al., 2013; Chen et al., 2019). Each SPL gene contains a highly conserved SBP domain that is usually the size of about 78 amino acids and includes a nuclear localization signal and two zinc fingers (Yamasaki et al., 2004). SPL members function not only as transcription factors, but also as miR156/157 targets that form a complex gene regulatory network (Jia et al., 2018).
SPLs are involved in plant development processes, including shoot and leaf morphogenesis, floral organ development, flowering, and fruit ripening (Preston & Hileman, 2013; Xu et al., 2016; Yu et al., 2015; Wang et al., 2016; Gou et al., 2011). In Arabidopsis, six SPLs (SPL2, -9, -10, -11, -13, and -15) regulate various processes during shoot and root development (Wu et al., 2009; Wang et al., 2008; Stief et al., 2014; Yu et al., 2010; Usami et al., 2009; Yu et al., 2015). However, SPL3, -4, and -5 may promote floral meristem identity (Wu & Poethig, 2006; Yamaguchi et al., 2009; Wang, Czech & Weigel, 2009; Cardon et al., 1997) and Arabidopsis SPLs directly activate flower meristem specific genes (LFY, FUL, and AP1) to promote the transition from vegetative to reproductive growth (Yamaguchi et al., 2009). Similar to Arabidopsis, the single AtSPL3/4/5 ortholog AmSBP1 in snapdragon (Antirrhinum majus) was found to be involved in the initiation of flower development after the switch to inflorescence development (Klein, Saedler & Huijser, 1996).
SPL genes are also involved in fruit development. Studies have shown that AtSPL8 affects the development of pollen sacs (Unte et al., 2003). In rice, it has been found that OsSPL13 and OsSPL16 regulate grain size and shape (Si et al., 2016; Wang et al., 2012a; Wang et al., 2012b). OsSPL13 overexpression in rice not only increases the rice grain size, but also the spike length, the number of grains per spike (significantly), and the ultimate rice yield. OsSPL16 gene overexpression promotes endosperm cell proliferation and grain filling, and increases grain width, grain weight, and yield.
Additionally, SPL genes play important roles in abiotic stress response. AtSPL1 and AtSPL12 participate in the regulation of thermotolerance during reproductive growth in Arabidopsis thaliana, and AtSPL1 and AtSPL2 overexpression enhances inflorescence thermotolerance (Chao et al., 2017). OsSPL10 plays dual roles in trichome formation and salt tolerance in rice: it has a negative effect on salt stress and a positive effect on the formation of trichomes (Lan et al., 2019). MsSPL8 gene down-regulation improves drought and salt tolerance in transgenic alfalfa (Gou et al., 2018). Birch SPL9 (BpSPL9) was expressed in roots and leaves under NaCl and PEG6000 stress (Ning et al., 2017). Physiological and enzymological analyses of BpSPL9 transgenic lines in birch showed that ROS scavenging improved under salt and drought stress and BpSPL9 gene overexpression enhanced salt and drought tolerance (Ning et al., 2017). The Chinese wild Vitis species SBP-box gene (VpSBP16) showed enhanced tolerance to drought and salt stress in transgenic Arabidopsis by regulating ROS and SOS signal networks (Hou et al., 2018). Some ZmSPL genes were induced by various environmental stimuli, such as cold, drought, and salinity (Mao et al., 2016).
Pecan (Carya illinoinensis), a hickory of the walnut family, is an important woody oil tree species. The oil content in its seed kernel is more than 70%, with unsaturated fatty acids making up 97% of that amount (Huang et al., 2017). The market demand for pecans is steadily increasing, indicating that the pecan industry still has a huge market prospect. However, pecan has a long vegetative growth period, meaning late flowering and low yields, which has seriously restricted the development of its industry. In order to improve the yield and benefit of pecan, it is necessary to regulate the balance between vegetative and reproductive growth, initiate the expression of flowering factors, and promote flower bud differentiation. It is well known that SPL genes regulate inflorescence and fruit development along with signal transduction and physiological and biochemical processes. Therefore, studying the function of CiSPL genes is of great significance in research on the flowering mechanism of pecan. In our study, we identified 32 CiSPL genes from pecan and performed a comprehensive analysis of its phylogenetic relationships, collinearity, gene structure, conserved motif, and cis-acting regulatory elements. The expression patterns of 32 CiSPL genes at different stages of female flower bud differentiation and fruit development, as well as in response to drought and salt stress treatment, were detected by qRT-PCR. Our research provides a comprehensive analysis of the CiSPL gene family and will be helpful in the further study of pecan SPL gene evolution and function.
Materials & Methods
Identification and characterization of SPL genes in pecan
The genome database, protein sequence, and pecan CDS sequences were downloaded from the Hardwood Genomics Project (https://www.hardwoodgenomics.org/) (Huang et al., 2019). The protein sequences of Arabidopsis, rice, and poplar SPL gene families were downloaded from the Plant Transcription Factor Database (PlantTFDB). The protein domain sequences of SPLs from the other three species were used as query sequences to blast the pecan proteome data with Local Blast P retrieval, and the E value was set to 1e−6. The blast results were sorted out to remove the repetitive sequence, and the NCBI-CDD (https://www.ncbi.nlm.nih.gov/cdd) and online software Pfam (http://pfam.xfam.org/) were used to further verify. The physical and chemical properties were analyzed using the online software Expasy (https://web.expasy.org/protparam/), and subcellular localization was predicted using Wolf psort (https://www.genscript.com/tools/wolf-psort).
Classification and phylogenetic tree construction of the SPL gene family
Bioedit software and the conserved domain sequences of SBP proteins in pecan were used to carry out multiple sequence alignments. For the evolutionary relationship, the candidate SPL protein domains of pecan, rice, Arabidopsis, and poplar were analyzed for multiple sequence alignment using ClustalW. Then, the comparison results were analyzed using MEGA 5.0 with a maximum likelihood (ML) (bootstrap=500) to construct the phylogenetic tree. Another phylogenetic tree was constructed using the SPL domains of all pecan protein sequences for further analysis via the same method.
Gene duplication and Ka/Ks value calculations
The collinearity (synteny) in the pecan, and between pecan and Arabidopsis, were analyzed using MCScanX software, and the E-value was set as 1 × 10⁻⁵, in accordance with previous studies (Wang et al., 2012). The ratio of nonsynonymous to synonymous nucleotide substitutions (Ka/Ks) was evaluated among segmentally duplicated gene pairs to detect the selection mode. First, the nucleotide coding sequences (CDS) of the CiSPL genes were aligned using the Muscle program with default options in MEGA 5.0 according to the protein sequence alignments. The Ka/Ks was then calculated based on multiple sequence alignments using MEGA 5.0 (Hu et al., 2019).
SPL gene structure and conserved motif analysis
GSDS software was employed to analyze gene structure. Simultaneously, we used the online software MEME (http://meme-suite.org/tools/meme) to predict and analyze the protein conservative motif of the SPL protein sequences. The MEME parameters were set as follows: maximum number of motifs, 20; motifs width: 6-60.
Category and number of cis-acting elements in CiSPL promoters
We extracted 1,500 bp promoter regions upstream of the translation start codon (ATG) of the CiSPL genes from the pecan genome website, which we labeled as promoter fragments. The cis-acting elements of each CiSPL were identified using the online program PlantCARE (Lescot et al., 2002).
Expression profiles of CiSPLs at various stages of flower and fruit development
In order to explore the role of CiSPLs in pecan growth and development, a comprehensive expression profile analysis was carried out. Normalized expression levels during female flower development were retrieved from our previous RNA-Seq data (Wang et al., 2019), and the CiSPL gene expression data in fruit development was retrieved from RNA transcriptome data (Bioproject ID PRJNA435846). The calculated fragments per kb of exon per million mapped reads (FPKM) were used to normalize the gene expression values (Huang et al., 2019). Next, the log2(FPKM) values of the CiSPL genes were used to generate heat maps with the software MEV4.9.
Plant materials and stress treatment
The gene expression patterns of 32 CiSPLs were detected in the leaves of pecan seedlings at the Institute of Botany, Jiangsu province and the Chinese Academy of Sciences. The pecan seedlings were cultivated from the seeds with the same size of ‘Pawnee’ and grown in fields under natural conditions. At the four-true-leaf stage, uniform and healthy pecan seedlings were transferred into a greenhouse. After being cultured in Hoagland’s solution for seven days, pecan seedlings were subjected to a variety of abiotic stresses. We added 10% polyethylene glycol (PEG) 6000 to the solution for drought treatment, and 3‰ (w/v) NaCl to the nutrient solution for salt treatment (Mo et al., 2020). Young leaves from the stress-treated plants were collected 0, 6, 12, and 24 h after treatment. All samples were immediately frozen in liquid nitrogen and stored at −80 °C until RNA extraction. The untreated pecan seedlings were used as the control groups.
RNA extraction and real time PCR analysis
Total RNA was isolated using the Universal Plant RNA Extraction Kit (BioTeke, Beijing, China), and reverse transcribed to cDNA with the PrimeScript™ RT reagent Kit (TaKaRa, Kyoto, Japan). The gene-specific primers of 32 CiSPLs were designed using CDS sequences and Primer 5.0 software, and all the primers are listed in Table S1. qRT-PCR was performed on ABI StepOnePlus (Thermo Fisher Scientific, Waltham, MA, USA) with SYBR Green Realtime PCR Master Mix (Thermo Fisher). Each reaction volume was 20 µL, and included 1 µL of diluted cDNA template, 0.4 µL of each gene forward and reverse primer, 10 µL of SYBR Mix, 8.2 µL of ddH2O, and 0.4 µL of ROX Reference Dye. The PCR reaction procedure was as follows: 95 °C for 30s, followed by 40 cycles at 95 °C for 5 s, 60 °C for 34 s, and the dissolution curve reaction procedure (95 °C for 15 s, 60 °C for 1 min, and 95 °C for 15 s). The pecan actin gene was used as the internal reference gene (Zhang et al., 2016). The relative expression level for all CiSPL genes was calculated using the 2−ΔΔCt method (Livak & Schmittgen, 2001). ANOVA Duncan analysis was performed for significant difference analysis using SPSS 21.0 software.
Results
Identification and annotation of SPLs in pecan
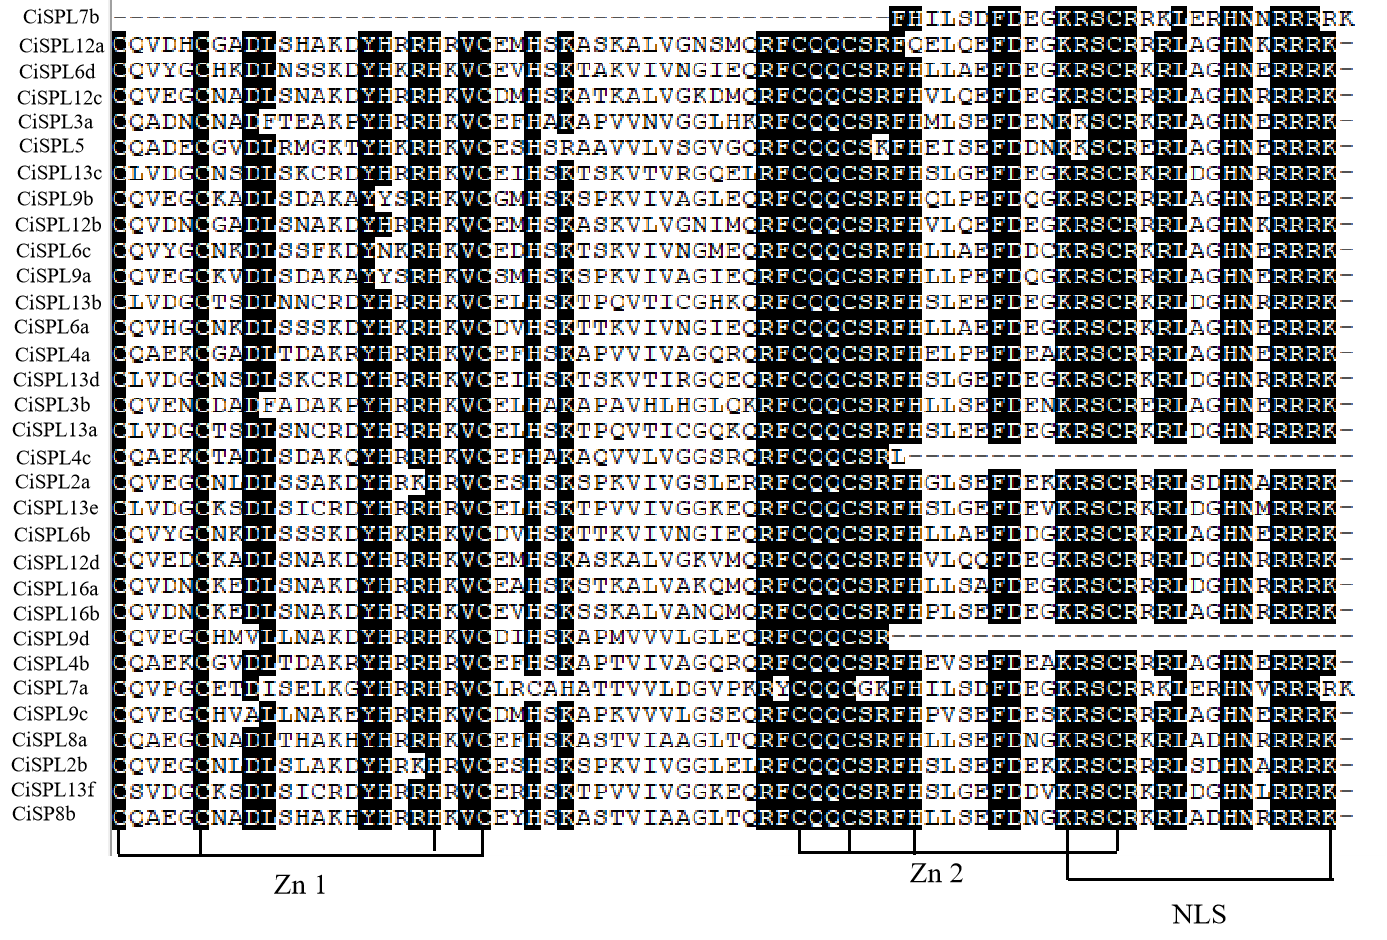
Referencing the SPL protein sequences of Arabidopsis, rice, and poplar, we searched all assumptive SPL genes of pecan using Local BLAST and BioEdit software. Through Pfam and NCBI domain analysis, we identified 32 candidate SPL genes (Table 1). Previously, Wu et al. (2019) found 30 CiSPL genes in the pecan genome. However, in this study, we found two CiSPL genes (CiSPL4c, CIL1118S0019; CiSPL9d, CIL1312S0023) in addition to the previously identified 30 CiSPL genes. The SBP box domains of the 32 CiSPL proteins were aligned and analyzed using BioEdit software (Table. S1). All CiSPLs had two zinc finger-like structures and NLS fragments except for CiSPL4c, CiSPL7b, and CiSPL9d, which indicated that the SBP domain was conserved in pecan. Further, the CiSPLs were named by orthology with Arabidopsis SPLs. The characterizations of CiSPL proteins were analyzed using the ProtParam tool. The lengths of the 32 CiSPL proteins ranged from 108 (CiSPL4c) to 1,071 (CiSPL16a), with molecular weights ranging from 12.184 kDa to 118.955 kDa, and theoretical isoelectric points from 5.25 to 9.36. This range of variations means that different CiSPL proteins may operate in different microenvironments. Most CiSPL genes were located in the nucleus, only two genes (CiSPL4c and CiSPL7b) were located in the chloroplast.
| Name | Gene Id | Gene location | Group | CDS length (bp) | Size (aa) | Protein MW (KDa) | PI | Loc |
|---|---|---|---|---|---|---|---|---|
| CiSPL2a | CIL1138S0014 | scaffold87792: 121998: 128864.+ | V | 1041 | 346 | 38.216 | 8.73 | nucl |
| CiSPL2b | CIL1486S0026 | scaffold122014: 339920: 354017.+ | V | 1398 | 465 | 51.780 | 8.28 | nucl |
| CiSPL3a | CIL0893S0386 | scaffold68792: 4195186: 4201886.- | VI | 444 | 147 | 16.669 | 7.05 | nucl |
| CiSPL3b | CIL1086S0071 | scaffold82459: 946930: 952277.- | VI | 456 | 151 | 17.445 | 7.66 | nucl |
| CiSPL4a | CIL1078S0073 | scaffold81904: 533329: 534617.+ | VI | 597 | 198 | 22.092 | 9.19 | nucl |
| CiSPL4b | CIL1361S0046 | scaffold109903: 544411: 546249.+ | VI | 621 | 206 | 22.945 | 9.12 | nucl |
| CiSPL4c | CIL1118S0019 | scaffold85792: 413380: 413706.- | VI | 327 | 108 | 12.184 | 8.96 | chlo |
| CiSPL5 | CIL0909S0046 | scaffold70015: 471192: 473177.- | VI | 666 | 221 | 25.254 | 5.25 | nucl |
| CiSPL6a | CIL1066S0023 | scaffold81126: 457953: 462330. + | IV | 1596 | 531 | 58.830 | 7.07 | nucl |
| CiSPL6b | CIL1182S0013 | scaffold93126: 195544: 201022.+ | IV | 1584 | 527 | 58.235 | 7.88 | nucl |
| CiSPL6c | CIL1032S0023 | scaffold77681: 289083: 314501.+ | IV | 1629 | 542 | 59.410 | 6.81 | nucl |
| CiSPL6d | CIL0248S0001 | scaffold22449: 2215: 12505.- | IV | 1683 | 560 | 62.434 | 6.33 | nucl |
| CiSPL7a | CIL1369S0030 | scaffold110459: 462859: 474068.- | I | 2385 | 794 | 89.169 | 6.90 | nucl |
| CiSPL7b | CIL0037S0017 | scaffold3226: 140675: 158469.+ | I | 1932 | 643 | 71.923 | 8.30 | chlo |
| CiSPL8a | CIL1479S0028 | scaffold121347: 434913: 437667.- | III | 942 | 313 | 35.019 | 8.99 | nucl |
| CiSPL8b | CIL1609S0008 | scaffold134903: 248011: 250331.- | III | 1089 | 362 | 40.668 | 9.17 | nucl |
| CiSPL9a | CIL1047S0099 | scaffold79681: 1350803: 1355813.+ | VIII | 1146 | 381 | 40.575 | 9.20 | nucl |
| CiSPL9b | CIL0987S0054 | scaffold74570: 467811: 471556.+ | VIII | 1134 | 377 | 40.316 | 9.36 | nucl |
| CiSPL9c | CIL1479S0027 | scaffold121347: 418158: 424186.+ | VIII | 1194 | 397 | 43.682 | 6.85 | nucl |
| CiSPL9d | CIL1312S0023 | scaffold104459: 174377: 175048.- | VIII | 672 | 223 | 24.786 | 7.67 | nucl |
| CiSPL12a | CIL0118S0017 | scaffold10448: 265972: 274738.- | II | 3012 | 1003 | 111.793 | 5.58 | nucl |
| CiSPL12b | CIL1028S0077 | scaffold77237: 1437361: 1446283.- | II | 3024 | 1007 | 111.896 | 6.24 | nucl |
| CiSPL12c | CIL0317S0003 | scaffold31337: 12553: 21322.+ | II | 3111 | 1036 | 115.511 | 7.02 | nucl |
| CiSPL12d | CIL1198S0043 | scaffold95015: 592578: 602173.+ | II | 2973 | 990 | 109.897 | 6.86 | nucl |
| CiSPL13a | CIL1101S0006 | scaffold84015: 175449: 179291.- | VII | 1179 | 392 | 43.110 | 6.73 | nucl |
| CiSPL13b | CIL1064S0113 | scaffold81015: 1301406: 1305416.- | VII | 1170 | 389 | 42.978 | 8.73 | nucl |
| CiSPL13c | CIL0984S0053 | scaffold74459: 902792: 906703.- | VII | 963 | 320 | 34.966 | 9.09 | nucl |
| CiSPL13d | CIL1086S0008 | scaffold82459: 85681: 87820.+ | VII | 972 | 323 | 35.399 | 8.93 | nucl |
| CiSPL13e | CIL1145S0047 | scaffold88681: 453966: 456433.+ | VII | 1149 | 382 | 41.903 | 7.99 | nucl |
| CiSPL13f | CIL1515S0030 | scaffold124569: 381271: 383997.- | VII | 1173 | 390 | 43.411 | 6.07 | nucl |
| CiSPL16a | CIL1230S0089 | scaffold97903: 847870: 854123.- | II | 3216 | 1071 | 118.955 | 8.24 | nucl |
| CiSPL16b | CIL1294S0032 | scaffold103237: 455137: 460718.+ | II | 3204 | 1067 | 118.346 | 7.70 | nucl |
Notes:
- AA
-
amino acid residues
- MW
-
molecular weight
- pI
-
theoretical isoelectric point
- Loc
-
subcellular location
- Nucl
-
nucleus
- Chlo
-
chloroplast
Cluster analysis and phylogenetic tree construction of SPL proteins in pecan
In order to explore the evolutionary relationships of SPL proteins in pecan and other species, we used the ML method on the SBP domains of 95 SPL proteins from pecan (32), Arabidopsis (17), rice (18), and poplar (28) to construct the phylogenetic tree (Fig. 1). In order to better understand the phylogenetic relationship of the SPL members, we also performed multiple alignment and phylogenetic tree analyses on the core SBP domains of all CiSPLs and AtSPLs. The 32 CiSPL genes were divided into eight subgroups (from I to VIII), described previously, based on phylogenetic analysis and SBP domain alignment (Fig. 2). The subgroups II, VI, and VII had the largest number of members (six). Each subgroup contained at least one SPL gene from the other three species (Arabidopsis, rice, and poplar). Subgroup I contained one SPL gene from Arabidopsis and rice, and two from pecan and poplar, suggesting the functional conservation of the SPL7 gene in plants. CiSPL genes showed high similarity with the poplar orthologs, and had the most similar number of genes in each subgroup. The SBP domain was relatively conservative in different species.
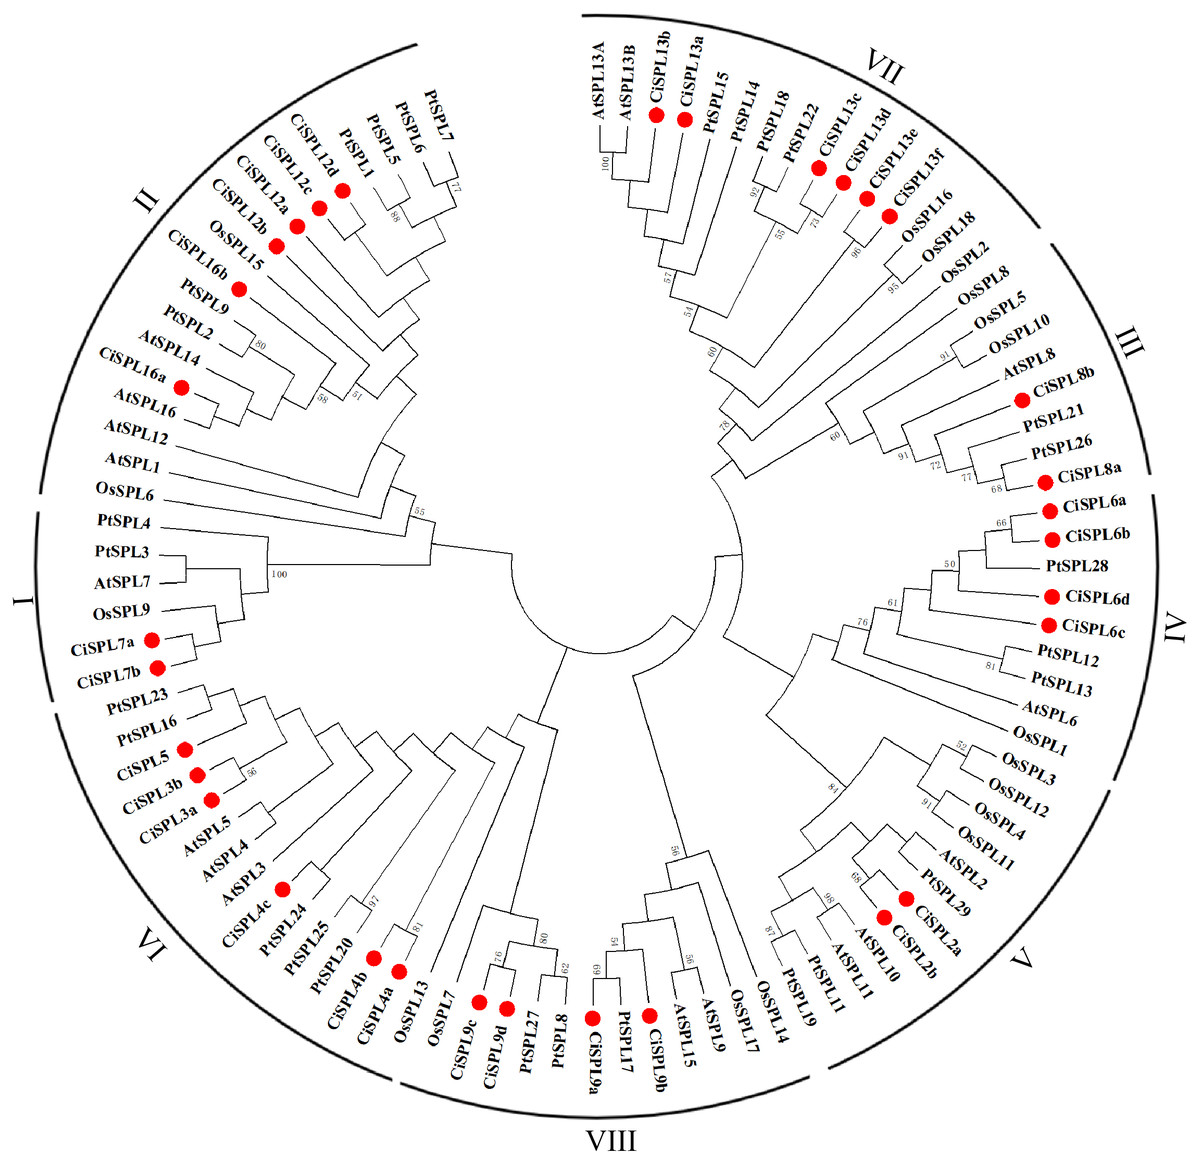
Figure 1: Phylogenetic analysis of the SPL family in pecan, Arabidopsis, rice, and poplar.
Phylogenetic tree of conserved SPL domains from pecan (CiSPL), Arabidopsis (AtSPL), rice (OsSPL), and poplar (PtSPL). The tree was constructed using MEGA 5.0 software with the Maximum Likelihood (ML) method, and bootstrap values were calculated with 500 replicates. The subgroups are shown outside of the tree. Bootstrap values greater than 50% are displayed.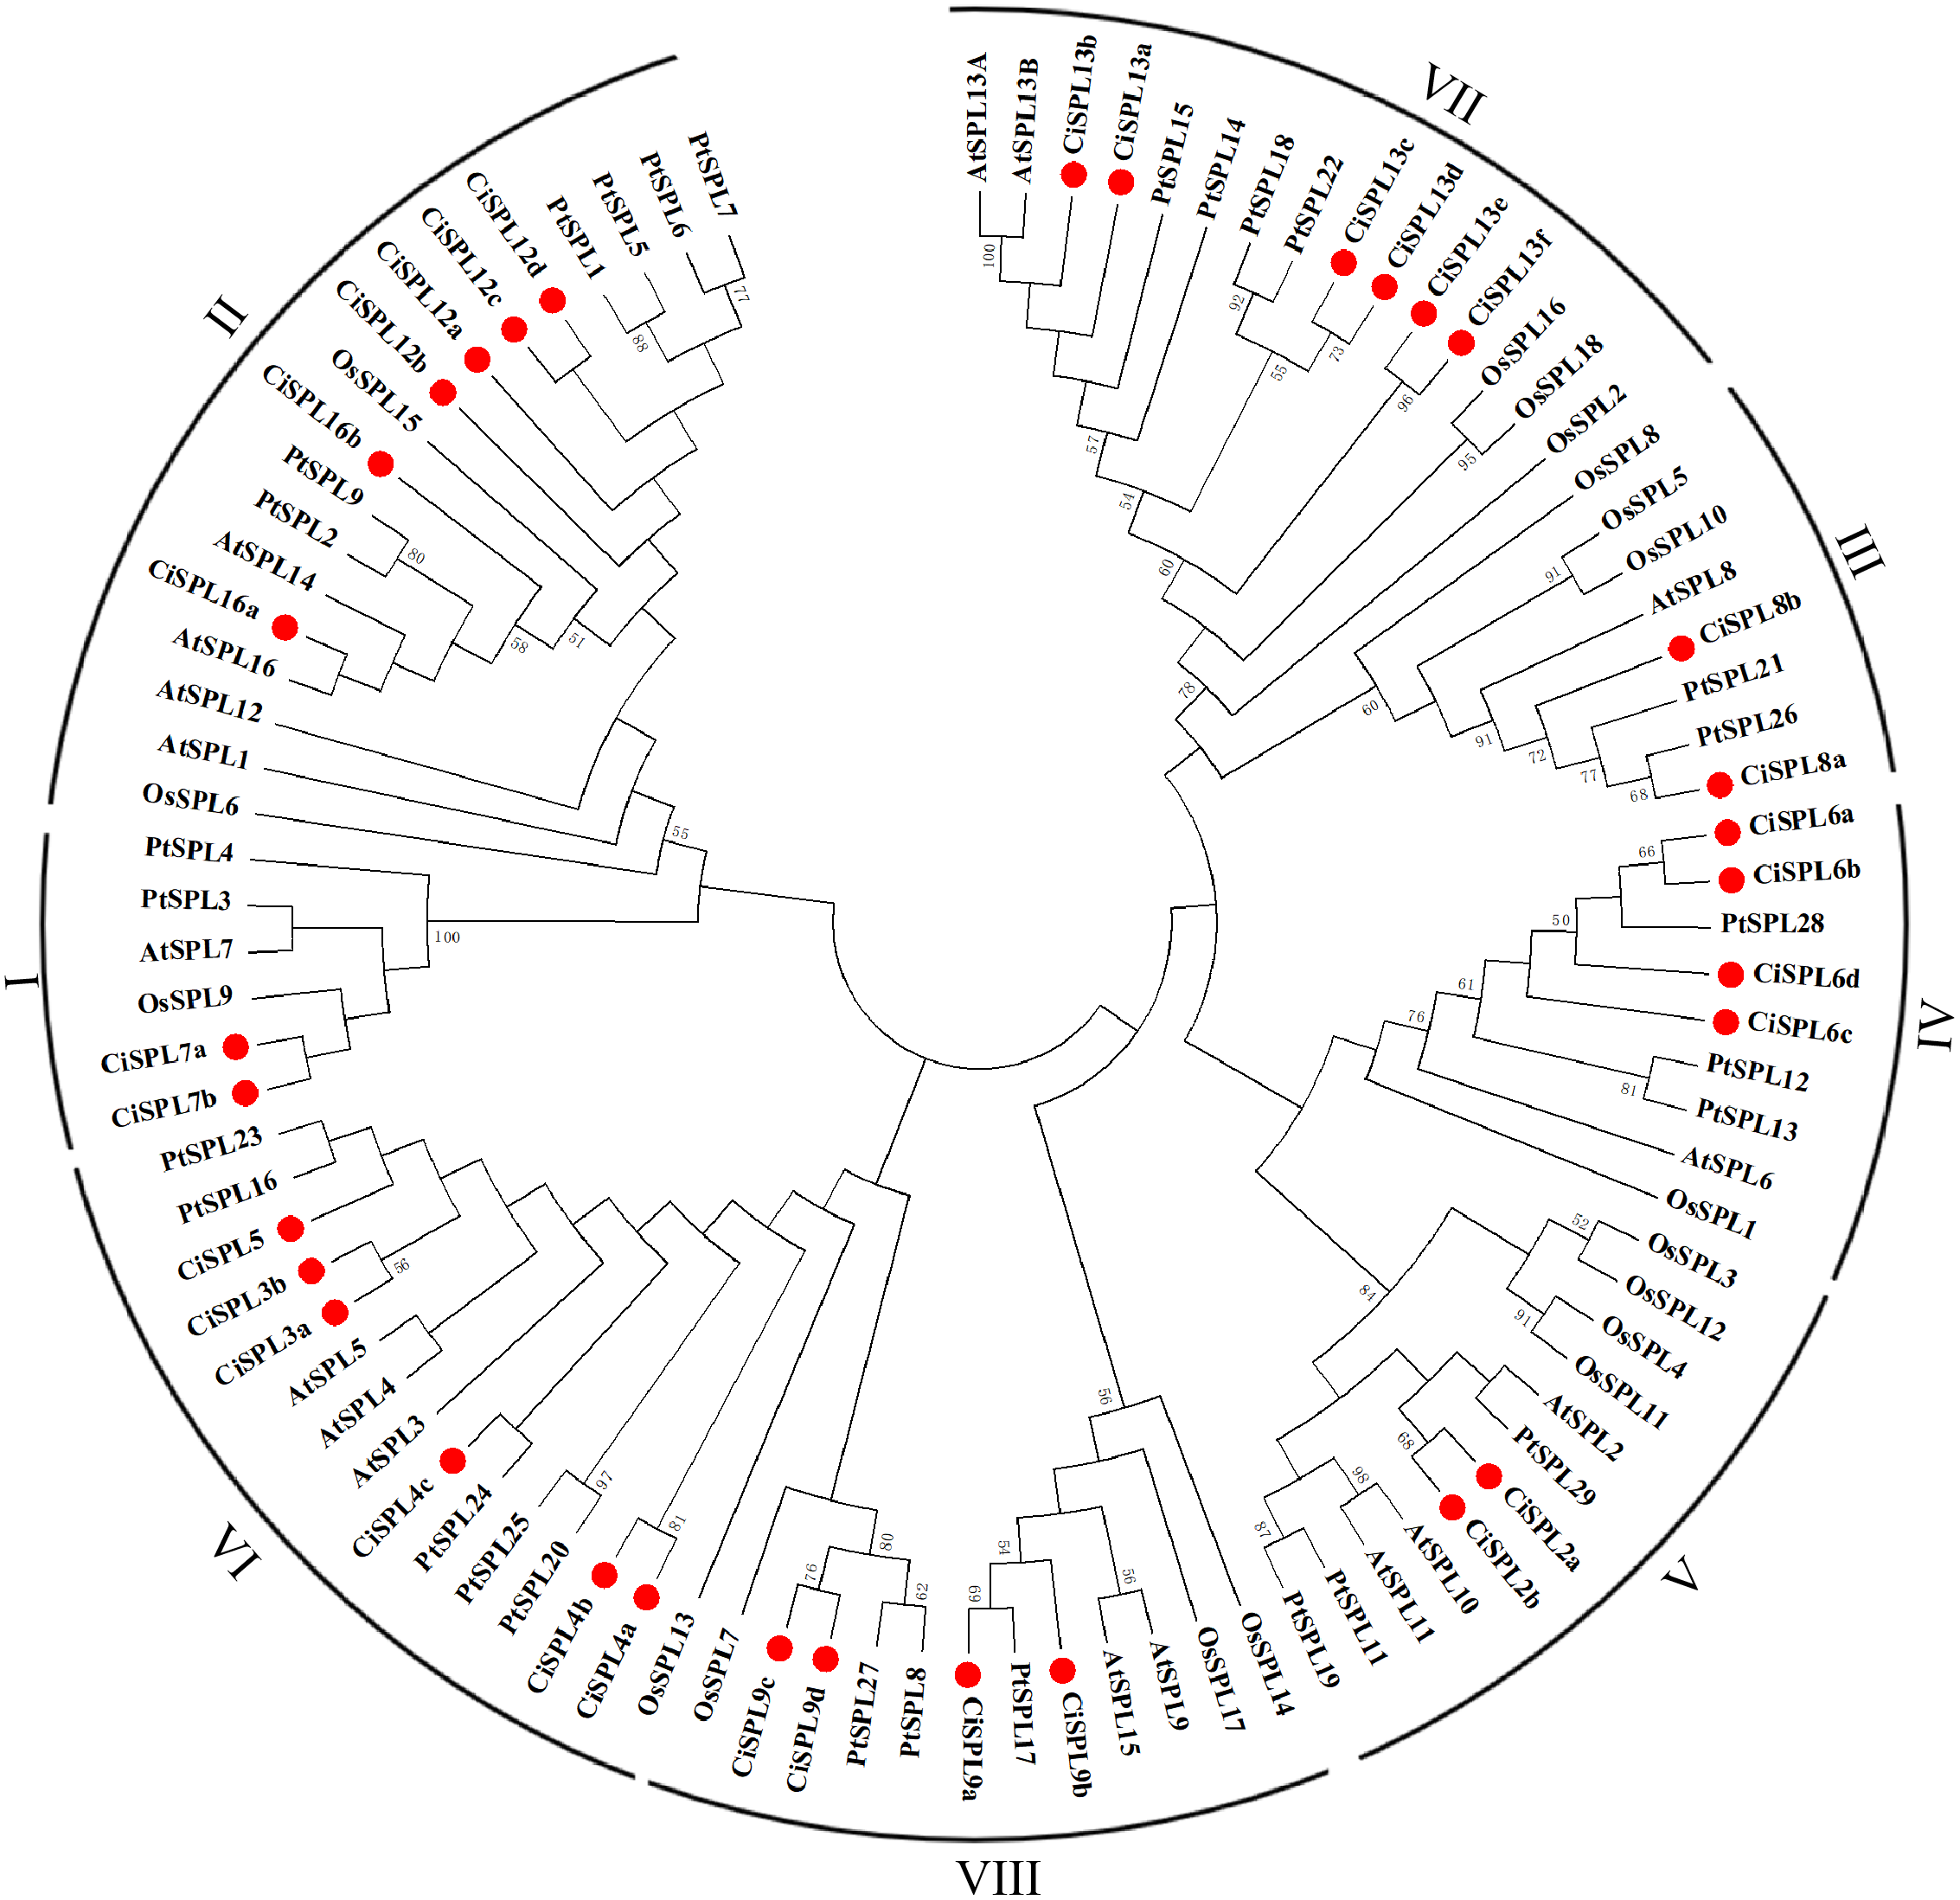
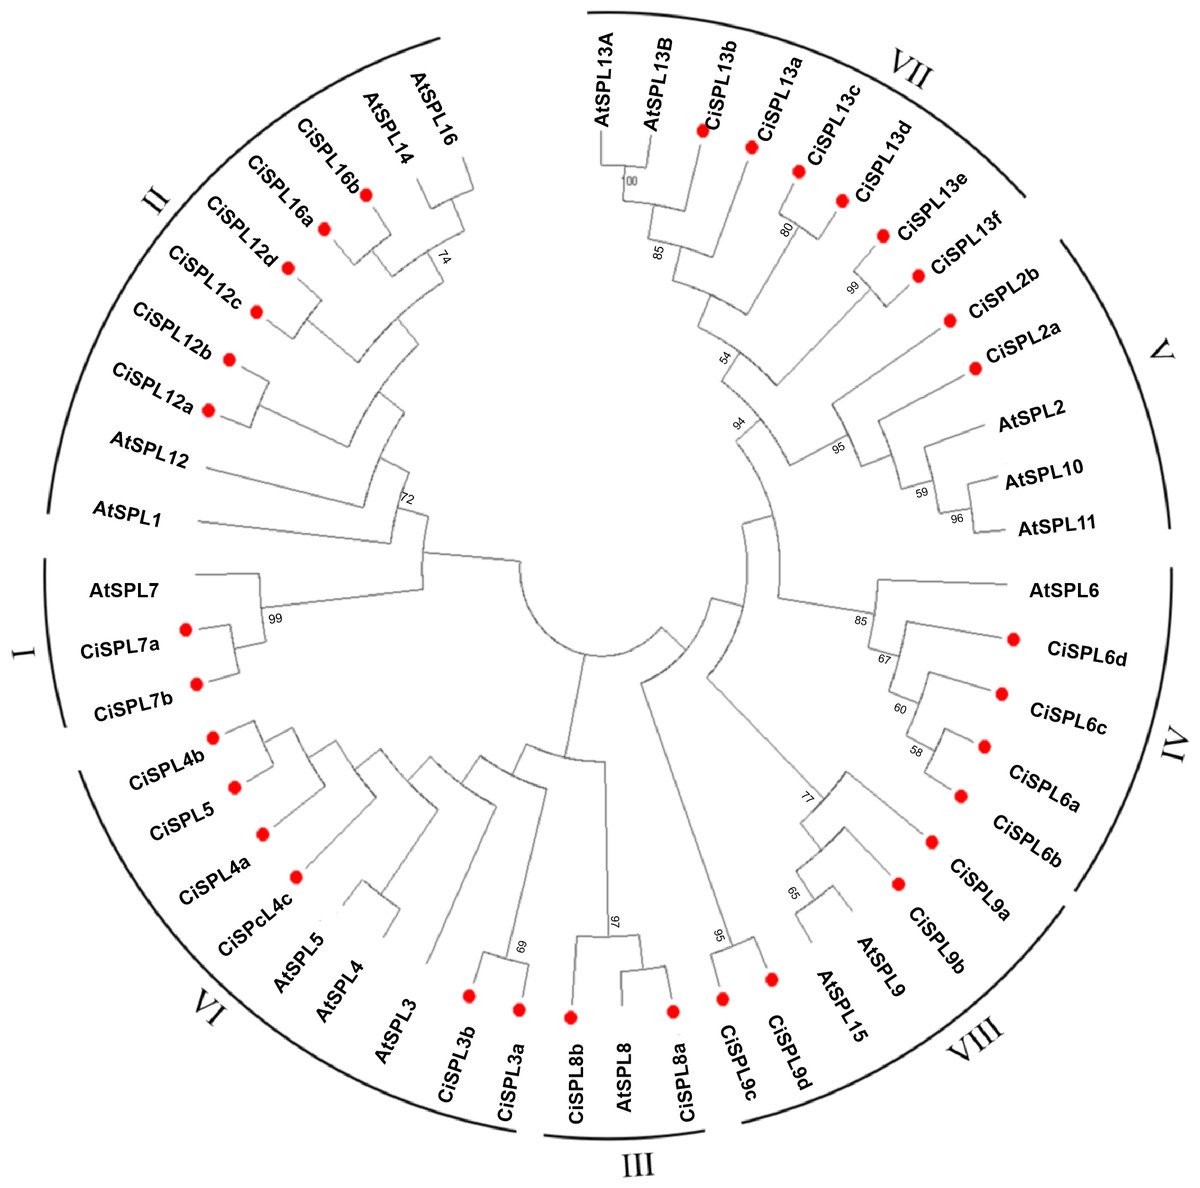
Figure 2: Phylogeny and distribution of SPL proteins from pecan and Arabidopsis.
The tree phylogenetic was generated using the Maximum Likelihood (ML) method with 500 bootstrap replicates by MEGA 5.0 software. Bootstrap values greater than 50% are displayed.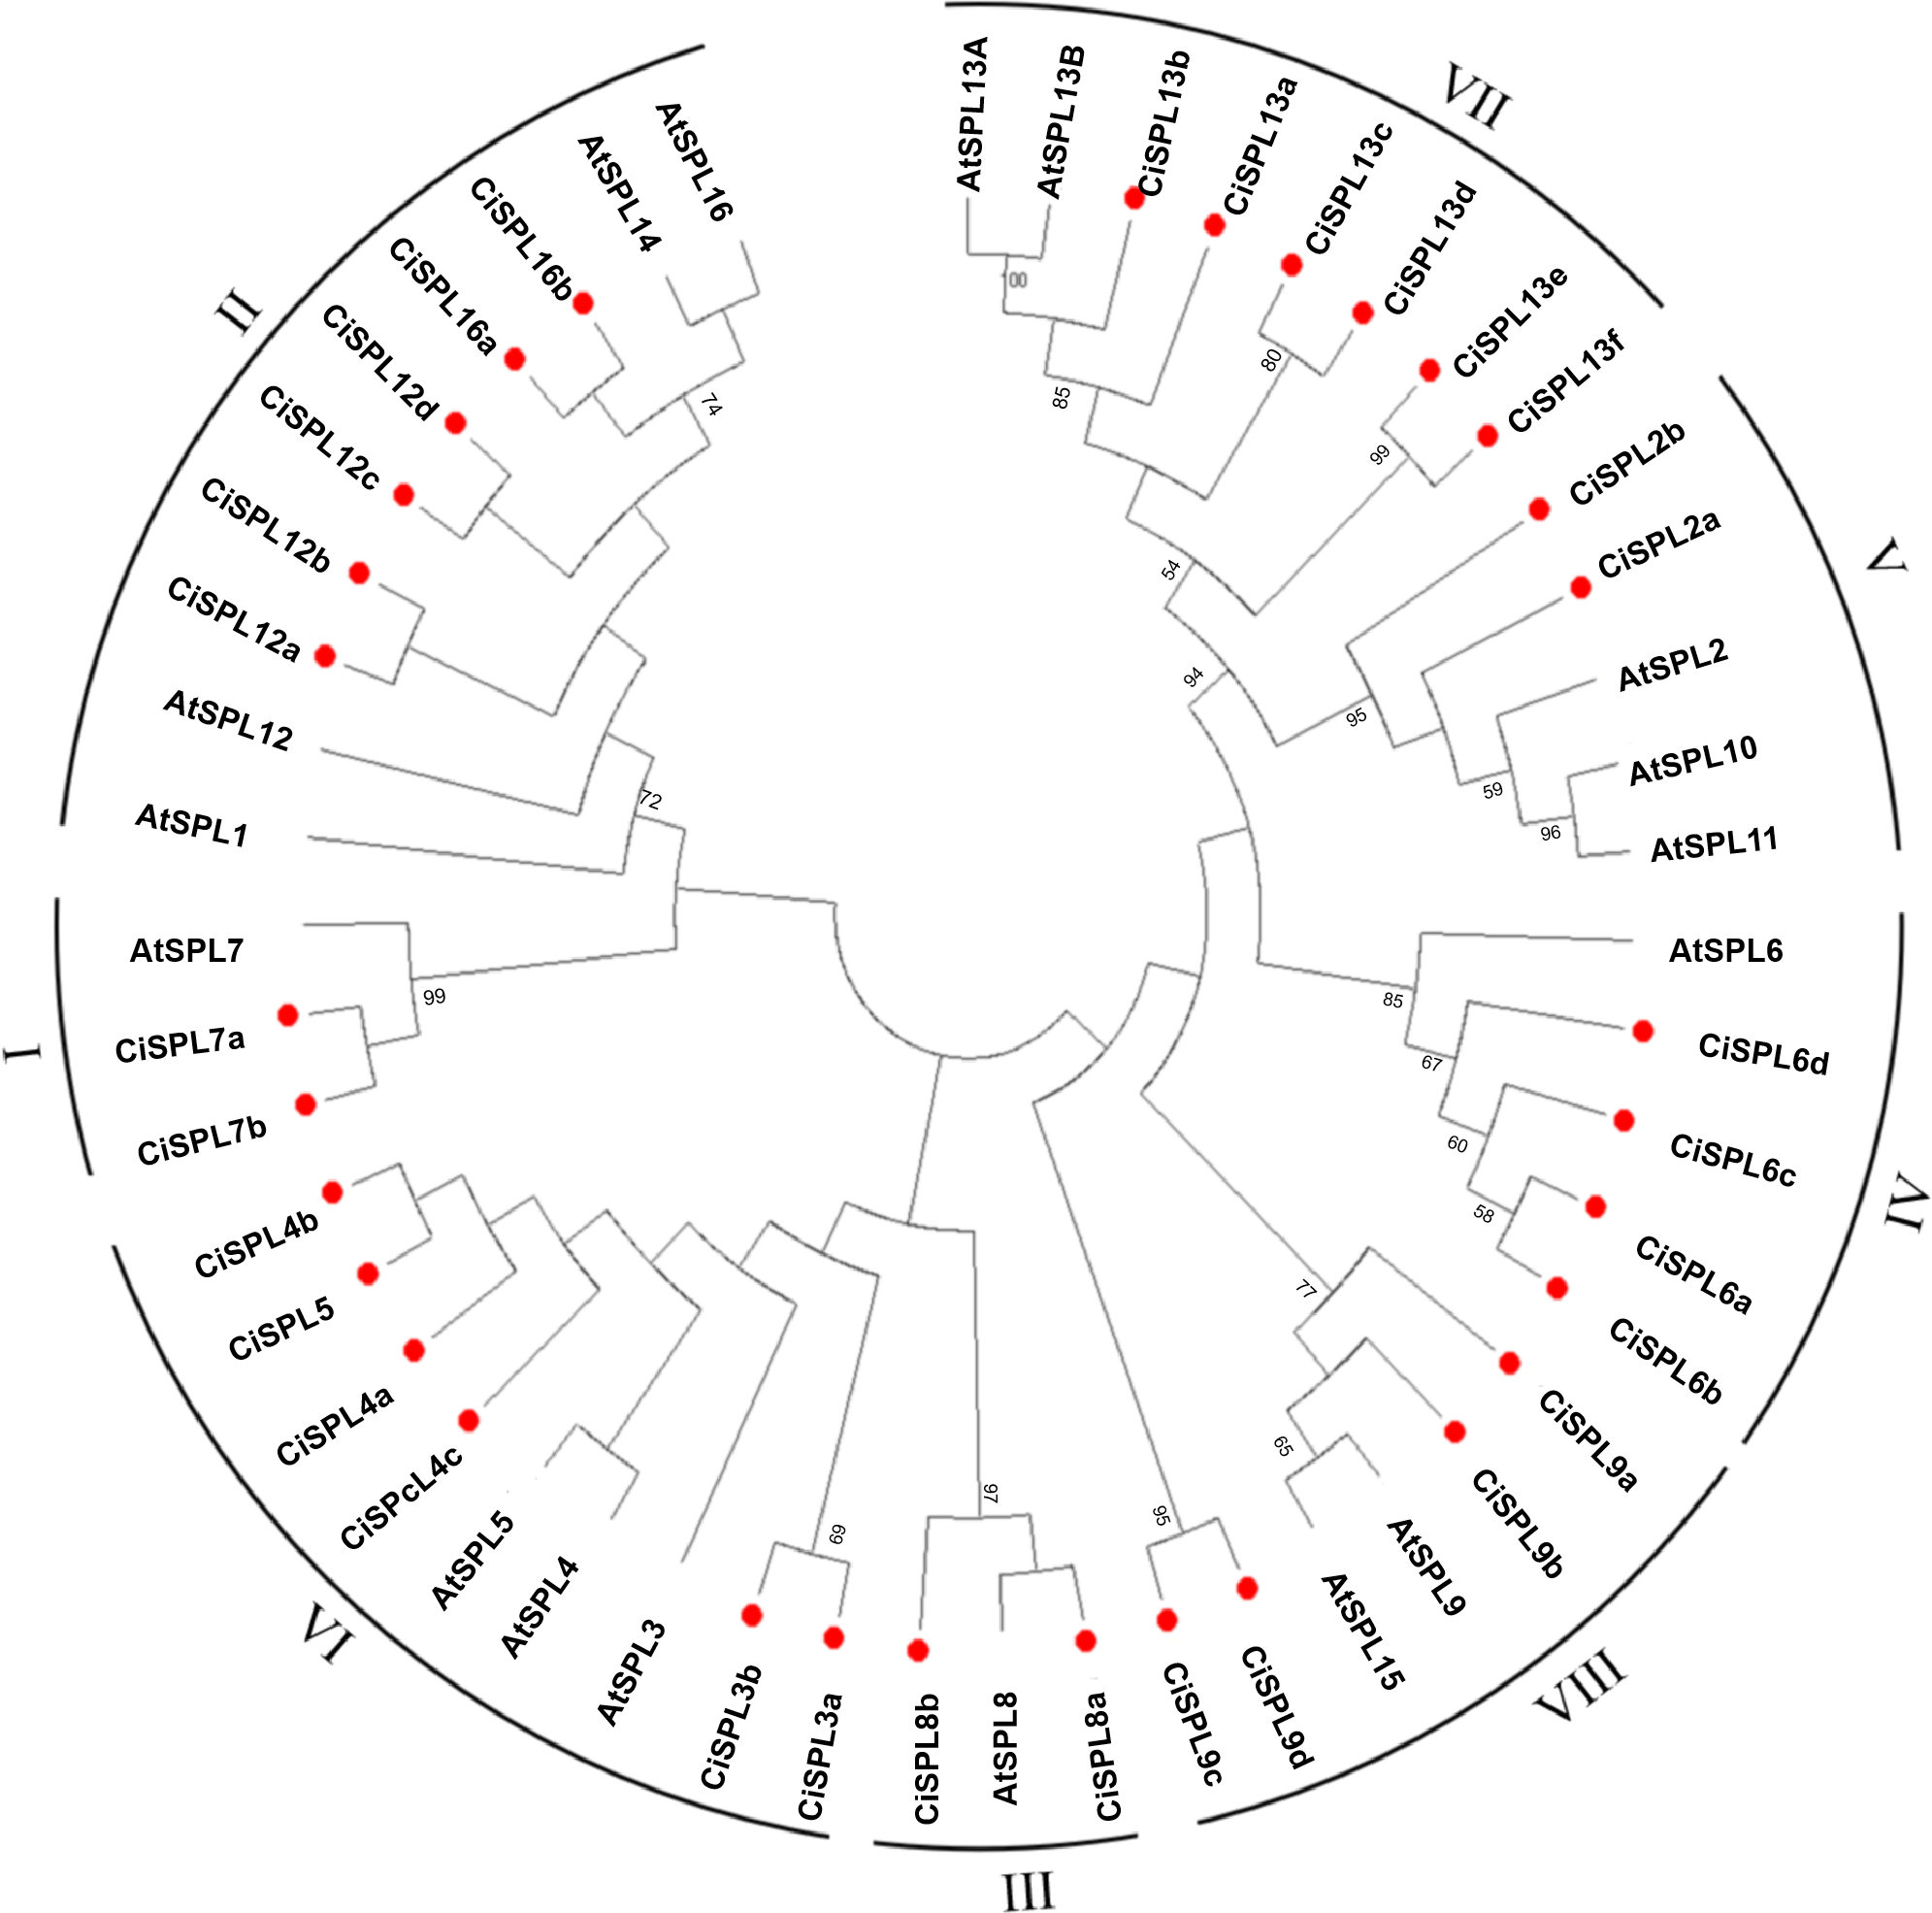
Motif and gene structure analysis of SPL genes in pecan
The CiSPL gene structure was analyzed using GSDS 2.0 (http://gsds.cbi.pku.edu.cn/) (Fig. 3). The number of introns in the 32 CiSPLs ranged from 0 to nine. Almost half of the 32 SPL genes (15 CiSPLs) had two introns. There were nine introns in seven CiSPLs (mainly members of group I and II), CiSPL2b and CiSPL8b had three introns each, CiSPL4c and CiSPL9d had no introns, and the remaining six CiSPL genes contained only one intron each. Most of the CiSPL genes within the same subgroups showed similar gene structures in terms of intron number and exon length. CiSPL3a and CiSPL3b were in group VI, and the length of their protein sequences was shorter than 200 amino acids, while in subgroup II, the SPL protein sequence was longer than 1,000 amino acids.
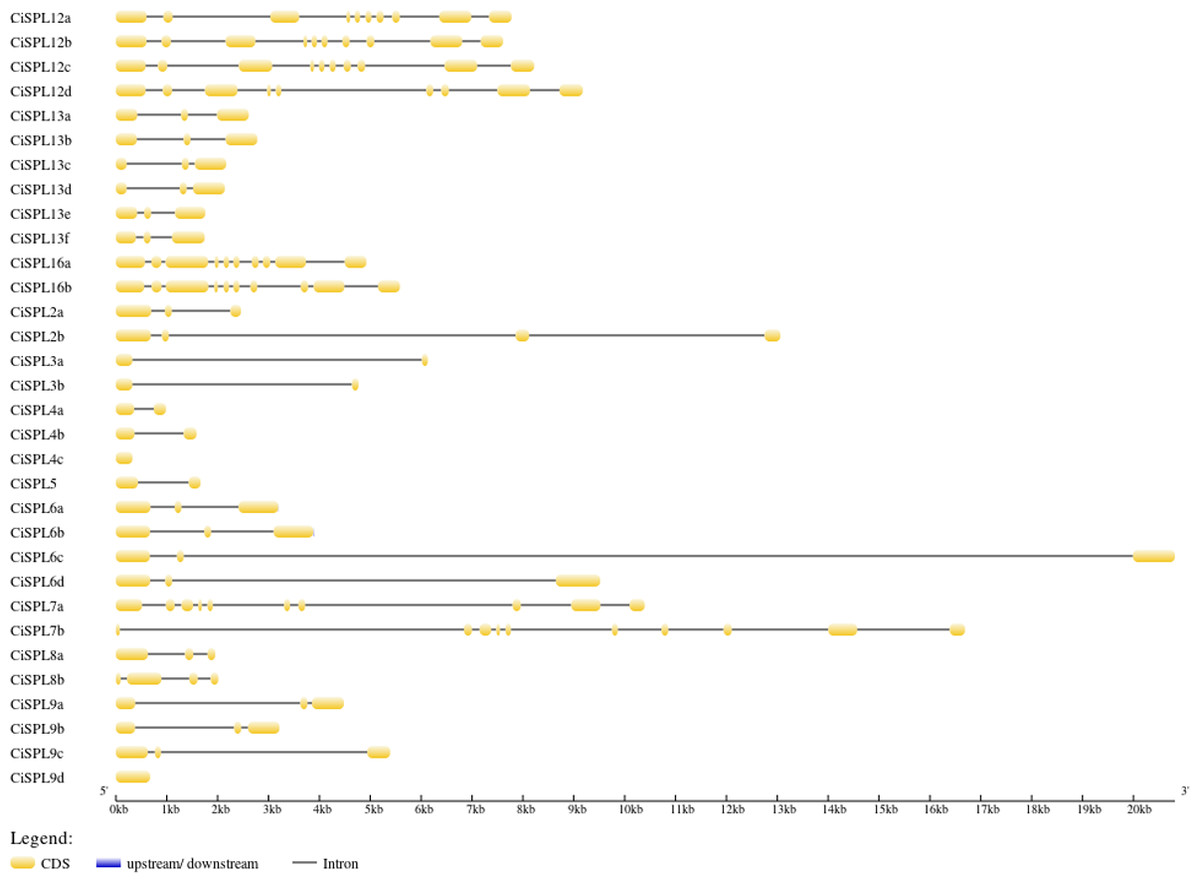
Figure 3: The gene structure of CiSPL genes.
The exons and introns are indicated by yellow blocks and gray thin lines, respectively. 5′UTR and 3′UTR are not shown.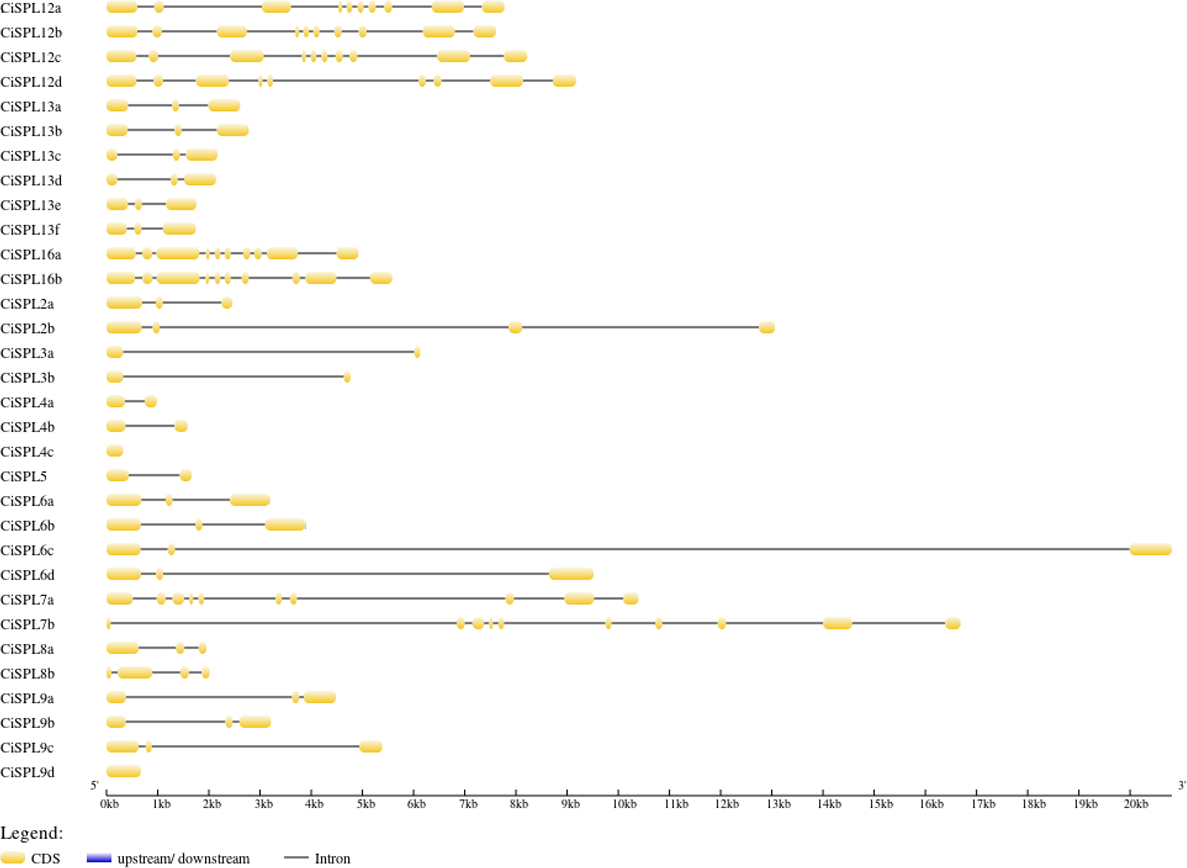
Other conserved domains besides the SBP domain also played roles in protein function. Based on the MEME software analysis of 32 CiSPL protein sequences, 20 motifs were identified and numbered from 1 to 20 (Fig. 4, Table S2). The number of motifs ranged from one to 17 in each SPL protein. All CiSPL proteins (except for CiSPL4c, CiSPL7b, and CiSPL9d) contained motif 1 (Zn-2), motif 2 (Zn-1), and motif 3 (NLS). CiSPL7b contained only motif 3, while CiSPL4c and CiSPL9d only had motif 2. Five CiSPL proteins (CiSPL3a, CiSPL3b, CiSPL4a, CiSPL4b, and CiSPL5) contained only motif 1, motif 2, and motif 3, while other CiSPL proteins had more motifs. CiSPL12a, CiSPL12b, CiSPL12c, and CiSPL12d had 17 motifs, and CiSPL16a and CiSPL16b had 11 motifs. Members of the same clade showed similar gene structures.
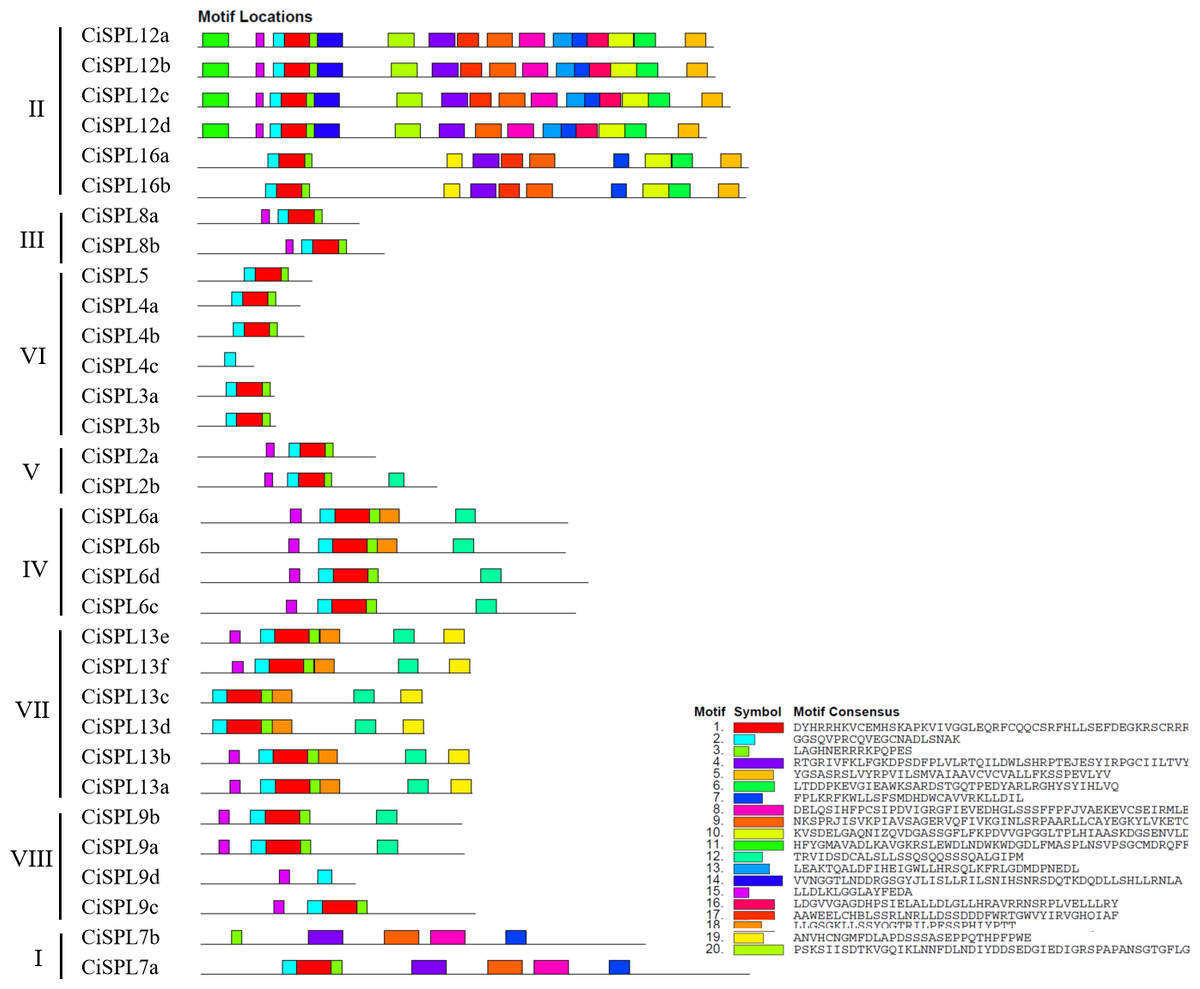
Figure 4: The conserved motifs distributed in CiSPL proteins were predicted by MEME.
Different motifs are represented by different colors and numbered from 1 to 20. The legend includes color definitions.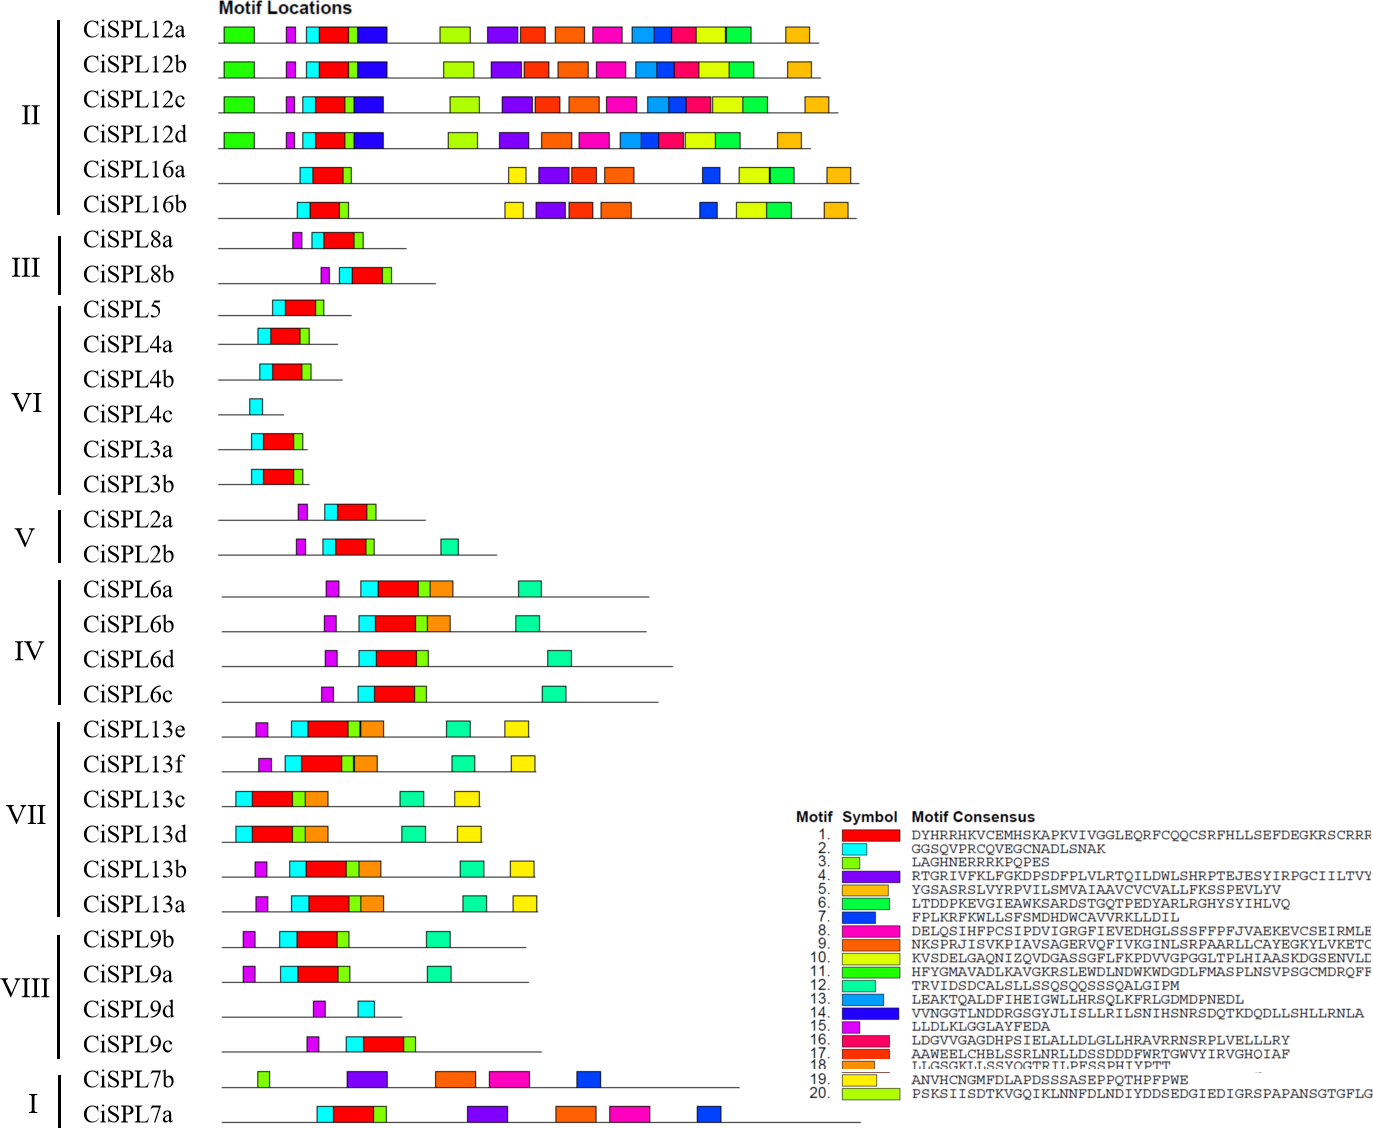
| Gene pairs | Ka/Ks |
|---|---|
| CiSPL2a/CiSPL2b | 0.38 |
| CiSPL3a/CiSPL5 | 0.37 |
| CiSPL4a/CiSPL4b | 0.27 |
| CiSPL6a/CiSPL6b | 0.37 |
| CiSPL7a/CiSPL7b | 0.41 |
| CiSPL9a/CiSPL9b | 0.34 |
| CiSPL12a/CiSPL12b | 0.30 |
| CiSPL13e/CiSPL13f | 0.43 |
| CiSPL16a/CiSPL16b | 0.24 |
| CiSPL3a/AtSPL3 | 0.13 |
| CiSPL3b/AtSPL3 | 0.11 |
| CiSPL4b/AtSPL5 | 0.33 |
| CiSPL6a/AtSPL6 | 0.37 |
| CiSPL6b/AtSPL6 | 0.39 |
| CiSPL7a/AtSPL7 | 0.32 |
| CiSPL7b/AtSPL7 | 0.33 |
| CiSPL9a/AtSPL9 | 0.32 |
| CiSPL9a/AtSPL15 | 0.28 |
| CiSPL9b/AtSPL9 | 0.28 |
| CiSPL9b/AtSPL15 | 0.32 |
| CiSPL12b/AtSPL1 | 0.18 |
| CiSPL13b/AtSPL13A | 0.36 |
| CiSPL16a/AtSPL14 | 0.19 |
| CiSPL16a/AtSPL16 | 0.16 |
| CiSPL16b/AtSPL16 | 0.18 |
Gene duplication and collinearity analysis of CiSPL genes
Gene duplication is both the foundation of gene function diversification and the main driving force of species evolution. In order to explore the expansion and evolutionary mechanism of the CiSPL gene family, MCScanX software was used to analyze the SPL gene replication mode. Twelve genes were involved in nine segmental duplication events (Table 2). However, there were no tandem duplication events, which suggests that segmental duplications were the main mechanism of pecan SPL gene expansion. In order to further understand the evolutionary and functional relationship between the pecan and Arabidopsis SPL genes, we analyzed their collinearity relationships. The 16 collinear gene pairs, which included 13 CiSPLs and 11 AtSPLs, were as follows: CiSPL3a/AtSPL3, CiSPL4b/AtSPL5, CiSPL6a/AtSPL6, CiSPL6b/AtSPL6, CiSPL7a/AtSPL7, CiSPL7b/AtSPL7, CiSPL9a/AtSPL9, CiSPL9a/AtSPL15, CiSPL9b/AtSPL9, CiSPL9b/AtSPL15, CiSPL12b/AtSPL1, CiSPL13b/AtSPL13A, CiSPL3b/AtSPL3, CiSPL16a/AtSPL14, CiSPL16a/AtSPL16, and CiSPL16b/AtSPL16. This suggested that most SPLs had orthologs in Arabidopsis. For each duplicate SPL gene pair, the Ka/Ks ratio was calculated using MEGA 5.0 software to study divergence times. The Ka/Ks values in the pecan genome were distributed between 0.2–0.5, while the Ka/Ks ratios between the Arabidopsis and pecan genomes ranged from 0.1–0.4 (Fig. 5). This indicated that the SPL genes had a strong purifying selection between the pecan and Arabidopsis genomes.
Analysis of cis-acting elements in the promoter regions of CiSPL genes
We predicted and analyzed the cis-acting elements in the 1,500 bp promoter sequences of the CiSPL genes in order to understand the gene regulation mechanism. Except for the basic CAAT and TATA boxes, most of the other cis-acting elements mainly included stress response, hormone response, growth, and development, which were related to different life activities (Fig. 6). There were two cis-acting elements (GCN4_motif and AACA_motif) involved in endosperm expression and located in the promoter region of five and one CiSPL genes, respectively. The seed-specific regulation element (RY-element) was found only in the promoter region of CiSPL5. Nine meristem expression regulatory (NON-box and CAT-box) genes were identified in eight CiSPL promoters, and 11 zein metabolism regulation elements (O2 site) were also identified in eight CiSPL promoters. Additionally, circadian control (circadian) and flavonoid biosynthetic (MBSI) regulatory elements were located in the regions of three and one CiSPL promoters, respectively.
There were 46 MeJA-responsive elements (CGTCA motif and TGACG-motif), 19 auxin-responsive elements (TGA-element, TGA-box, and AuxRR-core), 10 gibberellin-responsive elements (GARE-motif, TATC-box, and P-box), 18 salicylic acid responsive elements (TCA-element), and 64 abscisic acid responsive elements (ABRE) located in the promoter regions of 15, 12, 9, 14, and 23 CiSPLs, respectively. There was the largest number of ABA-responsive elements, followed by MeJA-responsive elements, suggesting that CiSPL s may have a strong response to MeJA and ABA hormones, although this requires further experimental verification. The CiSPL transcription factor is an important adversity gene, and the number of hormone response elements in the promoters of CiSPLs varies widely. Among these, the CiSPL25 gene has the largest number of hormone response elements in its promoter region (up to 15). The promoter region of the CiSPL20 gene contains only one GA-related element, and no other types of hormone response elements. Different CiSPL s have different response patterns to different hormones.
There are five different types of stress-related elements in the promoter region of CiSPL genes. Among them, the most numerous are the regulatory elements related to anaerobic stress (ARE). Fourteen low temperature responsive elements (LTR) and 20 drought induction elements (MBS) were identified in 11 and 14 CiSPL genes, respectively. There are also stress-related response elements (TC_rich repeats).
Expression profiles of CiSPL genes during flower and fruit development
In order to understand the function of CiSPL genes, we analyzed the expression patterns of identified CiSPLs using the transcriptome data of female flower development (Table S3). Figure 7 shows that two-thirds of CiSPL genes were expressed during female flower development.CiSPL4c and CiSPL16b showed a high expression level during the whole flower development stage (FB1 to FL2). Four CiSPL genes (CiSPL8a, CiSPL8b, CiSPL9c, and CiSPL9d) were only expressed during the FL2 stage. The CiSPL4b gene was particularly expressed in the FL1 stage. CiSPLs play different roles in different stages of female flower development, and there is differentiation of gene function. We also analyzed the expression of CiSPL genes across three stages of pecan fruit development (Fig. 8, Table S4). Surprisingly, about half of the CiSPL genes were not expressed during fruit development. CiSPL12a, CiSPL12b, and CiSPL16a genes were highly expressed throughout fruit development. CiSPL3a and CiSPL12d were mainly induced and expressed during the early stages of fruit development. The specific functions of these CiSPL genes need to be further verified in future experiments.
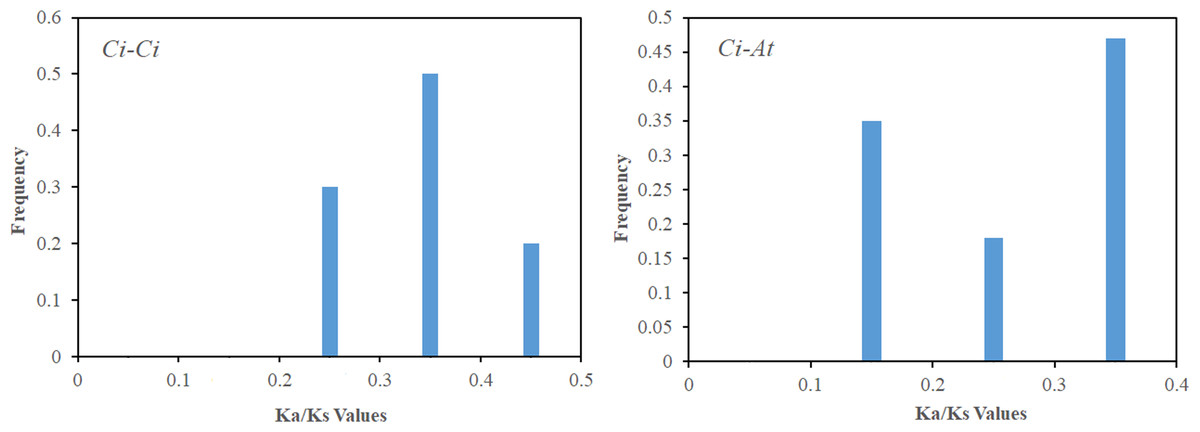
Figure 5: The Ka/Ks value distribution of the segmental duplication gene pairs in the pecan genome , and the collinear gene pairs between pecan and Arabidopsis.
Distribution of Ka/Ks values was obtained from segmentally duplicated gene pairs in the pecan genome (A), and the collinear gene-pairs between pecan and Arabidopsis (B).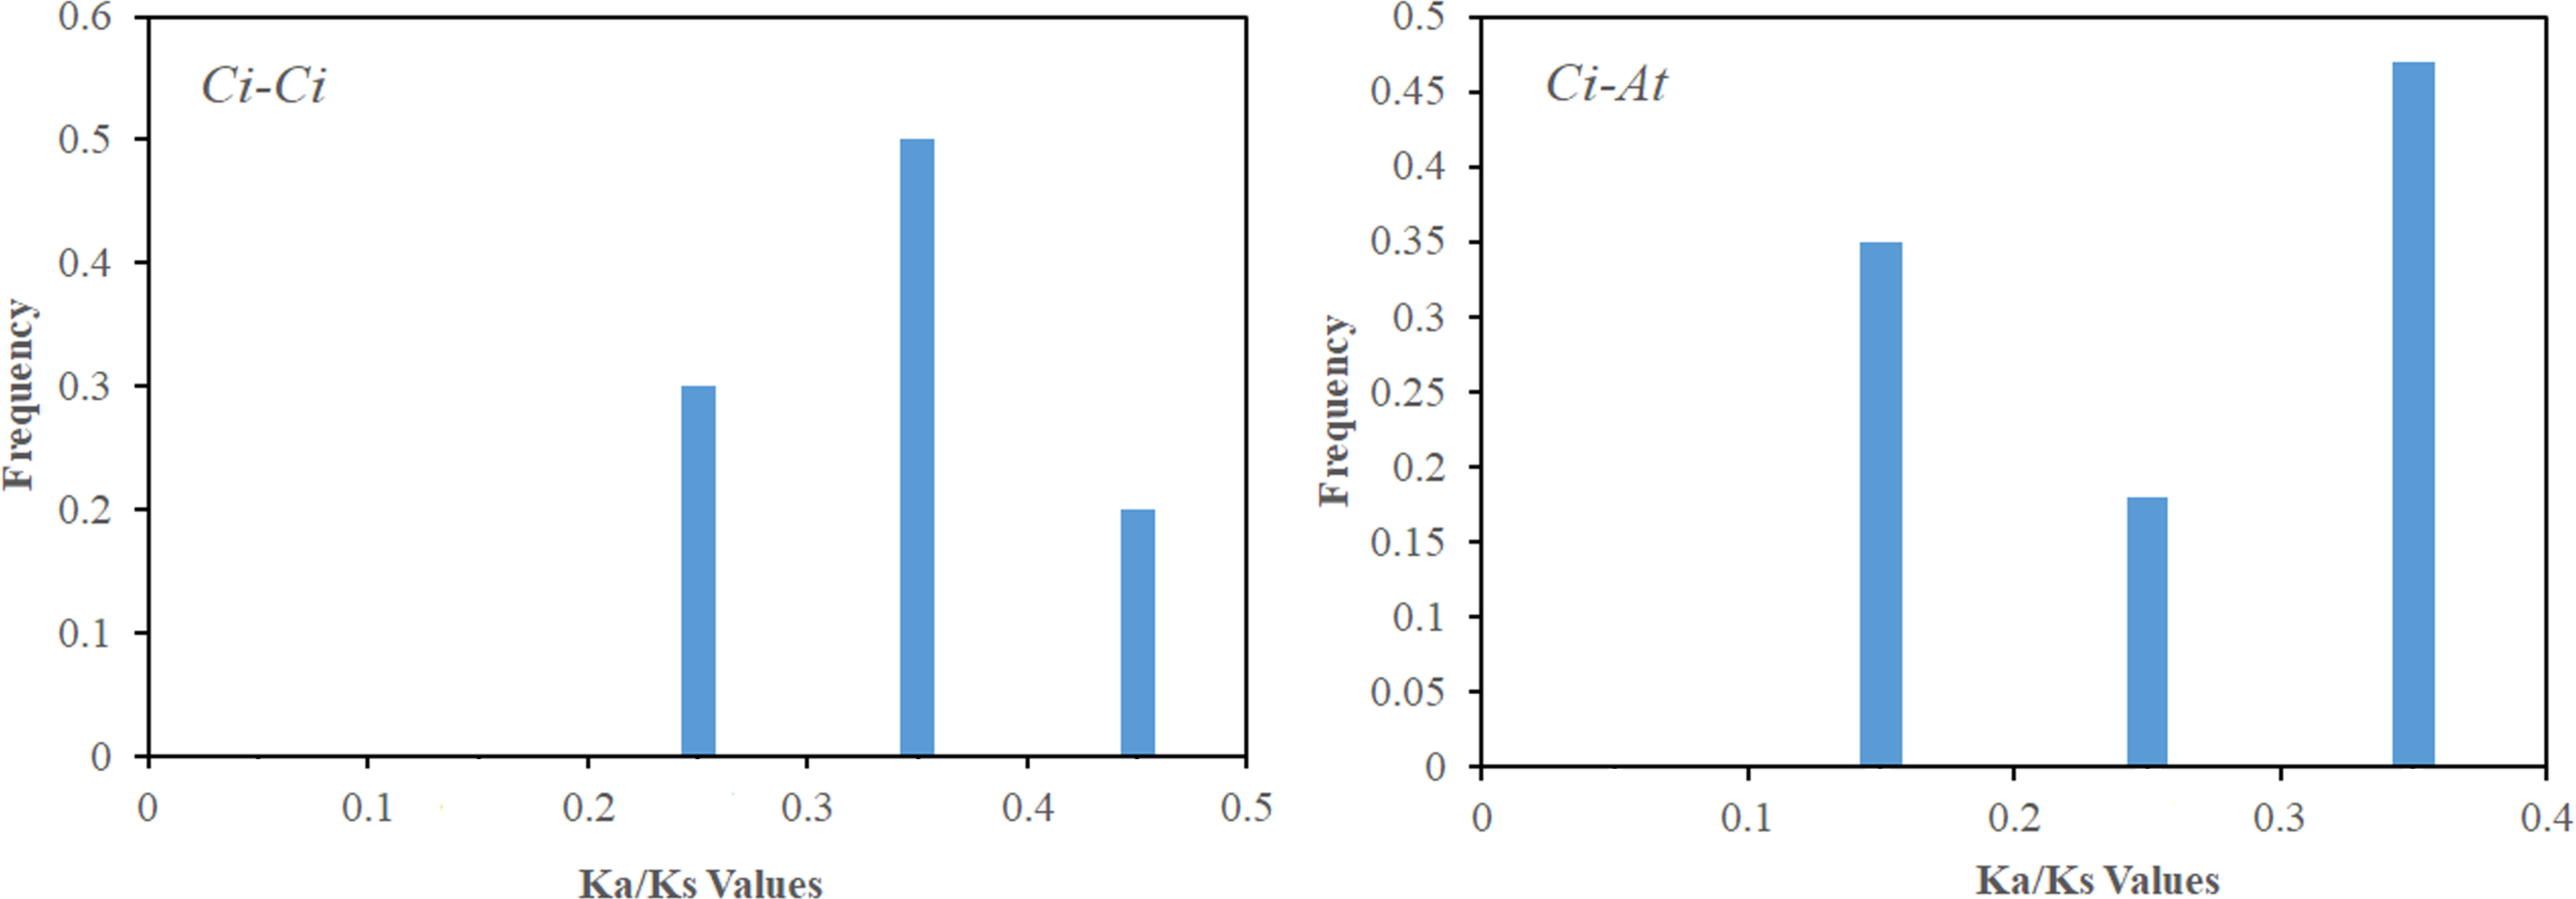
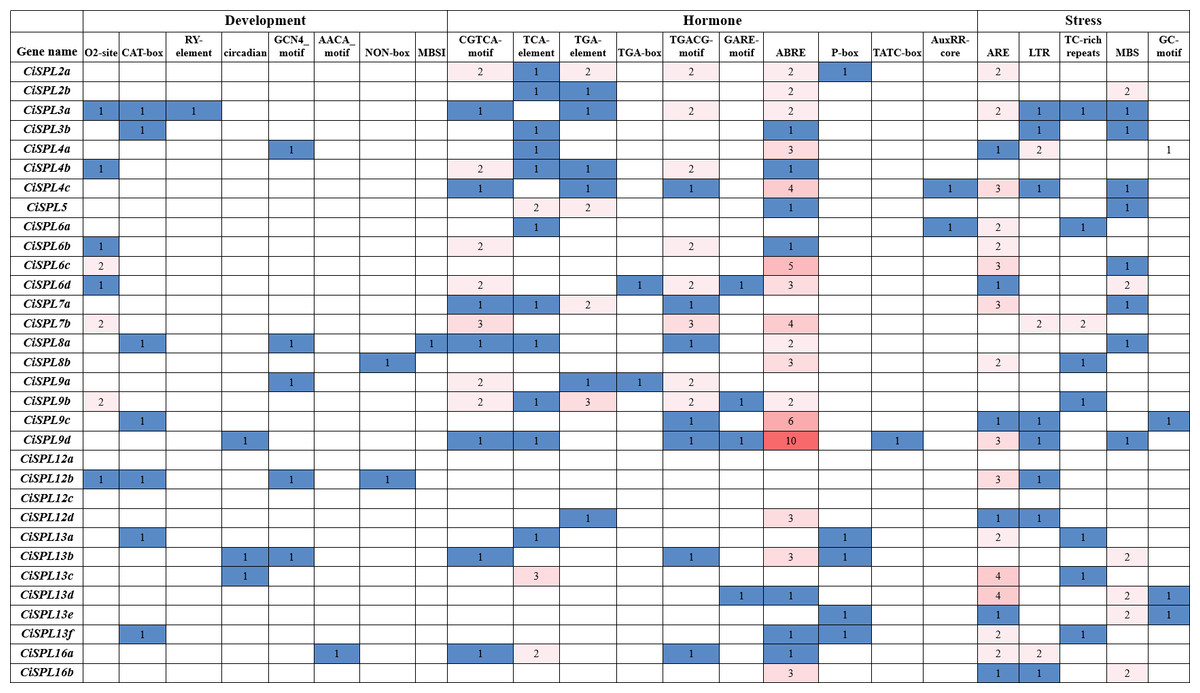
Figure 6: Analysis of cis-regulatory elements in promoter regions of CiSPL genes in pecan.
The number of cis-acting elements in each SPL gene promoter region (1.5 kb upstream of the translation start site). Based on the functional annotation, the cis-acting elements were divided into three categories: development, hormone responsive, and stresses-related cis-acting elements.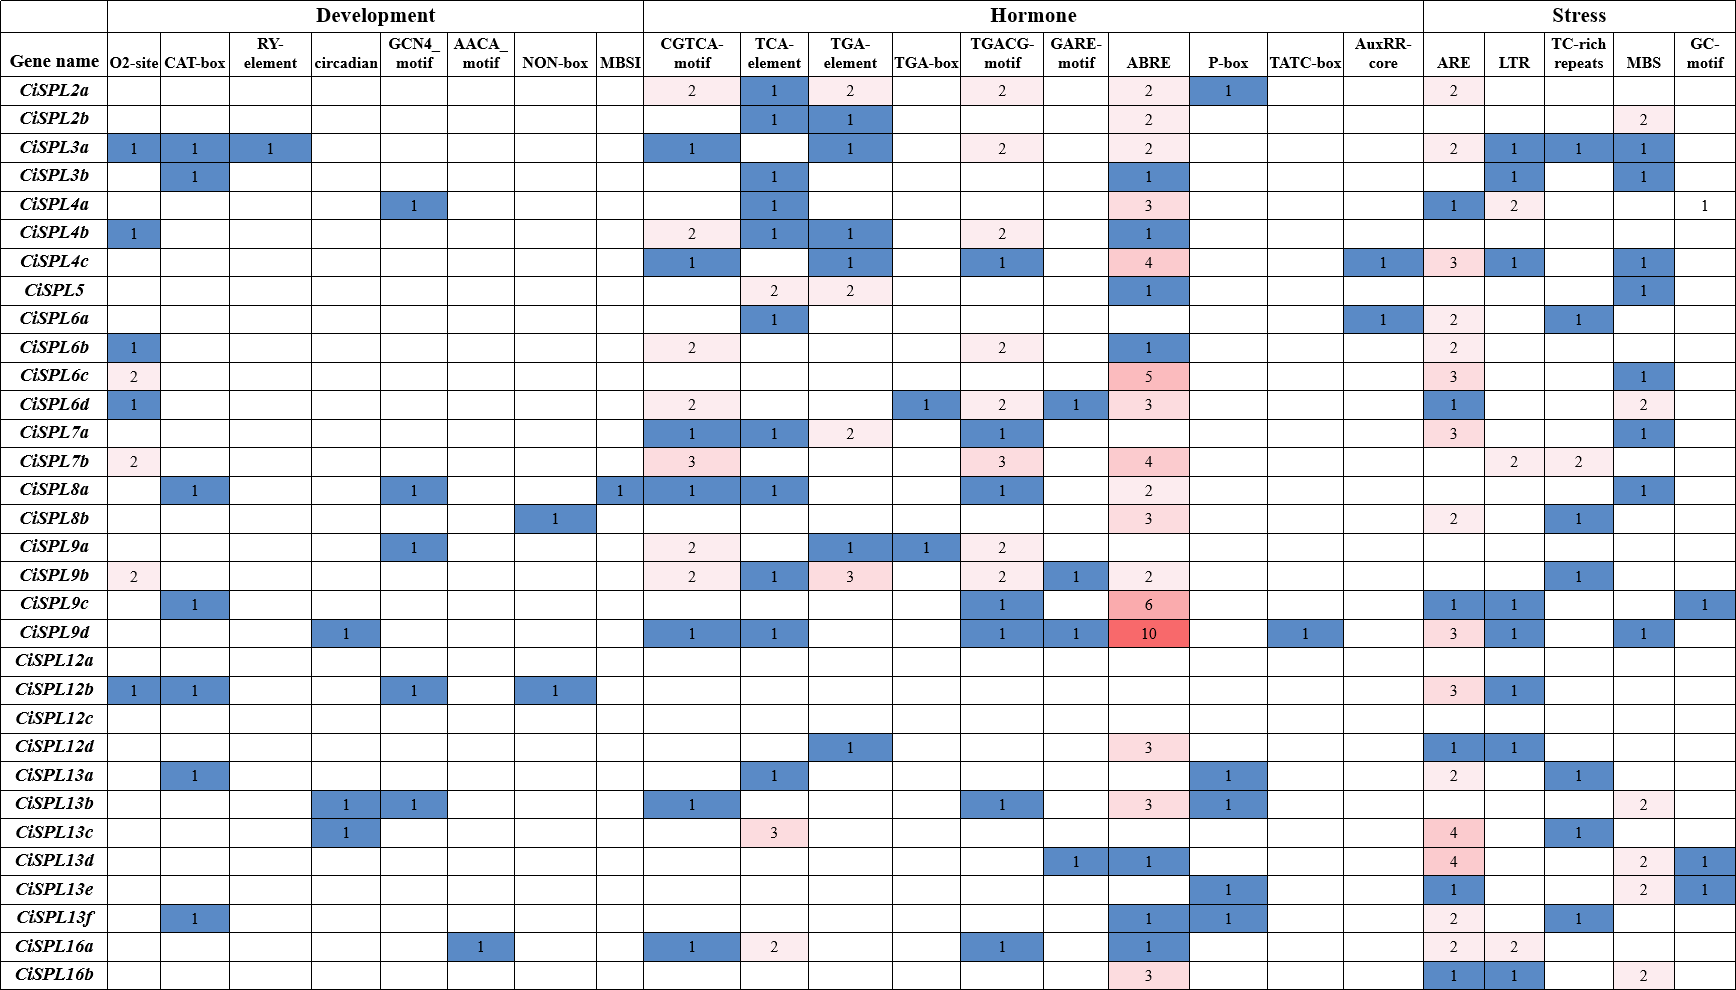
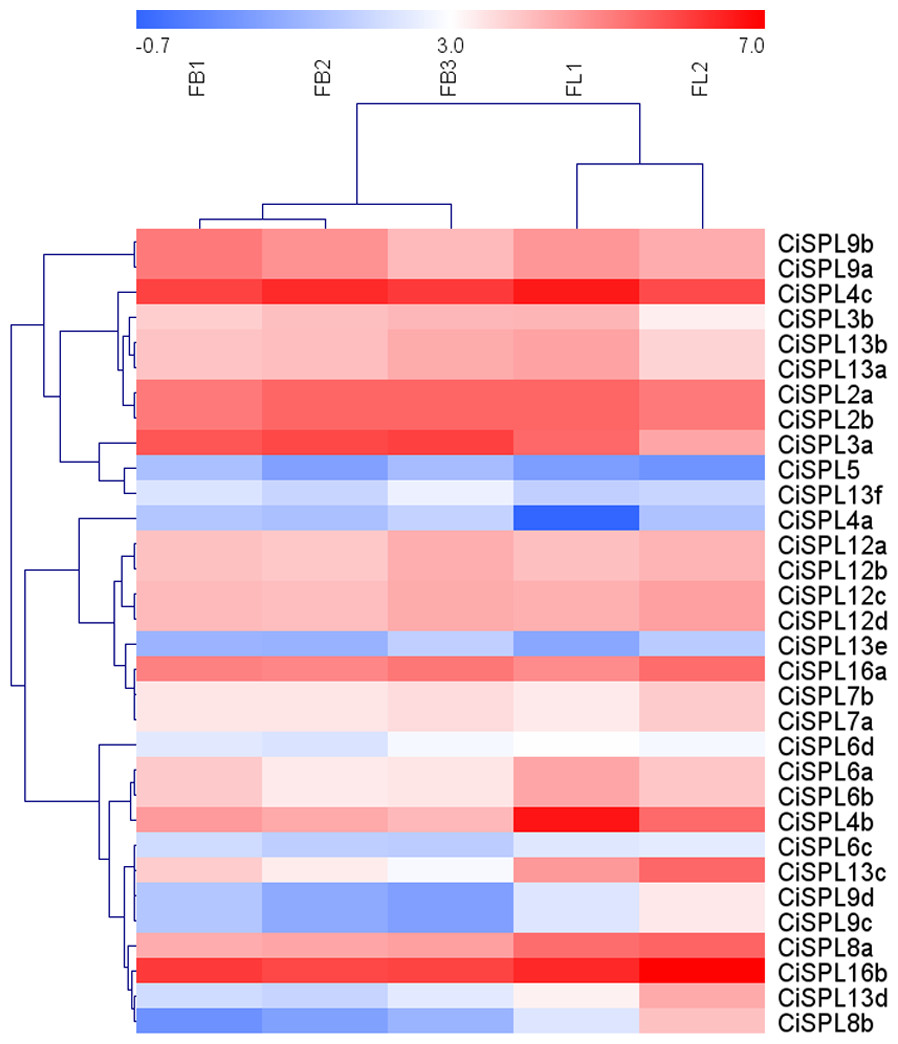
Figure 7: Expression profiles of CiSPL. genes during different stages of female flower development in pecan.
Red and blue boxes indicate up-regulation and down-regulation of gene expression, respectively. The color key represents log2 expression values (FPKM) of the genes. FB1, initial stage of female flower bud differentiation; FB2, formation stage of female inflorescence; FB3, the formation stage of female flower involucre; FL1, initial flowering stage of female flowers; FL2, blooming period of female flowers.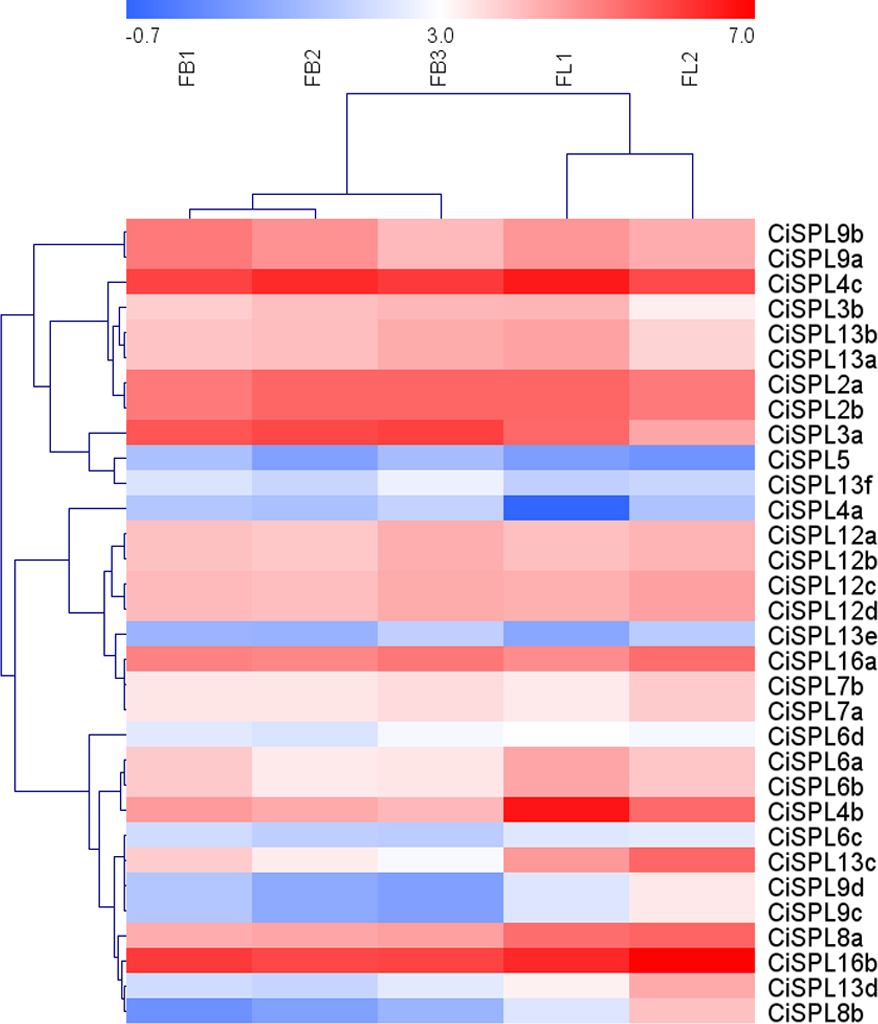
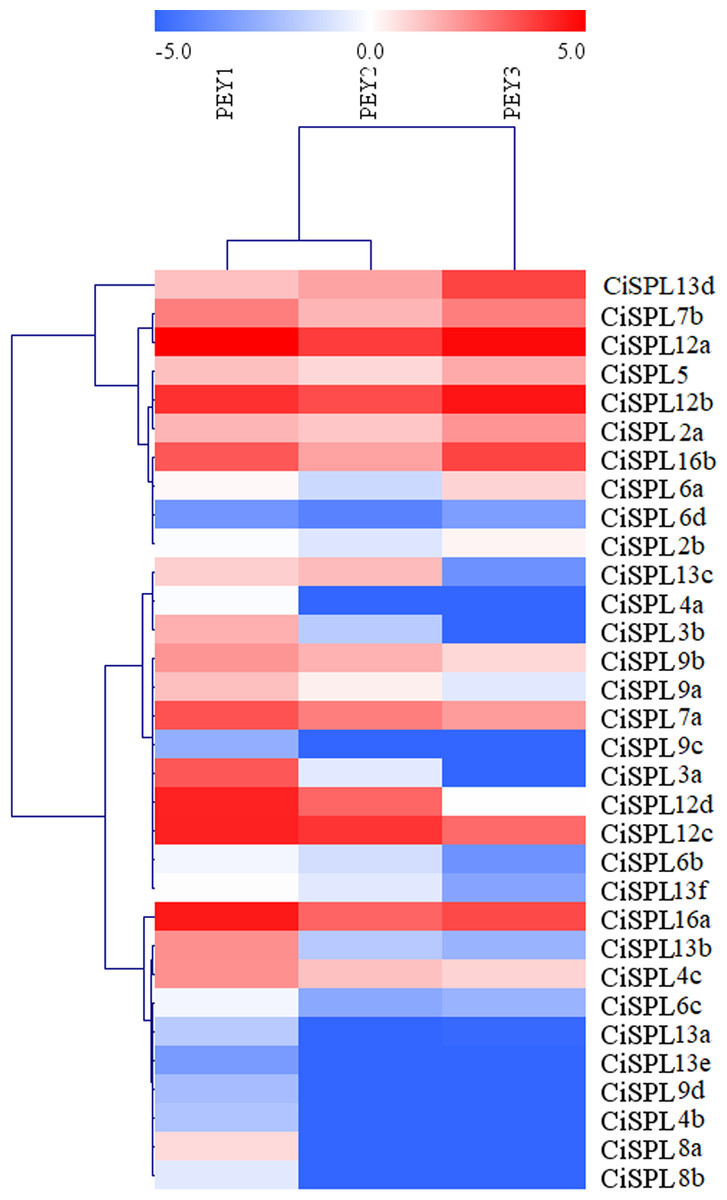
Figure 8: Expression profiles of CiSPL genes during different stages of fruit development in pecan.
Red and blue boxes indicate up-regulation and down-regulation of gene expression, respectively. The color key represents log2 expression values (FPKM) of the genes. The relative expression was calculated by Log2(FPKM). PEY1, the early stage of cotyledon development; PEY2, the fully developed stage of cotyledon development; PEY3, the fully matured stage of the embryos.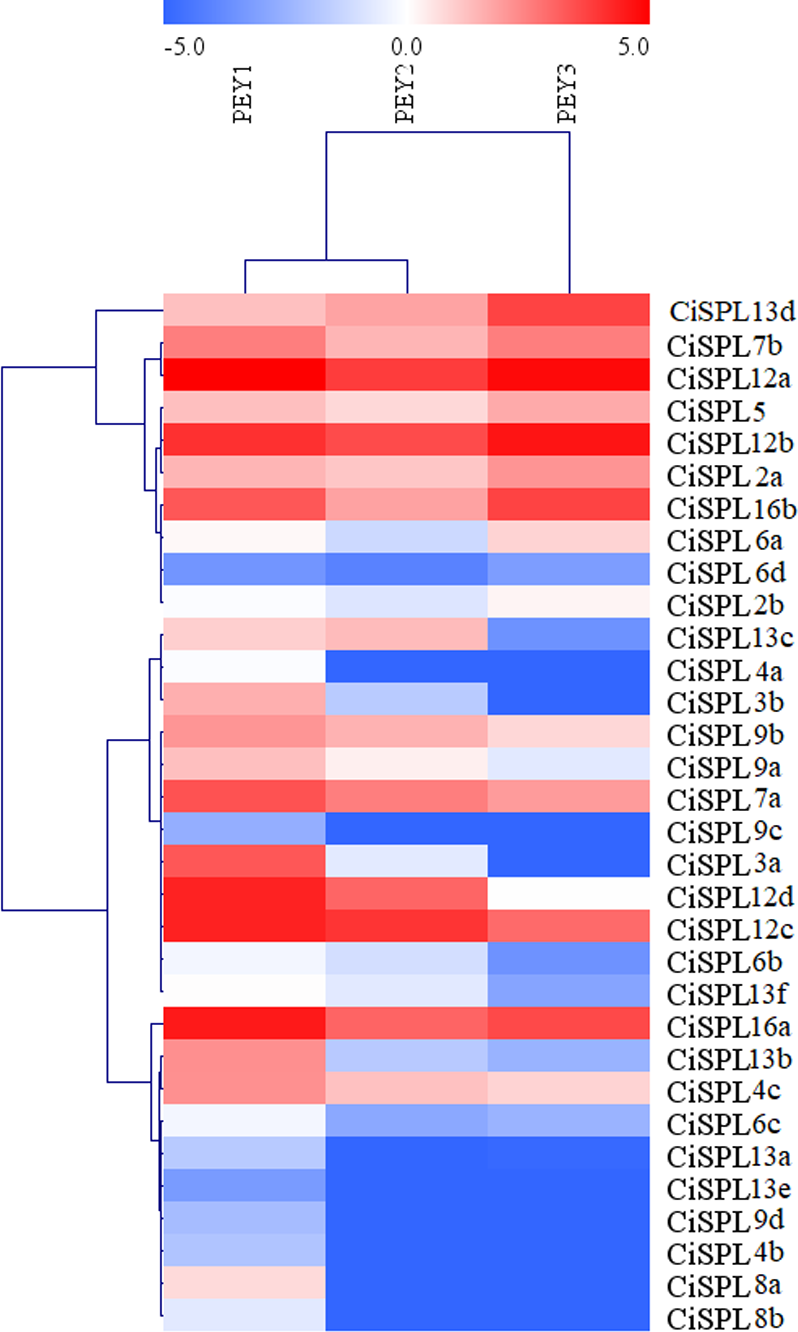
Expression analysis of CiSPL genes under drought and NaCl stress treatment
In order to explore the response of CiSPLs to drought stress, the expression profiles of 32 CiSPLs were examined by qRT-PCR (Table S6). Figure 9 shows that nearly half of the CiSPLs were found to show a drought stress response. In general, shorter genes were expressed more quickly. Four of the shorter CiSPLs (CiSPL4a, CiSPL4b, CiSPL6d, CiSPL8a, and CiSPL13e) were induced rapidly and reached their peak at 6 h. CiSPL7a, -7b, -12a, -13f, and -16b expression reached their peak 12 h after drought stress. CiSPL6c was the most responsive gene, with an expression 100 times greater than that of control. Thirteen CiSPLs (CiSPL-3a, -4c, -5, -6b, -9a, -9b, 12c, -12d, -13a, -13b, -13c, -13d, and -16a) were not induced or down-regulated during the whole process. Generally, CiSPLs play an important role in drought stress response.
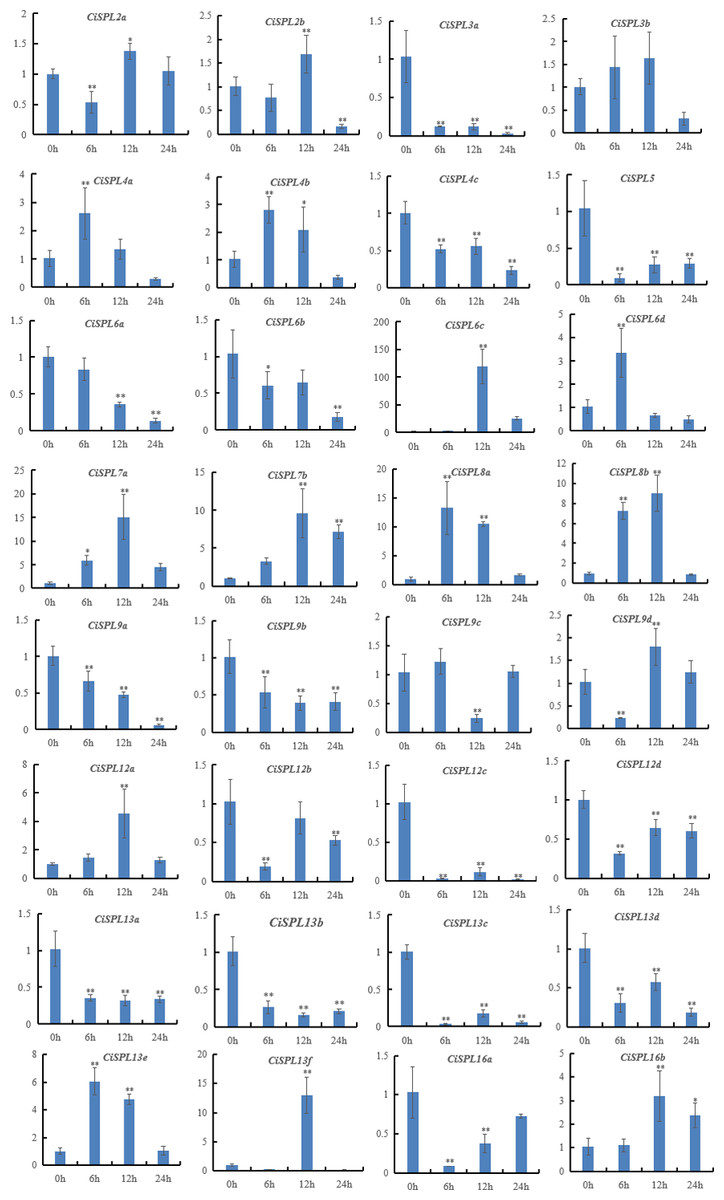
Figure 9: Expression profiles of 32 CiSPL genes under drought stress using qRT-PCR.
The relative expression levels of CiSPL genes were normalized with respect to the reference gene actin under drought stress treatment. Error bars represent the standard deviations (SD). Asterisks on top of the bars indicate statistically significant differences between stress treatment and the control (∗0.01 < P < 0.05; ∗∗p < 0.01). X-axes show time courses of drought stress treatments for each gene. Y-axes indicate the scale of the relative expression levels.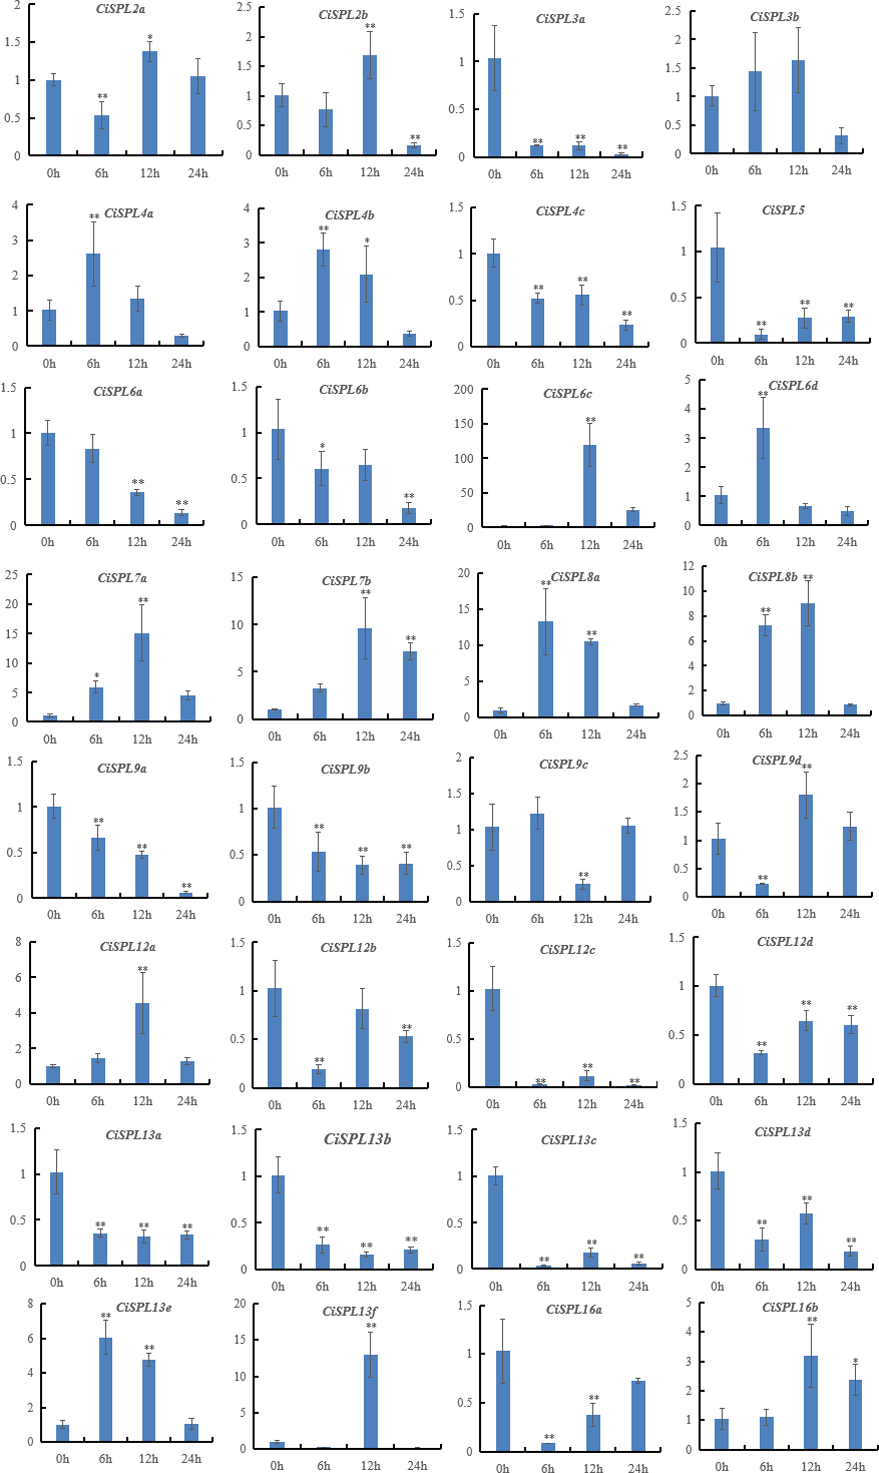
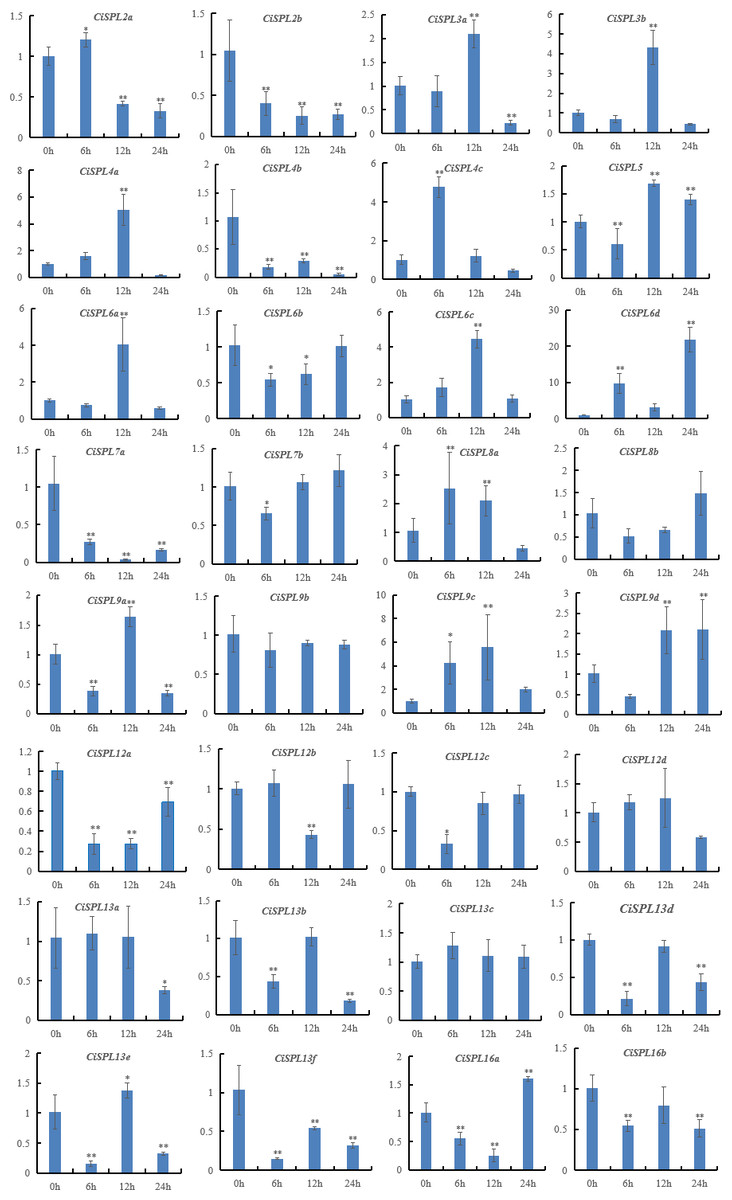
Figure 10: Expression patterns of 32 CiSPL genes under salt stress using qRT-PCR.
Samples were collected 0, 6, 12, and 24 h after treatment, and the relative expression levels were analyzed. X-axes represent time points after salt treatment. Y-axes represent relative gene expression values normalized to reference gene actin. Error bars indicate the standard deviations (SD). Asterisks on top of the bars indicate statistically significant differences between the stress treatment and the control (∗0.01 < P < 0.05; ∗∗p < 0.01).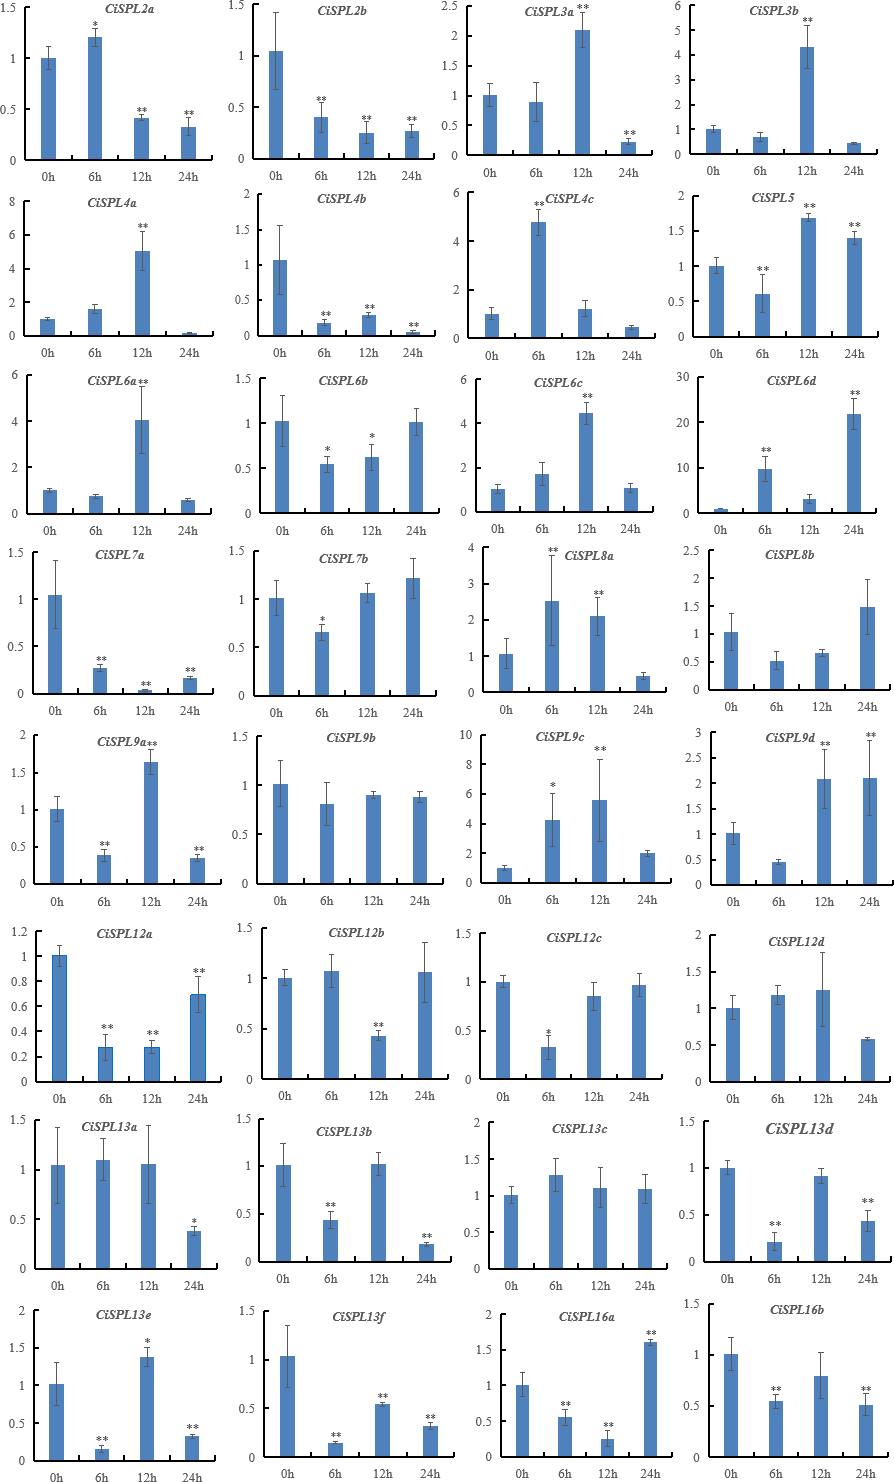
Under the NaCl treatment, nearly half of the 32 SPL genes were induced (Fig. 10, Table S7). However, six CiSPLs (CiSPL2b, -4b, -7a, 12a, -13f, and -16b) were down-regulated during the whole stress treatment process. CiSPL4c was significantly expressed at 6 h. The transcription level of six genes (CiSPL3a, -3b, -4a, -6a, -6c, and -9c) reached the maximum at 12 h. CiSPL8a and CiSPL13e were slightly induced at 12 h. CiSPL6d gene expression reached its peak at 24 h (nearly 20-fold over the control). CiSPL9d was induced at 12 h and 24 h, and the expression level was nearly the same.
Discussion
It has been established that the SPL gene family of plant specific transcription factors plays important roles in plant growth and development, as well as abiotic and biotic stress. Previous research on SPL transcription factors mainly focused on model plants. In this study, the function of SPLs was identified and investigated in a woody species, Carya illinoinensis. The whole genome identification of SPL transcription factors has been reported in several plant species with varying results (Table S5). The numbers were relatively conservative among Arabidopsis (17 members), grapevine (18 members), jujube (18 members), chestnut (18 members), rice (19 members), and strawberry (19 members). Recent studies also identified 30 SPL genes in hickory (Carya cathayensis), 30 SPLs in pecan (Carya illinoensis), and 37 SPLs in Juglans regia (Wu et al., 2019). However, a different study identified 48 SBP-box genes from Juglans regia (Zhou et al., 2020). In this study, 32 SPL genes were identified in the pecan genome, which was two more SPL genes than what was found in previous studies. We also identified the SPL gene family of pecan from the newly released genome (https://phytozome-next.jgi.doe.gov/info/CillinoinensisPawnee_v1_1) (Lovell et al., 2021). The number of SPL gene family members was found to be the same in the two versions of the pecan genome (Table S8). This indicates that the number of SPL genes is similar to that of different genera of Juglandaceae, apple (27 members), and poplar (28 members).
Using the phylogenetic tree analysis and protein sequence multiple alignment, the SPL proteins from pecan, Arabidopsis, rice, and poplar were divided into eight subgroups (I–VIII). Each subgroup had an unequal number of genes from pecan, Arabidopsis, and rice, while the numbers of pecan and poplar genes in each subgroup was similar. Phylogenetic analysis showed that the CiSPL genes were closely associated with PtSPL genes, which is consistent with the fact that pecan and poplar are woody plants. CiSPL genes’ diverse gene structures and protein motifs can help better understand their different roles in development and growth. Gene structure analysis showed that subgroup II CiSPL genes had the largest number of introns (nine), while other subgroups contained only two to three introns. Interestingly, two members (CiSPL4c and CiSPL9d) had no introns. Previous studies have shown that complete intron loss contributes to a new gene generation (Volokita, Rosilio-Brami & Rivkin, 2011). Intron variation in CiSPLs may be caused by two mechanisms: intron loss and intron gain. SPL genes has been amplified in a large number of plant genomes. The main amplification mechanisms are tandem and/or segmental duplication (Cannon et al., 2004). In our analysis, the segmentally duplicated gene pairs of CiSPLs accounted for over 50% of the entire SPL gene family in pecan (Fig. 4), but no tandem duplications were found. This result supported the interpretation that segmental duplication is the main reason for the amplification of SPL gene family members in pecan. To explore the macro evolution model in pecan, the Ka/Ks ratios for the segmentally duplicated gene pairs were estimated (Lan et al., 2019). Coincidentally, the peak values of Ka/Ks ratios for the Ci-Ci and Ci-At gene pairs were both between 0.3 and 0.4, implying a strong selection constraint and purifying selection in the CiSPL genes.
Pecan has a long vegetative growth period, late flowering and fruiting, and poor economic benefit, which have restricted its industrial development (Randall et al., 2015; Zhang, Peng & Li, 2015). Recent research on pecan flower bud differentiation, domestically and abroad, has mainly focused on phenological observation, external morphology, and internal anatomical structure. In our study, most CiSPL genes displayed different expression levels at different floral stages, implying that CiSPL genes mainly play roles in pecan flower development. Similarly to walnut, most of the JrSBP genes play an important role in flower induction (Zhou et al., 2020). In Arabidopsis, AtSPL3, SPL4, and SPL5 primarily promoted floral induction and/or floral meristem identity (Yamaguchi et al., 2009; Cardon et al., 1997; Wang, Czech & Weigel, 2009). Phylogenetic analysis showed that AtSPL3 was highly orthologous to CiSPL3a and CiSPL3b, while AtSPL4 and AtSPL5 shared close relationships with CiSPL4a, CiSPL4b, CiSPL4c, and CiSPL5. Four (CiSPL3a, CiSPL3b, CiSPL4b, and CiSPL4c) of the six CiSPL genes were expressed during the flower development process, indicating that these genes may be involved in the development of the flower. In Arabidopsis, AtSPL2, AtSPL10, and AtSPL11 jointly regulated the development of lateral organs during the reproductive stage, and were also involved in regulating the morphogenesis of stem leaves and flowers (Shikata et al., 2009). AtSPL2, AtSPL10, and AtSPL11 were highly orthologous to CiSPL2a and CiSPL2b, which were mainly up-regulated during the transformation from stem apical meristem (SAM) to floral meristem (undifferentiated, early differentiated, and inflorescence forming stages). Some CiSPL genes appeared to show similar expression patterns during specific pecan stages, which may reflect their participation in a common developmental process. For example, some genes in subgroup I (CiSPL13c/13d) and III (CiSPL8a/8b) had high expression during the flowering stage, while several genes in subgroup V (CiSPL3a/3b), were highly expressed in the flower buds. Therefore, we concluded that gene function differentiation existed in the same subfamily.
Previous studies focused on the role of SPL genes in development, but the function of SPL genes under stress has been seldom studied. In our study, the CiSPL genes showed diverse expression patterns under drought and salt stresses. qRT-PCR analysis showed that six SPL genes (CiSPL4a, CiSPL6c, CiSPL6d, CiSPL8a, CiSPL9d, and CiSPL13e) were up-regulated under the two stress treatments, confirming that these CiSPL s may actively participate in regulating stress responses. Gene expression regulation is mainly carried out at the transcription level, which is coordinated by a variety of cis-acting elements and trans-acting factors. TC-rich repeats and MBS were found in 21 CiSPL promoter regions. Analysis of CiSPL expression levels showed that these CiSPLs were strongly affected by at least one stress. Among the 11 genes that were mainly induced by drought stress, eight genes had promoter regions that contained MBS cis-elements. Some CiSPL genes were not induced under either drought or NaCl stress (CiSPL13a, CiSPL13b, CiSPL13c, and CiSPL13d, belonging to subgroup VII), and showed low gene expression under the two stresses.
In our study, there were 16 collinear gene pairs between Arabidopsis and pecan. Most of these orthologs were one-to-one relationships, although some orthologs showed one-to-two relationships. Among the two gene pairs (CiSPL6a/6b-AtSPL6, CiSPL16a/16b-AtSPL16), CiSPL6a and CiSPL6b expression showed differences under salt stress and during fruit development, while CiSPL16a and CiSPL16b expression differed under drought and salt stress. We inferred that these duplicated gene pairs experienced functional divergence, and one of them acquired a new function: ‘neofunctionalization’. The other gene pairs presented the same expression pattern, which showed that most collinear genes had conservative functions.
Conclusion
The CiSPLs were characterized using detailed analyses of their phylogenetic relationships, gene structure, conserved motifs, duplication events, and expression profiles. A total of 32 CiSPL genes were identified from the pecan genome in this study. The CiSPLs were divided into eight groups based on their phylogenetic analysis and homology with Arabidopsis. There were similar gene structures and motifs in the same subgroups. Cis-element analysis showed that CiSPLs were regulated by plant hormones and various stresses. The CiSPLs played an important role in the flower development process. CiSPL genes also showed distinct spatiotemporal expression patterns in response to drought and salt treatment. In general, our data increased our understanding of the evolutionary relationships and biological functions of SPL genes in pecan. Ultimately, the results of this study lay a foundation for revealing the further functional characterization of the SPL gene family.
Supplemental Information
Multiple alignments of the conserved SBP-domains for the pecan SPL proteins
The SBP conserved domain contains two zinc finger structures and one NLS structure.