
Identification of quantitative trait loci underlying five major agronomic traits of soybean in three biparental populations by specific length amplified fragment sequencing (SLAF-seq)
- Published
- Accepted
- Received
- Academic Editor
- Julin Maloof
- Subject Areas
- Genetics, Plant Science, Population Biology
- Keywords
- Soybean, QTL, SLAF-seq, Genetic map, Flowering time
- Copyright
- © 2021 Hu et al.
- Licence
- This is an open access article distributed under the terms of the Creative Commons Attribution License, which permits unrestricted use, distribution, reproduction and adaptation in any medium and for any purpose provided that it is properly attributed. For attribution, the original author(s), title, publication source (PeerJ) and either DOI or URL of the article must be cited.
- Cite this article
- 2021. Identification of quantitative trait loci underlying five major agronomic traits of soybean in three biparental populations by specific length amplified fragment sequencing (SLAF-seq) PeerJ 9:e12416 https://doi.org/10.7717/peerj.12416
Abstract
Flowering time, plant height, branch number, node numbers of main stem and pods per plant are important agronomic traits related to photoperiodic sensitivity, plant type and yield of soybean, which are controlled by multiple genes or quantitative trait loci (QTL). The main purpose of this study is to identify new QTL for five major agronomic traits, especially for flowering time. Three biparental populations were developed by crossing cultivars from northern and central China. Specific loci amplified fragment sequencing (SLAF-seq) was used to construct linkage map and QTL mapping was carried out. A total of 10 QTL for flowering time were identified in three populations, some of which were related to E1 and E2 genes or the other reported QTL listed in Soybase. In the Y159 population (Xudou No.9 × Kenfeng No.16), QTL for flowering time on chromosome 4, qFT4_1 and qFT4_2 were new. Compared with the QTL reported in Soybase, 1 QTL for plant height (PH), 3 QTL for branch number (BR), 5 QTL for node numbers of main stem, and 3 QTL for pods per plant were new QTL. Major E genes were frequently detected in different populations indicating that major the E loci had a great effect on flowering time and adaptation of soybean. Therefore, in order to further clone minor genes or QTL, it may be of great significance to carefully select the genotypes of known loci. These results may lay a foundation for fine mapping and clone of QTL/genes related to plant-type, provided a basis for high yield breeding of soybean.
Introduction
Soybean is an important commercial crop in the world, and one of the major sources of vegetable protein and oil (Wilcox, 2004). However, due to the photoperiodic sensitivity of soybean, a given superior cultivar can only be planted in a specific ecological area or geographical latitude, thus limiting its potential for widespread cultivation. The growth period of soybean, namely flowering time and maturity, is an important ecological index of photoperiod phenomenon (Panthee et al., 2007), it is also closely related to yield, quality and planting area of soybean.
Up to now, a total of 473 QTL associated with flowering time and maturation of soybean have been preserved in public Soybase. More than ten genes related to flowering time and maturity have been cloned; The most important of these are E series genes. In 2008, E4 gene was cloned and identified as phytochrome A (GmphyA2) (Liu et al., 2008). The E3 gene was cloned in 2009 by map-based cloning, and E3 was found to be another copy of the phytochrome A (GmphyA3) (Watanabe et al., 2009). When the E3 and E4 loci carry dominant alleles, the flowering time and maturation of soybeans were both delayed, while when the genotype was homozygous recessive, the flowering time and maturation of soybean were both accelerated. E2 gene was a homologous gene of GIGANTEA (GI) in Arabidopsis; there were a few alleles of E2 in soybean varieties. Under natural light, the e2 genotype may lead to early flowering by up-regulating the expression abundance of GmFT2a. E2 gene contributed significantly to the growth period of soybean, but had little effect on the photoperiod response (Watanabe et al., 2011). E1 can inhibit flowering and delay soybean growth period. Xia successfully cloned E1 gene using Harosoy near-isogenic line, and discovered that the E1 gene is a unique transcription factor of legume crops (Xia et al., 2012). Flowering and maturity of soybean are controlled by major genes, and four key maturity loci (E1–E4) are helpful to understand the mechanism of flowering and maturity. Allelic combinations of these genes determine the diversity of maturation and their adaptation to different latitudes (Li et al., 2017; Jiang et al., 2014). In recent years, some genes that can regulate flowering, such as E9 (Kong et al., 2014), J (Lu et al., 2017), FT (Kong et al., 2010; Zhai et al., 2014a) and PRR (Li et al., 2019) have been isolated.
Phenotypes, such as plant height, branch number, node numbers of main stem and pods per plant of soybean, are important agronomic traits, it is closely related to planting density, lodging resistance, canopy structure and photosynthetic efficiency of soybean, and has an important effect on the soybean yield. In Soybase database, QTL for plant height, branch number, node numbers of main stem and pods per plant are 230, 21, 38 and 51, respectively. Plant height, branch number and nodes are important plant architecture traits, and there are many studies on genetic and QTL mapping in soybean (Liu et al., 2013; Panthee et al., 2007; Zhang et al., 2004; He et al., 2014; Sayama et al., 2010; Assefa et al., 2019). Pods per plant are an especially important factor in determining soybean yield (Board & Tan, 1995). QTL for flowering and pods number were identified using 152 recombinant inbred lines and a linkage map of 306 markers. Two main QTL (qpn-Chr11 and qpn-Chr20) were detected for pods number (Zhang et al., 2010).
Quantitative traits are mostly regulated by multiple genes and affected by environment, and QTL mapping requires the construction of high-quality genetic linkage map. Polymorphic molecular markers are needed to construct the genetic map. High throughput of molecular markers development is very necessary. With the rapid development of sequencing technology, molecular markers have been transformed from traditional RFLP, RAPD and AFLP to the SSR or SNP markers. These molecular markers have significantly improved in speed, cost, and amount of information, speeding up the construction of genetic maps, gene mapping, and cloning. Specific loci amplified fragment sequencing (SLAF-seq) is a set of simplified genome sequencing technology, which has the advantages of long reads, high flux, flexible design, etc. Up to 100,000 labels can be developed at a time to obtain genome-wide cariation information (Sun et al., 2013). It has been widely used in the genetic map construction, QTL mapping, gene location and molecular breeding. Some important QTL were identified in soybean using this technique. A high-density genetic map covering a 2,144.85 cM soybean genome was constructed using 3,255 SLAF-markers. Six QTL for plant height and eleven QTL for flowering time were mapped (Ca et al., 2017). The map consisted of 5,785 SLAFs on 20 linkage groups (LGs) with a genome size of 2,255.18 cM. The 20 linkage groups had high collinearity with the reference genome (Li et al., 2014 ).
In the previous study, 180 cultivars were genotyped at the E1 to E4 loci, and the flowering time and maturity of these cultivars were investigated; Statistical analysis showed that allelic variations at each of four loci had a significant effect on flowering time and maturity (Zhai et al., 2014b). A total of 30 consistent QTNs were detected for flowering time (R1) and maturity (R7 and R8) on 16 chromosomes by genome-wide association study (GWAS) of 235 cultivars, and the known E loci were detected in different environment and year (Wang et al., 2018). Previous results have also showed that in the same genotypic populations, the time range to flowering and maturation is quite large, suggesting that there is some unknown genetic factor.
Therefore, one of the objectives of this study is to identify new or minor QTL for flowering time. Plant height, branch number, node numbers of main stem and pods per plant are important plant-type and yield traits, QTL mapping of these traits can lay a foundation for further cloning related genes, which is helpful to breed high-yield soybean cultivars.
Materials and Methods
Plant materials and field trails
The parents for developing biparental populations were selected according to different genetic background and soybean variety origin (Zhai et al., 2014b). Three populations were developed from a cross of Daheiqi and Pixian Ruantiaozhi (named Y32); Liaodou No.15 and Jilin No.35 (named Y133); Xudou No.9 and Kenfeng No.16 (named Y159), respectively. Randomized interval field trials were performed for each population. In 2015, three F2 genetic populations were planted using a consistent sowing method in the experimental field in Harbin. The row spacing was 60 cm, the line length was 5 m, and the plant spacing was 20 cm. In order to maintain relative uniform condition and obtain exact data in field, the emergence data of each individuals was recorded, and the plant spacing was consistent. Conventional field management were adopted, individual plant harvested and major agronomic traits were investigated.
Phenotyping
The investigation standards was based on soybean germplasm resources description specification and data standard and other research articles published (Fehr et al., 1971; Sayama et al., 2010 and Chen et al., 2007). Flowering time (FT) is the number of days from the emergence (VE) to the opening of the first flower (R1) found at any node on the main stem. After the soybean matured, each plant was harvested into a mesh bag to keep the plant intact. Plant height (PH) is the length from the cotyledonary node to the top of the plant. Branch number (BR) indicates the effective branches of the main stem. Node numbers of main stem (Nodes) indicate the number of nodes from the cotyledonary node to the top of the main stem. Pods per plant (Pods) indicate the number of pods with normal seeds.
Genotyping and construction of genetic linkage map
DNA was extracted from leaves by hexadecyltrimethylammonium bromide (CTAB) method with slight modification (Murray & Thompson, 1980; Xia et al., 2007).
To develop high-density molecular markers, 104 individuals of Y32 population, 105 individuals of Y133 population, and 104 individuals of Y159 population were randomly selected from the F2 population, and genotyping was performed by SLAF-seq technology in Biomarker Technologies Corporation. Firstly, in order to select the most suitable scheme and to predict the reference genome by enzyme digestion, the enzyme HaeIII was selected in this study. The length of restriction fragments between 264 bp and 364 bp was defined as the SLAF tag. The sample DNA was digested with enzyme according to the program to obtain SLAF tag and treated with 3′end plus A. Sequencing connectors, PCR amplification, purification, mixing and gel cutting were connected to the target fragment, and the prepared library was sequenced with Illumina Hiseq 2500.
Reads of each sample were obtained by identifying the raw data with the Dual-index connector sequence. The reads with connector sequence and N content more than 10% of the total length were filtered. Reads were compared with the genome to search for the polymorphisms SLAF tags. To ensure the quality of genetic map, polymorphisms SLAF tags were filtered. The filtering principle was that the depth of parental sequence was less than 10X, the number of SNPs was more than three, and the markers were severe deviation (P < 0.05). The modified LOD (MLOD) between the two tags was calculated to further filter the tags whose MLOD was less than three (Stam, 1993). High-density genetic map including 20 linkage groups (LGs) was constructed using High Map software (Liu et al., 2014). The genetic linkage map was constructed by interval plotting, and the recombination rate was converted into cell distance units (cM) by Kosambi function (P = 0.001).
QTL mapping and epistatic analysis by ICIM
After the genetic linkage map was constructed, the QTL for the main agronomic traits, such as flowering time, plant height, branch number, node numbers of main stem and pods per plant, were mapped by QTL Icimapping_4.0 software with the phenotypic data (Li, Ye & Wang, 2007). Composite interval mapping (ICIM-ADD) was used for QTL mapping, and LOD = 2.5 was the minimum threshold for QTL existence. Compared to the reported QTL loci or genes in Soybase, QTL with physical distance less than 5 Mb from known QTL were listed. After dividing into sub-populations, the sampe size with E1 and e1 background were 36 and 29 in Y32 population, respectively. The sample size with E1 and e1 background were 32 and 30 in Y133 population, respectively. The sample with E2 background was 34 in Y159 population. QTL mapping was also conducted in the sub-populations.
Epistatic analysis of QTL was conducted by ICIM-EPI method. LOD = 5 was the minimum threshold for QTL with epistatic interaction.
Genotyping of the E1 and E2 genes
Genotyping of the E1 and E2 loci was performed in populations according to published procedures, respectively (Xu et al., 2013; Zhai et al., 2014b). Due to the sample problem, several individuals of three populations were excluded for verification.
The E1 was genotyped by amplifying genomic DNA with the primer pair (Forward: TCAGATGAAAGGGAGCAGTGTCAAAAGAAGT; Reverse: TCCGATCTCATCACCTTTCC). The PCR was performed using the following program: 30 cycles at 94 °C for 20 s, 58 °C for 30 s, and 72 °C for 30 s. A 443/444 bp fragment was amplified and used to distinguish e1-as from E1 with the aid of relevant restriction enzymes, TaqI. The 142 bp fragment was amplified with primers (Forward: GAAGCCCATCAGAGCATGTCTTATT; Reverse: GAGGCAGAGCCAAAGCCTAT) and the DraI digestion was performed. The PCR procedurewas the same as that of E1 amplification. The fragment amplified from E2 allele was not cut off; while that from e2 allele could be cut into 115 bp and 27 bp fragments.
Results
Phenotypic variations in the F2 populations
Based on previous study, soybean cultivars with different genetic background of the major E genes in northern China and Huang-Huai-Hai region were selected for population development. The parents of the three populations shared the same genotypes at E3 and E4 loci (Zhai et al., 2014b); however, the genotypes of E1 or E2 loci were different (Table 1). Flowering time of the three populations showed major separations (Table 2, Fig. 1). Plant height, branch number, node numbers of main stem and pods per plant were also statistically analyzed and showed in Table 2 in detail. All of the traits showed a large separation, and genetic variation. The absolute values of skewness and kurtosis of each trait were less than one and the deviation was small, indicating that these traits were in line with normal distribution, and the map construction and QTL analysis could be carried out.
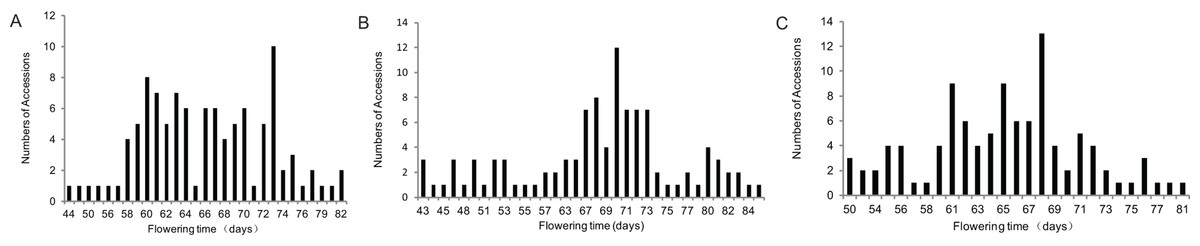
Figure 1: Frequency distributions of flowering time in three F2 populations.
| Population name | Parents | Genotype of E1–E4 | Origin | Number of individuals | FT1 | PH2 | BR3 | Nodes4 | Pods5 |
|---|---|---|---|---|---|---|---|---|---|
| Y32 | Daheiqi | e1-ase2E3HaE4 | Liaoning Province, China | 144 | 51 ± 1.8 | 87 ± 1.1 | 2 ± 1.0 | 21 ± 1.1 | 110 ± 1.7 |
| Pixian Ruantiaozhi | E1E2E3HaE4 | Jiangsu Province, China | 94 ± 1.4 | 98 ± 1.5 | 4 ± 1.4 | 23 ± 1.3 | 121 ± 1.5 | ||
| Y133 | Liaodou 15 | E1e2E3HaE4 | Liaoning Province, China | 137 | 68 ± 2.0 | 79 ± 1.3 | 4 ± 1.2 | 24 ± 1.0 | 109 ± 1.6 |
| Jilin 35 | e1-ase2E3HaE4 | Jilin Province, China | 53 ± 1.9 | 99 ± 1.8 | 2 ± 1.2 | 19 ± 1.5 | 118 ± 1.9 | ||
| Y159 | Xudou 9 | E1E2E3HaE4 | Jiangsu Province, China | 140 | 87 ± 1.3 | 60 ± 1.7 | 3 ± 1.6 | 20 ± 1.6 | 115 ± 1.8 |
| Kenfeng 16 | E1e2E3HaE4 | Heilongjiang Province, China | 54 ± 1.6 | 85 ± 1.2 | 1 ± 1.0 | 19 ± 1.3 | 124 ± 1.9 |
| Trait name1 | Mean2 | StdError3 | Skewness4 | Kurtosis5 | Minimum6 | Maximum7 | W-test8 | |
|---|---|---|---|---|---|---|---|---|
| Y32 | FT | 66.00 | 6.97 | −0.19 | 0.36 | 44.00 | 82.00 | 0.97 |
| PH | 111.64 | 24.50 | −0.68 | 1.42 | 32.00 | 170.00 | 0.95 | |
| BR | 6.13 | 2.03 | 0.21 | −0.3 | 2.00 | 11.00 | 0.96 | |
| Node | 23.28 | 15.91 | 8.94 | 84.69 | 9.00 | 24.00 | 0.31 | |
| Pod | 146.09 | 64.36 | 0.70 | 1.47 | 13.00 | 373.00 | 0.96 | |
| Y133 | FT | 66.74 | 10.63 | −0.62 | −0.31 | 43.00 | 88.00 | 0.91 |
| PH | 99.90 | 25.91 | −0.32 | −0.25 | 34.00 | 160.00 | 0.97 | |
| BR | 4.51 | 1.94 | 0.47 | 0.07 | 0.00 | 10.00 | 0.95 | |
| Node | 19.20 | 3.91 | −0.47 | −0.41 | 8.00 | 26.00 | 0.95 | |
| Pod | 119.97 | 49.60 | 0.92 | 2.31 | 16.00 | 315.00 | 0.95 | |
| Y159 | FT | 64.78 | 6.49 | −0.23 | −0.06 | 50.00 | 81.00 | 0.97 |
| PH | 89.89 | 7.09 | −0.19 | 0.03 | 68.00 | 106.00 | 0.99 | |
| BR | 4.14 | 1.94 | 0.31 | −0.32 | 0.00 | 9.00 | 0.95 | |
| Node | 21.10 | 2.89 | −1.31 | 2.69 | 9.00 | 26.00 | 0.90 | |
| Pod | 121.45 | 47.83 | 0.67 | 0.89 | 33.00 | 306.00 | 0.97 |
Notes:
Marker genotyping and genetic map construction
In order to rapidly develop molecular markers for genetic linkage mapping, three F2 populations were genotyped by SLAF-seq. The Q30 of sequencing data was all above 80% and the GC content was around 40% after removing the low quality markers (Table S1).
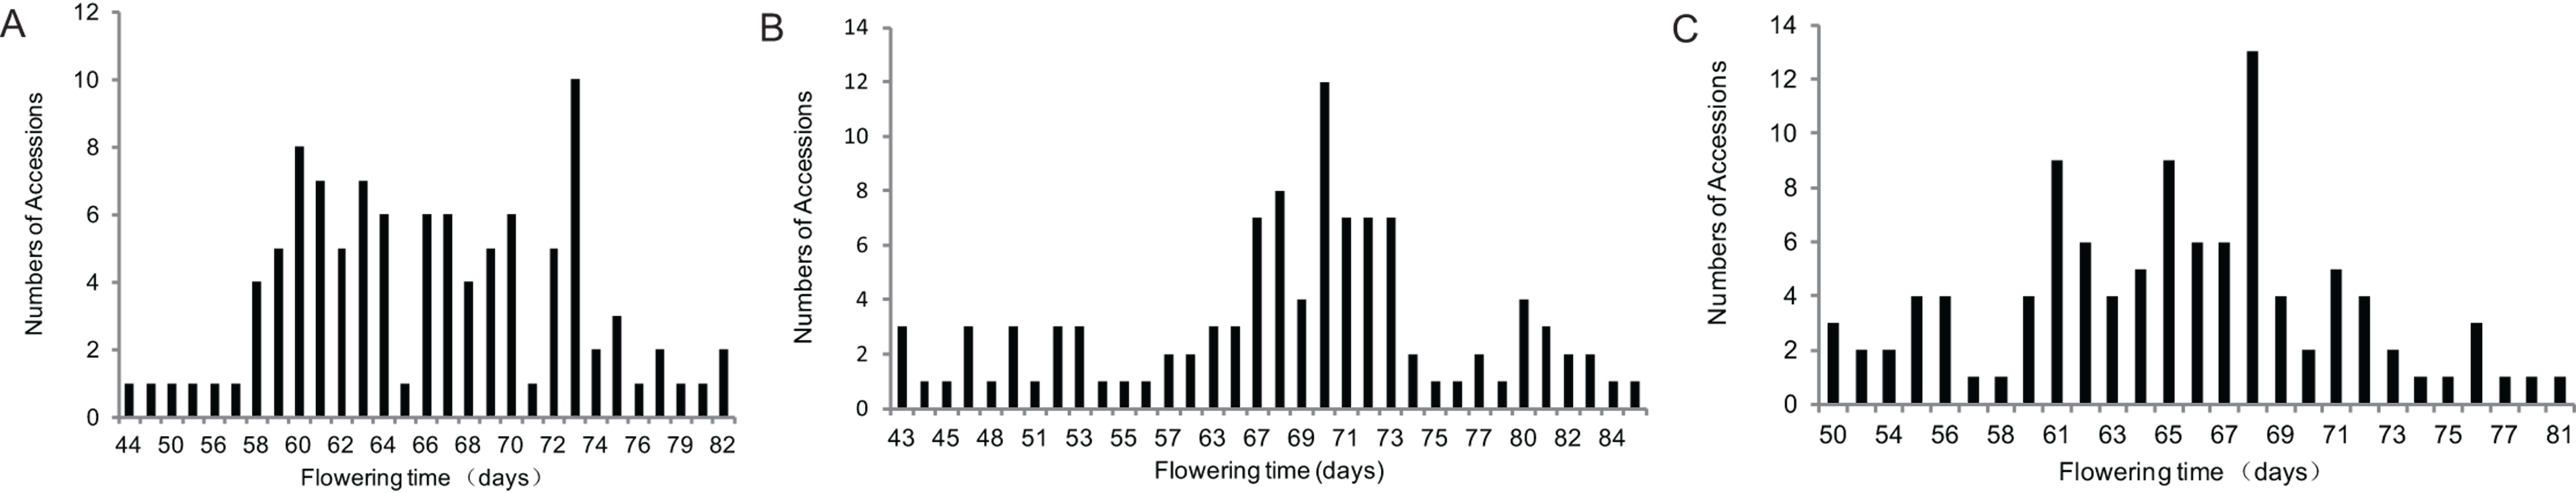
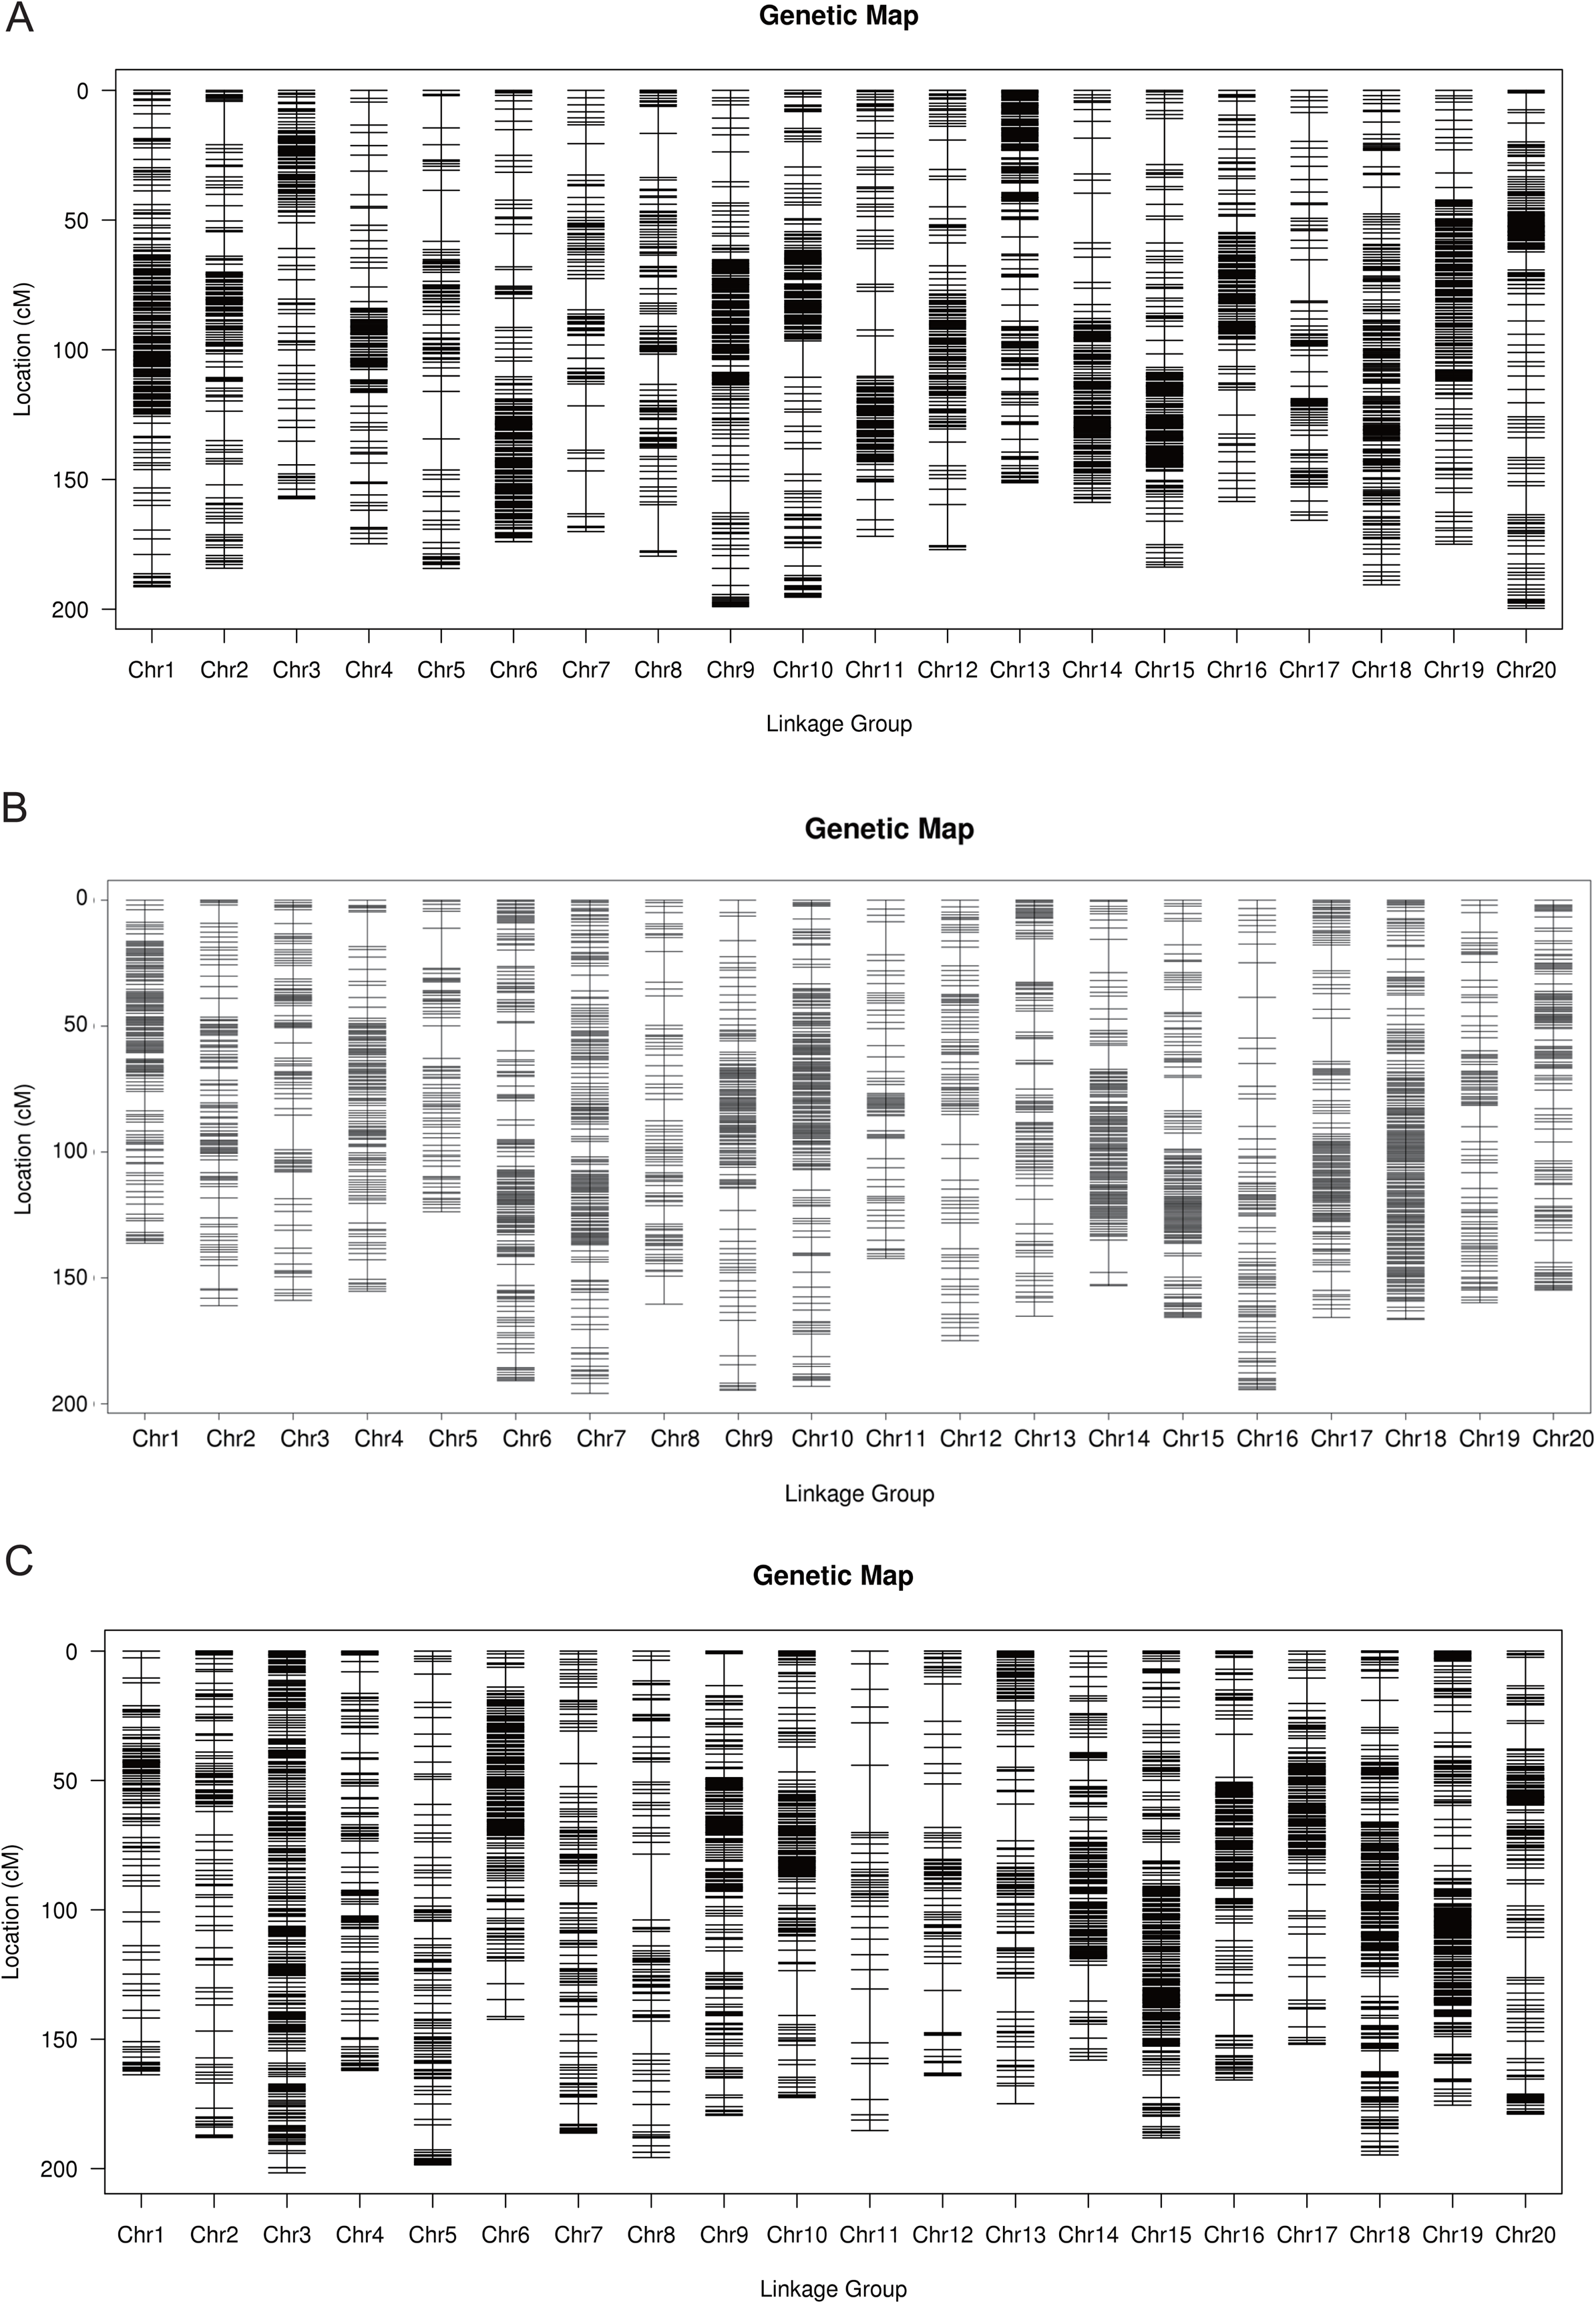
The total number of SLAF markers and polymorphism markers of the three populations were showed in Table S2. In Y32 population, the total length of the genetic map was 3,542.26 cM and the average distance was 0.68 cM (Table 3). In Y133 population, the markers using for constructing linkage map was 6,629, the total length of genetic map of 6,629 cM and the average distance of 0.50 cM (Table 3). In the Y159 population, 6,069 markers were obtained after filtering. The total length of genetic linkage map was 3,527.43 cM and the average distance being 0.58 cM (Table 3). The constructed high-density genetic maps were shown in Fig. 2.
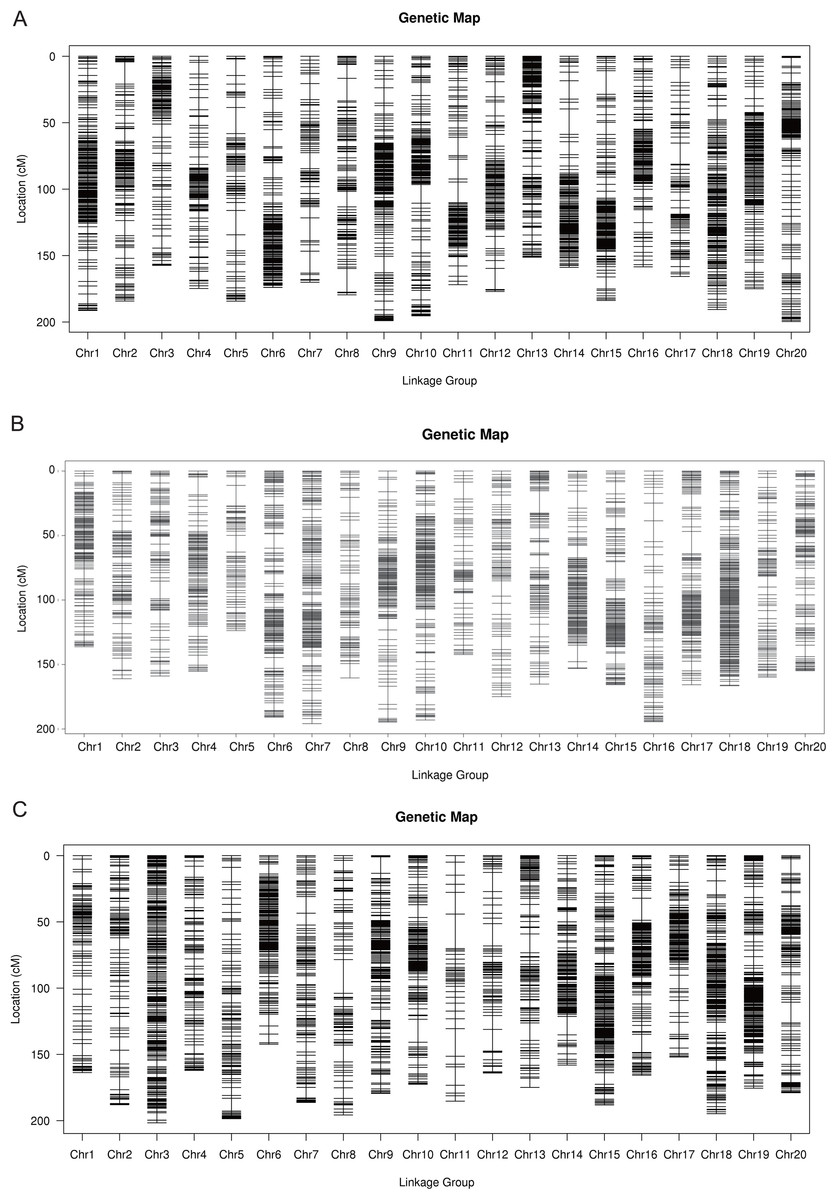
Figure 2: The genetic linkage maps of three F2 populations (A–C).
| Population | Total marker | Total distance (cM) | Average distance (cM) | Max gap (cM) | Gap < 5 cM |
|---|---|---|---|---|---|
| Y32 | 5,248 | 3,542.26 | 0.68 | 19.66 | 0.96 |
| Y133 | 6,629 | 3,312.97 | 0.50 | 17.24 | 0.97 |
| Y159 | 6,069 | 3,527.43 | 0.58 | 26.01 | 0.95 |
QTL mapping for main agronomic traits by ICIM
On the basis of the high-density genetic linkage map, QTL IciMapping 4.0 software and ICIM-ADD model were used to map the important agronomic traits such as flowering time, plant height, branch number, node numbers of main stem and pods per plant.
In the Y32 population, the QTL for flowering time were located on chromosome 6, 10, 18 and 20 (Fig. 3). The LOD value and PVE of QTL on chromosome 6 and chromosome 10 were 13.57, 32.30% and 9.90, 21.59%, respectively, higher than those on other chromosomes. Three QTL for plant height were detected on chromosome 7 and 15, with PVE of 12.49%, 10.75% and 14.22%, respectively. Only one QTL for branch number on chromosome 8. Three QTL for total pods number were detected on chromosome 1, 7 and 9 (Table 4).
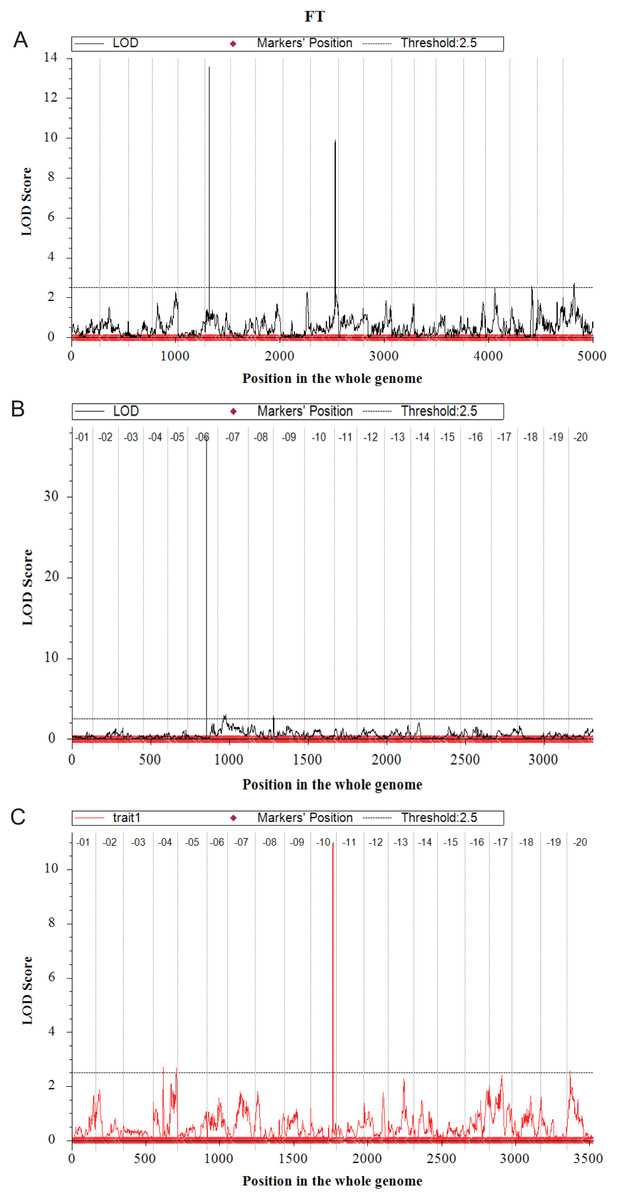
Figure 3: Quantitative trait loci for flowering time mapping by ICIM-ADD in three F2 populations (A–C).
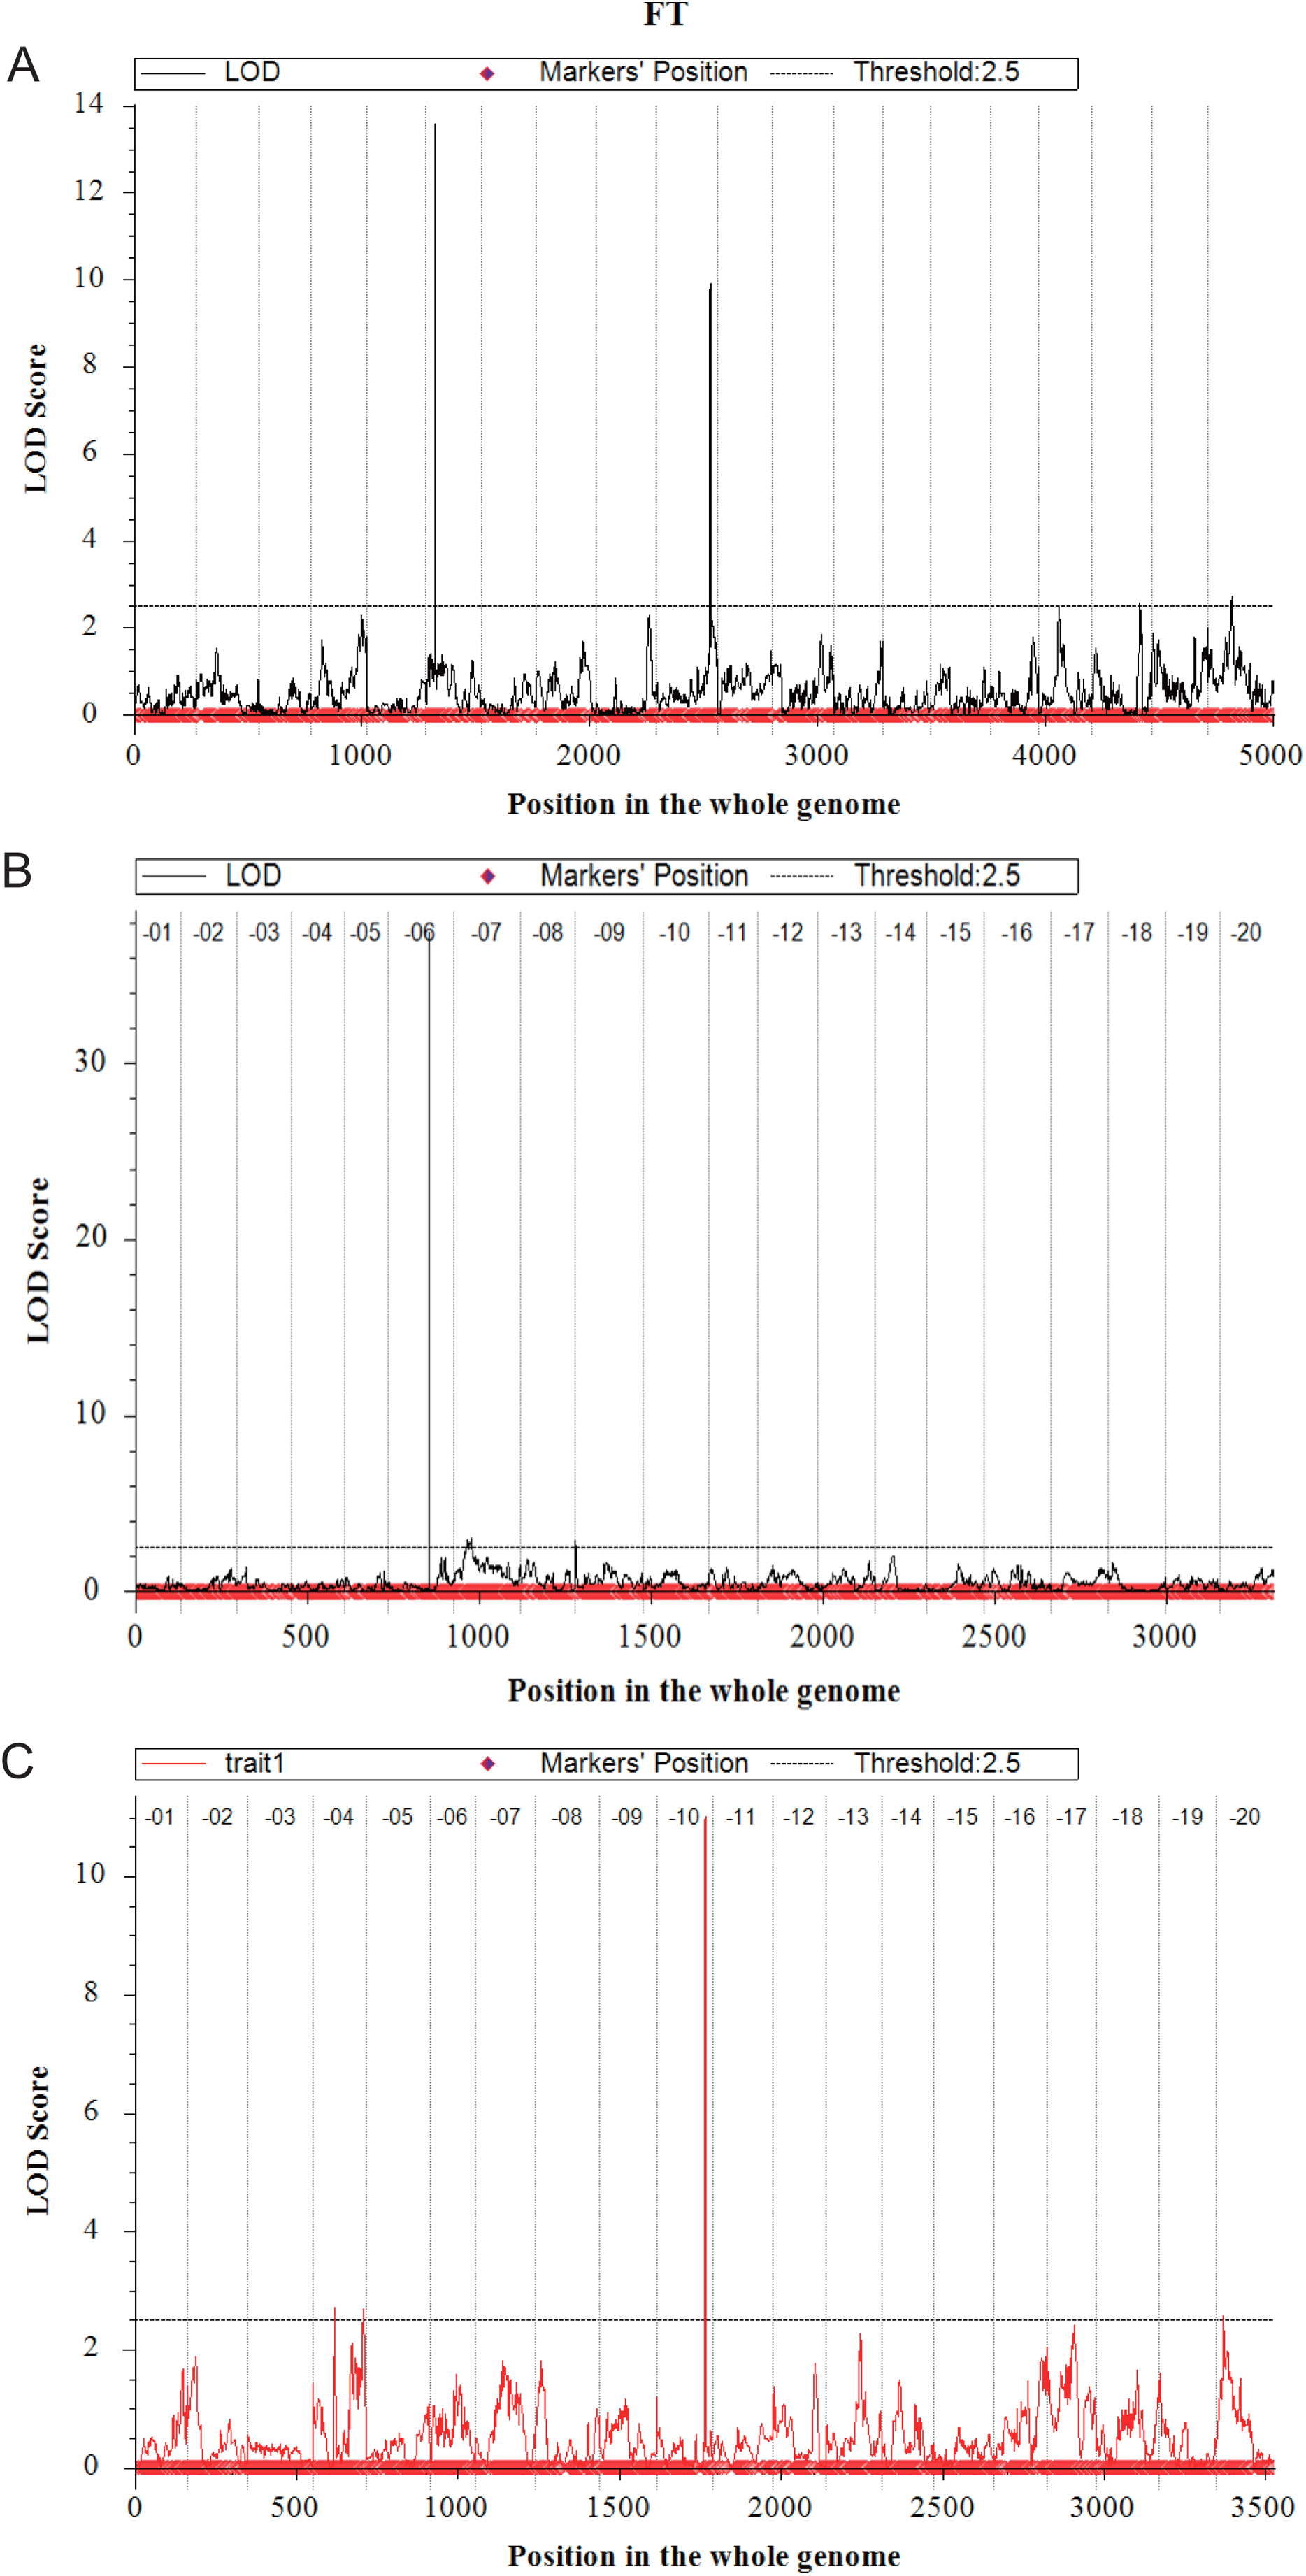
| QTL1 | Chr2 | LeftMarker3 | Physical position (bp) | RightMarker4 | Physical position (bp) | LOD5 | PVE (%)6 | Add7 | Dom8 | Distance to known QTL or gene (kb) | QTL in SoyBase or known gene | |
|---|---|---|---|---|---|---|---|---|---|---|---|---|
| Y32 | qFT6_1 | 6 | Marker323324 | 23537158 | Marker358360 | 27338462 | 13.57 | 32.30 | 1.19 | −9.10 | 3,329.22 | E1 (Xia et al., 2012) |
| qFT10_1 | 10 | Marker776629 | 45046804 | Marker863420 | 45440450 | 9.90 | 21.59 | 1.60 | −7.72 | Included | E2 (Watanabe et al., 2011) | |
| qFT18_1 | 18 | Marker3233026 | 7595593 | Marker3272581 | 5563090 | 2.57 | 4.94 | −0.10 | 4.18 | 1,387.98 | First flower 9-2 (Tasma et al., 2001) | |
| qFT20_1 | 20 | Marker1141036 | 39449778 | Marker1208177 | 39743944 | 2.70 | 4.53 | 1.53 | −2.43 | 2,607.41 | First flower 25-3 (Kuroda et al., 2013) | |
| qPH7_1 | 7 | Marker3543364 | 36305294 | Marker3558465 | 37867013 | 2.66 | 12.49 | −2.50 | 20.10 | Inside | Plant height 37-5 (Yao et al., 2015) | |
| qPH15_1 | 15 | Marker2248389 | 6350243 | Marker2232956 | 6291315 | 2.99 | 10.75 | −0.91 | −22.41 | 1,187.28 | Plant height 29-4 (Liu et al., 2011) | |
| qPH15_2 | 15 | Marker2240384 | 47919789 | Marker2283233 | 47849933 | 3.87 | 14.22 | 11.21 | −4.93 | 3,101.93 | Plant height 13-3 (Specht et al., 2001) | |
| qBR8_1 | 8 | Marker489330 | 10849470 | Marker425892 | 11184428 | 2.55 | 10.67 | 0.85 | −0.12 | |||
| qPod1_1 | 1 | Marker2932559 | 52563296 | Marker2849051 | 51269516 | 2.60 | 11.25 | 19.28 | 26.23 | |||
| qPod7_1 | 7 | Marker3636272 | 39034339 | Marker3559742 | 43637244 | 2.56 | 14.14 | −15.44 | −43.88 | 1,954.73 | Pod number 8-2 (Kuroda et al., 2013) | |
| qPod9_1 | 9 | Marker574929 | 39196944 | Marker585751 | 39126794 | 2.99 | 13.19 | −4.94 | 55.40 | Inside | Pod number 4-2 (Vieira et al., 2006) | |
| Y133 | qFT6_1 | 6 | Marker1511272 | 22576376 | Marker1477657 | 25662576 | 37.41 | 79.84 | −13.44 | 3.41 | 2,368.44 | E1 (Xia et al., 2012) |
| qFT9_1 | 9 | Marker3130054 | 20109767 | Marker3059482 | 19768764 | 2.85 | 2.55 | −2.24 | −0.36 | Inside | First flower 24-2 (Kuroda et al., 2013) | |
| qPH16_1 | 16 | Marker2161238 | 156191 | Marker2199160 | 175385 | 2.65 | 5.80 | −3.13 | −10.17 | 547.79 | Plant height 13-5 (Specht et al., 2001) | |
| qPH19_1 | 19 | Marker1629638 | 44862177 | Marker1741286 | 44948002 | 8.46 | 22.18 | 14.85 | 8.80 | 85.6 | Plant height 10-4 (Orf et al., 1999) | |
| qBR10_1 | 10 | Marker2018083 | 42634098 | Marker1984857 | 42592504 | 2.61 | 8.55 | 0.73 | −0.71 | Inside | Branching 2-1 (Li et al., 2008) | |
| qBR16_1 | 16 | Marker2202176 | 4335021 | Marker2227376 | 4061146 | 2.82 | 10.65 | 0.26 | 1.33 | |||
| qBR16_2 | 16 | Marker2194053 | 32878039 | Marker2180126 | 32881100 | 2.70 | 8.88 | −0.69 | −0.81 | |||
| qNode2_1 | 2 | Marker1045753 | 13457001 | Marker1043109 | 14241316 | 3.56 | 5.13 | 0.97 | 1.24 | |||
| qNode6_1 | 6 | Marker1591836 | 29389703 | Marker1422918 | 20262849 | 17.54 | 38.63 | −3.56 | 1.20 | 43.96 | Node number 2-2 (Zhang et al., 2004) | |
| qNode16_1 | 16 | Marker2199160 | 175187 | Marker2153289 | 119447 | 4.03 | 7.02 | −0.35 | −1.99 | |||
| qNode19_1 | 19 | Marker1603266 | 44854038 | Marker1666593 | 45184768 | 10.94 | 23.75 | 2.43 | 1.66 | |||
| qPod19_1 | 19 | Marker1661937 | 1188581 | Marker1609122 | 527556 | 2.52 | 13.48 | 5.22 | −31.45 | |||
| Y159 | qFT4_1 | 4 | Marker2190645 | 8278635 | Marker2198514 | 14131214 | 2.70 | 7.13 | −2.49 | 0.25 | ||
| qFT4_2 | 4 | Marker2247000 | 49076978 | Marker2157183 | 49623244 | 2.67 | 6.26 | 0.96 | 2.94 | |||
| qFT10_1 | 10 | Marker2556622 | 44734722 | Marker2594984 | 44920804 | 11.01 | 35.33 | −6.31 | 1.04 | 373.93 | E2 (Watanabe et al., 2011) | |
| qFT20_1 | 20 | Marker548749 | 1452527 | Marker564445 | 2408622 | 2.57 | 6.06 | −1.68 | 2.52 | 1,494.79 | First flower 20-3 (Funatsuki et al., 2005) | |
| qPH12_1 | 12 | Marker160225 | 34446165 | Marker286957 | 36996073 | 2.93 | 12.00 | 3.21 | 1.25 | Included | Plant height 17-12 (Kabelka et al., 2004) | |
| qPH14_1 | 14 | Marker3540947 | 12499348 | Marker3510677 | 13522667 | 2.58 | 8.45 | −2.54 | 2.17 | |||
| qPH18_1 | 18 | Marker3020509 | 5811373 | Marker2865777 | 5814304 | 3.23 | 11.86 | −3.40 | 0.65 | Inside | Plant height 23-6 (Reinprecht et al., 2006) | |
| qNode7_1 | 7 | Marker344604 | 2461951 | Marker385437 | 4606180 | 2.64 | 9.60 | 1.39 | 0.15 | |||
| qNode12_1 | 12 | Marker160225 | 34446165 | Marker286957 | 36996073 | 4.45 | 16.90 | 1.60 | 0.18 | |||
| qPod13_1 | 13 | Marker965589 | 33594593 | Marker929333 | 34347994 | 2.77 | 11.07 | −14.97 | 22.20 | 4,860.44 | Pod number 12-1 (Qi et al., 2014) | |
| qPod20_1 | 20 | Marker527124 | 1593395 | Marker479294 | 1533077 | 2.51 | 9.78 | −22.42 | −4.02 |
Notes:
In the Y133 population, the QTL for flowering time was located on chromosome 6 and 9 (Fig. 3), and the major QTL was on chromosome 6, with LOD value of 37.41, and PVE of 79.84%. Two QTL for plant height were located on chromosome 19, with LOD value of 8.46 and PVE of 22.18%. In addition, three QTL for branch number on chromosome 10 and 16 were detected. Four QTL for node numbers of main stem were identified, in which the LOD and PVE of qNode6_1 and qNode19_1 were 17.54, 38.63% and 10.94, 23.75%, respectively. One QTL for pods per plant was located on chromosome 19 (Table 4).
Four QTL for flowering time were located on chromosome 4, 10 and 20, respectively in Y159 (Fig. 3). Among them, the QTL located on chromosome 10 was the major QTL, with LOD value of 11.01 and PVE of 35.33%. Three QTL regulating plant height were detected on chromosome 12, 14 and 18, respectively. Two QTL for node numbers of main stem were located on chromosome 7 and 12, respectively. The LOD of qNode12_1 was 4.45, and the PVE was 16.90%. Two QTL for pods per plant were located on chromosome 13 and 20, respectively (Table 4).
QTL analysis
In three populations, a total of 34 QTL were identified for five traits. The corresponding QTL or known genes reported in Soybase were listed in Table 4. The genotypes of E1 and E2 of parents are shown in Fig. S3. Both in Y32 and Y133 populations, a QTL for flowering time with high PVE (32.30%, 79.84%) near the known E1 loci was detected. A QTL for flowering time near the E2 loci on chromosome 10 was identified in Y32 and Y159 populations, with PVE of 21.59% and 35.33%, respectively. Two QTL for the flowering time on Chr04 in Y159 population were new QTL, and there were two genes (Glyma.04G093900 (AGL24), Glyma.04G101500 (CRY1)) related to flowering in the interval of qFT4_1 in Y159 population.
Flowering time was affected by major E genes and different allelic combination. The E1 and E2 genotypes of each individual were identified in three populations, and the flowering time of the individuals with the same genotype was statistically analyzed (Fig. 4). The flowering time of the individuals with E1E2E3HaE4 genotype was late, and the individuals with e1-ase2E3HaE4 genotype was earlier than the other genotype. E1 gene has a greater effect on flowering time than E2. The flowering time of the individuals having the same genotype was not exactly same in three populations, indicating that E1 and E2 played different roles in different genetic backgrounds, or the other genes regulating flowering time were at play.
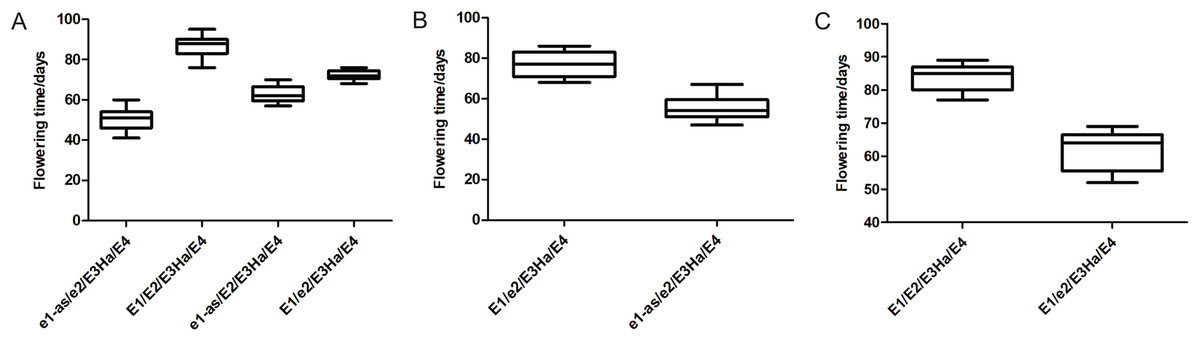
Figure 4: Flowering time of individuals with different genotypes in three populations, respectively. X-axis: different genotype combination of E1–E4, Y-axis: flowering time of each combination. ((A) Y32 population, (B) Y133 population, and (C) Y159 population).
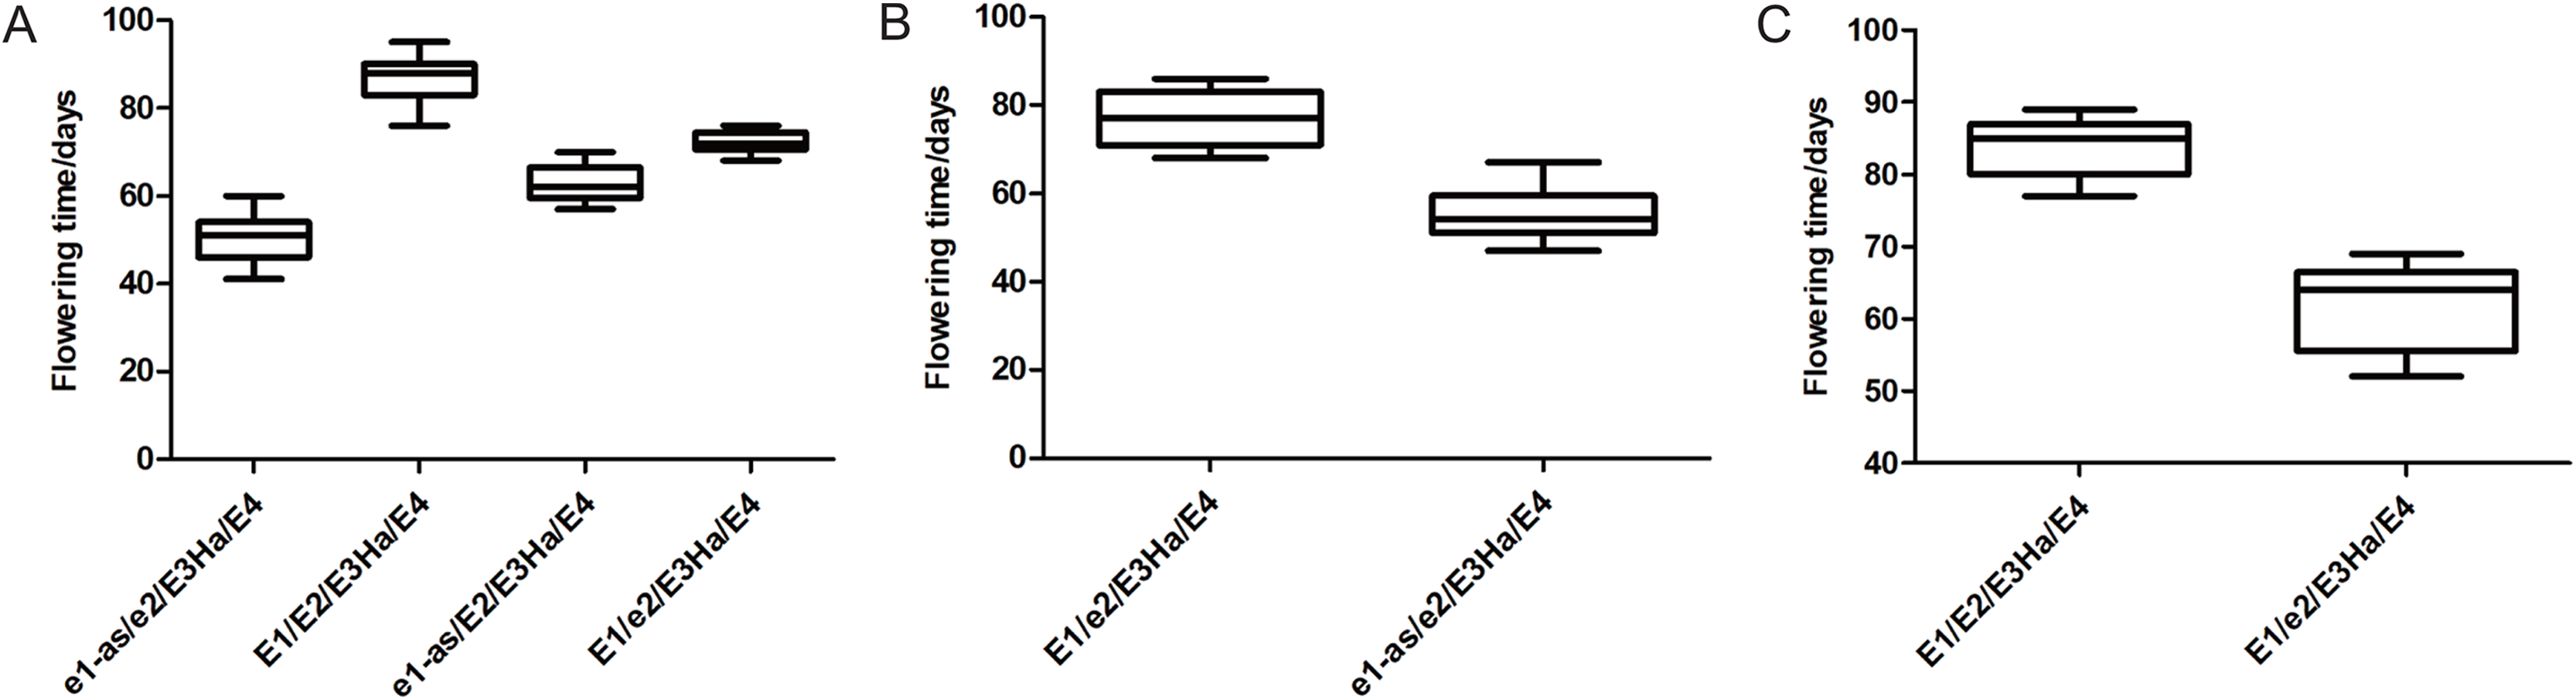
Plant height, branch number, node numbers of main stem and pods per plant were important agronomic traits affecting plant architecture and yield of soybean. A total of 8 QTL for plant height in three populations were detected, and seven of them were corresponding to the reported QTL in Soybase. The QTL, qPH14_1, in Y159 population was new QTL. There were four QTL for branch number identified in Y32 and Y133 populations, of which three were new loci with short interval. Six QTL for node numbers of main stem were detected in Y133 and Y159 population, the QTL qNode6_1 in Y133 population was near the reported loci with about 43.96 kb, and the other five QTL were new loci. Six QTL for pods per plant were detected in three populations, qPod1_1 of Y32, qPod19_1 of Y133 and qPod20_1 of Y159 were three new QTL (Table 4).
E1 and E2 are the main genetic factors controlling flowering time, maturity and geographic adaption in Chinese cultivars. Therefore, it is difficult to detect other QTL with small effects due to the large influence of major genes on flowering time. Based on different E1 or E2 alleles, each population was divided into two sub-populations, and QTL for five agronomic traits with high LOD and PVE were identified in the sub-populations (Tables S3–S5).
Analysis of QTL epistatic effect by ICIM-EPI method
The flowering time of soybean is a complex quantitative trait regulated by many genes or QTL loci. Epistasis is the main genetic basis of complex traits. In this study, epistatic effect of QTL for flowering time was analyzed by ICIM-EPI. In Y32, Y133 and Y159 populations, 22, 64, and 11 pairs of epistatic QTL were detected, respectively (Fig. 5). The PVE value of the epistatic QTL in Y133 population was around 1.5%, and that of the epistatic QTL in Y159 population was higher (around 6.06%).
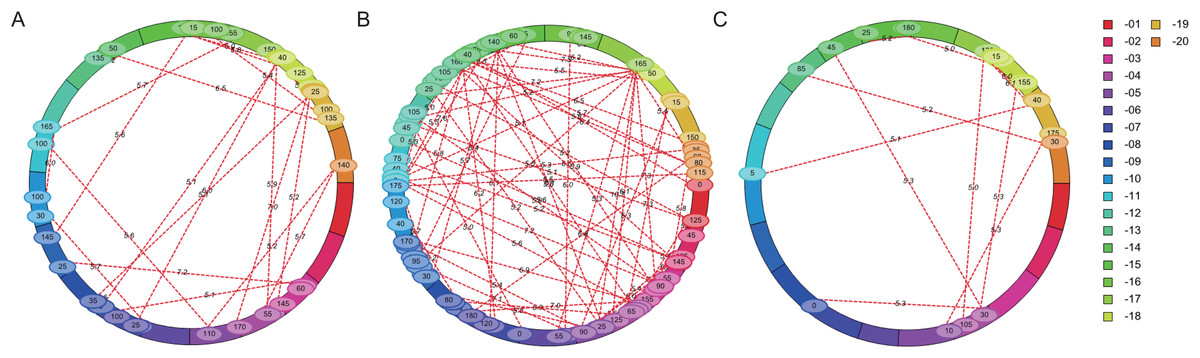
Figure 5: Epistatic interacting QTL of flowering time in three populations detected by ICIM-EPI ((A) Y32 population, (B) Y133 population, and (C) Y159 population).
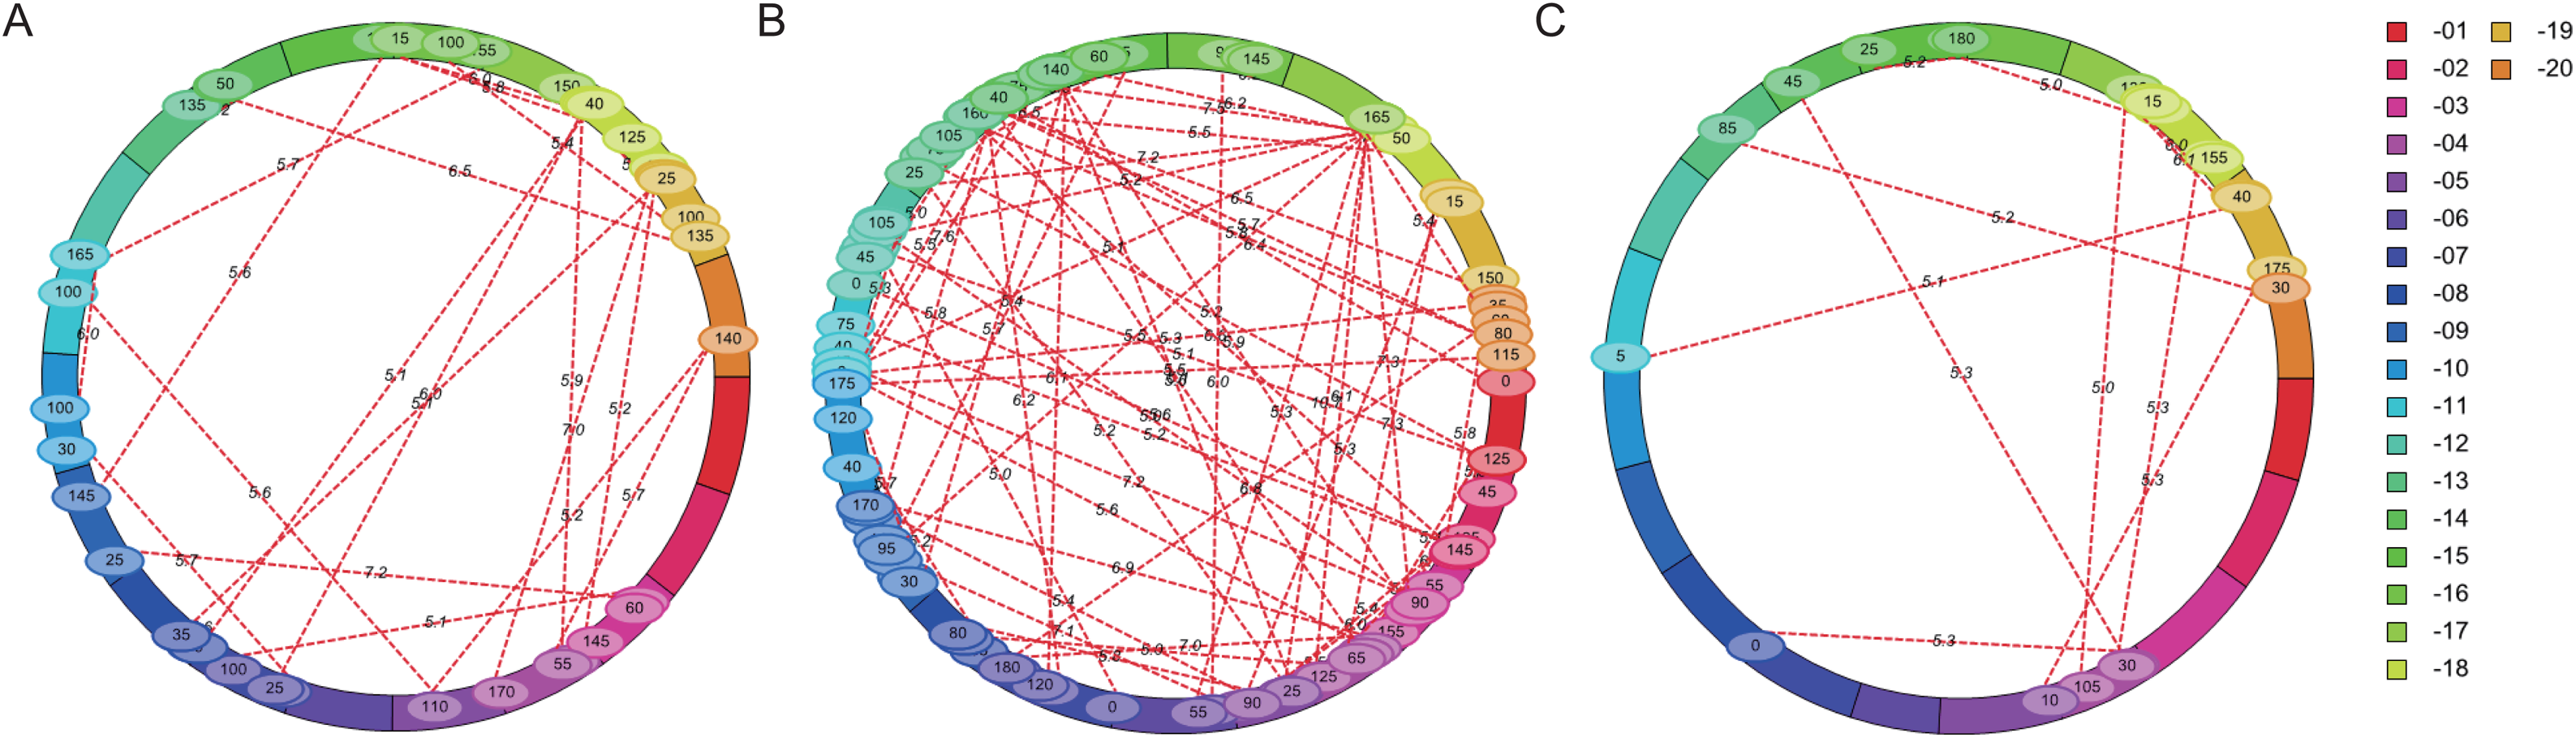
Discussion
Soybean is an important oil and commercial crop, which not only provides plant protein and oil for human beings, but also serves as one of the main ingredients of bean pulp, which is necessary for human dietary pattern and animal husbandry. Flowering time, plant height, branch number, node numbers of main stem and nodes per plant are the important agronomic traits that affect soybean yield, and they are all quantitative traits regulated by multiple genes. QTL mapping and genetic analysis of these traits can reveal the genetic characteristics of each trait, provide the basis for marker-assisted breeding, and available locus for molecular design breeding.
High-throughput sequencing is helpful for QTL/gene mapping and functional research. The construction of high density genetic linkage map is a necessary condition for QTL mapping, and the development of polymorphic molecular markers is a prerequisite for the construction of linkage map. As a new generation of molecular marker, SNP has been widely used for its advantages of high density, good stability and easy automatic analysis. SLAF-seq is a high-resolution strategy for single nucleotide polymorphism genotyping that has been developed in recent years. SLAF-seq has many advantages, such as longer reads, high throughput and flexible scheme design, etc. SLAF-seq can develop 100,000 labels at a time to obtain genome-wide variation information. It has been widely applied in genetic map construction and QTL mapping, gene location and molecular breeding. The final constructed map contained 5,308 markers distributed on 20 linkage groups with a length of 2,655.68 cM (Qi et al., 2014).
The map length was 2,909.46 cM, and the mean distance between markers was 0.57 cM. A total of 35 QTL related to plant height, 100-seeds weight, oil content and protein content were found (Zhang et al., 2018). SLAF-seq was used to construct a genetic map of the recombinant inbred lines (Luheidou 2 × Nanhuizao, F5:8), and the QTL for isoflavone content across various environments were identified with this map (Li et al., 2014). In this study, SLAF-seq technology was used to genotype three F2 generation populations to construct genetic linkage maps. After quality control, 5,248, 6,629 and 6,069 markers were developed in Y32, Y133 and Y159 populations, with total length of 3,542.26, 3,312.97 and 3,527.43 cM, respectively. Collinearity analysis was carried out based on the position of the markers on the genome and the genetic map. The results showed that most of the markers sequences on each linkage group were consistent with the genome, implying that the map had good collinearity and high accuracy. The map constructed with extensive and high-density markers developed by SLAF-seq was of high quantity.
At present, there are few strategies for QTL/gene mapping based on natural population or hybrid populations. Genome-Wide Association Studies (GWAS) is a widely used method for gene location. Population structure becomes complex due to the need to collect a large number of experimental materials. Meanwhile, this method can hardly detect rare variants. Compared with GWAS, gene/QTL mapping based on hybrid population has certain advantages and plays an irreplaceable role. The genetic background of this population is pure; there is relatively little variation between parents. As a temporary population, the F2 generation population has the advantages of relatively simple and time-saving construction, and contains rich genetic information. However, F2 population also have some limitations or disadvantages. Phenotypic data of F2 population are poor in reliability and repeatability, and it is hard to detect minor genes. Therefore, it is necessary to evaluate phenotypic data before QTL mapping. In this study, the phenotypic data of three F2 hybrid populations were investigated in detail, and the results showed that there was a large separation of traits and genetic variation. The absolute values of skewness and kurtosis of each trait were less than one or the deviation is small, which conforms to the normal distribution and meets the requirements of QTL mapping. Due to the limitations of F2 population, it is necessary to identify reconbinants and construct larger subgroups to further fine mapping the QTL.
Soybean cultivars can be grown across the world in a wide range of latitudes from 50°N to 35°S (Watanabe, Harada & Abe, 2012). This is mainly attributed to the rich genetic variability and different allelic combinations of genes or loci that influence the flowering time and maturity. E1, E2, E3, E4 have different impacts on maturity and their allelic variation and combination determine the diversification of soybean maturity and adaptation to different latitudes. Jiang et al. (2014) found that the more recessive alleles at E genes, the earlier the cultivars matured. In the US, a molecular model for soybean maturity based on the alleles underlying the major maturity loci: E1, E2 and E3, can significantly improve soybean breeding efficiency. Among the 48 Chinese cultivars, the E1 and e2 allele were predominant, and the results also showed that China generally had the most variation of E1 and E2 alleles as well as E genotype groups (Langewisch et al., 2017). A total of 59 cultivars sensitive to photoperiod were selected from different ecologies. Among them, E1/e2/E3/E4 was more abundant in the range of N 18°–N 42°, while E1/E2/E3/E4 was distributed south of N 39° (Jiang et al., 2014). Based on preliminary study of the group, Zhai et al. (2014b) evaluated 180 cultivars from six sites for 2 years of flowering time and maturity, and classified them into E1-E4 genotypes. The cultivars with genotypes of e1-as, e2, and E3 and E4 are mainly from Jilin and Liaoning provinces. A total of 67 cultivars or accessions with recessive e2, E1, E3 and E4 were the largest one of eight groups; the geographic distribution of this group was much diversified, from the northern Heilongjiang province, to southern Jiangsu province (the region along the Yangtze River). E1/E2/E3/E4 group were geographically from the southern areas, Jiangsu, Shanghai and Anhui provinces. Similarly, in the previous study, a total of 30QTNs related to flowering time and maturity of soybean were identified by GWAS of 235 cultivars from different countries using medium-density SNP sequences, most of which corresponded to known E1 to E4 genes or the reported QTL region in Soybase (Wang et al., 2018). In this study, parents of three populations were selected from the soybean cultivars among the 235 cultivars using for GWAS analysis. The parents from the Northeast China and Huang-Huai-Hai region were carried with various alleles of E1 or E2 genes, and the difference of these two E loci contributed to different adaptation. A total of 10 QTL for flowering time were detected, some of which were also corresponding to the known E1 and E2 genes, which further explained the core functions of E1 and E2 in different regions affecting flowering time and maturity. Similar to the reported QTL for flowering time, some QTL corresponding to E1 or E2 were frequently detected, indicating that they had the great effect on flowering time.
Due to the dominant role of major E genes in flowering and maturity, the genotypes of known gene loci should be considered to eliminate the effect of major E genes. In order to further clone minor genes or QTL, it is better to select the parents with the same alleles on the major gene loci. However, some studies had mapped the E1 or E2 QTL locus and found new QTL after dividing a population into two sub-populations with the same allele (Lu et al., 2016; Wang et al., 2019; Yang et al., 2017). In this study, each individual of the population was genotyped according to the E1 or E2 loci, and a population was divided into two sub-populations with different genotypes at E1 or E2 loci, and genetic map construction and QTL mapping were performed again. Some additional QTL with high PVE were detected; it might be an effective strategy for detecting minor QTL in the presence of major QTL, while in order to further fine mapping the candidate gene, it is necessary to expand the population size and find important recombinants. The flowering time of soybean is a complex network regulated by multiple genes. There are still new flowering genes or QTL loci that need to be detected. The interaction between flowering genes needs to be further studied, which lays a foundation for revealing the flowering regulatory network in soybean.
The QTL for important quality traits (protein content, oil content), yield traits (pods per plant, 100-seed weight), plant height, branch number, node numbers of main stem had also been identified and studied (Zhang et al., 2010; Yin et al., 2018; Chen et al., 2007; Li et al., 2008). In Soybase database, some reported QTL for these traits were listed in detail. In this study, plant height, branch number, node numbers of main stem and pods per plant were also investigated, and QTL mapping was also carried out. A total of eight plant height related QTL were identified in three populations. Compared with the QTL reported in Soybase, qPH14_1 in Y159 population might be a new QTL regulating plant height. Four QTL for branch number were identified in Y32 and Y133 populations. Six QTL for node numbers of main stem were detected in Y133 and Y159 populations, the QTL qNode6_1 in Y133 population was near the reported loci with about 43.96 kb, and the other five QTL were not reported. Six QTL for pods per plant were detected in three populations, qPod1_1 of Y32, qPod19_1 of Y133 and qPod20_1 of Y159 were three new QTL loci. These QTL mapping can provide a theoretical basis for further genetic analysis of these important traits, enrich QTL loci for important traits, and promote marker-assisted breeding.
Conclusions
A total of 10 QTL for flowering time were identified in three biparental populations. Some QTL were corresponding to the E1 or E2 genes or the other reported QTL. In fact, the E1 and E2 genes may be detected when the parents carry different E1 and E2 genotypes indicating that the major E loci have a significant influence on flowering time. However, the effect of E1 and E2 genes on flowering time are different under various E genes background. In Y159 population, QTL of qFT4_1 and qFT4_2 on chromosome 4 were new QTL for flowering time. In order to clone some minor QTL loci, the population was divided into sub-populations with the same genotype of E genes, and some additional QTL with high PVE were identified. Meanwhile, compared with the QTL reported in Soybase, 1 QTL for plant height (PH), 3 QTL for branch number (BR), 5 QTL for node numbers of main stem, and 3 QTL for pods per plant might be new QTL.