
Genome-wide analysis of BBX gene family in Tartary buckwheat (Fagopyrum tataricum)
- Published
- Accepted
- Received
- Academic Editor
- Genlou Sun
- Subject Areas
- Agricultural Science, Bioinformatics, Molecular Biology, Plant Science
- Keywords
- Regulation, Anthocyanin biosynthesis
- Copyright
- © 2021 Zhao et al.
- Licence
- This is an open access article distributed under the terms of the Creative Commons Attribution License, which permits unrestricted use, distribution, reproduction and adaptation in any medium and for any purpose provided that it is properly attributed. For attribution, the original author(s), title, publication source (PeerJ) and either DOI or URL of the article must be cited.
- Cite this article
- 2021. Genome-wide analysis of BBX gene family in Tartary buckwheat (Fagopyrum tataricum) PeerJ 9:e11939 https://doi.org/10.7717/peerj.11939
Abstract
BBX (B-box), a zinc finger transcription factor with one or two B-box domains, plays an important role in plant photomorphogenesis, growth, and development as well as response to environmental changes. In this study, 28 Tartary buckwheat BBX (FtBBX) genes were identified and screened using a comparison program. Their physicochemical properties, gene structures, conserved motifs, distribution in chromosomal, and phylogeny of the coding proteins, as well as their expression patterns, were analyzed. In addition, multiple collinearity analysis in three monocots and three dicot species illustrated that the BBX proteins identified from monocots clustered separately from those of dicots. Moreover, the expression of 11 candidate BBX genes with probable involvement in the regulation of anthocyanin biosynthesis was analyzed in the sprouts of Tartary buckwheat during light treatment. The results of gene structure analysis showed that all the 28 BBX genes contained B-box domain, three genes lacked introns, and these genes were unevenly distributed on the other seven chromosomes except for chromosome 6. The 28 proteins contained 10 conserved motifs and could be divided into five subfamilies. BBX genes of Tartary buckwheat showed varying expression under different conditions demonstrating that FtBBXs might play important roles in Tartary buckwheat growth and development. This study lays a foundation for further understanding of Tartary buckwheat BBX genes and their functions in growth and development as well as regulation of pigmentation in Tartary buckwheat.
Introduction
Zinc finger protein (ZFP) transcription factors are a large class of transcription factors, capable of interacting with DNA, RNA and proteins, and regulate transcription, RNA packaging, apoptosis, protein folding and assembly, among others (Noman et al., 2019). Based on the protein structure, ZFP can be divided into several subfamilies. Among them, BBX (B-box) is a subfamily of zinc finger structural protein family that occurs in all eukaryotes from single-celled to multicellular organisms (Crocco & Botto, 2013; Fang et al., 2019). These proteins contain one or two B-box domains that are involved in protein-protein interaction with some of them having a CCT (CONSTANS, CO-like and TOC1) domain (Wei et al., 2020). The B-box domain contains one or two B-box motifs with about 40 amino acid residues. Based on the consistency and differences in amino acid sequences of the B-box motif, and the specificity of the zinc ion binding site, the B-box domain can be divided into two types: B-box 1 and B-box 2. Both of them are quite conservative. The CCT domain which is involved in transcriptional regulation and nuclear protein transport contains 42∼43 amino acid residues that are also highly conserved (Gangappa & Botto, 2014).
Previous studies have reported that BBX proteins are involved in seedling de-etiolation, by controlling hypocotyl and lateral root growth and cotyledon extension (Crocco & Botto, 2013; Wei et al., 2016). In Arabidopsis thaliana, AtBBX4, AtBBX20, AtBBX21, and AtBBX22 promotes light morphogenesis, while AtBBX18, AtBBX19, AtBBX24, AtBBX25, and AtBBX32 inhibits light morphogenesis (Datta et al., 2006); In apple, Bai et al. (2014b) found that one BBX protein MdCOL11 responds to UV-B, and interacts with MdHY5 and thus increases anthocyanin accumulation and coloration in apple pericarp. Therefore, BBX proteins play coordinated and antagonistic roles in the regulation of photomorphogenesis in seedlings. Studies have shown that BBX proteins are closely related to regulatory transcription factors such as HY5 (ELONGATED HYPOCOTYL 5) and COP1 (CONSTITUTIVE PHOTOMORPHOGENIC 1) in the light signaling pathway, and are likely to cross-talk with other pathways (Wang et al., 2011). In addition, as one part of photomorphogenesis, light-induced anthocyanin synthesis is also regulated by BBX proteins. AtBBX21, AtBBX22, and AtBBX23 were reported to be positive regulators of anthocyanin synthesis in Arabidopsis (Xu et al., 2016; Chang, Maloof & Wu, 2011; Zhang et al., 2017b), while AtBBX24, AtBBX25, and AtBBX32 inhibited the biosynthesis and accumulation of anthocyanin (Job et al., 2018; Gangappa et al., 2013; Holtan et al., 2011). AtBBX21 and AtBBX24 can affect the synthesis of anthocyanin by directly interacting with HY5. In tomato, SlBBX20 regulates the synthesis of carotenoids by directly binding to the promoter of the carotenoid biosynthesis key enzyme, PHYTOENESYNTHASE 1 (Xiong et al., 2019). In pear, two B-box proteins, PpBBX18 and PpBBX21, antagonistically regulate anthocyanin biosynthesis via competitive association with HY5 in the peel of the fruit (Bai et al., 2019a).
BBX protein has been thoroughly studied in Arabidopsis thaliana. The first BBX protein CONSTANS (CO/AtBBX1) found in Arabidopsis interacts with SPA1 (suppressor of phyA-105 1), which contains a coiled helix domain and participates in the flowering control process affected by photoperiod (Laubinger et al., 2006). When R:FR decreases growth density is high and BBX proteins are involved in regulating shade avoidance response. For example, AtBBX19, AtBBX21, and AtBBX22 inhibit the shade avoidance response, while AtBBX18 and AtBBX24 promote the shade avoidance response. The expression of plant hormone related genes involved in shade avoidance response is also regulated by BBX protein (Crocco et al., 2011), BBX protein has been shown to play an important role in hormone signal transduction such as Indole-3-acetic acid (IAA), Gibberellic acid (GA), Abscisic acid (ABA), and Brassinosteroids (BR) (Vaishak et al., 2019). In addition to being involved in plant growth and development, BBX protein can also respond to abiotic stress. For example, AtBBX18 is also involved in heat tolerance response (Wang et al., 2013). AtBBX24 participates in the signal transmission of salt stress and indirectly participates in the molecular pathway related to the improvement of plant salt tolerance (Nagaoka & Takano, 2003). A considerable number of BBX genes in apples were up-regulated under osmotic pressure, high salt, low temperature, and ABA (Abscisic acid) treatment (Liu et al., 2018b).
At present, the BBX gene has been deeply studied in Arabidopsis, rice, apple among others. Buckwheat as a grain and a medicinal crop, especially Tartary buckwheat has extremely high nutritional and medicinal value. There is no report regarding the BBX gene family in buckwheat. The identification and bioinformatics analysis of Tartary buckwheat BBX transcription factors is of great significance to further understand their role in the growth and development, especially in the development of Tartary buckwheat seedlings and anthocyanin synthesis. Combined with public database resources, the authors carried out bioinformatics analysis of the BBX gene family in Tartary buckwheat at the genome level, and preliminarily analyzed the chromosome location, classification, phylogeny, and physicochemical properties of the BBX gene family, in order to provide a basis for enriching the expression regulation of BBX transcription factors and the function of BBX gene family.
Materials and Methods
Identification and analysis of BBX gene family from Tartary buckwheat
32 BBX protein sequences of Arabidopsis were downloaded from Arabidopsis transcription factor database (https://www.arabidopsis.org/), and Tartary buckwheat genome, predicted coding region sequence (CDS), and protein sequences were downloaded from Tartary buckwheat Genome Project (http://www.mbkbase.org/Pinku1/) (Zhang et al., 2017a). The Arabidopsis BBX proteins were aligned together with the Tartary buckwheat proteins data by Local Blastp (1e−10) of BioEdit software (7.1.9 Version). The preliminary homologous candidate sequences of Tartary buckwheat were obtained. After the repeat sequences were removed from the preliminary candidate sequences, the conserved domains were analyzed by the Conserved Domain Database (CDD) database (https://www.ncbi.nlm.nih.gov/Structure/cdd/cdd.shtml), and the protein sequences without BBX domain were deleted, and the members of Tartary buckwheat BBX transcription factor family were obtained.
The length of coding region sequence, the number of amino acids, the relative molecular weight, isoelectric point, the number of aliphatic amino acid number as well as protein hydrophobicity of Tartary buckwheat BBX family proteins were analyzed by an online Protparam software provided by ExPaSy (https://web.expasy.org/protparam/).
Synteny analysis and chromosome localization
All the FtBBX genes were mapped on 8 chromosomes according to the genome database obtained from Tartary buckwheat Genome Project by TBtools. The syntenic blocks used for constructing a synteny analysis map within the Tartary buckwheat genome and between Oryza sativa, Zea mays, Sorghum bicolor, Solanum lycopersicum, Fagopyrum tataricum, and Arabidopsis thaliana genomes, were obtained by using BLASTP of TBtools with the reference E < 1e−10 and top 10 matches. Syntenic blocks were identified and the collinearity results were visualized using the Multiple Collinear Scan Kit (MCScanX) (Wang et al., 2012) and TBtools software (Chen et al., 2020). The rice genome file downloaded from the MSU Rice Genome Annotation Project Database (http://rice.plantbiology.msu.edu/) (Kawahara et al., 2013), The maize and sorghum genome file downloaded from the plant genome database (http://plantgdb.org). The tomato genome file was downloaded from Sol Genomics Network (https://solgenomics.net/organism/Solanum_lycopersicum/genome). The Arabidopsis thaliana genome files are downloaded from Arabidopsis Information Resource (TAIR) database (http://www.arabidopsis.org).
Gene structure, conserved motif analysis of FtBBX genes
The structure of exon and intron of each FtBBX gene was analyzed using the TBtools software. Conservative domain analysis was carried out by CDD database. Conserved motifs of each FtBBX protein were identified using the MEME online database (Multiple Em for Motif Elicitation, http://memesuite.org/tools/meme). The maximum motif number was set as 10 and the motif length was set as 6–200 amino acids, and the other parameters were set at default (Bailey & Elkan, 1995).
Construction of phylogenetic tree
The phylogenetic tree of FtBBXs and AtBBXs proteins were constructed using MEGA7.0 program by Maximum Likelihood (ML) method and bootstrap analysis (1,000 replicates) (Kumar, Stecher & Tamura, 2016), and “JTT+G” was found to be the best ML model using MEGA 7.0 program.
Expression profile analysis of FtBBX genes in tissue specificity and response to light and salt stressSince BBX proteins were involved in plant photomorphogenesis and flavonoids biosynthesis (Xu et al., 2018; Gangappa & Botto, 2014; Wang et al., 2011), and BBX protein can also respond to abiotic stress and hormone signals. The expression profiles of FtBBXs of Tartary buckwheat seedling in response to different illumination treatment, including dark, far-red light, red light and blue light, were chosen from the RNA-seq data (The sequencing data have been deposited in the National Center for Biotechnology Information (NCBI) database, Accession number: SRP157461) by Zhang et al. (2019) (in whose paper, data of Supplemental Data, Table S2 was used, https://onlinelibrary.wiley.com/doi/abs/10.1111/pce.13470). The expression profiles of the FtBBX genes in each sample were collected at 0 and 24 h after salinity treatment using RNA-seq data (The sequencing data have been deposited in the National Center for Biotechnology Information (NCBI) database, accession number: SRR6068977, SRR6068978) recently published by Wu et al. (2017) from Tatary buckwheat plants. In addition, we analyzed the expression profiles of the 28 FtBBX genes in different tissues using RNA-seq data (The sequencing data have been deposited in the National Center for Biotechnology Information (NCBI)database, Accession number: Root SRR5433734, Stem SRR5433731, Leaf SRR5433730, Flower SRR5433732) recently published by Zhang et al. (2017a) and Li et al. (2019). The RNA-seq data processing procedure refer to the transcriptome data processing method in Liu et al. (2018a) And the FPKM (Fragments Per Kilobase of transcript sequence per Millions base pairs sequenced, at least one sample must have had fragments per kilobase of transcript per million mapped reads (FPKM) ≥ 0.5) values of FtBBXs were used to construct heatmap using the TBtools software.
FtBBX genes that regulates anthocyanin biosynthesis in Tartary buckwheat
Six proteins (AtBBX21, AtBBX22, AtBBX23, AtBBX24, AtBBX25, and AtBBX32) which have regulatory effect on anthocyanin synthesis in Arabidopsis ((Bai et al. 2019b) were selected as the search sequences, and the FtBBX which may regulate anthocyanin synthesis were screened out from 28 FtBBX sequences. Then ClustalW program was used for multiple sequence alignment of these related BBX proteins. A phylogenetic tree based on BBX proteins sequence was constructed by using MEGA7.0 program neighbor-joining method and bootstrap analysis (1,000 replicates) (Kumar, Stecher & Tamura, 2016).
In order to further identify the FtBBX gene that might be involved in anthocyanin synthesis, we analyzed the expression correlation between FtBBX gene and some genes involved in the synthesis of flavonoids based on RNA-seq expression data by Zhang et al. (2019). The correlation was obtained in Excel and the TBtools was used to draw the heat-map of correlation coefficients.
Plant materials and anthocyanins measurement
The Tartary buckwheat cultivar ‘Jinqiao 2’ (‘JQ 2’) was used in this study and germination was performed based on the paper bed germination method. They were then placed in an artificial climate box with the temperature maintained at 26 °C and humidity 70%. First, they were incubated in the dark for 2 days and then followed by light treatment for 0, 6, 12 and 24 h. The stems of the sprouts at these five periods of light treatment were collected and snap-frozen in liquid nitrogen and immediately stored at −80 °C for further use.
The anthocyanin was extracted from the samples mentioned above according to the previous report (Rahim, Busatto & Trainotti, 2014) with slight modification. Briefly, 1 g sample was weighed and powered using liquid nitrogen. The extraction was achieved by adding four mL methanol containing 1% (v/v) HCl and incubated for 24 h at 4 °C. Afterwards, the mixture was centrifuged at 12,000 rpm for 10 min. The supernatant was then collected and the absorbance value was measured at 530 nm and 657 nm, respectively. The anthocyanin content was obtained by the formula Qanthocanin =(A530 − 0.25 × A657) × M−1 (M represented the fresh weight of the sample). Three biological repeats for each sample were analyzed.
RNA extraction and qRT-PCR analysis
Total RNAs from seedling tissues mentioned above were extracted by GREENspin Plus Plant RNA kit (ZoManBio, Beijing, China) according to the manufacturer’s protocol. And cDNA was synthesized using a First Strand cDNA Synthesis Kit (TOYOBO, Japan). The expression level of 11 BBX genes, which were speculated to be involved in regulation of anthocyanin biosynthesis, in the sprouts after irradiation for 0, 6, 12 and 24 h were analyzed by qRT-PCR. A 20 μL reaction system was used which contained 10 μL 2 × iQ™ SYBR Green Super mix (Bio-Rad, Irvine, CA, USA), 0.5 μL 10 μM of specific forward and reverse primer, respectively, 1 μL containing about 100 ng cDNA. qRT-PCR was carried out on the C1000™ thermal cycler coupled with a CFX96™ detection module (Bio-Rad) with the following program: 95 °C, 3 min; 40 cycles of 95 °C for 10 s, 55 °C for 30 s and 72 °C for 10 s. The primers sequences are listed in Supplemental File 1.
The relative expression of these genes was calculated using 2−∆∆Ct method, and performed with triplicate biological repeats. To analyze significant differences, one-way ANOVA was conducted using IBM SPSS Statistics 22.0.
Results
Identification and distribution analysis of the BBX genes in Tartary buckwheat genome
A total of 28 putative BBX genes were identified in Tartary buckwheat which were named as FtBBX1 to FtBBX28. Detailed information including gene name, gene ID, intron number, protein length, MW (molecular weight), theoretical pI (isoelectric point), aliphatic index, and GRAVY (grand average of hydropathicity) of FtBBXs is listed in Table 1. FtBBX1, FtBBX8, and FtBBX21 genes contained no intron, and the number of introns in other genes ranges from one to six. Among them, nine members contained only one intron and eight genes contained two introns. FtBBX11 and FtBBX12 comprised the largest number of introns, six and five, respectively. The 28 FtBBX proteins had diverse amino acids (aa) and molecular weight (MW) with the number of aa ranging from 114 (FtBBX1) to 419 (FtBBX7) and MW ranged from 12.78 kDa to 46.51 kDa. Theoretical isoelectric points (pI) of these FtBBX proteins varied from 4.20 (FtBBX21) to 8.22 (FtBBX10) and the value of the aliphatic index ranged from 52.26 (FtBBX9) to 95.88 (FtBBX1), indicating a varying thermostability of this family of proteins. The GRAVY of FtBBX protein was less than zero except that of FtBBX1 (0.118), implying that the majority of FtBBX proteins were hydrophilic proteins.
| Gene name | Gene ID | Intron number | Protein/aa | MW (Da) | pI | Aliphatic index | GRAVY |
|---|---|---|---|---|---|---|---|
| FtBBX1 | FtPinG0008534900.01.T01 | 0 | 114 | 12781.83 | 6.09 | 95.88 | 0.118 |
| FtBBX2 | FtPinG0006549100.01.T01 | 2 | 253 | 28192.96 | 5.48 | 84.39 | −0.349 |
| FtBBX3 | FtPinG0008621100.01.T01 | 3 | 327 | 35128.98 | 6.06 | 60.03 | −0.499 |
| FtBBX4 | FtPinG0006138300.01.T01 | 1 | 254 | 27914.32 | 5.51 | 71.38 | −0.345 |
| FtBBX5 | FtPinG0008738000.01.T01 | 1 | 356 | 40364.42 | 7.17 | 66.29 | −0.79 |
| FtBBX6 | FtPinG0001521000.01.T01 | 2 | 264 | 29661.51 | 5.1 | 79.77 | −0.403 |
| FtBBX7 | FtPinG0003751600.01.T01 | 3 | 419 | 45833.02 | 4.96 | 67.26 | −0.455 |
| FtBBX8 | FtPinG0000904300.01.T01 | 0 | 258 | 28354.12 | 6.92 | 75.93 | −0.331 |
| FtBBX9 | FtPinG0007958700.01.T01 | 2 | 243 | 26651.43 | 6.11 | 52.26 | −0.563 |
| FtBBX10 | FtPinG0007693900.01.T01 | 1 | 124 | 13951.98 | 8.22 | 84.19 | −0.328 |
| FtBBX11 | FtPinG0008082900.01.T01 | 6 | 414 | 46512.47 | 6.13 | 58.7 | −0.713 |
| FtBBX12 | FtPinG0000614000.01.T01 | 5 | 397 | 43516.39 | 5.42 | 57.81 | −0.627 |
| FtBBX13 | FtPinG0005709400.01.T01 | 1 | 192 | 20487.53 | 4.52 | 64.06 | −0.447 |
| FtBBX14 | FtPinG0003122700.01.T01 | 1 | 376 | 42553.85 | 6.05 | 68.51 | −0.668 |
| FtBBX15 | FtPinG0007743000.01.T01 | 4 | 205 | 22657.56 | 7.57 | 65.27 | −0.619 |
| FtBBX16 | FtPinG0009564600.01.T01 | 1 | 378 | 41234.24 | 5.66 | 72.04 | −0.334 |
| FtBBX17 | FtPinG0002738900.01.T01 | 2 | 226 | 25300.69 | 5.96 | 70.4 | −0.477 |
| FtBBX18 | FtPinG0008999600.01.T01 | 2 | 371 | 41072.56 | 5.91 | 61.29 | −0.631 |
| FtBBX19 | FtPinG0006024400.01.T01 | 4 | 414 | 45005.81 | 4.98 | 61.55 | −0.519 |
| FtBBX20 | FtPinG0003531700.01.T01 | 1 | 349 | 38323.08 | 6.01 | 75.73 | −0.255 |
| FtBBX21 | FtPinG0002269700.01.T01 | 0 | 135 | 14728.83 | 4.2 | 57.85 | −0.796 |
| FtBBX22 | FtPinG0003402900.01.T01 | 1 | 376 | 40829.45 | 5.52 | 66.3 | −0.432 |
| FtBBX23 | FtPinG0009261700.01.T01 | 2 | 283 | 30503.38 | 5.38 | 75.83 | −0.225 |
| FtBBX24 | FtPinG0005206600.01.T01 | 2 | 239 | 26513.04 | 5.03 | 80.5 | −0.338 |
| FtBBX25 | FtPinG0009408600.01.T01 | 2 | 327 | 36302.66 | 6.13 | 65.93 | −0.522 |
| FtBBX26 | FtPinG0005054800.01.T01 | 4 | 168 | 18795.14 | 6.18 | 61.61 | −0.637 |
| FtBBX27 | FtPinG0006374000.01.T01 | 3 | 391 | 43083.76 | 4.94 | 70.84 | −0.556 |
| FtBBX28 | FtPinG0004072200.01.T01 | 1 | 281 | 31151.97 | 7.93 | 69.79 | −0.371 |
Note:
aa, amino acid residues; MW, molecular weight; pI, theoretical isoelectric point; GRAVY, grand average of hydropathicity.
There are eight chromosomes in the Tartary buckwheat genome (Zhang et al., 2017a). The 28 FtBBX genes were distributed unevenly throughout the seven chromosomes except for chromosome 6 (Fig. 1). Among them, chromosome 8 had the highest number of FtBBX genes (8), while five FtBBX genes were localized on chromosome 5. Chromosomes 2 and 7 had four FtBBX genes each while chromosomes 3 and 4 had two FtBBX genes each (Fig. 1). Tandem duplication and segmental duplications occur frequently in gene families’ evolution and expansion. Five pairs of duplicated segments (FtBBX2/FtBBX17, FtBBX3/FtBBX23, FtBBX4/FtBBX28, FtBBX16/FtBBX20, and FtBBX16/FtBBX28) in FtBBX gene family were identified within the Tartary buckwheat genome. The result suggested that segmental duplication played an important role in the amplification of BBX gene family members in the Tartary buckwheat genome.
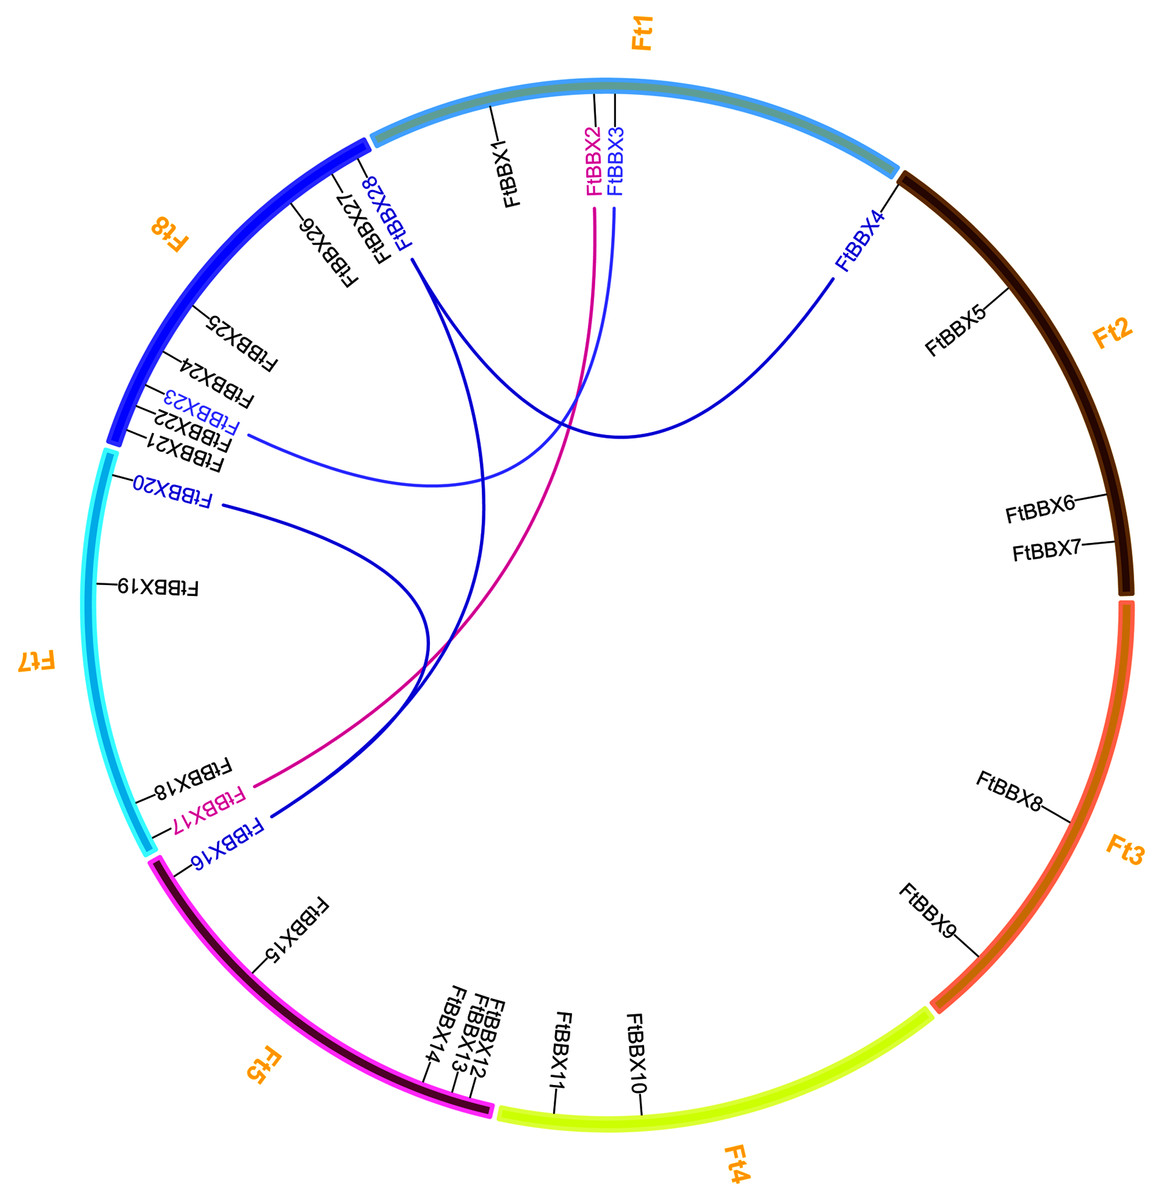
Figure 1: Chromosome distribution and segmental duplication of Tartary buckwheat BBX genes. Five pairs of the segmental duplicated genes are indicated in a different color and are connected by lines.
Phylogeny, multiple collinearity relationship, conserved motifs and gene structure analysis of FtBBXs
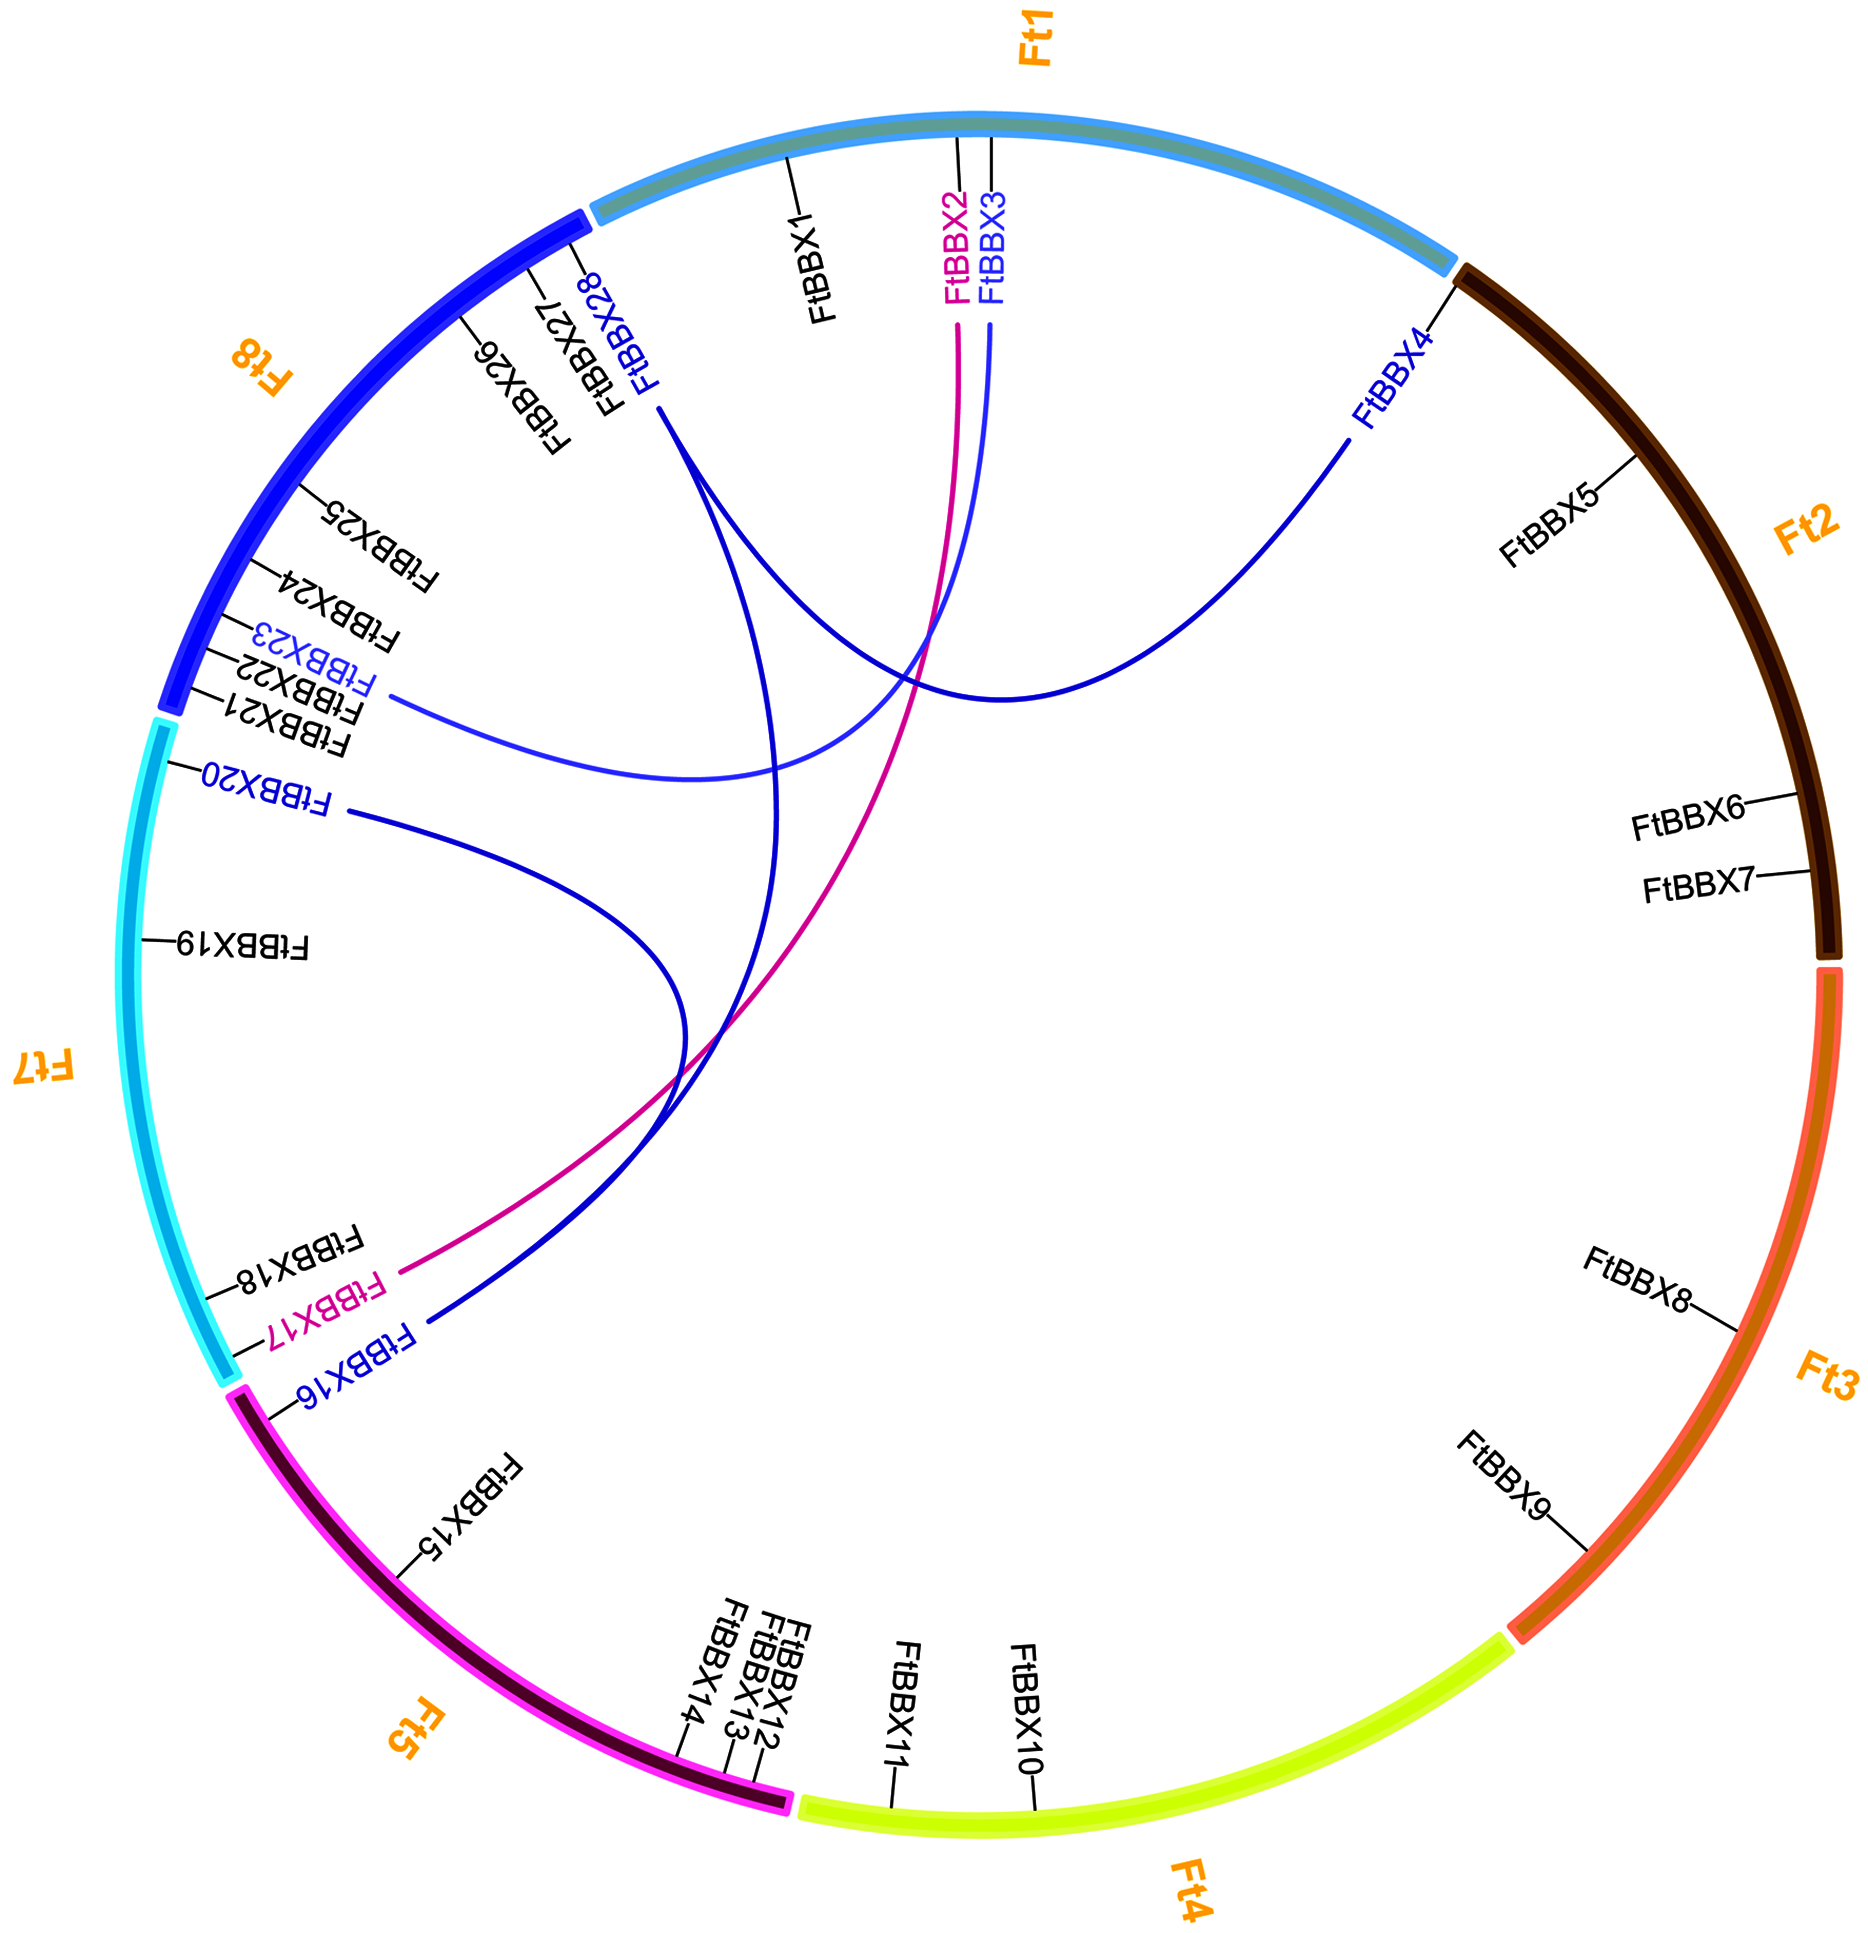
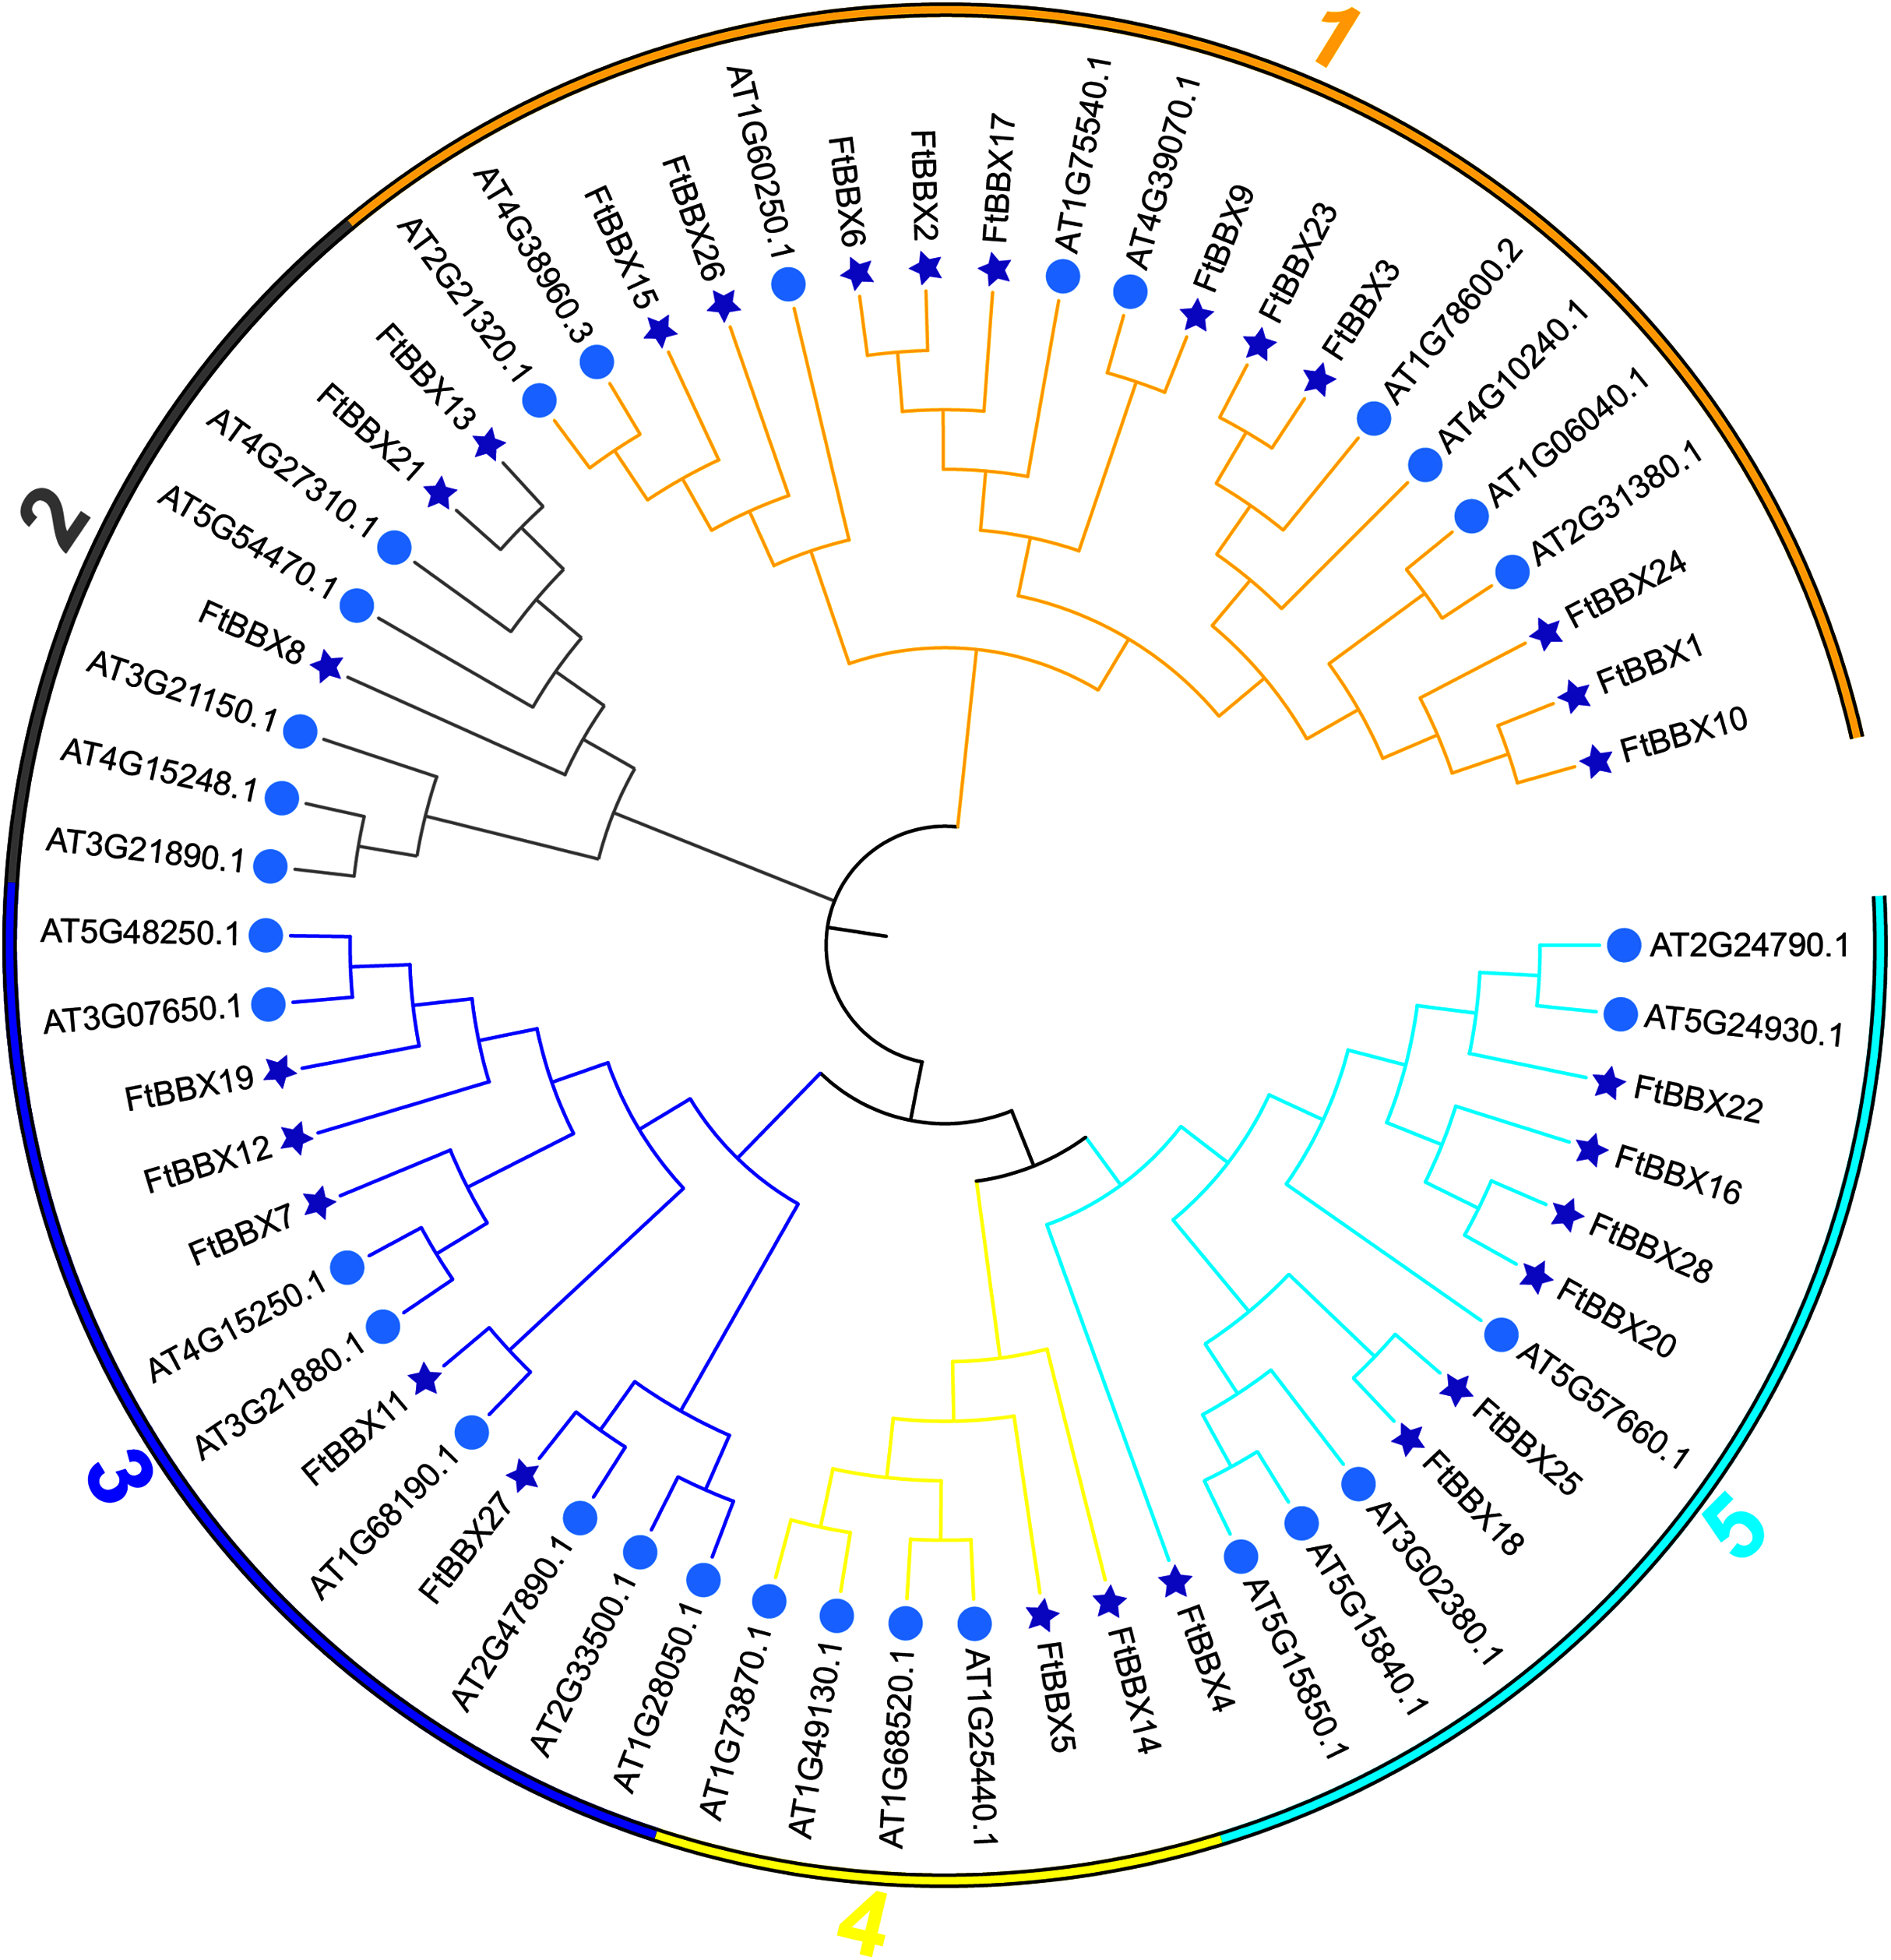
All FtBBX proteins could be classified into five subgroups based on the phylogenetic analysis of FtBBXs and AtBBXs (Fig. 2), as well as the cluster analysis of FtBBXs protein sequences (Fig. 3A), which was consistent with the previous study in grapevine and Arabidopsis (Wei et al., 2020; Gangappa & Botto, 2014; Khanna et al., 2009).
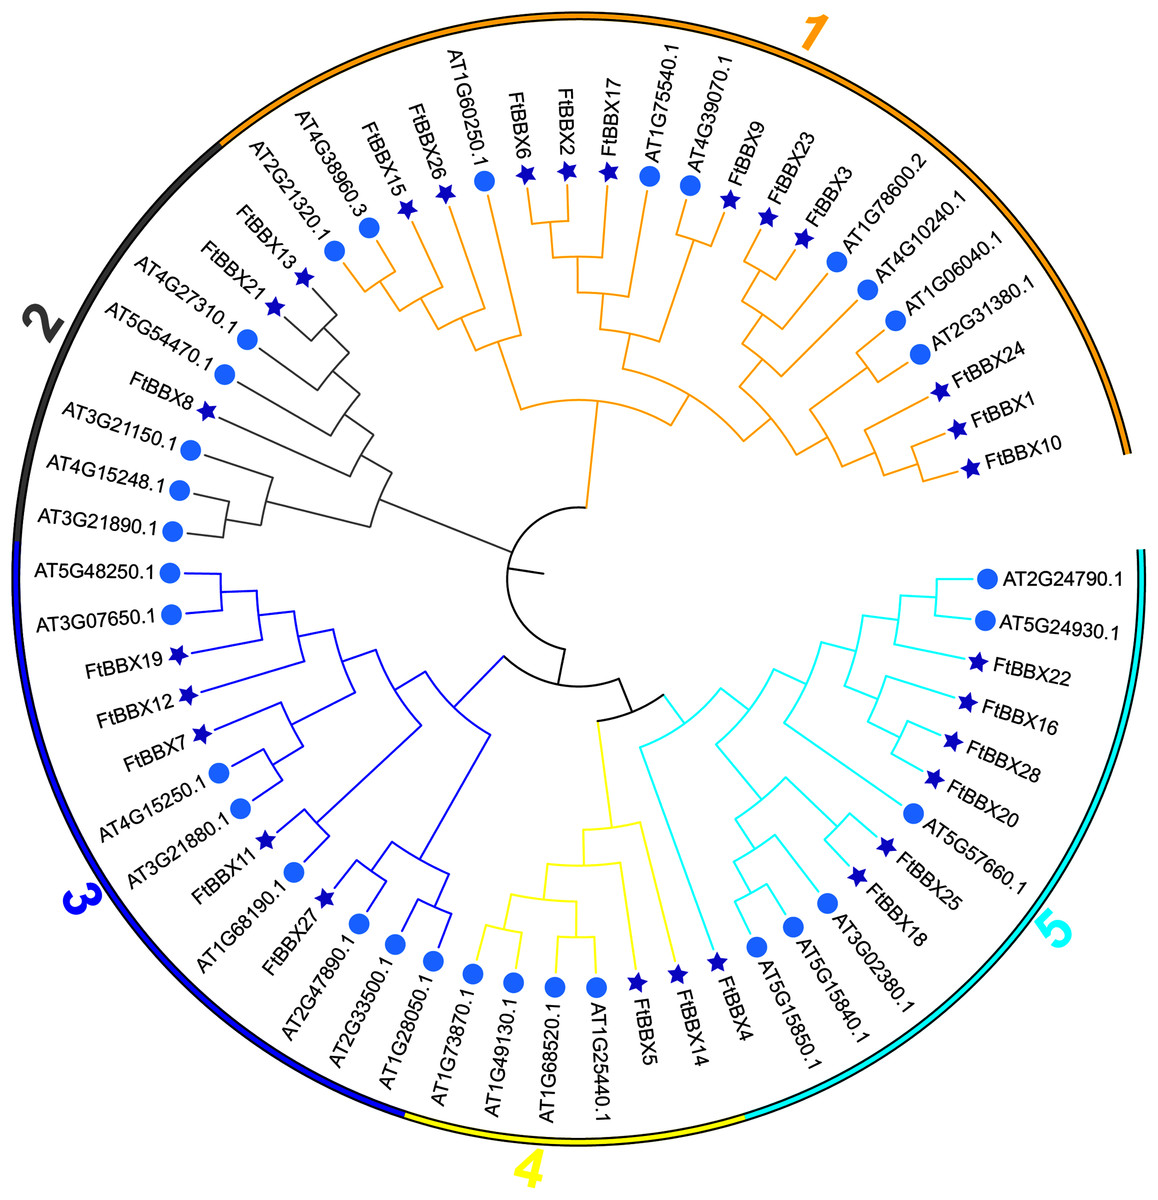
Figure 2: Phylogenetic tree of BBX genes from Tartary buckwheat and Arabidopsis.
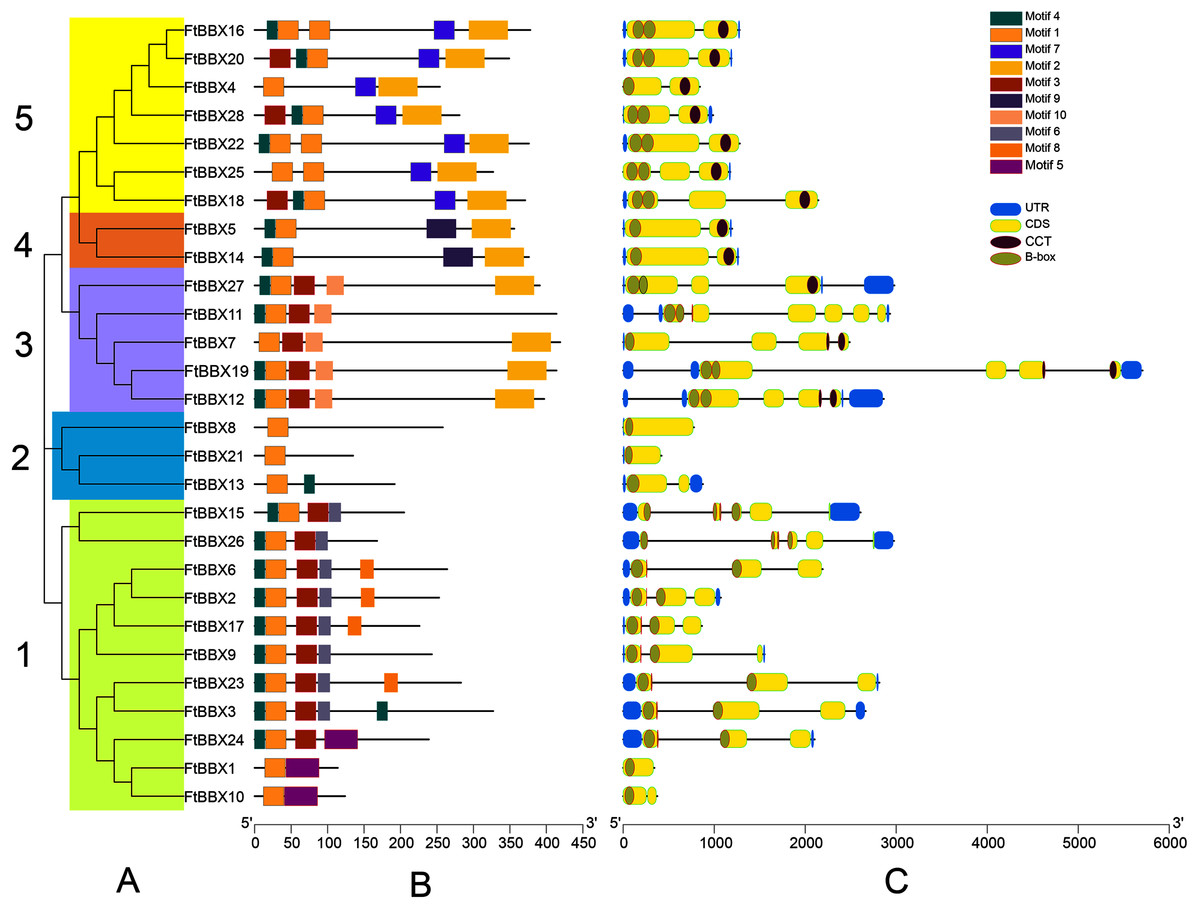
Figure 3: Phylogeny, conserved motifs and gene structure of FtBBXs gene family.
(A) Phylogenetic relationship of the FtBBX proteins. The five subfamilies (1–5) are denoted by different colors; (B) conserved motifs of FtBBX proteins. Each motif is marked with a different color, and the black line represents the non-conservative sequence. The size of each motif is proportional to the scale; (C) structure of FtBBX genes. Exons and domains are indicated by color frames, introns are represented by black lines.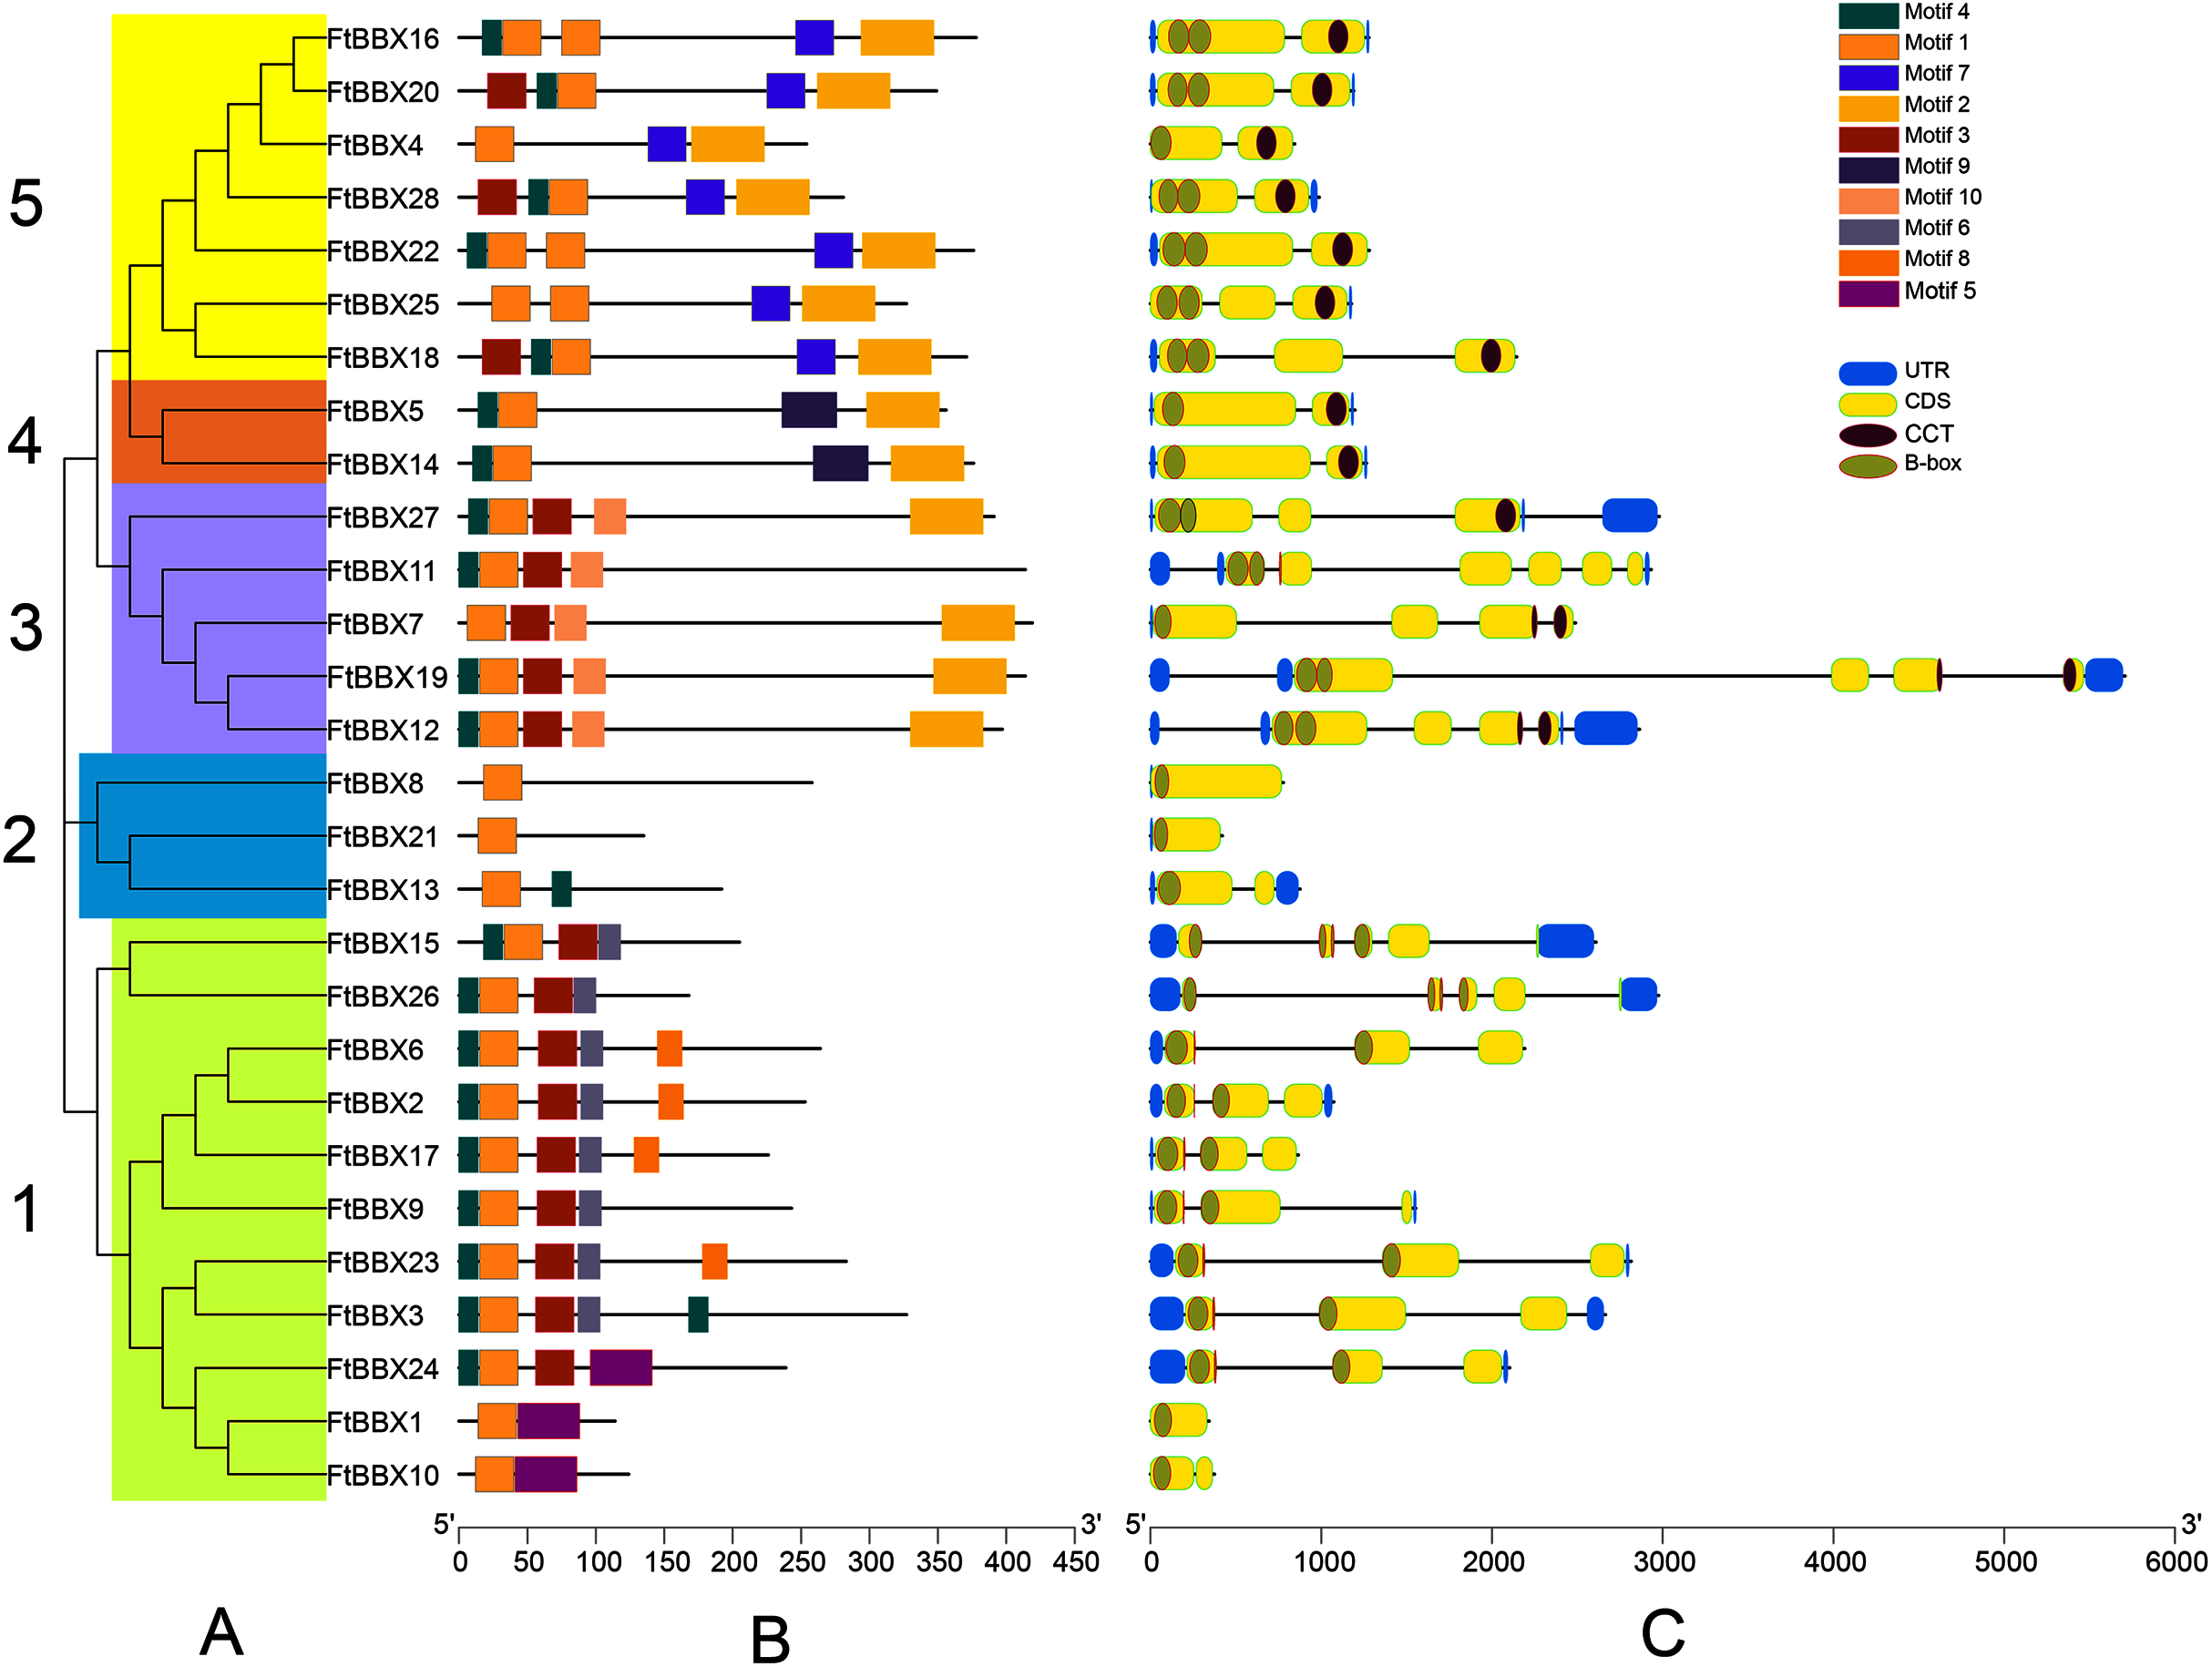
FtBBXs clustering in the same group possessed similar conserved motifs and their genes had similar structure (Fig. 3). Subfamily 1 contained the largest number of FtBBX proteins with 11 members, most of the proteins contained motifs 1, 3, 5 and 7, with several of them containing motif 8 or 5 (Figs. 3A and 3B). Most of the subfamily1 genes contained two B-box domains (Fig. 3C). Subfamily 5 contained the second most number of members (7), with all of them having motifs 1, 2, and 7, while three of them (FtBBX16, FtBBX22, and FtBBX25) contained two motif 1, and several members contained motif 3 and motif 4. Except for FtBBX4, which only had one B-box and one CCT conserved domains, the other six FtBBX genes had two B-box and one CCT conserved domains (Fig. 3). Subfamily 3 enriched five members. It is only FtBBX11 that lacked motif 2, and FtBBX 7 which was lacking motif 4, the other three FtBBX proteins contained five types of motif, including motif 1, 3, 4, 5, and 7. Except for FtBBX7, the other four genes had two B-box domains. Additionally, most of them also contained the CCT domain (Fig. 3). Three members (FtBBX8, FtBBX21, and FtBBX8) composed subfamily 2, which contained less domain but had a specific motif (motif 7) (Fig. 3). By contrast, subfamily 4 was the smallest one which was composed of only two members. Subgroups 3, 4, and 5 had a close genetic relationship and shared a common parent according to the phylogenetic analysis, predicting that these proteins may have similar functions (Fig. 3A).
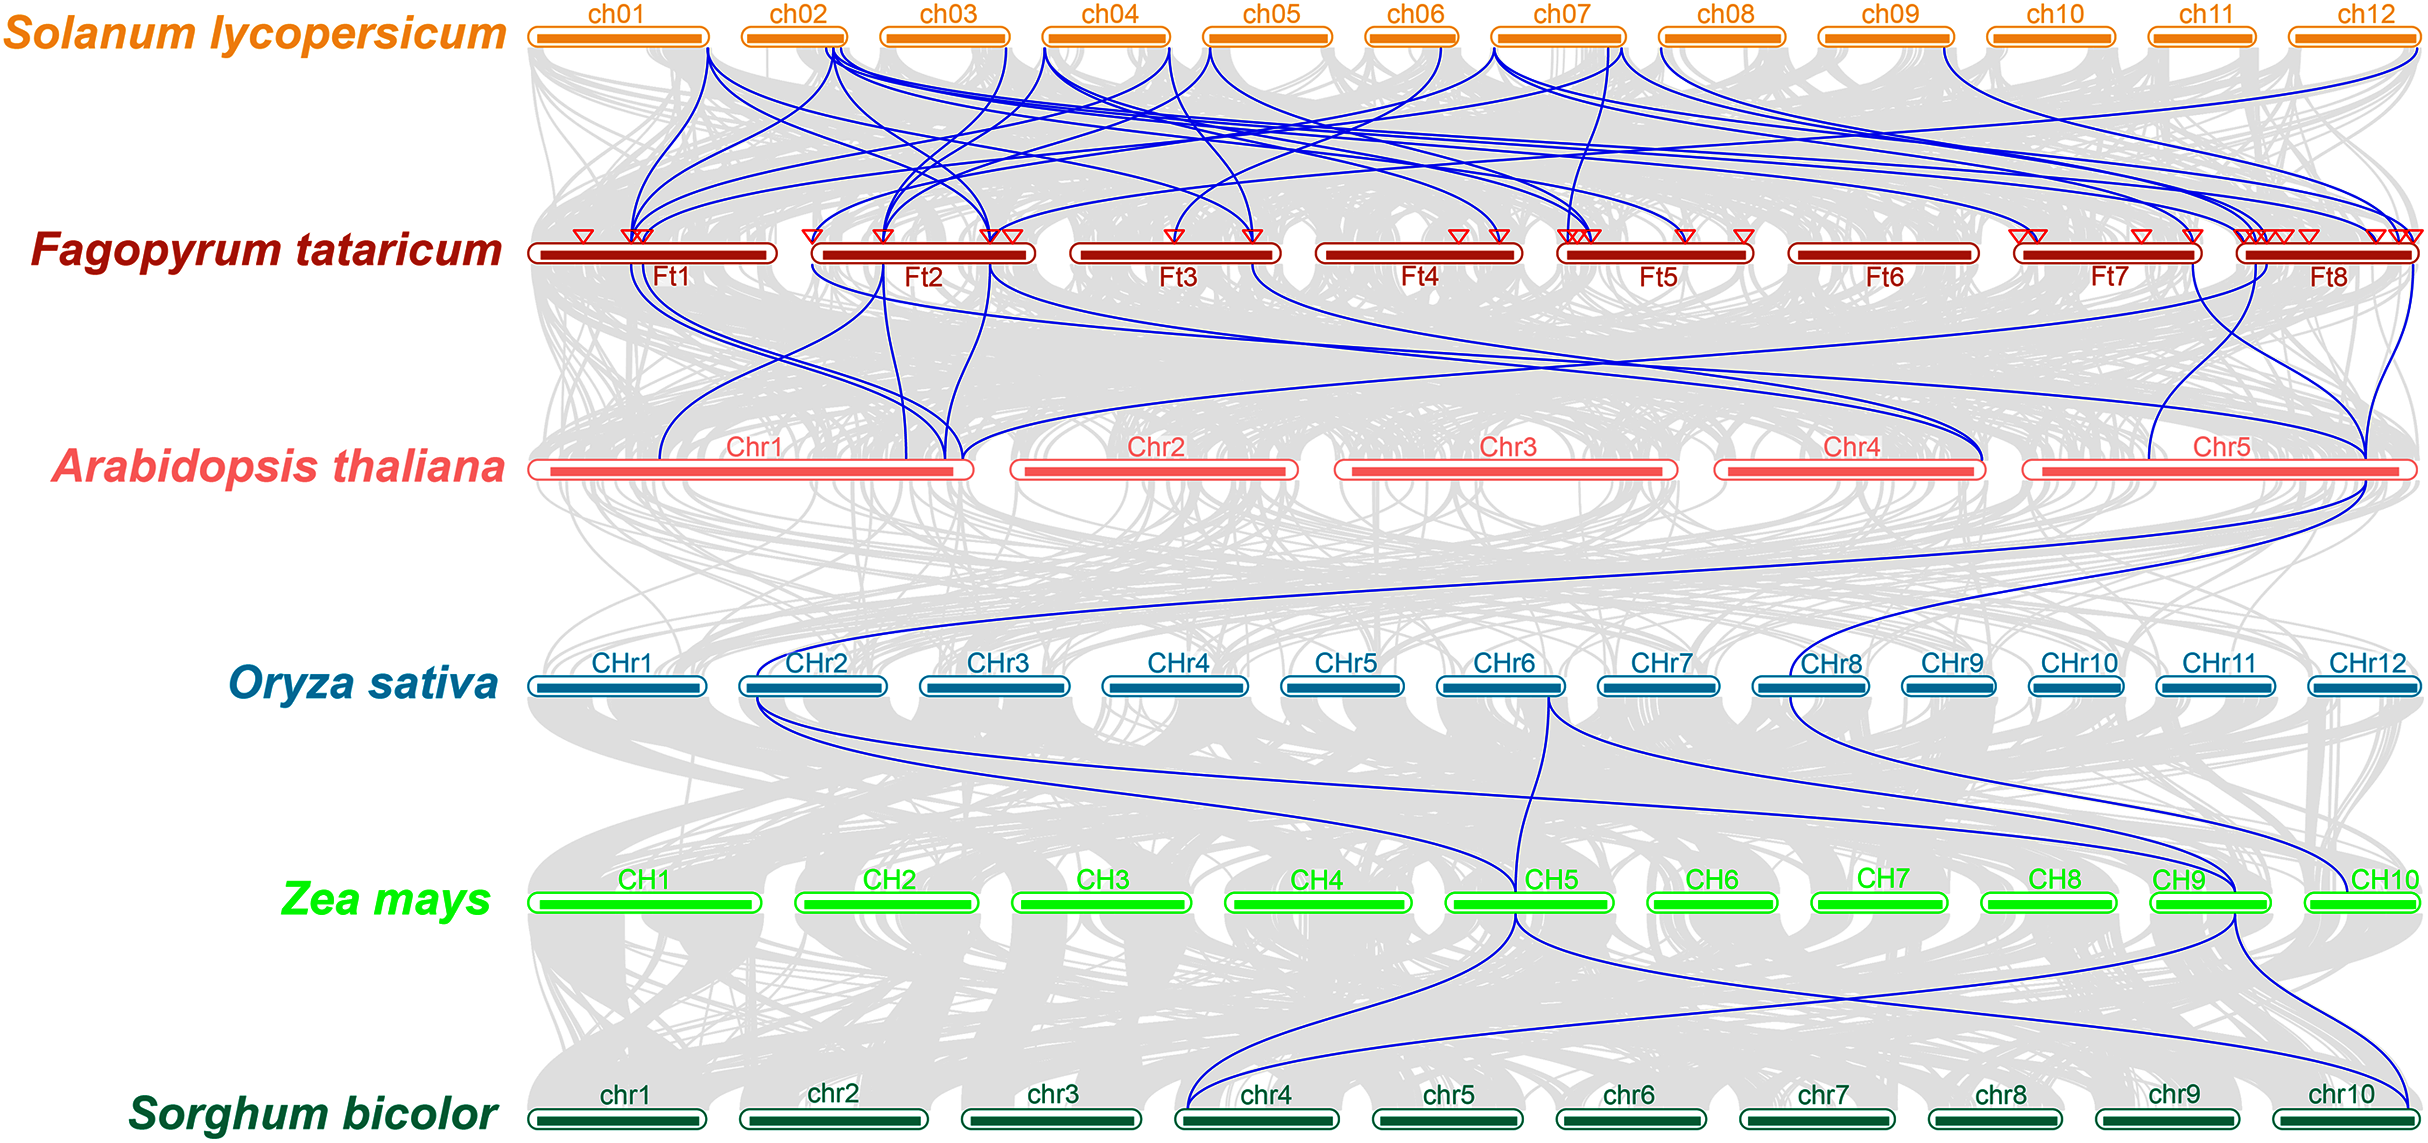
The study of collinearity relationship can provide information for homologous pairs between species. Between rice and pineapple CPK genes, four pairs of syntenic orthologous genes were identified by collinearity analysis, indicating that these genes might be derived from the same ancestor of rice and pineapple (Zhang et al., 2020). A multiple collinearity analysis of six species which included monocots (Oryza sativa, Zea mays, and Sorghum bicolor) and dicots (Solanum lycopersicum, Fagopyrum tataricum, and Arabidopsis thaliana) was created using TBtools software. The results (Fig. 4) showed that there were more homologous pairs between dicotyledonous species, and there were fewer homologous pairs between monocotyledons and dicotyledons. In dicots, 15 genes in Solanum lycopersicum were linked to 19 genes in Fagopyrum tataricum. 10 BBX genes in Fagopyrum tataricum corresponded to seven genes in Arabidopsis thaliana. In monocots, three genes in Oryza sativa corresponded to three genes in Zea mays, 2 genes in Zea mays corresponded to two genes in Sorghum bicolor. However, only one gene in Arabidopsis thaliana linked to two genes in Oryza sativa, indicating that BBX genes were conserved in dicots, but there was no obvious relationship between monocotyledons and between monocots and dicot species.
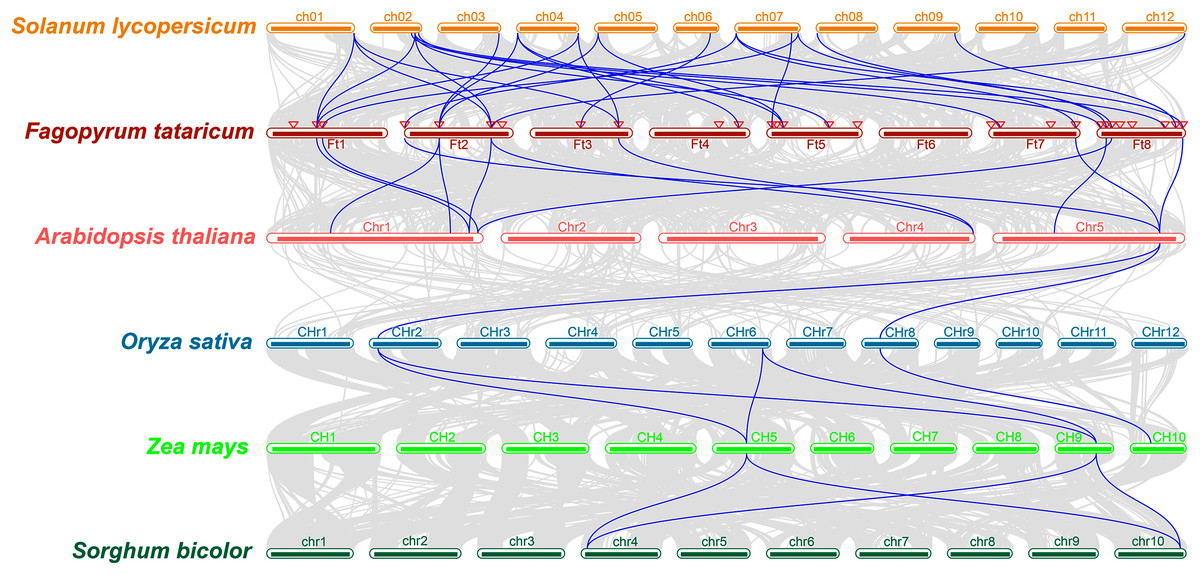
Figure 4: Collinearity relationship of six species genes.
In addition, many FtBBX genes had their one-to-one corresponding orthologs between species. However, some FtBBX genes had two or more orthologs. For example, FtBBX2 (on chromosome 1) corresponded with Solyc01g110370.4.1 (on chromosome 1), Solyc02g084420.3.1 (on chromosome 2), Solyc04g081020.3.1 (on chromosome 4) and AT1G75540.1 (on chromosome 1); FtBBX5 (on chromosome 2) corresponded with Solyc03g119540.3.1, Solyc04g007210.3.1 (on chromosome 4), Solyc05g009310.3.1 (on chromosome 5), AT1G25440.1 and AT1G68520.1 (on chromosome 1); FtBBX6 (on chromosome 2) corresponded with Solyc01g110180.4.1 (on chromosome 1), Solyc02g084420.3.1 (on chromosome 2), Solyc12g089240.2.1 (on chromosome 12), AT1G75540.1 (on chromosome 1) and AT4G39070.1 (on chromosome 4). Moreover, there were several BBX genes in Arabidopsis thaliana that had 2 or more duplicated orthologs in Fagopyrum tataricum. AT1G75540.1 (on chromosome 1) corresponded with FtBBX2 (on chromosome 1) and FtBBX6 (on chromosome 2); AT1G78600.1 (on chromosome 1) corresponded with FtBBX3 (on chromosome 1) and FtBBX23 (on chromosome 8); AT5G57660.1 (on chromosome 5) corresponded with FtBBX4 (on chromosome 2), FtBBX20 (on chromosome 7) and FtBBX28 (on chromosome 8). This result offers information about BBX genes’ duplications among species.
The expression profiling of FtBBX genes in tissues-specific and response to light and salt stress
It’s reported that BBX proteins play a vital role in plant growth and developmental processes, especially in seeding photomorphogenesis (Gangappa & Botto, 2014). We investigated the transcript expression patterns at the different developmental tissues and under different treatments to study the biological roles of FtBBX genes in the Tartary buckwheat growth and development, based on the published Supplemental Data sets (Zhang et al., 2019; Wu et al., 2017; Zhang et al., 2017a; Li et al., 2019). The expression data of these FtBBX genes are presented in the form of a heat map that was constructed using HeatMap IIustructor program of TBtools software based on the Log2(FPKM) value of genes.
The transcript expression patterns (Fig. 5A) of 28 FtBBX genes were investigated under different light treatment for 48h including dark (D48), far-red light (FR48), blue light (B48), and red light (R48) using the published Supplemental Data sets (Zhang et al., 2019). Except for FtBBX1, FtBBX7, FtBBX10, and FtBBX21, other genes were expressed in all samples, but the expression patterns of each gene were different. FtBBX22 had the highest expression level in all 4 samples with its FPKM value ranging from 359.79 to 735.43, which indicated that this gene may be unrelated to the light response signals, but may play an important role during Tartary buckwheat seedlings process. FtBBX9, FtBBX17, FtBBX11, FtBBX2, FtBBX6, and FtBBX27 expressed higher in D48 seedlings than those in other illumination conditions. FtBBX6 expressed higher in D48 seedlings than those in other illumination conditions. FtBBX4 had a slightly higher expression level in R48 seedlings and FtBBX19 expressed higher in FR48 and B48 seedlings. FtBBX18 and FtBBX28 showed no significant differential expression among the four samples. To explore the mechanisms of FtBBX genes response to the salt stresses, we analyzed the expression profiles of the 28 FtBBX genes in each sample collected at 0 and 24 h after salinity treatment using RNA-seq expression data recently published by Wu et al. (2017) from Tartary buckwheat plants. Similarly, other genes were expressed except FtBBX1, FtBBX7, FtBBX10, and FtBBX21. The results (Fig. 5B) showed that most genes having a low expression level, indicating that most BBX genes are not salt responsive. It is noteworthy that the expression values of FtBBX12, FtBBX4, FtBBX8, and FtBBX25 were significantly changed after salt stress treatment. In particular, the expression levels of FtBBX8 and FtBBX25 were 2 times higher than those of the control group after salt stress treatment. It was speculated that FtBBX8 and FtBBX25 might play an important role in the response of Tartary buckwheat to salt stress.
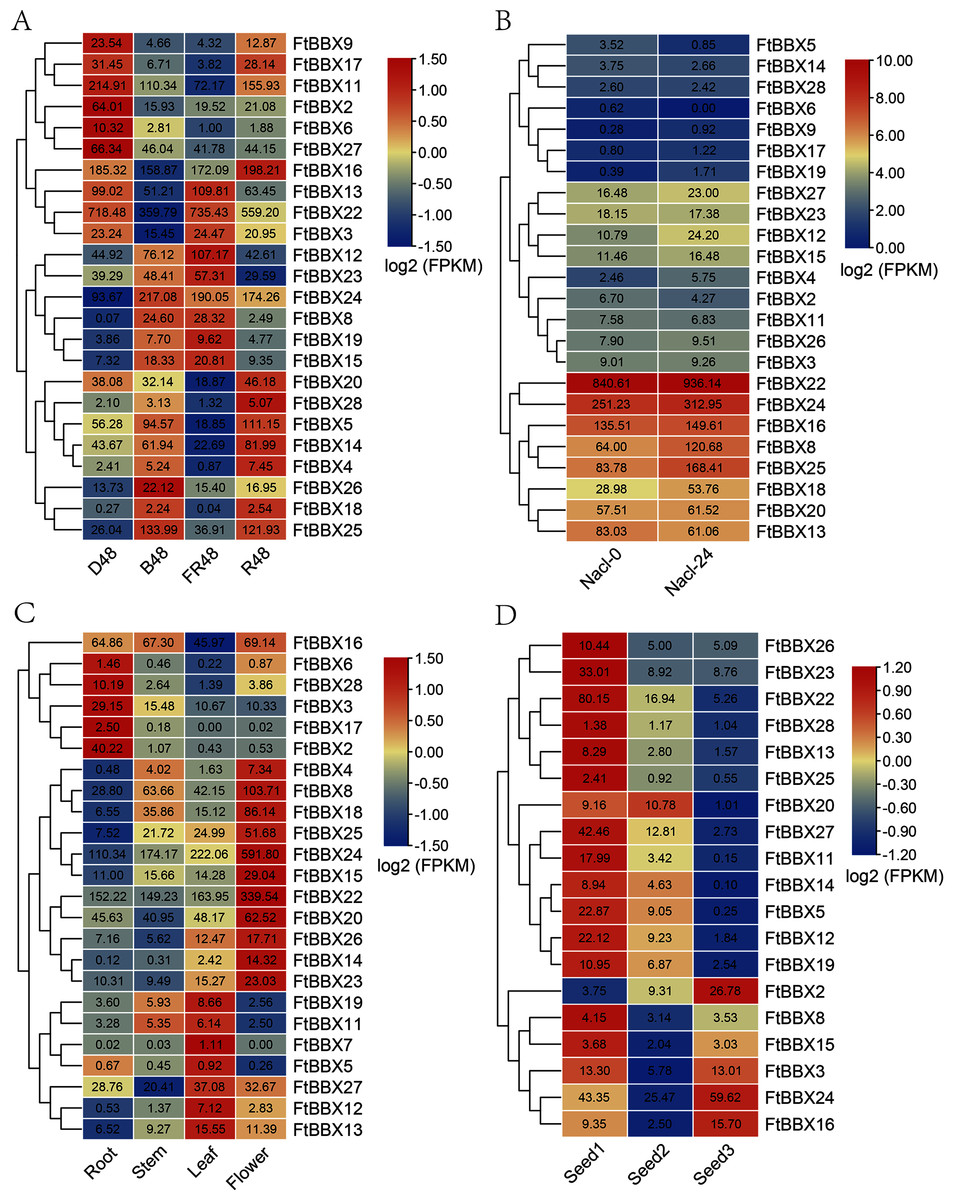
Figure 5: The expression profile of FtBBX genes in Tartary buckwheat.
(A) The expression patterns of Tartary buckwheat seedlings under different light treatment for 48 h including dark (D48), far-red light (FR48), blue light (B48), and red light (R48); (B) the expression patterns of Tartary buckwheat seedlings at 0 and 24 h after salinity treatment; (C) the expression patterns of Tartary buckwheat flowers, roots, leaves, and young stems at 10-week-old under natural light; (D) the expression patterns of Tartary buckwheat seeds of Tartary buckwheat at 12 day, 15 day, and 21 day after full bloom. Numbers in cells are the expression values (FPKM) of genes.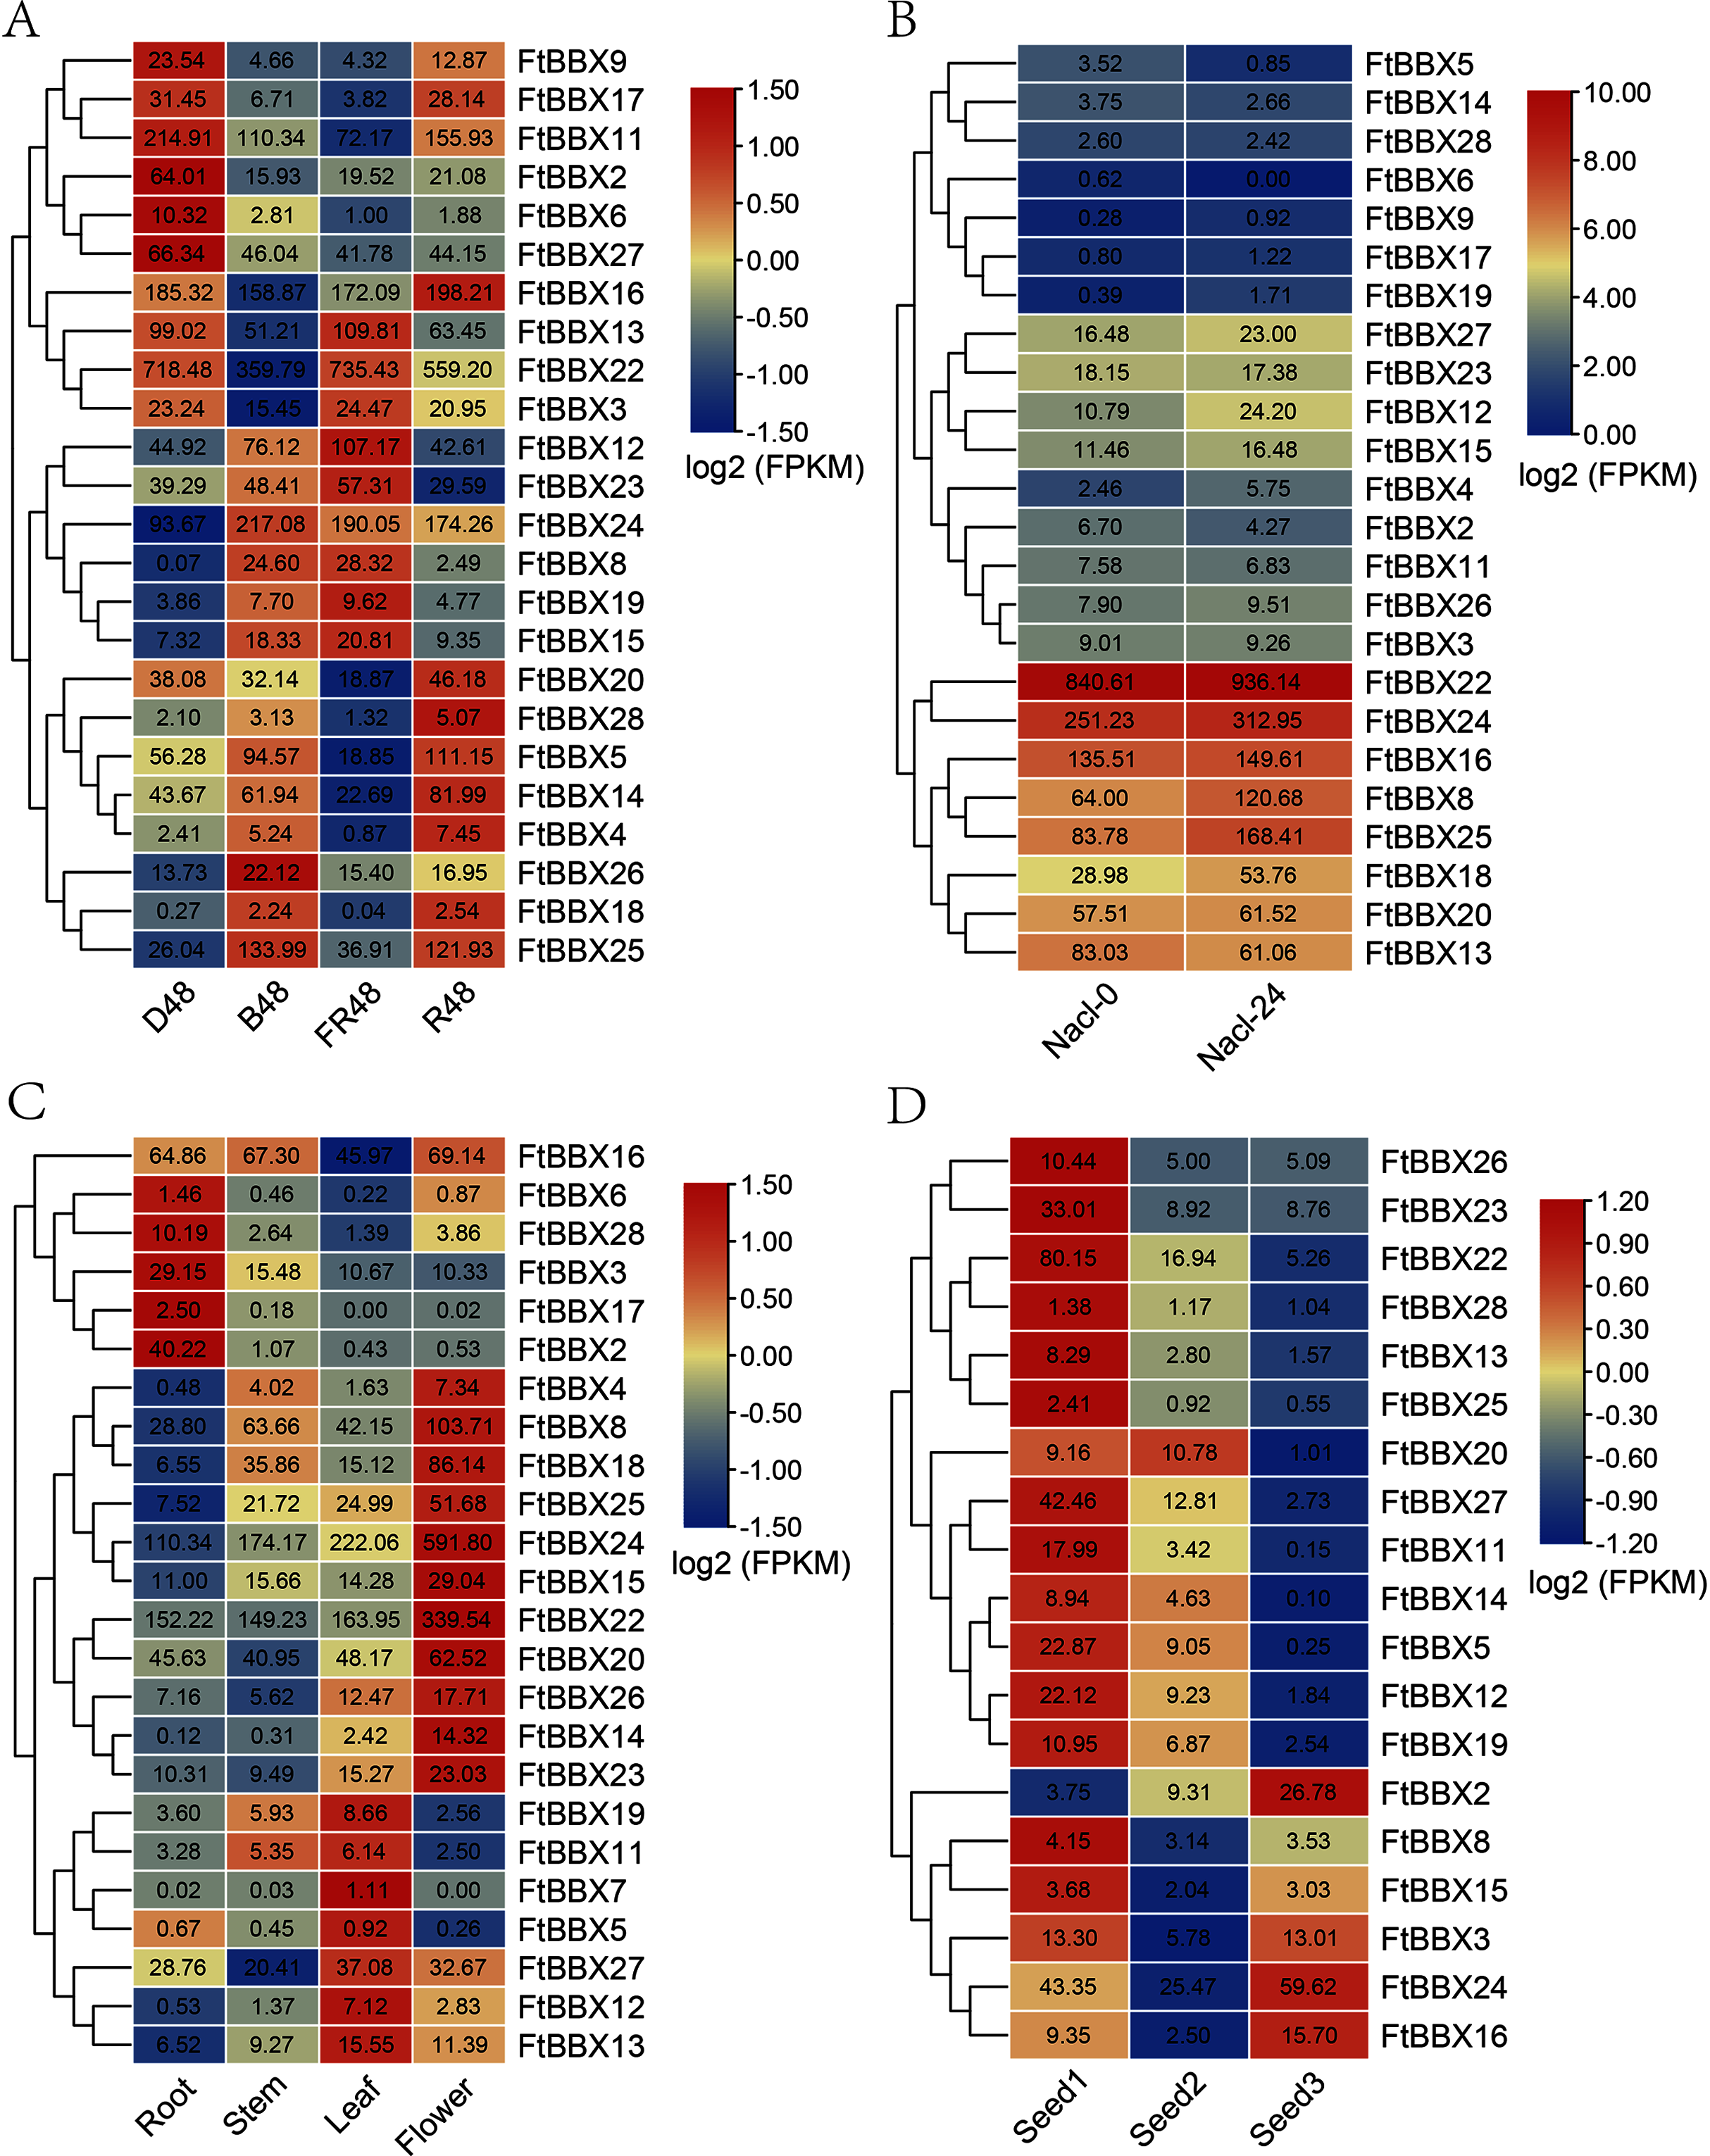
To investigate the functional roles of FtBBX genes in the Tartary buckwheat genome, we analyzed the expression profiles of the 28 FtBBX genes in different tissues using RNA-seq expression data recently published by Zhang et al. (2017a). Similar to the results above, FtBBX1, FtBBX9, FtBBX10, and FtBBX21 showed no expression, and FtBBX7 only had a slight expression value in leaves. The results (Fig. 5C) showed that the BBX genes were expressed in different tissues in Tartary buckwheat. Some genes showed preferential expression across the detected tissues. Remarkably, FtBBX24 showed a high expression level in flowers while a low expression level in root, stem, and leaf. FtBBX8, FtBBX18, FtBBX25, FtBBX15, FtBBX22, FtBBX20, and FtBBX23 also had high expression level in flower and showed similar expression pattern. On the contrary, FtBBX2 displayed a high expression level in root while barely any expression in stem, leaf, and flower. FtBBX6, FtBBX28, FtBBX3, and FtBBX17 also had high expression levels in root and showed similar expression patterns, indicating they might participate in the regulation of flower color formation in the Tartary buckwheat.
In addition, we analyzed the expression profiles of the 28 FtBBX genes in seeds harvested at 12, 15, and 21 days after full bloom, which corresponding to the initial filling stage (Seed1), peak filing stage (Seed2), and initial maturity stage (Seed3) (Li et al., 2019). According to the result (Fig. 5D), nine BBX genes including FtBBX1, FtBBX4, FtBBX6, FtBBX7, FtBBX9, FtBBX10, FtBBX17, FtBBX18, and FtBBX21 were also not expressed during seed development. Most genes such as FtBBX23, FtBBX22, FtBBX27, and FtBBX11 were expressed at a relatively high level at the initial filling stage and a relatively low level at the peak filing stage and the initial maturity stage. It was speculated that these genes played important regulatory roles at the early stage of seed development. Interestingly, the high expression levels of FtBBX22 in different developmental tissues and under different treatment conditions indicated that the gene might play an important role in the development of Tartary buckwheat, especially in response to hormones.
Potential BBX proteins involved in anthocyanin biosynthesis in Tartary buckwheat and their expression profile under light treatment
Previous studies suggested that some BBX proteins were involved in anthocyanin production, including the AtBBX21, AtBBX22, and AtBBX23 from Arabidopsis (Xu et al., 2016; Chang, Maloof & Wu, 2011; Zhang et al., 2017b), MdBBX20, MdBBX21, and MdBBX22 from apple (Fang et al., 2019; An et al., 2019), PpBBX16, PpBBX18 from red pear (Bai et al., 2019a, 2019b) were reported to positively regulate anthocyanin biosynthesis. However, AtBBX24, AtBBX25, AtBBX32 (Job et al., 2018; Gangappa et al., 2013; Holtan et al., 2011), MdBBX24 (An et al., 2019) as well as PpBBX21 (Bai et al., 2019b) were identified as negative regulators in anthocyanin accumulation. In the phylogenetic tree, both the positive and negative regulators were divided into two branches, respectively (Fig. 6).
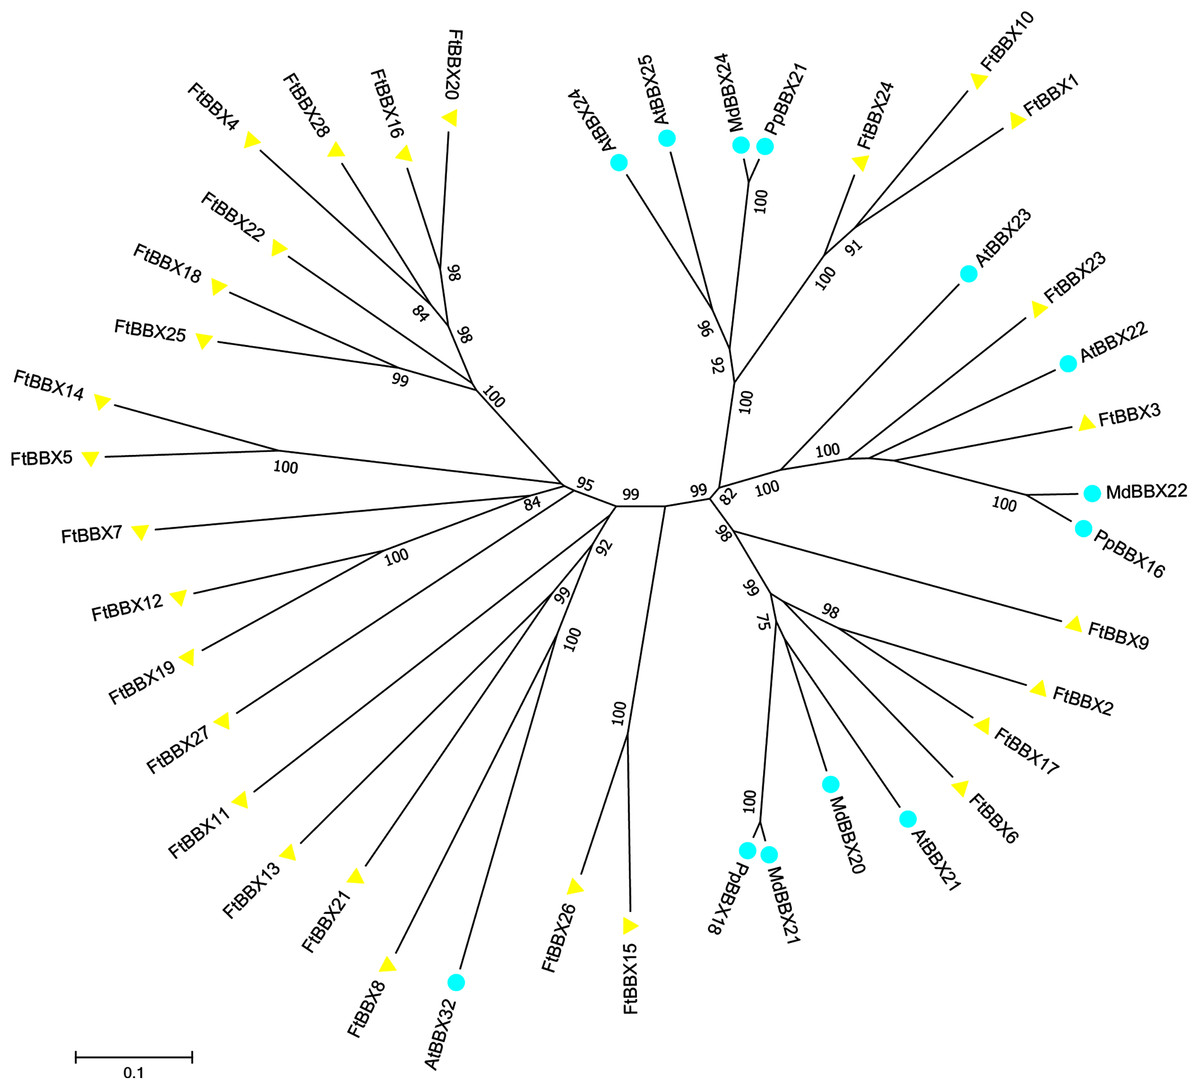
Figure 6: Phylogenetic tree of BBX homologues that regulate anthocyanin biosynthesis.
AtBBX21 (Arabidopsis thaliana, NP_177686.1); AtBBX22 (Arabidopsis thaliana, NP_001185428.1); AtBBX23(Arabidopsis thaliana, NP_192762.1); AtBBX24 (Arabidopsis thaliana, NP_172094.1); AtBBX25 (Arabidopsis thaliana, NP_565722.1); AtBBX32 (Arabidopsis thaliana, NP_188752.1); MdBBX22 (Malus domestica, XP_008348545.2); MdBBX21 (Malus domestica, XP_008387988.1); MdBBX24 (Malus domestica,NP_001315848.1); MdBBX20 (Malus domestica,XP_008382325.2); PpBBX18 (Pyrus pyrifolia, XP_009335579.1); PpBBX21 (Pyrus pyrifolia, XP_009342646.1); PpBBX16 (Pyrus pyrifolia, XP_009376736.1).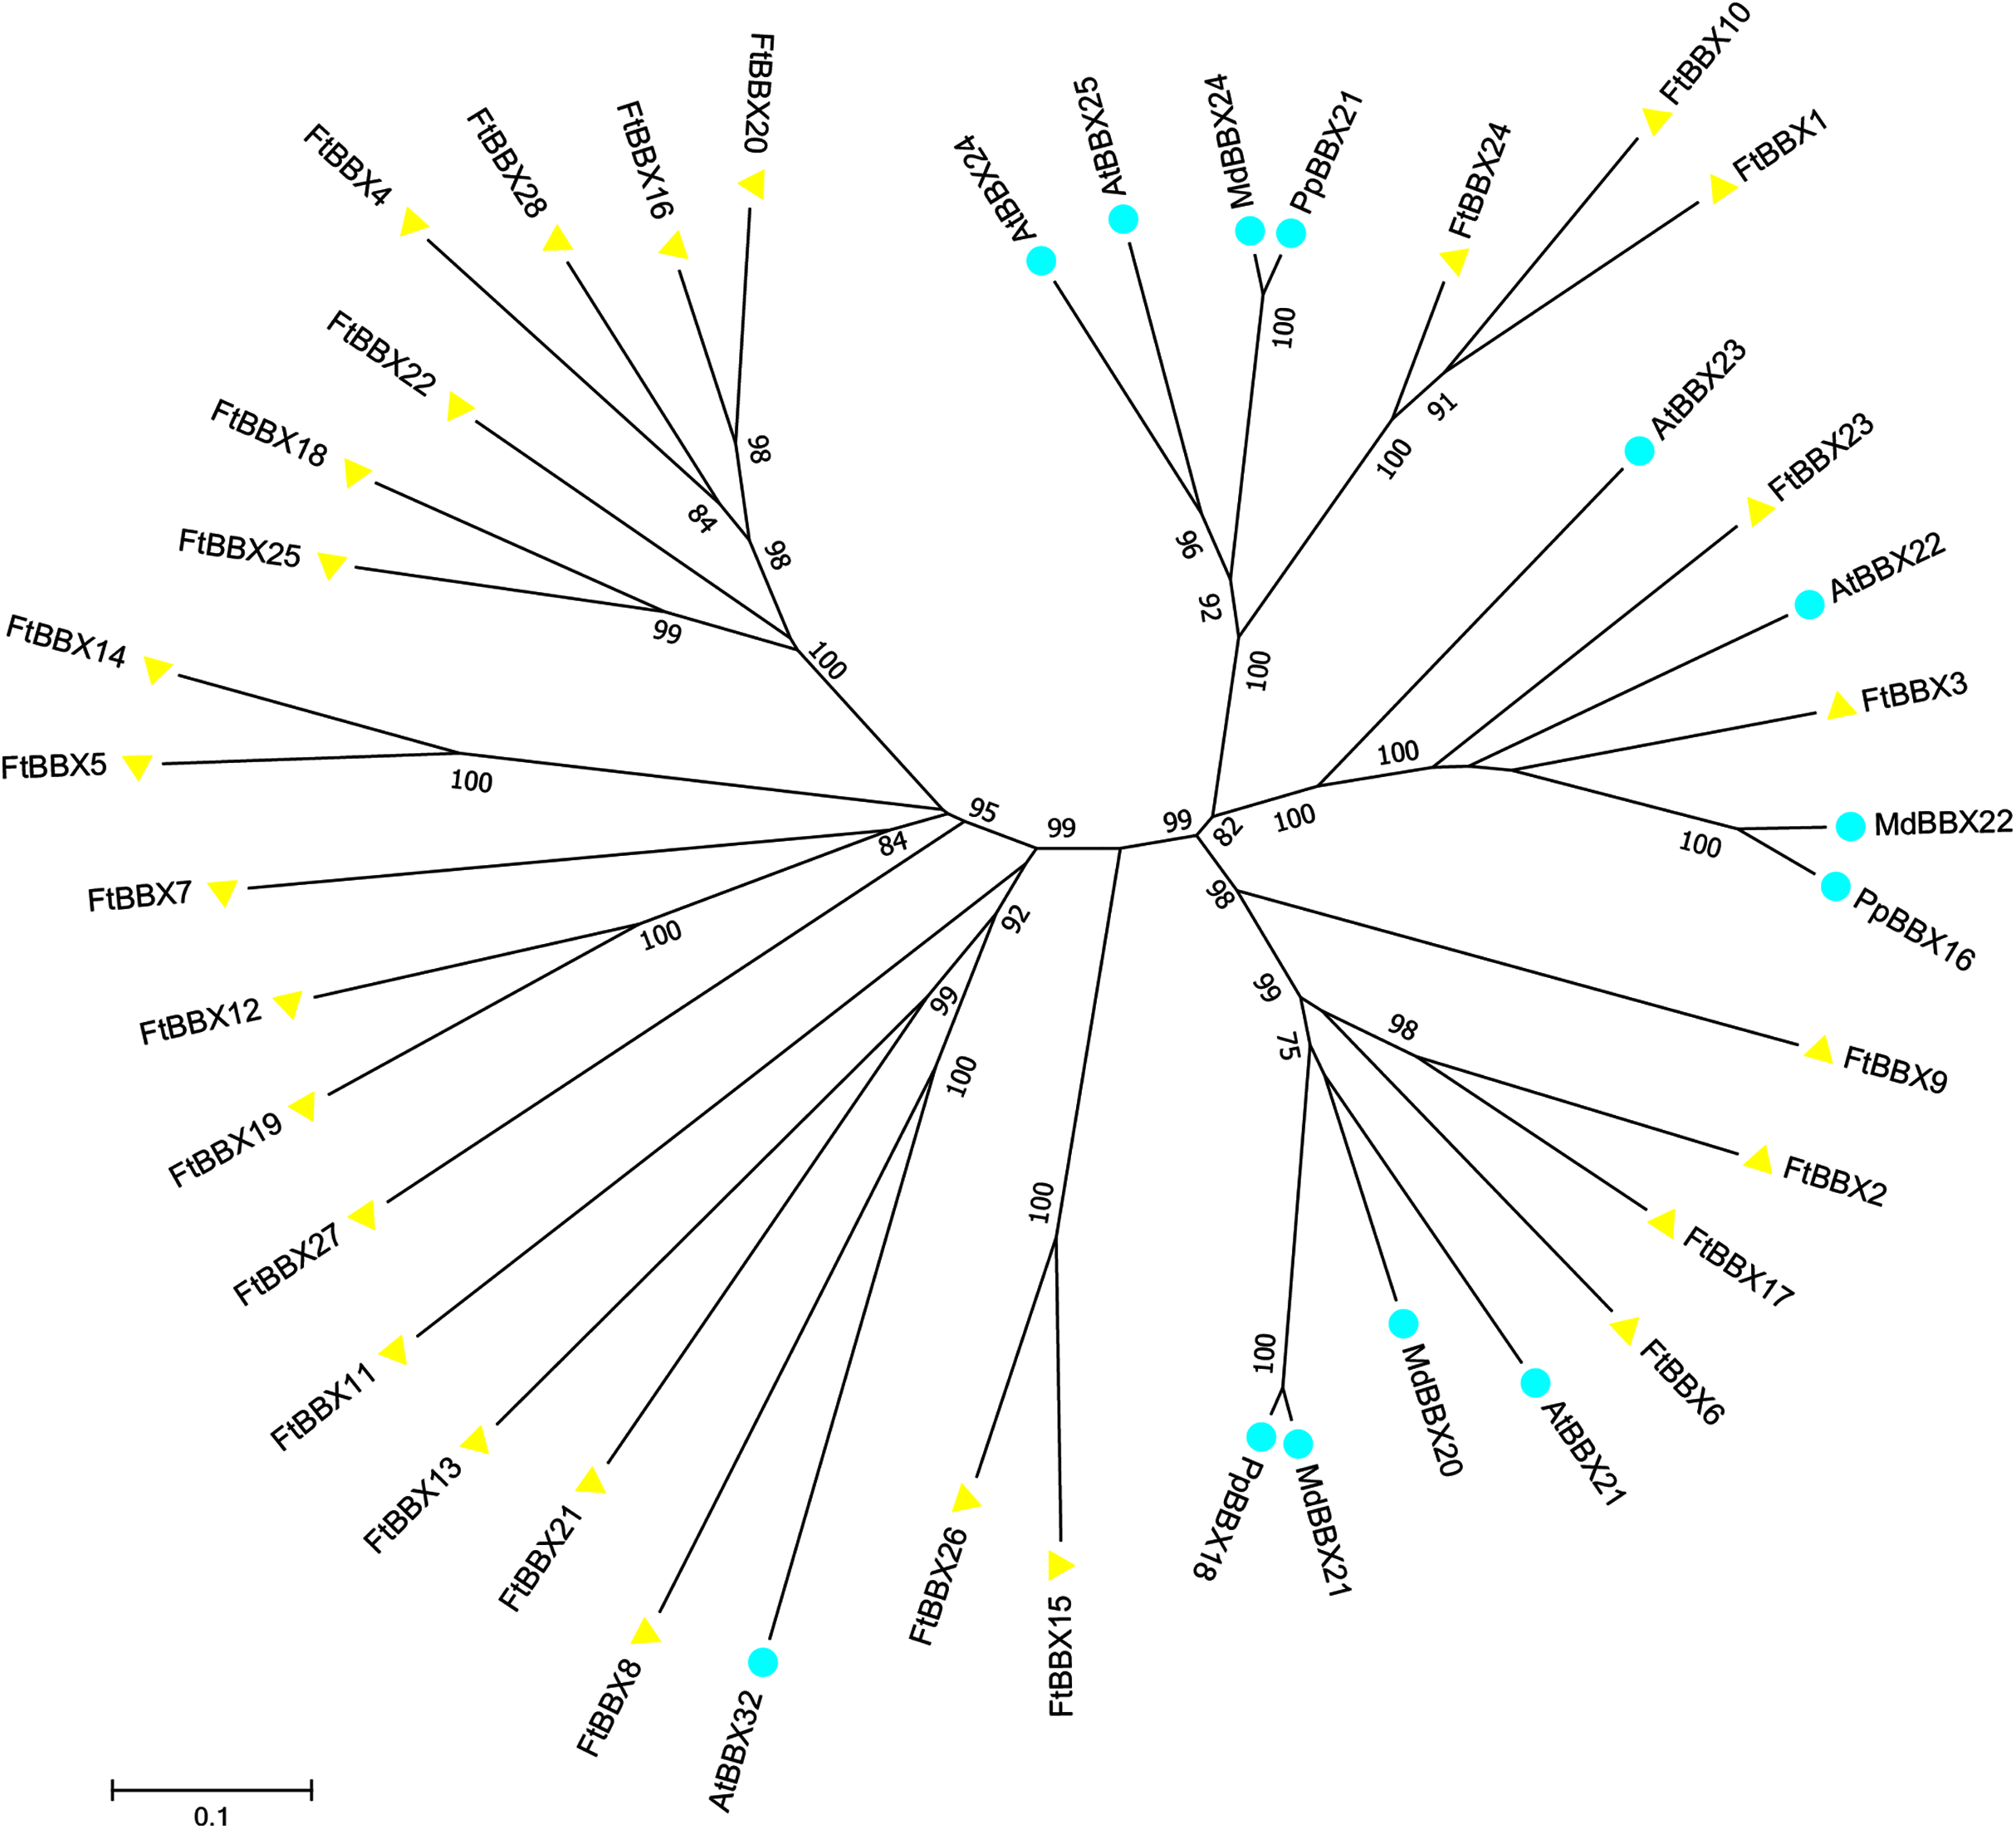
Fifteen FtBBX proteins were obtained after the construction of the phylogenetic tree with those BBX proteins mentioned above and all FtBBX proteins (Fig. 6), which indicated that these 15 FtBBX proteins may be also involved in the regulation of anthocyanin biosynthesis in Tartary buckwheat. Among them, six FtBBX proteins including FtBBX2, FtBBX3, FtBBX6, FtBBX7, FtBBX9, and FtBBX23 were clustered together with those proteins that promote anthocyanin synthesis, therefore, they were speculated to possess similar function. Meanwhile, other five FtBBX members (FtBBX8, FtBBX10, FtBBX15, FtBBX24, and FtBBX26) were presumed to negatively regulate anthocyanin biosynthesis due to their phylogenetic proximity to AtBBX24, AtBBX25, MdBBX24, and AtBBX32 (Fig. 6).
In order to further identify the FtBBX gene which may be involved in anthocyanin synthesis, we analyzed Gene Coexpreesion between FtBBX gene and flavonoids-related genes (Bai et al., 2014a; Luo et al., 2018; Sun et al., 2020; Huang et al., 2019; Li et al., 2019; Zhou et al., 2016; Yao et al., 2019) based on the transcriptome data of buckwheat seedlings under different light conditions (Fig. 7). In addition to the significant positive correlation between the FtBBX3 and the FtANS only, four genes, FtBBX2, FtBBX6, FtBBX9, and FtBBX17, all showed a positive correlation with FtMYB31, FtF3H-2, FtF3′H, and FtF3′5′H. In addition, FtBBX9 and FtBBX17 also showed a positive correlation with FtCHI, FtFLS, and FtUFGT41. Moreover, FtBBX23 was positively correlated with FtMYB2, FtMYB8, and FtGL3-1, also positively correlated with anthocyanin synthesis structural genes FtCHS, FtUFGT3, and FtUFGT15. FtBBX24 exhibited a negative correlation with FtMYB31, FtF3H-2, FtF3′H, and FtF3′5′H.
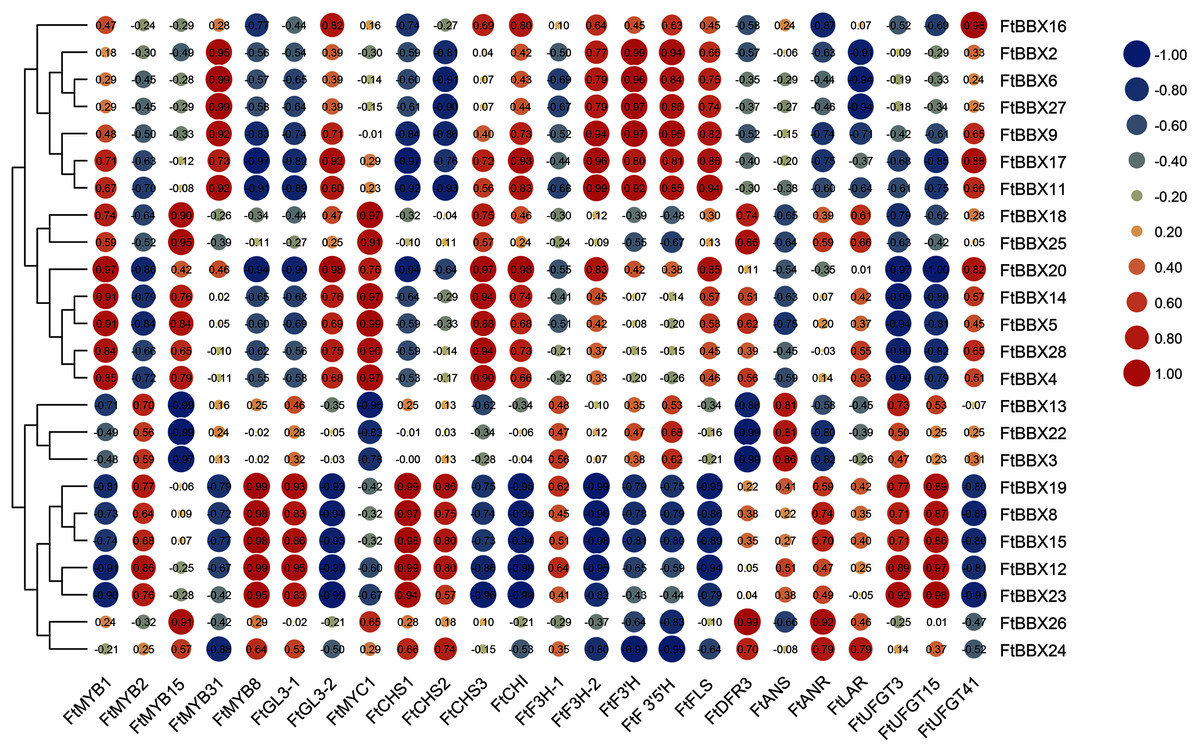
Figure 7: Heat-map of correlation coefficients between FtBBX and flavonoids synthesis genes in Tartary buckwheat seedlings under different light conditions.
The figures are correlation coefficients and the size of the circle indicates the strength of the correlation.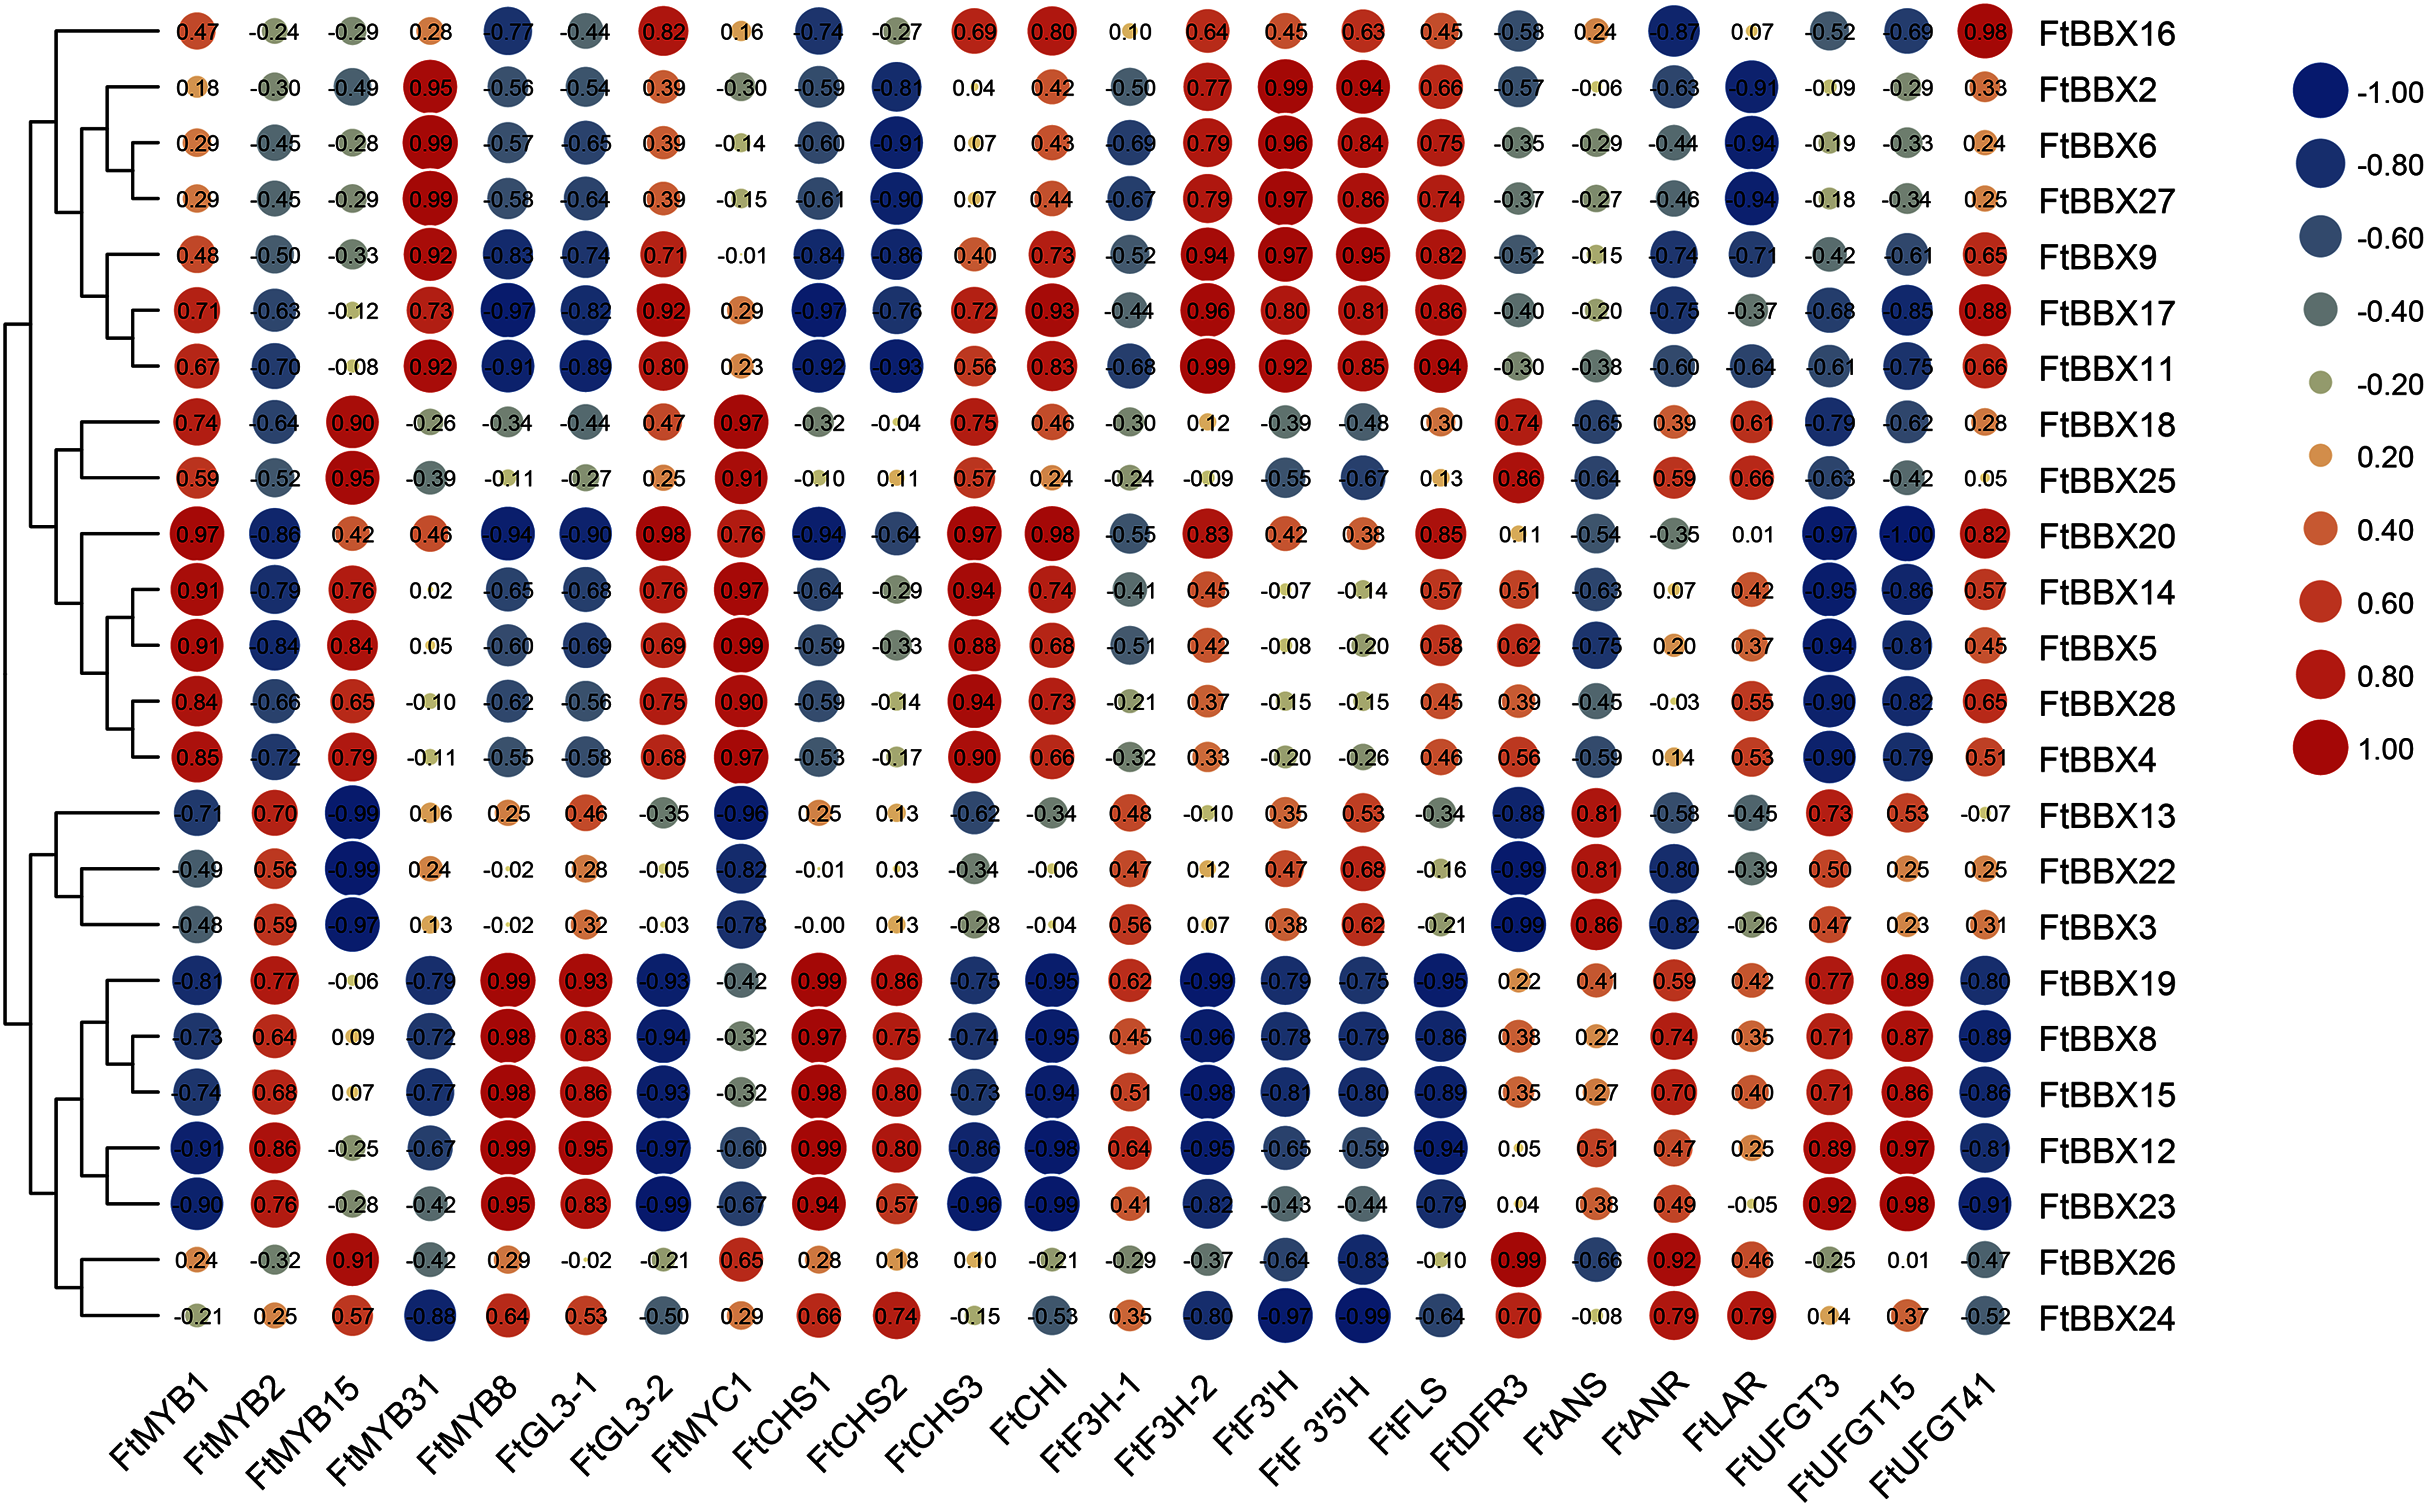
Eleven genes were selected for qRT-PCR expression analysis based on the above results. The expression level of these 11 FtBBX genes in seedlings of the cultivar ‘Jinqiao 2’ under light treatment for 0, 6, 12 and 24 h were analyzed by qRT-PCR. The total anthocyanins contents of these samples were also measured. The results showed that there was no pigment accumulation in the seedlings grown under dark conditions, but the anthocyanin accumulated when they were grown under light with the main accumulation occurring in the stem tissues (Fig. 8A). The anthocyanin content increased with the duration of light exposure, reaching the maximum at 24 h time point (Fig. 8B, Supplemental File S2).
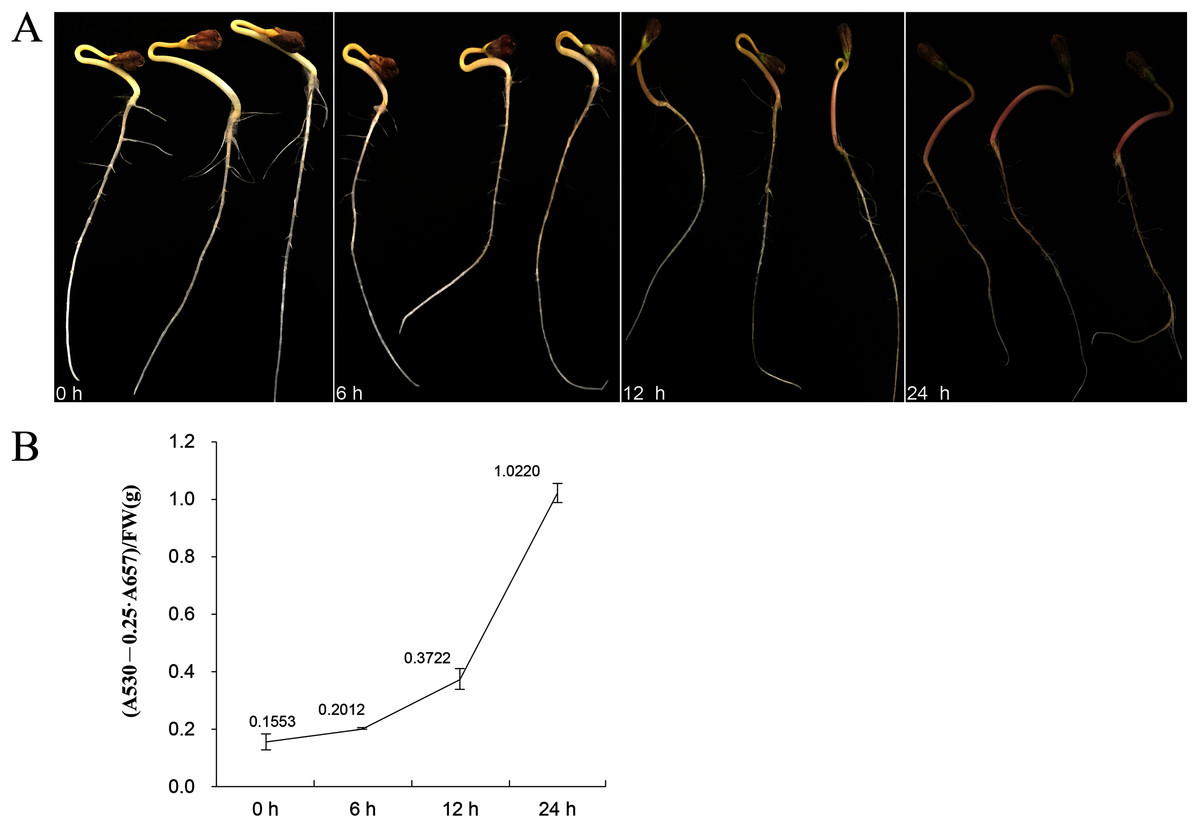
Figure 8: (A) Seedlings of ‘Jinqiao 2’ under light treatment for 0, 6, 12, and 24 h and (B) the total anthocyanin content of these four samples.
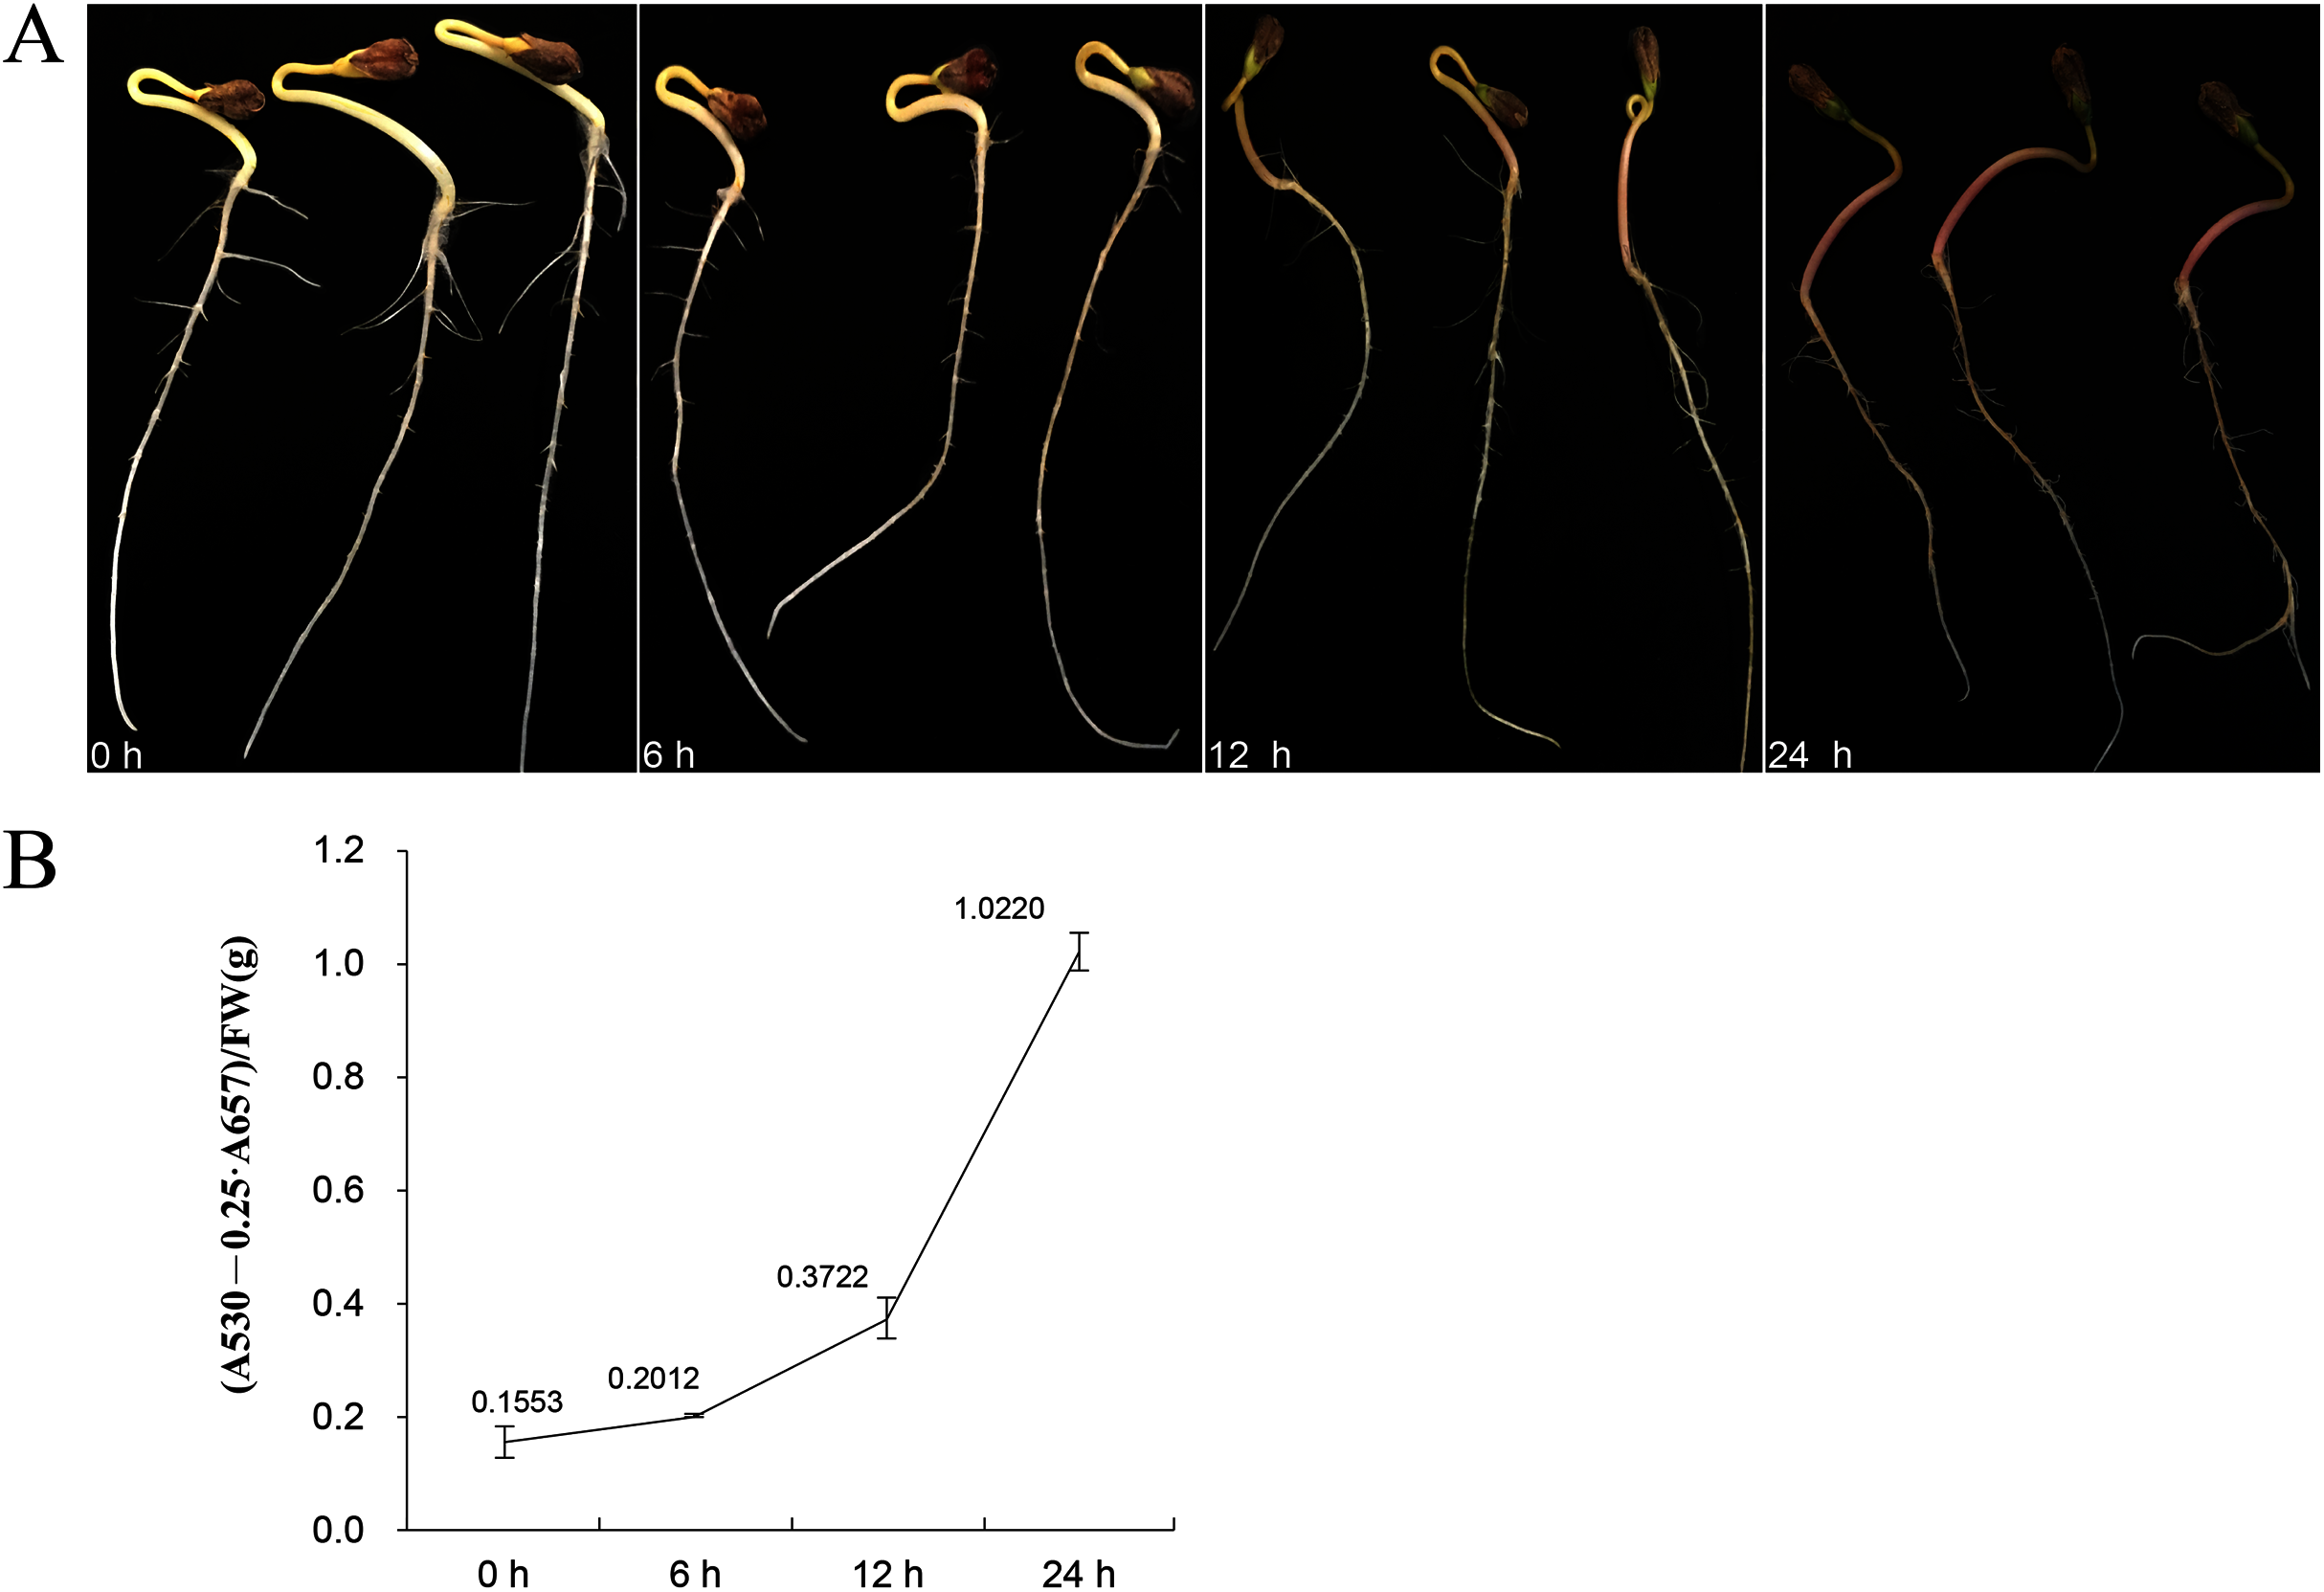
The expression levels of most genes in Tartary buckwheat seedlings treated with different light times showed significant difference (Fig. 9, Supplemental File 3). Among them, FtBBX2, FtBBX8, and FtBBX26 gradually increased in expression level under light treatment (Fig. 9), which was consistent with the accumulation of anthocyanins. Hence, these three FtBBX genes were perceived to be probable positive regulators of anthocyanin biosynthesis in Tartary buckwheat. Although the expression level of FtBBX3, FtBBX10, FtBBX15, FtBBX23, and FtBBX24 didn’t continue to increase in seedlings under light treatment, their expression levels were up-regulated compared with those in the darkness. Therefore, they were also thought to promote anthocyanin accumulation in seedlings when exposed to light. While FtBBX17 expressed with a slight increase in the seedlings under light treatment for 6 h, then began to decline, and the final expression level was only 1/10 of that at 0 h, which seemed nearly negatively correlating with anthocyanin accumulation. Thus, it’s speculated that FtBBX17 may inhibit anthocyanin biosynthesis (Fig. 9). In addition, the expressions of FtBBX6 and FtBBX9 showed no significant differences among these four samples, which suggested that they may not be responsive to light.
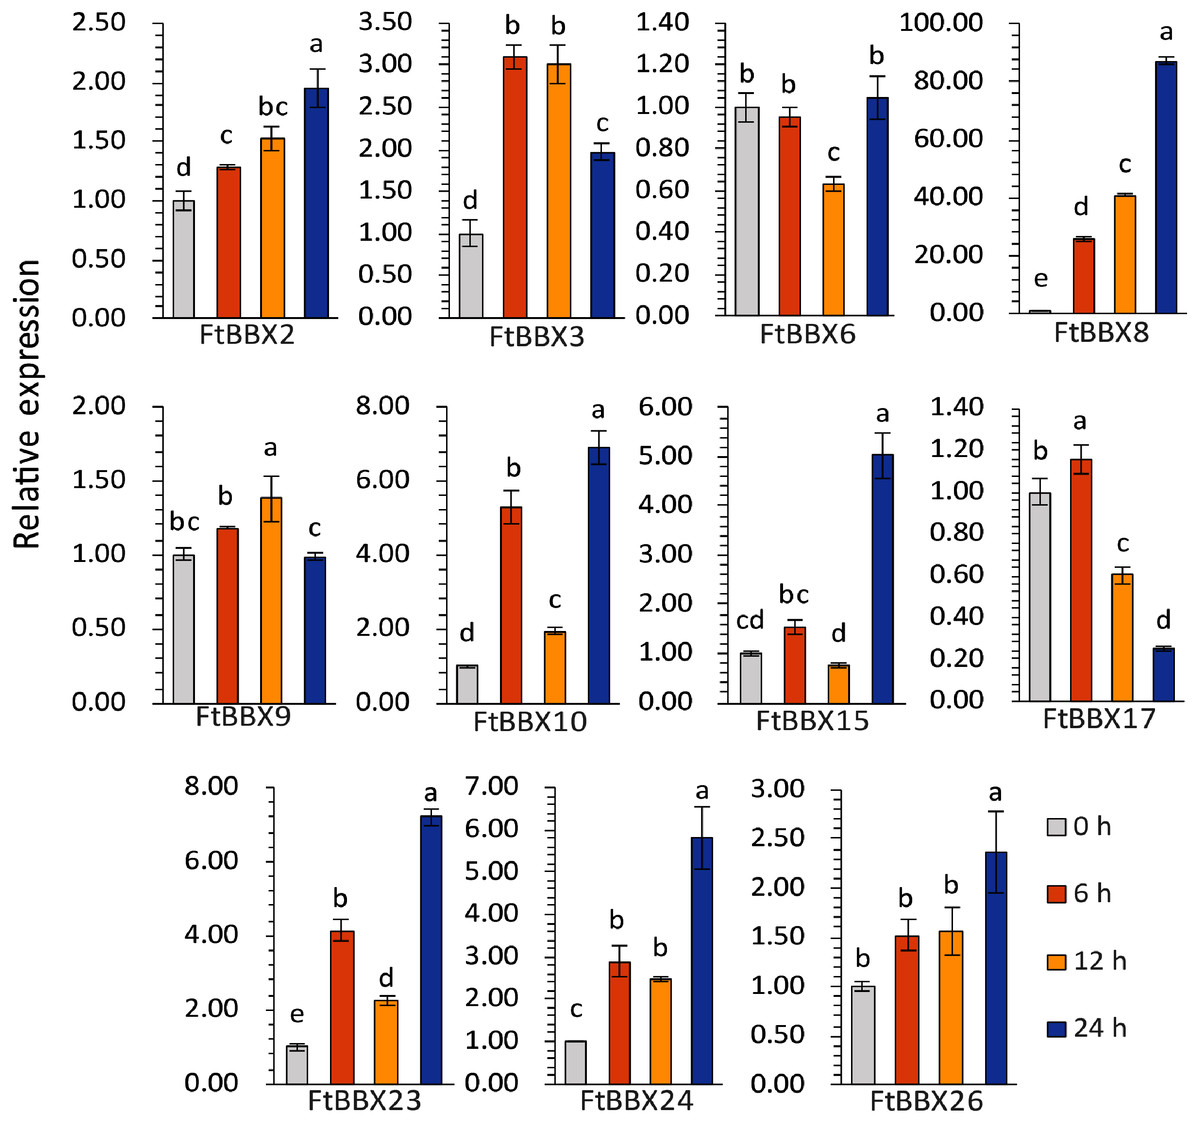
Figure 9: The expression profiles of 11 FtBBX genes in Tartary buckwheat seedlings under different illumination treatment time analyzed by qRT-PCR.
The lowercase letters above the bar chart indicated significant differences determined by one-way ANOVA, and different letters represented significant differences (p < 0.05); Data are means ± SD (n = 3).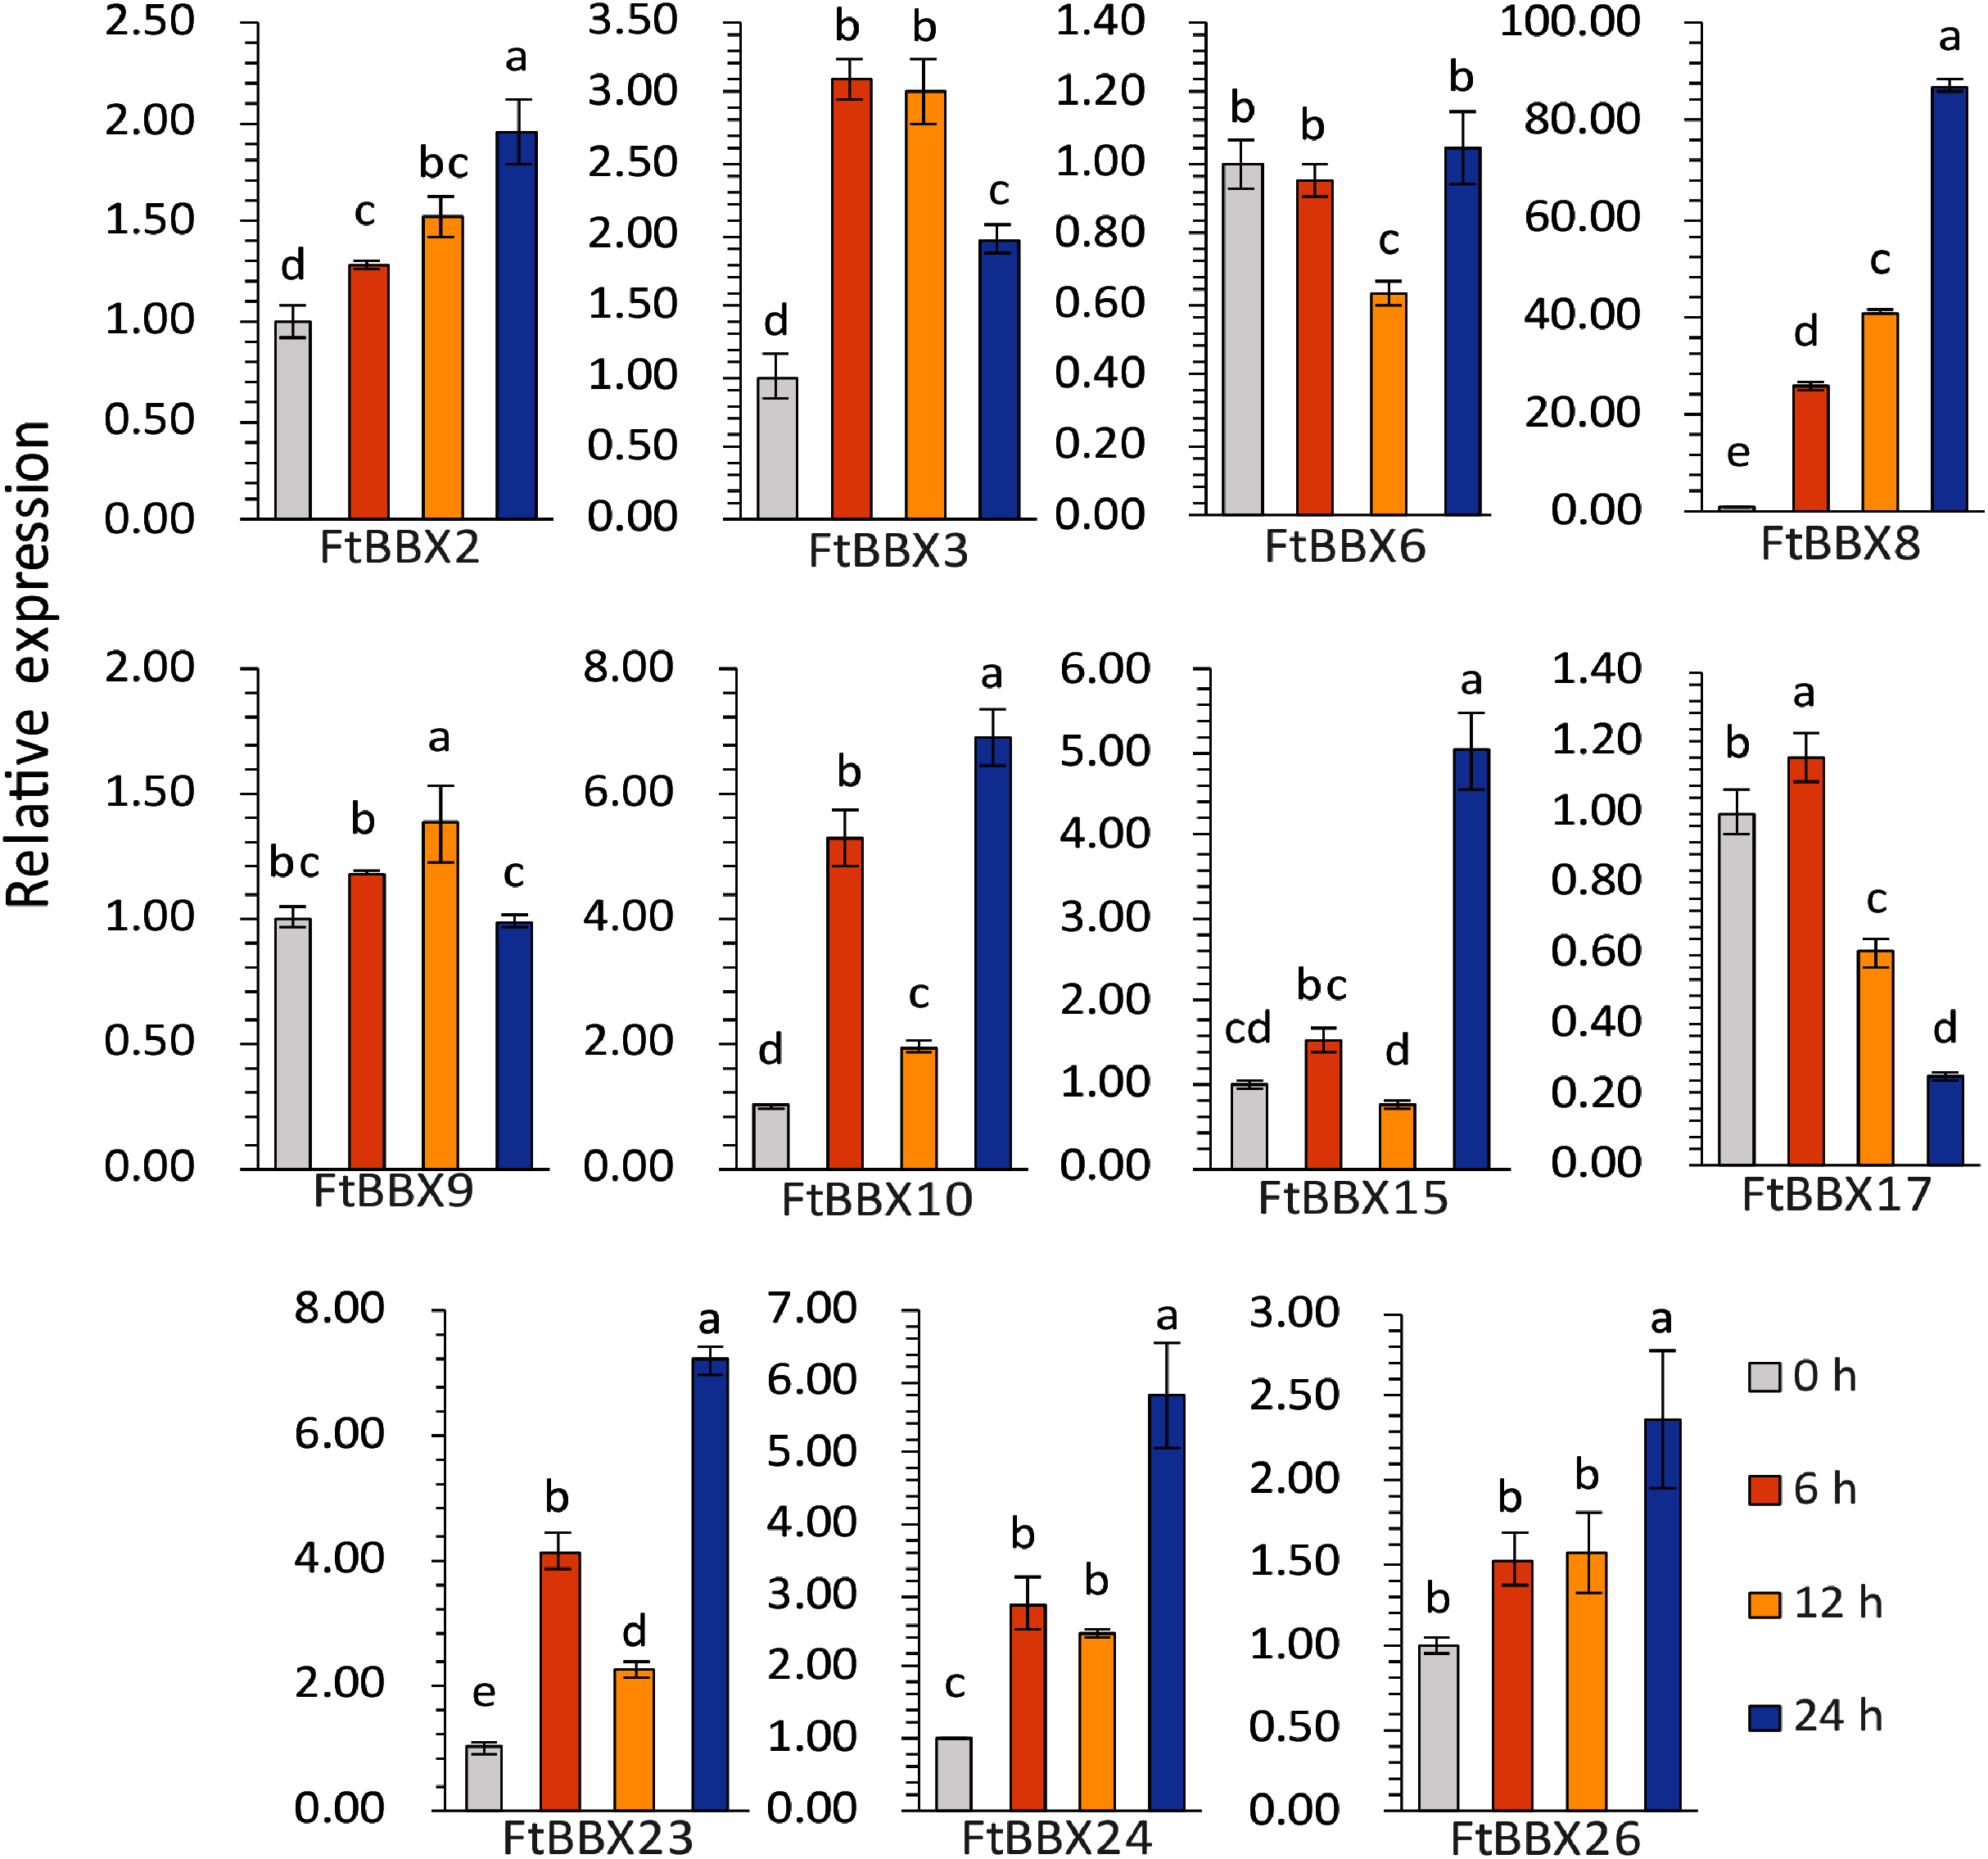
Discussion
Twenty-eight BBX family sequences were identified in Tartary buckwheat, which is similar with the number of BBX genes in Arabidopsis (32) and rice (30). Meanwhile, the classification of Tartary buckwheat BBX family also has a high similarity with that in Arabidopsis by analysis of phylogenetic tree, gene structure, conserved motifs, indicating that the BBX genes remained relatively intact during the plant evolution process. Besides, the results of collinearity analysis showed that the BBX gene between the dicots had better homology, and there was a significant difference in the genetic relationship between the dicots and the monocots.
There are some specific transcription factors in BBX family. These transcription factors combine with other protein to form a complex, BBX21, BBX22, BBX24 and BBX25 have been reported to genetically interact with HY5 in Arabidopsis (Datta et al., 2007, 2008; Chang et al., 2008; Jiang et al., 2012; Gangappa et al., 2013), and where the B-box domain can form a heterodimer in the BBX protein family or with other proteins (Gangappa et al., 2013). For example, in pear, PpBBX18 physically interacted with transcription factor ELONGATED HYPOCOTYL 5 (HY5) to form the PpHY5–PpBBX18 active transcription activator complex, and subsequently induce PpMYB10 gene expression and finally activate anthocyanin accumulation in the pee of pear fruit (Bai et al., 2019a), while another BBX protein, PpBBX21, can interact with PpHY5 and PpBBX18 to hinder the formation of the activator complex, and thus inhibiting anthocyanin biosynthesis (Bai et al., 2019a).
In plants, flavonoids are synthesized by phenylpropane, which can be divided into different kinds of derivatives, such as anthocyanins and procyanidins (Lepiniec et al., 2006). The biosynthesis of anthocyanins includes a series of enzymes encoded by structural genes and is relatively conserved among plant species (Qian et al., 2014). Transcription of the genes encoding these enzymes is regulated by the MYB-bHLH-WD40 (MBW) protein complex, HY5, and BBX (Ramsay & Glover, 2005; Bai et al., 2019a). As an important member of zinc finger structural transcription factors, the BBX gene family is widely involved in plant growth, development, and environmental response (Gangappa & Botto, 2014). Importantly, the R2R3-MYBs and bHLH were able to regulate individual flavonoid-related genes at the transcriptional level and cause the accumulation of one or more particular flavonoid derivatives. In this study, we focused on those BBX members that may regulate anthocyanin biosynthesis, however, several genes showed contradicting results at the phylogenetic analysis, qRT-PCR expression level, and the anthocyanin content result, such as FtBBX8, FtBBX10, FtBBX15, FtBBX17, FtBBX24, and FtBBX26. For example, FtBBX8 and AtBBX32 were clustered together in the phylogenetic analysis (Fig. 6), but the expression level of FtBBX8 continuously increased during light treatment, which was consistent with anthocyanin accumulation (Fig. 8). However, due to the complexity of BBX gene function, all the candidate FtBBX genes need further analysis to verify their functions in the regulation of anthocyanin biosynthesis.