
Exploring plant diversity through soil DNA in Thai national parks for influencing land reform and agriculture planning
- Published
- Accepted
- Received
- Academic Editor
- Amanullah Khan
- Subject Areas
- Agricultural Science, Biodiversity, Molecular Biology, Plant Science
- Keywords
- Agricultural expansion, Environmental DNA, Metabarcoding, Plant diversity, National Park
- Copyright
- © 2021 Osathanunkul et al.
- Licence
- This is an open access article distributed under the terms of the Creative Commons Attribution License, which permits unrestricted use, distribution, reproduction and adaptation in any medium and for any purpose provided that it is properly attributed. For attribution, the original author(s), title, publication source (PeerJ) and either DOI or URL of the article must be cited.
- Cite this article
- 2021. Exploring plant diversity through soil DNA in Thai national parks for influencing land reform and agriculture planning. PeerJ 9:e11753 https://doi.org/10.7717/peerj.11753
Abstract
Background
The severe deforestation, as indicated in national forest data, is a recurring problem in many areas of Northern Thailand, including Doi Suthep-Pui National Park. Agricultural expansion in these areas, is one of the major drivers of deforestation, having adverse consequences on local plant biodiversity. Conserving biodiversity is mainly dependent on the biological monitoring of species distribution and population sizes. However, the existing conventional approaches for monitoring biodiversity are rather limited.
Methods
Here, we explored soil DNA at four forest types in Doi Suthep-Pui National Park in Northern Thailand. Three soil samples, composed of different soil cores mixed together, per sampling location were collected. Soil biodiversity was investigated through eDNA metabarcoding analysis using primers targeting the P6 loop of the plastid DNA trnL (UAA) intron.
Results
The distribution of taxa for each sample was found to be similar between replicates. A strong congruence between the conventional morphology- and eDNA-based data of plant diversity in the studied areas was observed. All species recorded by conventional survey with DNA data deposited in the GenBank were detected through the eDNA analysis. Moreover, traces of crops, such as lettuce, maize, wheat and soybean, which were not expected and were not visually detected in the forest area, were identified. It is noteworthy that neighboring land and areas in the studied National Park were once used for crop cultivation, and even to date there is still agricultural land within a 5–10 km radius from the forest sites where the soil samples were collected. The presence of cultivated area near the forest may suggest that we are now facing agricultural intensification leading to deforestation. Land reform for agriculture usage necessitates coordinated planning in order to preserve the forest area. In that context, the eDNA-based data would be useful for influencing policies and management towards this goal.
Introduction
Thailand has been ambitiously aiming to have a forest coverage of 40% throughout the country, but this goal, set in 1985, has yet to be accomplished. However, satellite data to assess forest changes in tree density indicate that areas surrounding forests, e.g., agricultural areas and neighboring settlements, had a net gain in tree density (Reytar, Stolle & Anderson, 2019). Forest loss is nevertheless outpacing forest gain in Thailand. Forest coverage has declined from approximately 70% in 1950 to 31% in 2018 (Royal Forest Department, 1999). Deforestation has been occurring to an extreme degree in many parts of Northern Thailand (Delang, 2002; Virapongse, 2017).
Numerous studies have shown that deforestation results in a loss of plant diversity (Barlow et al., 2016; Giam, 2017; Decaëns et al., 2018). Agricultural expansion is one of the major drivers for deforestation in Thailand and several other countries in Asia, which resulted in plant biodiversity loss having adverse effects on ecology and climate (Jayathilake et al., 2021; Hosonuma et al., 2012). Thailand was endowed with cultivable land covering over 50% of the country’s land area (Land Development Department, 2012). As a result, the change from subsistence agriculture to cash crops cultivation, required an expansion of the agricultural land base (Jamroenprucksa, 2007). Over the past few decades, the area of agricultural land has expanded at the expense of the forest biodiversity. Conservation of biodiversity depends on the biological monitoring of plant species distribution not only for preserving threatened species, but also for maintaining the resilience and health of the ecosystems. Species monitoring in empirical ecological studies has thus far been relied on the morphology-based species identification. This is usually performed by morphological investigation and by counting individuals in the field (Elliott & Jonathan Davies, 2014). Obtaining biodiversity data solely by existing conventional approaches is hindered by several factors, including lack of diagnostic characters, the requirement of taxonomic expertise, as well as the associated expenses (Yoccoz et al., 2012; Fahner et al., 2016). In order to improve our understanding on the state of forest diversity, novel assessment methods should be applied characterized by sensitivity, effectiveness and reliability.
The latest sequencing technologies have paved the way in diversity studies. High-throughput sequencing (HTS) of DNA barcode amplicons (DNA metabarcoding) has proved to be a robust, accurate and efficient approach to survey biodiversity (Epp et al., 2012; Taberlet et al., 2012a; Yoccoz et al., 2012). Traces of living organisms including animals, plants and fungi can be accumulated and detected in the environmental DNA (eDNA). eDNA metabarcoding has been used to analyze the complex DNA from environmental samples like soil, water, air and feces (Drummond et al., 2015; Creer et al., 2016). Several markers are now available for use in the eDNA metabarcoding for various groups of organisms (Drummond et al., 2015; Fahner et al., 2016). Given that eDNA metabarcoding is a powerful technique offering many possibilities, we have used this approach to explore soil eDNA, which is expected to reflect taxonomic richness and diversity of plants in the studied area.
Deforestation is an ongoing problem in Northern Thailand and especially the Doi Suthep-Pui National Park (Marod et al., 2014). Doi Suthep-Pui National Park is the 24th national park, located in Chiang Mai Province. There are different altitudes in the National Park ranging from 330 m to 1,685 m ASL, resulting to a great variety of flora and fauna. The forest ecosystem of the Doi Suthep-Pui National Park is known for its wide indigenous genetic diversity. The major forest types represented in Doi Suthep-Pui National Park include the deciduous forest of the lowlands (deciduous dipterocarp, bamboo deciduous forest and mixed evergreen deciduous forest) and the evergreen forest of the uplands (Maxwell & Elliott, 2001). Although the national park is protected by various conservation measures, it is still facing plant diversity loss due to deforestation. Thus, eDNA data on species diversity is required for effective monitoring of biodiversity in this area for conservation and management purposes.
Materials & Methods
Soil sampling
Soil samples were collected from four forest types in Doi Suthep-Pui National Park in Northern Thailand. The locations where the soil samples were taken are indicated in Table 1. We collected three samples (each composed of many soil cores mixed together) per sampling location, which were subsequently used for the DNA extraction. Field permits were granted by the Department of National Parks, Wildlife and Plant Conservation (Field Permit number: 0907.4/2529).
| Abbreviation | Communities | Latitude | Longitude | Altitude |
|---|---|---|---|---|
| CA | coniferous | 18°49′51”N | 98°53′33”E | 1,342 |
| HE | hill evergreen | 18°49′36”N | 98°53′55”E | 1,214 |
| DD | dry dipterocarp | 18°47′15”N | 98°55′10”E | 827 |
| DE | dry evergreen | 18°47′16”N | 98°55′11”E | 809 |
DNA extraction and sequence analyses
Extracellular DNA was extracted twice from 15 g of soil per soil core as described previously (Taberlet et al., 2012b). Air-dried soil sample was mixed with 15 ml of saturated phosphate buffer (Na2HPO4; 0.12 M, pH ≈ 8) for 15 min followed by centrifugation for 10 min at 10,000 g. Approximately 400 µl of the supernatant were used as starting material for extraction by the NucleoSpin Soil kit (MACHEREY–NAGEL, Germany), following the manufacturer’s instructions omitting the cell lysis step.
Soil biodiversity was investigated through eDNA metabarcoding analysis using primers targeting the P6 loop of the plastid DNA trnL (UAA) intron using the g (5′-GGGCAATCCTGAGCCAA-3′) and h (5′-CCATTGAGTC TCTGCACCTATC-3′) primers (Yoccoz et al., 2012), which were 5′- labelled for each soil core sample with a unique eight-nucleotide tag. PCR negative controls were included for a quality check of the amplifications. The sequencing was conducted by 2 × 125 base pairs, pair-end sequencing. The sequences of DNA were filtered with OBITools software (Boyer et al., 2016) following the procedure detailed in Pansu et al. (2015). The initial step of the process was to join the forward and reverse reads, using the OBITools suite. The Illumina paired-end tool of the suite aligned the two reads of the sequenced pair-end library, returning either the consensus sequence, or when there was no overlap, the concatenation of the forward and reverse-complement sequence reads.
The next step was to distinguish between sequences from different PCR products (from 24 extractions) pooled in the same sequencing library. The Next-Generation Sequencing filter tool from the suite was used in this instance, taking as input the aligned/merged reads and a file containing tag pairs information corresponding to each sample. The results consisted of sequence records with their sequence trimmed of the primers and tags and annotated with the corresponding experiment and sample. Sequences for which the tags and primers have not been well identified, and which are thus unassigned to any sample, are stored in a different file and tagged as erroneous sequences by the tool.
The first step of the downstream analysis was to de-multiplex the single FASTQ file into multiple sample-specific FASTQ-formatted files. This was performed using standard Linux commands for splitting the original file. After demultiplexing, quality trimming was performed with Trim Galore tool using the default parameters (default Phred score 20). The trimmed samples were imported into QIIME 2 (version 2020.8) as single-end files. All samples were denoised, dereplicated and filtered for chimeras with the DADA2 plugin. No singletons are reported as DADA2 does not call singletons. In Table 2 the total number of processed reads during the DADA2 step is presented. For each sample between 80% to 98% of the raw reads were passed as non-chimeric. The resulted reads were clustered with the de novo clustering method having percent identity of 99%. The final step was to annotate the final OTUs with the taxonomy based on homology with sequences in the National Center for Biotechnology Information (NCBI) non-redundant (NR) database. The NR database is compiled by the NCBI as a protein database for BLAST searches. It contains non-identical sequences from GenBank CDS translations, PDB, Swiss-Prot, PIR, and PRF. The strengths of NR are that it is comprehensive and frequently updated. This annotation step was performed using the HERMES tool (Kintsakis et al., 2017) to run a full BLAST comparison with NR, and keeping the single best hit per sequence. The GenInfo Identifier (GI) number, a simple series of digits that are assigned consecutively to each sequence record processed by NCBI, of each hit was consequently connected to the corresponding taxonomy and the query sequence (i.e., original OTU) was annotated with the produced taxonomy.
| Sample-id | Input (after quality trimming) | Filtered | Input passed filter (%) | Denoised | Non-chimeric | Input non-chimeric (%) |
|---|---|---|---|---|---|---|
| CA1 | 186,403 | 185,030 | 99.26 | 184,613 | 168,120 | 90.19 |
| CA2 | 114,641 | 112,908 | 98.49 | 111,947 | 102,832 | 89.7 |
| CA3 | 264,423 | 256,404 | 96.97 | 255,978 | 232,368 | 87.88 |
| DD1 | 188,652 | 186,650 | 98.94 | 185,492 | 177,079 | 93.87 |
| DD2 | 173,521 | 173,106 | 99.76 | 172,795 | 170,795 | 98.43 |
| DD3 | 174,168 | 173,531 | 99.63 | 173,459 | 146,102 | 83.89 |
| DE2 | 143,186 | 142,606 | 99.59 | 142,354 | 139,775 | 97.62 |
| DE3 | 175,162 | 174,653 | 99.71 | 174,230 | 172,227 | 98.32 |
| HE1 | 163,084 | 159,777 | 97.97 | 158,689 | 140,204 | 85.97 |
| HE2 | 198,672 | 192,739 | 97.01 | 191,885 | 180,297 | 90.75 |
| HE3 | 132,638 | 129,097 | 97.33 | 128,393 | 121,062 | 91.27 |
Within-community (alpha) diversity was estimated for every sample, using the phyloseq package in R (McMurdie & Holmes, 2013). As an input to the function the clustered OTU table was used in which singletons were excluded. For this reason, the Shannon index was used in order to avoid estimates that are highly dependent on the number of singletons.
Results
In this study, we used eDNA metabarcoding method to explore plant diversity from soil sampled at four forest types in Doi Suthep-Pui National Park. We obtained a total of 2,031,271 g/h sequence reads from 12 different samples including Coniferous (CA1-3), Dry dipterocarp (DD1-3), Dry evergreen (DE1-3), Hill evergreen (HE1-3) soils (Fig. 1). Numbers of processed reads over the downstream analysis of each sample are shown in Table 2.
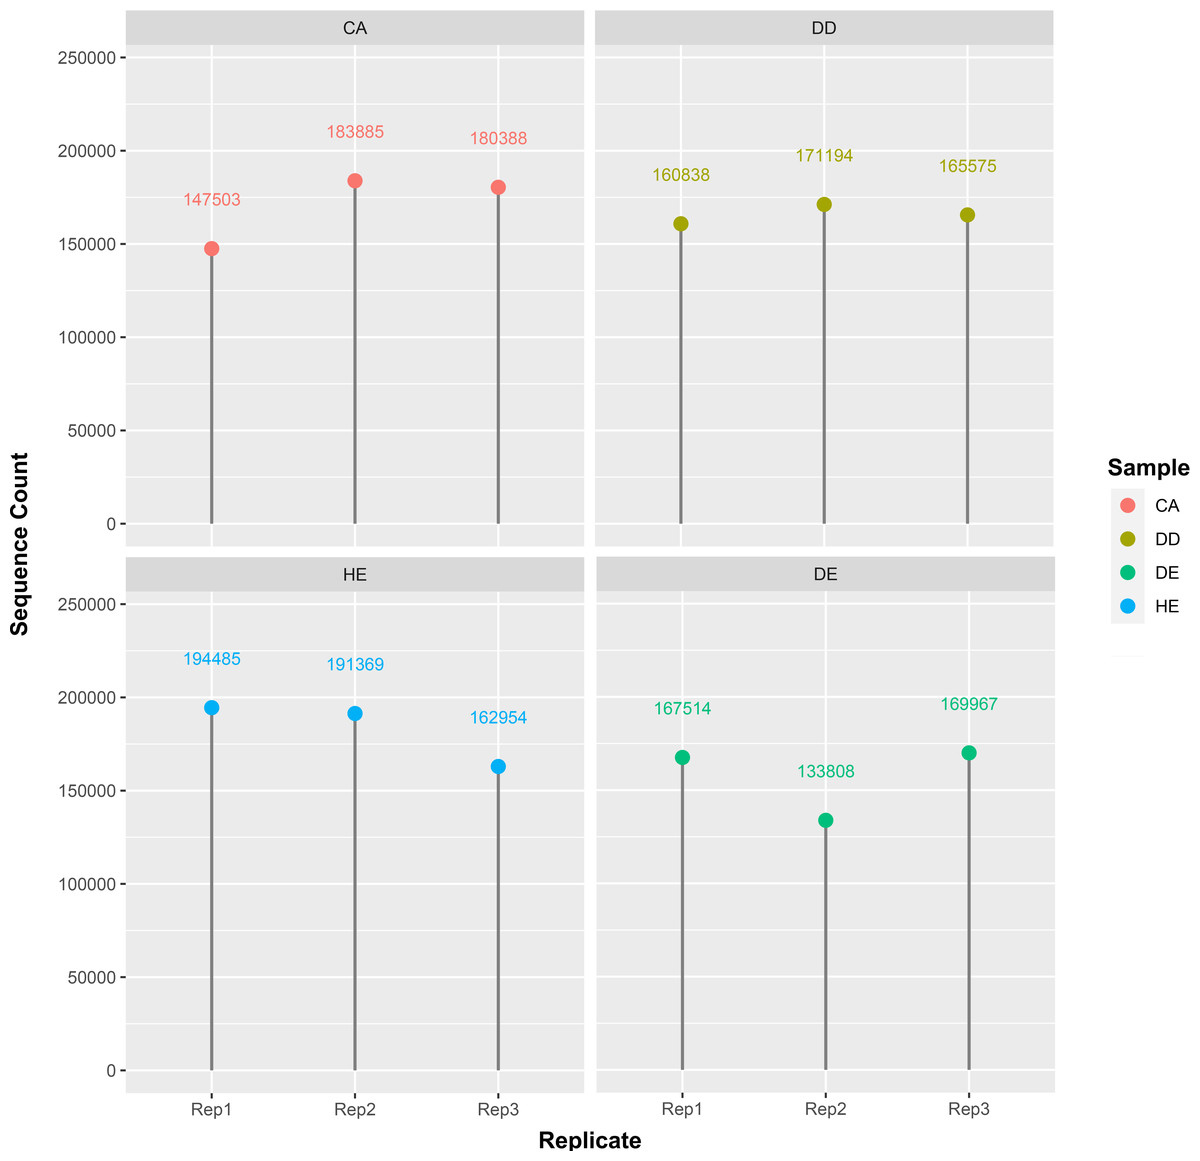
Figure 1: Distribution of the sequence count per sample.
There are four samples which are CA: coniferous, DD: dry dipterocarp, DE: dry evergreen, and HE: hill evergreen with three replicates per sample.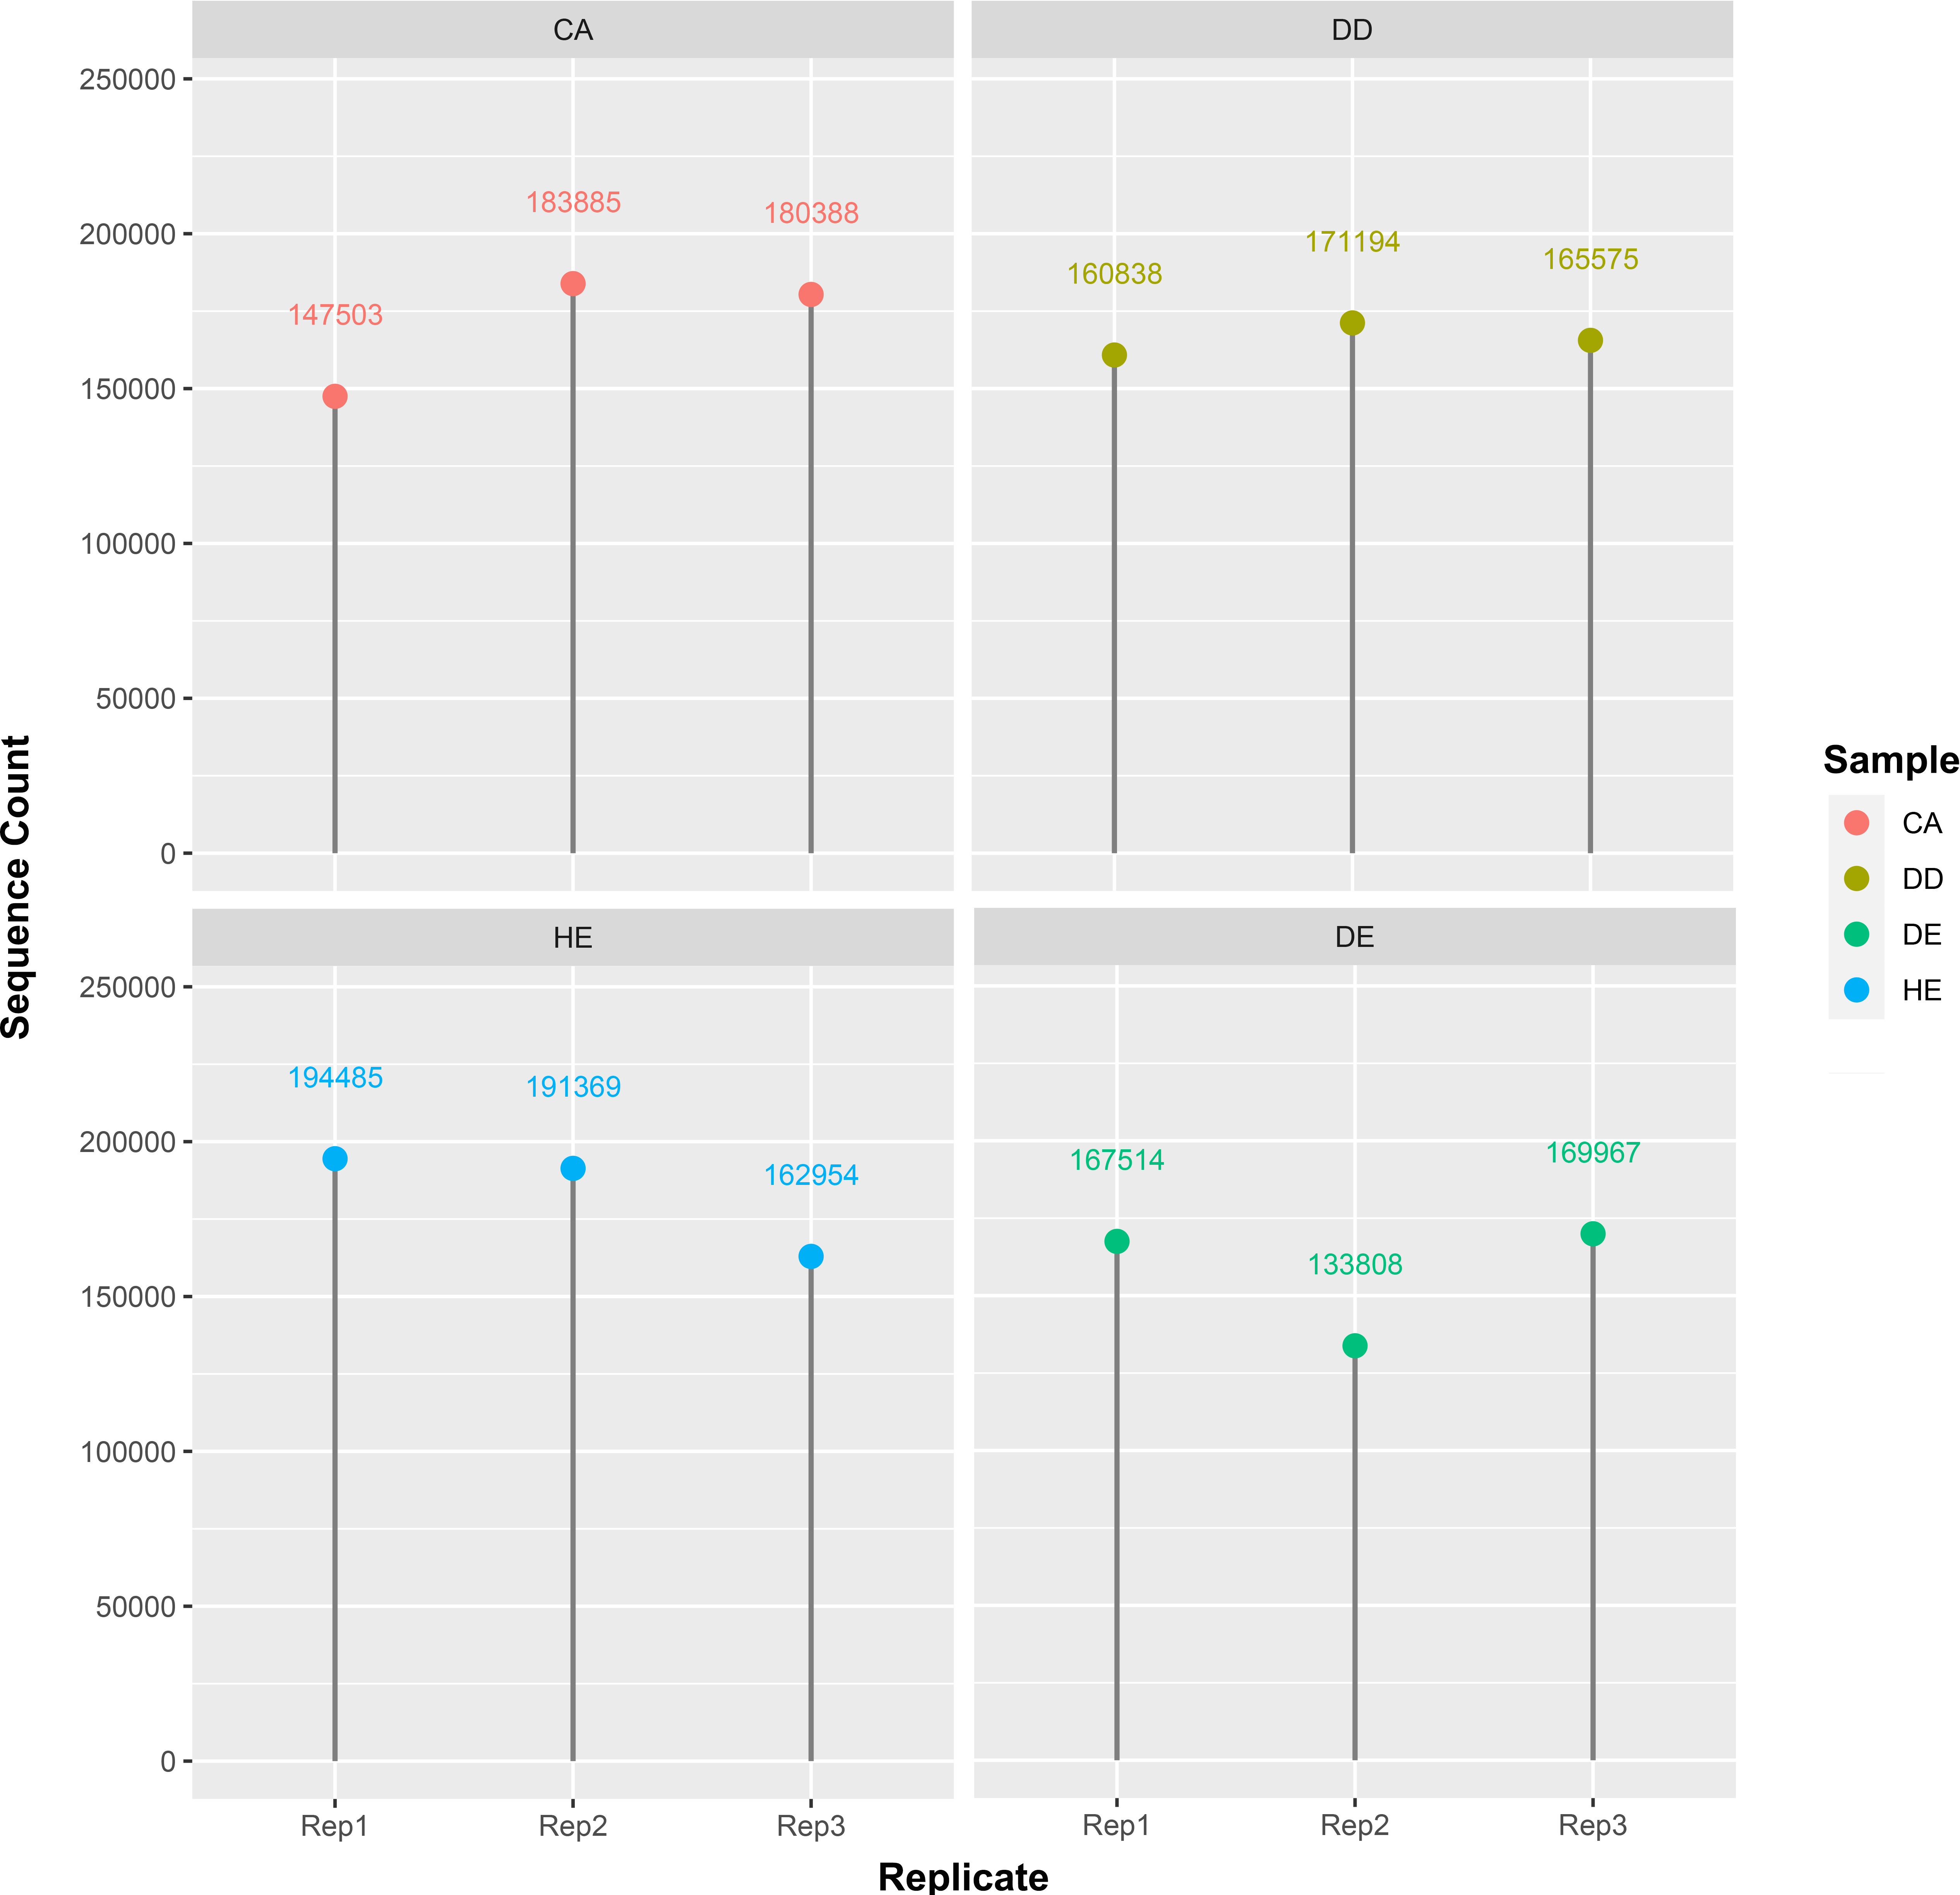
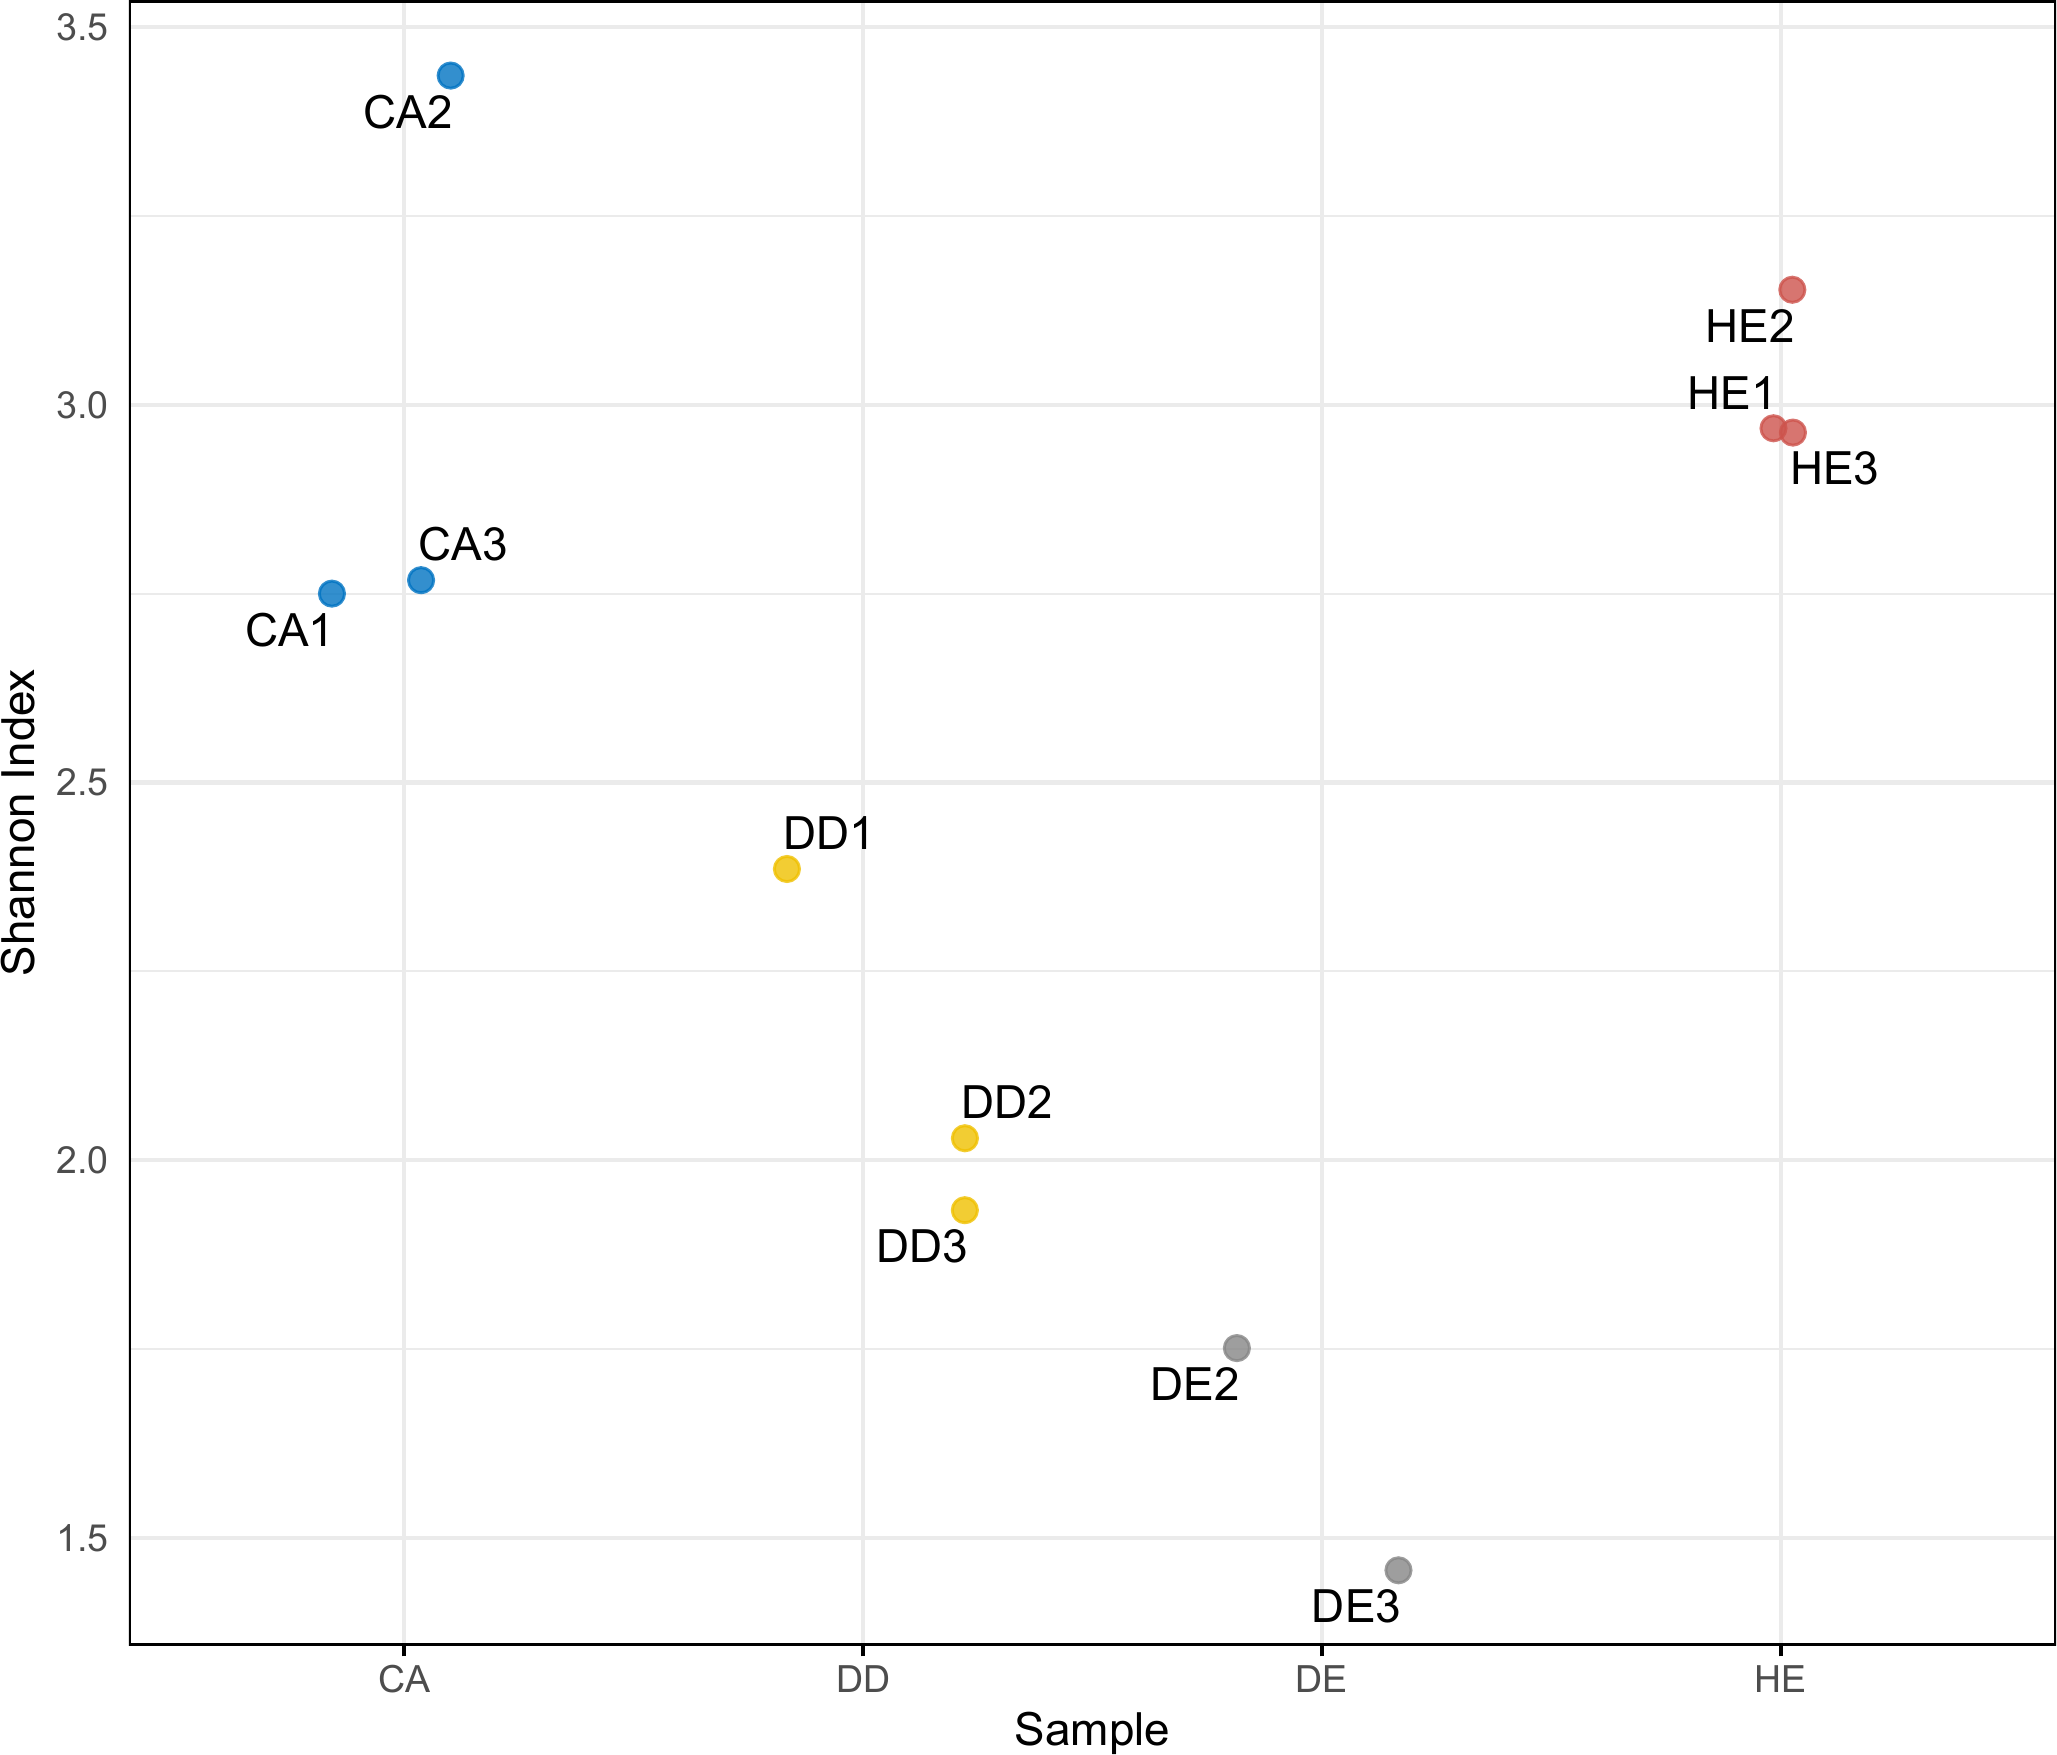
Differences in diversity between samples were measured using the Shannon diversity index (Fig. 2). The alpha diversity results indicate that Coniferous (CA) and Hill Evergreen (HE) samples present higher mean species diversity, in comparison to Dry Dipterocarp (DD) and Dry Evergreen (DE) samples. Moreover, we performed Principal Component Analysis and Hierarchical clustering in order to investigate how are the samples clustered. To this end the OTU table was used on which Total Sum Scaling (TSS) normalization was applied. In Fig. 3A. The result of Hierarchical clustering with the Euclidean distance method and the Ward.D clustering method is shown. In Fig. 3B. all samples are projected in PC1–PC2 dimensional space. In both cases the Coniferous (CA) and Hill Evergreen (HE) samples are grouped together, in agreement with the alpha diversity results.
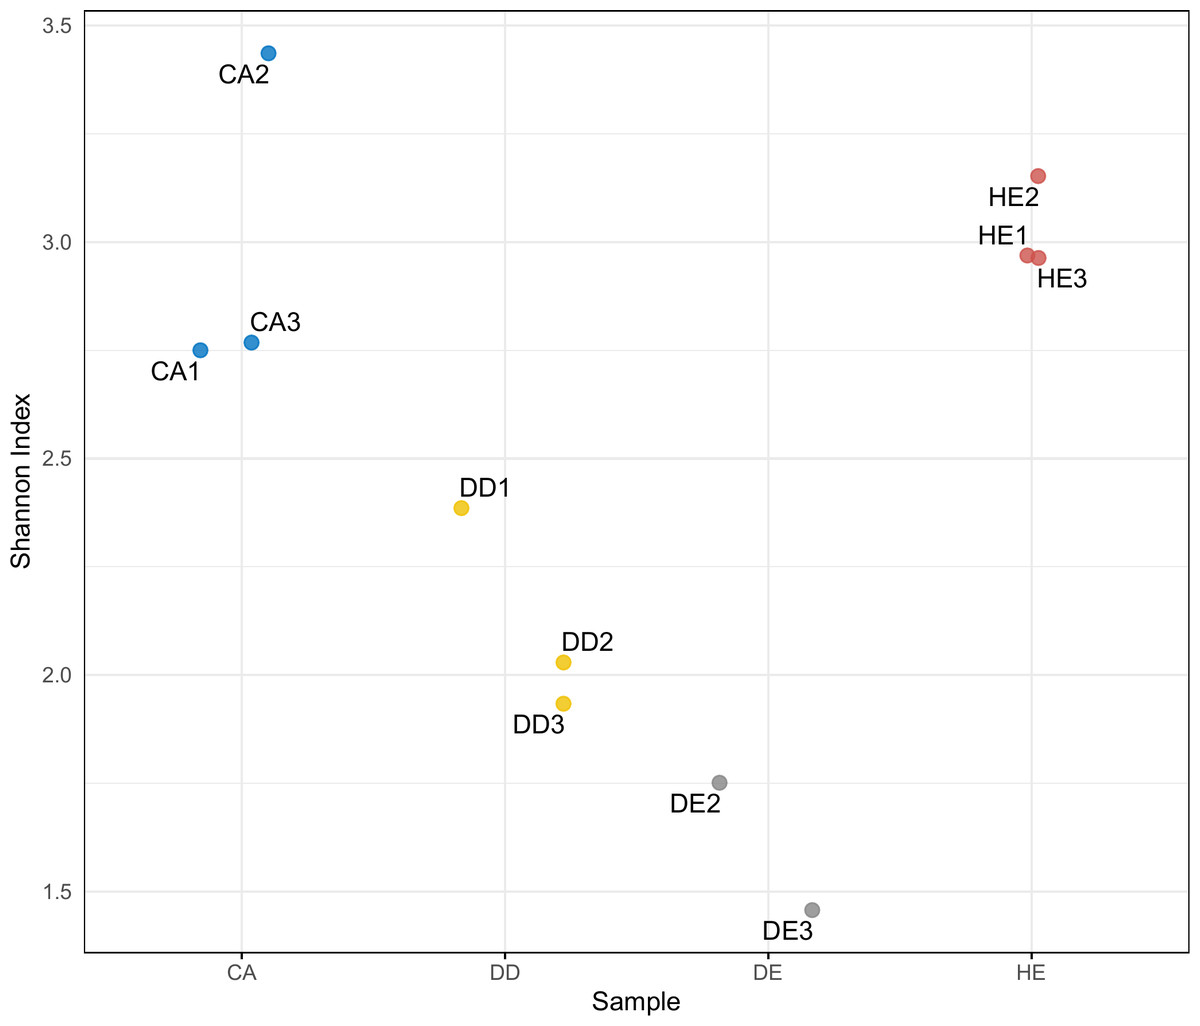
Figure 2: Within-community (alpha) diversity measured with the Shannon index as a function of the sample group (CA, DD, DE and HE).
Figure 3: (A) Hierarchical clustering of the samples based on the normalized (Total Sum Scaling normalization–TSS) OTU table.
The Euclidean distance metric and the ward. D clustering method have been used. (B) The PC1–PC2 two-dimensional space along with the corresponding explained variance.
According to the species annotation results (1. 7578 × 106 reads), the statistics of sequence number were placed in different classification levels i.e., genus and species. The dominant taxa among all samples, which were obtained from conventional survey and our analyses are displayed in Table 3. Interestingly, there are 31 plants that could not be identified at the species level and nine that were only visually identified but could not be detected by the eDNA method (Table 3). Analysis of DNA data from these 40 species in the GenBank database showed that none of those species had the trnL sequence deposited (Supplementary data 1).
| Family | Species | Conventional survey | Soil eDNA | |||
|---|---|---|---|---|---|---|
| CA | DD | DE | HE | |||
| Actinidiaceae | Saurauia napaulensis DC. | – | – | – | x | x |
| Saurauia roxburghii Wall. | x | x | – | x | x | |
| Anacardiaceae | Spondias pinnata (L.f.) Kurz | – | – | x | – | x |
| Annonaceae | Melodorum fruticosum Lour | – | – | x | – | x |
| Miliusa lineata Alston | – | – | x | – | x | |
| Bignoniaceae | Oroxylum indicum vent. | – | – | x | – | x |
| Stereospermum neuranthum Kurz | x | – | – | x | xx | |
| Burseraceae | Protium serratum Engler | x | – | x | x | xx |
| Compositae | Vernonia volkameriaefolia Wall. ex DC. | x | – | – | x | xx |
| Dipterocarpaceae | Dipterocarpus alatus Roxb. ex G.Don | – | – | x | – | x |
| Dipterocarpus obtusifolius Teijsm. ex Miq. | x | x | x | – | x | |
| Dipterocarpus tuberculatu s Roxb. | – | x | – | – | x | |
| Dipterocarpus turbinatus Gaertn. f. | x | x | x | – | x | |
| Hopea odorata Roxb. | – | x | x | – | x | |
| Shorea obtusa Wall. ex Blume | – | x | – | x | xx | |
| Shorea roxburghii G. Don | – | x | x | x | x | |
| Shorea siamensis Miq. | – | x | – | – | x | |
| Ebenaceae | Diospyros ehretioides Wall. ex G. Don | – | x | – | – | x |
| Elaeocarpaceae | Elaeocarpus sphaericus Schum | – | – | – | x | x |
| Elaeocarpus stipularis Bl. | x | – | x | x | x | |
| Ericaceae | Vaccinium sprengelii Sleumer | x | x | – | x | xx |
| Euphorbiaceae | Antidesma bunius (L.) Spreng. var. bunius | x | – | – | x | – |
| Antidesma sootepense Craib | – | x | – | x | – | |
| Baccaurea ramiflora Lour. | – | – | x | x | x | |
| Balakata baccata (Roxb.) Esser | – | x | – | – | x | |
| Bischofia javensis Blume | – | – | – | x | – | |
| Bridelia affinis Craib | – | x | – | – | x | |
| Bridelia glauca Blume | x | – | – | x | x | |
| Bridelia retusa (L.) A.Juss | – | x | – | x | x | |
| Mallotus barbatus Muell. Arg | x | – | – | x | x | |
| Mallotus paniculatus Muell. Arg | – | – | x | x | x | |
| Fagaceae | Castanopsis acuminatissima Rehd. | x | x | x | x | xx |
| Castanopsis calathiformis Kurz | x | – | x | x | x | |
| Castanopsis diversifolia King | x | x | x | x | xx | |
| Castanopsis purpurea Barnett | x | x | – | – | xx | |
| Lithocarpus elegans Hatus. ex Soepadmo | x | x | x | x | xx | |
| Lithocarpus fenestratus Rehd | – | – | x | x | x | |
| Lithocarpus finetii A. Camus | x | – | – | x | xx | |
| Lithocarpus lindleyanus A. Camus | x | x | – | x | xx | |
| Lithocarpus tenuinervis A. Camus | x | x | – | x | xx | |
| Lithocarpus thomsonii Rehd. | x | – | x | x | xx | |
| Quercus brandisiana Kurz | – | x | – | x | x | |
| Quercus helferiana A. DC. | x | – | x | x | xx | |
| Quercus kerrii Craib | x | x | x | x | xx | |
| Quercus kingiana Craib | x | x | x | x | xx | |
| Flagellariaceae | Flagellaria indica Linn. | – | – | x | – | x |
| Gnetaceae | Gnetum montanum Markgr. | x | – | x | x | x |
| Hypericaceae | Mesua ferrea Linn. | – | – | x | – | x |
| Irvingiaceae | Irvingia malayana Oliv. ex A.W.Benn. | – | – | x | – | xx |
| Juglandaceae | Engelhardtia serrata Blume | x | – | x | x | x |
| Engelhardtia spicata Blume var. colebrookeana (Lindl. ex. Wall.) Kuntze | x | – | – | x | x | |
| Labiatae | Clerodendrum serratum (L.) Moon var. wallichii C.B. Clarke | x | x | x | x | x |
| Clerodendrum viscosum Vent. | – | – | x | – | x | |
| Lauraceae | Actinodapne henryi Gamble | – | – | – | x | – |
| Cryptocarya pallens Kosterm | x | – | – | x | xx | |
| Lindera metcalfiana Allen | x | – | x | x | xx | |
| Leguminosae | Acacia megaladena Desv. var. megaladena | – | – | x | x | xx |
| Dalbergia cana Graham ex Kurz | – | x | – | x | x | |
| Dalbergia cultrata Graham ex Benth. | x | x | x | x | x | |
| Dalbergia oliveri Gamble | – | x | – | – | x | |
| Dalbergia ovata Grah. | x | – | – | x | xx | |
| Desnodium megaphullum Zoll | x | x | – | x | – | |
| Indigofera caloneura Kurz. | x | – | – | – | xx | |
| Millettia pachycarpa Benth. | – | – | – | x | x | |
| Pterocarpus macrocarpus Kurz | – | x | – | – | xx | |
| Magnoliaceae | Manglietia garrettii Craib | x | – | x | x | xx |
| Melastomataceae | Memecylon celastrinum Kurz | x | – | x | x | – |
| Meliaceae | Trichilla connaroides (Wight & Arn.) Bentv. T | – | – | – | x | – |
| Moraceae | Artocarpus gomezianus Wall. ex Trec. | x | – | x | x | x |
| Artocarpus lakoocha Roxb. | – | – | – | x | x | |
| Ficus auriculata Lour. | – | – | – | x | x | |
| Ficus callosa Willd. | – | – | – | x | x | |
| Ficus religiosa Linn. | – | x | – | – | x | |
| Myrsinaceae | Rapanea yunnanensis Mez | x | – | x | x | xx |
| Myrtaceae | Syzygium albiflorum (Duthie & Kurz) Bahadur & R.C.Guar | x | x | – | x | xx |
| Tristaniopsis burmanica (Griff) Peter G.Wilson & J.T. Waterh. var. rufescens (Hance) J.Parn. & Nic Lughadha | – | x | – | x | – | |
| Pinaceae | Pinus kesiya Royle ex Gordon | x | – | – | – | x |
| Pinus merkusii Royle. ex Gordon | x | x | – | – | x | |
| Poaceae | Bambusa membranacea (Munro) C.M.A. Stapleton & N.H. Xia | – | x | – | – | x |
| Bambusa nutans Wall. | – | x | – | – | x | |
| Gigantochloa albociliata | – | x | – | – | x | |
| Proteaceae | Helicia nilagirica Bedd. | x | x | – | x | xx |
| Rubiaceae | Canthium parvifolium Roxb. | x | – | x | x | xx |
| Gardenia coronaria Buch.-Ham | – | x | x | x | x | |
| Gardenia obtusifolia Roxb. Ex Kurz | – | x | x | x | x | |
| Ixora cibdela Craib | – | x | x | x | xx | |
| Pavetta tomentosa Roxb. ex. Sm. var. tomentosa | x | x | x | x | xx | |
| Randia sootepensis Craib | x | – | x | x | x | |
| Tarrennoidea wallichii (Hook.f.) Tirveng. & Sastre | x | – | x | x | – | |
| Wendlandia tinctoria A. DC. | x | x | x | x | x | |
| Strychnaceae | Strychnos nux-vomica Craib | – | x | – | – | x |
| Styracaceae | Styrax benzoides Craib | x | – | x | x | xx |
| Theaceae | Anneslea fragrans Wall. | x | x | x | x | x |
| Camellia oleifera Abel. | x | – | – | – | x | |
| Camellia sinensis Ktze. var. assamica Kitamura | – | – | – | x | x | |
| Eurya acuminata DC. | x | – | – | – | x | |
| Eurya nitida Korth. | x | x | x | x | x | |
| Schima wallichii Korth. | x | x | x | x | x | |
| Ternstroemia gymnanthera (Wight & Arn.) Bedd. | x | – | – | x | x | |
Notes:
- x
-
found
- xx
-
found at genus level
- –
-
not found
Furthermore, results from our study on the trnL region compared with the available sequences in GenBank showed that in a total of 1,225 plant species in Dipterocarpaceae and 1,101 species in Fagaceae family, there were only 268 (21.9%), and 154 (14.0%) species having trnL sequences deposited in the database, respectively, thus hindering the eDNA metabarcoding identification for these species. There are three, nine, eight and five plant species found only in the coniferous (CA), dry dipterocarp (DD), dry evergreen (DE) and hill evergreen (HE) community, respectively. Nine species were found in all forest types (Fig. 4). Interestingly, our molecular analyses showed traces of crops that were not expected to be found in the forest including lettuce (Lactuca sativa), maize (Zea mays), wheat (Triticum timopheevii) and soybean (Glycine max). Additionally, these crop plant species, which were found in the soil samples, were not visually detected in situ during the collection of the soil samples.
Figure 4: Plant species found in one type of the forest soil samples and species that detected in all four types of forest.
Discussion
Herein, eDNA metabarcoding analysis revealed that unique plant groups are present in specific forest types, whereas some species were detected in all sample types. A strong congruence between the morphological- and eDNA-based data of plant diversity in the studied areas was also observed. The alpha diversity results indicate that Coniferous (CA) and Hill Evergreen (HE) samples present higher mean species diversity in comparison to Dry Dipterocarp (DD) and Dry Evergreen (DE) samples. Interestingly, morphological assessment only focusses on tree species and thus excludes the smaller plants like shrubs, herbs and grasses, such as Alloteropsis, Canavalia, Germainia and Miscanthus. However, the soil eDNA metabarcoding reveals both above- and below-ground species and assesses the composition and richness of plant communities from soil or sediment samples. Several studies reported higher eDNA-based diversity compared to traditional sampling approaches (Epp et al., 2012; Hiiesalu et al., 2012; Pansu et al., 2015; Alsos et al., 2018; Matesanz et al., 2019).
Two popularly used single-locus regions, trnL and rbcL, have been the markers of choice for plant eDNA metabarcoding. Although trnL gave better results of species richness in some studies, rbcL also showed higher sequence recovery of target taxa in others (Epp et al., 2012; Yoccoz et al., 2012; Fahner et al., 2016; Mallott, Garber & Malhi, 2018). Recently, the nuclear ribosomal internal transcribed spacer (ITS) is becoming popular marker of choice in the field, showing a high level of sequence divergence. The ITS2 region has greater coverage in vascular plant species sequences on GenBank when compared to the rbcL and trnL (Fahner et al., 2016). However, plant species have been misidentified as fungi in several studies given the limited nucleotide variation in the ITS2 region between fungi and plants. The main factor influencing eDNA metabarcoding results is the lack of relative DNA sequences in the databases (Edwards et al., 2018). For example, although Castanopsis acuminatissima, Lithocarpus elegans, and Quercus kerrii are common species in the study region, there was no available trnL reference sequence for these species, and thus could not be identified in our metabarcoding analysis. In addition, all 40 dominant plant taxa previously recorded in the Doi Suthep-Pui National Park lacked reference sequences in the GeneBank for trnL DNA barcoding region, thus none of them could have been identified through metabarcoding at species level in the soil samples (Supplementary data 1). DNA data of plants in Dipterocarpaceae and Fagaceae family are very scarce in the GeneBank. More comprehensive reference sequence database is required in order to increase species-level resolution for plant biodiversity assessments.
Herein, we report the identification of cultivated plant species, which were not visually detected during sampling. Plant DNA has been reported to remain in soil for up to 50 years and can be detected by metabarcoding (Yoccoz et al., 2012). The eDNA metabarcoding was able to detect crop plant species cultivated up to 8 years before soil sampling (Foucher et al., 2020). Interestingly, nearby lands and some areas in the Doi Suthep-Pui National Park used to be cultivated lands. Also, cultivated lands still exist within a 5–10 km radius of the forest areas where the soil cores samples were taken.
In addition, Christisonia, one of the rare plant genera of Thailand, was detected only in one replicate of soil samples collected from dry evergreen forest (DE). Inability to detect this species in some replicates might be due to the effects of PCR and variation in the soil material used for DNA extractions. Similar results have been previously published and thus sensitivity and reproducibility of the eDNA metabarcoding results have been a challenging issue (Boggs, Scheible & Meiklejohn, 2019). To avoid replicate variation, it has been suggested that performing technical replicates during PCR and pooling them before downstream processing could be effective (Lauber et al., 2013; Young, Weyrich & Cooper, 2016; Demanèche et al., 2017). Christisonia is a genus of root parasitic plants. The DNA concentration of these plants in the soil would be proportionally lower by the distance from host plant, as previous reported by (Osathanunkul, 2019) on an eDNA detection of a root parasitic species, Sapria himalayana. Some of the replicates of the DE sample were collected from areas far from the host plants, while the replicate in which Christisonia was detected was in close range. Therefore, the DNA concentration among the soil replicates was not equal and has led to variation in species detection.
The eDNA based method is more sensitive compared to the traditional morphology-based approaches. This is because it provides a comprehensive view of the targeted community, which is not only strongly reflecting current diversity, but also past biodiversity (Yoccoz et al., 2012; Smith et al., 2015; Foucher et al., 2020). Therefore, obtaining data from a soil DNA metabarcoding-based study would allow for better understanding of the studied areas. In our case, the presence of DNA from crop plant species in the soil samples collected from the forest still leads to a big question of whether we are now facing an agricultural intensification; however further investigation is needed.
Conclusions
The eDNA metabarcoding is a rapid method for monitoring biodiversity, which could greatly advance assessment and enable understanding of the threats to the ecosystems, and could lead to effective conservation strategies. The method was proven to be revolutionary in biodiversity research. Herein, we report a strong congruence between the conventional morphology- and eDNA-based data of plant diversity in the studied areas. In addition, traces of crops that were not expected to be found in the forest were found in the eDNA analyses but were not identified by visual detection. eDNA metabarcoding used for biodiversity studies could allow the understanding of possible biodiversity shifts and give an insight towards land use change. Thus, the presence of crop plant traces probably suggests that we might face an agricultural intensification, which might lead to loss of biodiversity. Nevertheless, land reform for agricultural use should be well-planned in order to preserve forest biodiversity and in this context, the eDNA-based technology could be of paramount importance in assisting correct policy measures and planning.