
Nitrogen fertilizer reduction in combination with Azolla cover for reducing ammonia volatilization and improving nitrogen use efficiency of rice
- Published
- Accepted
- Received
- Academic Editor
- Mirza Hasanuzzaman
- Subject Areas
- Agricultural Science, Ecology, Plant Science, Soil Science, Environmental Impacts
- Keywords
- Nitrogen fertilizer reduction, Azolla cover, Ammonia volatilization, Nitrogen use efficiency, Rice
- Copyright
- © 2021 Yang et al.
- Licence
- This is an open access article distributed under the terms of the Creative Commons Attribution License, which permits unrestricted use, distribution, reproduction and adaptation in any medium and for any purpose provided that it is properly attributed. For attribution, the original author(s), title, publication source (PeerJ) and either DOI or URL of the article must be cited.
- Cite this article
- 2021. Nitrogen fertilizer reduction in combination with Azolla cover for reducing ammonia volatilization and improving nitrogen use efficiency of rice. PeerJ 9:e11077 https://doi.org/10.7717/peerj.11077
Abstract
Background
Excessive nitrogen (N) application rate with low N use efficiency (NUE) caused a considerable amount of N losses, especially ammonia volatilization (AV). Proper N fertilizer reduction (RN) could significantly reduce AV. However, continuous RN led to a nutrient deficiency in the soil and therefore negatively impacted the NUE and rice yield. Paddy Azolla, a good green manure, is considered as a promising measure to decrease AV and improve NUE and grain yield of rice. However, there is limited information on the integrated effects of RN and Azolla cover on the AV, NUE, and rice yield, especially in the highly fertilized rice-growing systems.
Methods
The experiment was conducted including eight treatments: the control (without N fertilizer and Azolla cover), Azolla cover without N fertilizer (A), farmer’s N application rate (FN), FN + Azolla cover (FNA), 15% RN from FN (RN15), RN15 + Azolla cover (RN15A). 30% RN from FN (RN30), RN30 + Azolla cover (RN30A). The integrated effects of N fertilizer reduction and Azolla cover on AV, NUE, and rice grain was evaluated.
Results
RN15A and RN30A substantially reduced total AV by 50.3 and 66.9% compared with FN, respectively, primarily due to the lower surface water ammonia concentrations and pH. RN improved the efficiency of Azolla cover on reducing AV, with 4.1–9.9% higher than for FN. Compared with the FN, RN15A and RN30A enhanced apparent N recovery efficiency (ANRE) by 46.5 and 39.1%, which might be responsible for the lower NH3 emission and the increased total N uptake / total chemical N applied. Furthermore, RN15A and RN30A reduced yield-scaled volatilization by 52.3 and 64.3% than for FN, respectively. Thus, combining 15–30% RN with Azolla cover may be a way to reduce AV and improve ANRE without decreasing rice grain yield.
Introduction
China is the largest user of synthetic nitrogen (N) in the world (FAO, 2019). In China, the annual N consumption was accounted for approximately 30% of the world’s total N use (Huang & Zou, 2020). The average amount of chemical N fertilizer used in rice production in China was 180 kg ha−1 (Peng, Tang & Zou, 2009; Chen et al., 2014). In Jiangsu Province of Taihu Region, the N application rate for rice production ranged from 270 to 330 kg ha−1, and the average amount of N application was 300 kg ha−1 (Peng et al., 2011; Yao et al., 2018a). The average apparent use efficiency and agronomic use efficiency of N fertilizer of rice were 39.0% and 12.7 kg kg−1, respectively (Yu & Shi, 2015). Excessive N fertilizer input with low N utilization efficiency (NUE) caused a large amount of N losses (Huang et al., 2016). Ammonia volatilization (AV) from paddy fields is a principal pathway of N loss (Zhang et al., 2014). Previous researchers estimated that 10–40% of chemical N fertilizer application lost via AV (Zhang et al., 2014; Sun et al., 2015; Feng et al., 2017). A large amount of AV caused many environmental problems such as air quality degradation (Wei et al., 2015), water eutrophication, soil acidification, and biodiversity loss (Liu et al., 2013; Ti et al., 2018). Thus, it is urgent to find efficient ways to reduce the AV from paddy fields.
To reduce the AV and increase the NUE of rice, many technical measures have been developed, such as applying enhanced efficiency fertilizers (slow / controlled-release fertilizers and urease inhibitors) (Linquist et al., 2013; Wang et al., 2018; Yang et al., 2019; Yang et al., 2020), using new types of biochar (Chu et al., 2020; Yu et al., 2020), and improving fertilization techniques (split applications of N fertilizer and N fertilizer deep placement) (Huang et al., 2016; Liu et al., 2015; Yao et al., 2018a). However, enhanced efficiency fertilizers and biochar are generally too expensive, and thereby, limiting their use in rice production. In addition, their effectiveness in migrating AV, and improving NUE and rice yield was influenced by many factors such as climate conditions, soil type, and agronomic measures (Linquist et al., 2013; Abalos et al., 2014; Silva et al., 2016; Sha et al., 2019). The improved fertilization techniques need more labor or knowledge required in N fertilizer management, and thus, they are not commonly adopted by farmers (Yao et al., 2018b; Huang & Zou, 2020).
Reducing the amount of N fertilizer of rice has been recommended as a feasible way to reduce AV, increase NUE, and maintain rice yield in a highly fertilized rice-growing system (Deng et al., 2012; Qiao et al., 2012; Guo et al., 2019). Yu, Xue & Yang (2015) reported that a 22–44% reduction of N fertilizer application led to a 20–35% AV reduction from paddy fields. A meta-analysis suggested that ≤25% reduction of N fertilizer application rate improved partial factor productivity of N fertilizer and rice yield by 25% and 6.3%, respectively, in a highly fertilized rice-growing system (Guo et al., 2019). However, continuous N fertilizer reduction led to a nutrient deficiency in the soil and therefore negatively impacted the NUE and rice yield (Guo et al., 2019).
Previous studies reported that N fertilizer reduction together with green manure was more efficient in improving NUE and stabling rice grain yield compared with N fertilizer reduction alone (Guo et al., 2019; Zhang et al., 2020). Azolla, a floating pteridophyte, is commonly grown as an intercrop with rice and used as a green manure after death (Kollah, Patra & Mohanty, 2015). It forms a mat that covers the surface water to reduce AV by preventing the escape of NH3. It could also absorb the NH4+ and decrease the temperature and pH of the surface water, thereby reducing AV (Yao et al., 2018c; Yang et al., 2020). As green manure, Azolla can enhance the properties of the soil and enhance the microbial population of the soil, thereby improving soil fertility and rice yield (Kollah, Patra & Mohanty, 2015; Subedi & Shrestha, 2015; Yao et al., 2018c).
Previous studies have suggested that the integrated use of N fertilizer reduction and Azolla cover markedly reduced AV and improved NUE compared with conventional N application rate (De Macale & Vlek, 2004; Kern & Vlek, 2007; Yao et al., 2018c). For most of the previous studies, the integrated effect of N fertilizer reduction and Azolla cover was investigated under the low quantity of N application (<160 kg N ha−1) (De Macale & Vlek, 2004; Kern & Vlek, 2007). There is rarely study on the interaction influence of N fertilizer reduction and Azolla cover on AV, NUE, and grain yield under the highly fertilized rice-growing systems. Previous studies observed that high concentrations of ammonium N (c(NH4+)) in the surface water depressed the growth and N absorption as well as N fixation of Azolla (Costa et al., 2009; Yao et al., 2018c). Whether combining N fertilizer reduction and Azolla cover further exhibits beneficial effects in decreasing the AV, and enhancing the NUE and rice yield in highly fertilized rice-cropping systems is needed to investigate and confirm.
Therefore, this study investigated the integrated influence of N fertilizer reduction and Azolla cover on c(NH4+), pH, and AV in the surface water. Also, we investigated their integrated impact on rice yield, total biomass, N uptake and utilization. The aims of our study were to (1) comprehensively investigate the influence of N fertilizer reduction and Azolla cover on AV, NUE, and rice grain yield; (2) determine a proper percentage of N fertilizer reduction aiming to achieve a balance between rice production and environmental impacts in the Azolla-covered paddy fields.
Materials and Methods
Experimental design
A pot experiment was carried out in Bai Ma Experimental Station (31°36′N, 119°11′E), located in Taihu Region, China. The length, width, and height of the pot used in this study was 25, 20, and 35 cm, respectively. The soil which was taken from a nearby paddy field was classified as Hydragric Anthrosolos. Table 1 shows the initial properties of the soil. The experiment involved four N fertilizer application rates and two Azolla treatments (eight treatments in total). The eight experimental treatments contained the control (without N fertilizer and Azolla cover), Azolla cover without N fertilizer (A), farmer’s N application rate (FN, 330 kg ha−1), FN + Azolla cover (FNA), 15% N reduction from FN (RN15), RN15 + Azolla cover (RN15A), 30% N reduction from FN (RN30), RN30 + Azolla cover (RN30A). The pot experiment was performed with four replicates.
| Soil properties | Organic matter (g kg−1) | Total nitrogen (N) (g kg−1) | Total phosphorus (P) (g kg−1) | Available N (mg N kg−1) | Available P (mg P205 kg−1) | Available potassium (mg K20 kg−1) |
|---|---|---|---|---|---|---|
| Values | 24.60 | 0.90 | 0.24 | 150.41 | 11.85 | 96.32 |
The experimental variety was Nanjing 9108, which was classified as a late-maturing medium japonica variety. This variety was suitable for growing in the central and southern regions of Jiangsu Province. The growth duration and grain yield of this variety were approximately 149–153 d and 9200–10000 kg ha−1 (Wang et al., 2013). The rice seedlings were transplanted into the plastic pots with a density of 2 hills per pot on June 28 in 2019. For each fertilized treatment, 40% of chemical N applied was broadcast on the surface water at basal fertilization period (the same date as transplanting). 20% of the chemical N applied was broadcast at tillering fertilization period (ten days after transplanting), and 40% of the chemical N applied was broadcast at panicle fertilization period (thirty-eight days after transplanting). The potash (K) fertilizer was potassium chloride (K2O = 60%) and phosphate (P) fertilizer was superphosphate (P2O5 = 16%). The amount of K fertilizer application was 112.5 kg K2O ha−1, and the amount of P fertilizer application was 67.5 kg P2O5 ha−1. 50% of the total K fertilizer applied was broadcast on the surface water at basal fertilization period, and the remaining 50% of total K fertilizer applied was broadcast at panicle fertilization period. All the P fertilizer was broadcast on the surface water at basal fertilization period. A shallow water layer (3–5 cm) was maintained in the pots before the grain-filling stage. During the grain-filling stage, alternating wetting and drying (AWD) were used. The pots were drained at 10 d before maturity. 200 g m−2 of fresh Azolla (Azolla filiculoides Lamarck) was applied into the pots one day before basal fertilizer application. The initial coverage of the surface water was approximately 20%. Azolla covered almost all the surface water 5–7 days after inoculation. The Azolla grew naturally on the surface water before the rice filling stage. Most of Azolla died off because of the AWD irrigation during the rice filling stage.
Sampling and measurements
Ammonia volatilization
The ventilation method was used to measure ammonia volatilization (AV) (Xu et al., 2012; Sun et al., 2019a). After soaking with phosphoglycerol, two sponges (diameter = 15 cm and thickness = two cm) were laid in a PVC pipe (diameter = 15 cm and height = 20 cm) to collect the NH3. The upper sponge was placed at the top of the PVC pipe, and the lower sponge was placed three cm below the upper sponge. After each N application, the PVC pipe with two sponges was inserted into the soil. The samples in the lower sponge were collected daily in the first three days after N application and then were collected every two days. The samples were continuously collected for 7–10 days. And then, the samples were extracted with 300 mL of 1.0 mol L−1 KCl solution into a bottle (500 mL) and shaken for 1 h at 25 °C. The AA III continuous flowing analytical system (Bran + Luebbe company, Germany) was used to determine the c(NH4+). The ammonia volatilization flux (AVF, kg N ha−1 d−1) and cumulative ammonia volatilization (CAV, kg N ha−1) were calculated as follows:
CAV = ∑AV F
M refers to the quantity of NH3 (mg) absorbed by the phosphoglycerol-soaked sponges. A refers to the cross-sectional area (m2) of the sponges. T refers to the sampling interval (d).
Surface water c (NH4+) and pH value
100 mL surface water was sampled from the pots to determine the c(NH4+) and pH simultaneously when the AV was measured. AA III continuous flowing analytical system was used to measure the c(NH4+) in the surface water. In addition, a portable pH meter was used to measure the surface water pH.
Yield-scaled NH3 emission and apparent N recovery efficiency (ANRE)
The yield-scaled NH3 emission and ANRE were calculated as follows:
where TAV is the total cumulative NH3 emission (g N kg−1 grain) during the whole growing season of rice. GY refers to the rice grain yield under different treatments. TNUN and TNUcontrol refer to the total N uptake of rice plants under the N treatments and the control at maturity, respectively. Na refers to the total chemical N fertilizer applied.
Plant sampling
After maturation, three pots of rice were destructively sampled for each treatment. The leaves, stems, and panicles of rice plants were separated and then were dried in an oven at 105 °C for 30 min and then at 80 °C. After weighing the dry matter of plant organs, the plant organs were crushed with a grinder. The samples were first digested with H2SO4 and H2O2, and then the N concentrations in these samples were determined using AA III continuous flowing analytical system. At maturity, three pots of rice were harvested to measure the grain yield (GY) and its components.
Statistical analysis
The statistical analysis was conducted by two-way analysis of variance (ANOVA) in SPSS 20.0. The combined influence of N fertilizer reduction and Azolla cover on the AV, GY, total biomass, straw yield, harvest index, TNU, and ANRE were tested with a general mixed linear model at p < 0.05. N fertilizer reduction and Azolla cover were treated as fixed effects and the replicate as a random effect. The LSD test was applied to determine the statistical differences between means under different treatments at p < 0.05. Simple correlation analysis was used to determine the correlation between AV and c(NH4+), pH of the surface water.
Results
Ammonia volatilization fluxes and cumulative ammonia volatilization
Figure 1 shows the dynamic variations of the ammonia volatilization fluxes (AVF) and NH4+-N concentrations (c(NH4+)) in the surface water after each urea application under different treatments. The maximum AVF was observed at 2–3 days after urea application, and it rapidly declined to a low level at 7 days after urea application (Fig. 1A). As expected, the peak values of AVF decreased with the decreasing N rates. The peak values of AVF after each urea application were 4.3–8.7 kg ha−1 d−1 under the FN treatment, 2.5–6.2 kg ha−1 d−1 under the RN15 treatment, and 1.7–3.6 kg ha−1 d−1 under the RN30 treatment. The Azolla cover resulted in a lower peak value of AVF. The decrease of the peak value of AVF ranged from 10.9–25.6% under the FNA to 12.5–33.2% under the RN15A, and to 24.9–38.0% under the RN30A. This indicated that the benefit of Azolla cover is more evident under N fertilizer reduction than for farmer’s N application rate. Combined N fertilizer reduction and Azolla cover substantially reduced the AVF. RN15A and RN30A reduced the AVF by 50.0–60.1% and 68.8–73.3% compared to the FN, respectively (Fig. 1A).
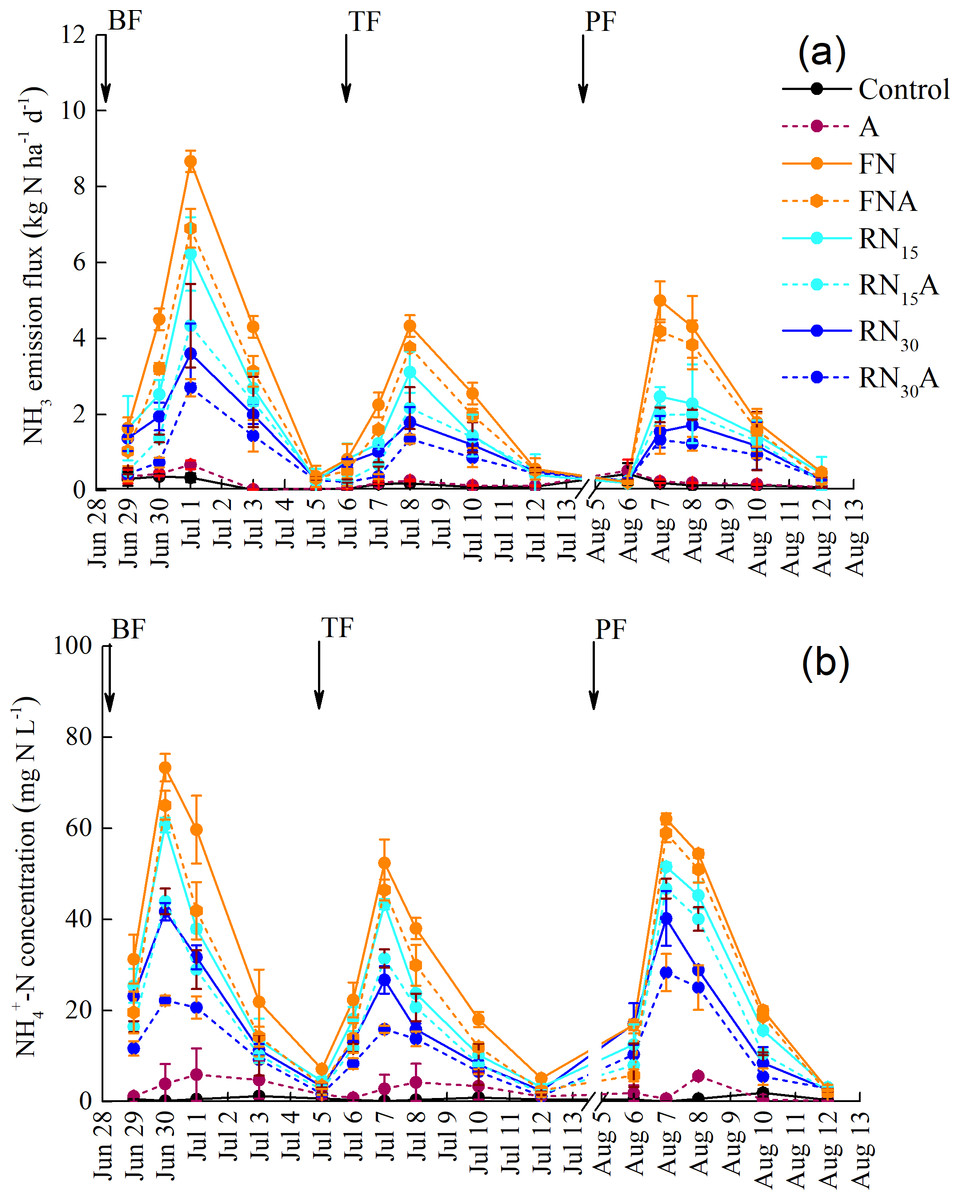
Figure 1: Dynamic variations of NH3 emission flux (A) and surface water NH-N concentration (B) under different treatments.
BF, basal fertilization period; TF, tillering fertilization period; PF, panicle fertilization period. Control, without N fertilizer and Azolla cover; A, Azolla cover without N fertilizer; FN, farmer’s N application rate; FNA, FN + Azolla cover; RN15, 15% N reduction from FN, RN15A; RN15 + Azolla cover; RN30, 30% N reduction from FN; RN30A, RN30 + Azolla cover. Vertical bars represent the standard deviations of mean (n = 3).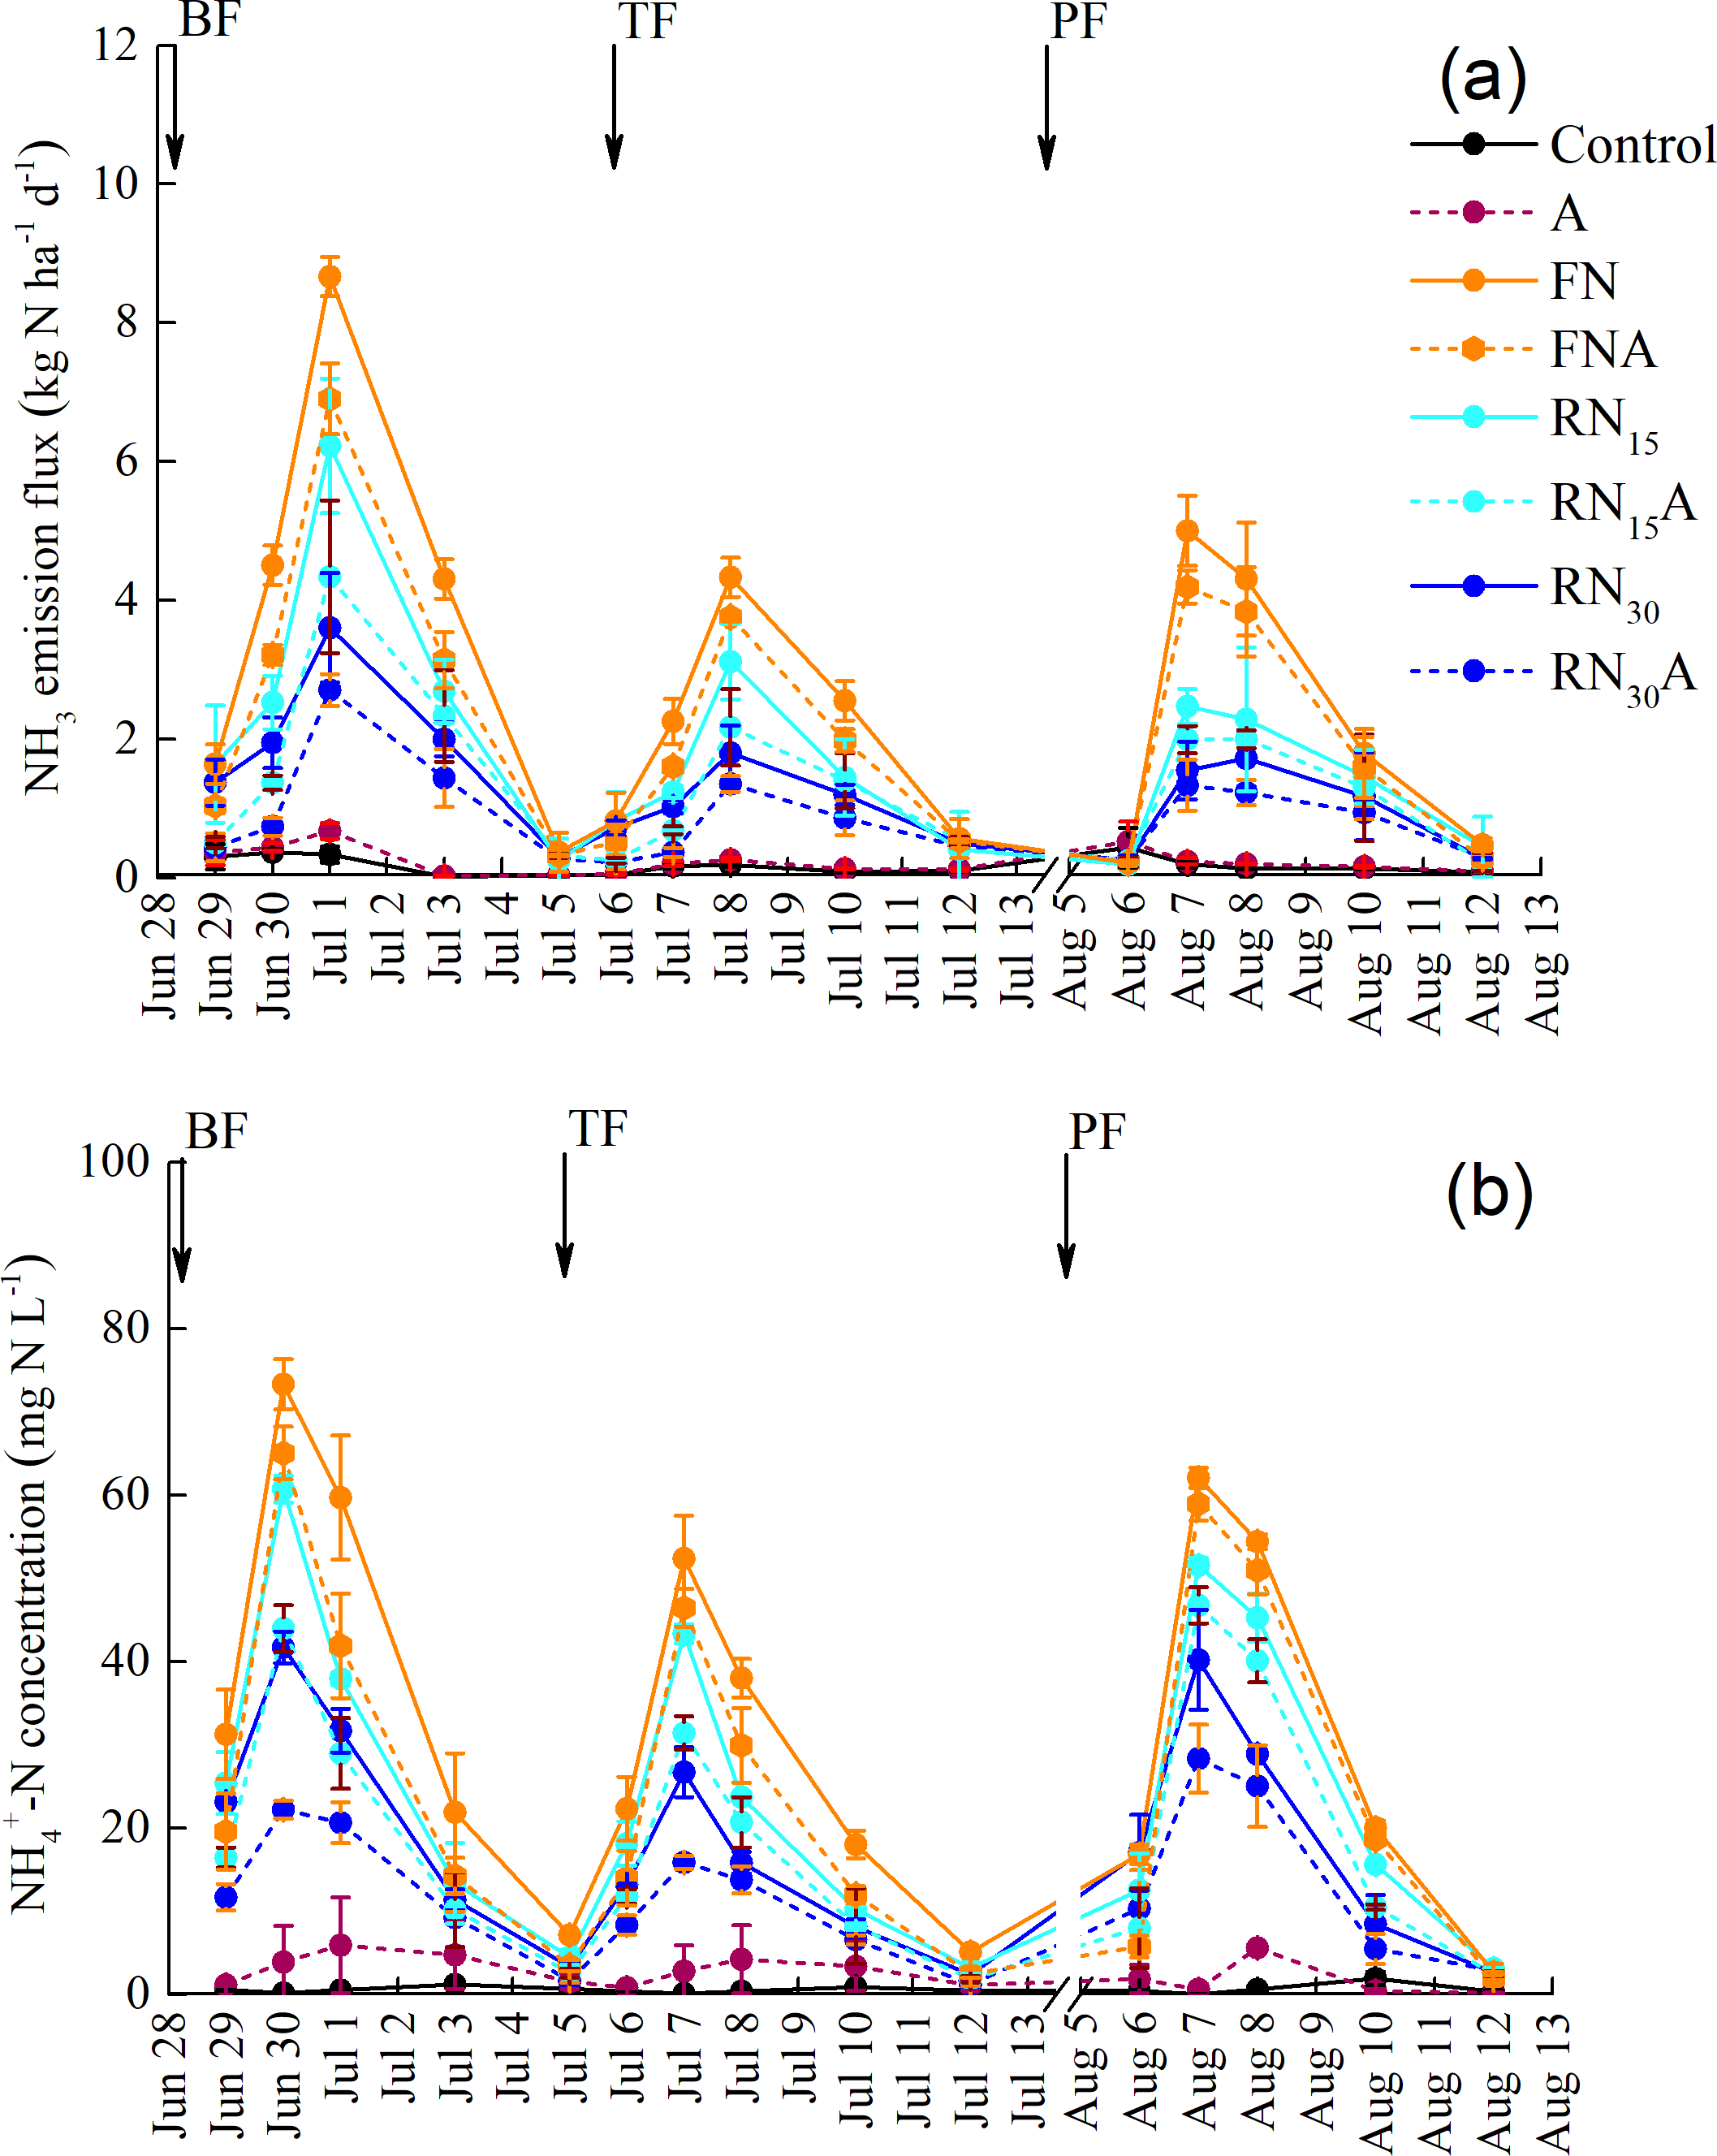
The cumulative NH3 volatilization (CAV) under the combined application of N fertilizer reduction and Azolla cover was presented in Table 2. The total cumulative NH3 volatilization (TAV) for N treatments was 17.7–51.9 kg N ha−1, accounting for 7.5–15.7% of the total N application rate (Na). The CAV during the basal fertilizer stage (BF) was higher than those of during tillering and panicle fertilizer stages (TF and PF). N fertilizer reduction significantly decreased the TAV (p < 0.05). The highest TAV was 51.93 kg N ha−1 for the FN and was account for 15.74% of the total urea N applied. The TAV significantly decreased to 34.48 kg N ha−1 for RN15 and 24.91 kg N ha−1 for RN30. Compared with uncovered treatment, Azolla cover significantly reduced the TAV, and the magnitude varied among the N application rates as detected by a significant N × Azolla interaction. Azolla cover reduced the TAV by 21.0% under the FN, by 25.1% under the RN15, and by 30.9% under the RN30. Combining N fertilizer reduction and Azolla cover significantly reduced the TAV. The TAV under RN15A and RN30A were 50.3% and 66.9% lower than that of the FN, respectively (Table 2).
| Treatment | Ammonia volatilization (kg N ha−1) | TAV / Na (%) | |||
|---|---|---|---|---|---|
| BF | TF | PF | Total | ||
| Control | 1.13 ± 0.04 e | 0.77 ± 0.03 f | 1.21 ± 0.07 f | 3.11 ± 0.06 f | – |
| A | 1.63 ± 0.14 e | 1.03 ± 0.10 f | 1.48 ± 0.15 f | 4.14 ± 0.23 f | – |
| FN | 24.19 ± 3.57 a | 13.66 ± 1.17 a | 14.09 ± 1.58 a | 51.93 ± 3.09 a | 15.74 |
| FNA | 18.08 ± 1.11 b | 10.93 ± 0.47 b | 12.00 ± 0.96 b | 41.01 ± 1.87 b | 12.43 |
| RN15 | 16.43 ± 2.33 b | 9.29 ± 1.27 c | 8.76 ± 0.50 c | 34.48 ± 3.88 c | 12.32 |
| RN15A | 11.54 ± 2.16 c | 6.99 ± 1.22 d | 7.30 ± 1.05 cd | 25.83 ± 4.26 d | 9.22 |
| RN30 | 11.53 ± 0.39 c | 6.94 ± 0.06 d | 6.44 ± 1.25 de | 24.91 ± 1.47 d | 10.83 |
| RN30A | 7.32 ± 1.19 d | 4.59 ± 0.64 e | 5.30 ± 0.60 e | 17.21 ± 1.74 e | 7.48 |
| Source of variance | Probability values | ||||
| Nitrogen | <0.001 | <0.001 | <0.001 | <0.001 | – |
| Azolla | <0.001 | <0.001 | 0.01 | <0.001 | – |
| Nitrogen ×Azolla | 0.005 | 0.019 | 0.193 | 0.005 | – |
Notes:
- BF
-
basal fertilization period
- TF
-
tillering fertilization period
- PF
-
panicle fertilization period
- Control
-
without N fertilizer and Azolla cover
- A
-
Azolla cover without N fertilizer
- FN
-
farmer’s N application rate
- FNA
-
FN + Azolla cover
- RN15
-
15% N reduction from FN;
- RN15A,
-
RN15 + Azolla cover
- RN30
-
30% N reduction from FN
- RN30A
-
RN30 + Azolla cover
TAV/Na indicates the ratio of total cumulative ammonia volatilization to the total N fertilizer applied.
In each column, different lowercase letters indicate statistically significant difference at the 0.05 level between different treatments.
Values represent mean ± standard deviation.
Surface water c(NH4+) and pH
In line with the AVF, the surface water c(NH4+) showed the same trend (Fig. 1B). The largest surface water c(NH4+) after each urea application ranged from 52.3 to 73.3 mg N L−1 under the FN, from 43.4 to 60.7 mg N L−1 under the RN15, and from 26.7 to 41.7 mg N L−1 under the RN30 (Fig. 1B). Compared with uncovered treatment, Azolla cover significantly decreased the c(NH4+) by 5.0–11.3% under the FN, by 9.3–27.6% under the RN15, and by 29.5–46.7% under the RN30 (Fig. 1B). This indicated that the efficiency of Azolla cover in decreasing c(NH4+) in surface water under N fertilizer reduction was higher than that of farmer’s N application rate. Combining N fertilizer reduction and Azolla cover decreased the surface water c(NH4+) substantially. Compared with the FN, RN15A and RN30A reduced the c(NH4+) in surface water by 24.7–40.0% and 54.4–70.0%, respectively (Fig. 1B).
Compared with the control, N treatment increased the surface water pH during the BF and TF. The average surface water pH was reduced by 0–0.1 units under the RN30 compared with the FN. The impact of RN15 on the pH of surface water was smaller compared with the FN. Compared with uncovered treatment, Azolla cover reduced the surface water pH, and the efficiency of Azolla on reducing surface water pH varied under different N application rates. Azolla cover decreased the surface water pH 0–0.1 units under the RN30, while the effects of Azolla cover under the RN15 and FN on surface water pH were relatively small. Moreover, compared with the FN, RN15A, and RN30A reduced the pH value of surface water 0–0.1 and 0.1–0.3 units, respectively (Table 3).
| Treatment | BF | TF | PF | |||||
|---|---|---|---|---|---|---|---|---|
| Range | Mean ± SD | Range | Mean ± SD | Range | Mean ± SD | |||
| Control | 7.34–8.10 | 7.75 ± 0.28 | 7.34–7.85 | 7.63 ± 0.19 | 7.52–8.10 | 7.86 ± 0.24 | ||
| A | 7.11–7.74 | 7.55 ± 0.20 | 7.11–7.71 | 7.55 ± 0.25 | 7.49–8.06 | 7.74 ± 0.22 | ||
| FN | 7.59–8.47 | 8.18 ± 0.35 | 7.79–8.47 | 8.11 ± 0.33 | 7.61–8.58 | 8.12 ± 0.44 | ||
| FNA | 8.03–8.32 | 8.13 ± 0.11 | 7.90–8.32 | 8.09 ± 0.16 | 7.71–8.58 | 8.09 ± 0.38 | ||
| RN15 | 7.91–8.45 | 8.15 ± 0.39 | 7.85–8.25 | 8.08 ± 0.25 | 7.47–8.45 | 7.95 ± 0.41 | ||
| RN15A | 7.97–8.33 | 8.13 ± 0.13 | 7.70–8.17 | 8.01 ± 0.15 | 7.31–8.33 | 7.99 ± 0.42 | ||
| RN30 | 7.73–8.51 | 8.12 ± 0.26 | 7.48–8.51 | 7.96 ± 0.36 | 7.78–8.27 | 8.01 ± 0.23 | ||
| RN30A | 7.73–8.44 | 8.01 ± 0.28 | 7.42–8.01 | 7.80 ± 0.15 | 7.60–8.62 | 8.04 ± 0.46 | ||
Notes:
- BF
-
basal fertilization period
- TF
-
tillering fertilization period
- PF
-
panicle fertilization period
- Control
-
without N fertilizer and Azolla cover
- A
-
Azolla cover without N fertilizer
- FN
-
farmer’s N application rate
- FNA
-
FN + Azolla cover
- RN15
-
15% N reduction from FN
- RN15A
-
RN15 + Azolla cover
- RN30
-
30% N reduction from FN
- RN30A
-
RN30 + Azolla cover
SD represents the standard deviation of mean (n = 5).
The relationships between AVF, c(NH4+), and pH in the surface water were well described with the exponential models (p < 0.001) (Fig. 2). At low c(NH4+) and pH of surface water, the AVF increased slowly as both parameters increased. However, at high c(NH4+) and pH in the surface water, the AVF increased sharply with the increase of two parameters (Fig. 2).
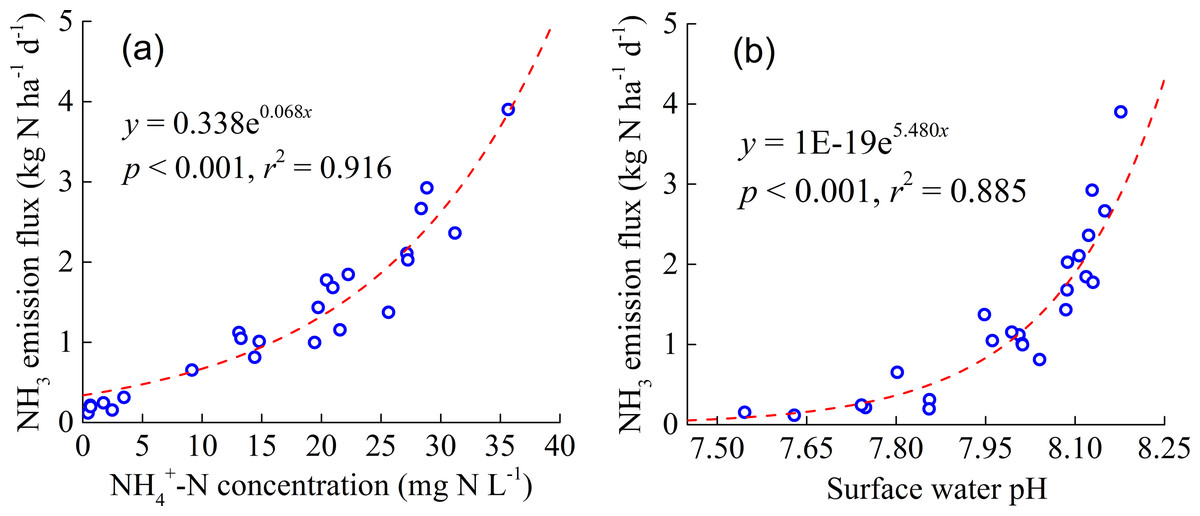
Figure 2: The relationship between ammonia (NH3) emission flux and surface water NH-N concentration (A) and surface water pH (B).
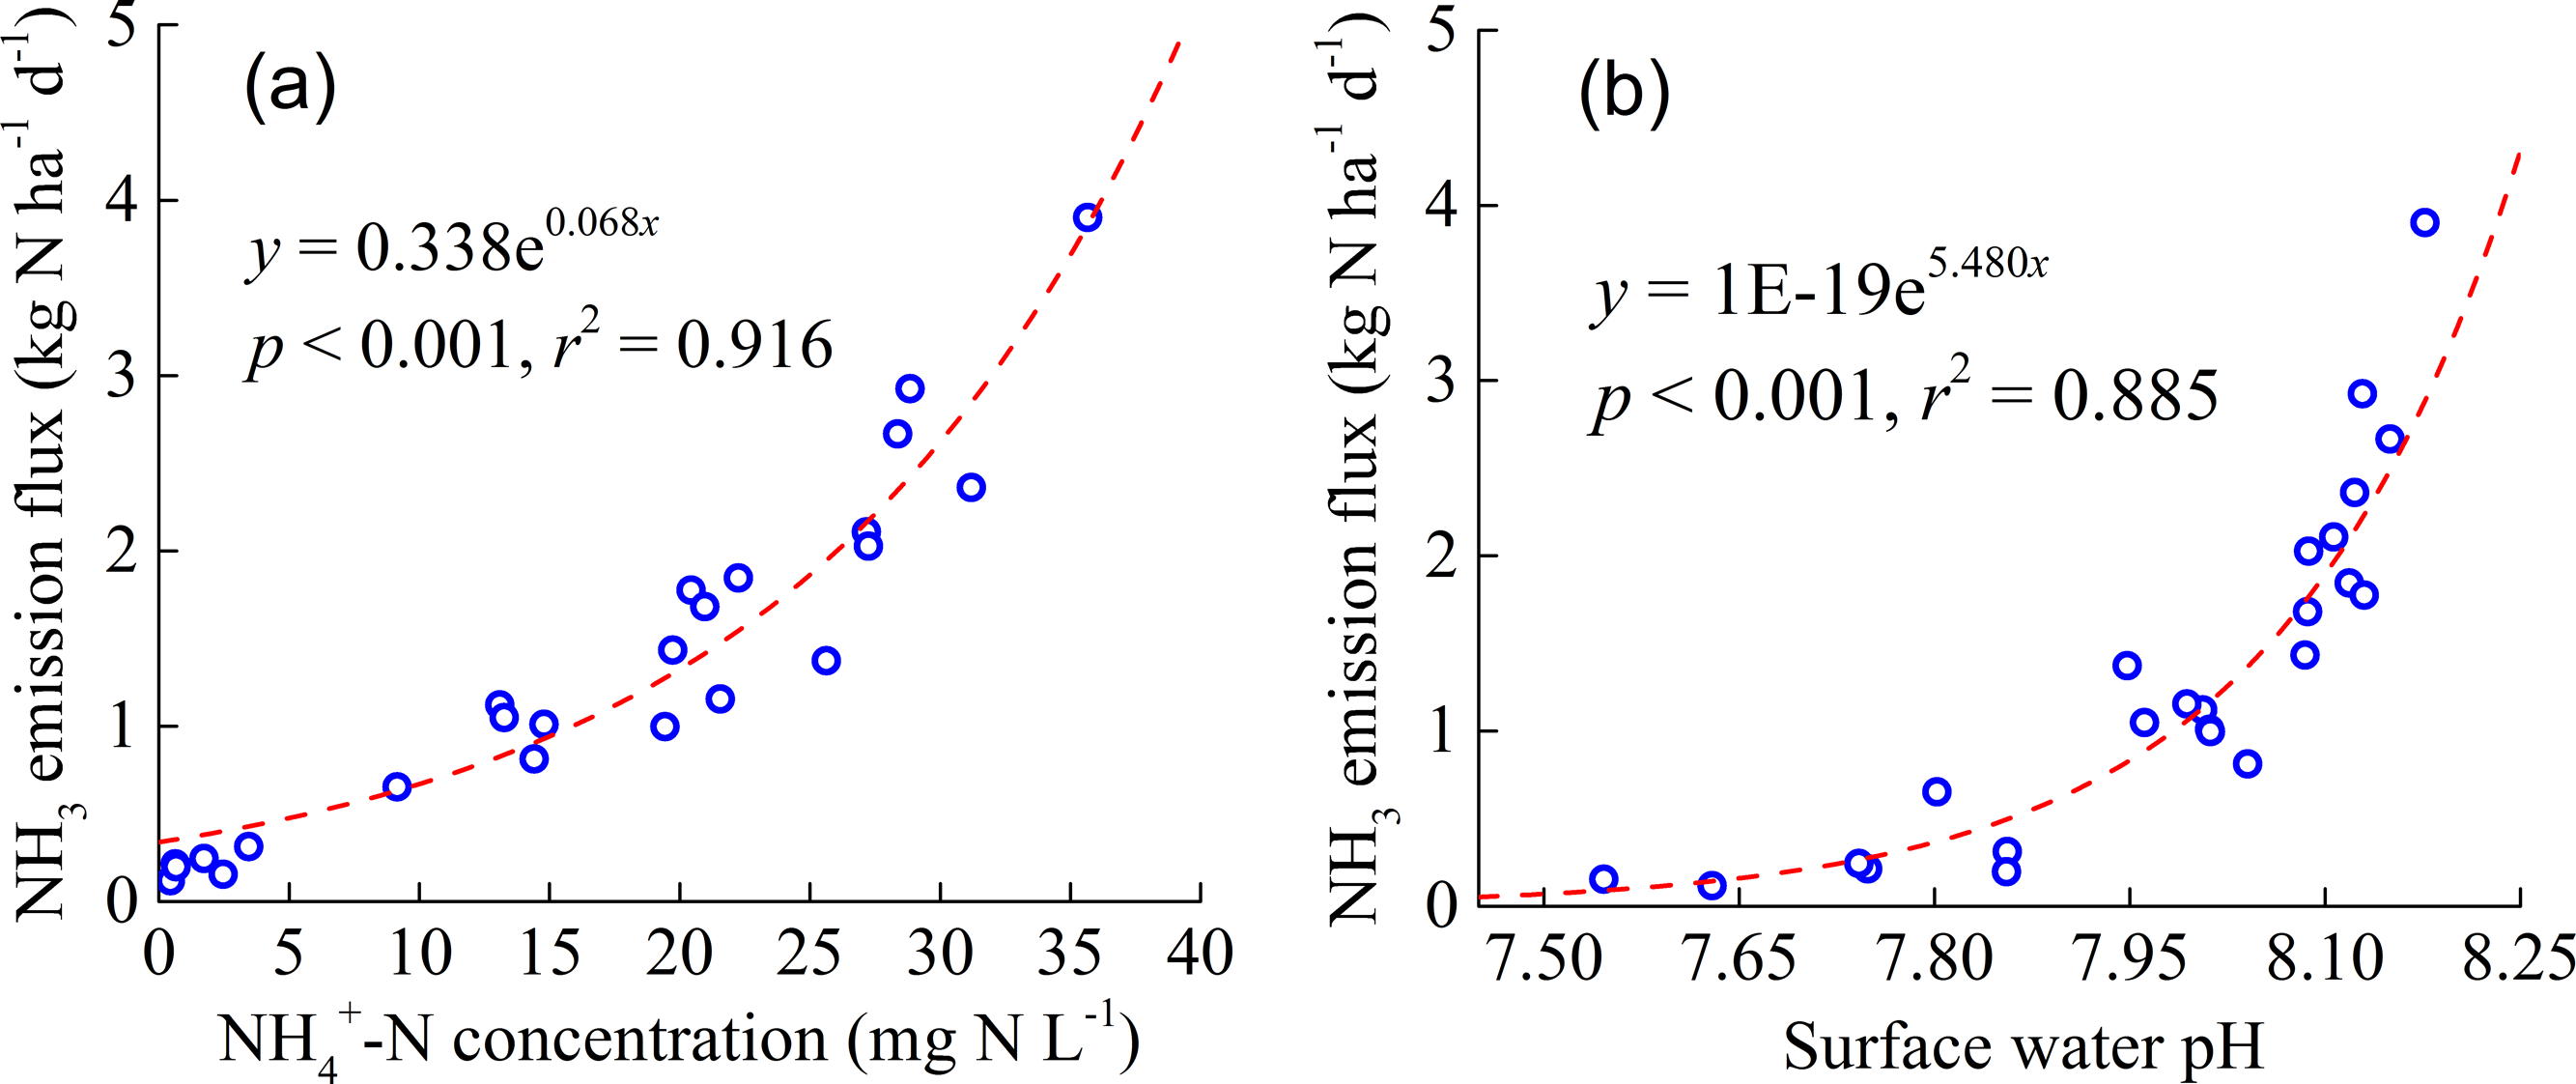
Rice yield, total biomass, straw yield, and harvest index
The impacts of N fertilizer reduction on the grain yield (GY) were significant (p < 0.05), whereas the effect of Azolla cover and the interaction effect of N fertilizer reduction and Azolla cover on GY were not significant (Table 4). The GY for the RN30 treatment was 70.04 g pot−1, and the GY significantly increased to 80.01 g pot−1 for RN15 treatment and 81.26 g pot−1 for FN treatment. Despite the absence of statistical differences, compared with uncovered treatment, Azolla cover increased the GY by 2.9% under the FN, by 6.3% under the RN15, and by 7.7% under the RN30, respectively. It demonstrated that the positive effect of Azolla cover on the GY was pronounced under N fertilizer reduction than under farmer’s N application rate. In addition, we observed that rice yield for RN30A was comparable to for the FN, and a higher rice yield was obtained for RN15A than for FN (Table 4).
| Treatment | Grain yield (g pot−1) | Total biomass (g pot−1) | Straw yield (g pot−1) | Harvest index |
|---|---|---|---|---|
| Control | 56.81 ± 2.86 d | 95.91 ± 7.26 d | 39.10 ± 8.90 d | 0.60 ± 0.06 a |
| A | 62.65 ± 5.46 d | 104.64 ± 12.10 d | 41.99 ± 7.41 cd | 0.59 ± 0.01 ab |
| FN | 81.26 ± 6.85 ab | 165.53 ± 10.16 ab | 84.28 ± 8.56 ab | 0.49 ± 0.04 c |
| FNA | 83.63 ± 5.17 a | 178.32 ± 9.87 a | 94.68 ± 6.51 a | 0.47 ± 0.08 c |
| RN15 | 80.10 ± 5.12 ab | 157.40 ± 3.97 b | 77.30 ± 9.09 b | 0.52 ± 0.10 bc |
| RN15A | 85.17 ± 7.37 a | 175.58 ± 6.07 a | 90.41 ± 6.64 ab | 0.49 ± 0.08 c |
| RN30 | 70.04 ± 6.85 c | 124.03 ± 10.58 c | 53.99 ± 7.58 c | 0.57 ± 0.07 ab |
| RN30A | 75.42 ± 5.04 bc | 157.89 ± 7.85 b | 82.47 ± 7.35 ab | 0.48 ± 0.05 c |
| Source of variance | Probability values | |||
| Nitrogen | <0.001 | <0.001 | <0.001 | 0.002 |
| Azolla | 0.05 | <0.001 | 0.001 | 0.051 |
| Nitrogen × Azolla | 0.97 | 0.11 | 0.07 | 0.33 |
Notes:
- Control
-
without N fertilizer and Azolla cover
- A
-
Azolla cover without N fertilizer
- FN
-
farmer’s N application rate
- FNA
-
FN + Azolla cover
- RN15
-
15% N reduction from FN
- RN15A
-
RN15 + Azolla cover
- RN30
-
30% N reduction from FN
- RN30A
-
RN30 + Azolla cover
In each column, different lowercase letters indicate statistically significant difference at the 0.05 level between different treatments.
Values represent mean standard deviation (n = 3).
The effects of N fertilizer reduction on total biomass (TB), straw yield (SY), and harvest index (HI) were significant (p < 0.05) (Table 4). The TB and SY decreased with the decreasing N fertilizer application rate. However, the HI increased with the decreasing N fertilizer application rate. The Azolla cover had a significant effect on the TB and SY, but it had no significant effect on the HI. There was no significant difference in TB, SY, and HI between RN15A, RN30A, and FN (Table 4).
N absorption and use efficiency
Figure 3 shows the integrated effect of N fertilizer reduction and Azolla cover on the total N uptake / total chemical N applied (TNU / Na) and apparent N recovery efficiency (ANRE). The influence of N fertilizer reduction and Azolla cover on the TNU / Na and ANRE was significant (p <0.05), but their interaction effect on the TNU / Na and ANRE was not significant. The ANRE under different N treatment were in the order of RN15 >RN30 >FN. This indicated that an appropriate N fertilizer reduction could obtain a higher ANRE. The combined application of N fertilizer reduction and Azolla cover led to the higher TNU / Na and ANRE than N fertilizer reduction alone. However, the magnitude of increase in TNU / Na and ANRE by applying Azolla cover varied under different N application rates. Compared with N fertilizer reduction, Azoll a cover increased TNU / Na and ANRE by 10.1 and 19.9% for FNA, by 10.6% and 20.6% for RN15A, and by 11.5 and 25.9% for RN30A, respectively. Moreover, compared with the FN treatment, RN15A and RN30A significantly increased ANRE by 46.5 and 39.1%, respectively (Fig. 3). The correlation analysis showed that ANRE was negatively correlated with TAV / Na (r2 = 0.72) and was positively correlated with TNU / Na (r2 = 0.64). Thus, the higher ANRE might be attributed to the reduced TAV / Na and the enhanced TNU / Na.
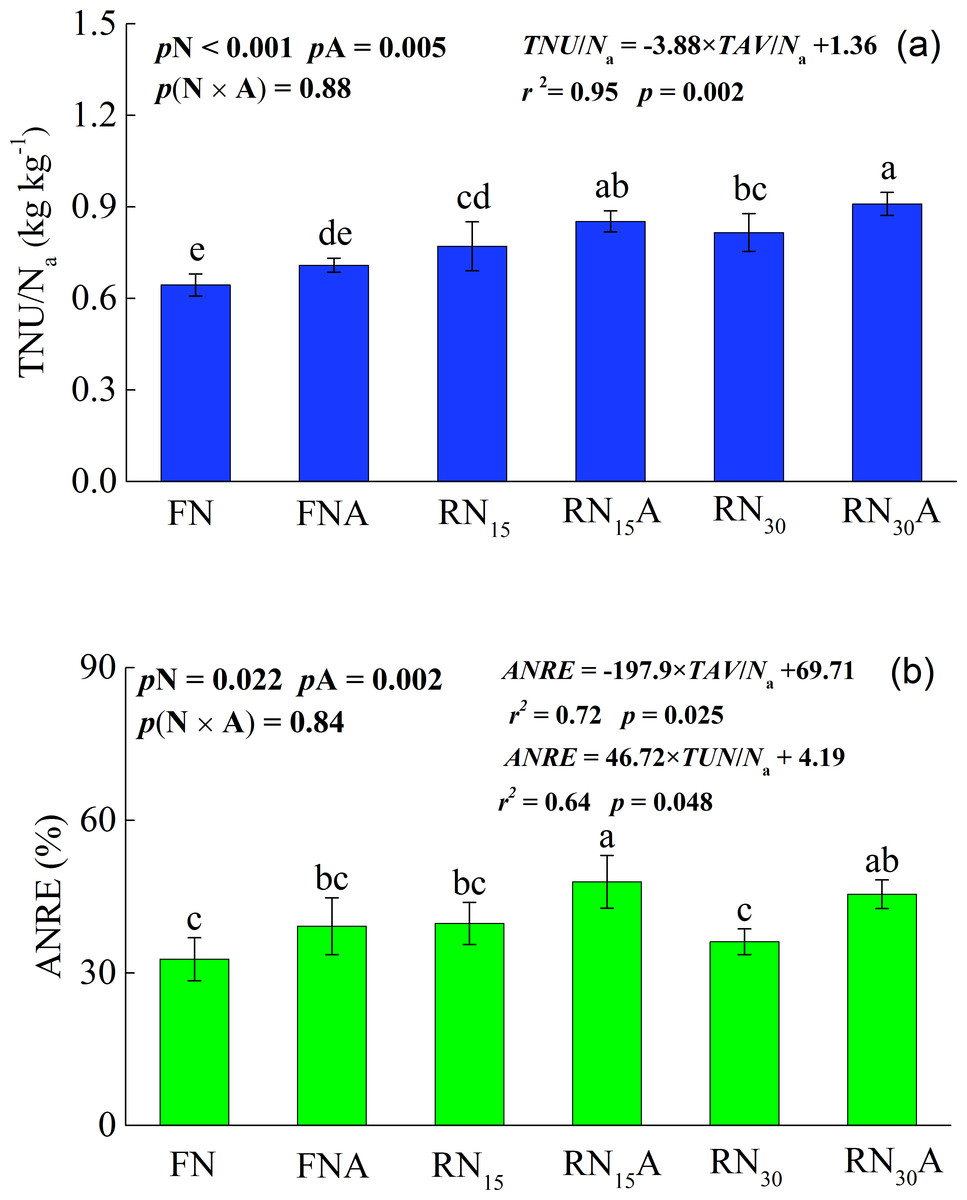
Figure 3: The total nitrogen uptake/total chemical N applied (TNU/Na) (A) and apparent nitrogen recovery efficiency (ANRE) (B) under different treatments.
Control, without N fertilizer and Azolla cover; A, Azolla cover without N fertilizer; FN, farmer’s N application rate; FNA, FN + Azolla cover; RN15, 15% N reduction from FN; RN15A, RN15 + Azolla cover; RN30, 30% N reduction from FN; RN30A, RN30 + Azolla cover. pN, pA, and p (N × A) represent the probability values of the effect of nitrogen fertilizer treatment, Azolla treatment and their interaction. TAV/Na indicates the ratio of total cumulative ammonia volatilization to the total N fertilizer applied. Vertical bars represent the standard deviations of the mean (n = 3).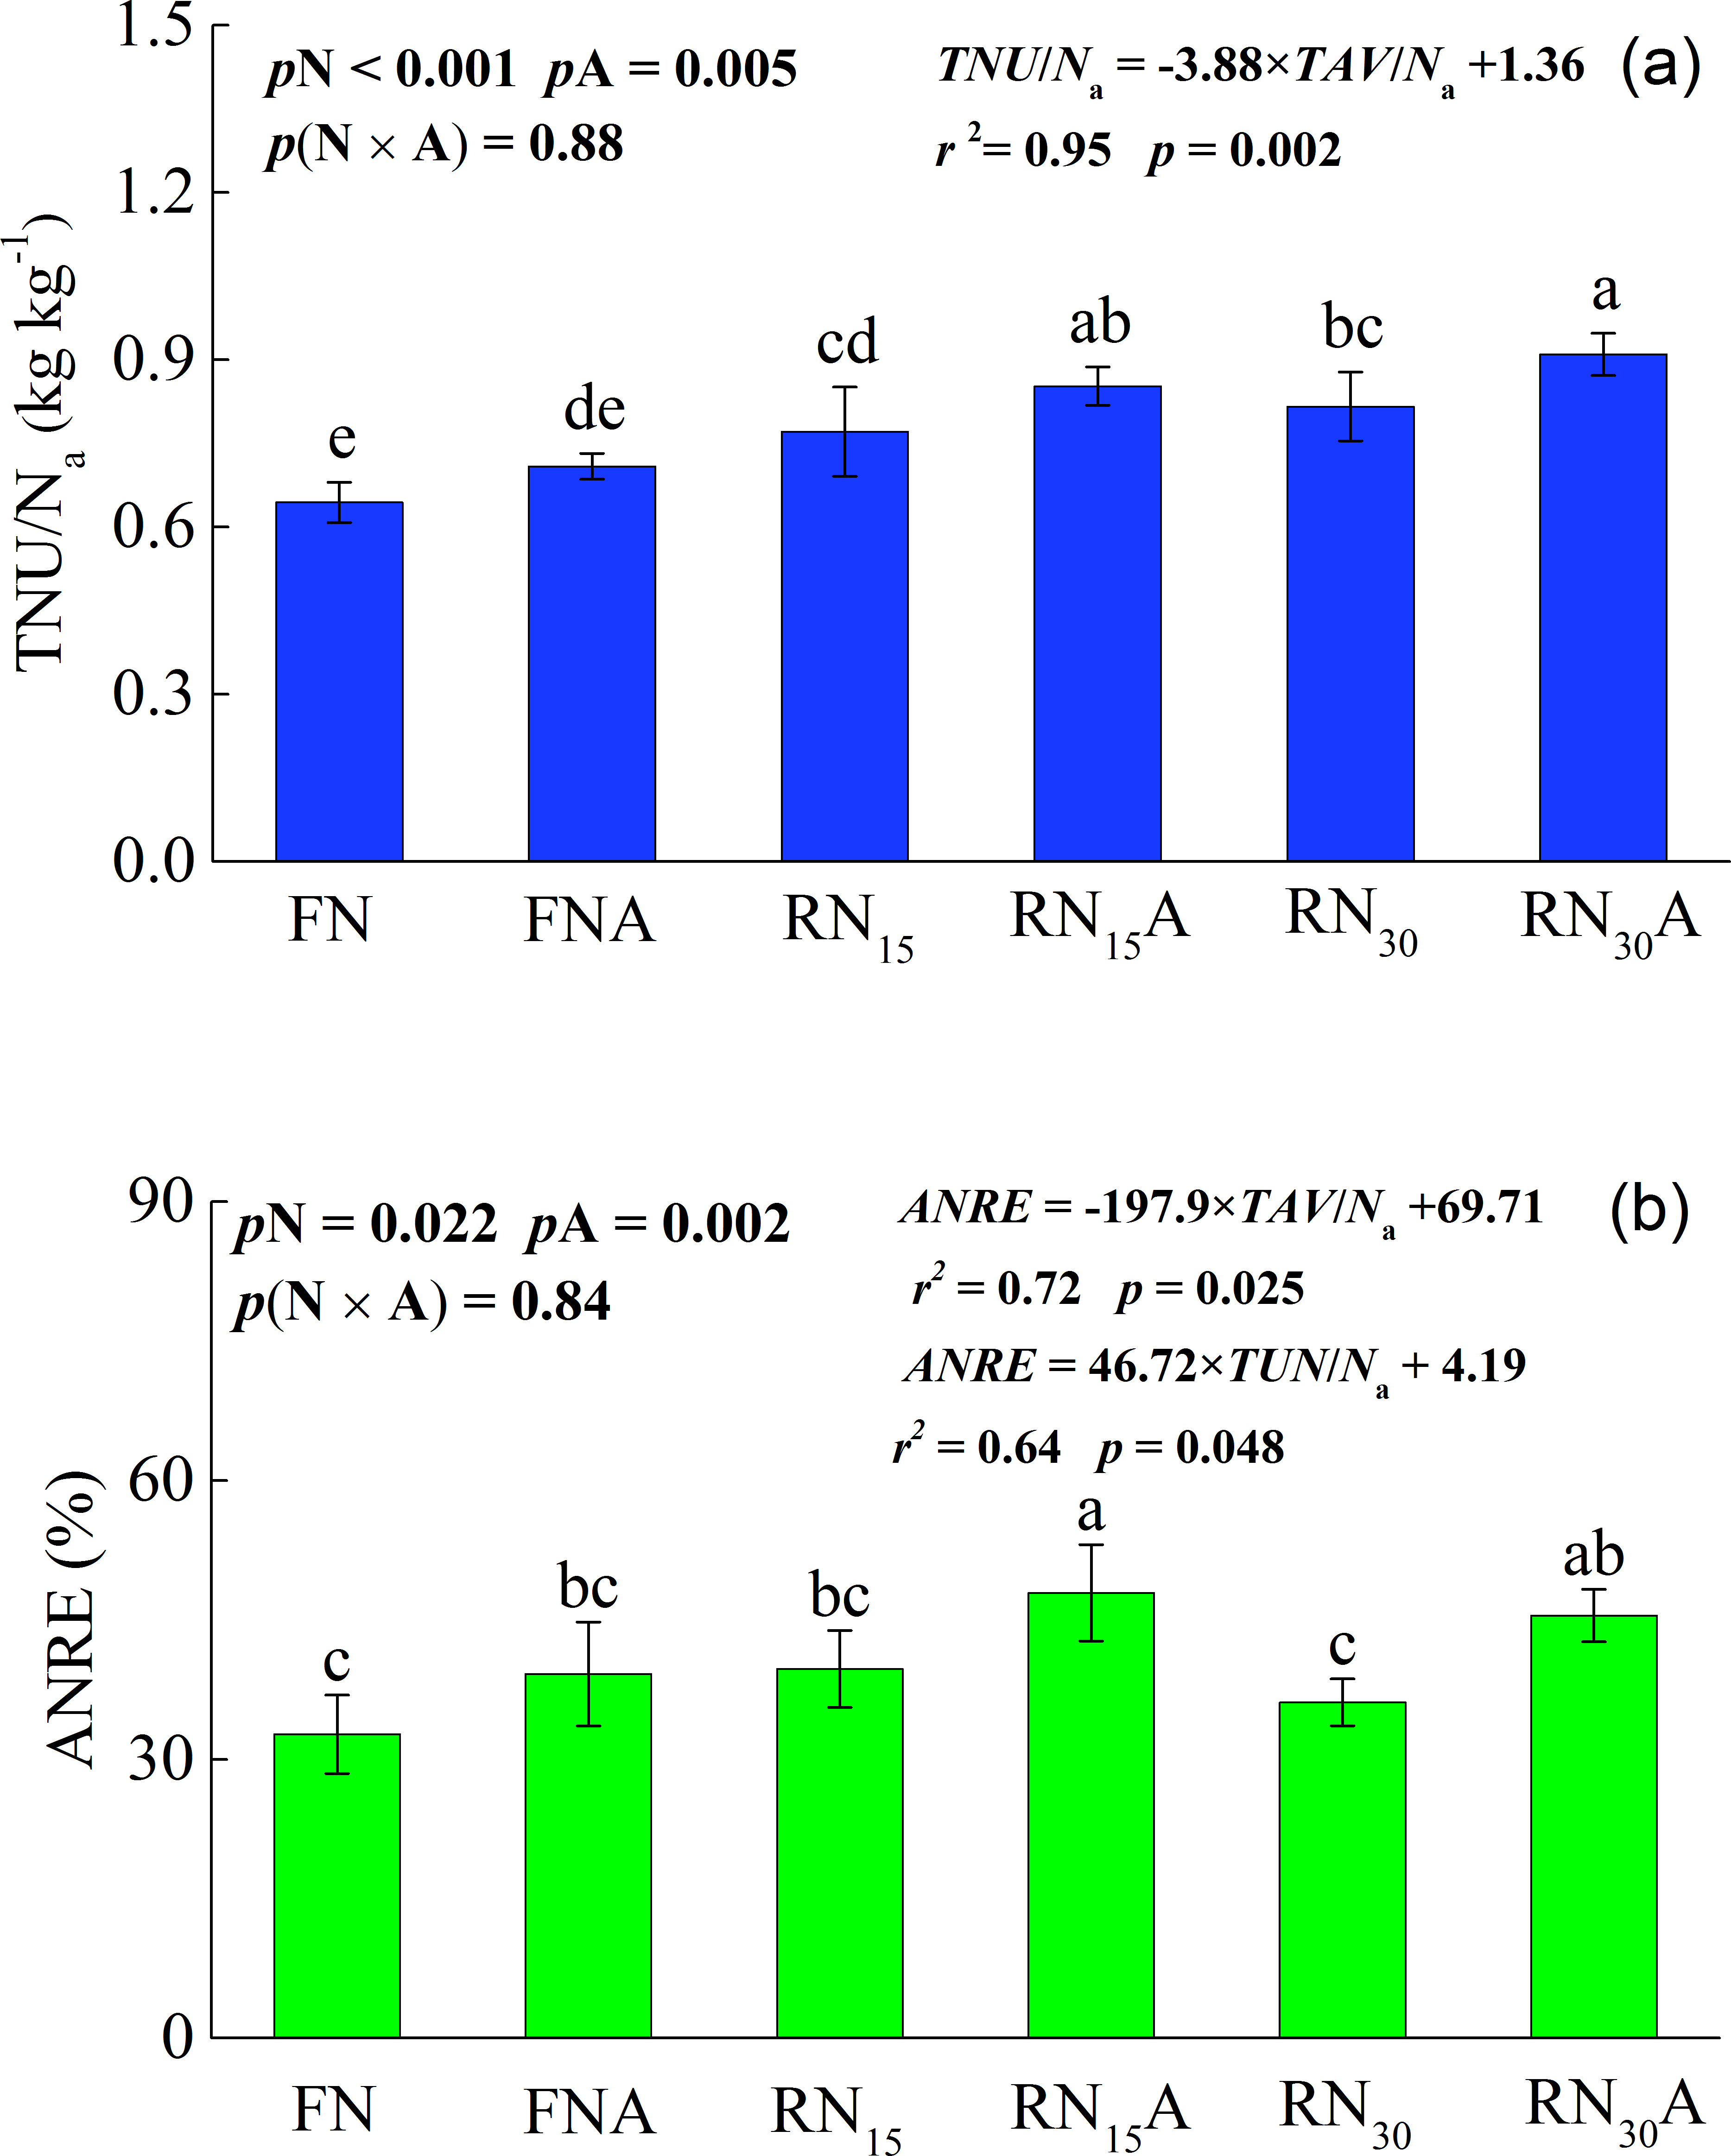
Yield-scaled NH3 volatilization
Figure 4 shows the yield-scaled ammonia volatilization under different treatments. The effect of N fertilizer reduction and Azolla cover treatments on yield-scaled ammonia volatilization was significant (p < 0.05). However, their interaction effect on yield-scaled NH 3 volatilization was not significant. The yield-scaled NH 3 volatilization was 1.78 g N kg−1 grain for RN15, and 2.15 g N kg−1 grain for RN 30. It substantially increased to 3.22 g N kg−1 grain for FN, which was the highest AV-producing treatment. Azolla cover significantly reduced yield-scaled NH 3 volatilization by 23.6–35.3%, and the magnitude of yield-scaled NH3 volatilization reduction was higher for the RN15A and RN30A than for the FNA. The combined application of N fertilizer reduction and Azolla cover significantly decreased yield-scaled NH 3 volatilization. RN15A and RN30A reduced yield-scaled NH3 volatilization by 52.3 and 64.3% compared with the FN, respectively.
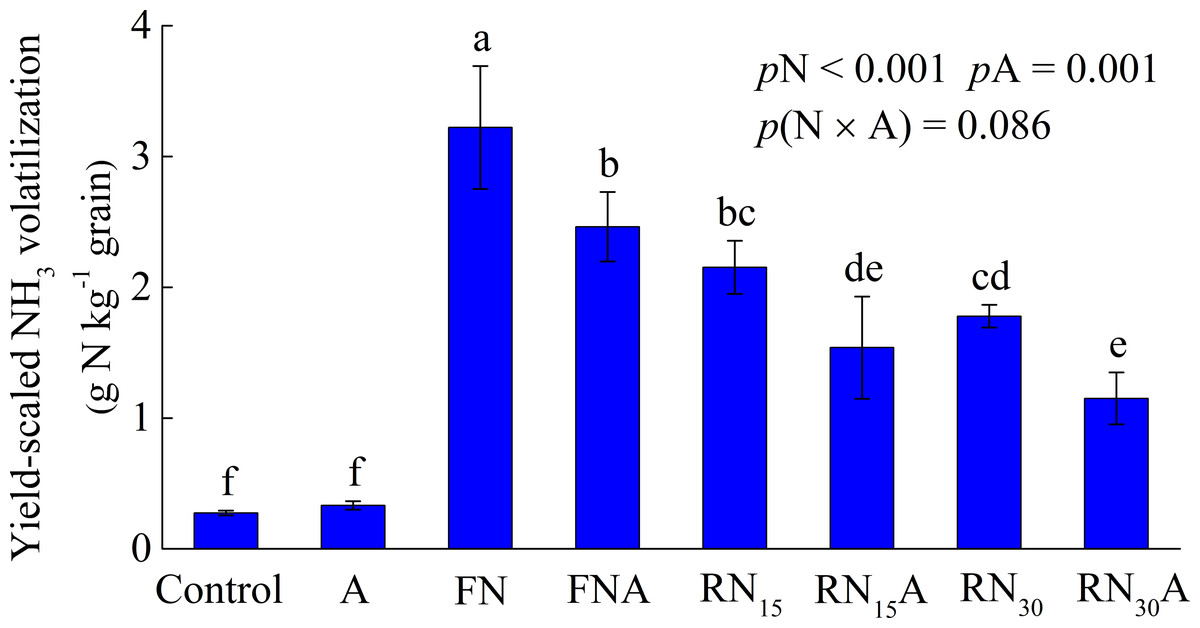
Figure 4: The yield-scaled NH3 volatilization under different treatments.
Control, without N fertilizer and Azolla cover; A, Azolla cover without N fertilizer; FN, farmer’s N application rate; FNA, FN + Azolla cover; RN15, 15% N reduction from FN; RN15A, RN15 + Azolla cover; RN30, 30% N reduction from FN; RN30A, RN30 + Azolla cover. pN, pA, and p (N × A) represent the probability values of the effect of nitrogen fertilizer treatment, Azolla treatment and their interaction. Vertical bars represent the standard deviations of the mean (n = 3).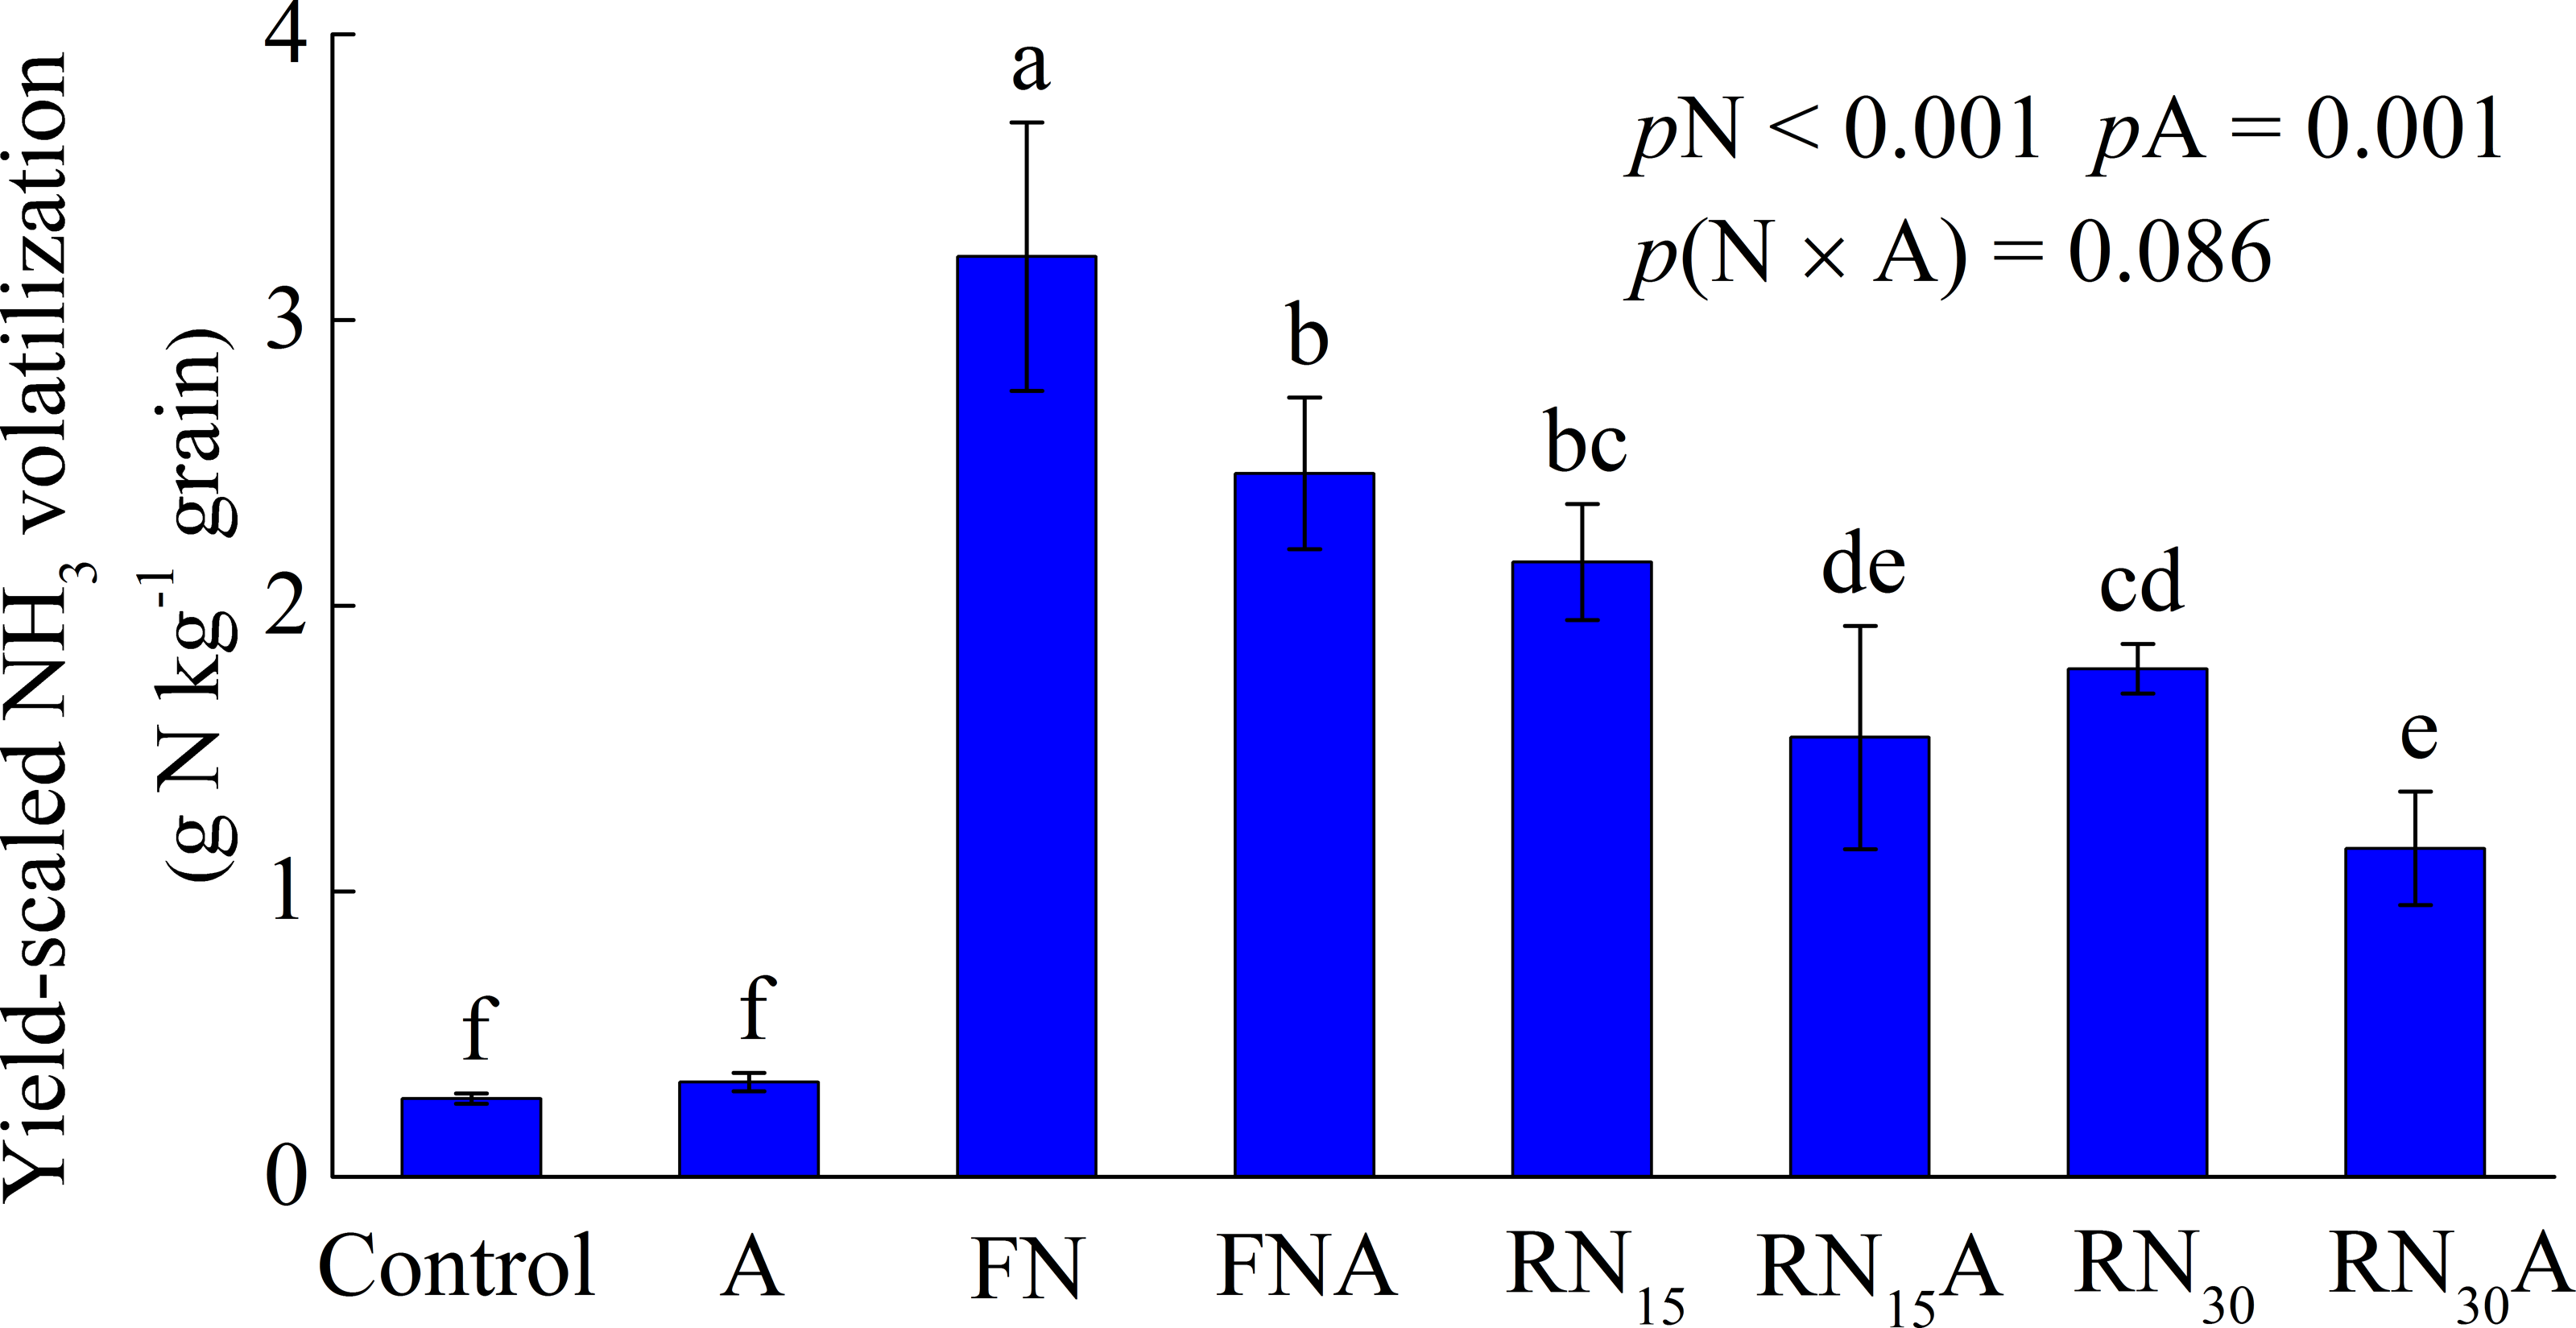
Discussion
Combined effect of N fertilizer reduction and Azolla cover on NH3 emission
In this study, the TAV under different treatments was responsible for 7.5–15.7% of the total N applied (Table 2). Similar results were observed by other previous studies (Cao et al., 2013; Feng et al., 2017; Sun et al., 2019b). Reducing N application was one of the primary strategies to achieve lower NH3 loss. The NH3 loss decreased with the reduced N application rates (Chen et al., 2015; Huang et al., 2016; Shi et al., 2020). The TAV was 51.93 kg N ha−1 for FN, and it significantly decreased by 34.48 kg N ha−1 for RN15 and by 24.91 kg N ha−1 for RN30 (Table 2).
Azolla cover can mitigate NH3 emission by acting as a mat to hinder the escape of NH3 and reduce the light intensity in the floodwater. Thus, it could depress the rise in pH caused by algal photosynthesis and decrease the temperature in the floodwater. In addition, Azolla cover reduced the NH3 loss by assimilating NH4+-N in the floodwater (Yao et al., 2018c; Yang et al., 2020). Azolla cover substantially reduced the TAV by 21.0 −30.9% under the N application rate (Table 2). Moreover, the efficiency of Azolla cover in controlling NH3 emission differed among the N application rates. The efficiency of Azolla cover in controlling NH3 emission increased with the decreasing N application rate (Table 2). Previous studies reported that the influence of Azolla cover on decreasing NH3 emission under low N application rates had a higher effectiveness than for high N rates (Kern & Vlek, 2007; Yao et al., 2018c). High c(NH4+) in the surface water depressed the growth and N absorption of Azolla, negatively impacting the efficiency in reducing NH3 loss (Cissé & Vlek, 2003; Kern & Vlek, 2007; Yao et al., 2018c). Costa et al. (2009) reported that 40 mg L−1 c(NH4+) led to an 18 and 46% inhibition of growth and N fixation of Azolla, respectively. In this study, the peak value of c(NH4+) in surface water after each urea application was 26.7–41.7 kg N ha−1 for low N rate, but they increased to as high as 43.4–60.7 kg N ha−1 for moderate N rate, and 52.4–73.3 kg N ha−1 for high N rate (Fig. 1B). This is the main reason that Azolla cover is more effective in reducing NH3 loss under the low N rate than for the high N rate.
In addition, a high N rate promoted the growth of algae plants. The algae bloom consumed a large amount of dissolved CO2 in surface water and led to an increase in surface water pH (Yao et al., 2017), resulting in an increase of NH3 emission. Light intensity on surface water is one of the principal environmental factors determining Azolla growth (Sadeghi et al., 2013; Pouil et al., 2020). A high N application rate produced a higher leaf area index of rice, causing more shading to the Azolla plants than for a low N application rate (Singh & Singh, 1988). The enhanced shading significantly suppressed the biomass and the N fixation of Azolla (Sadeghi et al., 2013), which might negatively influence the efficiency in reducing NH3 emission.
The integrated application of N fertilizer reduction Azolla cover could more effectively decrease the TAV compared with single N fertilizer reduction. In the present, the combined application of N fertilizer reduction and Azolla cover not only led to 50.3–66.9% lower TAV than for the FN treatment but also led to 25.1–30.9% lower TAV than for the N reduction alone (Table 2). The lower TAV under the combined application of N fertilizer reduction and Azolla cover was mainly ascribed to the lower surface water c(NH4+) and pH (Fig. 2). In our study, the combined application of N fertilizer reduction and Azolla cover decreased the c(NH4+) by 24.7–70.0% (Fig. 1) and pH 0.1–0.3 units in the surface water (Table 3). The lower surface water c(NH4+) was ascribed to the lower N application rate and the absorption of NH4+ by Azolla (Yang et al., 2020). The N fertilizer reduction decreased the pH of surface water (Silva et al., 2016). Moreover, Azolla cover reduced the incoming light, and therefore depressing the photosynthesis of algae. Thus, it decreased the CO2 consumption by algae in the surface water, resulting in a decrease in pH (Liu et al., 2017).
Combined effects of N fertilizer reduction and Azolla cover on grain yield
Our results showed that the rice yield under the FN treatment was slightly higher than that of the RN15, but was significantly higher than for the RN30 treatment (Table 4). This indicated a 15% N fertilizer reduction from the FN treatment could maintain rice grain yield compared with the FN treatment. However, a 30% N fertilizer reduction from the FN treatment resulted in a substantial decrease in rice grain yield.
Combined proper N fertilizer reduction and Azolla cover could maintain grain yield of rice compared with conventional N fertilizer application (De Macale & Vlek, 2004; Kern & Vlek, 2007; Malyan et al., 2019). Guo et al. (2019) suggested that the rice yield could be improved by reducing N application when controlling the reduction of N fertilizer within 31% and combined with optimizing management. Malyan et al. (2019) reported that combined application of Azolla and 30% N fertilizer reduction from recommended N fertilizer led to a comparable yield with the recommended N fertilizer (120 kg N ha−1). We observed that the combined application of a 15–30% N fertilizer reduction from the FN treatment with Azolla cover produced comparable or higher rice grain yield than FN treatment (Table 4). This indicated that N fertilizer application rate could be reduced by 50–100 kg N ha−1 in Azolla-covered paddy field without significantly decreasing the grain yield. Previous study reported that 50% of the applied chemical N fertilizer was absorbed by Azolla during early stage, leading to the decrease of NH3 emission (Kollah, Patra & Mohanty, 2015). The N absorbed by Azolla during early stage had little impact on the growth of rice due to the lower N demand for rice seedlings (Li et al., 2018). In addition, Azolla could fix approximately 44–56 kg N ha−1 during the whole growing season (Yao et al., 2018c). Duo to the Azolla death and decomposition during mid-growing stage, Azolla-N was released and a considerable quantity of available N was absorbed by rice, and therefore, promoting the dry matter accumulation and grain yield increase (Yao et al., 2018c). Thus, there was no significant decrease in grain yield even when the N fertilizer was reduced by 100 kg N ha−1 in our study.
The continuous single N fertilizer reduction might result in a nutrient deficiency in the soil, and therefore increasing the risk of reduction in N use efficiency and yield (Guo et al., 2019). Azolla can increase the nutrient of soil, enhance the properties of the soil, and increase the microbial population of the soil (Kollah, Patra & Mohanty, 2015; Subedi & Shrestha, 2015; Teimour et al., 2018). Thus, combining N fertilizer reduction and Azolla cover might stable rice grain yield in the long term (Xue, Yu & Yang, 2014; Guo et al., 2019; Zhang et al., 2020).
The positive effect of Azolla cover on rice grain yield was more significant under the RN30 than under the RN 15 and FN treatments. This result can be explained by the fact that N becomes the limiting factor in crop yield under low N rates. The N saved from NH3 loss duo to Azolla cover under low N rate greatly influenced rice grain yield (Silva et al., 2016). On the contrary, under the moderate and high N rates, the N level of the soil is relatively high, and conserving N by decreasing NH 3 loss may not effectively be used to improve grain yield of rice (Li et al., 2015).
Combined effects of N fertilizer reduction and Azolla cover on N absorption and use efficiency
Appropriate N fertilizer reduction improved grain yield and N absorption of rice, and therefore resulted in increased NUE (Guo et al., 2019). RN15 improved the ANRE compared with the FN treatment. However, RN30 slightly increased the ANRE than for the FN treatment (Fig. 3B). Similarly, Liu et al. (2016) suggested that 10% N fertilizer reduction from farmer’s N application rate could increase the ANRE. However, a 20–30% N fertilizer reduction from farmer’s N application rate decreased ANRE (Liu et al., 2016). In this study, RN30A significantly increased ANRE compared with the FN treatment (Fig. 3B). The combined application of 30% N fertilizer reduction and Azolla cover significantly decreased NH3 loss (Table 2) and enhanced N uptake of rice plants (Fig. 3A), therefore increasing the ANRE. In addition, the magnitude of increase in ANRE duo to Azolla cover was higher under N fertilizer reduction than that of farmer’s N fertilizer application rate (Fig. 3B). This might be attributed to the higher efficiency in reducing NH3 losses under the N fertilizer reduction than for farmer’s N fertilizer application rate (Table 2). The higher reduction in ammonia loss under a low N rate supplied a relatively larger quantity of N for rice than a high N rate, and therefore produced a higher N use efficiency (Yang et al., 2020; Yao et al., 2018c).
Conclusion
This study assessed the integrated influences of nitrogen fertilizer reduction and Azolla cover on NH3 loss, nitrogen use efficiency, and rice yield. Our results showed that a 15–30% nitrogen fertilizer reduction with Azolla cover could significantly reduce NH3 emission and enhance apparent nitrogen recovery efficiency (ANRE) without decreasing rice yield. Combining nitrogen fertilizer reduction with Azolla cover decreased NH4+ concentrations of the surface water and pH, with subsequence reducing the NH3 volatilization, thereby enhancing the ANRE of rice. Overall, this study could provide an approach to reduce NH3 emission and improve agronomic performance in environment-friendly rice production. However, our results were supported by a pot experiment. It was not clear and needed to be studied further under field conditions.