
De novo assembly of Amorpha fruticosa L. transcriptome in response to drought stress provides insight into the tolerance mechanisms
- Published
- Accepted
- Received
- Academic Editor
- Jacqueline Batley
- Subject Areas
- Genomics, Plant Science
- Keywords
- Amorpha fruticosa L., Drought stress, Transcriptomic analysis, Tolerance mechanisms
- Copyright
- © 2021 Sun et al.
- Licence
- This is an open access article distributed under the terms of the Creative Commons Attribution License, which permits using, remixing, and building upon the work non-commercially, as long as it is properly attributed. For attribution, the original author(s), title, publication source (PeerJ) and either DOI or URL of the article must be cited.
- Cite this article
- 2021. De novo assembly of Amorpha fruticosa L. transcriptome in response to drought stress provides insight into the tolerance mechanisms. PeerJ 9:e11044 https://doi.org/10.7717/peerj.11044
Abstract
Background
Amorpha fruticosa L. is a deciduous shrub that is native to North America and has been introduced to China as an ornamental plant. In order to clarify the drought resistance characteristics of Amorpha fruticosa L. and excavate the related genes involved in drought resistance regulation pathway, the mechanism of drought resistance stress of Amorpha fruticosa L. was revealed by the changes of transcriptome of Amorpha fruticosa L. under drought stress.Through the changes of the transcriptome of Amorpha fruticosa L. under drought stress, the mechanism of anti-stress of Amorpha fruticosa L. could be revealed.
Methods
Different concentrations of polyethylene glycol-6000 (PEG-6000) was used to simulate drought stress, and transcriptomic analysis was used to reveal the changes of gene expression patterns in Amorpha fruticosa L. seedlings.
Results
Results showed that Amorpha fruticosa L. seedlings were seriously affected by PEG-6000. As for the differently expressed genes (DEGs), most of them were up-regulated. The additional Go and KEGG analysis results showed that DEGs were functionally enriched in cell wall, signal transduction and hormonal regulation related pathways. DEGs like AfSOD, AfHSP, AfTGA, AfbZIP and AfGRX play roles in response to drought stress.
Conclusion
In conclusion, Amorpha fruticosa L. seedlings were sensitive to drought, which was different from Amorpha fruticosa L. tree, and the genes functions in drought stress responses via ABA-independent pathways. The up-regulation of Salicylic acid signal related DEGs (AfTGA and AfPR-1) indicated that Salicylic acid play a key role in response to drought stress in Amorpha fruticosa L.
Background
Amorpha fruticosa L. is a deciduous shrub that is native to North America and has been introduced to China as an ornamental plant (Hou, 1982; Wang et al., 2002). As a kind of urban greening and slope protection plant, Amorpha fruticosa L. has high ornamental value and is widely used in the construction of urban landscape and road slope protection. In addition, Amorpha fruticosa L. also has medicinal value, such as cytotoxic rotenoid glycosides, antibacterial and cytotoxic phenolic metabolite in seeds (Wu et al., 2014; Muharini et al., 2017). Furthermore, Amorpha fruticosa L. leaf was a kind of traditional Chinese medicine used for the treatment of fever, burns, pyogenic carbuncle and eczema (Wu et al., 2014; Hovanet et al., 2015). Amorpha fruticosa L. can tolerate dry soils, but it is most abundant along river banks and roads and the edges of flooded forests, even is tolerant of occasional flooding (Kozuharova et al., 2017). The high tolerance of various habitat conditions and potent propagation ability promotes the aggressive invasive behavior of Amorpha fruticosa L. outside of its native range (Kozuharova et al., 2017). Understanding the drought tolerance mechanism of Amorpha fruticosa L. is of great significance to the study of plant tolerance. Drought stress is one of the most prevalent environmental factors limiting plant growth (Bray, 2007). Different plants adapt to drought stress in the environment through different mechanisms, but most plants could response to drought stress via hormonal regulation, such as abscisic acid (ABA), cytokinin (CK), gibberellic acid (GA), auxin, and ethylene, etc, which regulate diverse processes and enable plant adaptation to drought stress (Wilkinson et al., 2012; Basu et al., 2016). Many genes related to hormonal regulation have been proved to improve plant resistance, including GH3, NAP, ABIs, AP37, PP2C, PP2C06, PYR/PYL, SIDP366, MYBs, RK1, hox22, SNAC2, OAT, bZIPs, SNAC1, EREBP1, DSM2, AREB2, SRO1c and ABA8OX3 (Basu et al., 2016). When plants suffer from stress, a series of biological processes will be induced to respond to stress signals, which will lead to the increase of reactive oxygen species (ROS) content in plant cells (Lawlor & Cornic, 2002). In the long evolutionary process, plants have evolved a series of anti-oxidative system to respond to drought, such as glutathione metabolism pathway, catalase system, peroxidase system, superoxide dismutase system system, etc. Despite several researchers reporting on the drought resistance in Amorpha fruticose L., few articles have focused on the gene expression patterns and molecular mechanisms of gene action in response to drought stress.
In this study, PEG-6000 was used to simulate drought stress, and transcriptomic analysis was used to reveal the changes of gene expression patterns in Amorpha fruticosa L. seedlings. The present study will provide theoretical basis and data support for Amorpha fruticosa L. drought resistant breeding.
Methods
Plant material and PEG treatment
Amorpha fruticosa L. seeds were collected from our research test plot in November 2018 and identified by Seed Key Laboratory of Saline-alkali Vegetation Ecology Restoration, Ministry of Education (Northeast Forestry University). Seeds need to be disinfected before germination test. Amorpha fruticosa L. seeds were surface-sterilized with 70% alcohol and 5% sodium hypochlorite for 5 min followed by rinsing three times with distilled water. Seeds were then seeded into culture bowls full of fine sand (sterilized by high temperature) and cultured in a plant growth chamber (temperature 25 °C ± 2; relative humidity 60% ± 5; light intensity 150 µmol m−2s−1; light and darkness cycle: 16:8) with sufficient water supply for four weeks. Subsequently, the seedlings were randomly divided into four groups with three repetitions in each group. Osmotic stress was gradually applied with varying concentrations of polyethylene glycol-6000 (PEG-6000; w/v- 0%, group CK; 10%, group 10%; 20%, group 20%; 30%, group 30%) for 72 h. Although PEG-6000 has many limitations, it is still a good choice because of its wide application in drought stress research. Whole seedlings of all groups were sampled, snap frozen in liquid nitrogen and then stored at −80 °C until testing. After PEG treatment, 20% PEG-6000 was considered the most suitable for transcriptome analysis. Hence, the samples in CK and 20% PEG-6000 treatment (72 h) group were used to reveal the gene expression pattern using transcriptome sequencing (three biological repeats in each group). Similarly, samples in CK and 20% PEG-6000 treatment (72 h) group were used to determine the superoxide dismutase (SOD), malondialdehyde (MDA), proline (Pro) and relative electrical conductivity (REC) according to previous reports (Guo et al., 2016; Zhao, Aspinall & Paleg, 1992). Samples in CK, 10%, 20% and 30% PEG-6000 treatment group (72 h) were used for quantitative real-time PCR (qRT-PCR) detection (three biological repeats in each group).
RNA extraction, library preparation, and transcriptome sequencing
Total RNA was isolated using a RNAprep pure Plant Kit (Tiangen, China) according to the manufacturer’s instruction. RNA quality was tested using gel electrophoresis, Agilent 2100 (Agilent Technologies Inc., USA) and Nano Drop 2000 (Thermo Fisher Scientifc Inc., USA). Then, total RNA was reverse transcribed to cDNA by a QuantScript RT Kit (Tiangen, China). After that, we started constructing sequencing libraries. An efficient mRNA-seq Library Prep Kit for Illumina (Vazyme, China) was used for the sequence libraries construction. Subsequently, the quality control (QC) was performed by an Agilent 2100 Bioanalyzer and an ABI StepOnePlus Real-Time PCR System to quantify the sample libraries. Finally, all the six mRNA-seq libraries were sequenced on an Illumina HiSeq 4000 sequencing platform with pair-end 2 × 150 bp mode to obtain sequencing data. The sequencing data are available at Bigsub database (https://bigd.big.ac.cn/gsub/) with accession number CRA002113.
De novo assembly, sequence annotation and differentially expressed genes (DEGs) screening
Raw reads were filtered to remove adapter and low-quality reads using FasqQC (version 0.11.5) with default parameter settings. De novo transcriptome assembly were performed by Trinity (version 2.2018) using the filtered clean data of the six libraries (Chrysant et al., 2012). The assembled transcripts were hierarchically clustered using Corset (version 1.0.5) (Davidson & Oshlack, 2014). After hierarchical clustering, the longest sequence (unigene) of each cluster were used for further analyses, including length distribution statistics, gene annotation and identification of DEGs. For gene annotation, the unigenes were annotated using BLAST program against Nr, Nt, Pfam, KOG/COG, Swiss-prot, KEGG, GO databases with an E-value ≤ 1e−5. In addition, ESTScan (version 3.0.2) (Iseli, Jongeneel & Bucher, 1999) was used for ORF predication of gene sequences that could not be aligned to any of the abovementioned databases. To evaluate the correlation of biological repetition, principal component analysis (PCA) and pearson’s correlation analysis were performed based on the FPKM of reads. Following this, read counts were normalized and DEGs in different comparisons were screened using DEseq2 (R package) methods (Love, Huber & Anders, 2014) with the criteria of padj value <0.05 by Negative binomial distribution test and |log2(Fold Change, FC)| ≥ 1.5. Genes with identified as log2FC >1 and log2FC <−1 were identified as up- and down-regulated DEGs, respectively. Hierarchical clustering based on the expression profiles of DEGs was presented by pheatmap (version 1.0.10).
DEGs functional analysis
The DEGs enriched into modules correlated with the phenotypes were separately subjected to the enrichment analysis for Gene Ontoloy (GO) and Kyoto Encyclopedia of Genes and Genomes (KEGG) pathways (Kanehisa et al., 2007). Significant GO biological processes (BP) and KEGG pathways were identified with the criterion of p < 0.05. The candidate gene interaction analysis was performed using Cytoscape (version 3.7.2).
qRT-PCR verification of RNA-seq data
Differentially expressed genes play a crucial role in drought stress resistance in Amorpha fruticosa L. The genes that are more affected by drought stress are those related to the scavenging homeostatic system of reactive oxygen species in plants; genes related to the signal transduction transcriptional regulation and metabolic regulation pathways are differentially expressed in response to drought stress. Therefore, in this study, 20 genes from the above three categories were selected for qRT-PCR validation. qRT-PCR analysis was performed on an Agilent Mx3000P QPCR system (Agilent, USA) using 2 × Brilliant III SYBR Green qPCR Master Mix (Agilent, USA). PCR amplification was performed under the following conditions: 95 °C for 5 min, followed by 40 cycles of 95 °C for 30 s, 58 °C for 30s, and 72 °C for 30 s and a final extension at 72 °C for 5 min. Quantification of gene expression was performed by the comparative 2−ΔΔCT method (Guan et al., 2014). The validation analysis was performed with three independent biological replicates. The gene-specific primers for qRT-PCR were designed using Primer Premier 5.0 (http://www.PremierBiosoft.com) and were synthesized by Invitrogen (Carlsbad, USA). The gene β-actin was used as the housekeeping gene. Data was analyzed by one-way ANOVA with Tukeys post hoc test.
Statistical analysis
Statistical analysis was performed using the GraphPad Prism 8. All experimental data were expressed as mean ± standard deviation (SD), and differences between groups or treatments were analyzed using one-way ANOVA with Tukeys post hoc test . P < 0.05 was set as significant threshold for statistical differences.
Results
Effects of different concentrations of PEG-6000 on plant growth
After PEG-6000 treatment, the Amorpha fruticosa L. plants were under drought stress. The leaves of the drought-stressed plants showed severe wilting and curling, which aggravated the increase of PEG-6000 concentration (Fig. 1), indicating that Amorpha fruticosa L. seedlings were sensitive to drought stress, and 30% concentration PEG-6000 treatment was fatal for plant seedlings. The contents of SOD, MDA, Pro and REC showed that plants suffered from drought stress had significantly higher values than that of CK (Fig. 2).
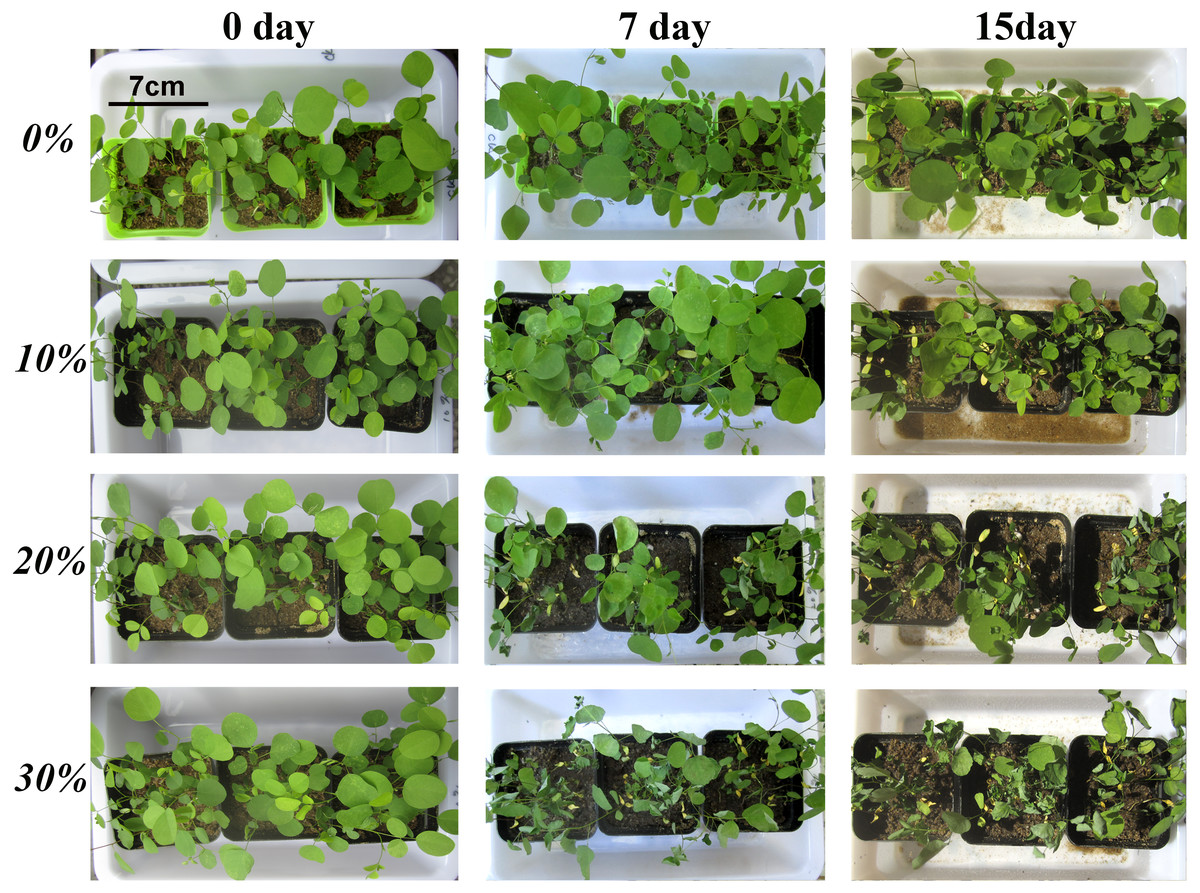
Figure 1: Growth of Amorpha fruticosa L. seedlings under different drought stress conditions.
0% means control group without PEG-6000 treatment; w/v = 10%, 20% and 30% means PEG-6000 treatment group, w/v = 10%, w/v = 20% and w/v = 30%, respectively. 0 day, 7 day and 15 day represent the groups 0 day, 7 day and 15 day after PEG-6000 treatment. Scale bars length is 7 cm long.
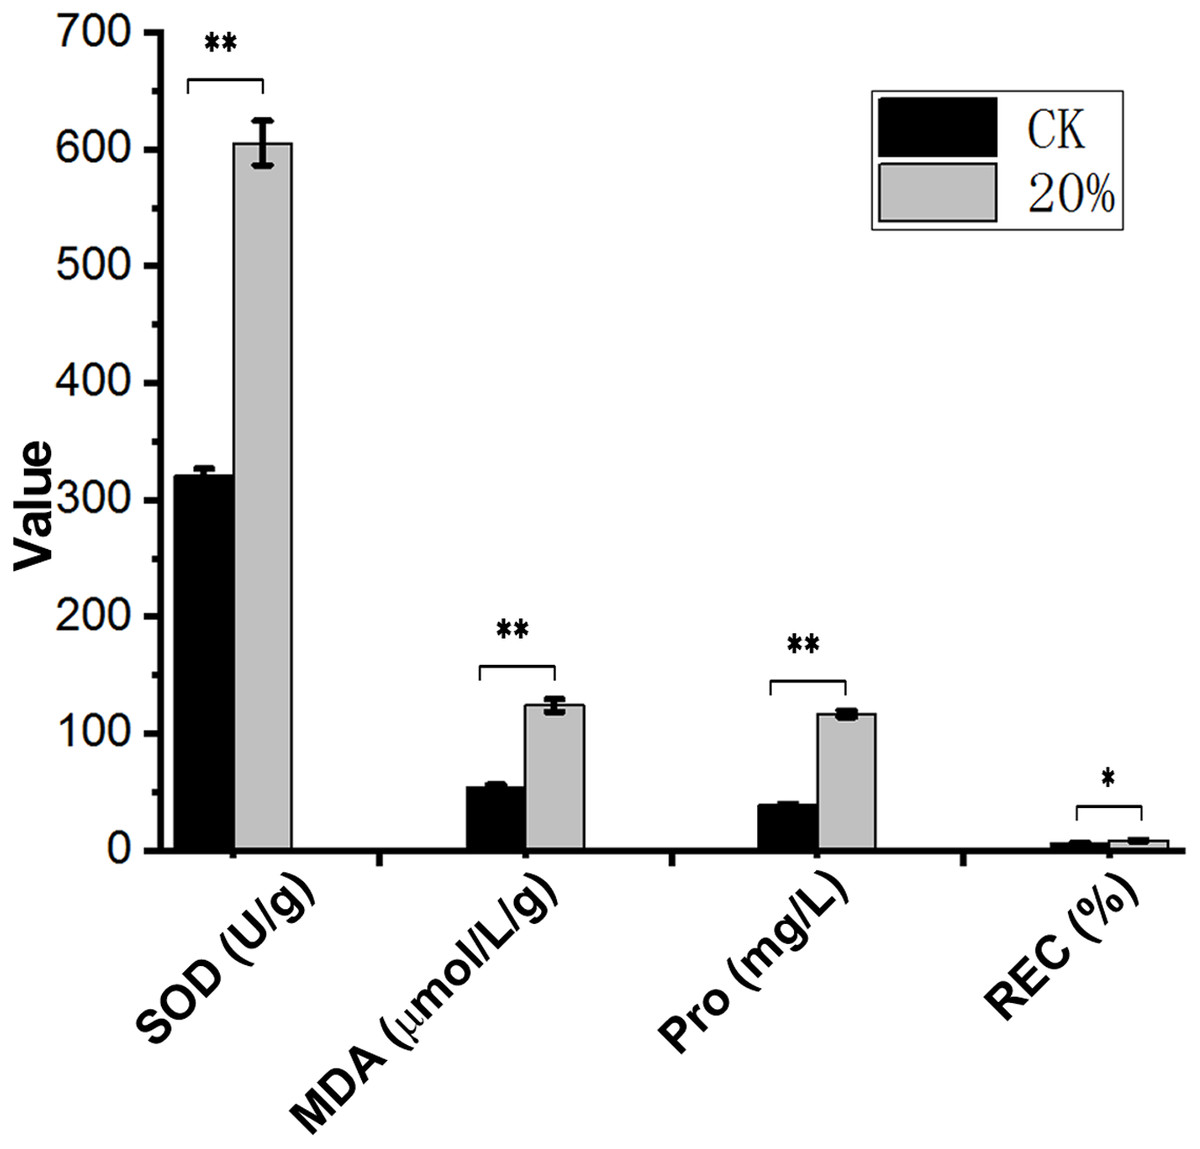
Figure 2: Contents of SOD, MDA, Pro and REC under drought stress.
Abscissa shows the index and unit. Ordinate numbers represent values. SOD, superoxide dismutase; MDA, malondialdehyde; Pro, proline; REC, relative electrical conductivity. **p < 0.01, *p < 0.05, data was analyzed by one-way ANOVA with Tukeys post hoc test (n = 3). CK means control group without PEG-6000 treatment; 20% means PEG-6000 treatment group, w/v = 20%.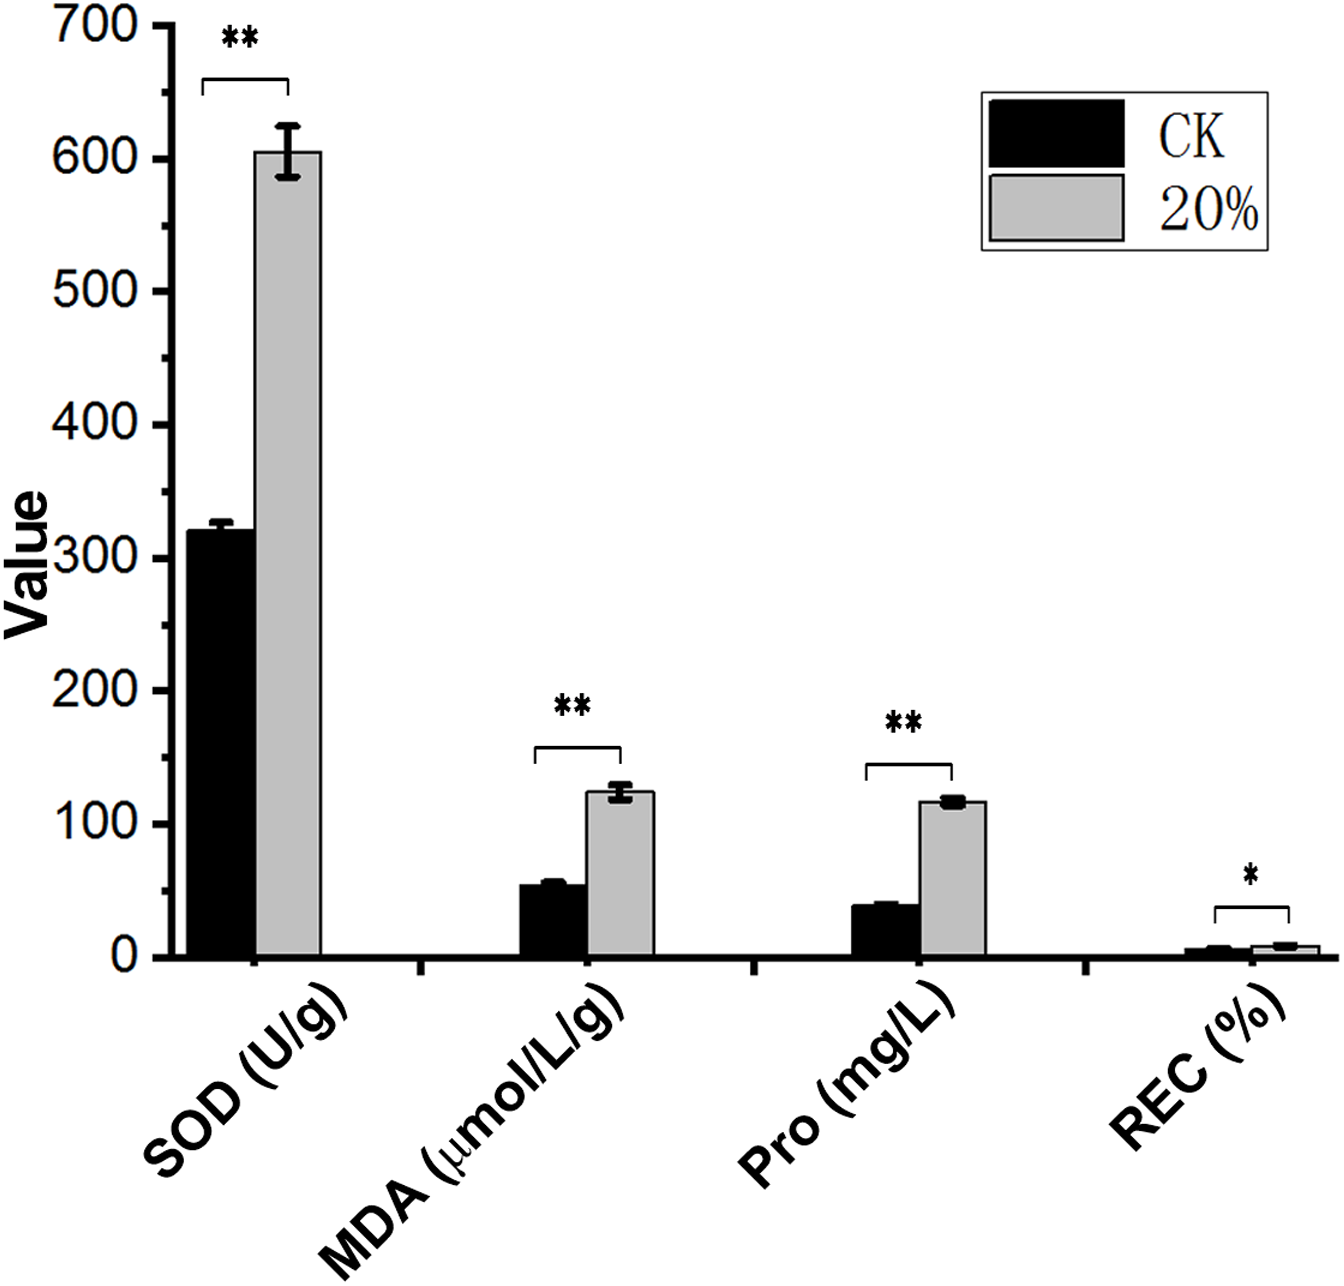
Sequence data summary and de novo assembly
Approximately 42.6 G raw data, including 142 million reads from the six libraries, were generated. QC results revealed the good quality of the sequence data with an average Q20 of 96.71%, average Q30 of 92.46%, the average sequencing error rate of 0.01% and average GC content of 57.08% (Table S1). PCA and sample to sample correlation analysis results showed that each group’s biological replicates were clustered together (Figs. 3A and 3B), indicating that the variability between samples in the same group was small. After de novo assembly of clean reads with Trinity, the transcripts were clustering and de-redundant, and 96,594 unigenes were obtained with an average length of 864 bp and N50 of 1,430 bp (Table S2). The annotation results showed that 52,010 unigenes were successfully matched with at least one database, including 15,883 (30.54%), 28,297 (54.41%), 18,348 (35.28%), 29,472 (56.67%), 33,287 (64.00%), 28,188 (54.2%), 46,878 (90.13) and 48,186 (92.65%) that significantly matched with the COG, GO, KEGG, KOG, Pfam, Swiss-Prot, EggNOG and nr databases, respectively.
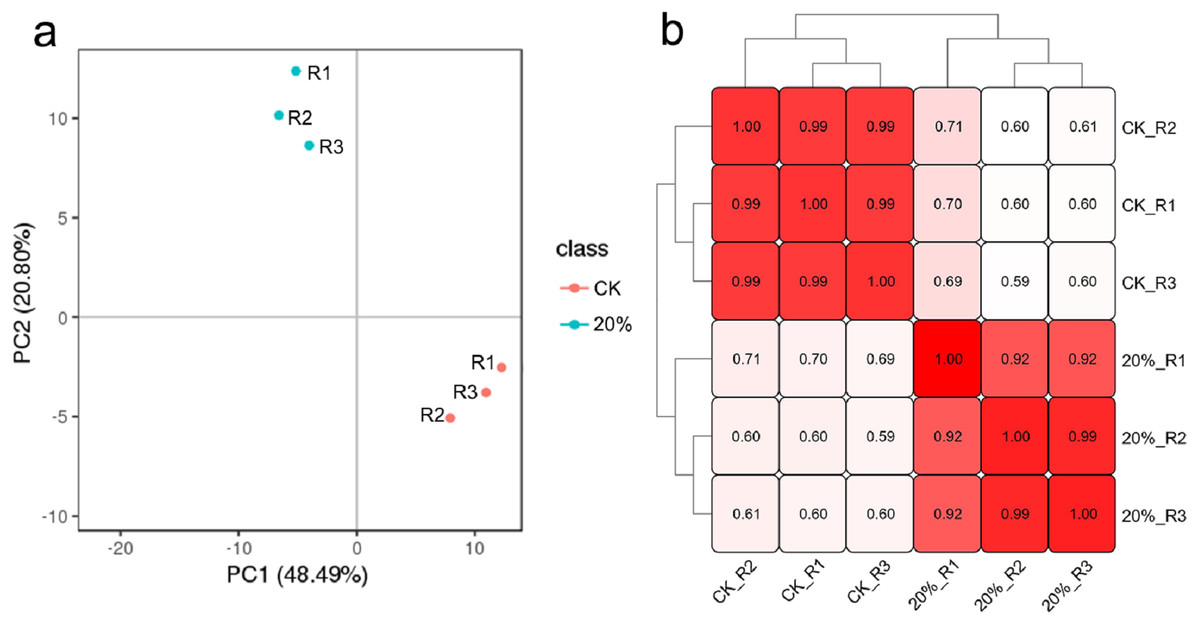
Figure 3: Clustering results of all the samples.
(A) Principal component analysis (PCA) clustering results. (B) The sample-to-sample clustering analysis based on the mRNA expression level. The color depth notes the similarity between samples (0∼1). The deeper the color, the higher the similarity.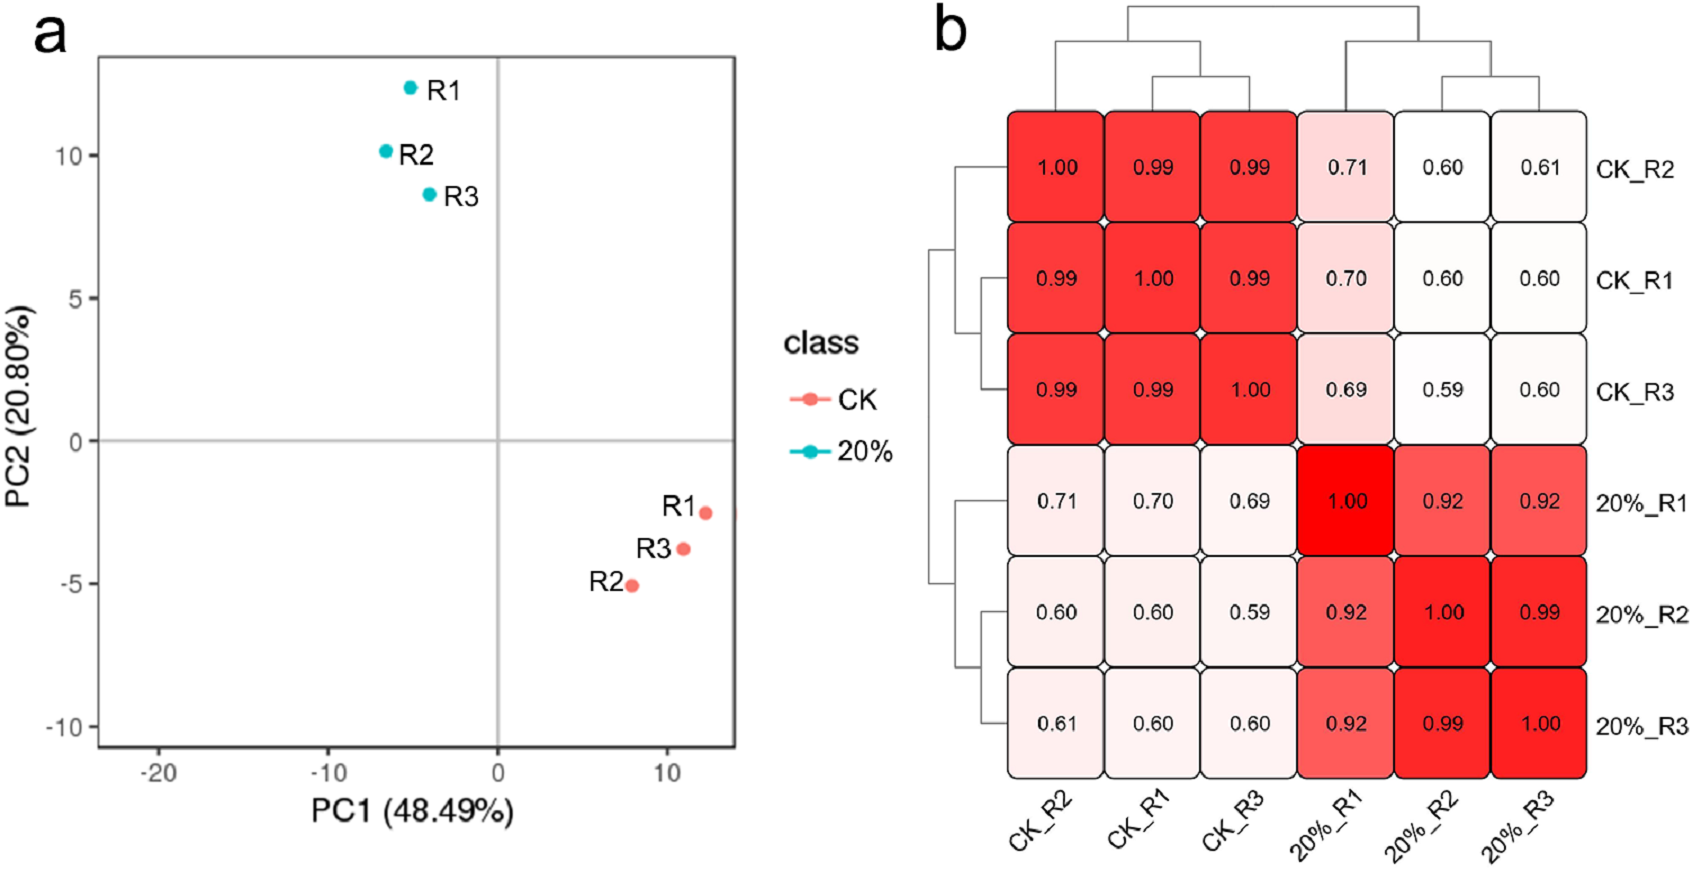
DEGs between CK and 20% PEG-6000 treatment group
There were 1084 and 603 up- and down-regulated DEGs found between CK and 20% PEG-6000 group. In order to better understand the function of DEGs, we performed GO and KEGG analysis. The GO results showed that “regulation of catalytic activity”, “regulation of peptidase activity”, “oxidation–reduction process”, “plant-type cell wall loosening” and “cell redox homeostasis” were the main BP terms respond to drought stress. In which, AfSOD, AfHSP70, AfCYPs, AfCSY4 and 60S ribosomal proteins had high frequency. Most of these DEGs were up-regulated (Fig. 4A). As for KEGG analysis, DEGs were significantly enriched in starch and sucrose metabolism, carbon fixation in photosynthetic organisms and 2-Oxocarboxylic acid metabolism pathway. In addition, 34 DEGs, including c144508.graph_c0, c164358.graph_c0, c167827.graph_c0, c171717.graph_c1 and c187107.graph_c0, were enriched in plant hormone signal transduction pathway, although the p value >0.05. DEGs in plant hormone signal transduction showed that DEGs of salicylic acid downstream were active and transcripts of PP2C were upregulated. Expression of DEGs in ABA and salicylic acid pathway were shown in Figs. 4B and 4C. What more, DEGs in Starch and sucrose metabolism including AfTPS, AfTREH, AfAMY, etc. Most DEGs in Carbon fixation in photosynthetic organisms pathway were up regulated.
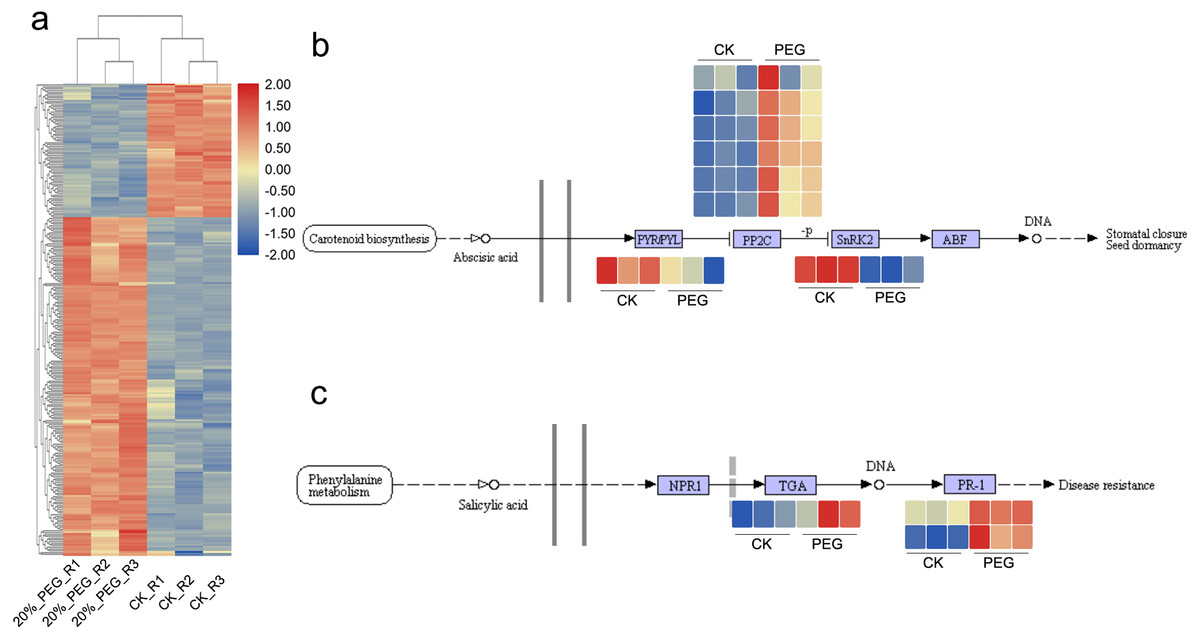
Figure 4: DEGs expression pattern and candidate pathways.
DEGs expression patterns in different samples. Blue and red color in the heatmap indicates the expression of DEGs is low and high, respectively. (B) DGEs expression pattern in ABA signaling pathway. (C) DEGs expression pattern in Salicylic acid signaling pathway. CK means control group without PEG-6000 treatment; PEG means PEG-6000 treatment group, w/v = 20%.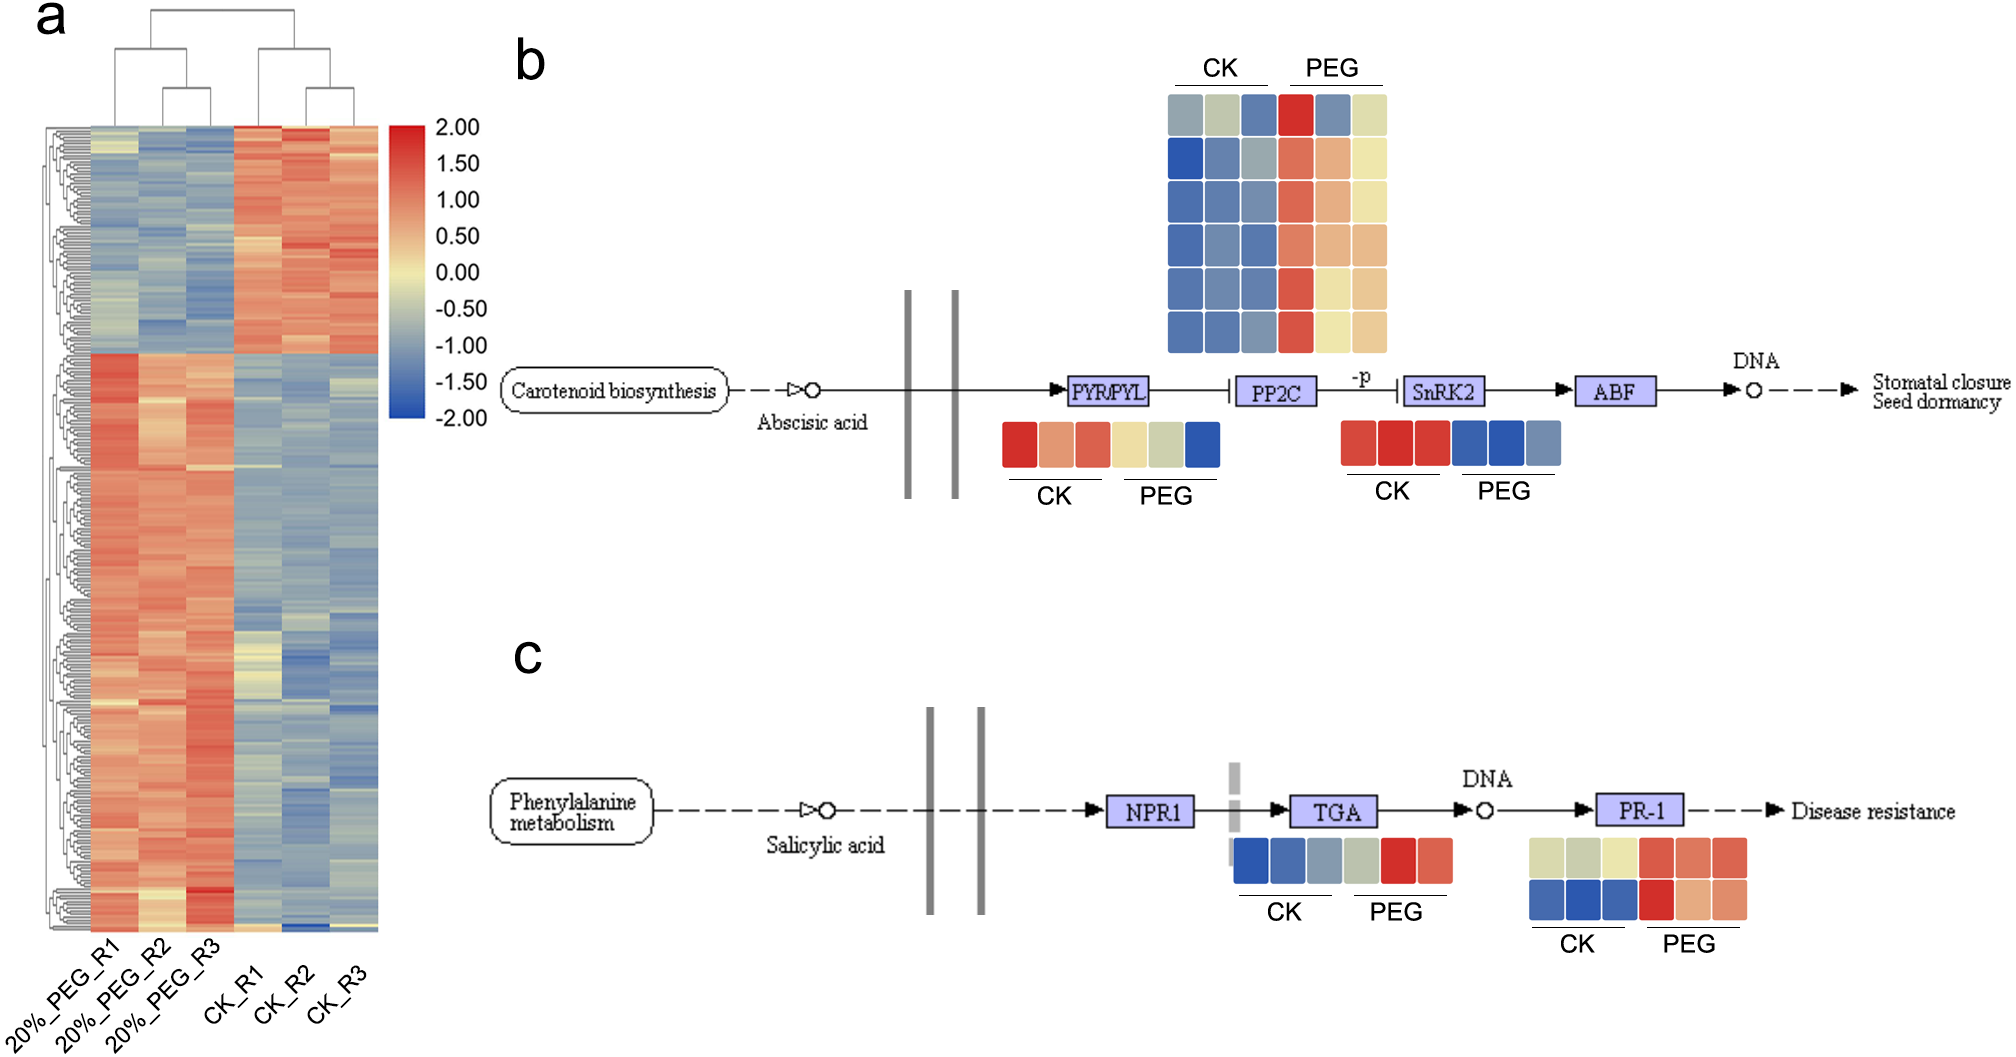
Interaction network of DEGs and proteins
The interaction network was drawn according to STRING database. There were 262 up-regulated DEGs with Confidence Score >0.9 and the interaction network showed that c160801.graph_c0, c192497.graph_c0, c190485.graph_c1, c175551.graph_c1 were the core regulators in these DEGs (Fig. 5A). The expression heatmap showed the distinct gene expression pattern between CK and PEG-6000 treatment group (Fig. 5B). The down-regulated DEGs formed an interactive network of six nodes. Besides, we classified the genes according to their functions and then construct the interaction network. Genes related to ROS showed a six nodes network (Fig. 5C), of which three genes were differently expressed (Fig. 5D). DEGs related to translation showed that 17 genes had an interaction relationship (Fig. 5E) and the expression was shown in Fig. 5F.
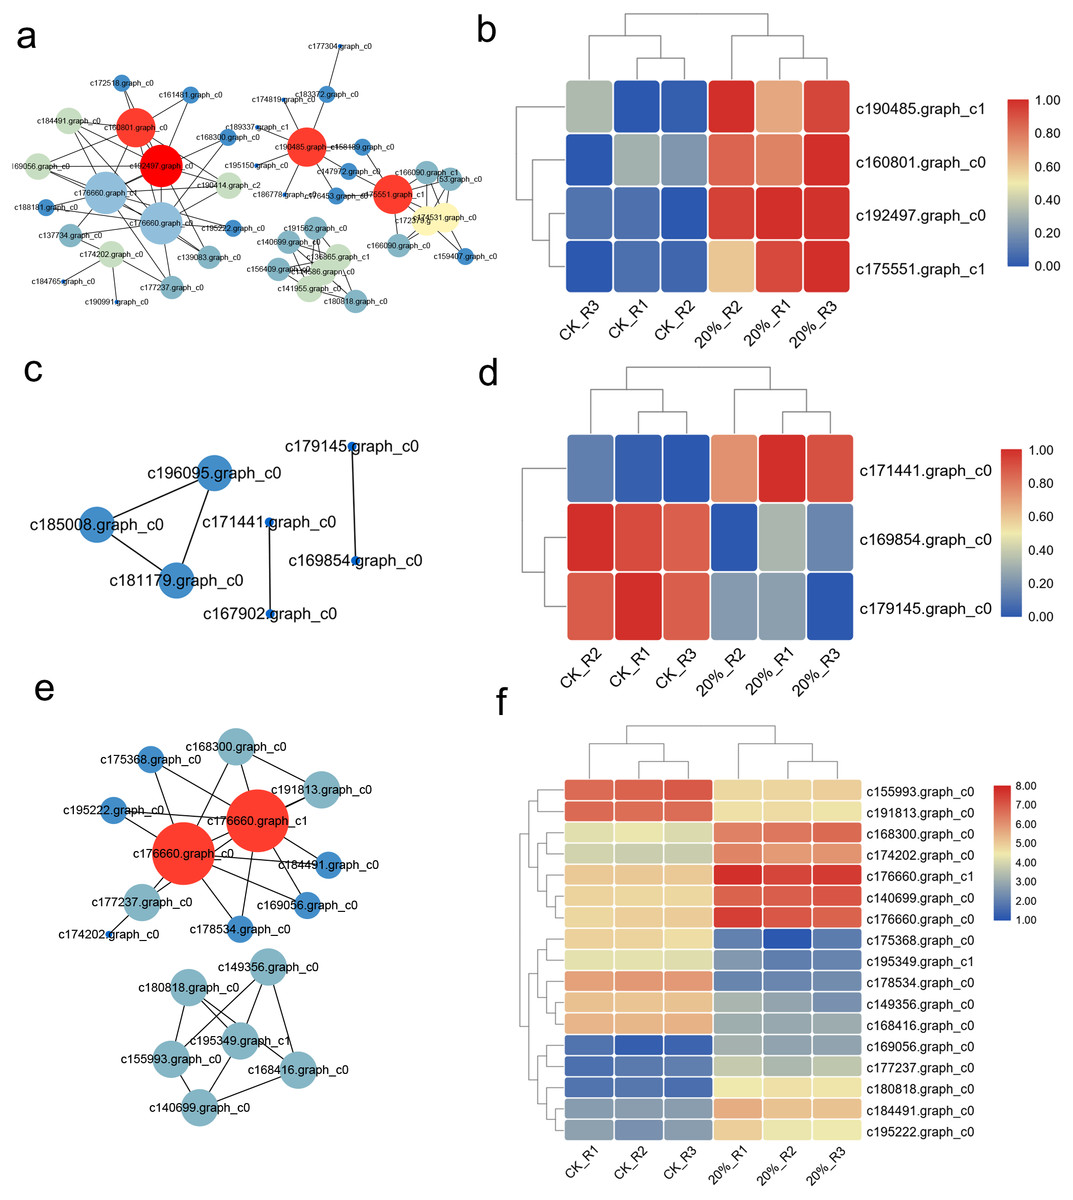
Figure 5: Interaction network of DEGs and proteins.
(A) Interaction network of up-regulated DEGs under drought stress. (B) Heatmap of core regulators in the interaction network of a. (C) Interaction network of genes related to ROS. (D) Heatmap of core regulators in the interaction network of b. (E) Interaction network of genes related to translation. (F) Heatmap of core regulators in the interaction network of e.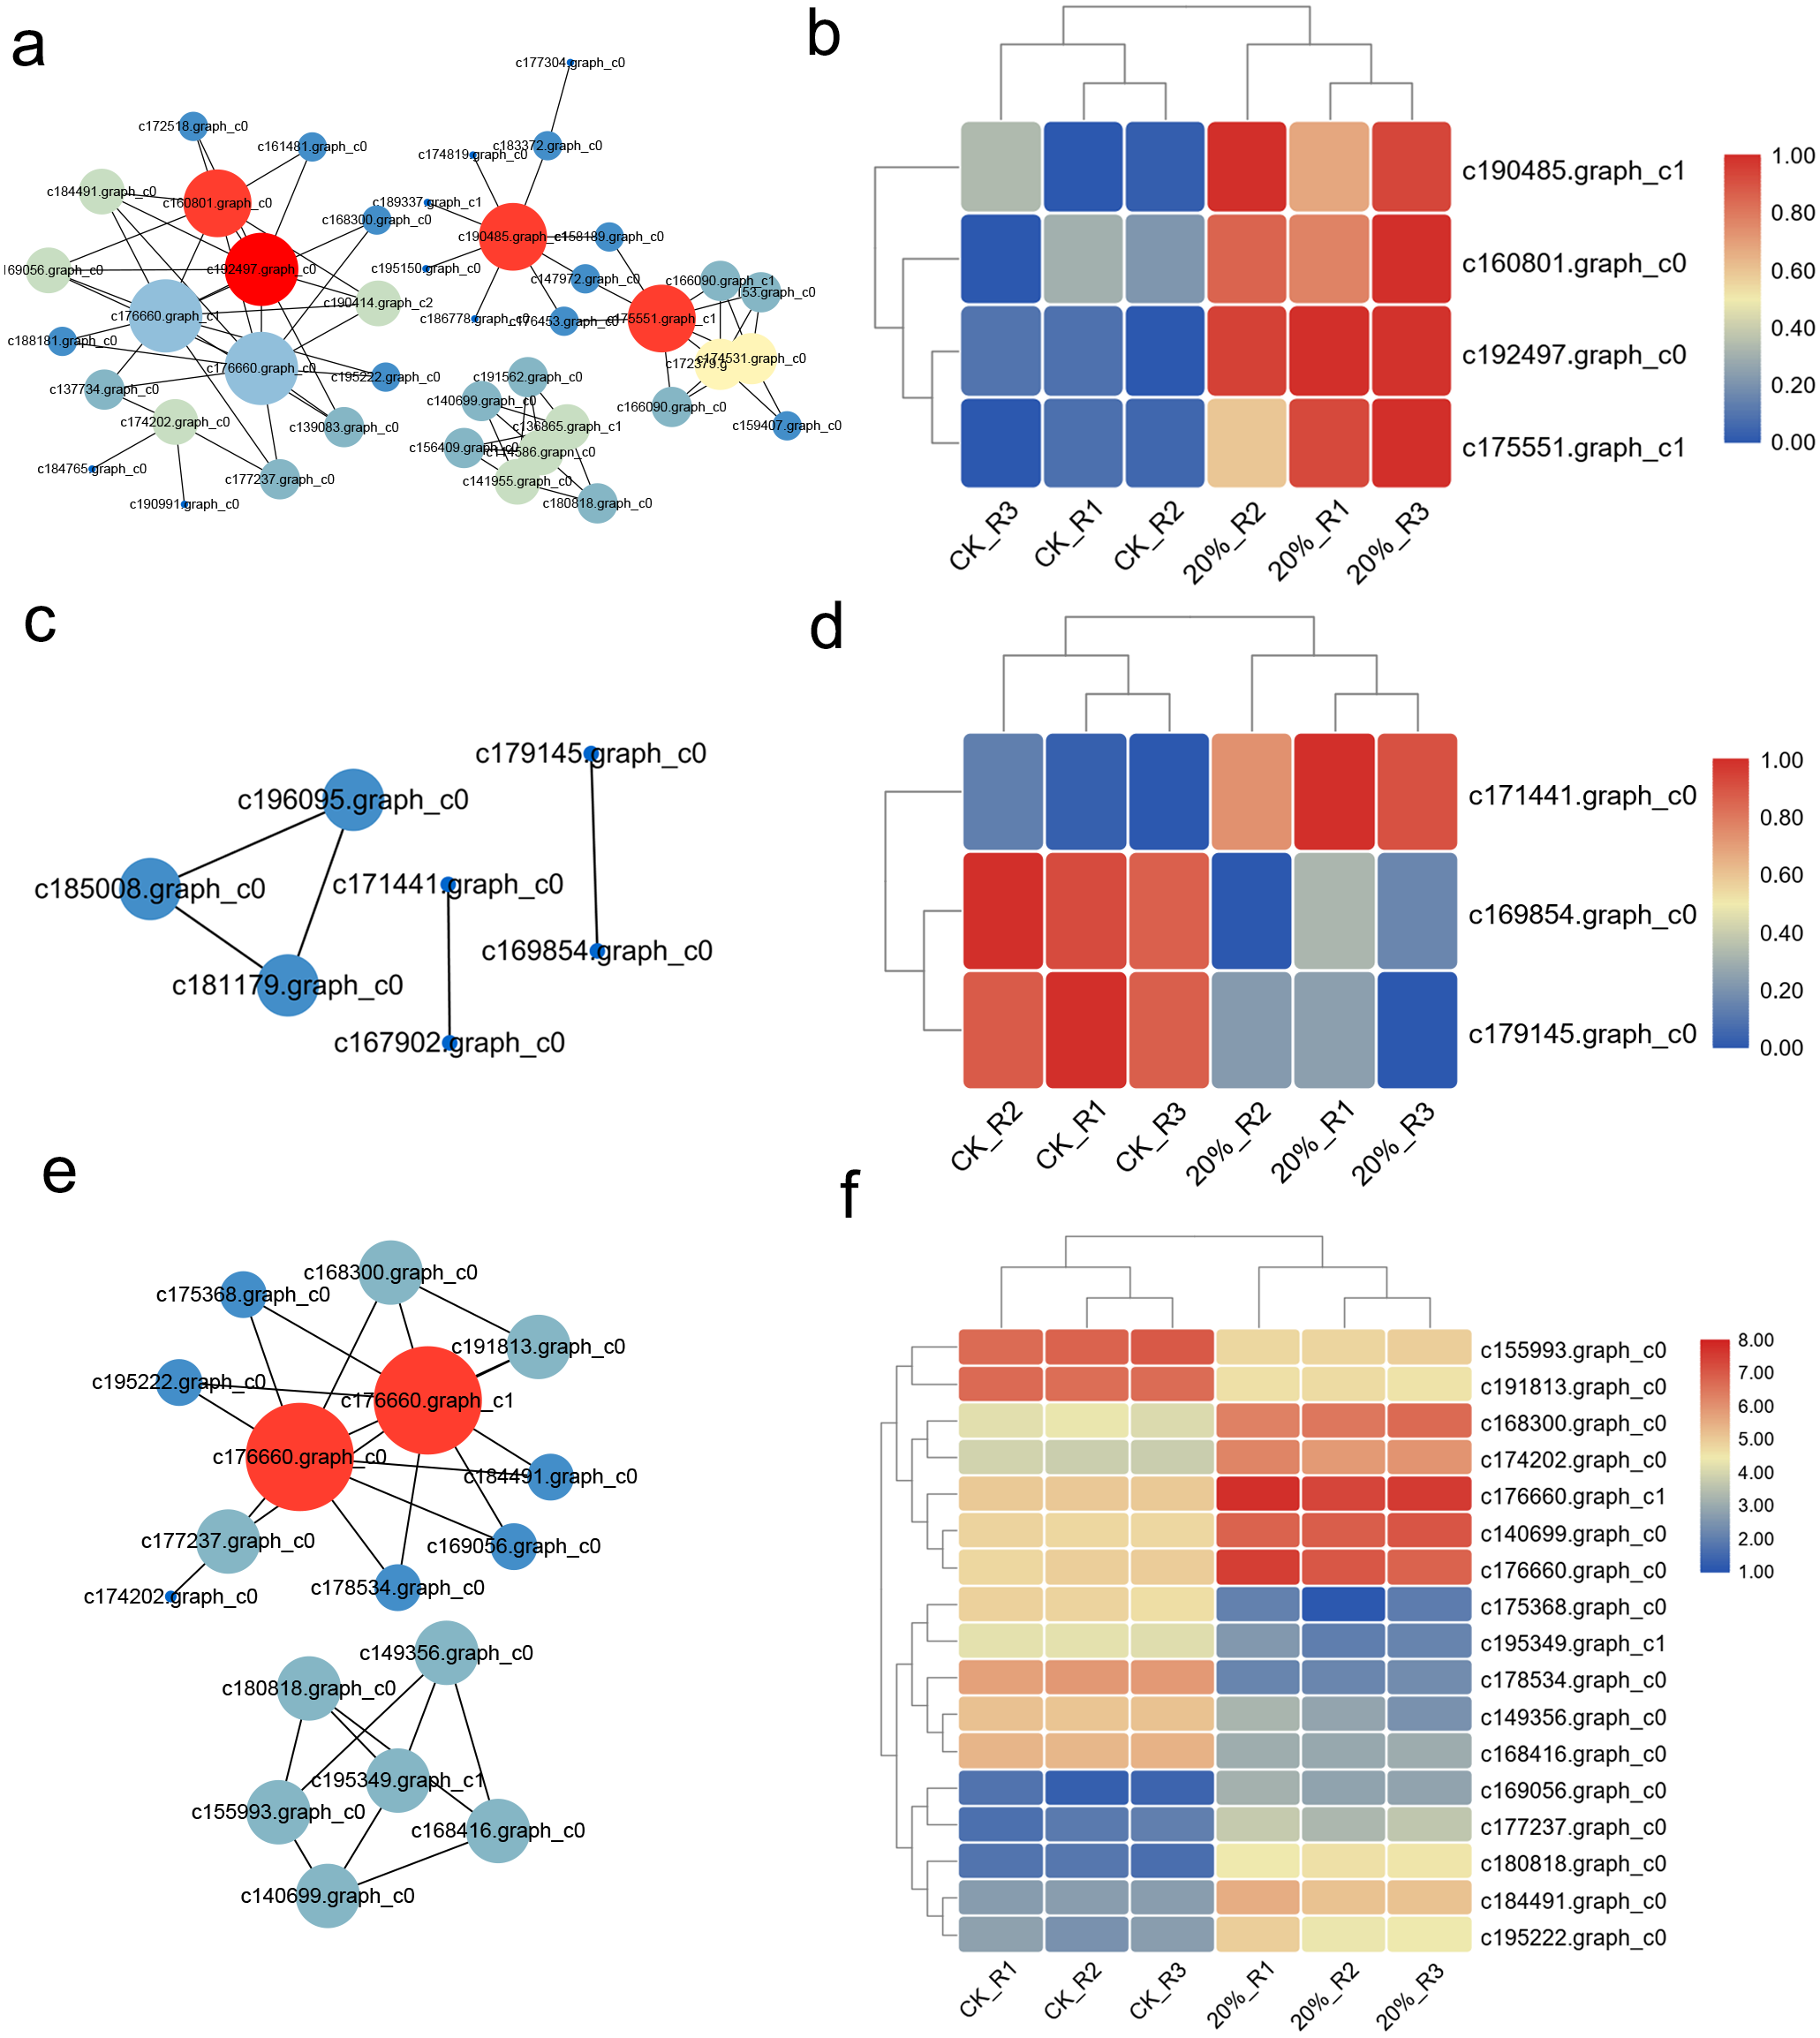
qRT-PCR verification
To validate the accuracy of gene expression data obtained by RNA-seq, 20 DEGs were selected to be verified by qRT-PCR using the same samples for RNA-seq. These DEGs were AfADH_Zinc_N, AfNAC1, AfZAT10, AfWRKY25, AfPhospholipase A1, AfDREB4, AfRAP2-1, AfABRE3, AfbHLH-MYC, AfABP19a, AfPAP17-X2, AfTrx_2, AfWRKY20, AfMYB1, AfPAL 1, AfMYB2, AfAPX2, AfCAT, AfFe/Mn-SOD and AfGST. The primers used were listed in Table S3. The qRT-PCR results showed that most stress response genes were up-regulated, especially in 20% and 30% PEG treatment. Also, some transcription factors were down-regulated with the aggravation of stress. All the expression of all these genes was shown in Fig. 6.
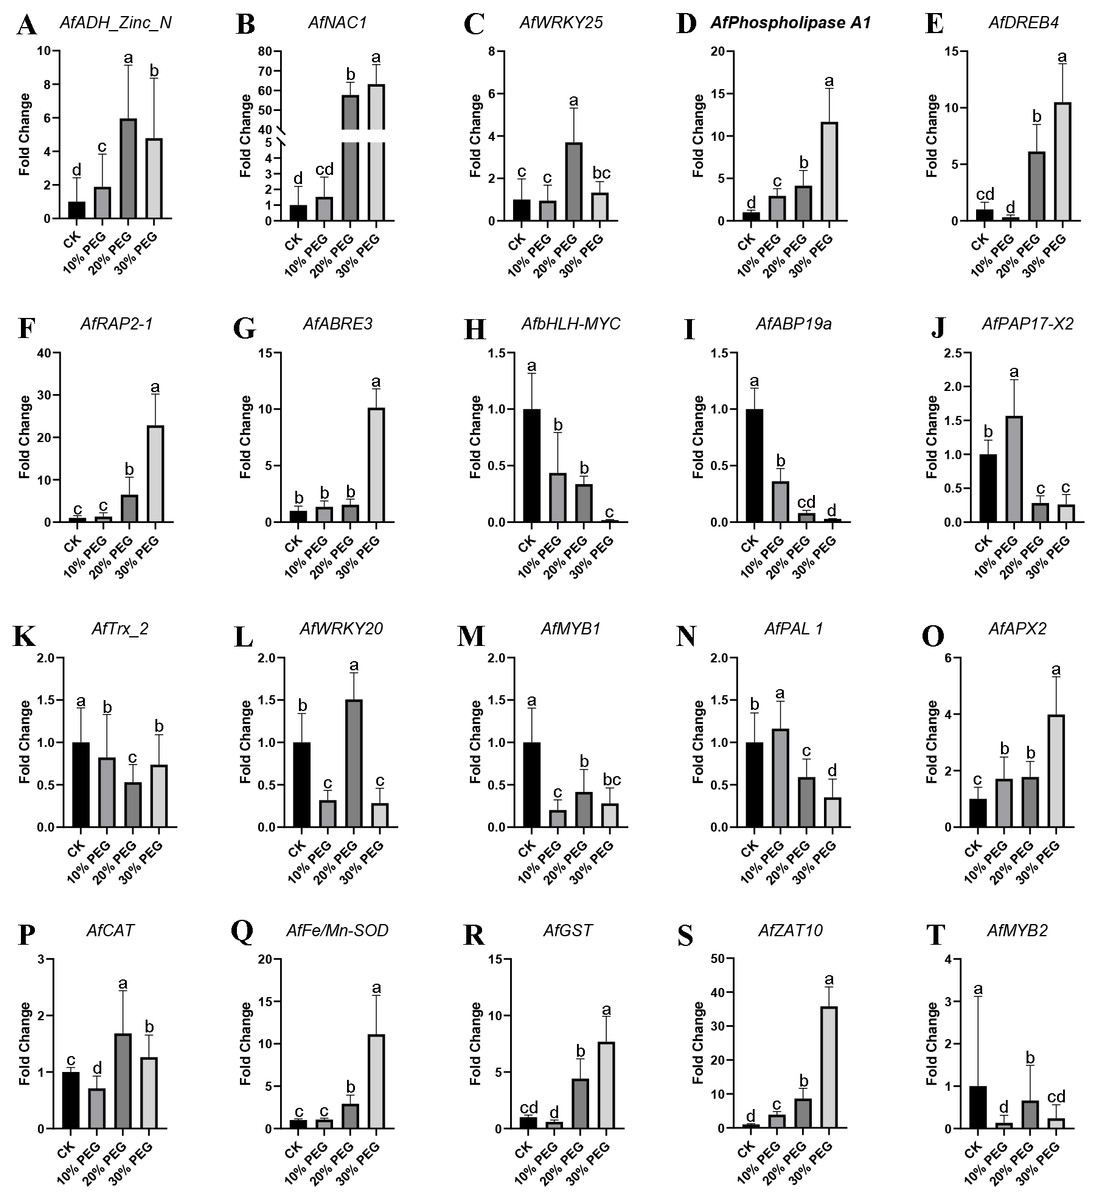
Figure 6: QRT-PCR verification results.
(A–T) Twenty significantly altered genes from the RNA-seq study were selected and tested by real-time RT-PCR. β-Actin was used to normalized the gene expression levels. Values are means ± SE, n = 3. A, B, C and D are differential analyses at 0.05 levels.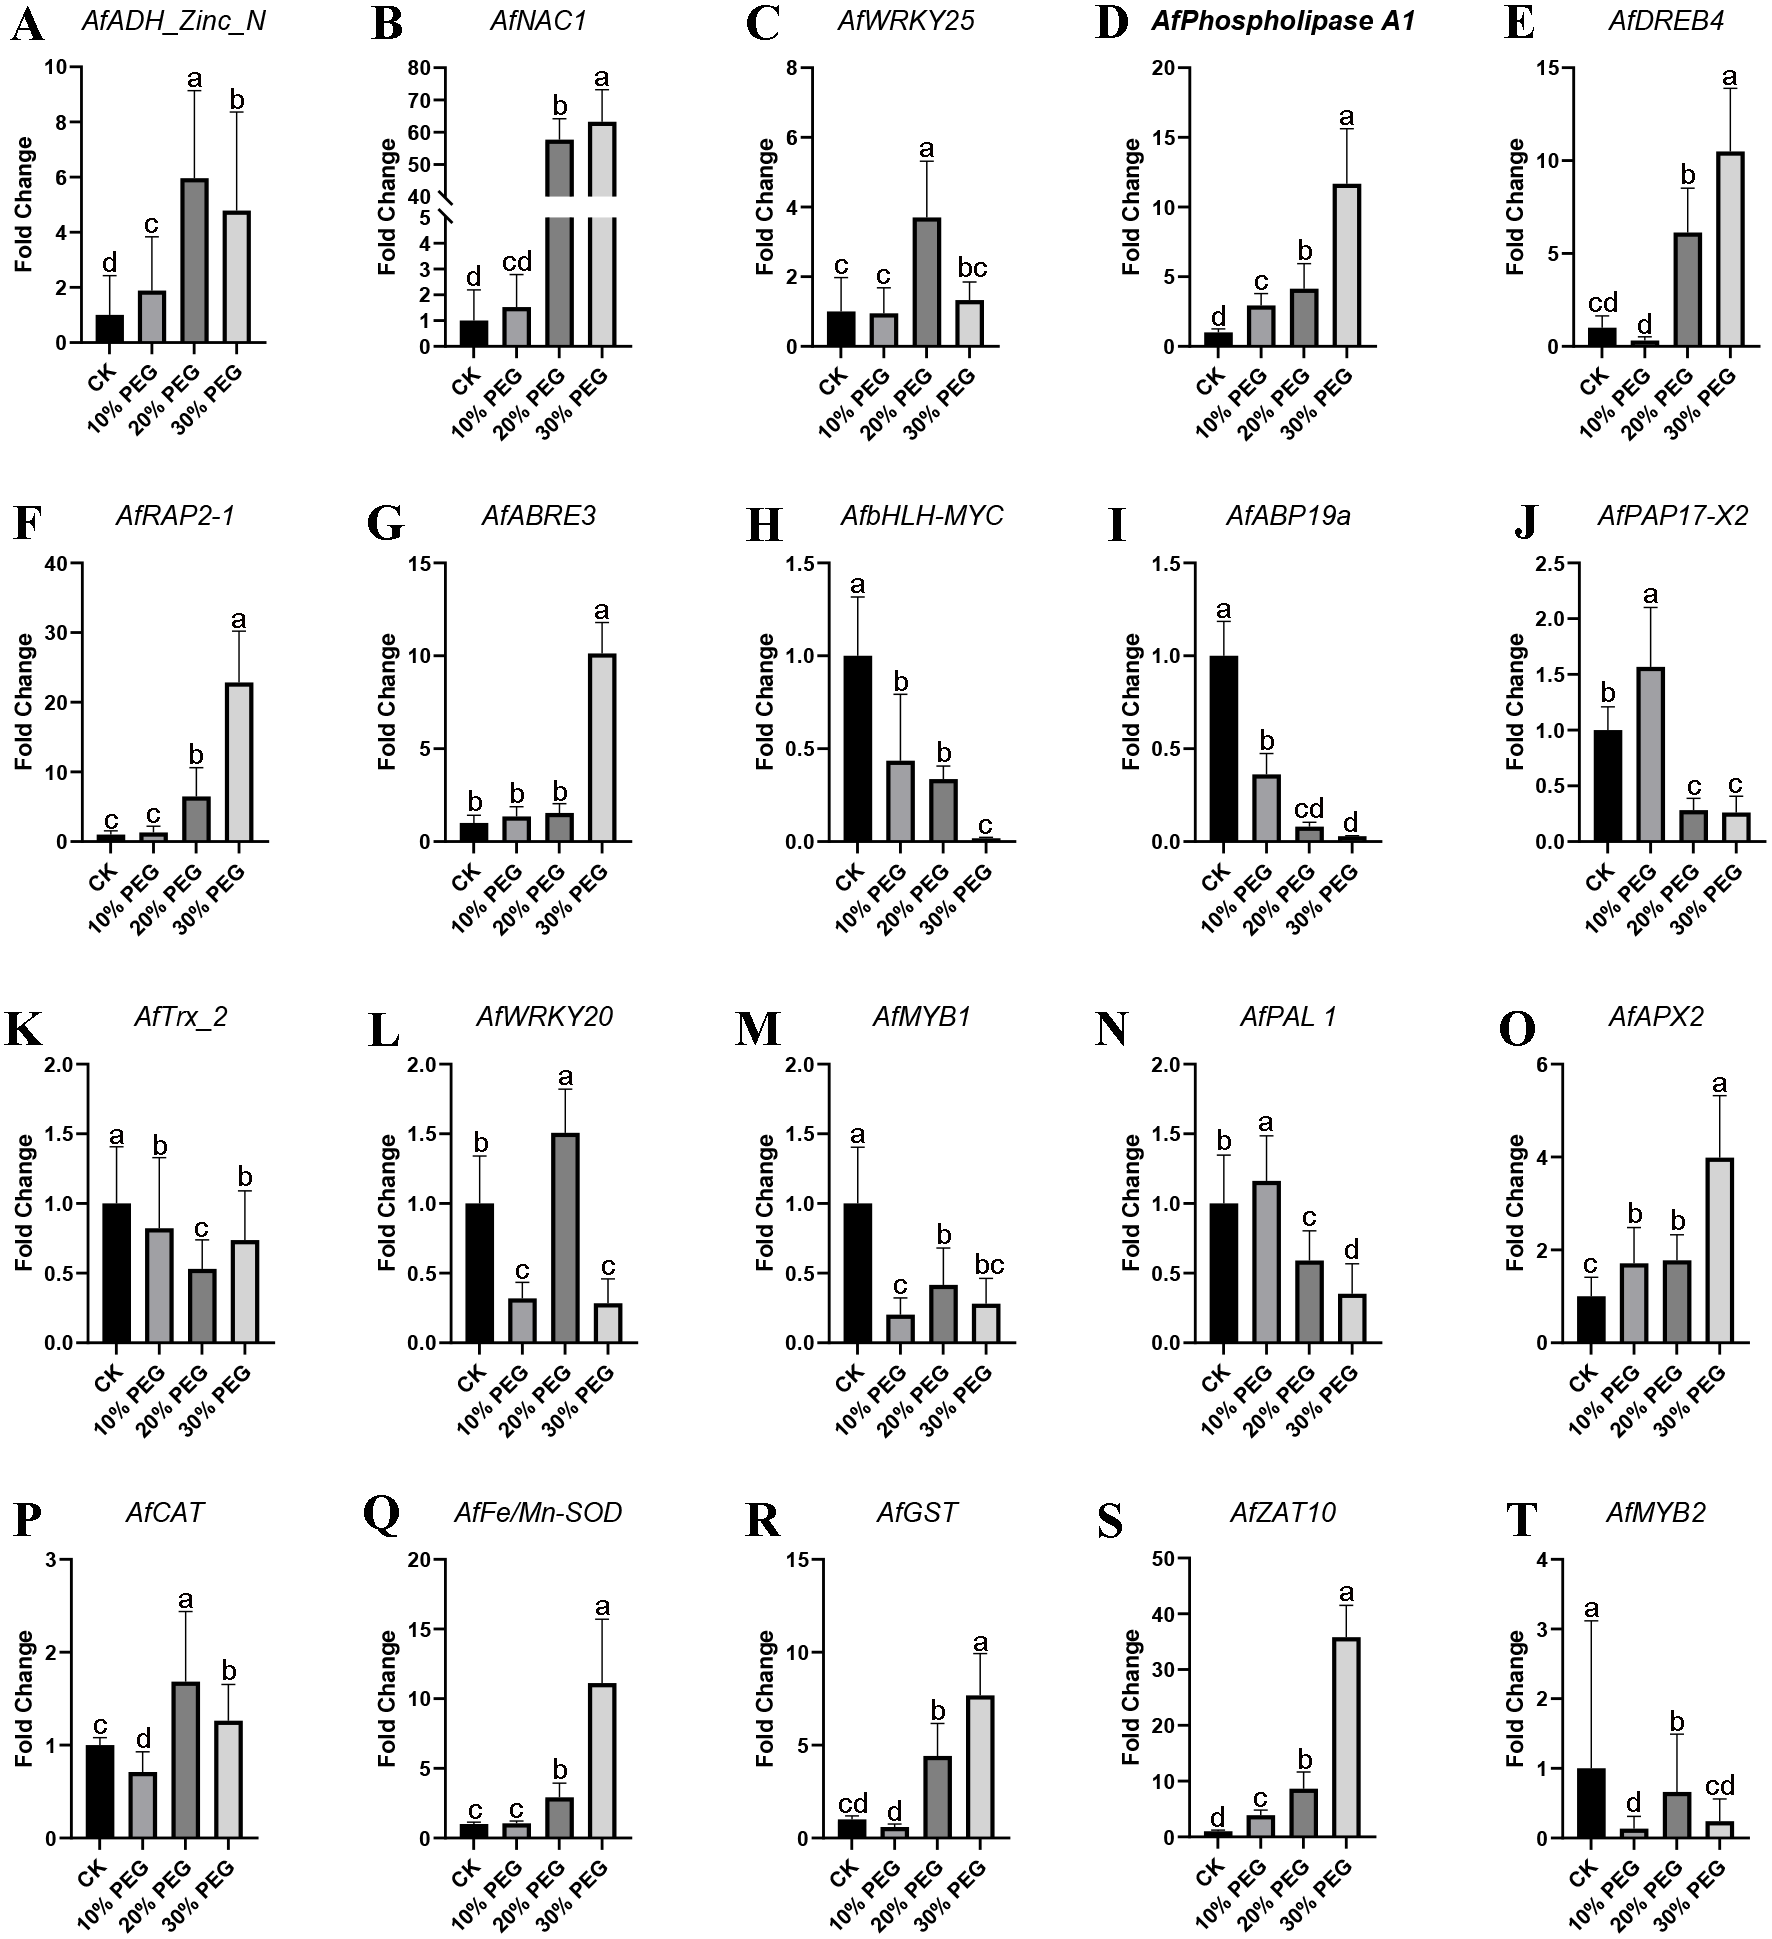
Discussion
As an important tree species for highway and slope protection, Amorpha fruticosa L. is widely used in Northeast China. Amorpha fruticosa L. is vulnerable to drought stress, so revealing the biological process response to stress is important to Amorpha fruticosa L. breeding. When environmental conditions become adverse, plants can successfully deploy complex physiological and molecular strategies to cope with abiotic stress (Guo et al., 2016). In this study, the curling and wilting of plant leaves prove that plants are under drought stress. The physiological indexes of Amorpha fruticosa L. against drought stress were consistent with that in citrus (Guan et al., 2014), Tibet Plateau (Guo et al., 2016) and some shrubs (Hussain et al., 2018). The tolerance of plants to drought resulted in increasing antioxidants activities which face the increased levels of free radicals (Toscano et al., 2016; Shao, Liang & Shao, 2005). The increased contents of SOD, MDA and Pro indicated the cellular defenses against ROS.
The statistical results of DEGs show that most of the DEGs were up-regulated, which demonstrated the response of gene expression pattern to drought stress. The DEGs functional analysis results showed that “regulation of catalytic activity”, “regulation of peptidase activity” and “oxidation–reduction process” were the main enriched GO terms and AfSOD, AfHSP70, AfCYPs and 60S ribosomal proteins were the key regulators involved in these terms. SODs are key enzymes in many oxidation processes, and provide basic protection against ROS in plants (Ahmadizadeh et al., 2011). The significantly increasing of AfSOD, AfHSP and AfCYPs after PEG-6000 treatment played an important role response to drought stress. Especially, various reports to date reveal that SODs overexpressing plants protect them from oxidative damage (Grene, Erturk & Heath, 2002; Badawi et al., 2004; Rubio et al., 2002; Zlatev et al., 2006). Similarly, HSP overexpressing plants also showed excellent stress tolerance (Wang et al., 2008; Wang et al., 2015b; Xiang et al., 2018), which act as core genes in our interaction network analysis results. In addition, CYP family members also act as key response genes to drought stress (Wang et al., 2015a; Sekhar et al., 2010). The mechanism of improving plant resistance to abiotic stress by SOD, HSP and CYP had been reviewed (Duan et al., 2017; Kim et al., 2017; Verma et al., 2019; Park & Seo, 2015), and we will not discuss it in detail. As for KEGG enrichment analysis, we found 34 DEGs enriched in plant hormone signal transduction pathway, including ABA signal related DEGs (AfPP2C, AfPYR/PYL and AfSnRK2) and Salicylic acid signal related DEGs (AfTGA and AfPR-1). ABA is an important signal molecule, which act as a comprehensive factor in response to environmental changes. It play roles the regulation of seed germination and root growth, as well as the adaptive response to various abiotic stresses (Whitley, Goldberg & Jordan, 1999). In our results, AfPP2C were up-regulated by PEG-6000 treatment. In this study, qRT-PCR detected a significant increase in the expression of AfAPX2, AfFe/Mn-SOD, and AfGST genes, and AfCAT gene was first decreased and then increased, showing an overall trend of induced increase under different concentration gradients of PEG6000 treatment, contributing to the increased drought resistance of the phytoplankton (Fig. 6). A significant amount of research on PP2C action is related to ABA signaling. The ABA INSENSITIVE1 (ABI1) and ABI2 genes encode homologous type-2C protein phosphatases with redundant yet distinct functions in ABA responses (Fujii et al., 2009). Genetic analysis of abi1 and abi2 mutants, their revertants, transient expression studies, and analysis of transgenic antisense plants showed that PP2Cs act as negative regulators of ABA signaling (Chak et al., 2000; Rodriguez, 1999; Sheen, 1998; Merlot et al., 2001). The increased expression level of AfPP2C revealed that Amorpha fruticosa L. seedlings were sensitive to drought and the genes functions in drought stress responses via ABA-independent pathways (Gosti et al., 1999). In addition, AfTGA and AfPR-1 were increased by high concentration of PEG-6000. TGA factors constitute a conserved plant subfamily of basic domain/Leu zipper (bZIP) transcriptional regulators whose genomic targets are thought to include glutathione S-transferase and pathogenesis-related (PR) genes that are associated with detoxification and defense (Yoshida, Mogami & Yamaguchi-Shinozaki, 2014; Klinedinst et al., 2000). In this study (Fig. 6), signal-responsive AfABRE3, AfDREB4, AfNAC1, and AfRAP2-1 factors were detected to increase in expression in response to changes in PEG stress concentration, and again with respect to the zinc finger protein-like transcription factors AfADH Zinc N, AfZAT10, and AfWRKY25, expression changes were also up-regulated significantly. Drought stress response genes were not only up-regulated expression, but also down-regulated related genes. Firstly, the expression of AfMYB and AfbHLH-MYC transcriptional regulators decreased significantly with increasing concentration of PEG stress treatment; AfWRKY20 showed a fluctuating change of decreasing and then increasing, and the expression of AfNADH genes involved in electron transfer increased and then decreased in response to drought stress.TGA factors contribute to protective gene responses that are mobilized by plants against stress. As for PR-1, of which the expression was promoted by TGA factors (Johnson, Boden & Arias, 2003). Johnson reported that the in vivo recruitment of TGAs to the PR-1 promoter precedes the SA (Salicylic Acid)-induced expression of a transcriptionally divergent XET gene, which encodes a putative xyloglucan endotransglycosylase (Klinedinst et al., 2000). These enzymes remodel the cell wall during development and in response to environmental cues, which is consistent with the enriched cell wall related GO terms in our results. Both AfTGA and AfPR-1 were up-regulated by drought stress, which indicated that Amorpha fruticosa L. can resist drought stress through SA. The possible mechanism is that when plant suffered from drought stress, NPR1 can transfer the SA-induced activation of PR-1 to the nucleus, where it interacts with the C-terminal domain of TGAs (Gatz, 2012). The interaction network analysis results showed that AfHSPs, AfCXXS1, AfGRXS11, AfGRXC6 and AfFAD play roles in gene interaction. Of which, GRX is a kind of small molecule redox protein, which plays an important role in antioxidation in the form of thiol reductase (Kinkema, Fan & Dong, 2001). Pervious study reported that environmental stresses such as cold, heat, drought and salt induce changes in fatty acid composition, mainly in the content of linolenic acid (Noctor, Reichheld & Foyer, 2017). Zhang found that FAD3 and FAD8 overexpressing tobacco plants showed increased tolerance to drought and to osmotic stress (Noctor, Reichheld & Foyer, 2017). The FADs induced drought tolerance can be related directly to the changes in membrane structure such as decreased membrane fluidity found in hyperosmotically stressed phospholipid vesicles and yeast cells, and the accumulation of unsaturated fatty acids can attenuate rigidification of membranes leading to reduced damage by osmotic stress (Zhang et al., 2005). This view was also confirmed in our results, because many genes related to cell wall showed differential expression. The increased AfFAD in Amorpha fruticosa L. might played similar roles to against to the damage of drought stress.
Conclusions
Amorpha fruticosa L. can effectively respond to drought stress by increasing the intracellular content of SOD, MDA and Pro. Correspondingly, the expression of drought stress response genes and transcription factors increased. Some of the transcription factors played key roles in polygenic interaction against to stress. Amorpha fruticosa L. seedlings were sensitive to drought and the genes functions in drought stress responses via ABA-independent pathways. The up-regulation of Salicylic acid signal related DEGs (AfTGA and AfPR-1) indicated that Salicylic acid may play a key role in response to drought stress in Amorpha fruticosa L.
Supplemental Information
Raw data
The data derived from the instrument we use is the average of three repetitions, the D column is the upper error line, and the E column is the lower error line. Instrument Name: MxPro-Mx3000P Comparative Quantitation.