
Unraveling the genetic diversity and structure of Quercus liaotungensis population through analysis of microsatellite markers
- Published
- Accepted
- Received
- Academic Editor
- Paolo Costantino
- Subject Areas
- Biodiversity, Genetics, Plant Science, Forestry
- Keywords
- Quercus liaotungensis Koidz., Genetic diversity, Genetic structure, Microsatellite marker
- Copyright
- © 2021 Guo et al.
- Licence
- This is an open access article distributed under the terms of the Creative Commons Attribution License, which permits unrestricted use, distribution, reproduction and adaptation in any medium and for any purpose provided that it is properly attributed. For attribution, the original author(s), title, publication source (PeerJ) and either DOI or URL of the article must be cited.
- Cite this article
- 2021. Unraveling the genetic diversity and structure of Quercus liaotungensis population through analysis of microsatellite markers. PeerJ 9:e10922 https://doi.org/10.7717/peerj.10922
Abstract
Background
Quercus liaotungensis Koidz. is an ecologically and economically important tree species widely distributed in Northern China. However, the effective assessment, utilization, and protection of Q. liaotungensis resources remain unexplored.
Methods
In total, 120 samples obtained from 12 Q. liaotungensis populations of Northern China were investigated for genetic diversity and structure using 19 simple sequence repeat (SSR) primer pairs.
Results
The total number of alleles detected was 293, the average number of effective allele (Ne) was 6.084, the genetic differentiation coefficient (Fst) was 0.033, and the mean observed heterozygosity (Ho) and expected heterozygosity (He) were 0.690 and 0.801, respectively. Moreover, analysis of molecular variance (AMOVA) showed a 5.5% genetic variation among 12 Q. liaotungensis populations, indicating that a high level of genetic diversity and a low degree of genetic differentiation among Q. liaotungensis populations. STRUCTURE and cluster analysis divided the 12 Q. liaotungensis populations into the following three subpopulations: Bashang Plateau subpopulation (SH), Liaodong Peninsula subpopulation (NC), and Loess Plateau subpopulation (other 10 populations). The cluster analysis based on 19 climatic factors was consistent with the genetic structure. A positive correlation was found between genetic distance and geographical distance (r = 0.638, p = 0.028) by the Mantel test, and two boundaries were found among the 12 Q. liaotungensis populations by the Barrier analysis, indicating that Q. liaotungensis populations existed isolated by geographical distance and physical barrier.
Conclusion
This study suggests that geographical isolation, physical barrier, climatic types, and natural hybridization promote the formation of genetic structures, which can contribute to future protection and genetic improvement of Q. liaotungensis.
Introduction
Quercus liaotungensis Koidz. is a dominant species found in deciduous broad-leaved forests of Northern China (Sun et al., 2018) with significant ecological and economic value (Yu, Zhou & Luo, 2003). The timber of Q. liaotungensis can be used to prepare building materials (Xu et al., 2018). In addition, it has a range of other functions, including the source of cultivation media for edible fungus, multiple nutrients, and medical materials, and carbon fixation, carbon sequestration, and soil and water conservation (Du et al., 2007; Li et al., 2012; Wang & Zhang, 2011). In the early decades of the 20th century, the natural forests of Q. liaotungensis constituted the indigenous vegetation of the Loess Plateau of China (Du et al., 2007). However, this species has rapidly dwindled due to extensive human disturbances and climatic changes and currently exists in the form of secondary forests with patchy distribution (Hou et al., 2004; Li & Ma, 2003). Moreover, the taxonomic position of two closely related species, i.e., Q. liaotungensis and Q. mongolica, is unclear. Although frequent gene exchange can cause natural hybridization between them, they should be considered as discretely taxonomic units according to the studies by Zeng et al. (Wei et al., 2015; Zeng et al., 2010; Zeng et al., 2011).
The genetic diversity of a species affects its adaptability to the environment and the stability of the forest ecosystem (Hughes et al., 2008), including various traits of economic significance present in forest trees, such as the size of stem, wood quality, drought resistance, and disease resistance. Therefore, analyzing the genetic diversity among and within populations is important to evaluate evolution and the potential for improvement of tree species. In recent years, several studies have reported the genetic diversity and structures of Quercus, such as Q. acutissima (Zhang et al., 2013), Q. ilex (Fernádez i Marti et al., 2018), Q. variabilis (Shi et al., 2017), Q. mongolica (Ueno & Tsumura, 2008), and Q. rubra (Pettenkofer et al., 2019). At present, the research on Q. liaotungensis mainly focuses on its ecological function (Sun et al., 2019), distribution pattern (Li et al., 2012; Wu, Zheng & Ma, 2002), natural regeneration (Sun, Gao & Chen, 2004; Zhang, Deng & Guan, 2014), and dispersal pattern of acorns (Wang, Ma & Liu, 1999; Zhang, Chen & Zhang, 2008). However, there are a few studies on the genetic diversity of Q. liaotungensis populations. Only Qin studied the genetic diversity of eight natural Q. liaotungensis populations from the Shanxi Province using 11 SSR primer pairs (Qin et al., 2012), and Wang et al. (2014) studied the genetic diversity of 8 Q. liaotungensis populations from the Shanxi Province at different altitudes using SRAP markers. The sampling strategy in a similar distribution incompletely assessed the genetic diversity of Q. liaotungensis with previous studies. Besides, climatic conditions not only promote genetic diversity but also play an essential role in the formation of the genetic structure of the Q. liaotungensis population. Furthermore, studies on genetic patterns and demographical histories of Q. liaotungensis suggest that soil and climatic conditions are the primary factors affecting the genetic diversity of the tree species (Yang et al., 2018).
Simple Sequence Repeat (SSR) markers are highly polymorphic, stable, codominant, and hence regarded as effective means to study the genetic diversity and genetic structure of Quercus species (Fernádez i Marti et al., 2018; Sullivan et al., 2013; Zhang et al., 2013). Zeng et al. (2010) assessed the taxonomic status of two closely related Chinese oaks using SSR and amplified fragment length polymorphism (AFLP) markers in their early reports. Subsequently, nuclear and chloroplast markers were used to analyze the demographical histories in the hybrid zones of Q. liaotungensis and Q. mongolica (Zeng et al., 2011). Yang et al. (2016) found that their interspecific divergence and phylogeographical histories were possibly related to the climatic events of the Pleistocene era by studying the four chloroplast DNA and two nuclear genes. Therefore, the collection of sufficient samples from different natural distributions, exploitation of accurate detection, and selection of sufficient markers are necessary to study the genetic pattern of Q. liaotungensis species.
Here, we used 19 SSR primers to detect and estimate the genetic variation of Q. liaotungensis from different distribution zones in China. The objectives of this study are as follows: (1) how the genetic diversity and genetic differentiation among 12 Q. liaotungensis populations; (2) the genetic structure and the number of subpopulations were assessed; (3) whether the geographical distance, physical barrier, and climate factors influenced the genetic structure. These findings are advantageous for revealing genetic information and assisting the conservation and utilization of Q. liaotungensis germplasm resources.
Materials & Methods
Plant materials
A total of 120 Q. liaotungensis samples from 12 natural populations were collected from five provinces in China (Fig. 1, Table 1), and studies were conducted on 10 individuals from each population. Q. liaotungensis is mainly distributed in the Loess Plateau (Shanxi, Shannxi, Gansu Province) of Northern China. Bashang Plateau (Hebei Province) and Liaodong Peninsula (Liaoning Provinces) are present in the distribution on an overlapping ecological niche of Q. liaotungensis and Q. mongolica species. The distance of each individual was above 50 m. Young leaves were collected and dried using silica gel for DNA extraction and stored at −80 °C until use.
DNA extraction and PCR amplification
The total genomic DNA was extracted from young leaves using the DNA secure Plant Kit (Tiangen Biotech, Beijing, China). The quality and concentration of DNA were detected by agarose gel electrophoresis and NanoDrop 2000 spectrophotometer (Implen, CA, USA), respectively. High-quality DNA was used immediately or stored at −20 °C until use.
The genetic diversity of 12 Q. liaotungensis populations was studied using 19 SSR primers (Aldrich et al., 2002; Dow, Ashley & Howe, 1995; Kampfer et al., 1998; Mishima et al., 2006; Steinkellner et al., 1997; Wang, 2012) (Table 2). Amplification was performed in a 10 µL reaction mixture, containing 1 µL of DNA template (10 ng/µL), 5 µL of 2 × Taq PCR Master Mix (TaKaRa, Japan), 3 µL of ddH2O, 0.5 µL of reverse primer(1 µM), and 0.5 µL of forward primer (1 µM) with a fluorescent label with FAM, HEX (Sangon, Shanghai, China). The PCR program was as follows: pre-denaturation at 94 °C for 5 min, followed by 35 cycles of denaturation at 94 °C for 30 s, annealing at 55 °C for 30 s, and extension at 72 °C for 30 s, with a final extension at 72 °C for 10 min. The PCR products were analyzed by capillary electrophoresis in an ABI 3730xl DNA Analyzer (Applied Biosystems, Foster City, CA, USA). The SSR allele size was determined by GeneMarker version 2.2 software (Genetics, State College, PA, USA).
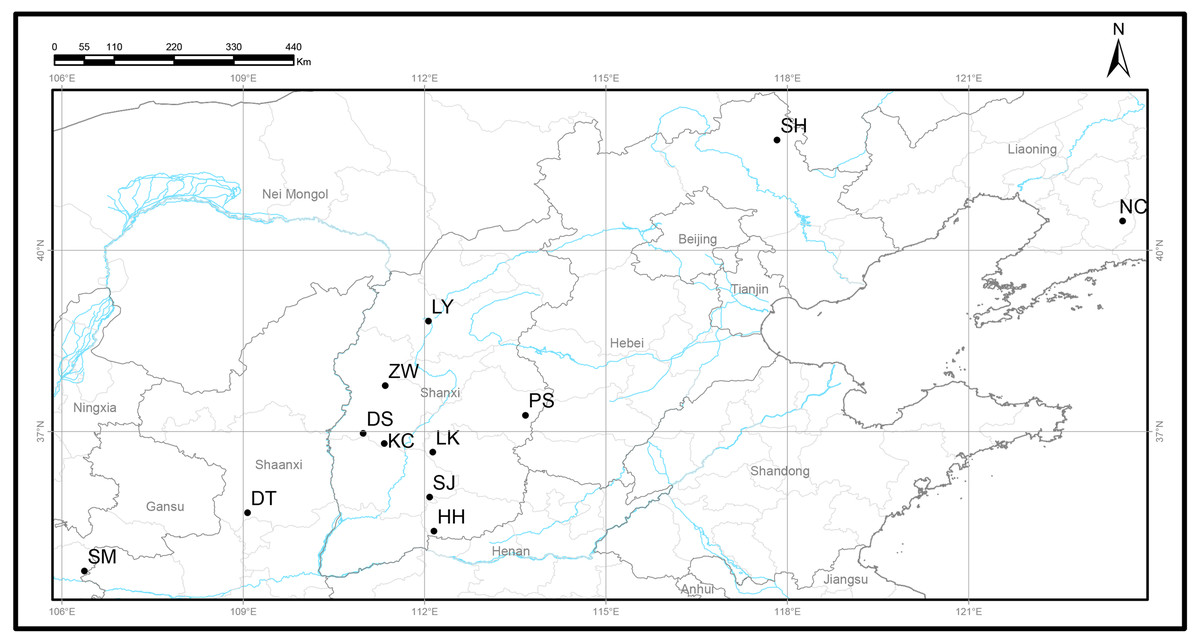
Figure 1: Locations of 12 natural Q. liaotungensis populations in China.
Map credit: OpenStreetMaps.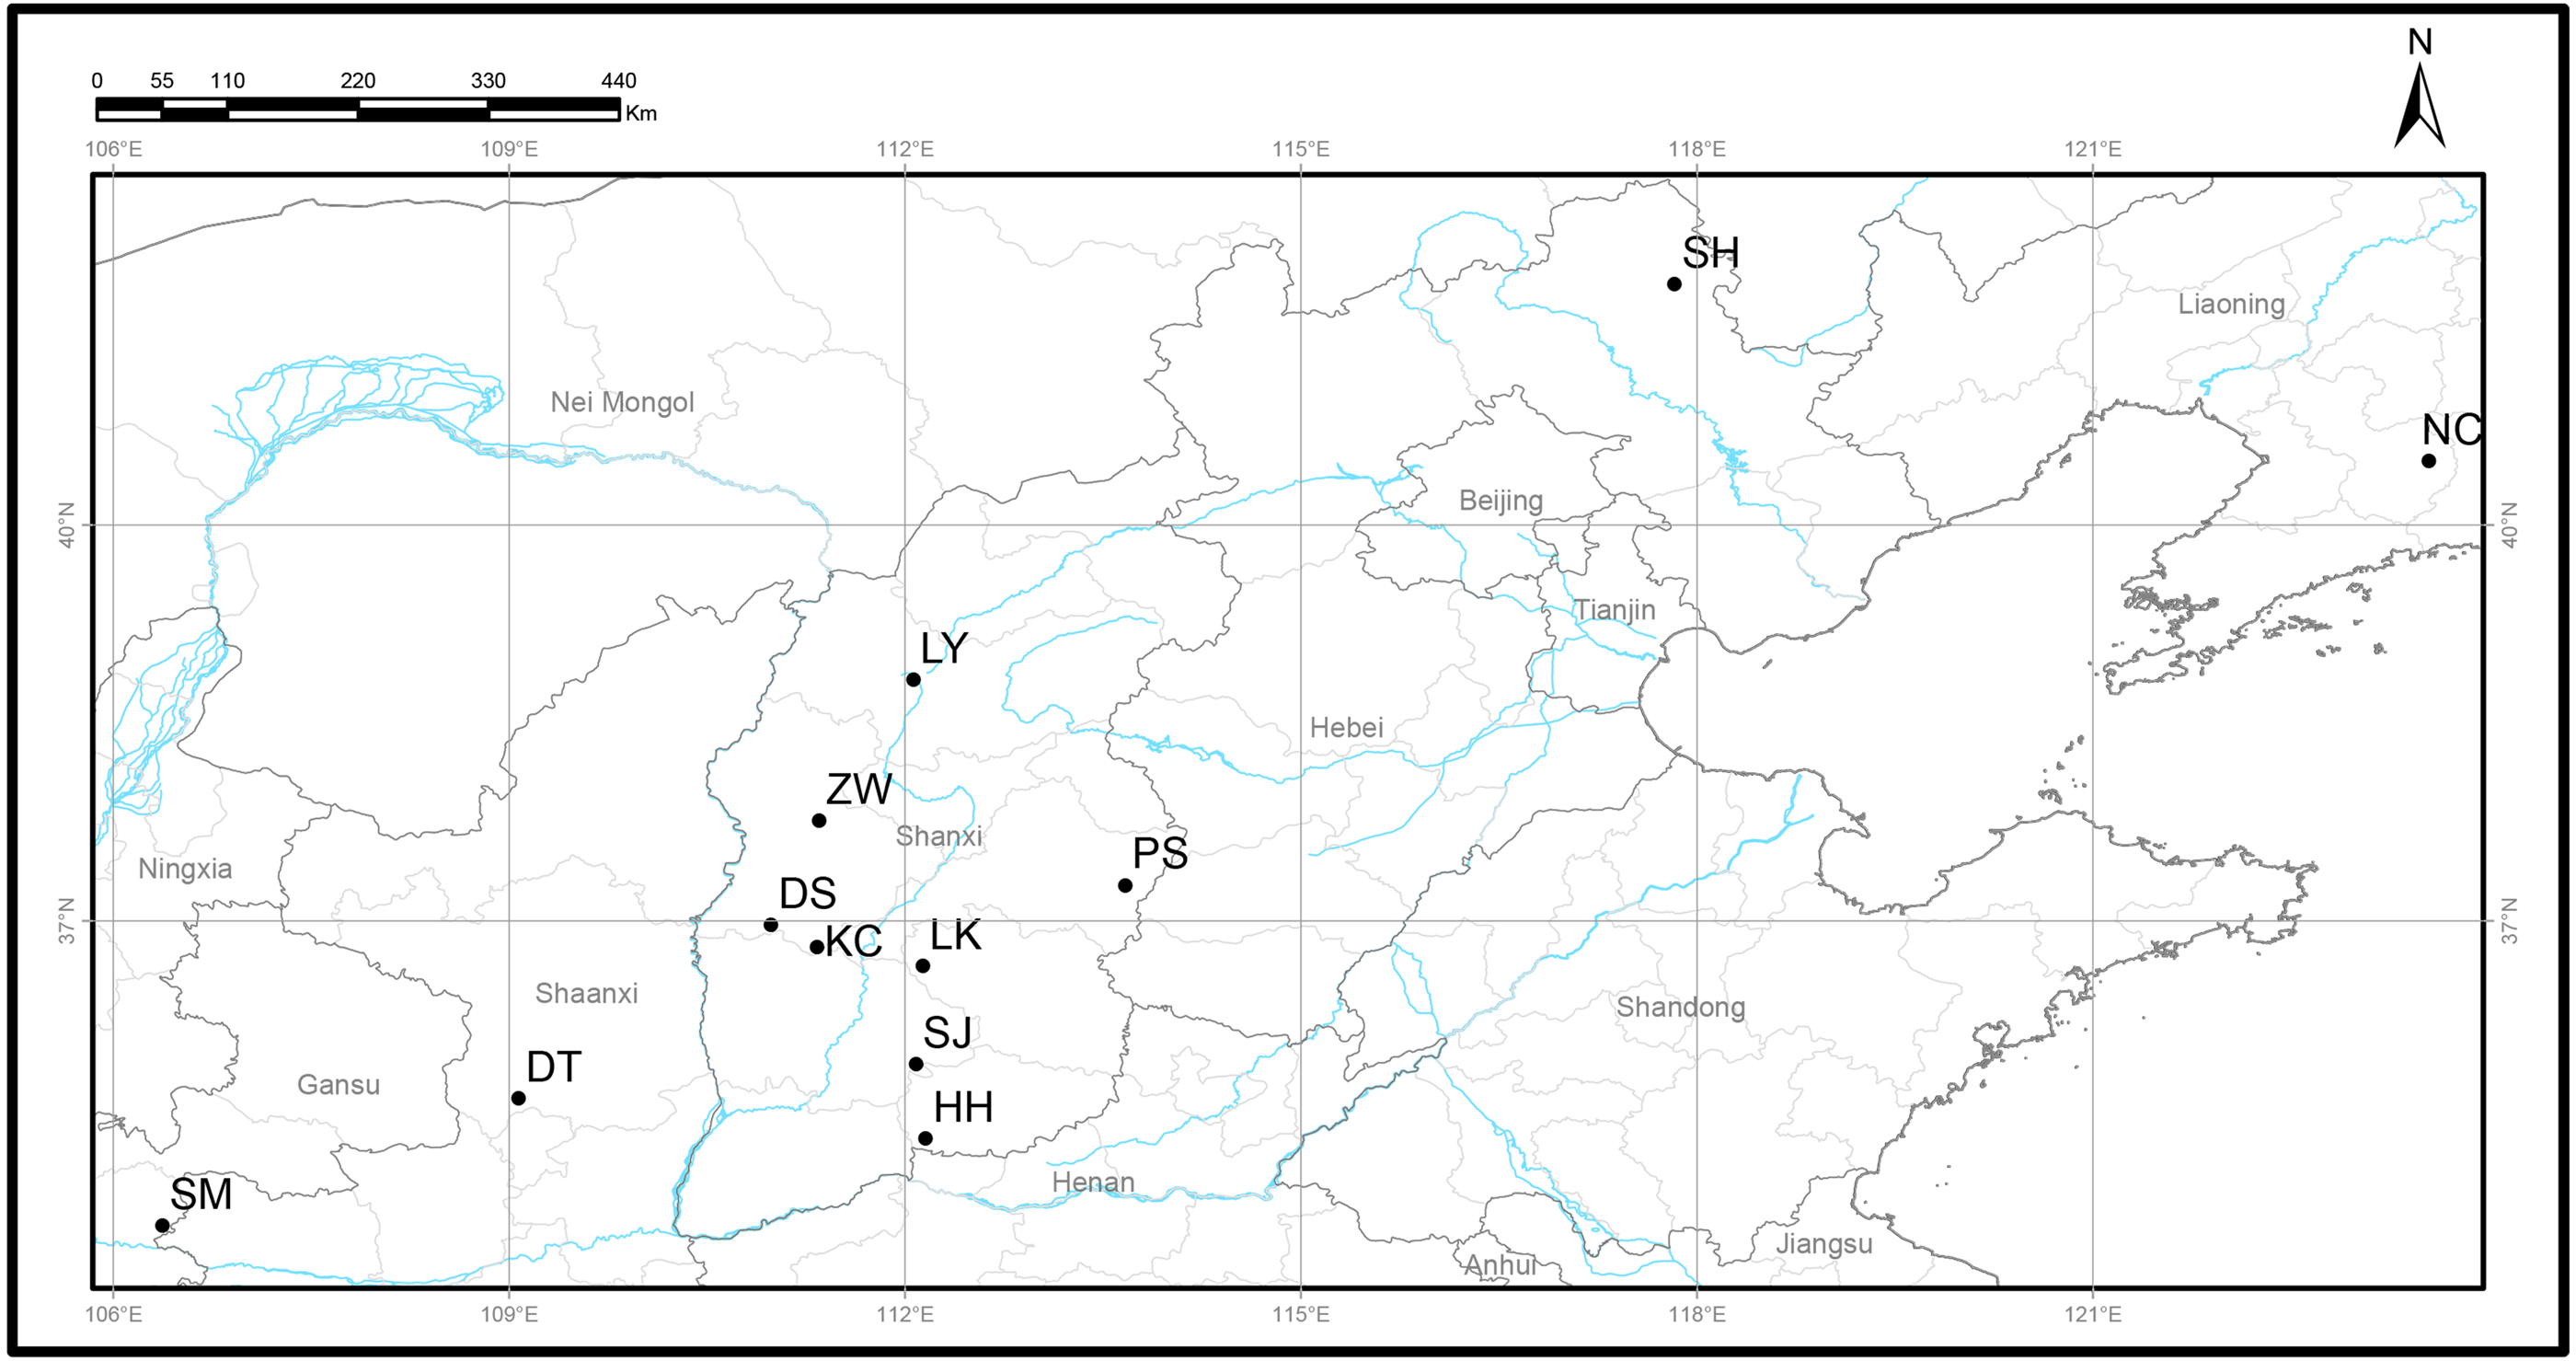
| Populations | ID | Sample size | Longitude (°E) |
Latitude (°N) |
Elevation (m) |
|---|---|---|---|---|---|
| Pingsong, Shanxi | PS | 10 | 113.67 | 37.27 | 1,250–1,361 |
| Luyashan, Shanxi | LY | 10 | 112.06 | 38.83 | 1,593–1,743 |
| Kangcheng, Shanxi | KC | 10 | 111.33 | 36.81 | 1,109–1,195 |
| Henghe, Shanxi | HH | 10 | 112.15 | 35.36 | 1,048–1,277 |
| Linkongshan, Shanxi | LK | 10 | 112.13 | 36.66 | 1,182–1,302 |
| Dongshan, Shanxi | DS | 10 | 110.98 | 36.97 | 1,383–1,494 |
| Sanjiao, Shanxi | SJ | 10 | 112.08 | 35.92 | 1,085–1,146 |
| Zhenwushan, Shanxi | ZW | 10 | 111.35 | 37.77 | 1,352–1,434 |
| Shanmen, Gansu | SM | 10 | 106.37 | 34.69 | 1,625–1,725 |
| Siheyong, Hebei | SH | 10 | 117.83 | 41.83 | 1,025–1,280 |
| Diantou, Shaanxi | DT | 10 | 109.07 | 35.66 | 968–1,051 |
| Nancigou, Liaoning | NC | 10 | 123.54 | 40.49 | 118–224 |
| Locus | Repeat motif | Size range (bp) | Na | Ne | I | Ho | He | Fst | Nm | PIC | Labela | Source |
|---|---|---|---|---|---|---|---|---|---|---|---|---|
| bcqm41 | (GT)30(AT)2 | 123–177 | 21 | 7.010 | 2.334 | 0.840 | 0.857 | 0.042 | 5.702 | 0.959 | FAM | Mishima et al. (2006) |
| bcqm42 | (GT)11 | 128–154 | 10 | 5.102 | 1.862 | 0.795 | 0.804 | 0.072 | 3.222 | 0.929 | FAM | Mishima et al. (2006) |
| bcqm50 | (AC)8 | 113–125 | 7 | 2.989 | 1.330 | 0.571 | 0.666 | 0.018 | 13.639 | 0.893 | FAM | Mishima et al. (2006) |
| bcqm74 | (TG)10 | 141–175 | 12 | 6.245 | 2.065 | 0.517 | 0.840 | 0.020 | 12.250 | 0.932 | HEX | Mishima et al. (2006) |
| bcqm76 | (GT)7 | 182–222 | 17 | 7.051 | 2.196 | 0.420 | 0.858 | 0.021 | 11.655 | 0.951 | HEX | Mishima et al. (2006) |
| bcqm94 | (AC)9 | 142–160 | 10 | 3.882 | 1.596 | 0.782 | 0.742 | 0.040 | 6.000 | 0.922 | FAM | Mishima et al. (2006) |
| bcqm96 | (AGT)2(GT)8 | 115–139 | 12 | 3.277 | 1.504 | 0.698 | 0.695 | 0.008 | 31.000 | 0.931 | FAM | Mishima et al. (2006) |
| bcqm325 | (AC)10 | 104–122 | 10 | 4.090 | 1.696 | 0.563 | 0.756 | 0.009 | 27.528 | 0.922 | FAM | Mishima et al. (2006) |
| MSQ4 | (AG)12 | 213–255 | 17 | 7.225 | 2.296 | 0.523 | 0.862 | 0.020 | 12.250 | 0.963 | HEX | Dow, Ashley & Howe (1995) |
| MSQ13 | (GA)29 | 213–259 | 14 | 4.568 | 1.801 | 0.725 | 0.781 | 0.027 | 9.009 | 0.940 | HEX | Dow, Ashley & Howe (1995) |
| ssrQrZAG7 | (TC)17 | 132–172 | 19 | 11.470 | 2.610 | 0.775 | 0.913 | 0.015 | 16.417 | 0.956 | FAM | Kampfer et al. (1998) |
| ssrQrZAG87 | (TC)20 | 117–175 | 20 | 4.443 | 2.027 | 0.633 | 0.775 | 0.036 | 6.694 | 0.935 | FAM | Kampfer et al. (1998) |
| ssrQrZAG96 | (TC)20 | 157–213 | 22 | 12.961 | 2.750 | 0.808 | 0.923 | 0.013 | 18.981 | 0.961 | HEX | Kampfer et al. (1998) |
| ssrQrZAG101 | (TC)20(AG)15 | 153–191 | 18 | 3.008 | 1.680 | 0.558 | 0.668 | 0.050 | 4.750 | 0.963 | FAM | Kampfer et al. (1998) |
| ssrQrZAG112 | (GA)32 | 88–126 | 15 | 5.998 | 2.043 | 0.850 | 0.833 | 0.077 | 2.997 | 0.945 | FAM | Kampfer et al. (1998) |
| ssrQpZAG36 | (AG)19 | 218–256 | 14 | 3.878 | 1.710 | 0.583 | 0.742 | 0.056 | 4.214 | 0.939 | HEX | Steinkellner et al. (1997) |
| quru-GA-0C11 | (GA)15 | 214–250 | 20 | 8.549 | 2.431 | 0.833 | 0.883 | 0.032 | 7.563 | 0.957 | HEX | Aldrich et al. (2002) |
| Qden03032 | (CT)12 | 402–448 | 16 | 3.582 | 1.792 | 0.729 | 0.721 | 0.046 | 5.185 | 0.949 | HEX | Wang (2012) |
| Qden05011 | (CT)8 | 177–217 | 19 | 10.271 | 2.529 | 0.900 | 0.903 | 0.016 | 15.375 | 0.956 | HEX | Wang (2012) |
| Mean | 15.421 | 6.084 | 2.013 | 0.690 | 0.801 | 0.033 | 11.286 | 0.942 |
Notes:
- Na
-
number of alleles
- Ne
-
effect number of alleles
- I
-
Shannon’s information index
- Ho
-
observed heterozygosity
- He
-
expected heterozygosity
- Fst
-
genetic differentiation coefficient
- Nm
-
gene flow
- PIC
-
polymorphism information content
Data analysis
POPGENE version 1.32 software (Yeh et al., 1997) was used to calculate the genetic diversity parameters, such as the number of alleles (Na), the effective number of alleles (Ne), observed heterozygosity (Ho), expected heterozygosity (He), and Shannon’s information index (I). Deviation from Hardy-Weinberg proportions (HWP) was investigated in each population at a single locus (Excoffier & Lischer, 2010), and genotyping errors were screened using Micro-checker software 2.2.3 (Van et al., 2004). Polymorphic information content (PIC) at each locus was calculated according to the following formula Eq. (1): (1) (Botstein et al., 1980), where P is the frequency of the jth allele for the ith marker summed over “n” alleles. The genetic differentiation coefficient (Fst) of each locus and the matrix among 12 Q. liaotungensis populations were calculated using FSTAT version2.9.3 software (Goudet, 2001). Gene flow (Nm) was evaluated using the following formula: Nm = (1 − Fst)/4Fst. Analysis of molecular variance (AMOVA) was performed among and within populations using GenAlEx version 6.5 software (Peakall & Smouse, 2012). A dendrogram was constructed using an unweighted pair-group method with arithmetic means (UPGMA) algorithm based on Nei’s genetic distance among populations using the NTSYS version 2.1 software (Rohlf, 2000). The correlation between genetic distance and geographical distance was detected using the Mantel test (Manel et al., 2003) with 1,000 permutations using GenAlEx software. To test the effects of the physical barrier among 12 Q. liaotungensis populations, the geographical location of each population was investigated by space Monmonier’s maximum difference algorithm (Monmonier, 1973) using Barrier version 2.2 (Manni et al., 2004).
Climatic factors from 12 regions of Q. liaotungensis populations were obtained from the WorldClim database (https://www.worldclim.org/data/worldclim21.html) at 10 arc-min resolution using ArcGIS software version10.2. The clustering heat map of 19 climatic factors was drawn using Origin 2018 software. The correlation between genetic distance and climatic factors was detected by the Mantel test (Manel et al., 2003) with 1,000 permutations using GenAlEx software.
The clustering of genetic structure was performed using a Bayesian model with the STRUCTURE software package version 2.3.4 (Pritchard & Stephens, 2000). The admixture model was used to perform a Markov chain Monte Carlo (MCMC) simulation algorithm. The membership of each sample was run for a range of subpopulations from K = 1 to 10 (the calculation of each K value was repeated 10 times), and also for the length of the burn-in period and MCMC after setting the length to 100,000 and 200,000, respectively. The optimal K value was selected according to the deltaK criterion using the “STRUCTURE HARVESTER” online program with the method from Evanno (Earl & Bridgett, 2012; Evanno, Regnaut & Goudet, 2005). Analysis of each sample was performed with CLUMPP software version1.1.2 (Jakobsson & Rosenberg, 2007), and the relative proportions of the cluster in each population were plotted by the Arc-GIS software using geographical distribution diagram.
Results
Genetic diversity
We used 19 pairs of SSR primers to generate 293 alleles from 120 individuals of 12 Q. liaotungensis populations (Table 2). The results showed an average value of 15.421 for all alleles ranging from 7.000 (bcqm50) to 22.000 (ssrQrZAG96). The effective number of alleles (Ne) for each locus ranged from 2.989 (bcqm50) to 12.961 (ssrQrZAG96), with an average of 6.084. The observed heterozygosity (Ho) for each locus varied from 0.420 (bcqm76) to 0.900 (Qden05011), with an average of 0.690, whereas the expected heterozygosity (He) ranged from 0.666 (bcqm50) to 0.923 (ssrQrZAG96), with an average of 0.801. Shannon’s information index (I) ranged from 1.330 (bcqm50) to 2.750 (ssrQrZAG96), with an average of 2.013. The genetic differentiation coefficient (Fst) (0.008(bcqm96)–0.077(ssrQrZAG112)) and polymorphic information content (PIC) (0.893(bcqm50)–0.963(ssrQrZAG101)) were detected at all loci. Gene flow (Nm) varied from 2.997 in locus ssrQrZAG112 to 31.000 in locus bcqm96, with an average of 11.286. 19 loci were accorded with Hardy-Weinberg proportions(HWP).
The genetic diversity of 12 Q. liaotungensis populations was shown in Table 3. The average number of alleles (Na) was 6.781, and it varied from 6.316 for the SH population to 7.474 for the NC population, whereas the average effective number of alleles (Ne) was 4.477, ranging from 3.819 for the SH population to 5.224 for the NC population. Shannon’s information index (I) varied from 1.498 for the SH population to 1.753 for the NC population, with a mean of 1.599. Mean value of observed heterozygosity (Ho = 0.688) were less than that of expected heterozygosity (He = 0.737). The mean value of fixation index (Fis) was 0.067, ranging from 0.062 for the DT population to 0.324 for the SH population, and Q. liaotungensis populations accorded with HWP, except for the SH population. Among them, the NC population had the highest genetic diversity parameters (Na, Ne, He, and I), whereas the SH population had the lowest. Thus, by comparison, the NC population showed the highest level of genetic diversity.
| Population | Na | Ne | I | Ho | He | Fis |
|---|---|---|---|---|---|---|
| PS | 7.000 | 4.629 | 1.636 | 0.732 | 0.749 | 0.067 |
| HH | 7.053 | 4.594 | 1.631 | 0.687 | 0.743 | 0.096 |
| LY | 7.316 | 4.770 | 1.695 | 0.712 | 0.764 | 0.093 |
| SJ | 6.579 | 4.486 | 1.561 | 0.650 | 0.726 | 0.145 |
| KC | 6.368 | 4.268 | 1.522 | 0.705 | 0.713 | 0.041 |
| LK | 6.368 | 4.247 | 1.534 | 0.664 | 0.718 | 0.069 |
| DS | 6.421 | 4.322 | 1.561 | 0.689 | 0.729 | 0.104 |
| SM | 6.842 | 4.488 | 1.583 | 0.625 | 0.724 | 0.171 |
| ZW | 7.000 | 4.637 | 1.647 | 0.632 | 0.749 | 0.193 |
| DT | 6.632 | 4.243 | 1.570 | 0.702 | 0.725 | 0.062 |
| NC | 7.474 | 5.224 | 1.753 | 0.726 | 0.786 | 0.083 |
| SH | 6.316 | 3.819 | 1.498 | 0.737 | 0.714 | 0.324a |
| Mean | 6.781 | 4.477 | 1.599 | 0.688 | 0.737 | 0.067 |
Notes:
- Na
-
number of alleles
- Ne
-
effect number of alleles
- I
-
Shannon’s information index
- Ho
-
observed heterozygosity
- He
-
expected heterozygosity
- Fis
-
fixation index
Genetic differentiation
The genetic differentiation was low and moderate among populations when the Fst value was between 0.00–0.05 and 0.05–0.15, respectively, and the Fst value more than 0.15 showed a high genetic differentiation (Wright, 1965). The genetic differentiation detected at the species level by FSTAT among 12 Q. liaotungensis populations was low (Fst = 0.033, p < 0.05), the average gene flow (Nm) was 11.286, which showed that the gene frequently changed among the 12 Q. liaotungensis populations. The relatively high level of gene flow was consistent with the low level of genetic differentiation. AMOVA showed that 94.5% of the genetic variation was found within 12 Q. liaotungensis populations, and only 5.5% of the variation occurred among 12 Q. liaotungensis populations (Table S1). The result was consistent with that of Fst, implying that the genetic differentiation of Q. liaotungensis mainly existed within populations. The matrix of Fst was estimated between two populations (Table S3), and the results showed that the genetic differentiation coefficient was the largest (Fst = 0.133) between KC and SH populations.
Genetic structure of the population
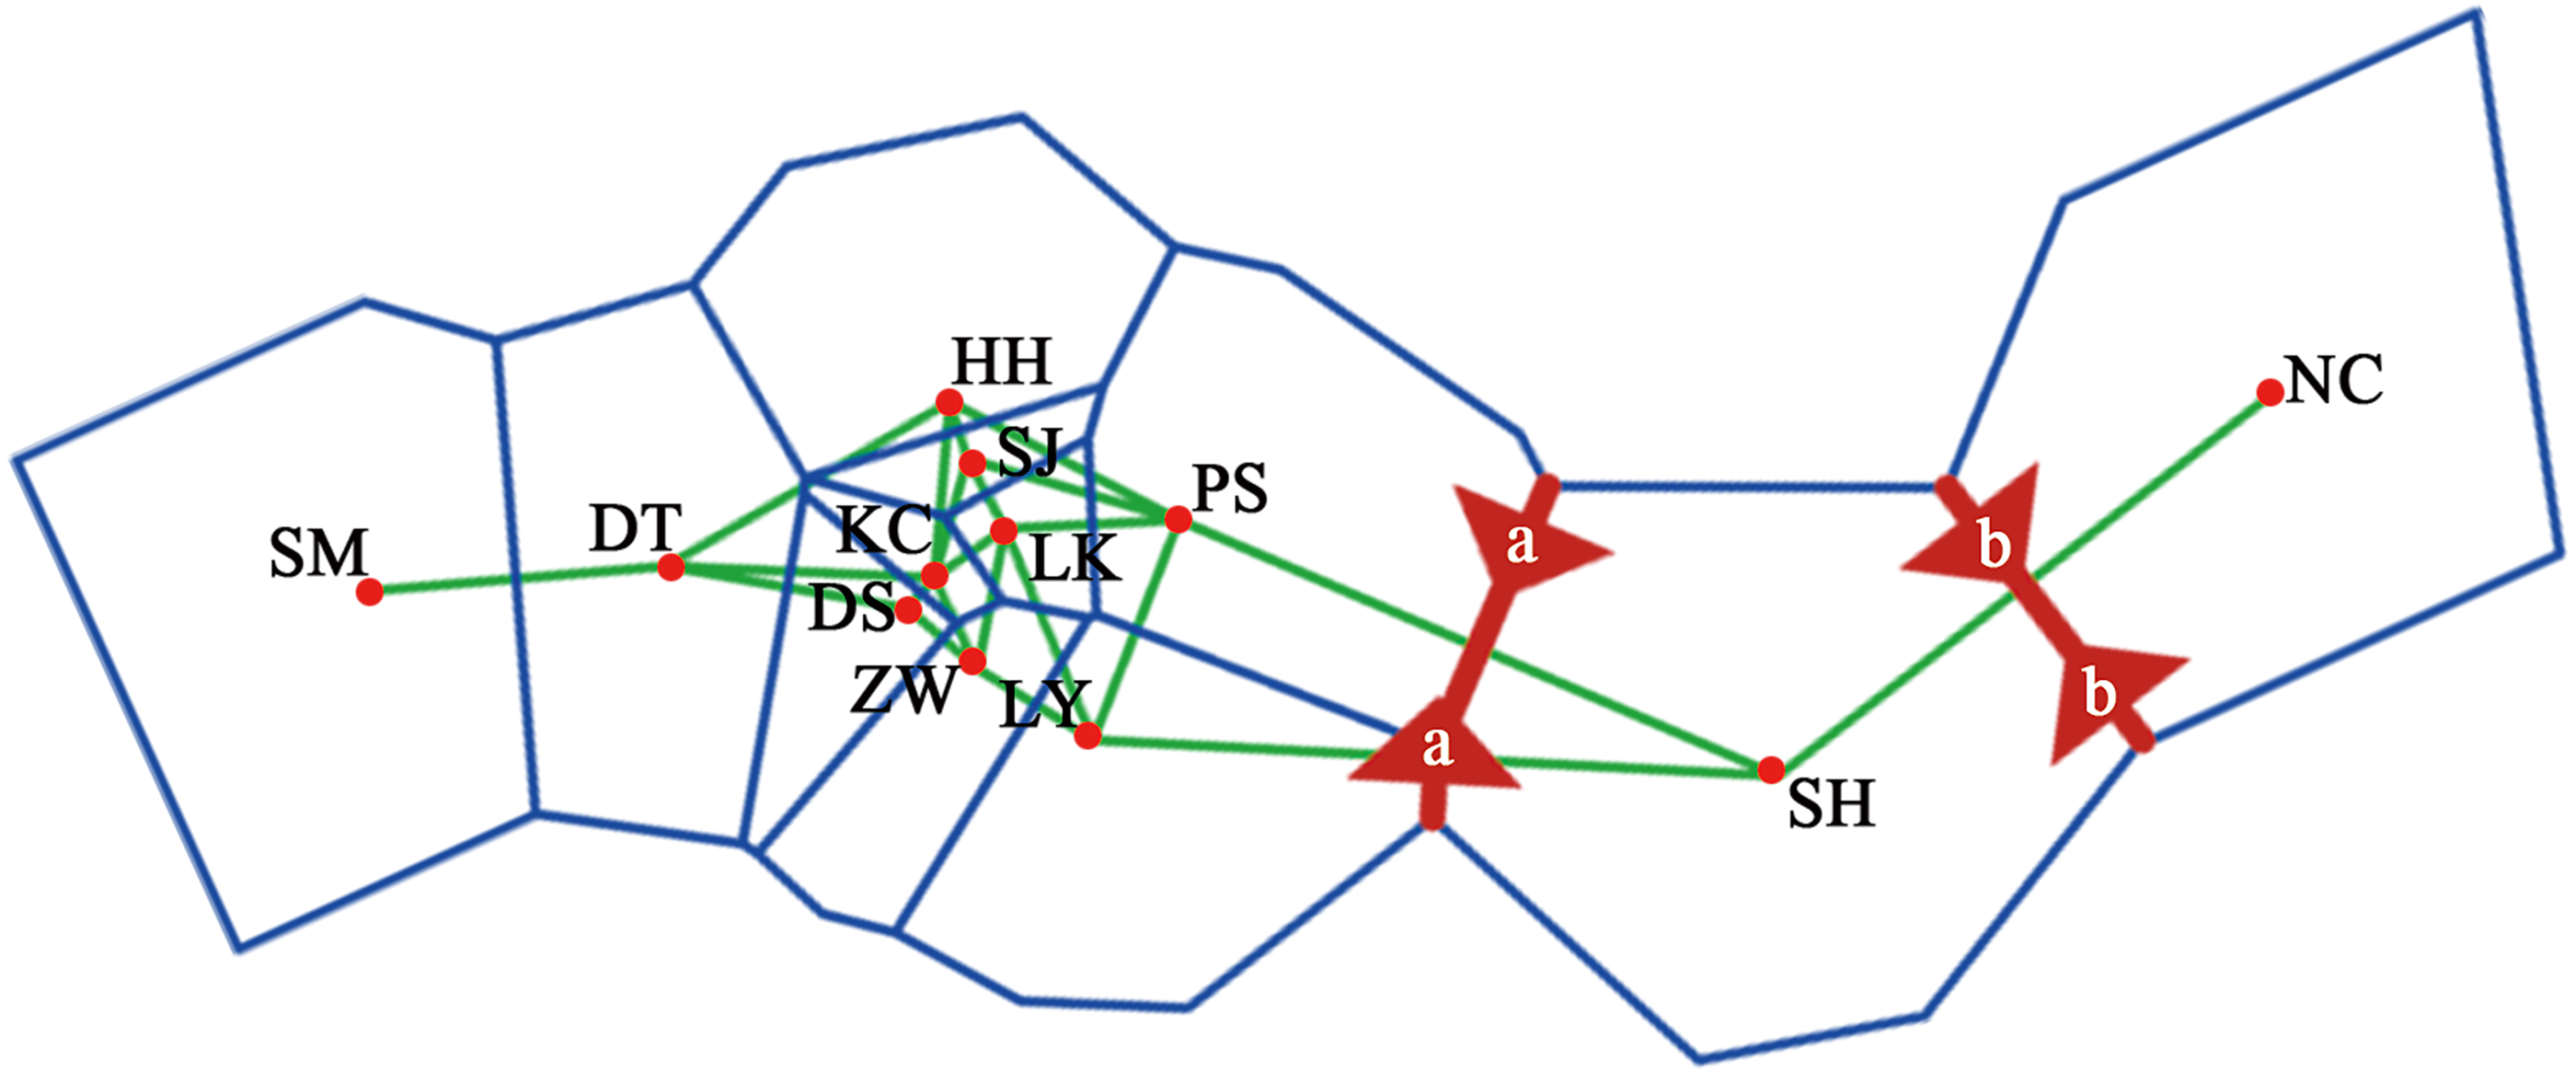
A dendrogram of 12 Q. liaotungensis populations was generated based on Nei’s genetic distances using the Unweighted Pair Group Method with Arithmetic Mean (UPGMA) method (Fig. 2A, Table S2). The Q. liaotungensis populations under a coefficient of 0.2 can be divided into 3 clusters: SH population (cluster I), NC population (clusterI I), and other 10 populations (cluster I I I). The result of the Mantel test was significant for Nei’s genetic and geographical distances of 12 Q. liaotungensis populations (Fig. 2B), indicating that Nei’s genetic distance was correlated with geographic distance (r = 0.638, p = 0.028). Analyses of the physical barrier between the 12 Q. liaotungensis populations supported the two boundaries shown in Fig. 3. The boundary a, between PS and SH population, isolated the SH population and others 10 Q. liaotungensis populations. The boundary b separated NC and SH population.
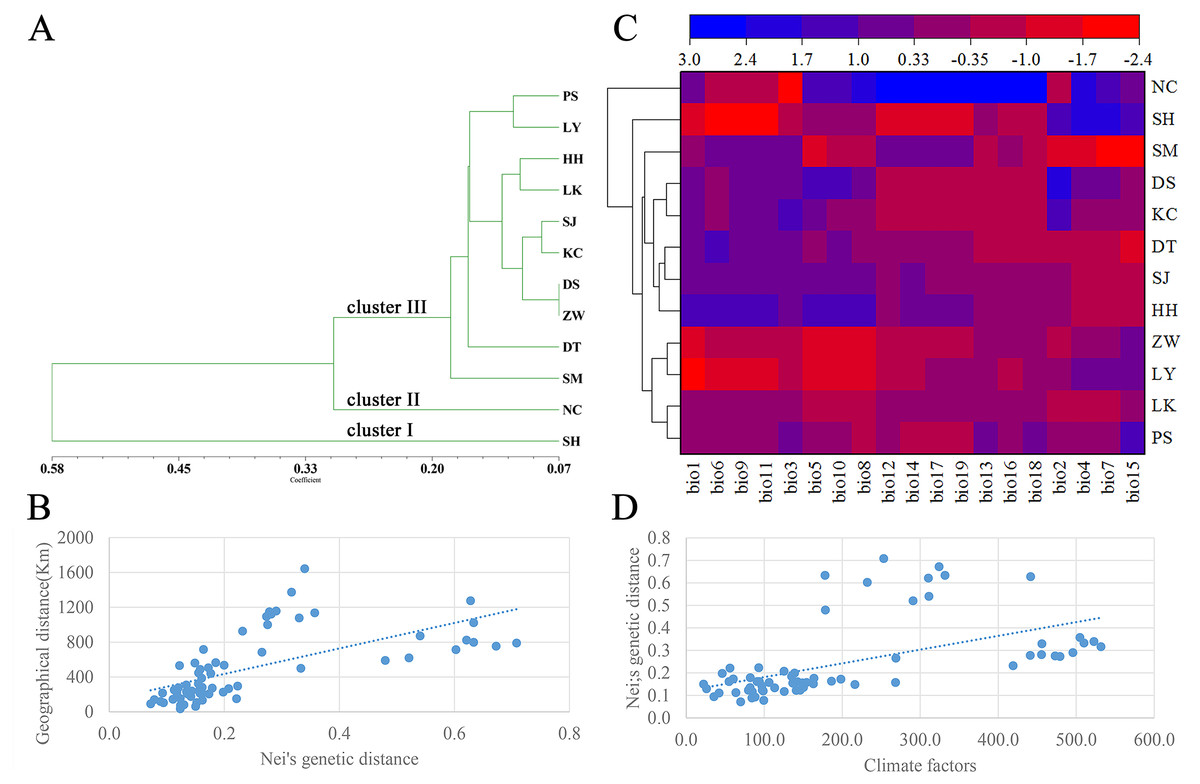
Figure 2: Genetic structure of the population.
(A) Cluster analysis of 12 Q. liaotungensis populations based on Nei’s genetic distance. (B) Mantel test between Nei’s genetic distance and geographical distance of 12 Q. liaotungensis populations. (C) Cluster heat map analysis of 12 Q. liaotungensis populations based on 19 climate factors. (D) Mantel test between Nei’s genetic distance and climatic factors of 12 Q. liaotungensis populations. bio1: Annual mean temperature; bio2: Mean Diurnal Range; bio3: Isothermality; bio4: temperature seasonality; bio5: max temperature of the warmest month; bio6: min temperature of the coldest month; bio7: annual temperature range; bio8: mean temperature of the wettest quarter; bio9: mean temperature of the driest quarter; bio10: mean temperature of the warmest quarter; bio11: mean temperature of the coldest quarter; bio12: precipitation factors: annual precipitation; bio13: precipitation of wettest month; bio14: precipitation of the driest month; bio15: precipitation seasonality; bio16: precipitation of wettest quarter; bio17: precipitation of driest quarter; bio18: precipitation of warmest quarter; bio19: precipitation of coldest quarter.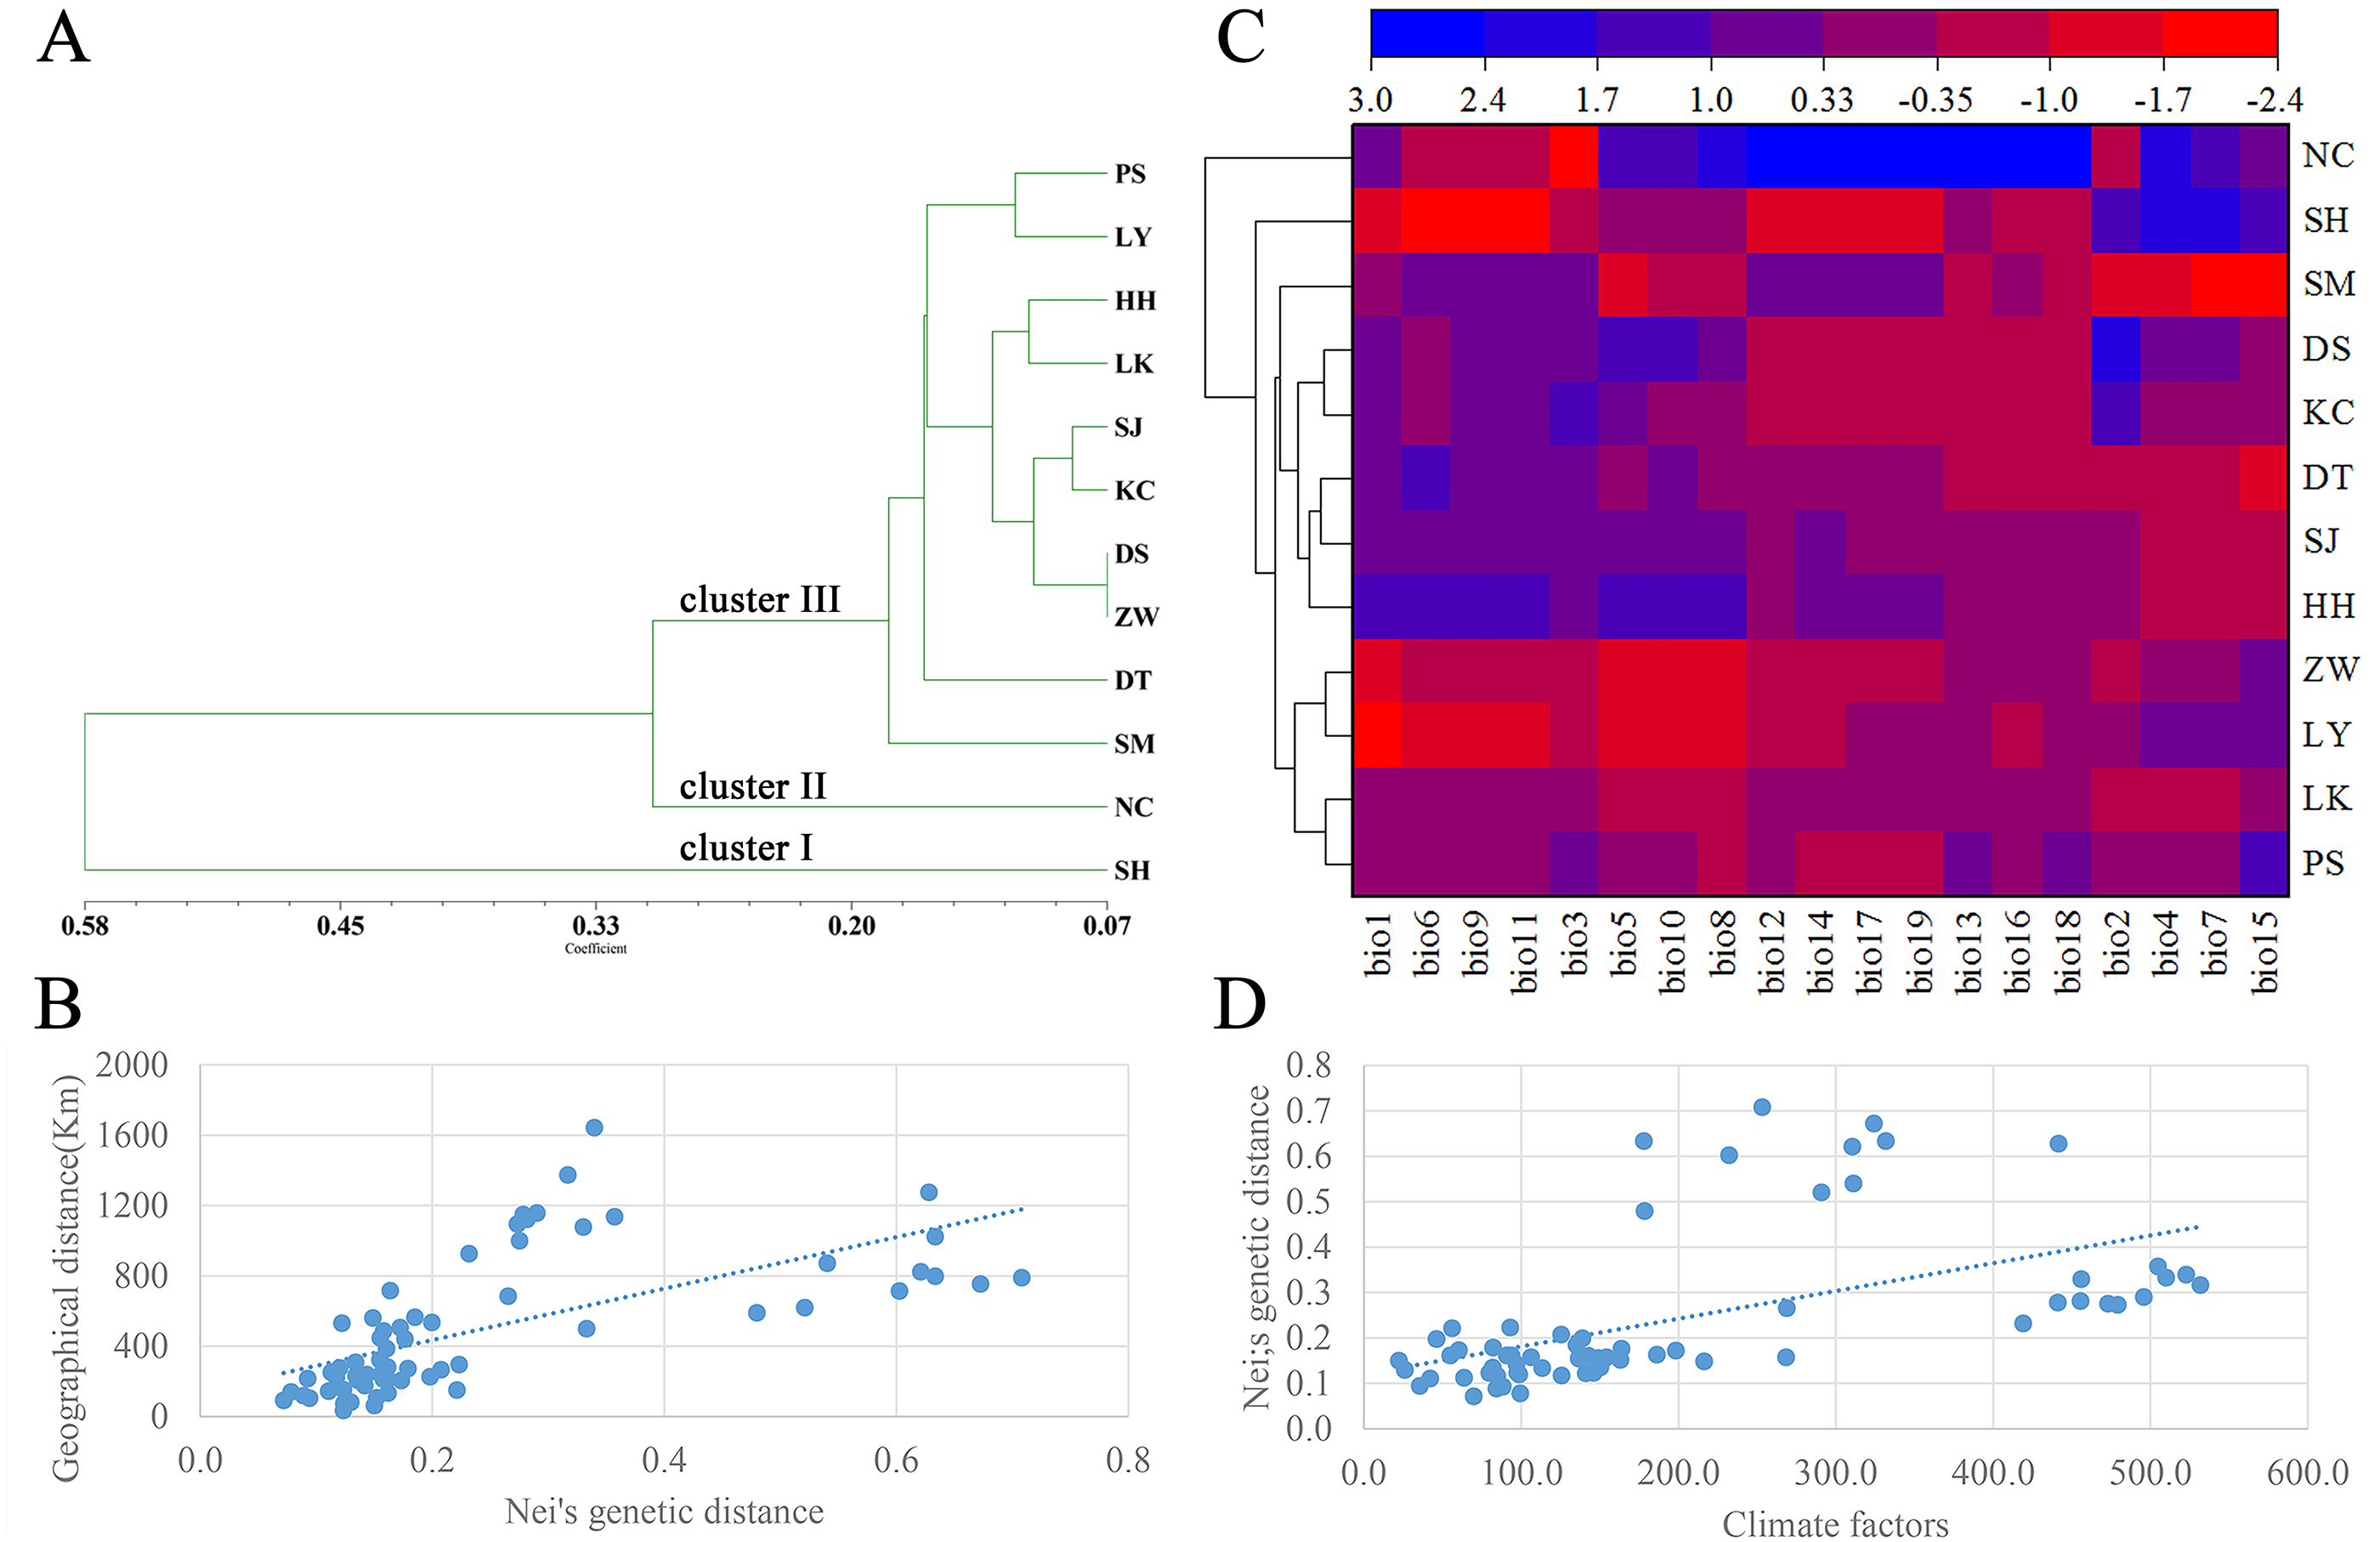
The cluster heat map of 12 Q. liaotungensis populations was constructed based on 19 climatic factors, as shown in Fig. 2C. The results showed that all of Q. liaotungensis populations were divided into 3 clusters, and the outcome was highly similar to the cluster analysis based on genetic distance, indicating that the genetic structure of Q. liaotungensis may be affected by climatic conditions. However, the result of the Mantel test between Nei’s genetic distance and climatic factors of 12 Q. liaotungensis populations was not significant (r = 0.544, p = 0.120) (Fig. 2D).
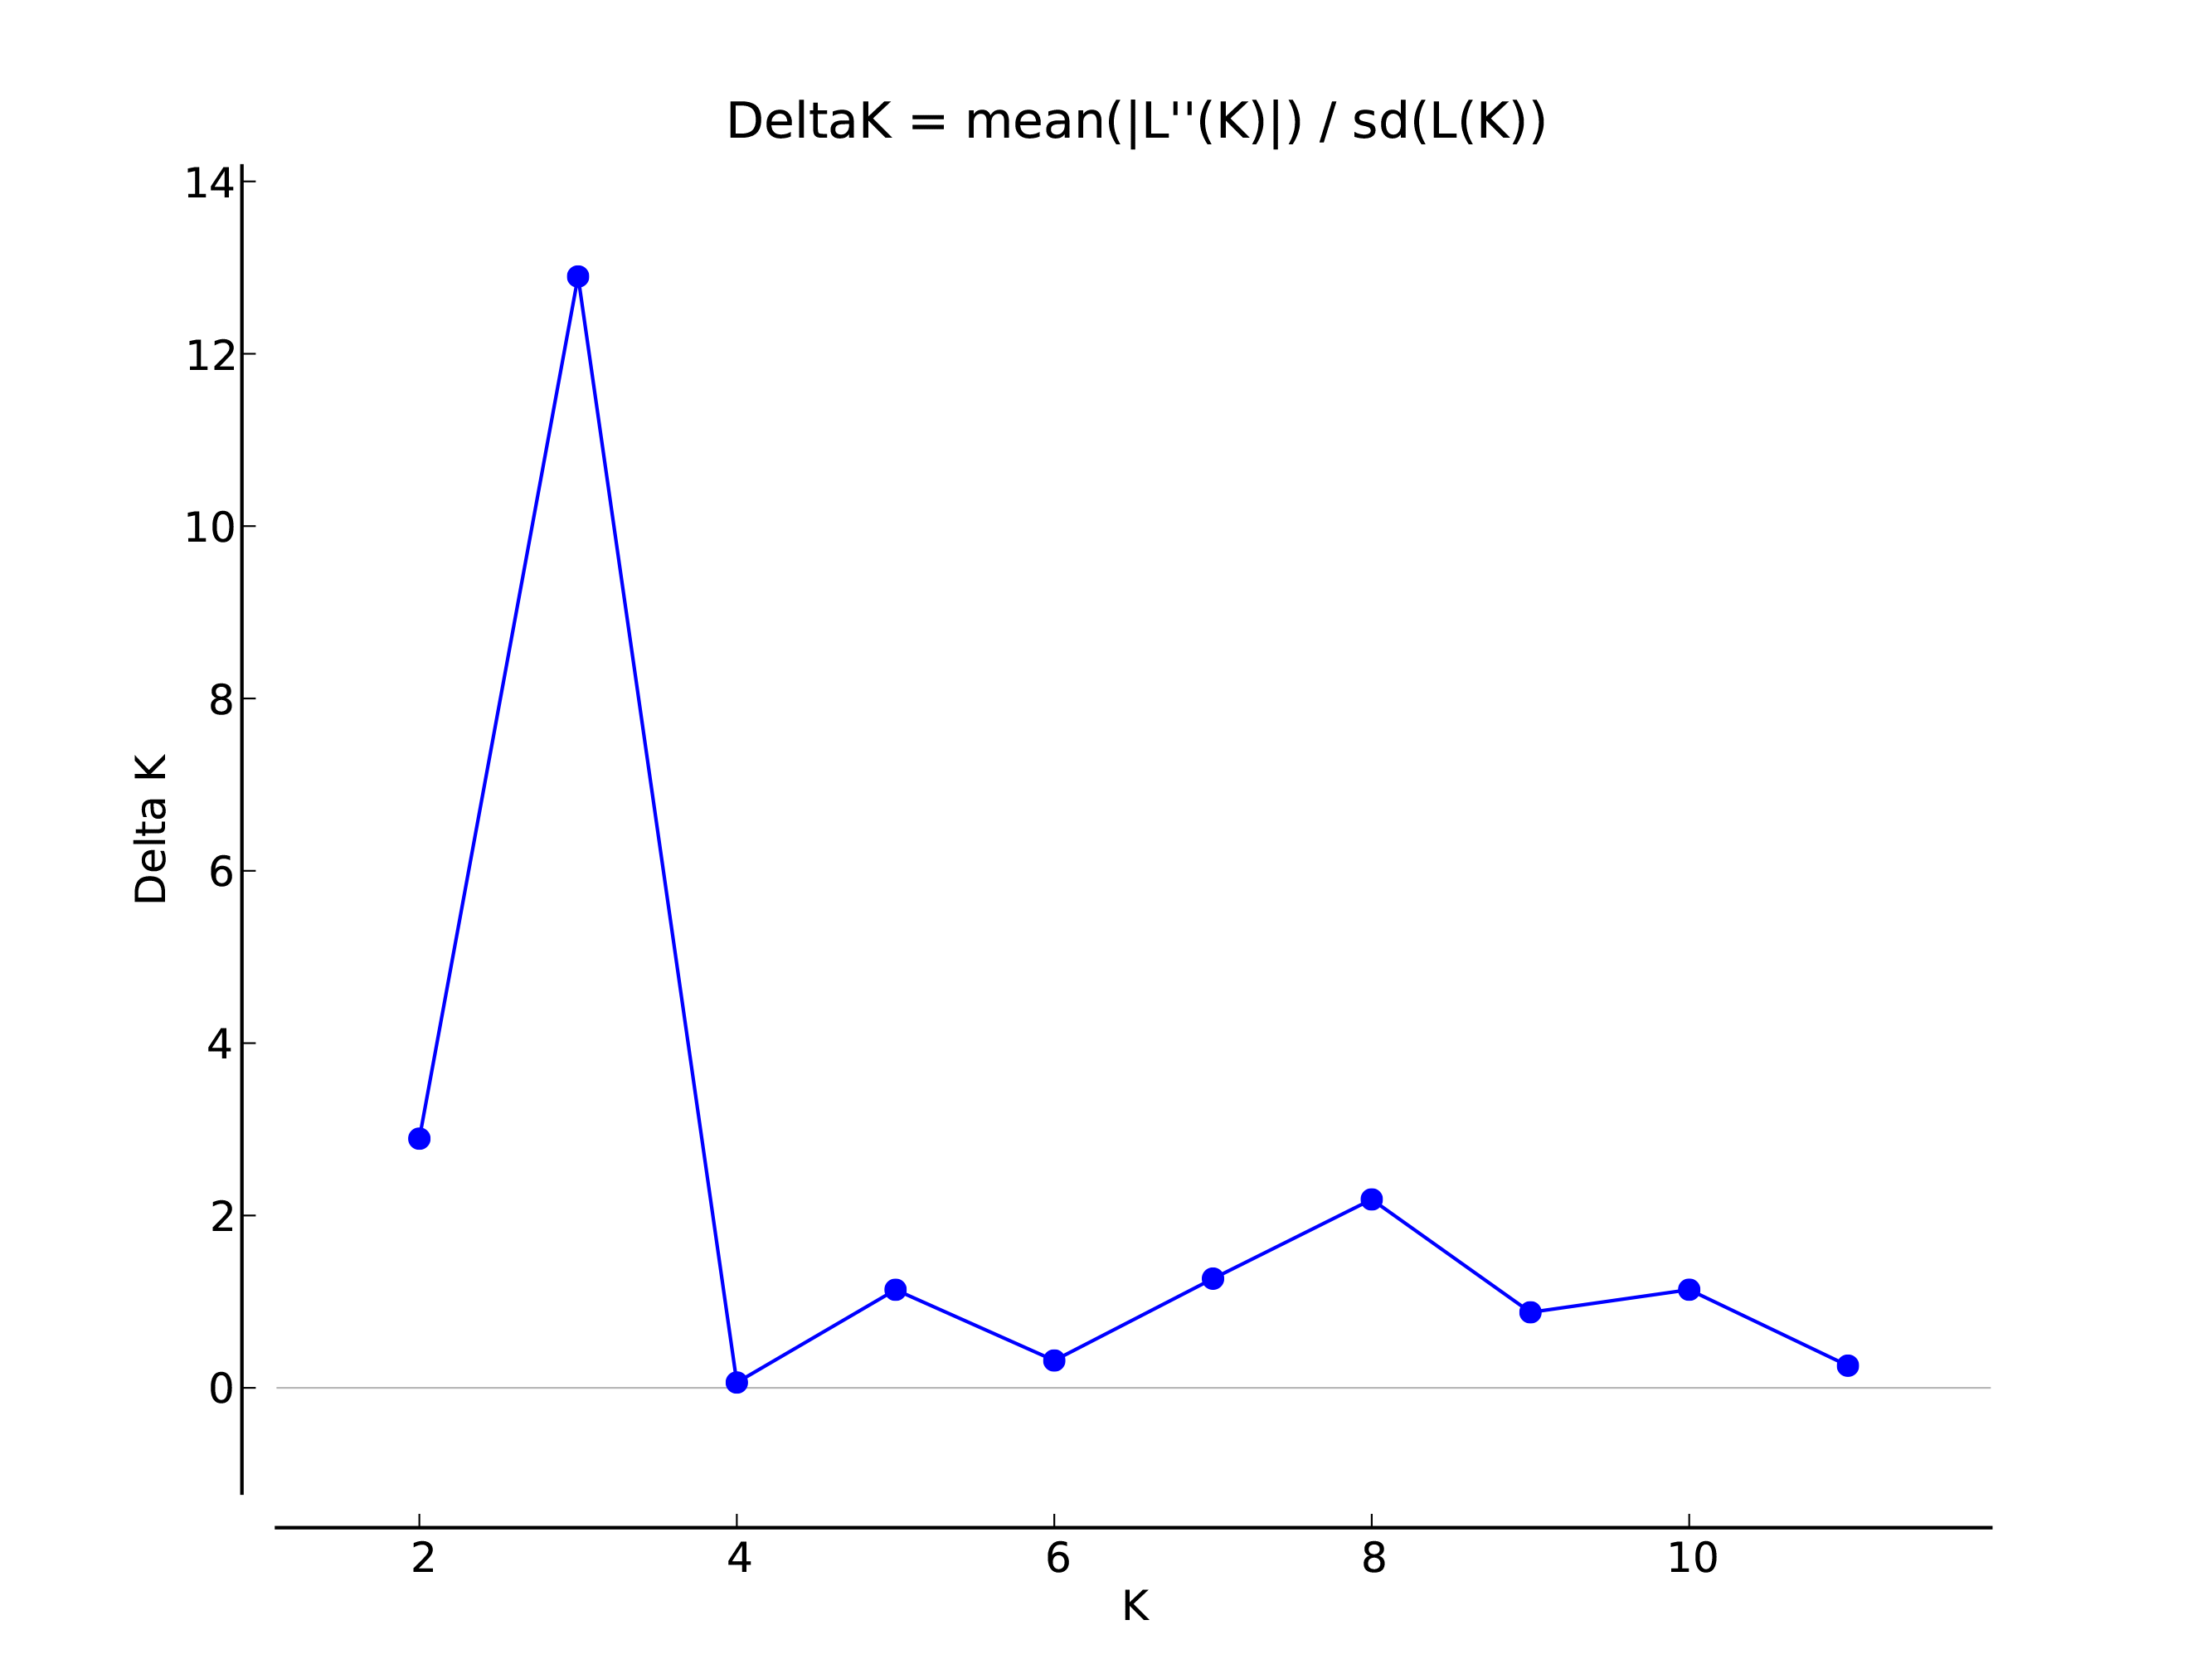
The genetic structure of Q. liaotungensis was analyzed with a Bayesian model using STRUCTURE software. The result showed that ΔK reached a maximum value when K = 3, indicating that 12 Q. liaotungensis populations can be divided into 3 subpopulations (Fig. S1). Different colors were used to indicate the proportion of cluster membership in each individual (Fig. 4A), and a visual comparison of the proportion of clusters in each population was performed based on Q values. (Fig. 4B). Geographical distribution was relatively straightforward, with the Liaodong Peninsula subpopulation (NC), Bashang Plateau subpopulation (SH), and Loess Plateau subpopulation (other 10 populations) exhibiting significant differences. For the Loess Plateau subpopulation, the first cluster (green) and the third cluster (blue) had a more significant proportion, whereas the second cluster (red) had a smaller proportion. Meanwhile, the second cluster (red) had a larger proportion in the Bashang Plateau subpopulation and the Liaodong Peninsula subpopulation.
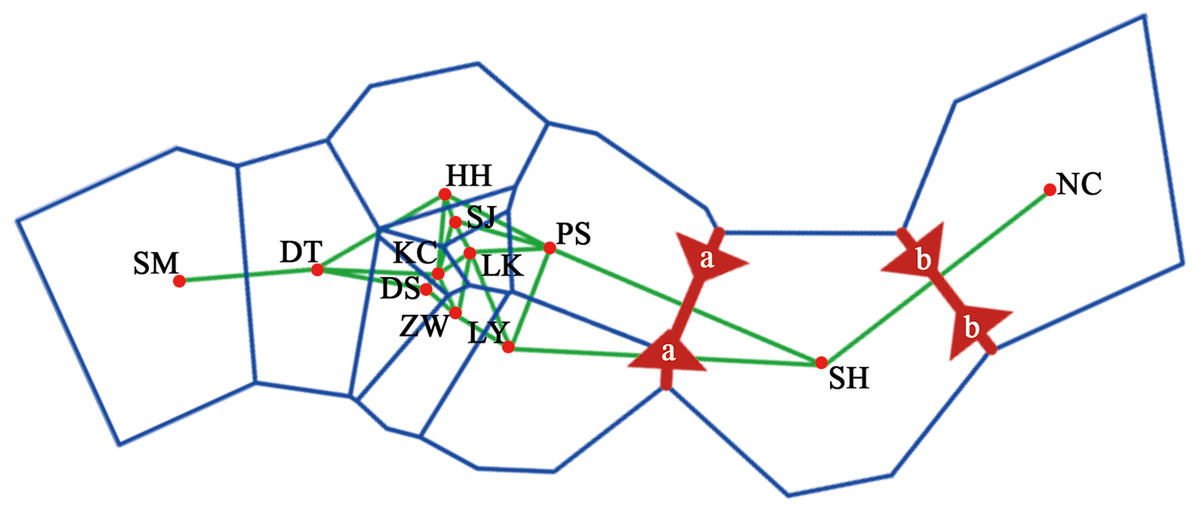
Figure 3: Physical barrier of 12 Q. liaotungensis populations predicted by BARRIER (version 2.2).

Figure 4: Genetic structure of the population using STRUCTURE analysis.
(A) Genetic structure of 12 Q. liaotungensis populations (K = 3). (B) Proportions of cluster memberships in each of 12 Q. liaotungensis populations (K = 3). Map credit: ©Esri.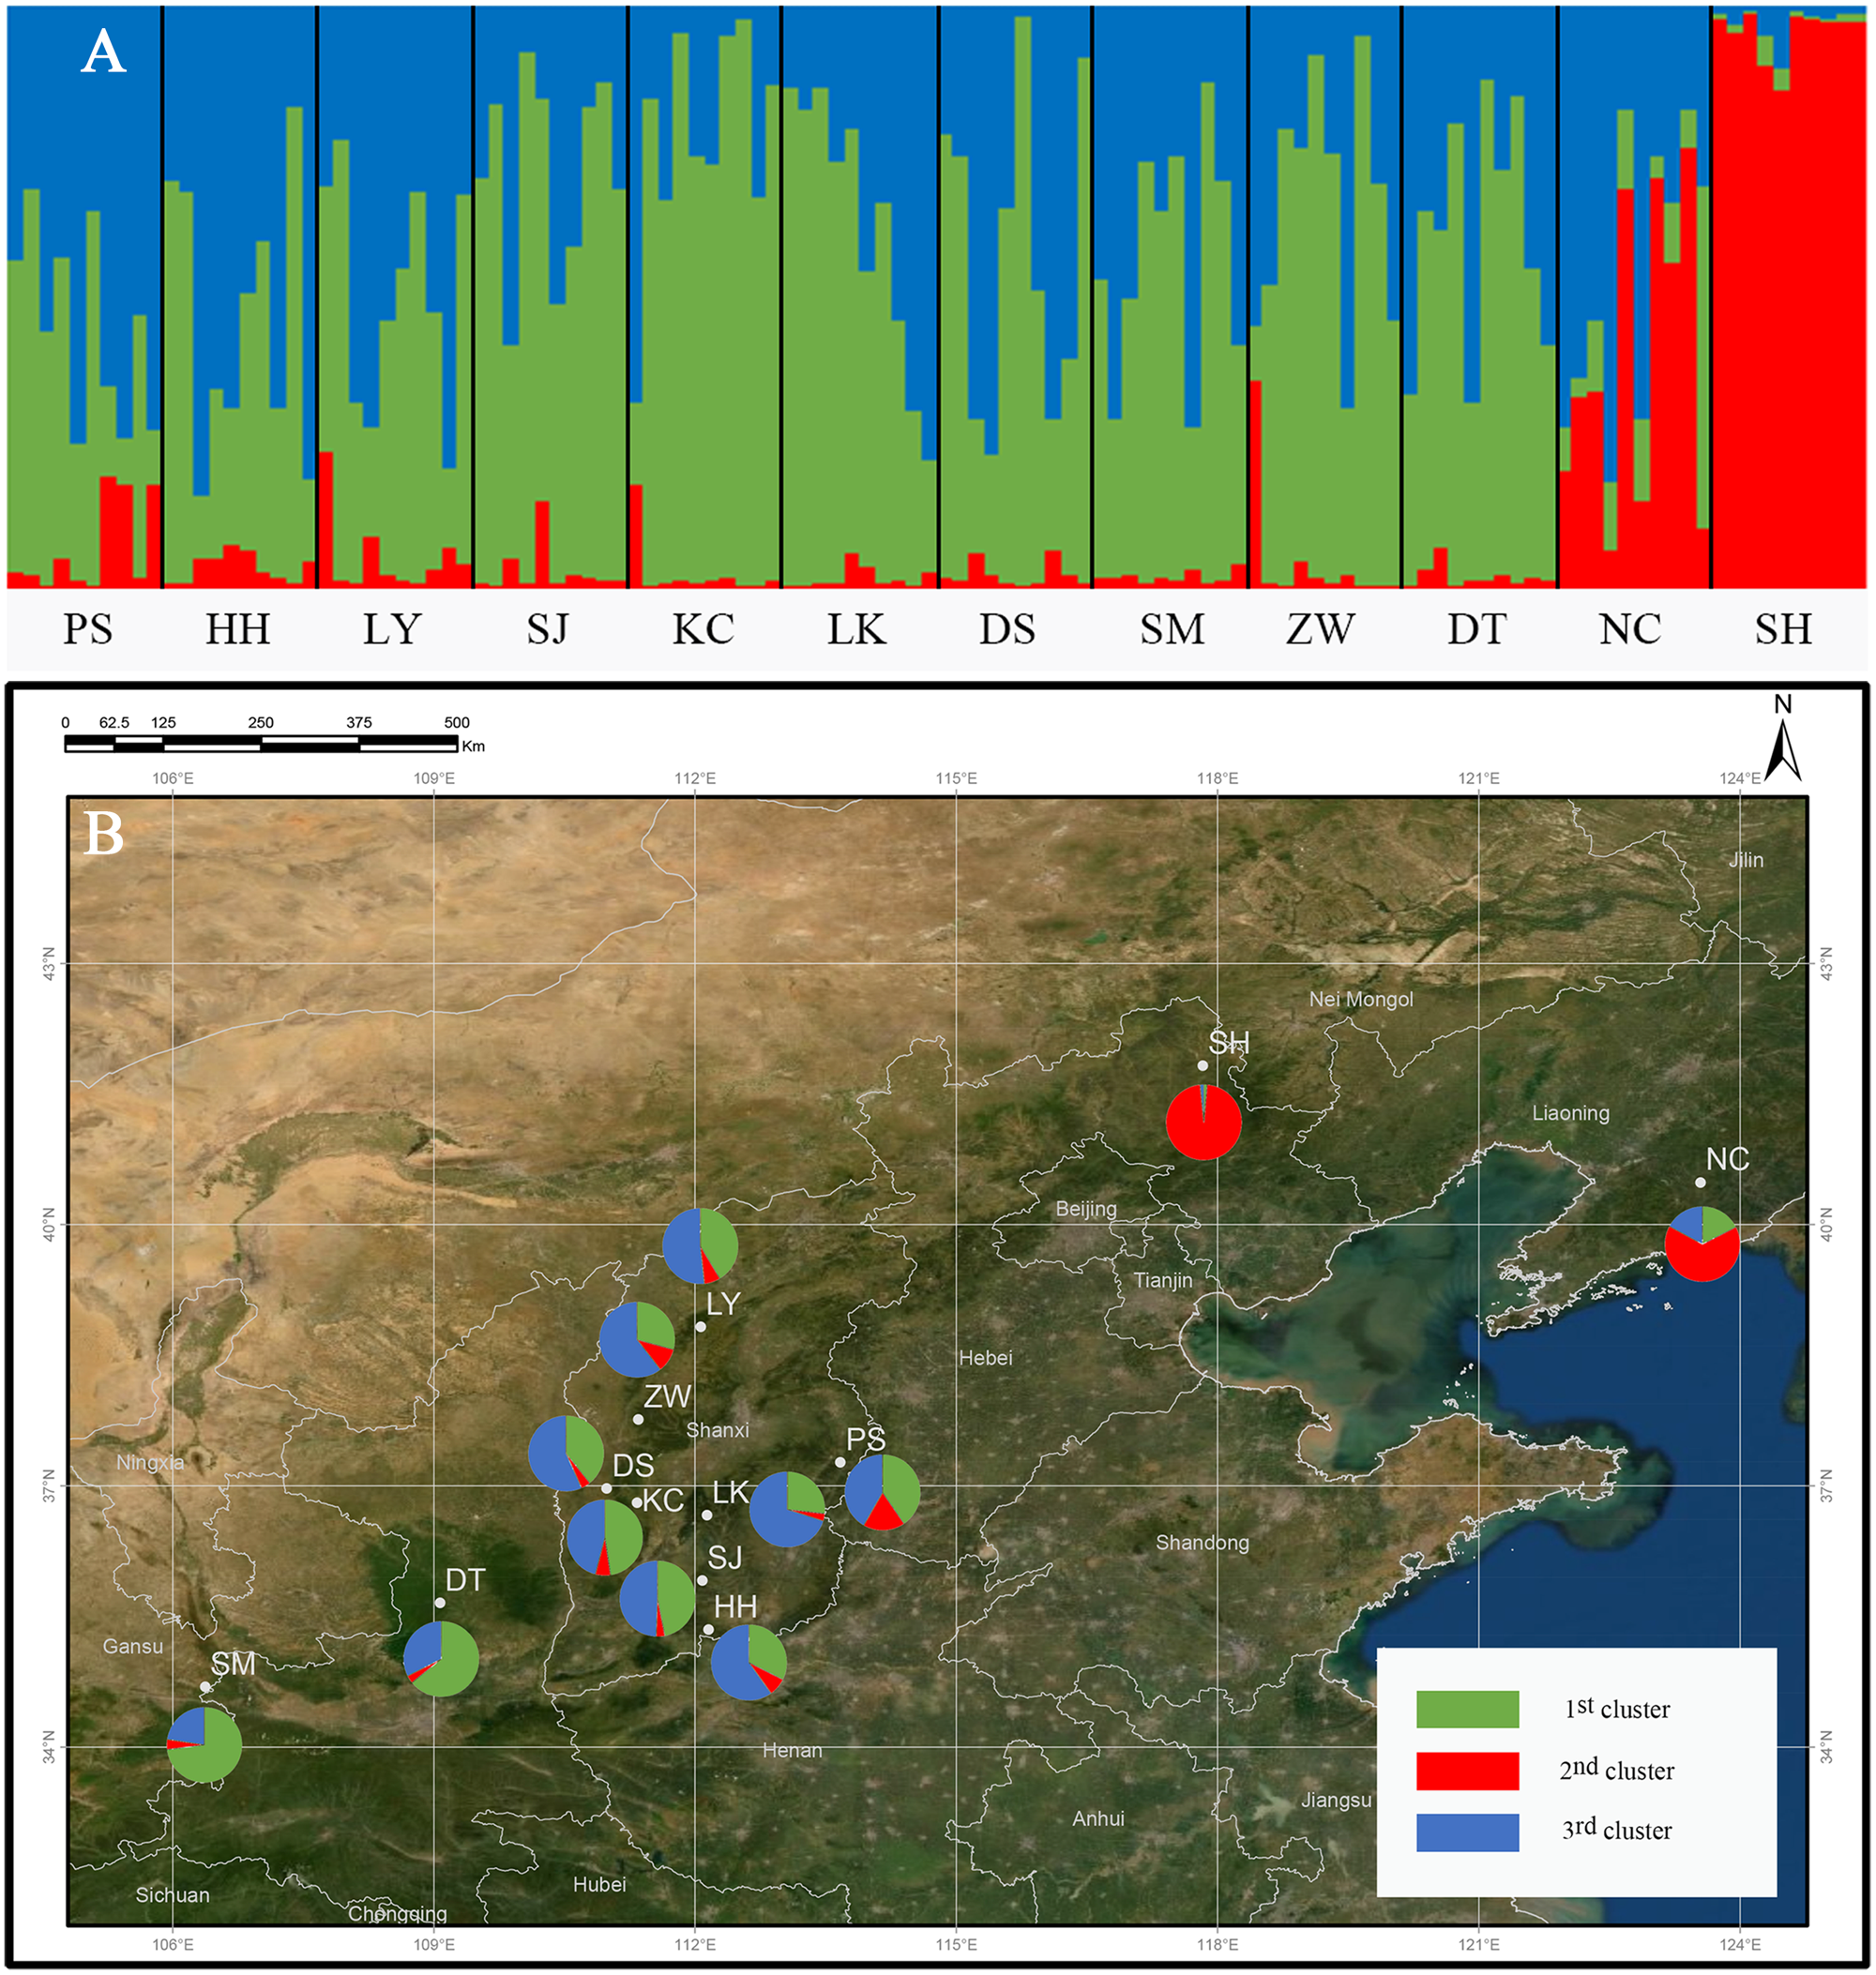
In addition, we independently investigated the genetic differentiation and gene flow among 3 subpopulations, and found that the higher values of Fst. The Fst value between Bashang plateau subpopulation (SH) and Liaodong peninsula subpopulation (NC) was 0.054, and between Bashang plateau subpopulation and Loess plateau subpopulation (other 10 populations) was 0.068, indicating a moderate level of genetic differentiation among 3 subpopulations. Meanwhile, we have investigated gene flow (Nm) among 3 subpopulations. The pair-wise value of Nm among 3 subpopulations was 3.41 (Bashang Plateau vs. Loess Plateau), 7.44 (Liaodong Peninsula vs. Loess Plateau), and 4.38 (Liaodong Peninsula vs. Bashang Plateau), respectively.
Discussion
Genetic diversity
At the species level, genetic diversity is usually related to the life cycle, geographic range, mating system, migration, and balancing selection (Gaudeul, Taberlet & Till-Bottraud, 2000; Hamrick & Godt, 1990; Hellmann & Pineda-Krch, 2007; Li et al., 2008). Generally, the widely distributed long-lived Quercus species exhibit abundant genetic diversity. In this study, Q. liaotungensis populations showed a high level of genetic diversity, especially concerning heterozygosity (He = 0.801), which was higher than that of other Quercus species, such as summer oak (Q. robur) (He = 0.764) (Sullivan et al., 2013), sawtooth oak (Q. acutissima) (He = 0.660) (Zhang et al., 2013), and Mongolian oak (Q. mongolica) (He = 0.630) (Ueno & Tsumura, 2008). On the one hand, high genetic diversity may be attributed to the biological characteristics of Q. liaotungensis. The geographical boundary of Q. liaotungensis spans from the northern slope of the Qinling Mountains to the southern slope of the Changbai Mountains (Li et al., 2012). The widespread distribution and heterogeneous habitats may lead to high levels of genetic diversity because abundant genotypes can enhance the ability of species to respond to different environments. On the other hand, the mating system with unique outcrossing and long-distance gene flow model can also strengthen the genetic diversity. In addition, the genetic diversity of Q. liaotungensis (He = 0.801) in this report was higher than that of previous report (He = 0.754) (Qin et al., 2012). The main reason could be the different sampling sites and that the number of samples in this study was more than that in previous studies. The other reason could be the various types of climatic environments and soil conditions in these sampling sites (Yang et al., 2018).
At the population level, the NC population had the highest genetic diversity out of the 12 Q. liaotungensis populations. The NC population is located in the Liaodong Peninsula of Northeast China, where the ecological niche overlap for Q. liaotungensis and Q. mongolica species. Therefore, the natural hybridization of the 2 species could lead to gene introgression and show a much larger genetic diversity than the other populations. The SH population had the lowest genetic diversity and significantly deviated from the HWP. Fewer individuals existed in secondary forests with a patchy distribution of Q. liaotungensis, thereby causing this phenomenon.
Genetic differentiation and genetic structure
Compared to the herbaceous plants, the woody plants have lower genetic differentiation among 12 Q. liaotungensis populations and higher genetic variation within 12 Q. liaotungensis populations. This difference could be attributed to high outcrossing rates, reproduction, wind-pollination, and acorn transport (Radu et al., 2014). The level of genetic differentiation among Q. liaotungensis population was low (Fst = 0.033), and the result was consistent with the recent research on Quercus species, such as holm oak (Q. ile x) (Fst = 0.018) (Guzmán et al., 2015) and cork oak (Q. suber) (Fst = 0.017) (Coelho et al., 2006). Moreover, gene flow and genetic drift have a strong influence on the genetic differentiation of different populations (Schaal et al., 1998). In the Q. liaotungensis species, wind-pollination, outcrossing, long-distance pollen dispersal, spreading of acorns by animals, and relatively high gene flow (Nm = 11.286) may limit genetic drift and reduce genetic differentiation.
The genetic structure of Q. liaotungensis is divided into 3 subpopulations with the Bayesian model, which is consistent with the results of the cluster analysis based on Nei’s genetic distance. Furthermore, the results of the Mantel test showed that the genetic distance had a significantly positive correlation with the geographic distance (r = 0.638, p = 0.028), indicating clear isolation by distance (IBD) among the investigated Q. liaotungensis populations. A larger distance from 35.89 km (between KC and DS population) to 1,642.82 km (between NC and SM population) based on the latitude and longitude may lead to a more significant genetic differentiation. In addition, two boundaries exist in 3 groups of 12 Q. liaotungensis populations. The boundary a, isolated the 10 Q. liaotungensis populations from Loess Plateau in China by Taihang Mountains. The boundary b, corresponding to the Liao River, and separated the NC population from the Liaodong Peninsula and SH population from Bashang Plateau. Therefore, the geographical distance and physical barriers jointly affected the genetic differentiation among Q. liaotungensis populations. Additionally, the genetic differentiation of marginal populations of the Q. liaotungensis was higher than that of the central populations in China (Petit, Mousadik & Pons, 1998). This genetic differentiation among populations could be attributed to habitat destruction in certain areas, which is affected by climate change and illegal logging.
The genetic structure formation not only depends on geographical isolation but also affected by the changes of distribution and size mediated by climatic conditions (Ortego et al., 2012). Studies have shown that in addition to the influence of geographical distance, the ecological conditions exert a significant influence on the genetic variation patterns of Fraxinus mandshurica and Elymus athericus (Bockelmann et al., 2003; Temunovic et al., 2012). Q. liaotungensis has adapted to different ecological niches with unique temperature and precipitation seasons, leading to high genetic differentiation within populations (Li et al., 2012; Yang et al., 2018). In this study, the cluster analysis based on 19 climatic factors revealed obvious differences between the climatic types of the 3 clusters. Climate differences caused by environmental heterogeneity may promote the formation of the genetic structure of Q. liaotungensis, and this result was similar to that of the study by Yang et al. The main reason as follow, firstly, Q. liaotungensis populations split before the Last Glacial Maximum (LGM) and have adapted to distinct ecological niches with unique temperature and precipitation seasonality, resulting in high genetic differentiation. Interestingly, the NC and SH population have higher precipitation (bio12, bio13, bio14, bio16, bio17, bio18, and bio19) and temperature differences (bio4 and bio7) when compared to other populations, respectively, and these two populations had been separately divided into 2 distinguished clusters. Secondly, Q. liaotungensis populations showed a dynamic expansion decline trend during the Quaternary climatic oscillations and increased genetic differentiation between central and peripheral populations. Hence, we can conclude that climatic conditions exert an important influence on the genetic structure of Q. liaotungensis.
In addition, the formation of genetic structure is related to hybridization and gene infiltration. Current studies have shown that the hybridization of Q. liaotungensis and Q. mongolica occurs in areas of ecological niche overlap. The hybrid traits, such as all of the differentiated leaf and reproductive traits, tend to those of Q. liaotungensis (Wei et al., 2015). The populations located around the Changbai Mountains in Northeast China retained the characteristics of Q. liaotungensis, but introduced alleles from Q. mongolica (Zeng et al., 2011). This study found that the NC and SH populations in the Liaodong Peninsula and the Bashang Plateau are located in the overlapping niche areas of Q. liaotungensis and Q. mongolica, respectively. Furthermore, the structural analysis showed the second cluster (red) of pie charts to be larger than the other groups. In addition, studies have shown that interspecific hybridization frequently occurs in the closely related species of Quercus (Gonzĺez-Rodríguez & Oyama, 2005; Lagache et al., 2013) causing gene introgression in the hybrid zones (Wei et al., 2015). The above evidence suggests that the Q. liaotungensis population in the niche overlap region may be a natural phenomenon of hybrid and gene introgression among the two species.
Conservation strategies of Q. liaotungensis
The germplasm resources of Q. liaotungensis suffered a continuous decline because of frequent human activities and weak natural regeneration. To prevent a decrease in population size and loss of genetic diversity, the protection and management of Q. liaotungensis should be strengthened. Our results showed that the genetic variation pattern of the Q. liaotungensis population was related to geographical isolation, physical barrier, climatic types, and natural hybridization. For in situ protection, establishing at least one respective conservation unit in 3 different areas (Liaodong Peninsula, Bashang Plateau, and Loess Plateau) is required. Meanwhile, seeds and scions should be collected to establish germplasm pools for ex-situ protection. Because the genetic variation exists mainly within the populations, we need to collect as many families and individuals as possible at each population. In addition, active management, such as the establishment of seed forests and artificial promotion of natural regeneration, is necessary.
Conclusions
In this study, we evaluated the genetic diversity and structure of 12 Q. liaotungensis populations in China using 19 SSR primer pairs. The Q. liaotungensis population presents a relatively high genetic diversity and low genetic differentiation, with the majority of variations occurring mainly within the population. The STRUCTURE analysis shows that the genetic structure of Q. liaotungensis populations can be divided into three subpopulations. The Mantel test reveals a positive correlation between Nei’s genetic distance and geographic distance, and two boundaries were found among the 12 Q. liaotungensis populations by the Barrier analysis, indicating that Q. liaotungensis populations have been isolated by distance and physical barrier. In addition, climatic conditions and natural hybridization influence the genetic structure of Q. liaotungensis populations. All together, the findings of this study will play an essential role in the conservation and genetic improvement of Q. liaotungensis.