
Down/up conversion luminescence of erbium-ytterbium co-deposited nanoparticles on carbon nanotubes via a microwave-assisted method
- Published
- Accepted
- Received
- Academic Editor
- Sreeprasad Sreenivasan
- Subject Areas
- Electronic, Optical and Magnetic, Nano and Microstructured Materials
- Keywords
- Down-conversion, Up-conversion, Erbium nanoparticles, Ytterbium nanoparticles, Carbon nanotubes, Microwave synthesis
- Copyright
- © 2025 Zapata-Perez et al.
- Licence
- This is an open access article distributed under the terms of the Creative Commons Attribution License, which permits unrestricted use, distribution, reproduction and adaptation in any medium and for any purpose provided that it is properly attributed. For attribution, the original author(s), title, publication source (PeerJ Materials Science) and either DOI or URL of the article must be cited.
- Cite this article
- 2025. Down/up conversion luminescence of erbium-ytterbium co-deposited nanoparticles on carbon nanotubes via a microwave-assisted method. PeerJ Materials Science 7:e33 https://doi.org/10.7717/peerj-matsci.33
Abstract
In this study we present the synthesis of erbium, ytterbium and erbium-ytterbium nanoparticles supported on multiwalled carbon nanotubes by a microwave-assisted method as well as the evaluation of their luminescent properties. In the case of erbium, nanoparticles of ~1 nm homogeneously dispersed on the carbon nanotubes were obtained. In the case of ytterbium, the carbon nanotubes were partially coated with this metal. Clusters of erbium-ytterbium nanoparticles were obtained in the co-deposition of both metals. The erbium-ytterbium/carbon nanotube composite showed both down- and up-conversion luminescence. For the down-conversion process, strong emission signals at 523, 530 and 563 nm as well as a weak signal at 612 nm under 488 nm excitation are observed. For the up-conversion process, the composite showed emission signals centered at 528 and 660 nm under 980 nm excitation.
Introduction
The demand of nanomaterials for new technological applications has increased in the last two decades. The fabrication of small devices has stimulated researchers to seek for compounds with excellent performance at the micro and nano scales. Carbon nanotubes (CNTs) have been successfully used as support for the dispersion and stabilization of metal and semiconductor nanoparticles due to their large chemical active surface and thermal stability. The combination of CNTs and metal nanoparticles has led to the integration of their properties producing new hybrid materials with special features finding applications in many technological areas such as catalysis, nanoelectronics, biosensors, etc. (Li et al., 2018; Wu et al., 2009; Georgakilas et al., 2007; Zhang, Bai & Yan, 2019; Serp, 2003). Special interest has been centered in methods that are able to control size, shape and homogeneous dispersion of the nanoparticles on CNTs. Hydrothermal, electrochemical, sonochemical and chemical vapor deposition methods, among others, have been used for producing these type of composites (Lorestani et al., 2015; Xing, 2004; Pan & Wai, 2009; Hoyos-Palacio et al., 2019). Microwave processing has emerged as a novel method for this purpose (Lopez-Tinoco et al., 2021).
Among rear earth elements, erbium and ytterbium have been widely studied for sensing, field emission (Shrestha et al., 2010), up-conversion (Li et al., 2018; Li, Zhang & Zhao, 2015) and photoluminescent (Yan-Hong et al., 2006) applications. Their electronic structure which allows electron-photon interactions and electronic transitions from the 4f to the 5d levels has been assessed as the reason for exhibiting interesting optical and luminescent properties. A great variety of host phosphors co-doped with Er3+ and Yb3+ have been studied for up- and down-conversion. These phosphors include Y2O3 (Silver et al., 2001; Agrawal & Dubey, 2014), KGd2F7 (Liang et al., 2005), NaYF4 (Wang et al., 2013), YBO3 (Yang et al., 2011), SrAl12O19 (Yan, Chen & Yin, 2011), Y2(WO4)3 (Huang et al., 2012), (Na0.5Gd0.5)MoO4 (Rajagopalan & Jagannathan, 2014), GdVO4 (Savchuk et al., 2016), CaMoO4 (Verma & Sharma, 2017), NaBiF4 (Pan et al., 2020) and transparent glass ceramic containing CaF2 (Kishi & Tanabe, 2005) and PbF2 (Labéguerie et al., 2008), just mention a few. Combining the optical and luminescent properties of rare earth elements with the electronic, mechanical and thermal properties of CNTs offers great opportunities for technological applications which includes dye sensitized solar cells (Cai et al., 2019), cancer diagnosis and therapy (Cheng et al., 2013), and biological imaging (Fan et al., 2020) among others. A new type of hybrid materials consisting of rare earth-doped nanophosphor deposited on CNTs have been studied recently. Some examples of these hybrid materials include Eu-doped Y2O3 nanophosphor deposited on MWCNTs (Shi et al., 2006), EuF3 and TbF3 nanoparticles on MWCNTs (Wei et al., 2006), Eu and Tb complex layers synthesized on MWCNTs (Fan et al., 2020), Y2O3 Yb/Er layer by layer assembled on CNTs (Mao et al., 2008) and NaYF4:Yb/Er nanoparticles deposited on SWCNTs (Wu et al., 2008). In these studies, the carbon support does not influence the optical and luminescence features showed by the rare earth complexes but rather improve the stability of the rare earth-doped phosphors under irradiation.
The goals of our study were to deposit erbium nanoparticles, ytterbium nanoparticles and a mixture of erbium-ytterbium nanoparticles on MWCNTs by a microwave-assisted method and to evaluate the photoluminescence properties of these hybrid materials.
Materials and Methods
CNTs were synthetized by a spray pyrolysis process reported before (Alonso-Nuñez et al., 2010). A mixture of α-pinene (Sigma-Aldrich, 98.00%) used as carbon source and ferrocene (Sigma-Aldrich, 98.00%) used as catalyst was fed with argon at 83.33 cm3/s flow rate for 30 min at 800 °C. The CNTs produced were purified and functionalized by a conventional acid treatment in order to achieve their dispersion in water. Erbium, ytterbium and erbium-yterbium nanoparticles were deposited on the CNTs by means of a microwave-assisted method. Erbium nitride (Sigma-Aldrich, 99.99%) and ytterbium nitride (Aldrich 99.99%) were used as metal sources, dioctyl sodium sulfosuccinate (AOT) was used as surfactant and NaBH4 as a reducing agent. The microwave synthesis was performed in a Synthos 3000 microwave reactor (Anton-Parr) at 120 °C for 15 min. The produced composites were characterized by high-resolution transmission electron microscopy (HR-TEM) and Raman spectroscopy as described in a previous report (Hernández-Vargas et al., 2021). The same Raman equipment was used to performed the photoluminescent experiments.
Results
HR-TEM images of the produced CNTs are shown in Fig. 1. Figure 1A is a low magnification bright field image of the produced CNTs by spray pyrolysis of α-pinene. The image shows the formation of long tubular carbon structures. Figure 1B is a high magnification bright field image which revels a remarkable alignment of the carbon layers indicating that the produced CNTs are highly crystalline. It also shows that the average outer and inner diameters of the CNTs is ~54 nm ~9 nm respectively. The EDS analysis (Fig. 1C) reveals the presence of carbon and iron in the analyzed sample. The iron particles detected are remaining of the ferrocene used as catalyst. The bright and sharp sports observed in the Fast Fourier Transform (FFT) analysis displayed in Fig. 1D are characteristic features of highly crystalline CNTs. The interlayer distance obtained from the line scan (Fig. 1E) of this image was found to be 0.341 nm which resembles the graphene interlayer distance in graphite (0.33 nm) (Lehman et al., 2011).
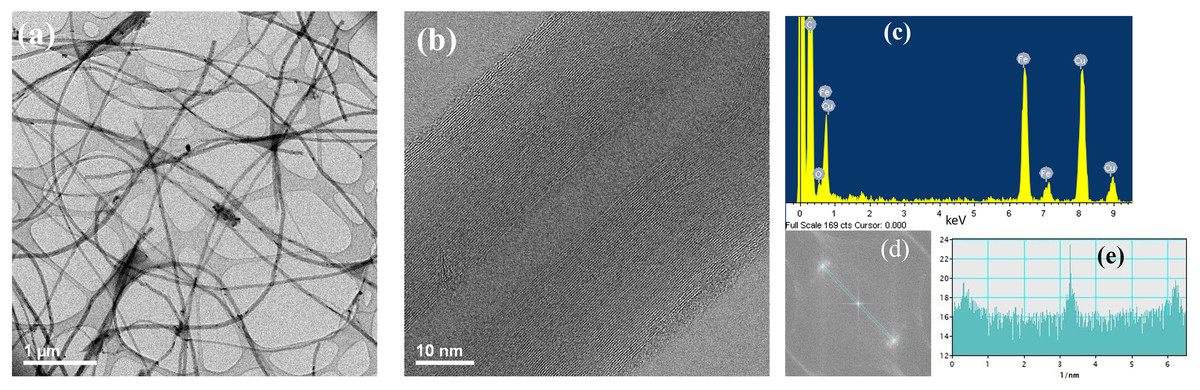
Figure 1: HR-TEM images of CNTs.
(A) Low magnification image, (B) high magnification image, (C) EDS analysis, (D) FTT analysis and (E) line scan of the FTT analysis.
The HR-TEM analysis of the microwave synthesis of erbium nanoparticles deposited on CNTs is presented in Fig. 2. Figures 2A and 2B are high magnification dark field images of Er nanoparticles. In this mode, metal nanoparticles can be distinguished as bright spots due to the contrast difference between lighter and heavier elements. The EDS analysis (Fig. 2C) confirms the formation of Er nanoparticles. The size histogram of the Er nanoparticle shown in Fig. 1D indicate that their average size is ~1.0 nm.
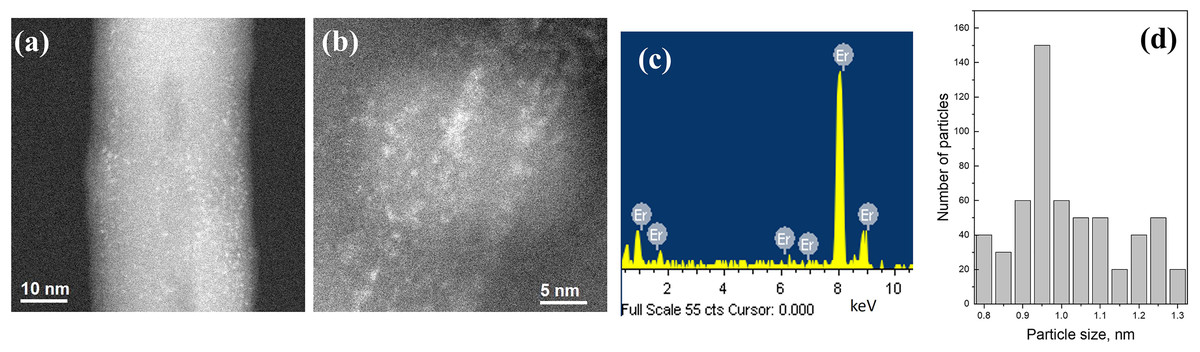
Figure 2: HR-TEM images Er nanoparticles supported on CNTs.
(A and B) High magnification images, (C) EDS analysis and (D) Er nanoparticles size histogram.
The TEM analysis for the synthesis of Yb nanoparticles on CNTs is shown in Fig. 3. Figure 3A is a low magnification and Figs. 3B and 3C are high magnification dark field images. In this case, the images reveal that CNTs are partially coated with Yb. Individual nanoparticles like in the previous case are not observed. The presence of the Yb is confirm with the EDS analysis shown in Fig. 3D.
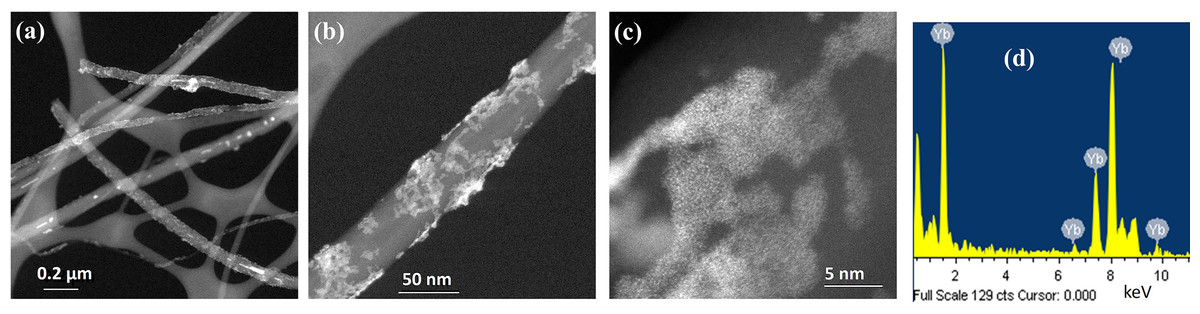
Figure 3: HR-TEM images Yb nanoparticles supported on CNTs.
(A) Low magnification, (B and C) high magnification images and (D) EDS analysis.
Figure 4 shows the TEM results of the co-deposition synthesis of Er-Yb nanoparticles. A 1:1 ratio of the precursor salts for each metal was used in the synthesis. Figure 4A is a low magnification and Figs. 4B and 4C are high magnification dark field images of the synthesized material. We observe the formation of small clusters of particles well dispersed on the surfaces of the CNTs. The EDS analysis of this sample shown in Fig. 4D indicates that the clusters are composed of Er and Yb nanoparticles which are in direct contact with each other.
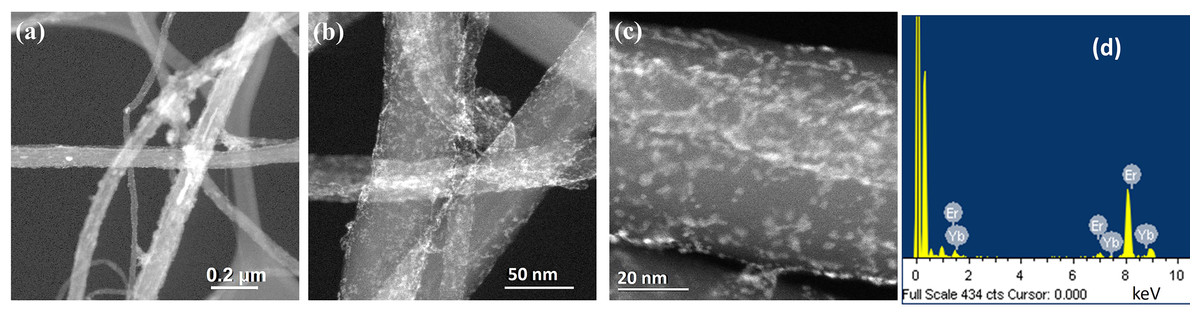
Figure 4: HR-TEM images of Er and Yb co-deposited nanoparticles on CNTs.
(A) Low magnification, (B and C) high magnification images and (D) EDS analysis.
Figure 5 shows the Raman spectra of all the synthesized samples. All spectra exhibit the three characteristic bands of CNTs: the D band, assigned to the disorder-induced phonon mode (A1g), located at ~1,330 cm−1, the G band, assigned to the Raman-allowed phonon mode (E2g), centered at ~1,590 cm−1 and the G’ band, attributed to the first overtone of the D mode, detected at ~2,670 cm−1 (Dresselhaus et al., 2005). Changes in the intensities of these bands are an indication that Er, Yb and Er-Yb nanoparticles have been deposited on the CNTs. As the value of the D/G-band intensity ratio increases, the sample becomes more disordered due to the incorporation of the metallic nanoparticles. As the value of the G’/G-band intensity ratio decreases, the smoothness-degree of the carbon layers decreases (Donato et al., 2007). The values of these intensity ratios are given in Table 1. We observe an important change of these ratios when Yb and Er-Yb nanoparticles were deposited suggesting that, when these nanoparticles are deposited on the CNTs, the CNTs’ structure becomes more disordered. In addition, we detect signals in the 200–600 cm−1 range which can be attributed to the presence of Er2O3 nanoparticles (Yan et al., 2019) and signals in the 600–850 range which are assigned to the formation of Yb2O3 nanoparticles (Panitz, 1999).
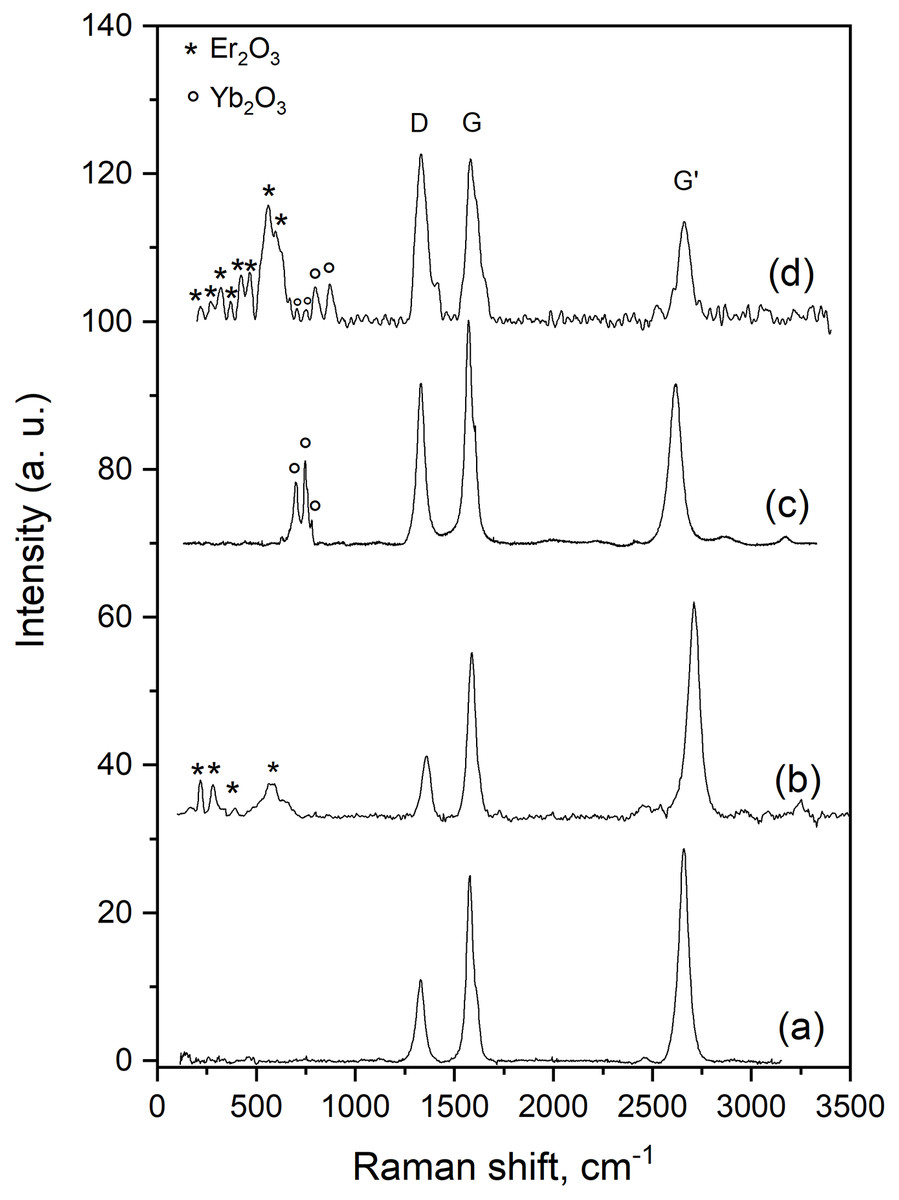
Figure 5: Raman spectra of the synthesized materials.
(A) CNTs, (B) Er nanoparticles supported on CNTs, (C) Yb nanoparticles supported on CNTs and (D) Er-Yb (1:1) nanoparticles co-deposited on CNTs.
| Sample | ID/IG | IG’/IG |
|---|---|---|
| CNTs | 0.39 | 1.25 |
| Er/CNTs | 0.41 | 1.16 |
| Yb/CNTs | 0.72 | 0.75 |
| Er-Yb/CNTs | 1.01 | 0.65 |
Note:
Intensity ratio values of the D, G and G’ Raman bands of the synthesized samples.
Figure 6A shows the down-conversion photoluminescent spectrum obtained from the Er-Yb/CNTs sample exited at 488 nm. It exhibits signals centered at 523, 528, 563 and 612 nm which are attributed to 2H11/2 → 4I15/2, 2S3/2 → 4I15/2 and 4F7/2 → 4I15/2 transitions of Er+3 (Agrawal & Dubey, 2014). The proposed transition diagram is shown in Fig. 6B. For Er/CNTs and Yb/CNTs, no signals were detected.
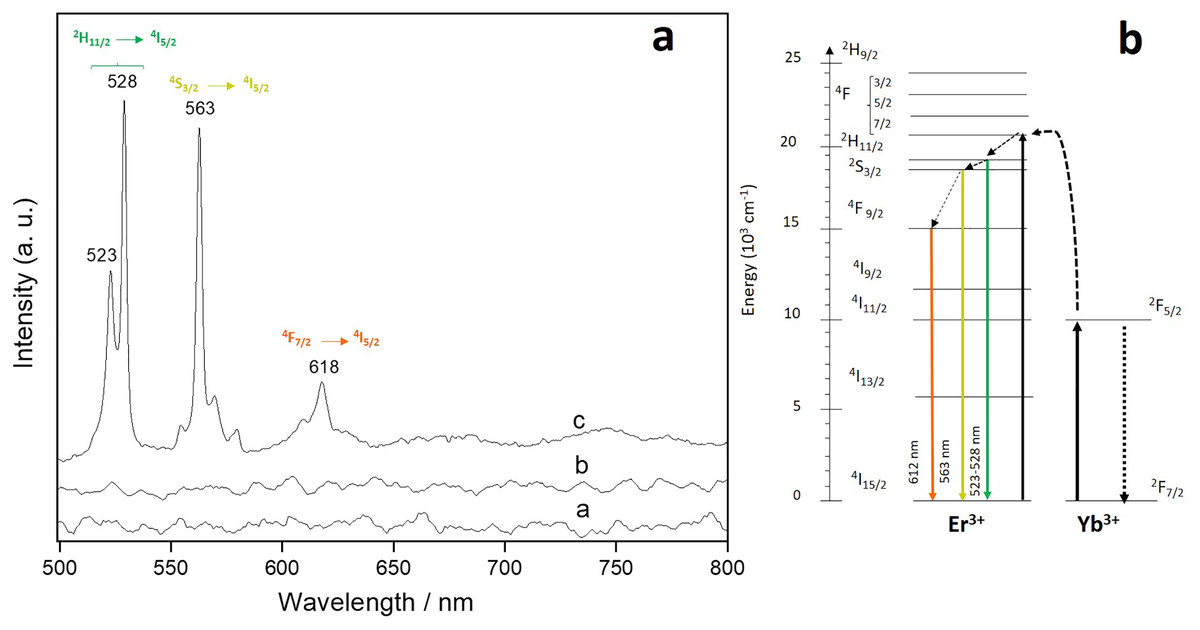
Figure 6: Down-conversion spectrum of Er-Yb/CNTs.
(A) Down-conversion spectrum of Er-Yb/CNTs under 488 nm excitation and (B) energy-level scheme of Er3+ and Yb3+ ions showing a possible down-conversion mechanism.
For the up-conversion analysis, the sample was exited at 980 nm and the results are shown in Fig. 7A. The spectrum consists of two up-converted visible signals centered at ~660 (red) and 528 (green) which can be attributed to the 4F9/2 → 4I15/2 and 2H11/2 → 4I15/2 Er3+ transitions respectively (Chen et al., 2018). Figure 7B shows the schematics of the proposed up-conversion mechanism. For Er/CNTs and Yb/CNTs, no signals were detected.
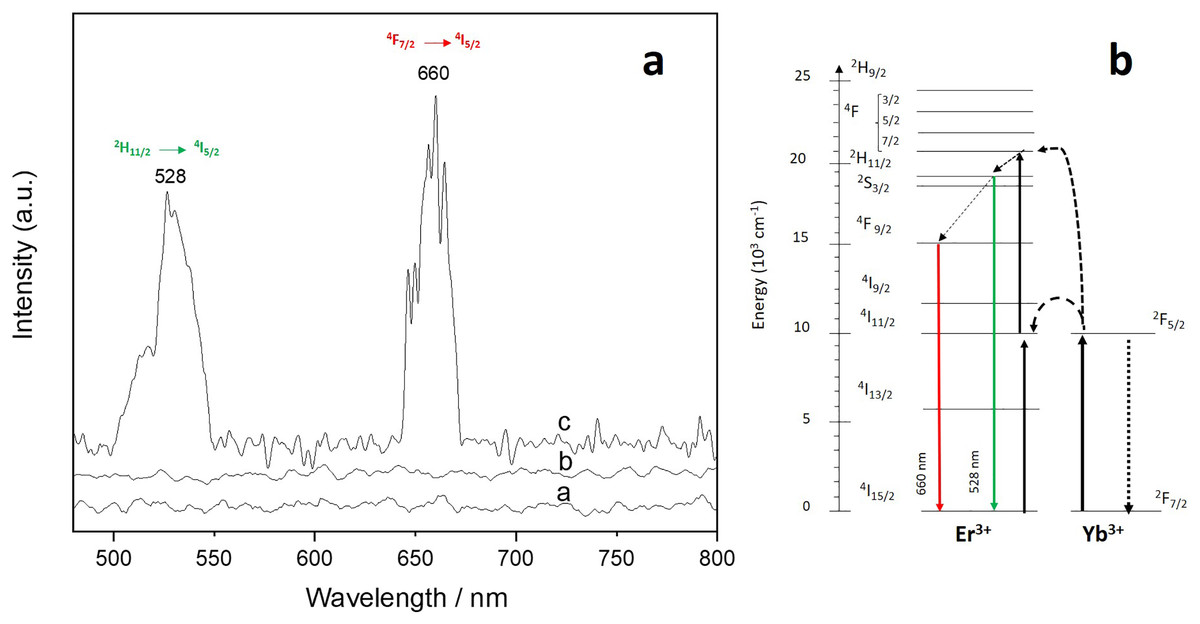
Figure 7: Up-conversion spectrum of Er-Yb/CNTs.
(A) Up-conversion spectrum of Er-Yb/CNTs under 980 nm excitation and (B) energy-level scheme of Er3+ and Yb3+ ions showing a possible up-conversion mechanism.
Discussion
The highly crystalline MWCNTs synthesized by the pyrolysis of turpentine, an economical, environmentally friendly and renewable carbon source obtained from living pine trees, are an excellent platform to anchor Er, Yb and Er-Yb nanoparticles. The microwave synthesis proved to be an excellent method to control the size and dispersion of metal nanoparticles. In the case of Er, well-dispersed and highly homogeneous nanoparticles of approximately 1 nm in size were formed. In the case of Yb, the MWCNTs were partially coated with this metal. In the case of the co-deposition Er-Yb, homogeneous clusters where Er is in direct contact with Yb were formed on the surface of MWCNTs. The microwaves provide a continuous heating with no temperature gradients of the reactants which allows to control the size and dispersion of the synthesized metal nanoparticles on the outer surface of the MWCNTs which is crucial to enhance their luminescence properties. According to the Förster resonance energy transfer mechanism has been assigned as main energy transfer mechanism between two chromophores. The efficiency of this energy transfer is inversely proportional to sixth power of the distance between the donor and the acceptor, so, it is distance sensitive. It has been reported that, when the distance is greater than 12 nm, the energy transfer process vanishes completely. The highest energy transfer efficiency occurs below this distance (Melle et al., 2018). In our case, it is critical to have Er atoms in contact or in a distance range below 10 nm with Yb atoms in order to promote the energy transfer between Er and Yb atoms upon excitation in order to obtain the up- and down-conversion luminescent effects. The up-conversion process takes place when the sample is irradiates with a 488 nm wavelength radiation. Upon excitation, the cross-relaxation energy transfer between Er3+ and Yb3+ ions populate de 4F7/2 followed by a multistep phonon relaxation to the 2H11/2, 4S3/2 and 4F9/2 from which the observed down-conversion emission signals take place.
For the down-conversion process, at 980 nm excitation, the 4I11/2 excited state of Er3+ ions can be populated via ground-state absorption from the 4I15/2 level. At the same time, Yb3+ ions can be excited from the ground 2F7/2 level to the 2F5/2 excited level. Since the Yb3+ absorption coefficient is stronger than that of Er3+, an efficient resonant energy transfer from Yb3+ ions to the Er3+ ions are expected and will play an important role in the Er/Yb co-doped system. The 4F7/2 level of the Er3+ ions can be populated from the 4I11/2 level via excited-state absorption as well as Yb3+ energy transfer. This process is followed by a non-radiatively decay into the 2H11/2 level which further relaxes non-radiatively to the 4F9/2 level. A final radiatively transfer from these populated exited states, 2H11/2 and 4F9/2 transfer their energy to the 4I15/2 ground level by emitting a green light photon with a wavelength of 528 nm and a red-light photon with a wavelength of 660 nm.
Conclusions
Er-Yb nanoparticles supported on multiwall carbon nanotubes were successfully synthesized by a microwave-assisted chemical method. This method proved to be facile and efficent to form Er-Yb clusters homogeneously dispersed on CNTs. This Er-Yb/CNTs composite exhibits down and up conversion luminescence properties showing potential as a novel phosphor. Green- and red-upconversion luminescence at 528 and 660 nm respectively were observed at 970 nm excitation. Upon excitation at 488 nm, down converted signals at 523 (green), 528 (green), 563 (yellow) and 612 nm (orange) were detected.
Supplemental Information
Raw data (image) used to prepare Figure 1.
HR-TEM images of CNTs.
Raw data (image) used to prepare Figure 2.
HR-TEM images Er nanoparticles supported on CNTs.
Raw data (image) used to prepare Figure 3.
HR-TEM images Yb nanoparticles supported on CNTs.
Raw data (image) used to prepare Figure 4.
HR-TEM images of Er and Yb co-deposited nanoparticles on CNTs.