
Spectroscopic, structural and thermal study of Y(OH)3microstructures synthesized by hydrothermal method: effect of the reaction time
- Published
- Accepted
- Received
- Academic Editor
- Alexey Kabalnov
- Subject Areas
- Materials Science (other), Nano and Microstructured Materials
- Keywords
- Yttrium hydroxide, Hydrothermal method, Reaction time effect, Material, Material characterization
- Copyright
- © 2022 Rodríguez de la Concha Azcárate et al.
- Licence
- This is an open access article distributed under the terms of the Creative Commons Attribution License, which permits unrestricted use, distribution, reproduction and adaptation in any medium and for any purpose provided that it is properly attributed. For attribution, the original author(s), title, publication source (PeerJ Materials Science) and either DOI or URL of the article must be cited.
- Cite this article
- 2022. Spectroscopic, structural and thermal study of Y(OH)3microstructures synthesized by hydrothermal method: effect of the reaction time. PeerJ Materials Science 4:e23 https://doi.org/10.7717/peerj-matsci.23
Abstract
Rare earth hydroxides have a wide variety of applications due to their interesting optical and magnetic properties. Specifically, yttrium hydroxide Y(OH)3 is an essential compound of rare earth hydroxides that can be used in areas such as electronics and chemistry due to its optical and structural properties. In this work Y(OH)3 was synthesized under nine reaction times (2–24 h) using the hydrothermal method in order to analyze the morphology evolution process that the Y(OH)3 follow to obtain the expected bar morphology. Also, a characterization study of Y(OH)3 through several techniques such as x-ray diffraction, scanning electron microscopy, energy dispersive x-ray spectroscopy, infrared, Raman and UV-Vis spectroscopy, thermogravimetric analysis, and differential scanning calorimetry is presented. The obtained samples in every reaction time were compared on phase purity, particle size and shape, and spectroscopic and thermal properties. It was concluded that the reaction time has an important effect in obtaining yttrium hydroxide using the hydrothermal method. During the study, the optimal time to obtain only Y(OH)3 was evaluated, as well as the evolution of the morphology over time. At 12 hours, only Y(OH)3is obtained, therefore this time is proposed as the optimal time.
Introduction
Recent years have witnessed considerable interest in the design and preparation of rare earth (RE)-based nano-materials due to their great potential applications as phosphors, magnets, catalysts, superconductors, and electrolytes (Li, Liu & Yang, 2015; Deng, Huang & Yu, 2015). Although the rare-earth hydroxides have been known for more than 70 years, their optical and magnetic properties are still being investigated. Their simple hexagonal structure and their small lattice parameters make them especially attractive (Wolf, Meissner & Catanese, 1978) since yttrium can be replaced by some lanthanide with the doping process especially efficient with these crystalline characteristics. Yttrium is an element considered within rare-earth group because it is a lighter congener of La an Ac; besides, it tends to occur in the same deposits as the lanthanides and exhibit similar chemical properties, but have different electronic and magnetic properties (Byrne & Lee, 1993).
Due to their high stability, Yttrium compounds can be used in hard conditions, more than STP (Standard Temperature and Pressure), of pressure and temperature (Housecroft & Sharpe, 2005). An essential compound of this family is the yttrium hydroxide Y(OH)3 since it can serve as a precursor for manufacturing important industrially products like ceramics, luminophores, yttrium garnets and yttrium oxide (Y2O3) (Bovina et al., 2011). Y(OH)3 has also been used for the pre-concentration and separation of trace elements in saline water (Kagaya et al., 2007). And the layers of Y(OH)3 are useful for inorganic anion exchange compounds (Yapryntsev et al., 2015).
Y(OH)3 is typically obtained by electrochemical (Aghazadeh, Yousefi & Ghaemi, 2012), hydrothermal (Wu et al., 2009; Zhang et al., 2012), sol–gel (García-Murillo et al., 2017), and solvothermal methodologies (Wang others, 2009). Among these, the synthesis of Y(OH)3 assisted by hydrothermal route is the most efficient to control morphology and crystallinity (Byrappa & Haber, 2001). The above mentioned route is typically carried out as follows: first the yttrium precursor is dissolved (usually in ethanol or water), afterwards a base like sodium, potassium or ammonium hydroxide is added (Wang others, 2009); as a result, an amorphous precipitated is obtained. Subsequently, the crystal phases of the hydroxide are formed when hydrothermal treatment is applied (Bovina et al., 2011).
In order to manipulate Y(OH)3 properties for future applications, there is a previous need of having complete information regarding characterization, and spectroscopy data of the sample.
In this work, the synthesis of Y(OH)3 by hydrothermal method at different reaction times (2–24 h) is proposed in order to assess the purity, crystallinity, size and morphology of the material through the following techniques: X-ray diffraction (XRD), scanning electron microscopy (SEM), energy dispersive X-ray spectroscopy (EDS), Fourier-transform infrared spectroscopy (FTIR), Raman spectroscopy, UV-Vis spectroscopy (UV-Vis), thermogravimetric analysis (TGA) and differential scanning calorimetry (DSC).
Materials & Methods
Yttrium nitrate hexahydrate 99.8% (Y(NO3)3⋅6H2O, Aldrich), absolute ethanol 99.5% (CH3CH2OH, CIVEQ reagents) and sodium hydroxide 98.6% (NaOH, Fermont) were used as received without further purification.
Y(OH)3 samples were synthesized based on our previous studies (Torres Gomez et al., 2017), 0.127 g of Y(NO3)3⋅ 6H2O was dissolved in 35 mL of ethanol. Afterwards, 1.4 g of NaOH was added while the solution was stirred vigorously with a magnetic stirrer. The solution was transferred to a 50 mL Teflon autoclave and heated at 160 °C in an oven at different times (2, 4, 6, 8, 10, 12, 16, 20 and 24 h), vessels were cleaned from one reaction to another washing them and then using aqua regia. Finally, the samples were collected by centrifugation and washed few times with deionized water; lastly the samples were dried at 50 °C for 12 h before further characterization.
Infrared spectra were obtained in the range of 3,000 to 500 cm−1, using FT-IR Spectrophotometer (Model Tensor 27; Bruker) with a resolution of four cm−1. The attenuated total reflectance accessory (ATR) was used to measure each sample.
Raman (Rm) spectra were obtained using XploRA™PLUS spectrometer by HORIBA with a spectral resolution of two cm−1. A DPSS laser (λ = 532 nm) in the range of 200–4,000 cm−1 with a hole of 300 µm and slit of 100 µm. The laser power was 2.5 mW, a 50X microscope objective lens was used to focalize the laser beam over the sample. 50 acquisitions were averaged with an exposure time of 1 s each.
The powder X-ray diffraction studies were carried out using a Bruker D2 Phaser diffractometer, with Cu K α radiation (λ = 1.54178 Å) with a θ-θ configuration in the range from 5° to 70° at 30 kV and 10 mA in a step-size of 0.02°/s equipped with a Ni-filter for Cu K β radiation and Lynxeye 1D detector. Phase identification was achieved with PDF4+ database.
The simulation of the unit cell of hexagonal Y(OH)3 was obtained in the CrystalMaker® Software.
The characterization by UV-Vis spectroscopy of each sample was carried out in the Cary 5000 UV-Vis-NIR, in a measurement interval of 200–300 nm with a scanning speed of 600 nm/min.
The size and morphology were observed in a Scanning Electron Microscope (JEOL JSM-6510LV), with an acceleration voltage of 20 kV, and a tungsten filament. The SEM is attached to an X-ray Dispersive Energy Spectrometer model QUANTAX 200 with an XFlash® 6130 used to evaluate the elemental composition of the samples. The products were dispersed in isopropanol by ultrasonic bath, then a drop was placed on a 2 × 2 mm double-stick carbon tape on aluminum stubs and let dry at room temperature.
In order to study the stability and thermal behavior of the Y(OH)3 samples synthesized at 2, 4, and 12 h, DSC and TG experiments under N2 atmosphere were performed. These were carried out in a Netzsch thermal analyzer model STA F3 Jupiter in the interval of 25 to 800 °C with a heating rate of 20 °C/min.
Results
The results of the materials obtained from the synthesis are presented hereafter. The results obtained at 2 and 12 h were used as examples of the most significant changes. However, the nine reaction times were added when the changes were not fully represented by the three reaction times chosen above. The results of the reaction times at 6, 8, 16, 20 and 24 h are presented in the Supplementary Material.
Infrared and Raman spectroscopy (FT-IR and Raman)
Vibrational spectroscopy is a useful tool to characterize semiconductor hydroxides that are in powder form. Using the FT-IR and RS characterization techniques, the signal corresponding to the “O-H” bonds present in the hydroxide and those coming from absorbed water can be distinguished (Mandal et al., 2014).
The FT-IR and Raman spectra of the powders obtained at 2, 4 and 12 h of reaction time are shown in Figs. 1 and 2, respectively. In Figs. S1 and S2 the FT-IR and Raman spectra is shown for the samples at 6, 8, 10, 16, 20 and 24 h.
X-ray diffraction (XRD)
The typical unit cell and the lattice parameters of hexagonal Y(OH)3 (Hari Krishna et al., 2014) are illustrated in Fig. S3; it can be observed O-H and O-Y bonds referring to its space group P63/m (176). The representative crystal structure and phase purity of the products were determined by XRD. Figure 3 shows the XRD diffraction patterns for powders obtained at 2, 4, 6, 8, 10, 12, 16, 20 and 24 h.
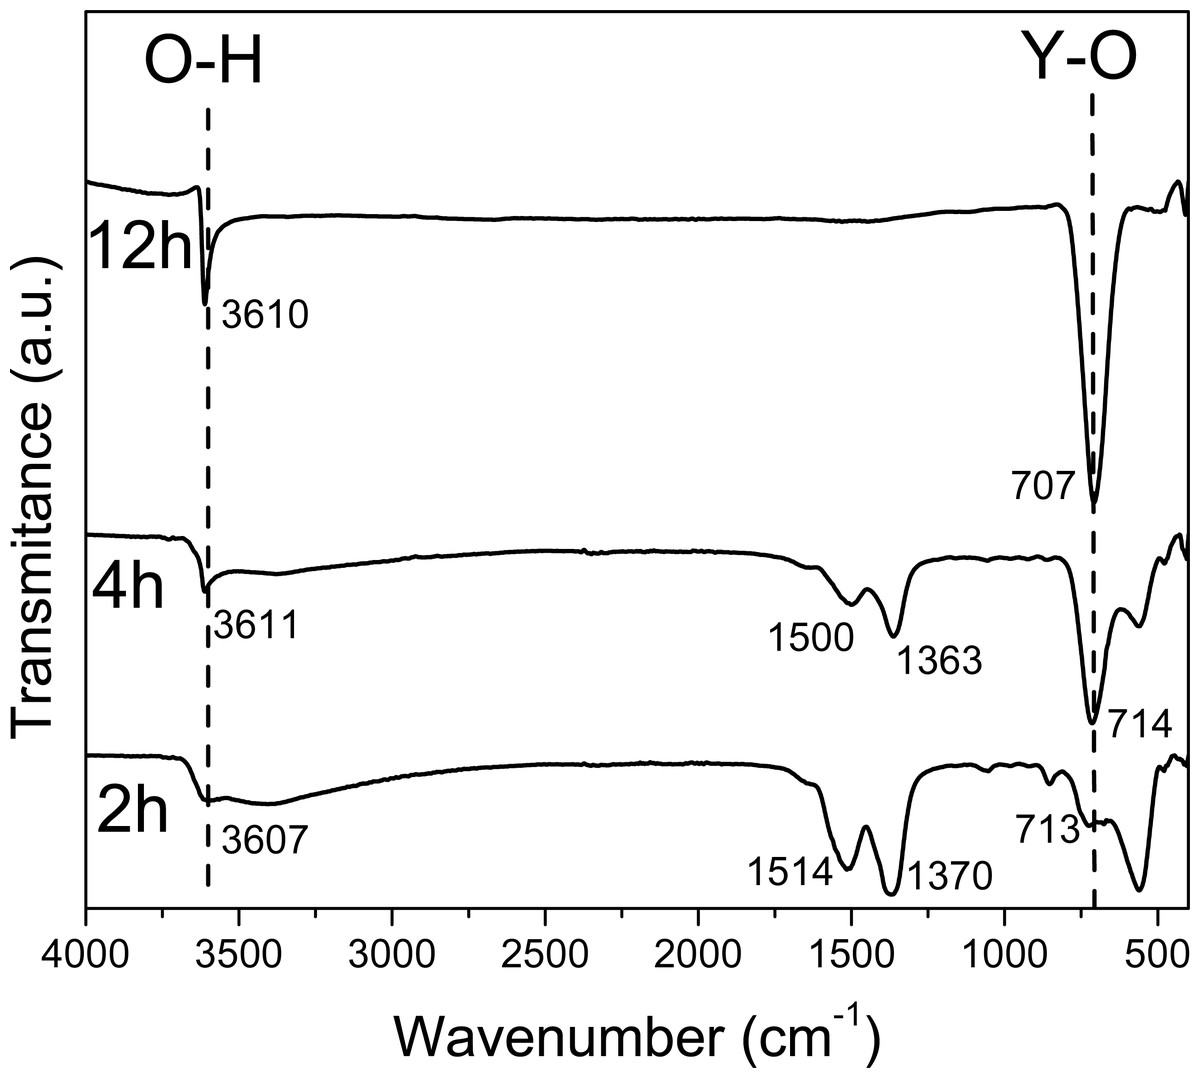
Figure 1: FTIR spectra of the sample obtained at 2 4, 12 hours.
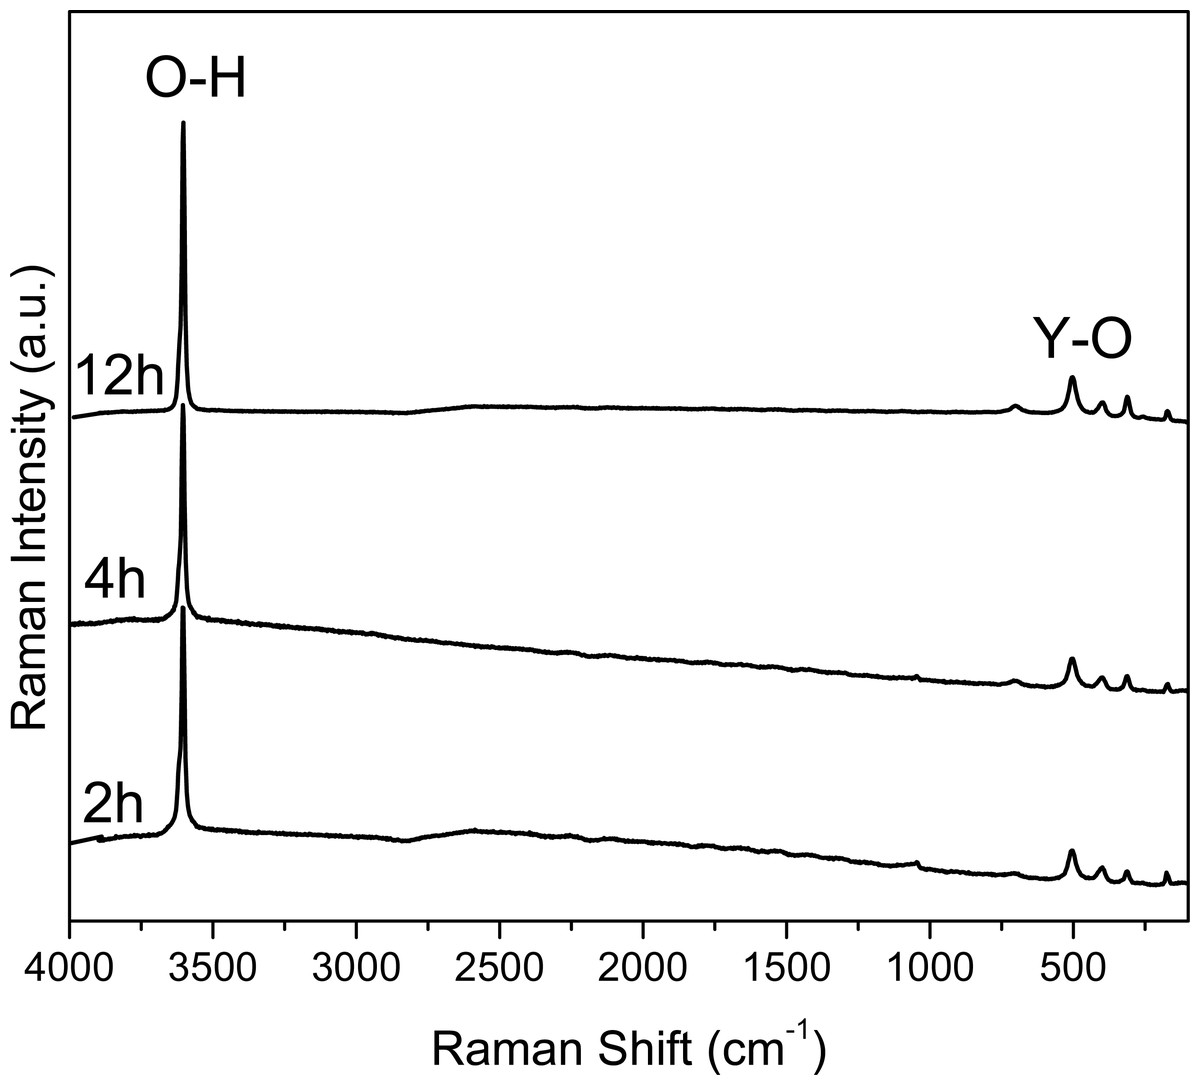
Figure 2: Raman spectra of the samples collected at 2, 4 and 12 hours.
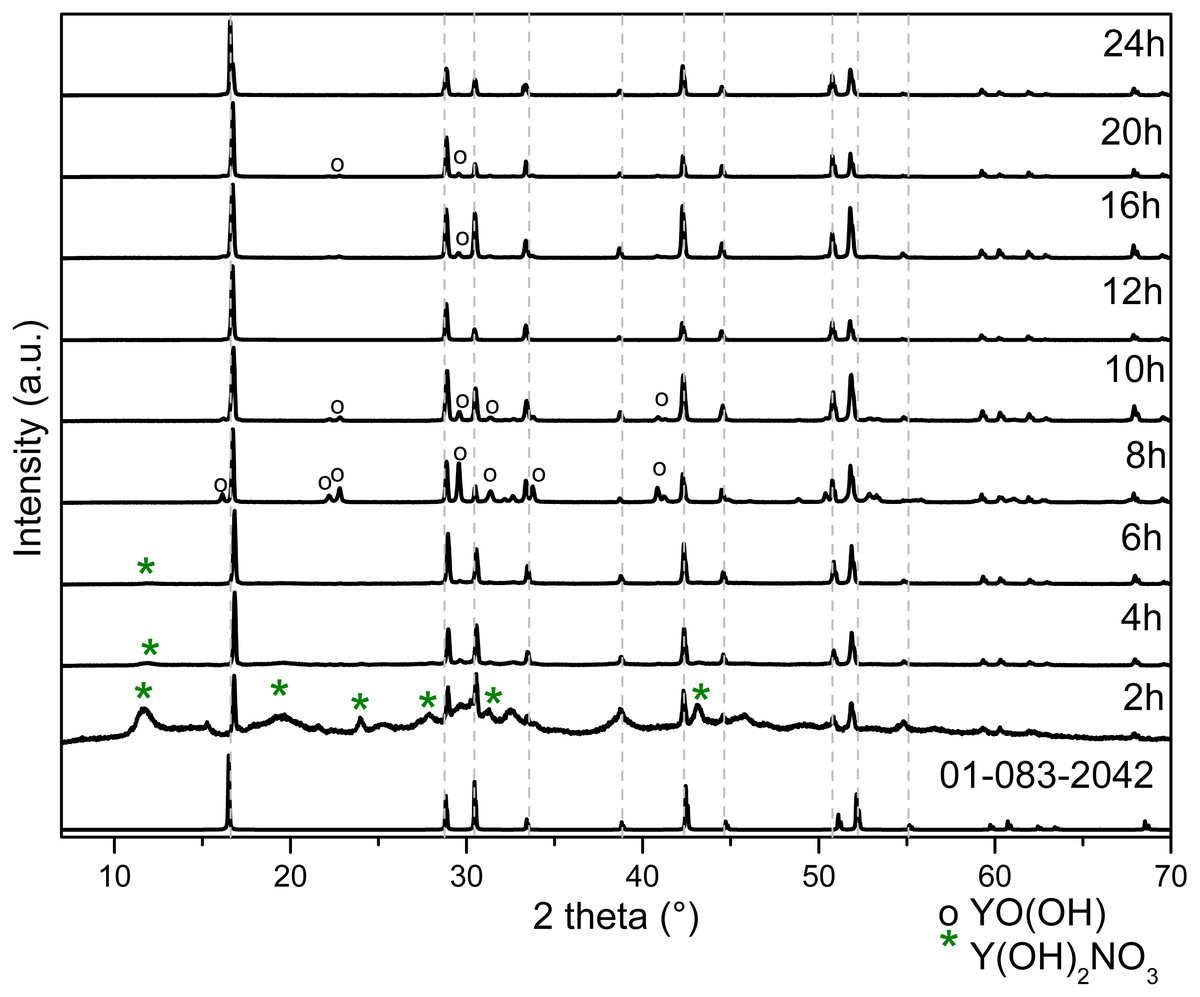
Figure 3: XRD patterns of Y(OH)3 obtained from 2 to 24 h of reaction.
The refinement process of the powder XRD data was achieved with Profex v3.11.1 software, which is a graphical interface of the program BGMN (Döbelin & Kleeberg, 2015). As example, the obtained results of the refinement process of the sample synthesized at 4 h is displayed in Fig. 4. Furthermore, residual parameters (Rp and Rwp) as well as the Goodness of Fit (GoF) achieved are also displayed in the figure; in both cases, the obtained values are below of the suggested values for a good agreement. The software calculates the phase quantification by means intensities ratio for every identified phase. The results of the Rietveld refinement of all samples are in Table 1.
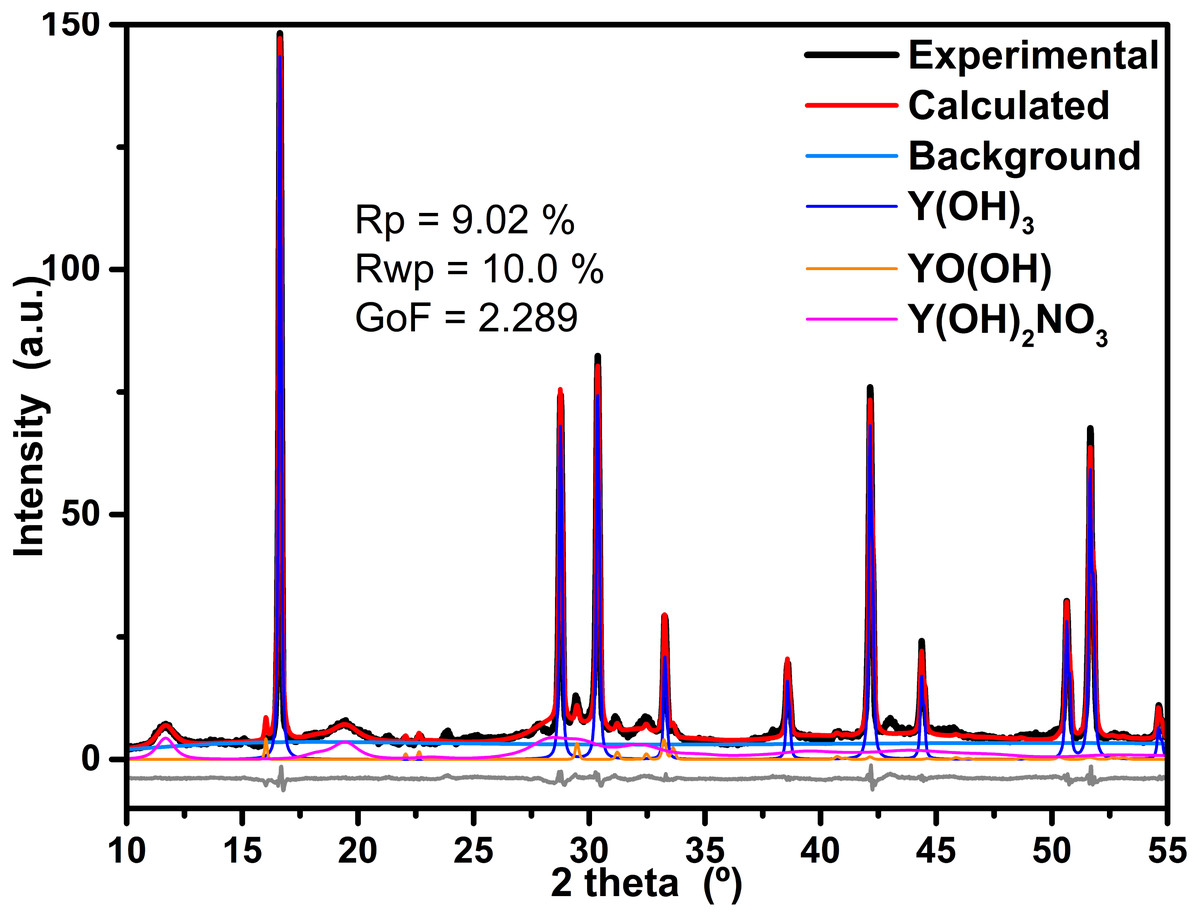
Figure 4: Results of refinement of the sample prepared at 4 h.
Results of refinement of the sample prepared at 4 h; in order to be appreciate the fit, only data between 25 and 65 2 theta are displayed, the background component as well as the difference between experimental and calculated data are also shown.
| Reaction time | Y(OH)3 | Y(OH)2NO3 | YO(OH) | Y(OH)3 | Y(OH)2NO3 | YO(OH) |
|---|---|---|---|---|---|---|
| P63/m | P1211 | P1211/m | ||||
| 2 h | 6.01 ± 0.3 |
93.99 ± 0.3 |
NP |
a = 6.2872 c = 3.55831 |
a = 6.5366 b = 3.4797 c = 7.8600 β = 97.69° |
NP |
| 4 h | 54.70 ± 0.87 |
45.30 ± 0.87 |
NP |
a = 6.2872 c = 3.55831 |
a = 6.5366 b = 3.4797 c = 7.8600 β = 97.69° |
NP |
| 6 h | 62.73 ± 0.78 |
37.27 ± 0.78 |
NP |
a = 6.2872 c = 3.55831 |
a = 6.5366 b = 3.4797 c = 7.8600 β = 97.69° |
NP |
| 8 h | 41.26 ± 0.53 |
NP | 58.74 ± 0.53 |
a = 6.2872 c = 3.55831 |
NP |
a = 4.3119 b = 3.6486 c = 6.1199 β=112.8696° |
| 10 h | 87.74 ± 0.38 |
NP | 12.26 ± 0.38 |
a = 6.2872 c = 3.55831 |
NP |
a = 4.3162 b = 3.6507 c = 6.1267 β = 112.908° |
| 12 h | 100 | NP | NP |
a = 6.2723 c = 3.5500 |
NP | NP |
| 16 h | 89.26 ± 0.55 |
NP | 10.74 ±0.55 |
a = 6.2668 c = 3.5449 |
NP |
a = 4.3044 b = 3.6474 c = 6.1031 |
| 20 h | 87.9 ± 0.50 |
NP | 12.10 ± 0.50 |
a = 6.2765 c = 3.5532 |
NP |
a = 4.3140 b = 3.6476 c = 6.1223 β = 112.921 |
| 24 h | 100 | NP | NP |
a = 6.1774 c = 3.4936 |
NP | NP |
Notes:
- NP
-
This phase is not present
UV-Vis spectroscopy (UV-Vis)
UV-Vis spectra of Y(OH)3 shows (Fig. 5) an absorption maximum at 223, 218, and 214 nm for the synthesis at 2, 4, and 12 h, respectively. These absorptions are associated with the transitions between valance band and conduction band (Hari Krishna et al., 2014). The optical band gap was also calculated using the Tauc method (Singh et al., 2018); obtaining 4.23, 4.19, and 4.10 eV for 2, 4, and 12 h.
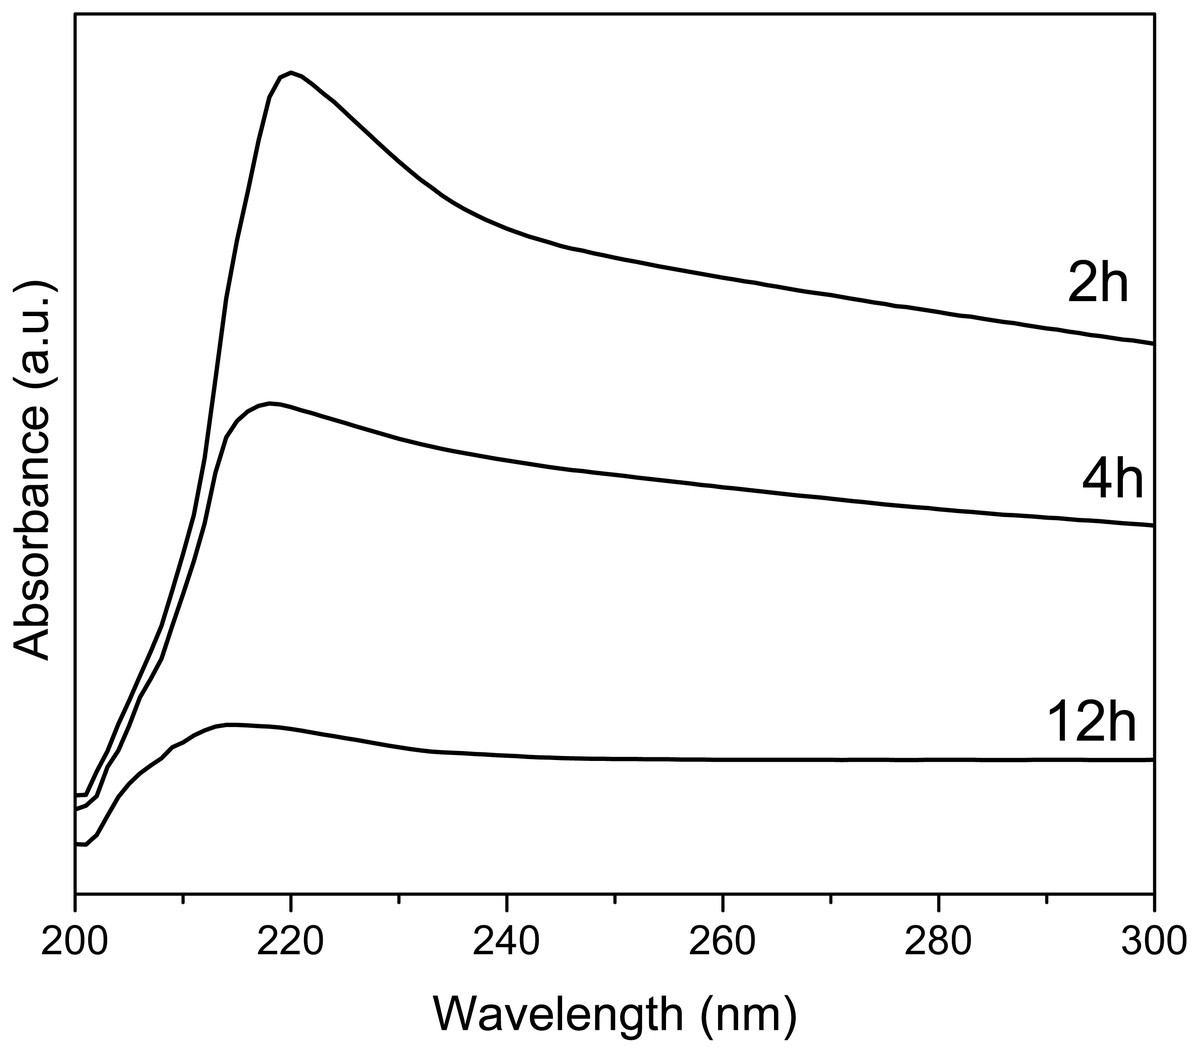
Figure 5: UV-Vis spectra of Y(OH)3.
Scanning electron microscopy and Energy dispersive X-ray spectroscopy (SEM-EDS)
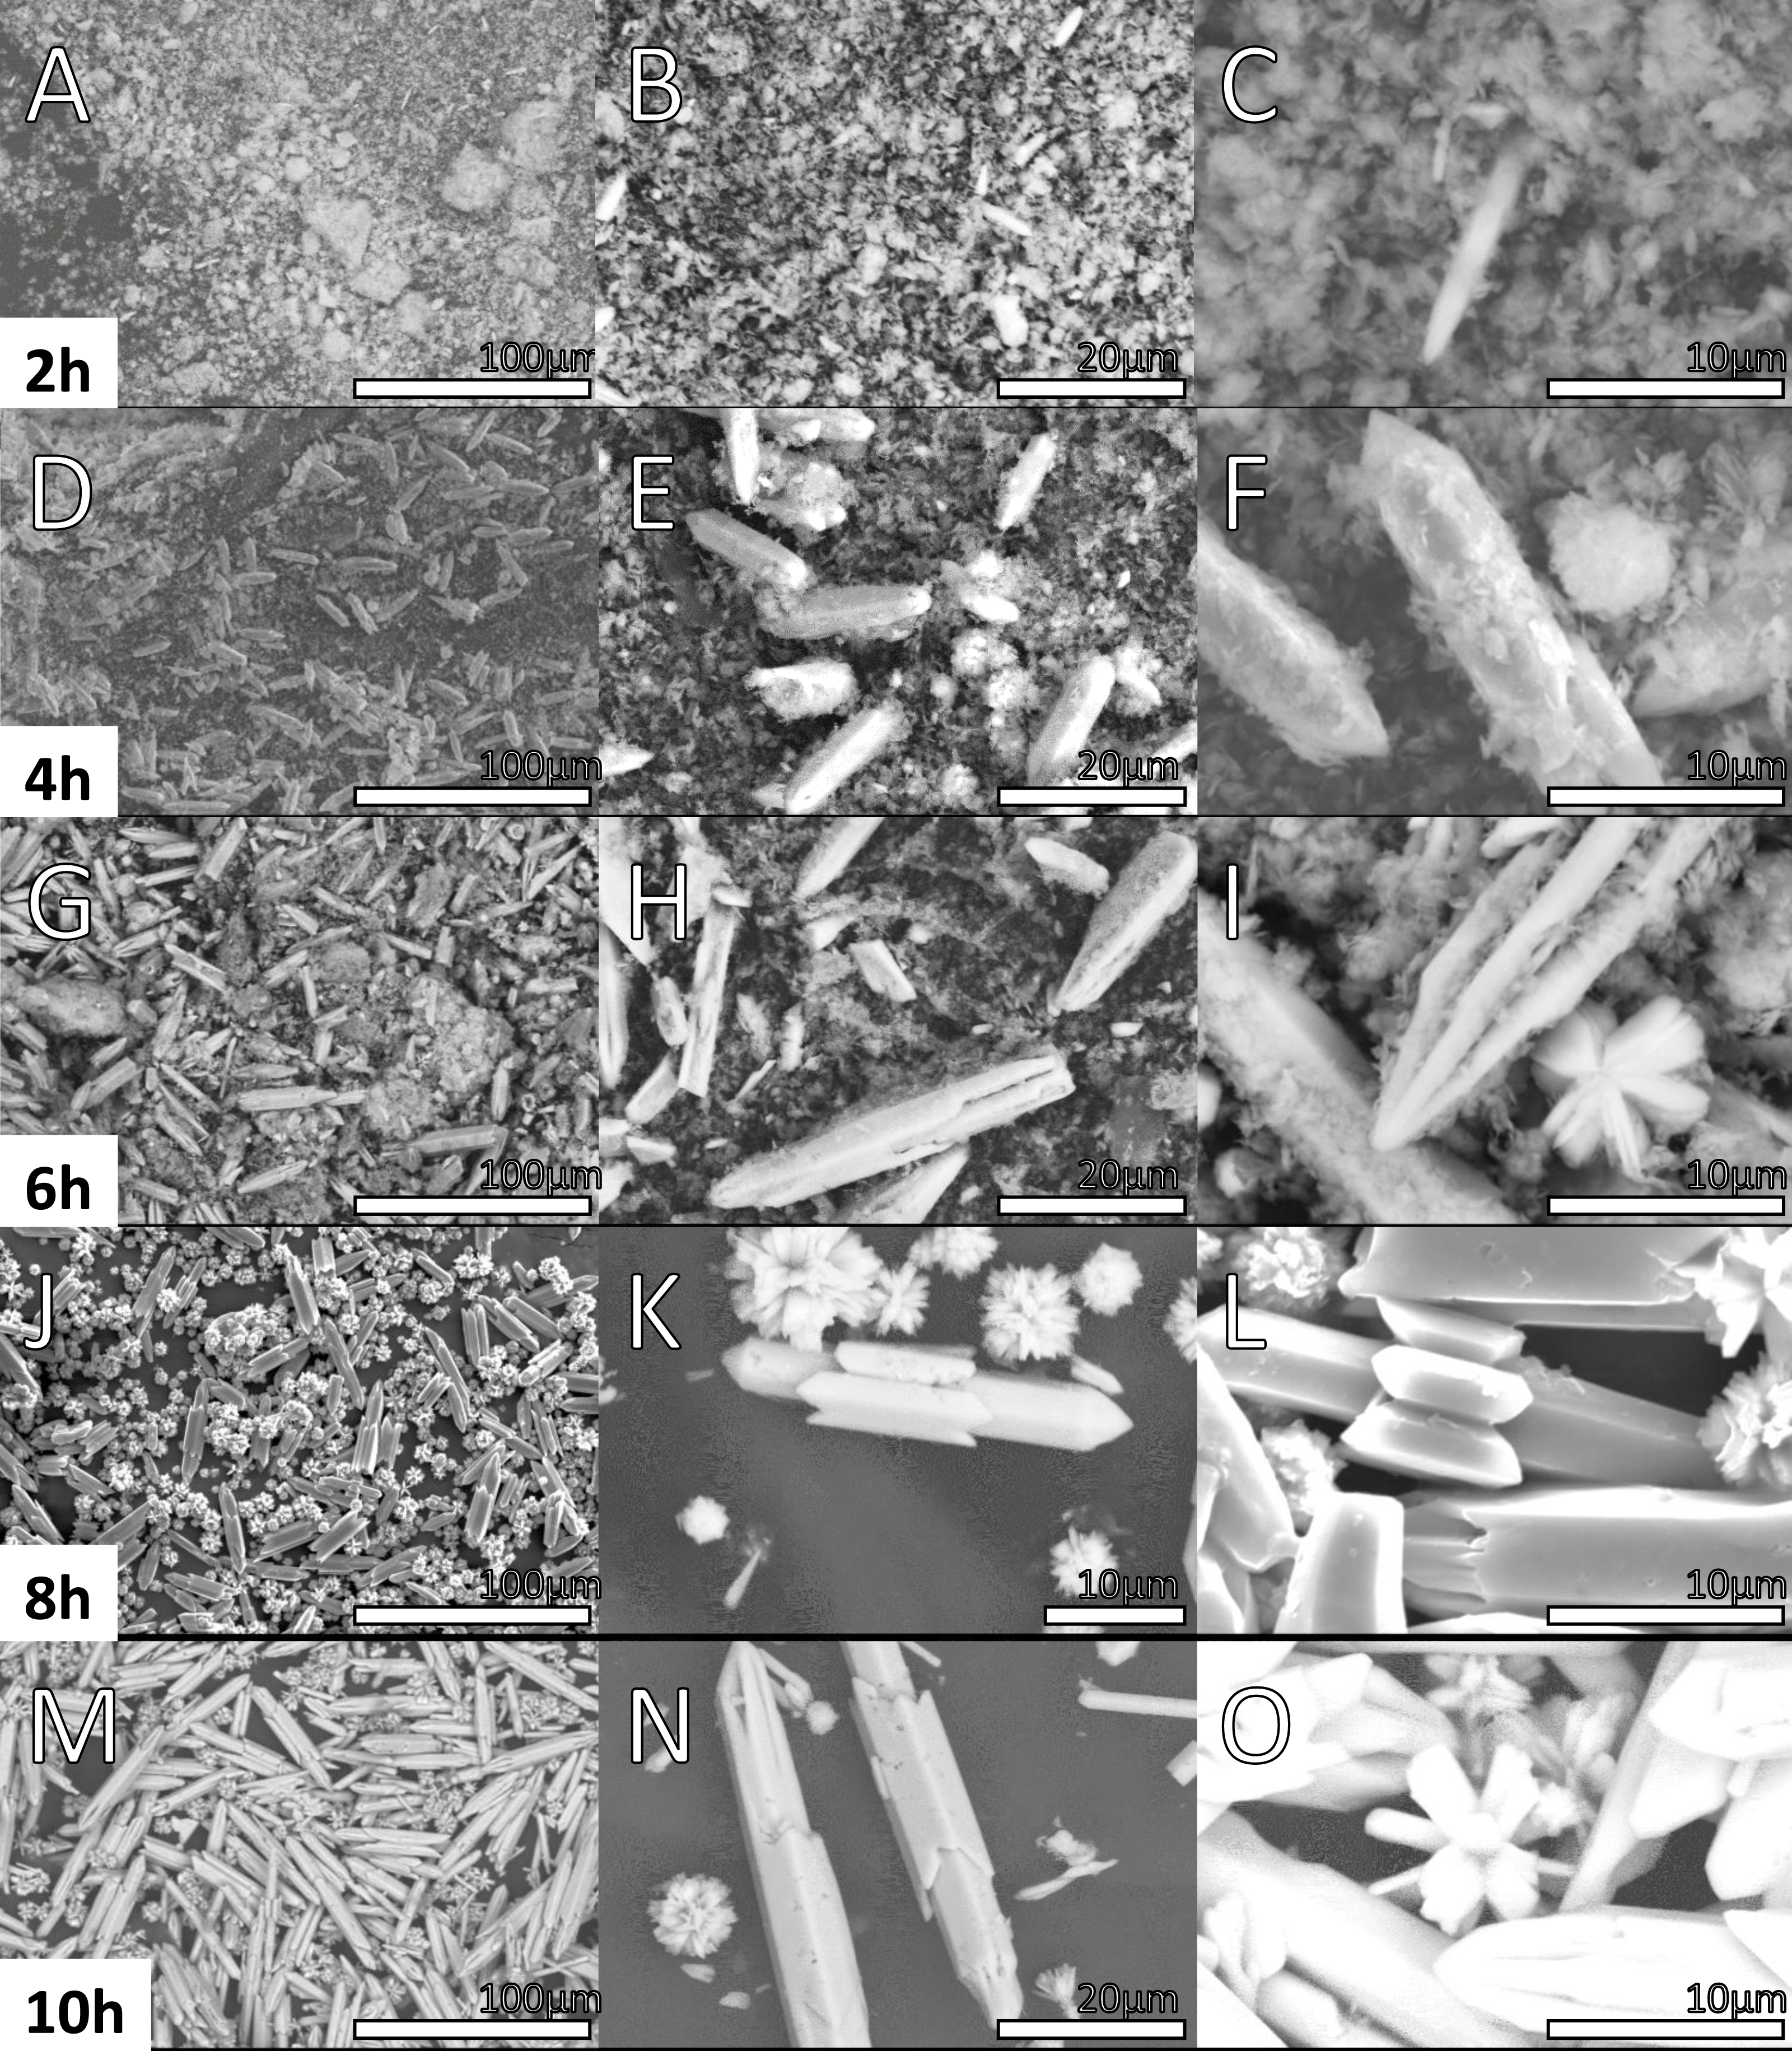
Figures 6 and 7 shows the morphology of the samples prepared at 2, 4, 6, 8, 10, 12, 16, 20 and 24 h. SEM images of the material synthesized at 2 h show two different morphologies.
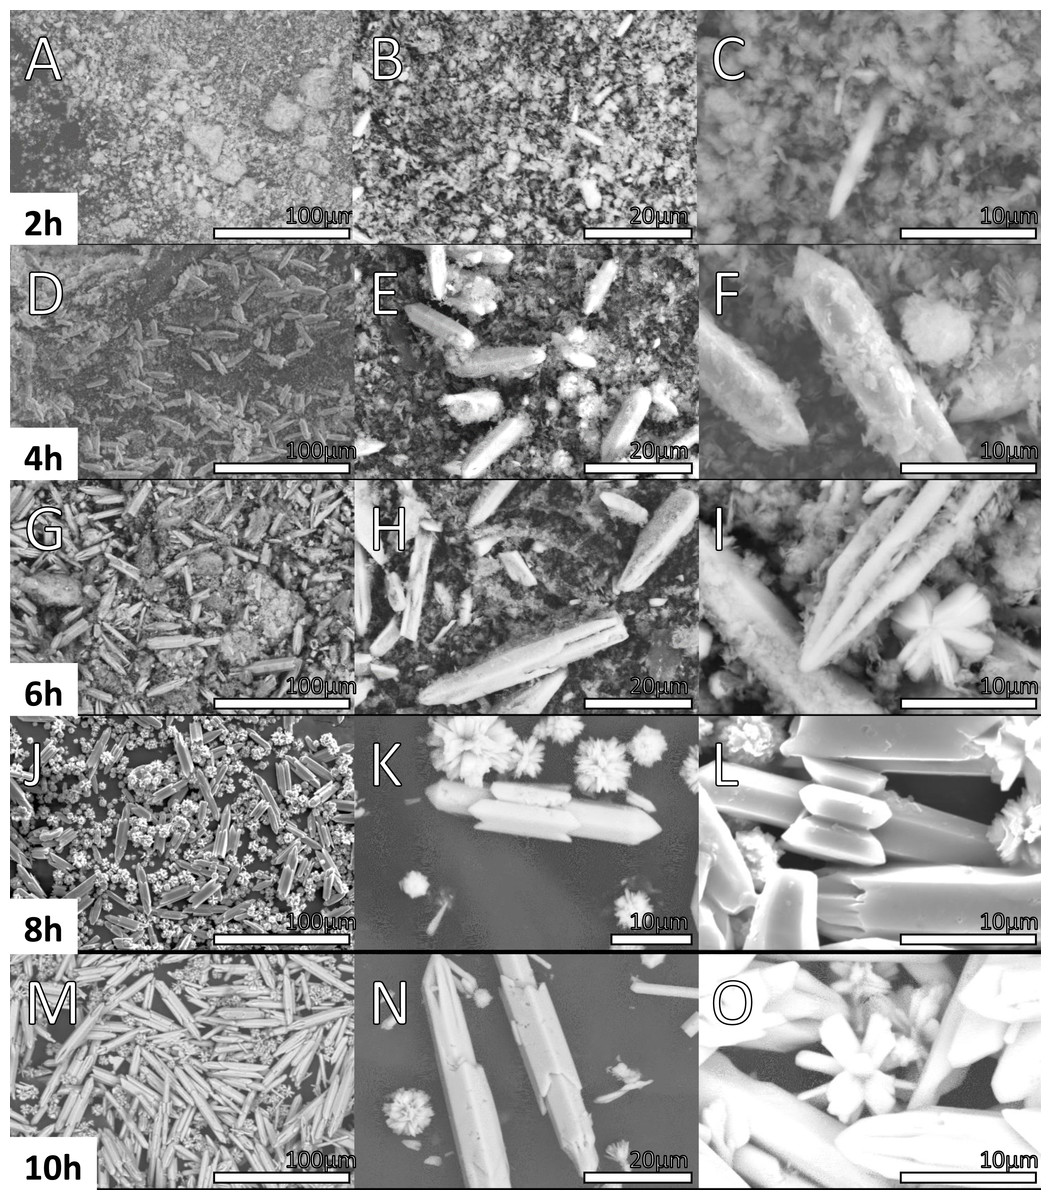
Figure 6: SEM micrographs of Y(OH)3 Samples obtained at 2, 4, 6, 8 and 10 h.
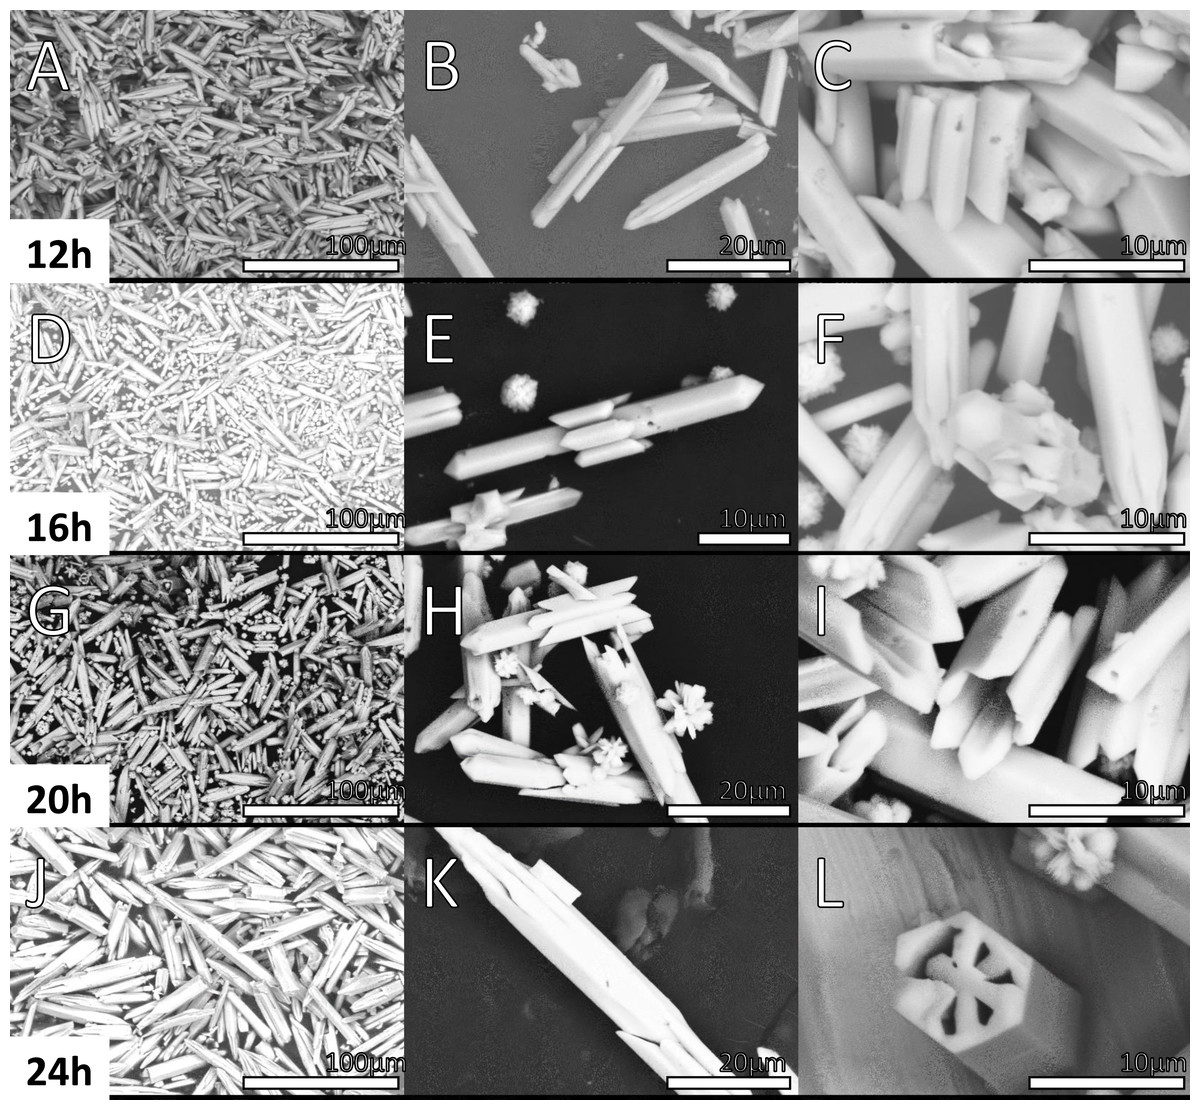
Figure 7: SEM micrographs of Y(OH)3 Samples obtained at 12, 16, 20 and 24 h.
In Figs. 6A, 6B, 6C, an amorphous material with a cloud-like appearance is observed, this morphology is associated to a mixture between the complex precursor Y(OH)2NO3 as discussed in XRD and the nucleation seeds. In fact, by the refinement process achieved in XRD results, the Y(OH)2NO3 phase component displayed wide signals that can be correlated with the amorphous nature of this phase. Besides, the crystallite size calculated by the refinement process in the sample synthesized at 4 h are 119 and 114 pm in the (100) and (001) directions, respectively the needles structures are not formed yet. Structures in one dimension (1D) are clearly observed in the micrographs (Figs. 7A, 7B, 7C) corresponding to the sample synthesized at 12 h; these structures are microbars with pointed ends, that were correlated with Y(OH)3. Regarding the micrographs corresponding to the products obtained at 4 h of reaction (Figs. 6D, 6E, 6F), where a 100% purity of the Y(OH)3 phase is not still reached, a mixture of morphologies (clouds and microbars) is observed; this mixture of morphologies could be related to the mixture of phases observed in XRD. Another important aspect observed is that the microbars present in the materials synthesized at 12 h have a larger size than those observed at shorter hours of synthesis.
Table 2 shows the average length of the microbars for every reaction time, it can be observed that its size increases as the reaction time increases, nevertheless, not linear dependence is observed due to the different morphologies that the material presents over the time. Micrographs from Figs. 6 and 7 show the size 1D structure of Y(OH)3 increases with the reaction time. Furthermore, the micrographs show different morphologies.
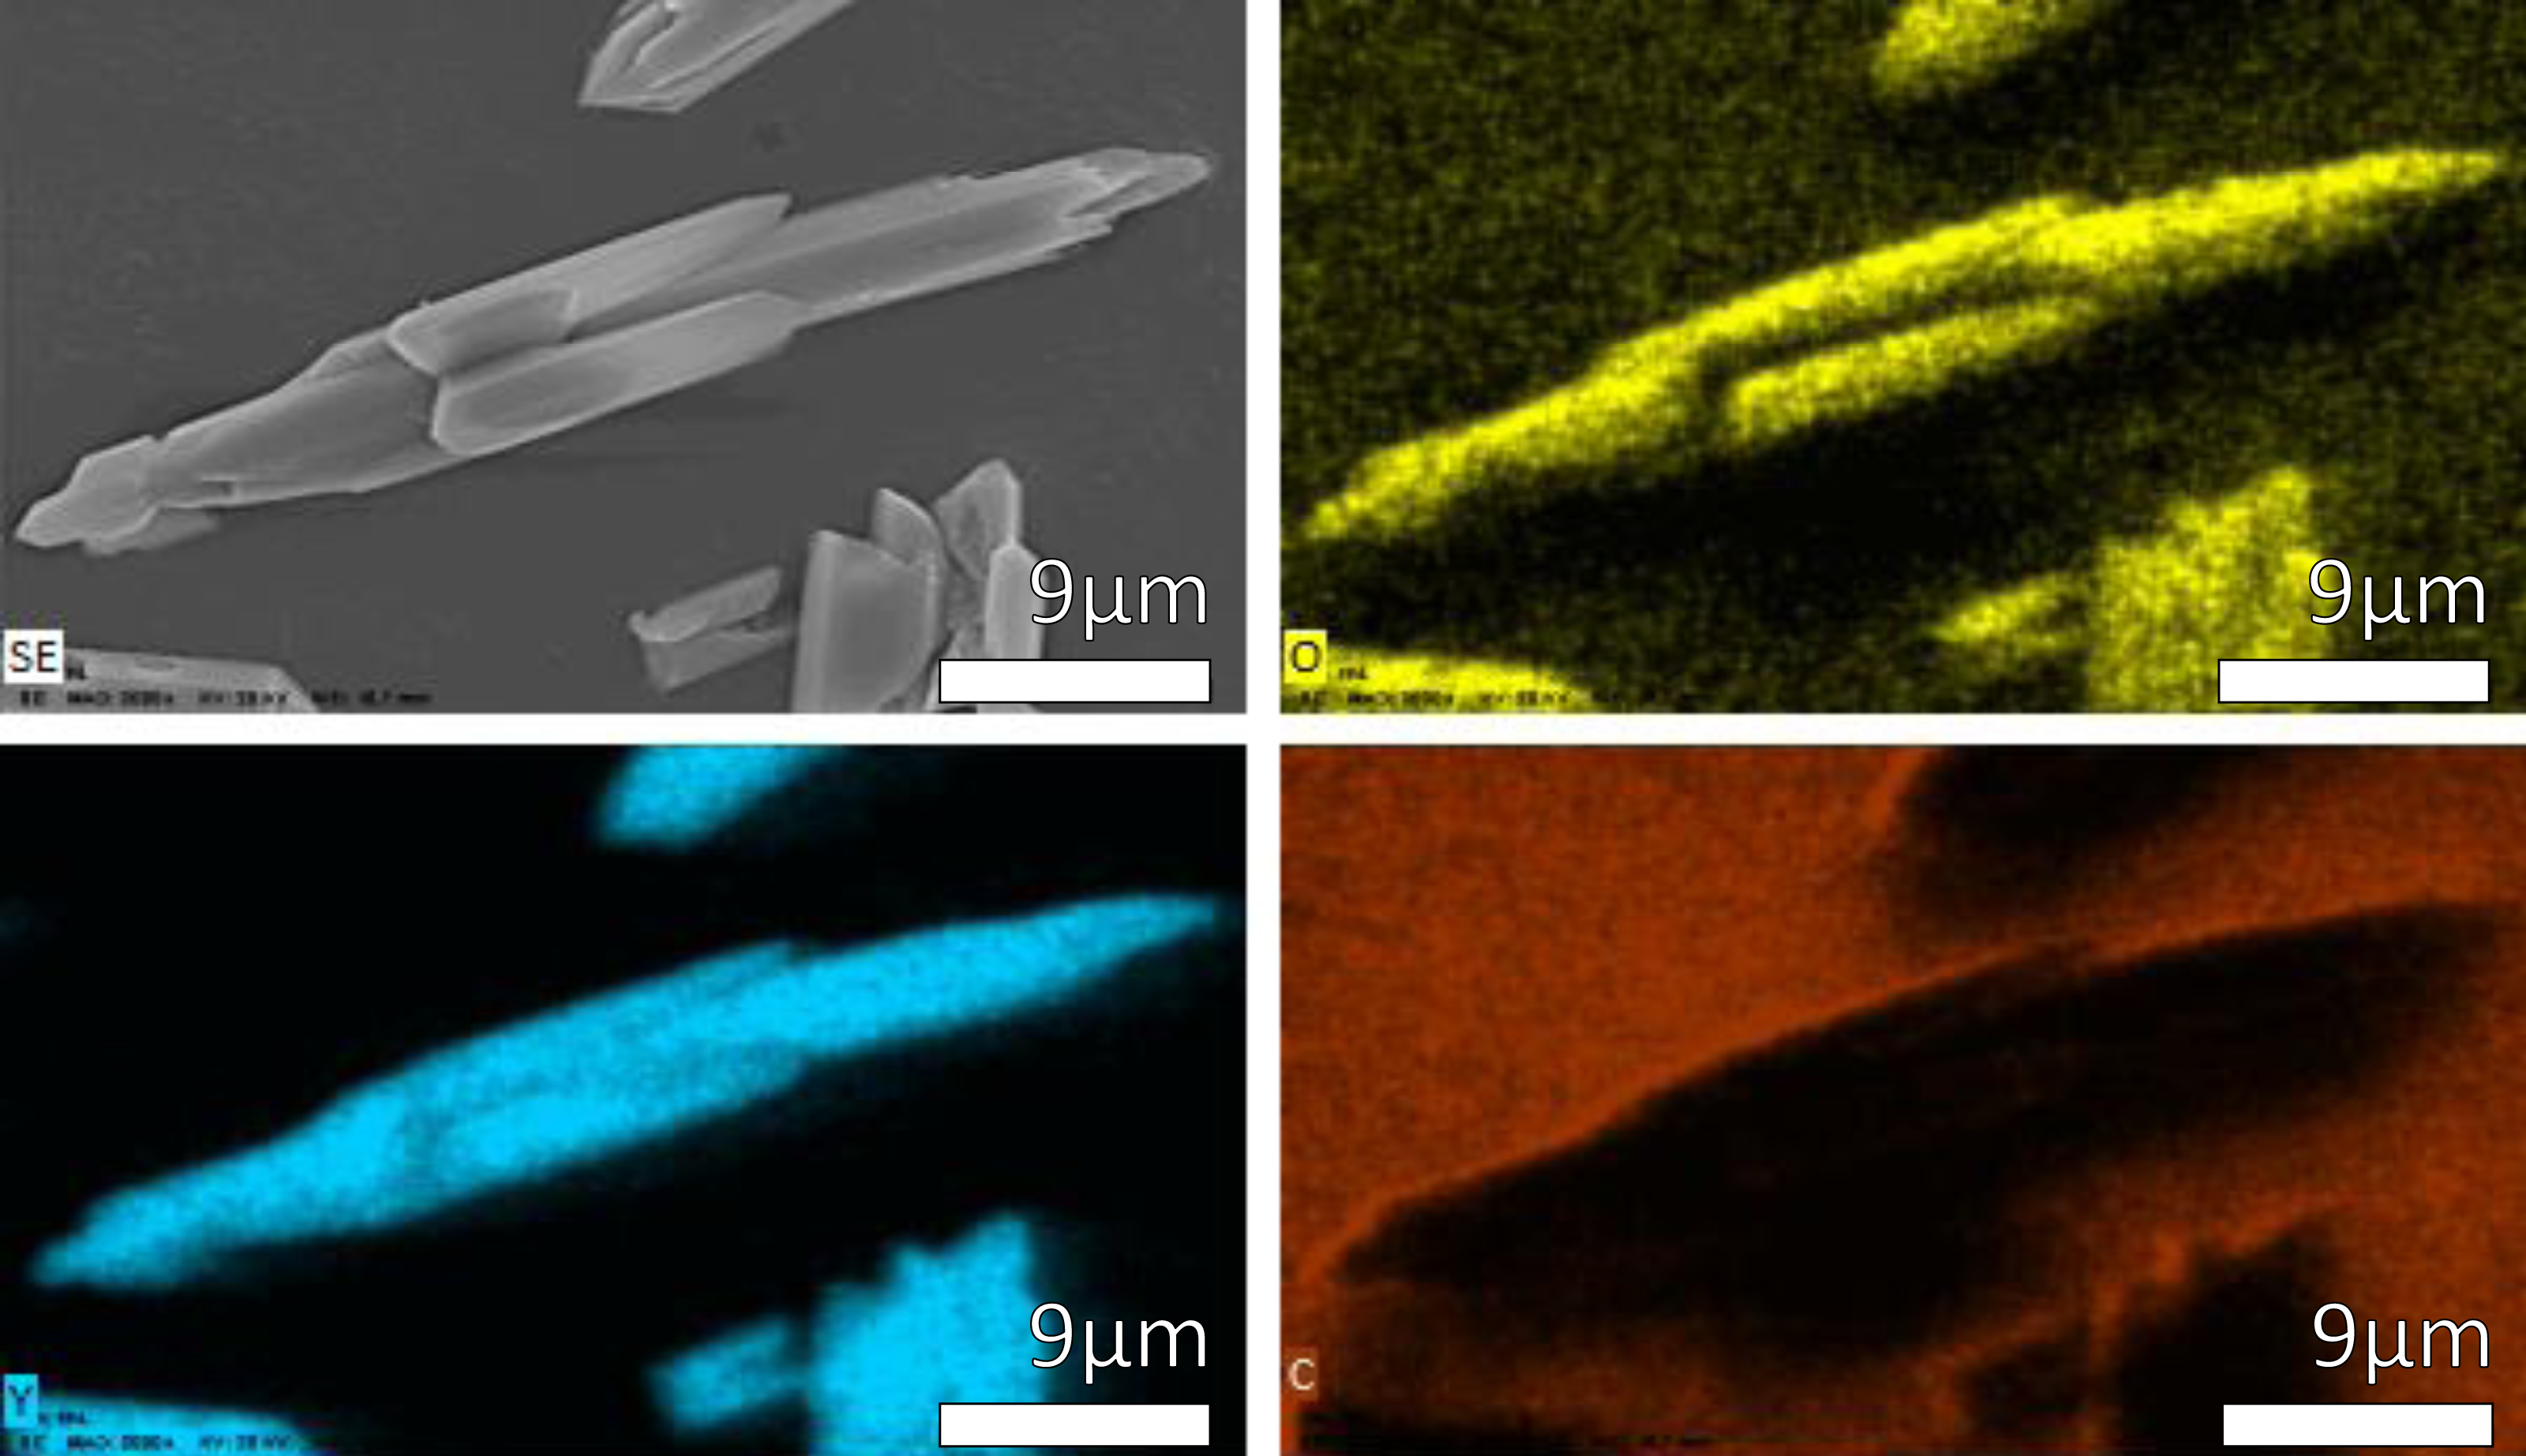
In order to identifies the elemental composition in the samples, Energy dispersive X-ray analysis were carried out. The results of semi-quantification are in Table 3 and the spectrums of each sample are in Fig. S4. Figure 8 shows an elemental mapping of few particles of Y(OH)3 at 12 h as well in Fig. S5 show an elemental line scan of Y(OH)3 at 12 h. These two studies show only the presence of yttrium and oxygen, and how these two elements are distributed in each particle.
Thermal analysis (TG and DSC)
The results are shown in Fig. 9 and Table 4, the values of the loss in mass percentage of each sample are shown.
Sato et al. carried out a phase transformation study of Y(OH)3 to Y2O3 using different precursors in aqueous solution. The authors mention that, with yttrium nitrate in alkaline solutions, hexagonal Y(OH)3 is preferably obtained (Sato, Imaeda & Sato, 1988).
The TG curve of the 2 h sample (Fig. 9) shows first mass loss between 50 and 200 °C typically associated with the desorption of water from the material surface and corresponds to the nitrates and the chemosorbed water of the compound Y(OH)2NO3⋅xH2O, these results are in agreement with the XRD results where 55% of Y(OH)2NO3 can be identified. In the DSC curve of this sample three endothermic peaks are observed, which are related with three transformation processes that occur in the sample. The first one at 315 °C corresponds to the formation of amorphous YOOH. The second one at 398 °C corresponds to the apparition of the monoclinic phase of YO(OH); and finally, the endothermic peak at 606 °C corresponds to the crystallization of the cubic yttrium oxide (Sato, Imaeda & Sato, 1988).
On the other hand, in the sample synthesized at 12 h three endothermic peaks are observed, here the changes in the crystalline phases present during the thermal treatment can also be observed. The first one at 294 °C corresponds to the formation of the amorphous YO(OH), the second one at 407 °C corresponds to monoclinic YO(OH), and finally the last one at 577 °C corresponds to the crystallization of the cubic yttrium oxide. The first weight loss observed between 50 and 250 °C is associated with the chemisorbed water.
It is important to highlight that the samples obtained after at 2 h and 12 h of reaction do not present the YO(OH) phase as can be observed in Table 1 with XRD studies. Therefore, the route to obtain YO(OH) requires 8 and 10 hours of reaction.
Discussion
On the basis of all the presented results, the reaction time determines the formation of pure and crystalline Y(OH)3. A characteristic of this material is that the vibrations corresponding to the O-H and Y-OH bonds are active in both spectroscopies; due to the symmetry present in the unit cell of Y(OH)3 (Schenzel, Fischer & Brendler, 2005).
The intensity and width of the peaks observed in the Raman spectra (Fig. 2) can be associated to the crystallinity of the material, comparing the results with XRD (Fig. 3). The width of the peaks decreases when the crystallinity in XRD increase.
In the FT-IR spectra at 2 h and 4 h (Fig. 1), a wide band around 3,610 cm−1 corresponding to the O-H stretching vibration from Y(OH)3 can be observed; besides, the observed bands in 1,500 and 1,363, and 1,514 and 1,370 cm−1 at 2 h and 4 h respectively, can be attributed to the O-H bending mode from the hydroxide, based on the Spectral Database for Inorganic Compounds file SDBS 40273 (Garduño Wilches et al., 2019).
Nevertheless, the 1,370 cm−1 band can be also attributed to yttrium nitrate; specifically, to the asymmetrical de-generate stretching N-O bond vibration, νd (NO). In fact, due to their strong covalent character, it has been reported that this band can be observed split in Y, La, Pr, Nd, Sm and Gd nitrates (Biinzli, Milicic-Tang & Mabillard, 1993).
These peaks around 1,500 and 1,370 cm−1 are observed up to 10 h, they decrease in intensity since the contribution made by the intensity of nitrates is only observed up to 6 h. At 6 h there is not any N observed in EDS (Table 3).
The FT-IR spectra at 6 and 8 h are similar to FT-IR spectra at 2 and 4 h only the bands at 1,509 and 1,370 cm−1 are less relative intensity due to the concentration of Y(OH)2NO3.
Whereas in the spectra that corresponds to the material synthesized at 12 h only two narrow bands are observed in 3610 and 707 cm−1, corresponding to the O-H stretching vibration and Y-OH bending vibrations, respectively; both present in the Y(OH)3 (Sato, Imaeda & Sato, 1988). Besides, it is important to note the absence of the bands attributed to NO bonds.
| Reaction time [h] | Average length [µm] |
|---|---|
| 2 | 8.83 |
| 4 | 15.44 |
| 6 | 28.87 |
| 8 | 31.86 |
| 10 | 40.12 |
| 12 | 26.43 |
| 16 | 21.07 |
| 20 | 27.17 |
| 24 | 69.97 |
| Reaction time [h] | Mass concentration [%] | ||
|---|---|---|---|
| N | O | Y | |
| 2 | 4.49 | 41.51 | 54 |
| 4 | 4.14 | 33.68 | 62.18 |
| 6 | 5.81 | 38.48 | 55.71 |
| 8 | 28.13 | 71.87 | |
| 10 | 30.92 | 69.08 | |
| 12 | 35.37 | 64.63 | |
| 16 | 37.65 | 62.35 | |
| 20 | 30.20 | 69.80 | |
| 24 | 32.05 | 67.95 | |
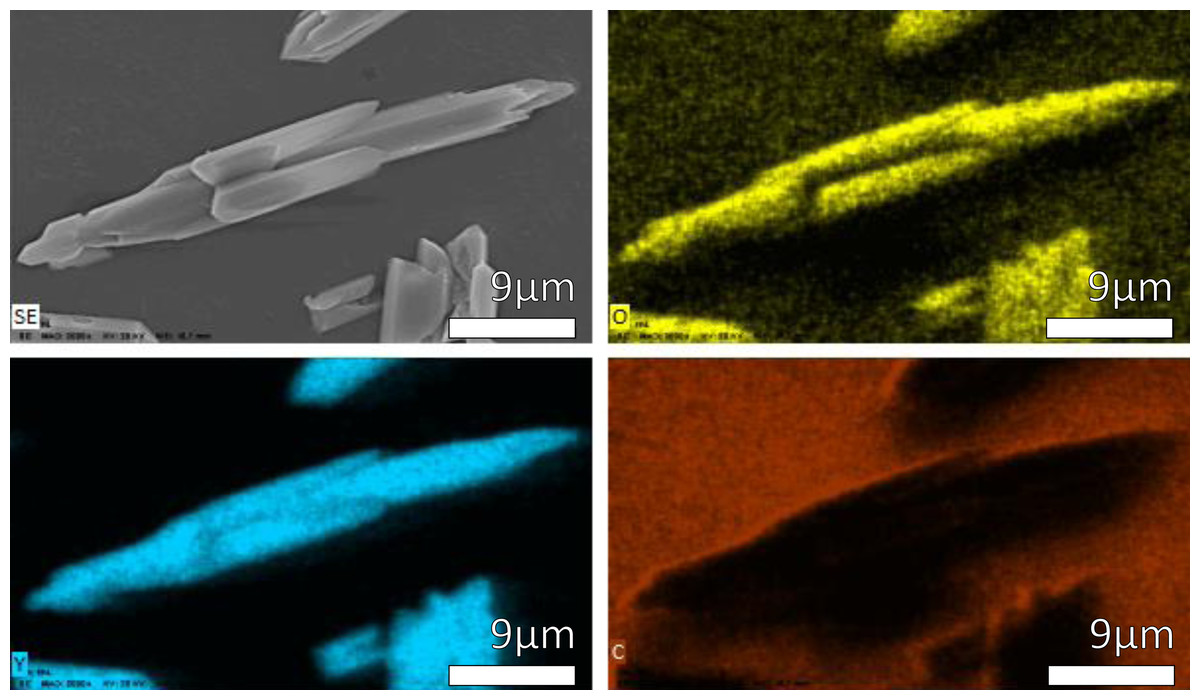
Figure 8: EDS mapping of Y(OH)3 obtained at 12 h.
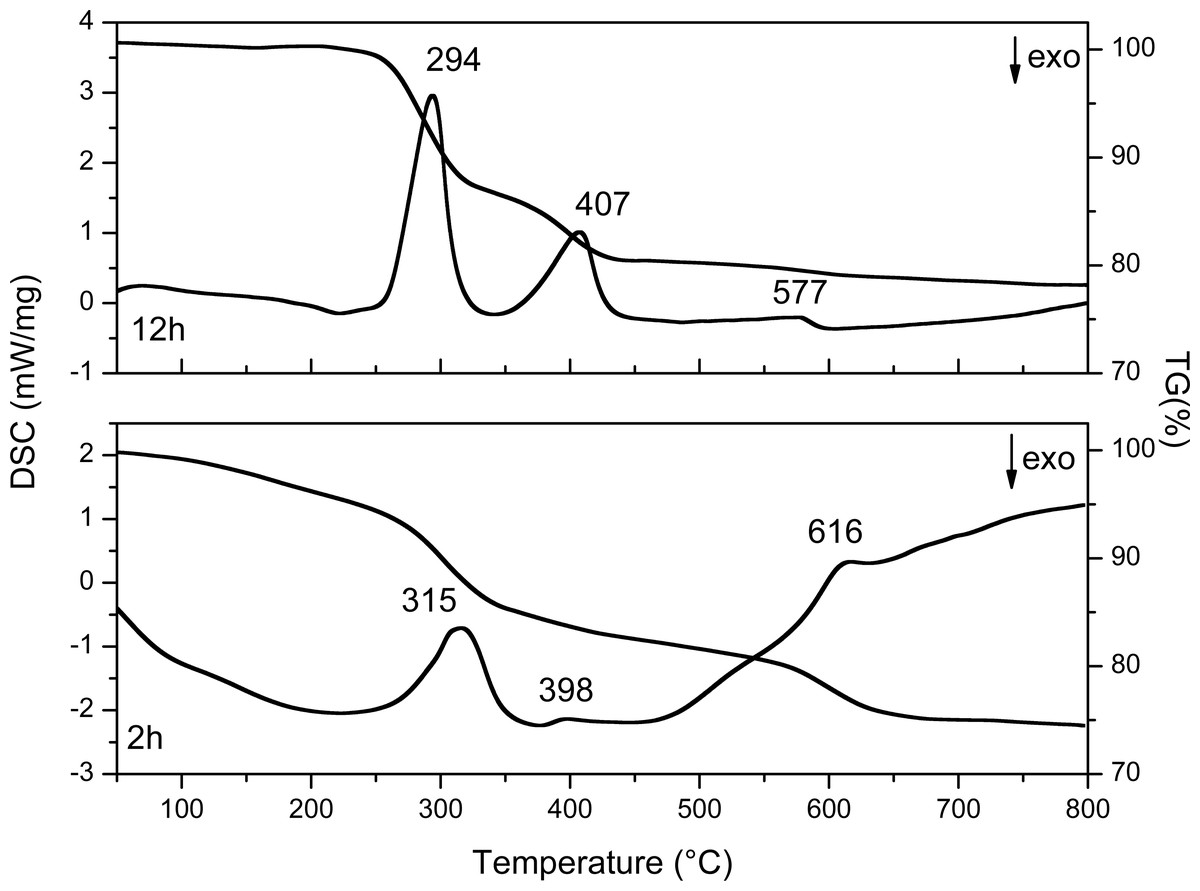
Figure 9: DSC and TG curves of Y(OH)3 obtained at 2 and 12 h.
The FT-IR spectra at 16, 20 and 24 h are similar to FT-IR at spectra at 12 h due to the purity of the material do not change from 12 h. The FT-IR spectra at 8 and 10 h have other bands around 1,519, and 1,387 and 1,735, 1,519, 1,379, and 1,218 cm−1 respectively, due to the formation of YO(OH).
In Fig. 2 the Raman spectra are shown. Here it can be observed an intense peak at 3,610 cm−1, corresponding to the O-H bonds in the structure of Y(OH)3; whereas the peak observed at 700 cm−1 can be attributed the Y-OH bond. It is worth noting that these spectra are similar to the one reported by Li et al. for crystalline Y(OH)3.
The XRD patterns change according to the reaction time due to the formation of the precursor Y(OH)2NO3 and the formation of the YO(OH).
Table 1 shows the results of the Rietveld refinement performed for each sample. The Y(OH)3 obtained presented a hexagonal unit cell P63/m with the following crystal cell lattice parameters: a = 6.2872 Å and c = 3.55831 Å and they are in good concordance with the lattice parameters reported (Hari Krishna et al., 2014).
| Sample | Mass loss (%) | ||
|---|---|---|---|
| 1 | 2 | 3 | |
| 2 h | 4.40 | 10.53 | 10.05 |
| 12 h | 13.20 | 6.67 | 2.25 |
In Fig. S6, the result of refinement process achieved in the 2 h sample is shown. In a first place, the background fitted was no linear. As can be observed, the peaks related with the raw material, Y(NO3)3(H2O)6 is present; peaks for Y(OH)2NO3 were also found, it can be considered as intermediate in the formation for Y(OH)3. For these cited phases, the observed broadening in the peaks can be correlated with low crystallinity in these compounds, due to the phase transformation towards yttrium hydroxide. Whereas, the fitted peaks for Y(OH)3 phase are shape, which is related with a relatively high crystallite size; in this context, in Table S1 the calculated crystallite size are shown, as can be seen, this size is anisotropic, which is related with the hexagonal lattice of the yttrium hydroxide and the observed morphology in electron microscopy characterization. Furthermore, the calculated strain in the Y(OH)3 phase also shown in Fig. S6 results to be isotropic.
The UV-vis spectra at 2, 4 and 12 h of reaction decrease in intensity since as the reaction time progresses the samples cease to be soluble in isopropanol and the dispersion of the samples decreases. The sample at 2 h is soluble and after 10 min does not precipitate, the sample at 4 h is soluble and after 10 min it start to precipitate, and the sample at 12 h is not soluble and after 3 min it precipitated. It is because of this difference in solubility of the samples that they decrease the intensity.
The changes in the value of the optical band gap can be associated with the crystallinity and the purity of the material, as observed in XRD (Hari Krishna et al., 2014).
Based on the SEM micrographs, diffraction patterns and previous report (Luo et al., 2020), the morphology evolution process as the reaction time progresses was proposed in Fig. 10. After mixing the Y(NO3)3 in ethanol the Y3+ ions are available in the system to react with the NaOH, forming a coordination complex with the OH− groups. Then, increasing the temperature and pressure of the system (Fig. 10A) the coordination complex get into Y(OH)3. This Y(OH)3 is converted into nucleation seeds. Subsequently, the seeds being to grow preferentially in the {100} facets exemplified in Fig. S7 to form the bars in Figs. 10B, 10C (Wang others, 2009). The growth is also observed along the {110} and {200} facets (Fig. S7) and it can be seen in Figs. 10D, 10E how the growth in these facets covers the particle as if it were a belt, this belt continues growing throughout until completely covers the bar as seen in Fig. 10F. As the reaction time progresses this process continues and another belt of the material settles around the bars and continues to grow, increasing its size and width. This process is observed in Figs. 10G, 10D, 10I. Moreover, not all bars form at the same time. There are nucleation seeds available and new little bars are formed following the same process, some of these little bars have an affinity for the large bars forming belts with the little bars. But other little bars continue to grow in length to become large bars and then start the process with belts of little bars, thus the sizes of Table 2 do not increase linearly. At the same time that this happens, particles like flowers are also formed that decrease in size as the reaction time increases.
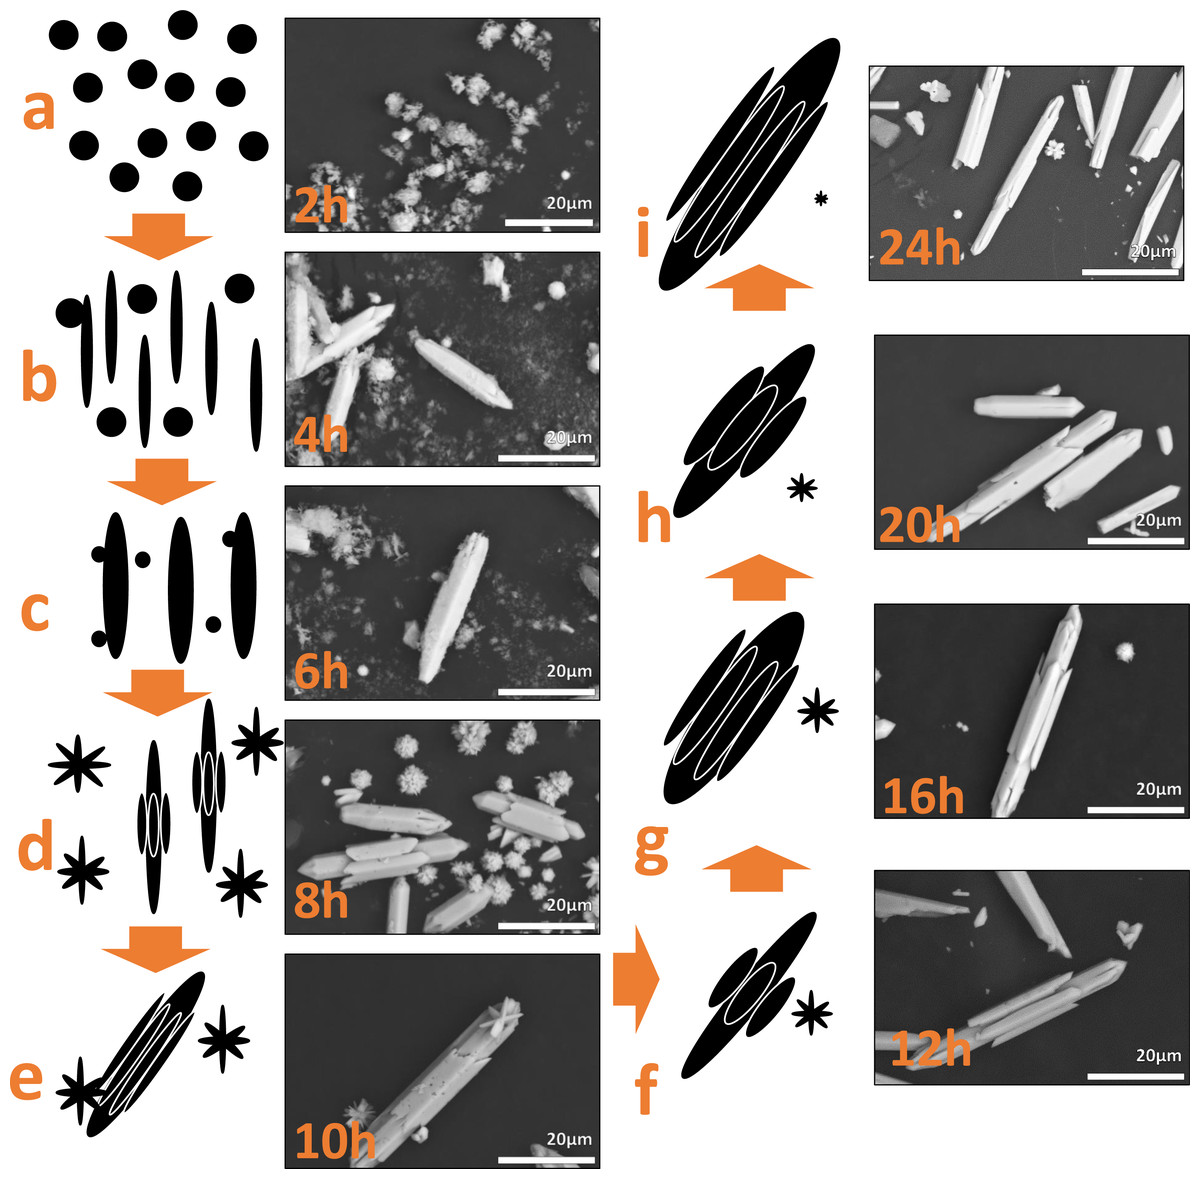
Figure 10: Schematic illustration for the formation of the Y(OH)3 using the results of each reaction time.
The energy dispersive X-ray analysis presented in Table 3 and Fig. S4 show that in samples at 2, 4 and 6 h there are nitrogen which agrees with the data obtained in XRD, this nitrogen comes from the complex precursor Y(OH)2NO3. In the elemental analysis of the samples at 8, 10, 12, 16, 20 and 24 only appear yttrium and oxygen so it agrees with the formation of Y(OH)3 and YO(OH).
The differences between thermograms obtained (Fig. 9) from the synthesized samples at 2 and 12 h are evident. The first weight loss at 2 h has a higher slope than the first weight loss at 12 h. This is because in the sample at 2 h the synthesis started with a compound, which contains a greater amount of water and compounds such as nitrates. On the other hand, the sample at 12 h contains less amount of water and it do not have nitrates up to 250 °C. Because nitrates can be thermally decomposed.
Conclusions
In summary, this work evidences the process of the morphological evolution of Y(OH)3 as the reaction time is increased. Considering the results of scanning electron microscopy and X-ray diffraction over time, the morphology evolution process followed by the Y(OH)3 particles to increase their size was described. Also, analyzing the results of energy dispersive X-ray spectroscopy, Fourier-transform infrared spectroscopy, Raman spectroscopy, thermogravimetric analysis, and differential scanning calorimetry of Y(OH)3, the phases and elements present in each sample over time could be identified. These characterization results also provide evidence of the reaction time as a key variable to obtain the Y(OH)3 with the desired characteristics: high chemical and phase purity, as well as shape tuning. As a result, the reaction time of the 12 h-synthesis is concluded to be the shortest time and it is a sufficiently long time that allows to obtain the highest purity and uniform shape of Y(OH)3. Times longest that 12 h are not necessary in order to obtain only Y(OH)3. On the other hand, if bigger particles of Y(OH)3 are required it could obtain increasing the reaction time. However, as discussed in this work, the chemical and phase purity, as well as the shape of Y(OH)3, can be tuned by modifying the reaction time.
Supplemental Information
Calculated Crystallite size and crystal micro strain for Y(OH)3 phase in the sample obtained at 2 h
FTIR spectra of Y(OH)3 perpared at 4, 6, 8 10, 16 and 20 h
Raman spectra of Y(OH)3 perpared at 4, 6, 8 10, 16 and 20 h
Schematic representation of the crystal structure of Y(OH)3
EDS spectra of Y(OH)3 perpared at 4, 6, 8 10, 16 and 20 h
Results of refinement of the sample prepared at 2h
Results of refinement of the sample prepared at 2 h; the background component as well as the difference between experimental and calculated data are also shown.