
Characterization and evaluation of the photocatalytic activity of oxides based on TiO2 synthesized by hydrolysis controlled by the use of water/acetone mixtures
- Published
- Accepted
- Received
- Academic Editor
- Nicholas Marshall
- Subject Areas
- Catalysts, Composites, Energy Materials, Porous Materials, Semiconductors
- Keywords
- Characterization, Photocatalytic activity, Hydrogen production, Enhanced photocatalysis, TiO2-based oxides, Controlled hydrolysis
- Copyright
- © 2020 Machado and da Hora Machado
- Licence
- This is an open access article distributed under the terms of the Creative Commons Attribution License, which permits unrestricted use, distribution, reproduction and adaptation in any medium and for any purpose provided that it is properly attributed. For attribution, the original author(s), title, publication source (PeerJ Materials Science) and either DOI or URL of the article must be cited.
- Cite this article
- 2020. Characterization and evaluation of the photocatalytic activity of oxides based on TiO2 synthesized by hydrolysis controlled by the use of water/acetone mixtures. PeerJ Materials Science 2:e11 https://doi.org/10.7717/peerj-matsci.11
Abstract
New photocatalysts based on TiO2 were synthesized and characterized. The synthesis involved the controlled hydrolysis of titanium tetraisopropoxide using water containing different proportions of acetone. X-ray diffraction analyses combined with Raman spectroscopy revealed crystalline oxides characterized by the coexistence of the anatase and brookite phases. The Rietveld refinement of diffractograms showed that the presence of acetone in the synthesis process influenced the composition of these crystalline phases, with the proportion of brookite growing from 13% to 22% with the addition of this solvent in the synthesis process. The BET isotherms revealed that these materials are mesoporous with surface area approximately 12% higher than that of the oxide prepared from hydrolysis using pure water. The photocatalytic potential of these oxides was evaluated by means degradation tests using the dyes Ponceau 4R and Reactive Red 120 as oxidizable substrates. The values achieved using the most efficient photocatalyst among the synthesized oxides were, respectively, 83% and 79% for mineralization, and 100% for discoloration of these dyes. This same oxide loaded with 0.5% of platinum and suspended in a 5:1 v/v water/methanol mixture, produced 56 mmol of gaseous hydrogen in 5 h of reaction, a specific hydrogen production rate of 138.5 mmol h−1g−1, a value 60% higher than that achieved using TiO2 P25 under similar conditions.
Introduction
Energy and environment are essential and challenging themes for humanity. The growing demand for energy combined with environmental contamination, particularly water contamination, has driven the search for sustainable resources and alternative processes aimed at minimizing negative impacts related to these issues (Cunha et al., 2018; Tractz et al., 2019).
Heterogeneous photocatalysis has proving to be a good alternative. Studies have shown its effectiveness in environmental remediation of contaminated waters (Machado et al., 2008; França et al., 2016; Meramo-Hurtado, Moreno-Sader & González-Delgado Ángel, 2019), as well as in hydrogen production (H2), an important energy vector (Bahnemann & Schneider, 2013; Rusinque, Escobedo & Lasa, 2020; Galvão et al., 2019).
Much of the efforts spent on expanding the use of heterogeneous photocatalysis were based on the development of new semiconductor materials with increased photocatalytic activity. Among the possible photocatalysts, TiO2 stands out due to its abundance, insolubility in water, low toxicity, good chemical stability in a wide pH range, and photostability (Kandiel et al., 2010). Despite these desirable characteristics, TiO2 may present low surface area (depending on the size and shape of crystallites), fast recombination rate of the photogenerated charge carriers (electron/hole) and absorption of radiation in ultraviolet (Bahadori et al., 2020). However, such limitations may be circumvented through structural modifications or by the introduction of dopants (Machado, Alves & Machado, 2019; Santos et al., 2015b; Martin-Somer et al., 2020).
TiO2 presents itself according to three distinct crystalline phases: brookite, with orthorombic structure, anatase and rutile, both with tetragonal structure, widely used in heterogeneous photocatalysis (Fujishima, Zhang & Tryk, 2008). Experimental and theoretical studies suggest that a high percentage of anatase phase and small fraction of brookite guarantees greater photocatalytic activity to TiO2, compared to pure anatase, due the existence of structural defects that end up delaying the displacement of electrons and holes, minimizing the recombination between load carriers, making more reactive the surface of the photocatalyst (Jiang et al., 2014; Di Paola, Bellardita & Palmisano, 2013).
Efforts have been spent on improving methods that allow the control and reproducibility of the synthesis of this kind of material, which allows the obtaining of particles with mixed crystalline phases and high photocatalytic yields (Luevano-Hipolito et al., 2014; Mohammadi, Harvey & Boodhoo, 2014; Myilsamy, Murugesan & Mahalakshmi, 2015). In this sense, an approach that has proved feasible is the use of solvent combinations in the manipulation of the material mesostructure. Kumar et al. (1999) showed that sol–gel synthesis in a system involving the combination of different solvents strongly interferes with precursor hydrolysis, improving the structural properties of oxides.
In the present study, we performed the modified sol–gel synthesis of TiO2-based photocatalysts aiming to improve their photocatalytic activities. The precursor (titanium tetraisopropoxide) hydrolysis rate was controlled by the use of different proportions of acetone as co-solvent, reducing the availability of water in the process. With this, greater control of the formation and growth of critical nuclei was possible, avoiding the formation of very crowded particles. The synthesized oxides were characterized by X-ray diffraction (XRD), Raman spectroscopy, diffuse reflectance, specific surface area measurements (BET) and transmission electron microscopy (TEM). The photocatalytic activity of these compounds was evaluated in promoting the photodegradation of two azo dyes, used as oxidizable substrates: Ponceau 4R (P4R) and Reactive Red 120 (RR120). The best and least efficient photocatalyst, along with the TiO2 P25, were confronted in terms of hydrogen production capacity. The reuse potential of the best photocatalyst was also evaluated.
Materials and Methods
Experimental
All reagents used (titanium tetraisopropoxide, 97%; isopropanol, 99.5%; ponceau 4R (P4R), 75%; reactive red 120 (RR120)—purity not informed by the supplier; Methanol, 99.8%; hexahydrated hexachloroplatinic acid, 37.5%; hydrochloric acid, 37% and sodium hydroxide, 98%) were of analytical grade, provided by Sigma–Aldrich. Acetone 99.5%, was provided by Synth. All solutions were prepared with ultrapure water obtained from an Elix 5 Milli-Q® water purification system.
Preparation of photocatalysts
The oxides were obtained by the sol-gel method, involving the solubilization of titanium tetraisopropoxide in isopropanol at 3 °C under ultrasonic stirring for 20 min, followed by its hydrolysis by the addition of water/acetone mixture by drip and precipitation under ultrasonic stirring.
The water/acetone mixtures were prepared with deionized water and different proportions of acetone (0%, 25%, 50% and 75% v/v). The resulting amorphous solids were washed with distilled water, centrifuged and sintered using a conventional oven at 400 °C for 5 h.
The standard photocatalyst, synthesized in aqueous medium, was called W1. The other oxides, synthesized by hydrolysis using different water/acetone mixtures (25%, 50%, 75% v/v of acetone), were named W1-25, W1-50, W1-75, respectively.
Characterization of the photocatalysts
The photocatalysts were characterized by different methodologies. By X-ray diffraction (XRD) using a XDR600 (Shimadzu, Kyoto, Japan) powder diffractometer operating at 40 kV and 120 mA, using Cu Kα radiation. The diffractograms were scanned in the range between 10 and 80° under a rate of 0.5° min−1. Finally, they were refined by the method of Rietveld using the software “FullProf ” (Roisnel & Rodriguez-Carvajal, 2001). As criteria of mounting, the S factors were maintained between 1.22 and 1.31 (Table S1, Supplemental Information).
The Raman spectra were acquired at room temperature using a Bruker RFS 100/S spectrometer coupled to a 1,064 nm laser operating at 100 mW. Each Raman spectrum, with spectral resolution of 4 cm−1, is the result of the accumulation of 128 scans.
The diffuse reflectance spectra were obtained using a double beam UV-1650 (Shimadzu, Kyoto, Japan) spectrophotometer, estimating the band energy by Kubelka–Munk treatment (Patterson, Shelden & Stockton, 1977). In these measures, barium sulfate was used as reference.
The N2 adsorption–dessorption isotherms were obtained using an ASAP 2020 (Micrometrics) analyzer. The adsorption data were analyzed by the method proposed by Brunauer, Emmett and Teller (BET) for the surface area and the method of Barrett–Joyner–Halenda (BJH) for pore volume.
Transmission electron microscopy (TEM) images were obtained using a JEM-2100 (Jeol, Tokyo, Japan) microscope. In the preparation of the samples, suspensions containing the powders dispersed in acetone were used with the aid of a cutting-edge ultrasound. These suspensions were deposited on copper grids and air dried. From the images, obtained with the aid of the image editing software “ImageJ”, it was possible to calculate the particle size randomly selecting approximately 100 particles per image.
Photocatalytic assays
Four liters of an aqueous solution containing 100 mg L−1 of the photocatalyst were used in each photodegradation assay, in combination with a concentration equivalent to 12.0 ppm of dissolved organic carbon of the dye—corresponding to 31.3 mg L−1 of P4R or 43.5 mg L−1 of RR120—used as oxidizable substrates. Detailed experimental assembly for the photodegradation assays was described in a previous study (Oliveira et al., 2012).
A commercial 400 W high-pressure mercury lamp (HPLN) without the protective bulb was employed as radiation source. Under this condition, its estimated photonic flux in the UVA was of 3.3 × 10⁻⁶ Einstein/s (Machado et al., 2008), with an irradiance inside the reactor of 100 W/m2. During discoloration and dye mineralization monitoring, aliquots were collected every 20 min, in a total reaction interval of 140 min. The dyes discoloration was evaluated, without pH correction, by measuring the absorbance of the solutions, collected at different reaction times. Monitoring was done in the maximum absorbance wavelength in the visible of each dye—507 nm for P4R and 512 nm for RR120—using a UV-1201 (Shimadzu, Kyoto, Japan) spectrophotometer.
Mineralization was monitored from dissolved organic carbon (DOC) measurements, using a TOC-VCPH/CPN (Shimadzu, Kyoto, Japan) analyzer, aiming to identify the most efficient photocatalyst. These experiments were restricted only to the monitoring of P4R photodegradation.
The most efficient photocatalyst was also submitted to photodegradation tests using Remazol Red (RR120), comparing its performance with that presented by the commercial catalyst Evonik Degussa TiO2.
These assays were conducted at least in triplicate and separately for each dye.
The reuse of the most efficient photocatalyst was evaluated using P4R as oxidizable substrate. For this, after each reaction the photocatalyst was separated from the supernatant by decanting, washed with distilled water, centrifuged and dried at 70 °C for 24 h, and then reused under the same described conditions using a new load of the same dye. Each test was performed in quadruplicate in order to compensate for the losses that occurred during the washing of the catalyst, in order to ensure a constant mass in each cycle.
Subsequently, hydrogen production assays were done using the most effective synthesized photocatalyst, as well as the commercial catalyst Evonik Degussa TiO2 and the W1 oxide. In these experiments, the concentration of catalyst was similar to that used in the assays of dye degradation, being this oxide loaded by photoreduction with 0.5% m/m of Pt, furnished by a solution of hexachloroplatinic acid. So, the Pt-loaded photocatalyst was then suspended in 750 ml of a water/methanol mixture containing 20% v/v of methanol, this last being used as sacrificial reagent. These assays occurred under continuous stirring. The pH of the reaction medium was adjusted in 6.2 using solutions 0.1 mol L−1 of HCl or NaOH. Finally, the potential of reuse of the photocatalyst used in such assays was evaluated in at least three photocatalytic cycles. In the reuse assays, only the pH adjustment of the reaction medium was performed at the beginning of each new cycle. The first cycle was equivalent to the first hydrogen production test, carried out for 5 h. Thus, the total reaction time was 15 h.
For all photocatalytic assays the results are the averages of at least three individual experiments.
For operator protection and better use of radiation produced by the lamp, the reactor was positioned in a box internally covered with aluminum film, Fig. 1.
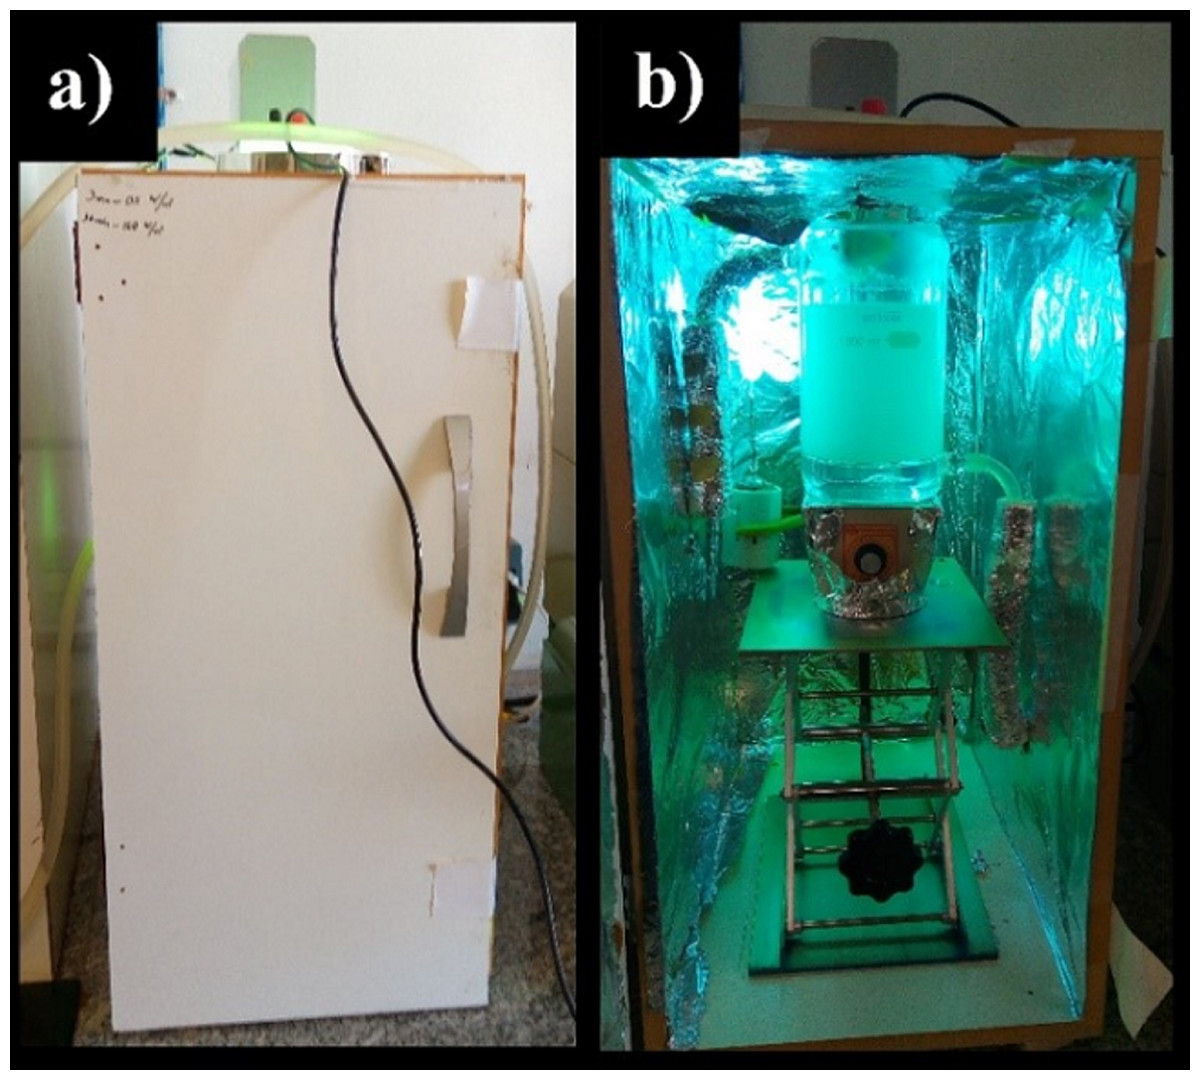
Figure 1: Assembly used in hydrogen production assays.
Image of the assembly used in hydrogen production assays: (A) external view, (B) internal view.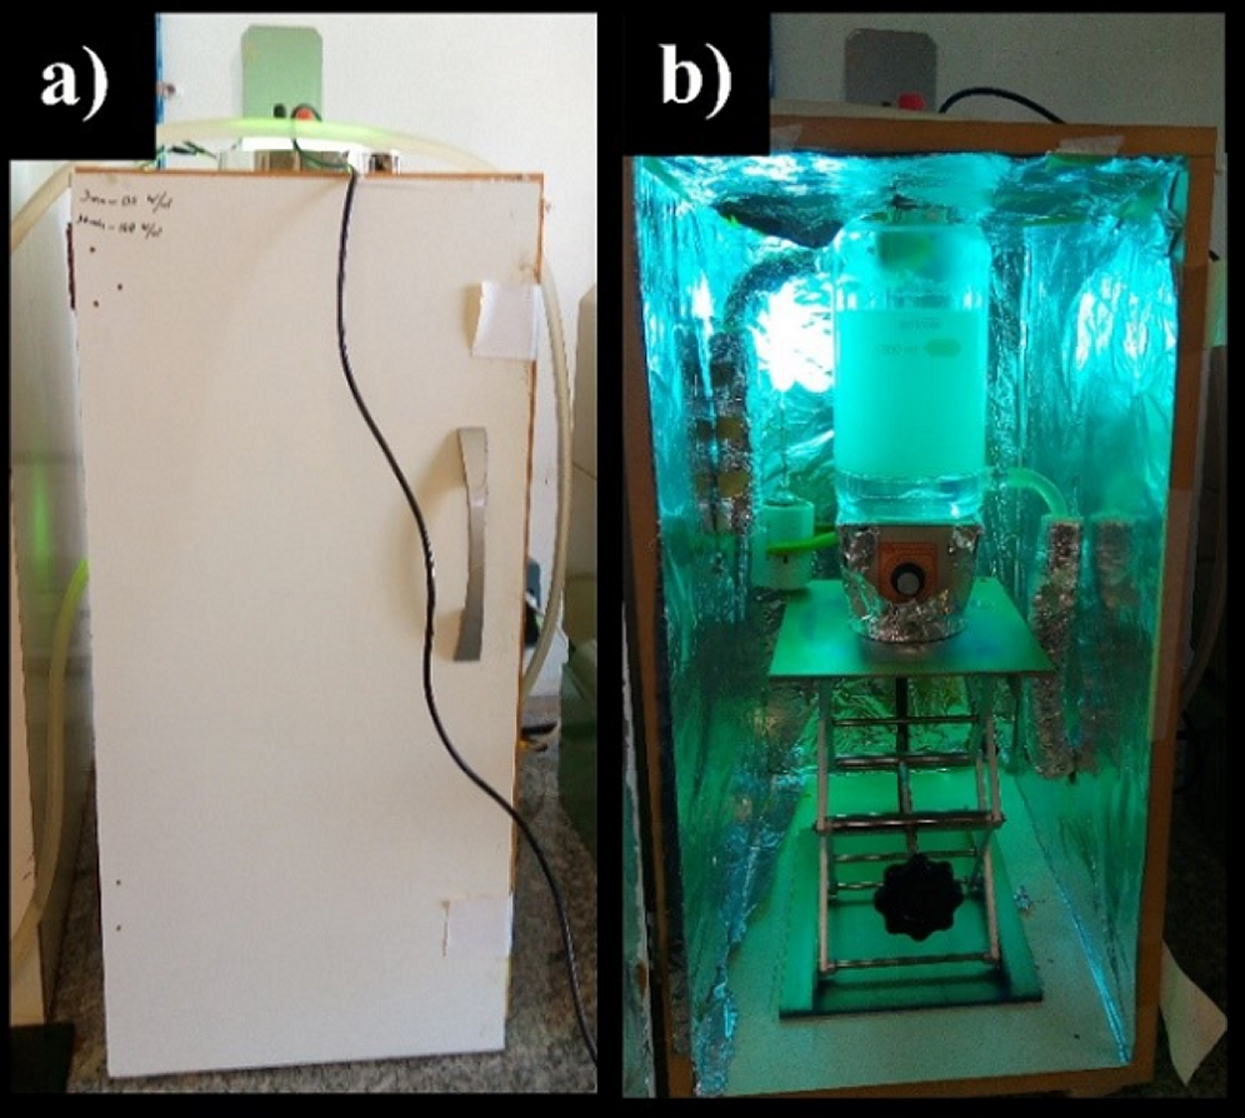
The reactor, built in borosilicate glass, has a cooling jacket connected to a thermostat bath on its outside which keeps the temperature of the reaction medium stabilized at 20 °C throughout the reaction. Before each experiment, the reactor was purged with N2 for 20 min to eliminate dissolved gases, especially oxygen. The same HPLN lamp reported above was used as radiation source. For analysis of the gases produced during the reaction, aliquots of one mL of these gases were collected at intervals of 30 min of reaction, in a total period of 5 h. These samples were analyzed at 230 °C in a Shimadzu GC-17A gas-phase chromatograph equipped with thermal conductivity detector (TCD) and a Carboxen™ 1010 Plot capillary column. Argon, with flow of 40 mL min−1, was employed as carrier gas.
Results and Discussion
Characterizations
By analyzing the X-ray diffraction (XRD) data, Fig. 2, it is possible to infer that all oxides have well-defined diffraction peaks suggesting crystallinity for these materials most likely due to the heat treatment used in the synthesis process. In addition, according to reports found in the literature and the crystallographic files JCPDS 21-1272 (anatase) and 29-1360 (brookite), all oxides exhibit major peaks characteristic of the anatase phase, and secondary peaks related to the brookite phase (Di Paola, Bellardita & Palmisano, 2013; Neto et al., 2017; Patrocinio et al., 2015; Hu, Tsai & Huang, 2003).
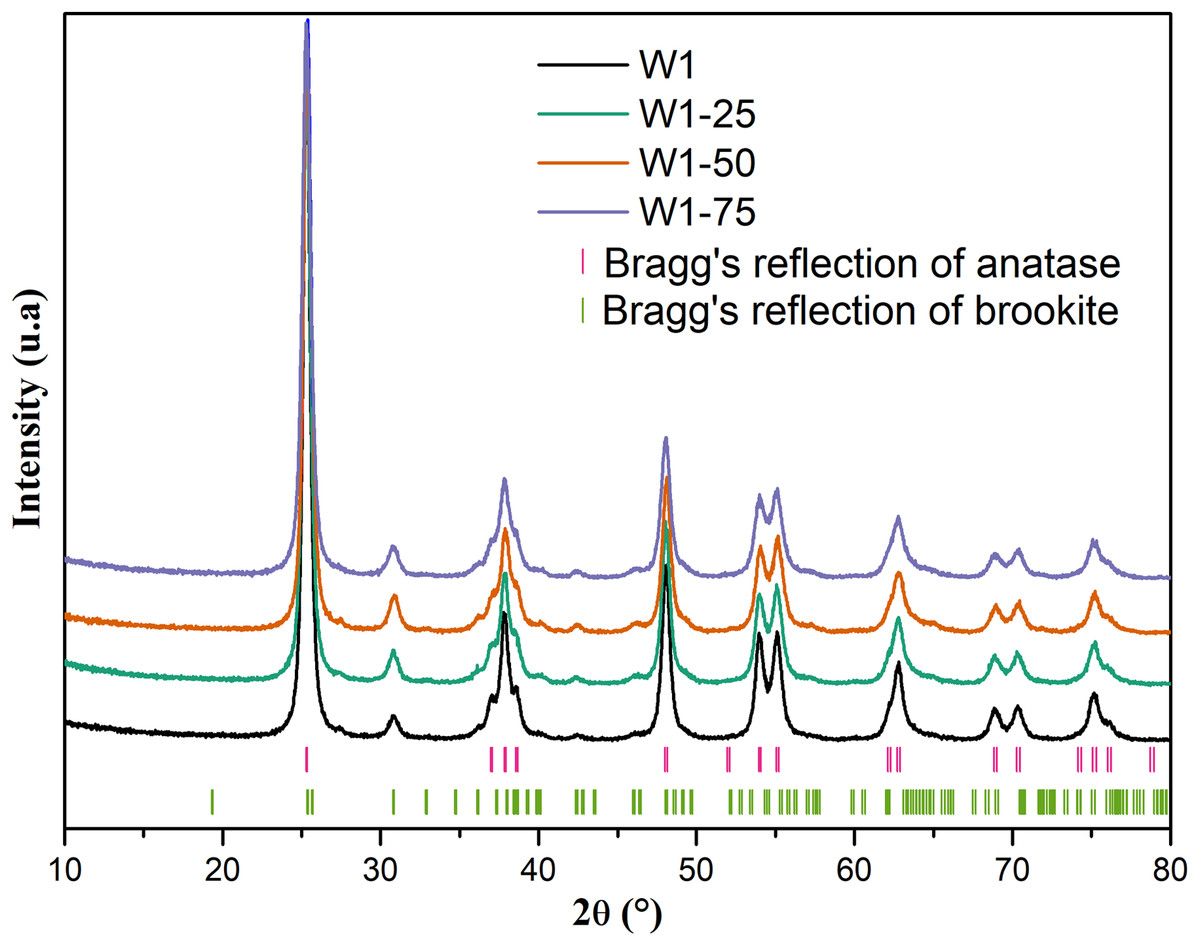
Figure 2: Ray diffratogram of the studied oxides.
The mean size and mean deformation of crystallite were calculated from the data obtained from Rietveld refinement, as presented in Table 1. The diffractograms, accompanied by the respective calculated diffraction profiles, experimentally obtained profiles, and residual curves and Bragg diffractions adjusted by Rietveld method can be seen in Fig. S1, in the Supplemental Information.
| Oxide | Crystalline phase (%) | Crystallite medium size (nm) | Crystallite medium deformation (%) | |
|---|---|---|---|---|
| W1 | Anatase | 87 | 61 | 4.0 |
| Brookite | 13 | 16 | 8.0 | |
| W1-25 | Anatase | 78 | 64 | 6.0 |
| Brookite | 22 | 10 | 6.0 | |
| W1-50 | Anatase | 78 | 63 | 6.0 |
| Brookite | 22 | 14 | 10 | |
| W1-75 | Anatase | 78 | 44 | 5.0 |
| Brookite | 22 | 22 | 11 | |
Rietveld refinement data demonstrates that the percentage of brookite phase increases from 13% to 22% with the addition of acetone as co-solvent in the hydrolysis of titanium tetraisopropoxide. Despite this, the increase in the proportion of acetone from 25% to 75% did not result in an equivalent increase in the percentage of brookite phase, suggesting that the use of acetone only interfered in hydrolysis, affecting the organization of critical nuclei in the oligomeric network of titanium, in order to preorder the crystallization of the mentioned phase. On the other hand, the average crystallite size of the anatase phase was about 30% lower for W1-75, compared to the other oxides, including the W1, prepared without addition of acetone during its synthesis. This suggests that the excess of acetone should promote a significant reduction in the average crystallite size of the anatase phase, favoring the increase in the average crystallite size of brookite. Thus, the mean deformation of the crystallite follows the same trend, that is, if the secondary phase becomes larger it will present larger deformations when compared with the primary phase.
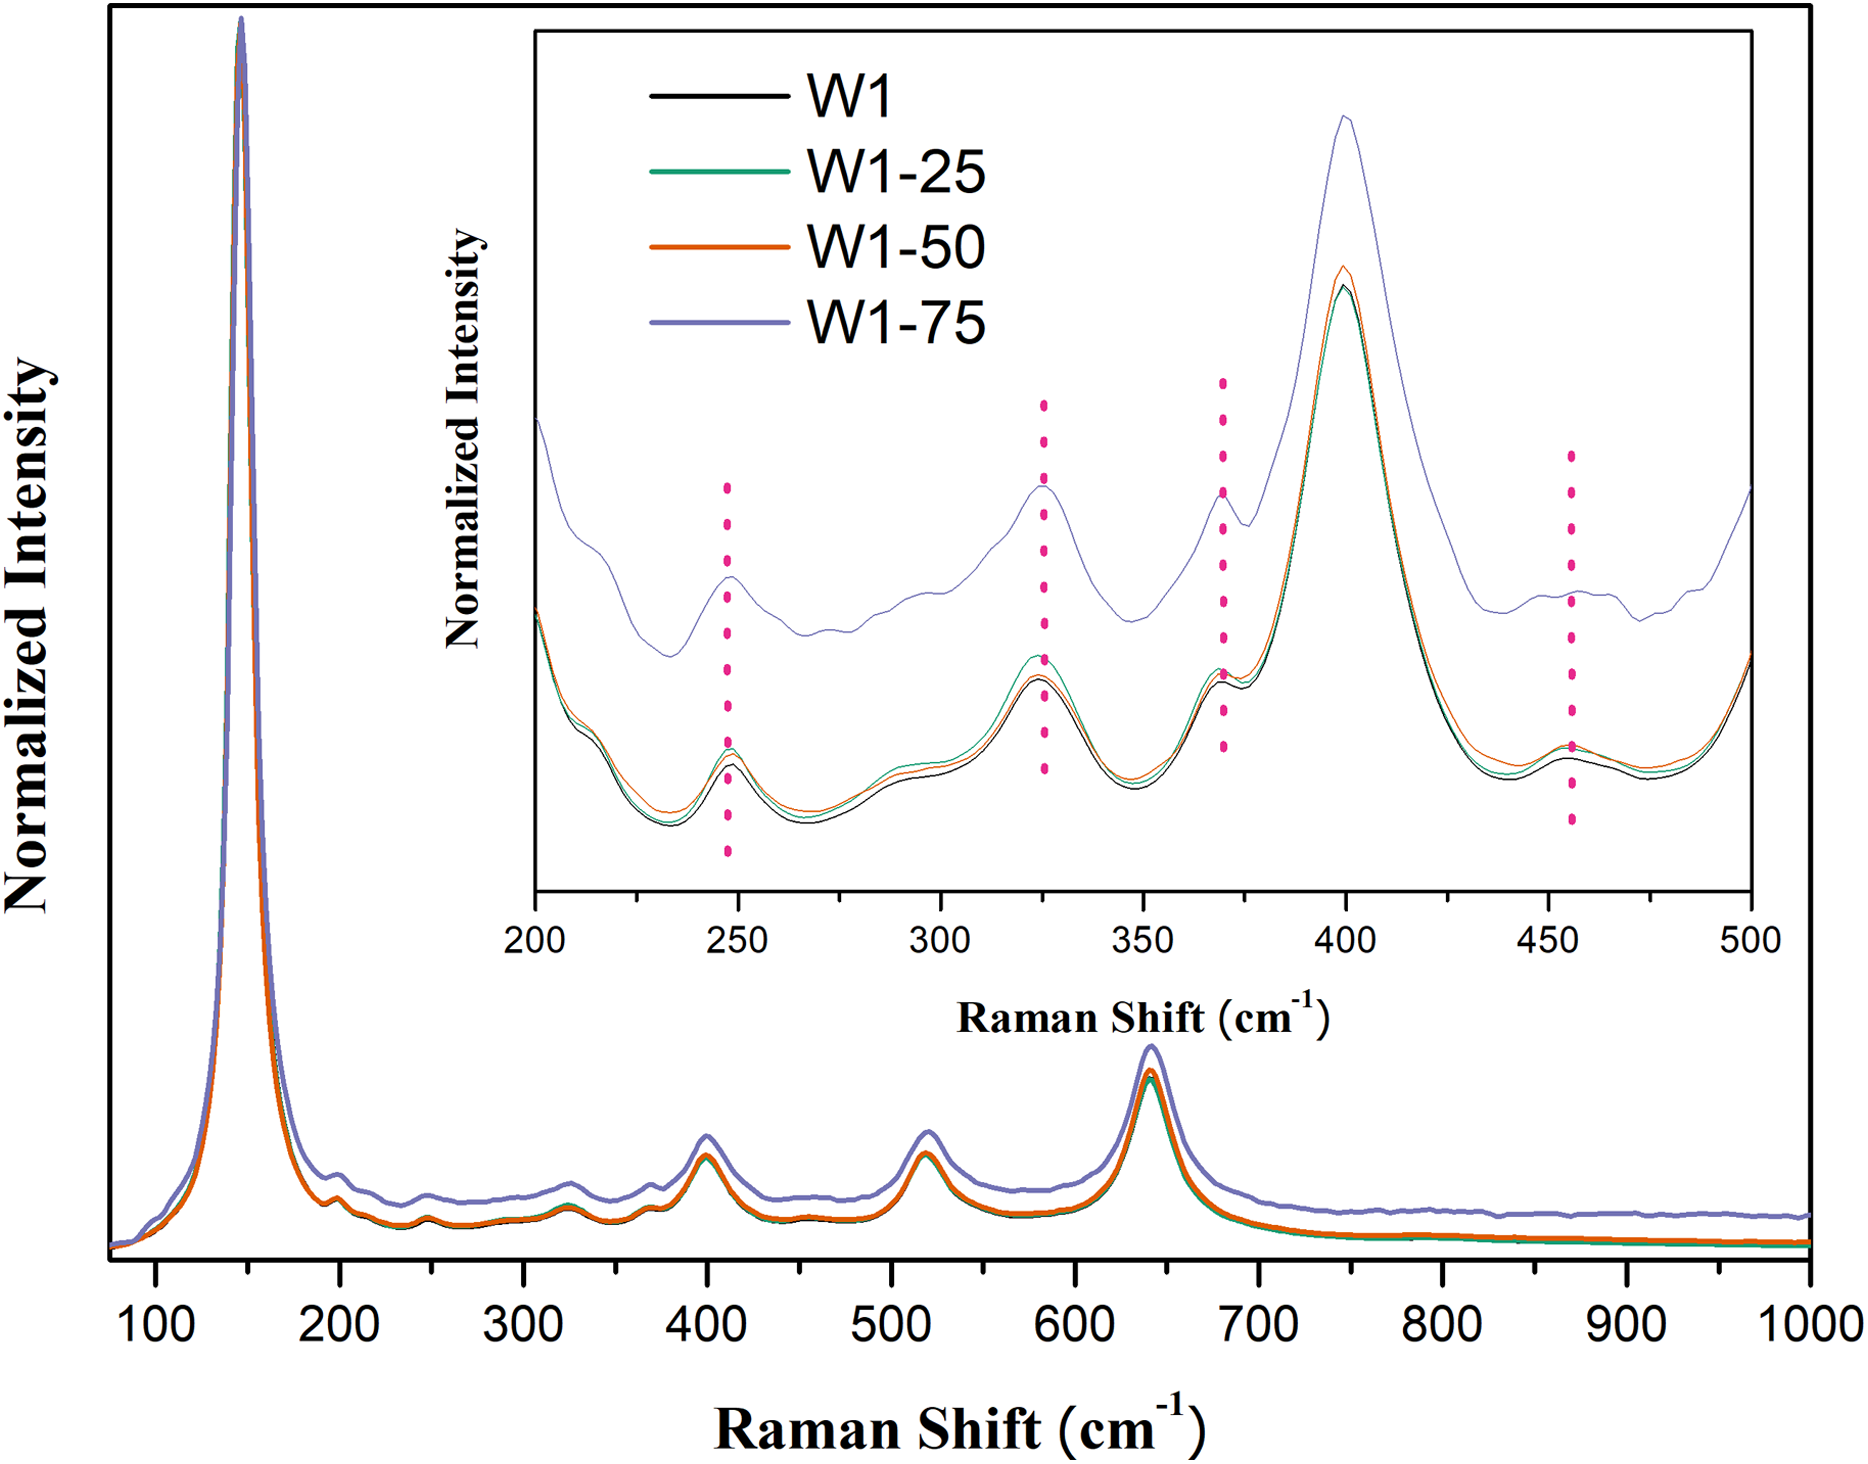
As in the X-ray diffractograms, the Raman spectra also evidence the mixed composition of two crystalline phases, Fig. 3. In all oxides, five main bands attributed to the anatase phase are observed respectively at 145 cm−1 (Eg), 198 cm−1 (Eg), 399 cm−1 (B1g), 519 cm−1 (B1g) and 640 cm−1 (Eg) (Sahoo, Arora & Sridharan, 2009). Between 200 and 500 cm−1 four bands of lower intensity are observed: at 247 cm−1 (A1g), 323 cm−1 (B1g), 368 cm−1 (B2g) and 456 cm−1 (B2g), attributed to the phase brookite. In addition to these bands, this phase features a band of greater intensity around 150 cm−1 which may be superimposed with the band identified at 145 cm−1, attributed to anatase, thus influencing the width of the Eg Raman mode (Di Paola, Bellardita & Palmisano, 2013; Iliev, Hadjiev & Litvinchuk, 2013).
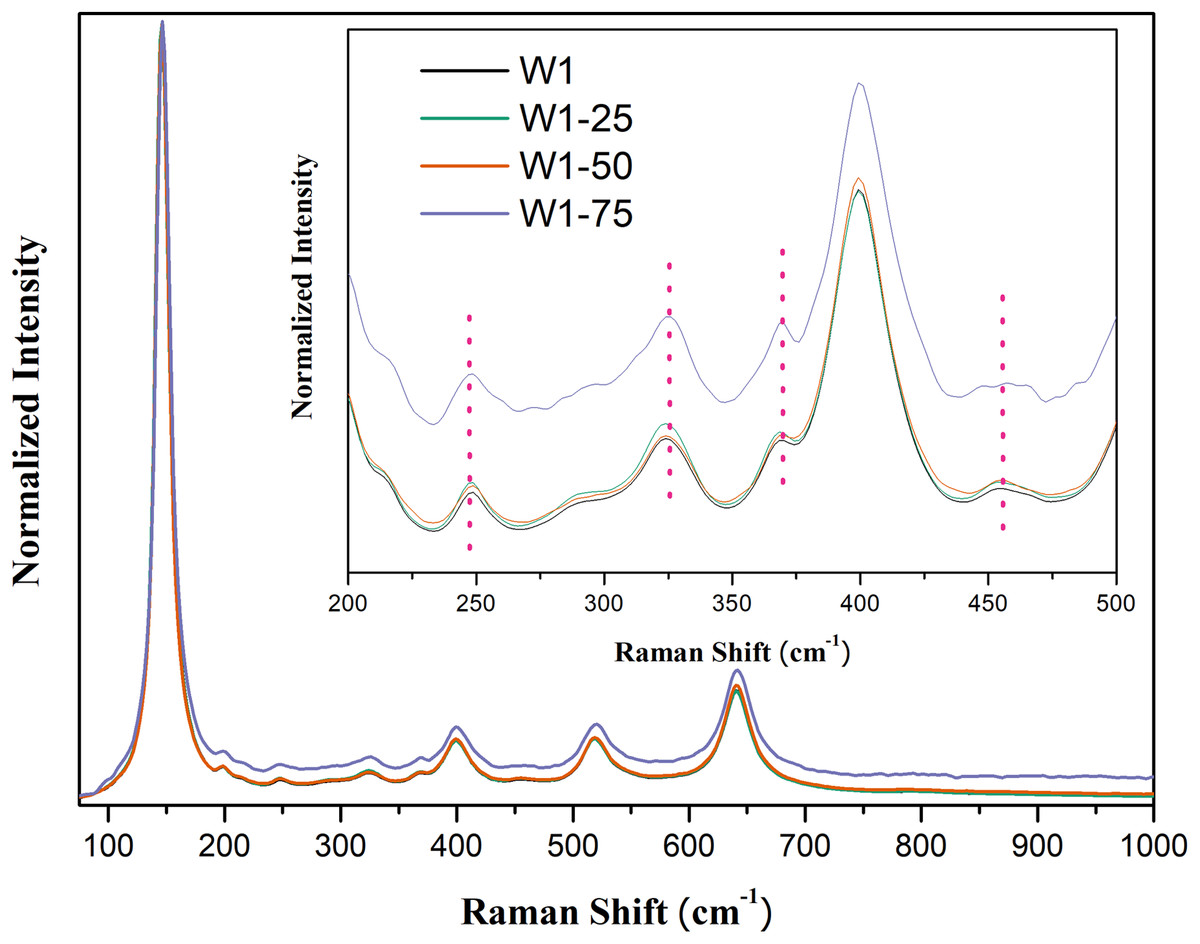
Figure 3: Raman spectra of the synthesized photocatalysts. Insert peaks at 247 cm−1, 323 cm−1, 368 cm−1, and 456 cm−1 attributed to brookite.
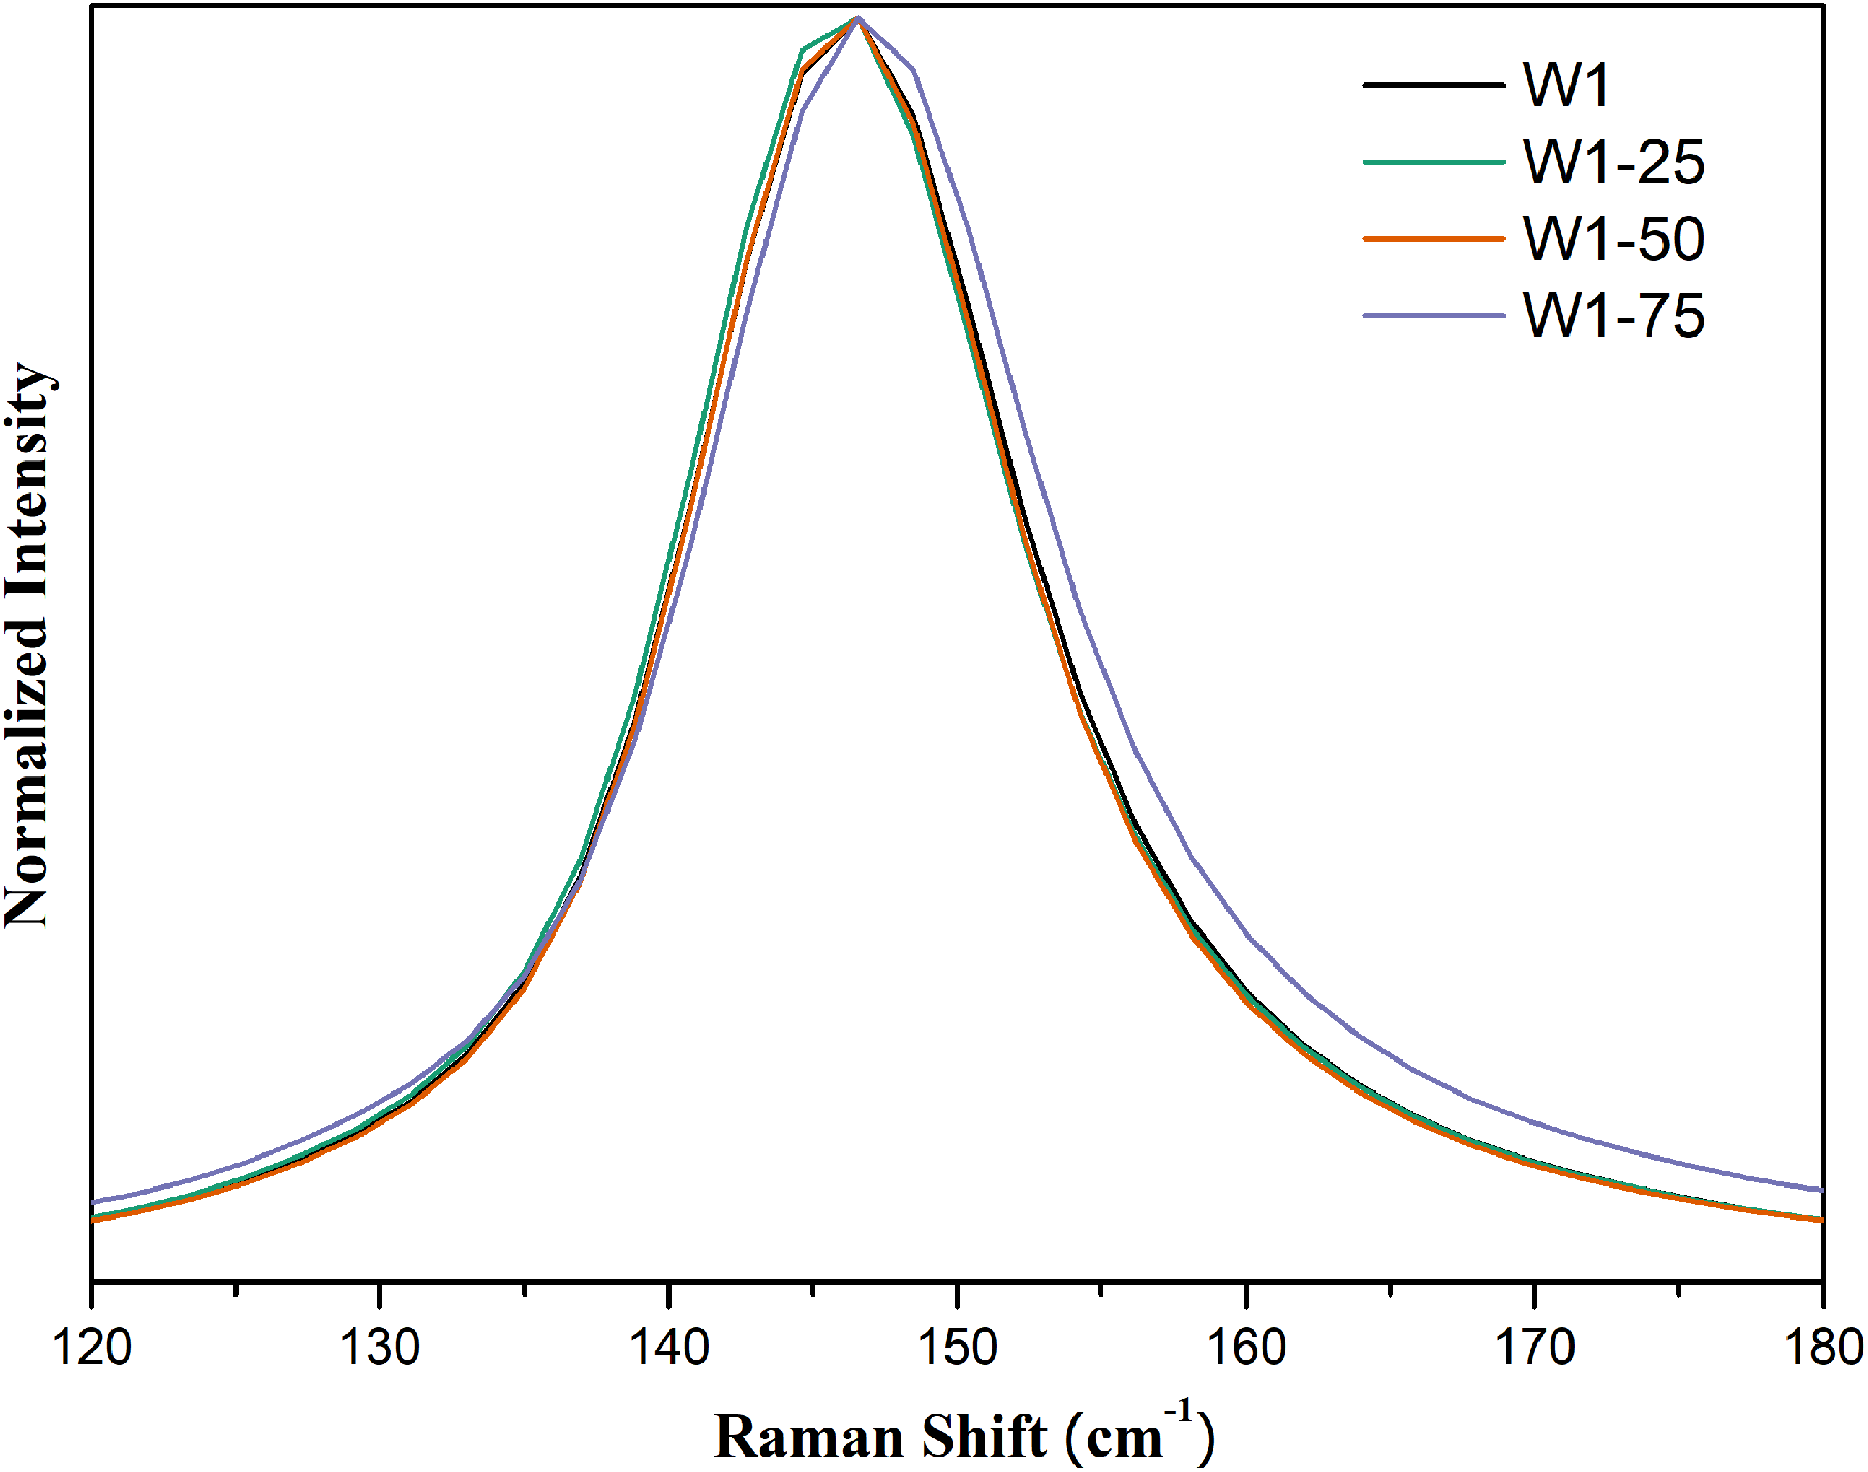
From the expanded spectrum, Fig. 4, it was possible to observe a small enlargement of the band centered at 145 cm−1 in the Raman spectrum of the photocatalyst W1-75. This effect should be related to the smaller particle size since the lifetime of the vibrational mode tends to be shorter as particle size decreases, which ends up resulting in band enlargement (Liu et al., 2012; Zhu et al., 2012).
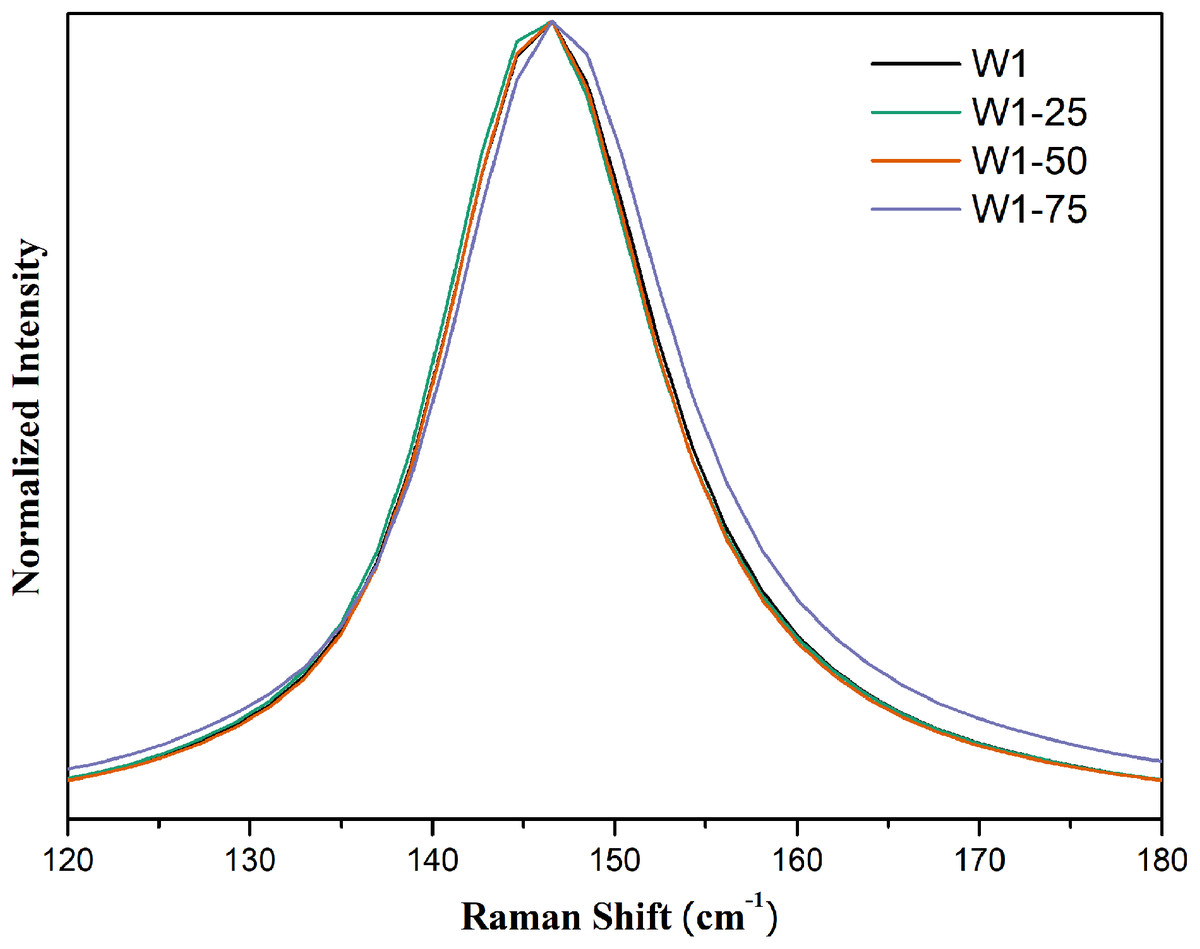
Figure 4: Expanded Raman spectra in the region between 120 and 180 cm-1 for the synthesized photocatalysts.
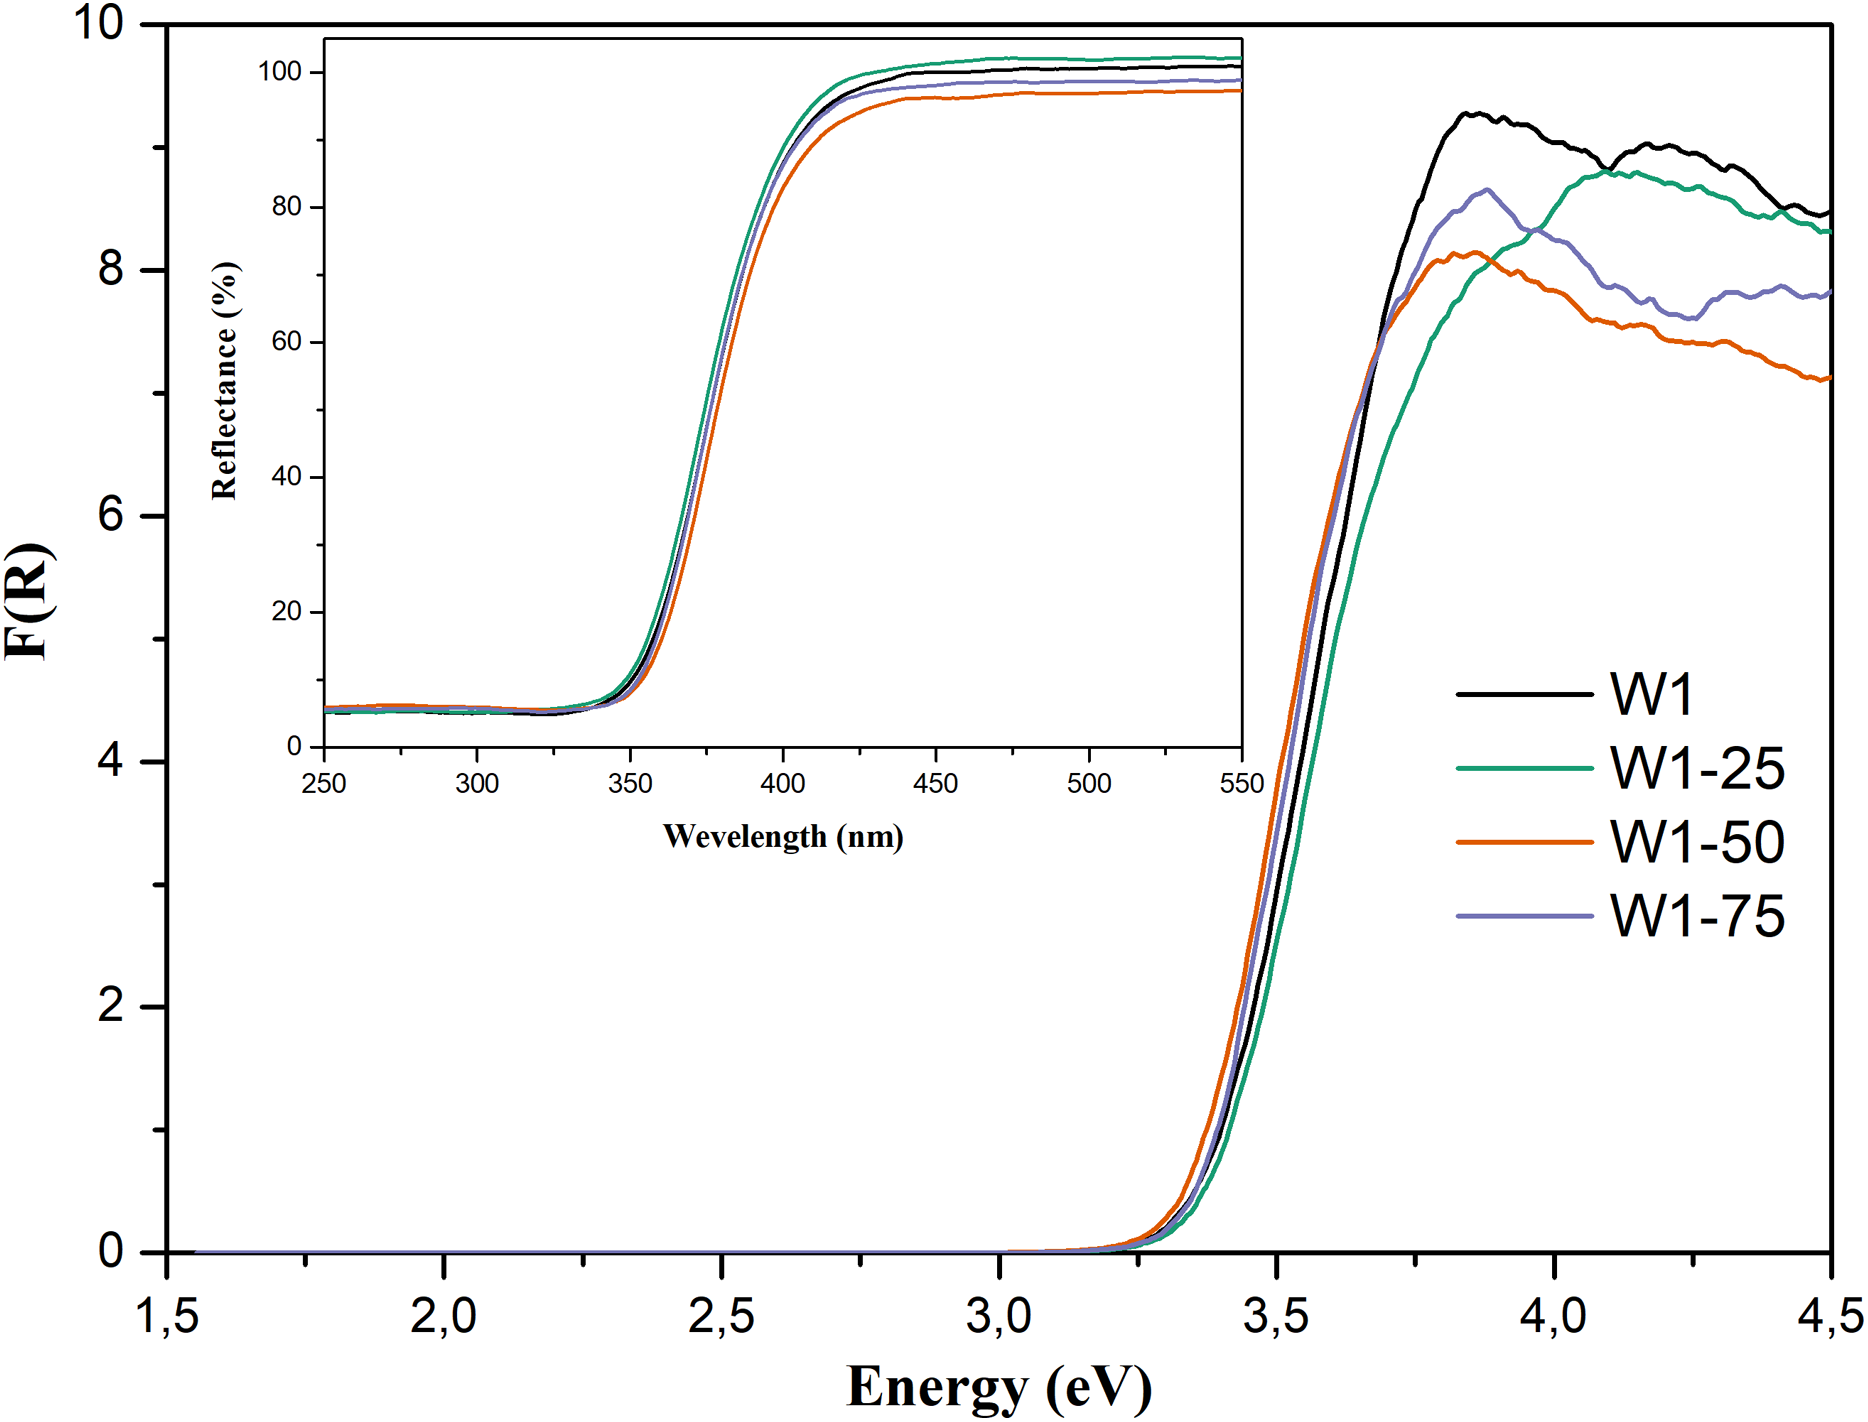
From the diffuse reflectance spectra, Fig. 5—Insert, expressed in terms of the Kubelka–Munk’s function, Fig. 5, and by applying the direct method, it was possible to estimate the band gap energies (Eg) of the photocatalysts (Liu & Li, 2012). The estimated Eg were as follows: 3.23 eV for W1, 3.24 eV for W1-25, 3.22 eV for W1-50, and 3.23 eV for W1-75, indicating that the estimated band gap energies have not undergone major changes, which agree with the data reported in the literature for pure TiO2 (Martin-Somer et al., 2020; Neto et al., 2017; Resende et al., 2017). Most likely, this stems from the synthesis conditions adopted in this work, where none dopant material was added. It is known that the Eg displacement to lower energies occurs preferably in synthesis that promote the doping of oxides with metal cations (Santos et al., 2015b), non-metallic anions (Liu et al., 2014), co-doping (Kuvarega, Krause & Mamba, 2015), and self-doping (Chen et al., 2011).
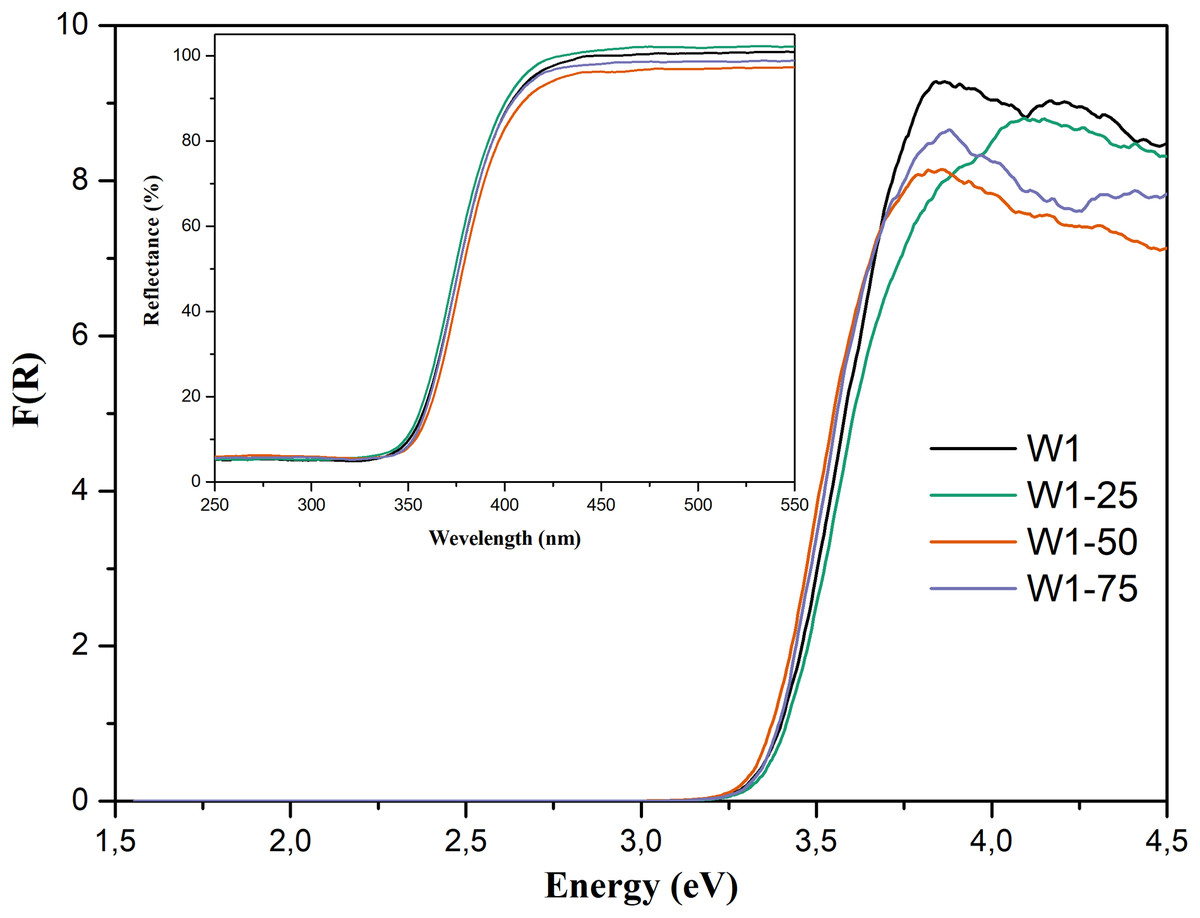
Figure 5: Diffuse reflectance spectra expressed in terms of Kubelka–Munk’s function. Insert: %Reflectance vs wavelength (nm) spectra for the synthesized photocatalysts.
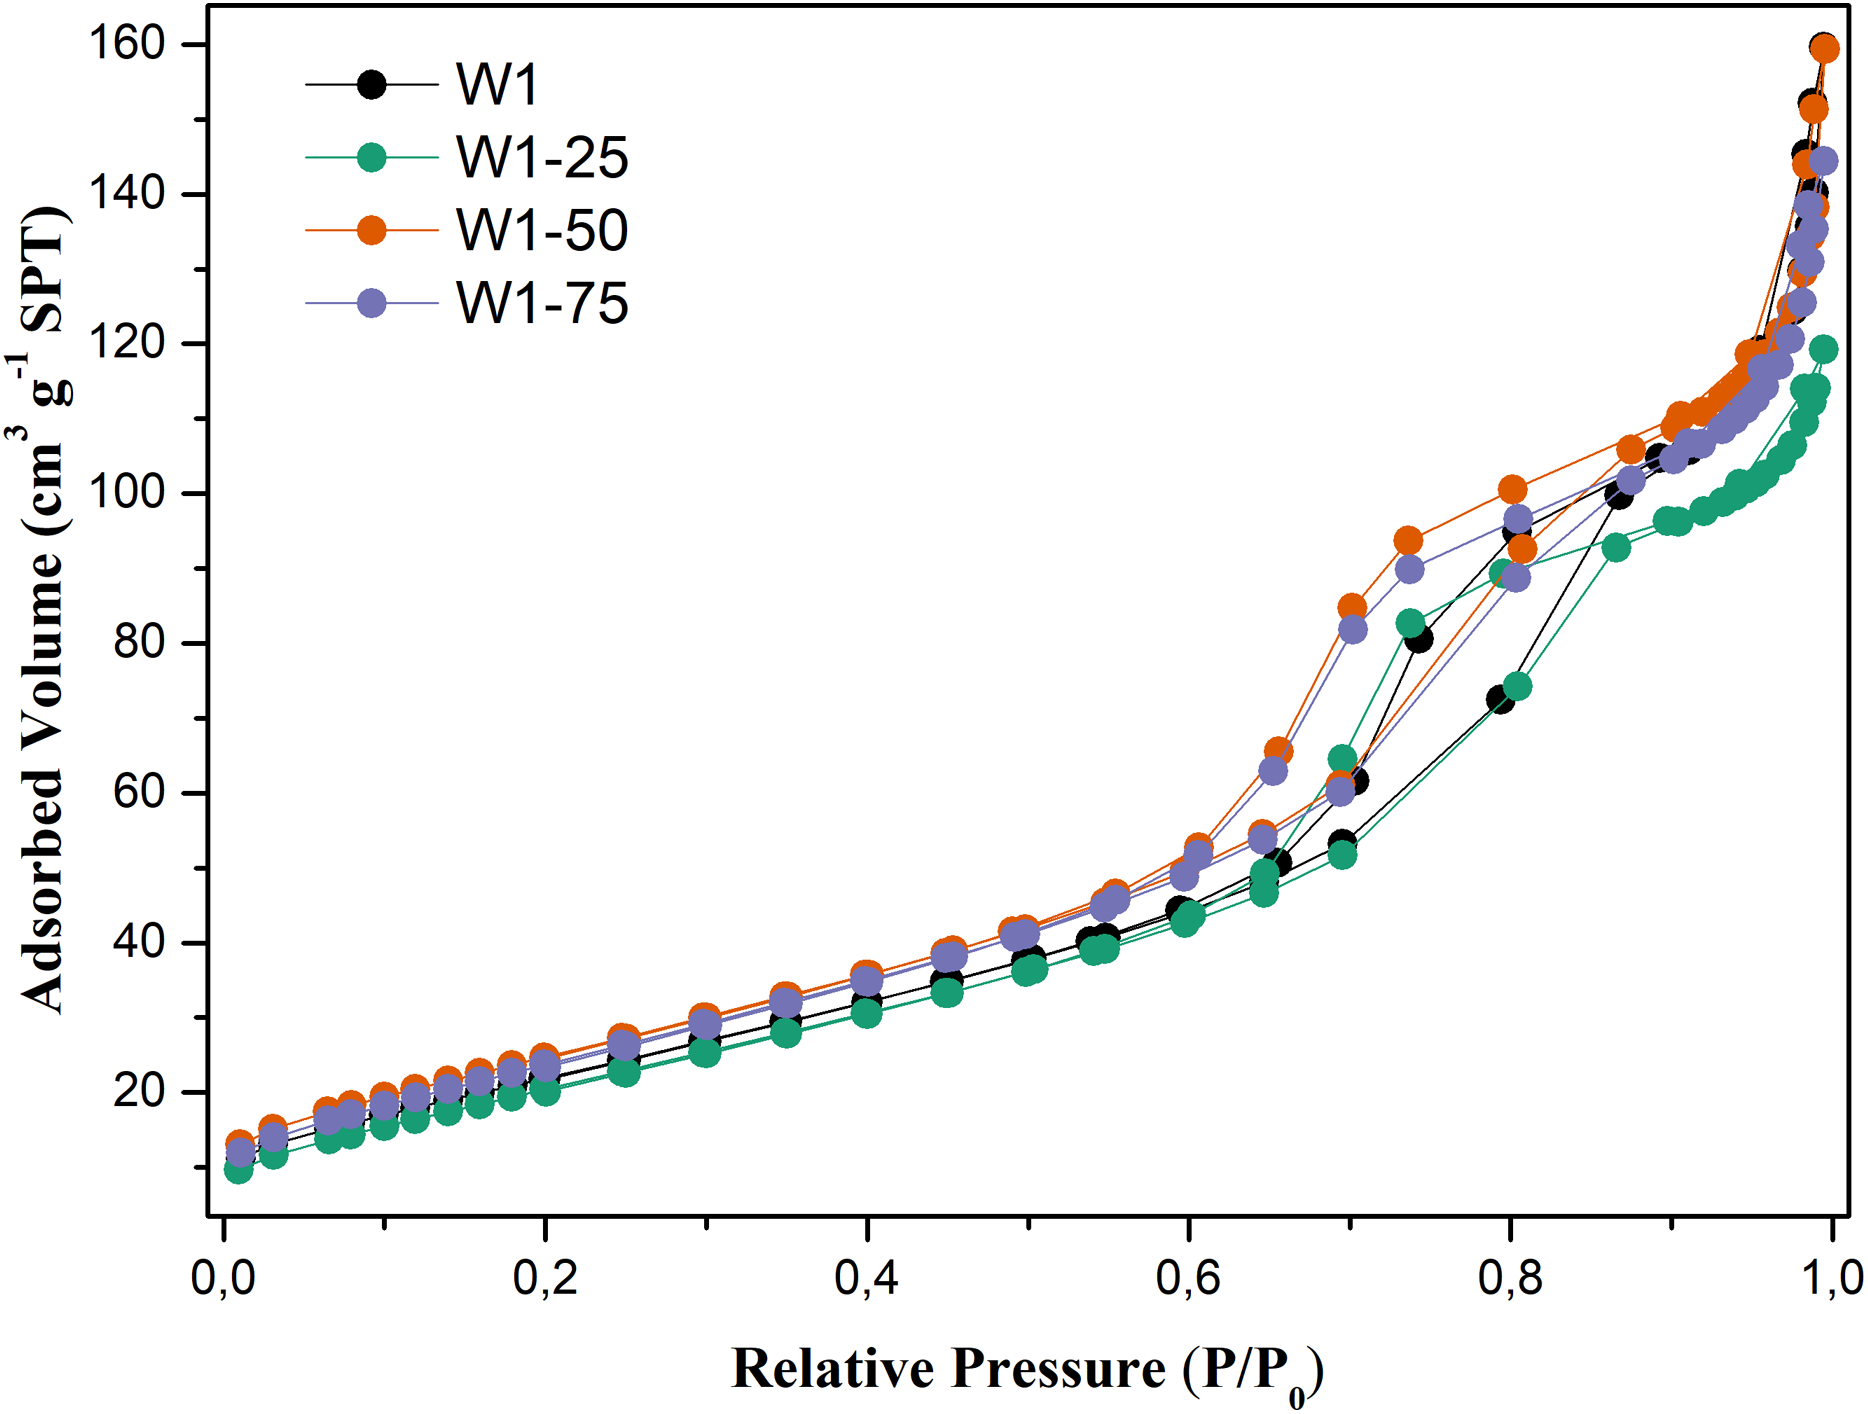
As for N2 adsorption and desorption of these oxides, Fig. 6, the analysis of the adsorption–desorption isotherms suggests that they are type IV (IUPAC, 1985), characteristic of mesoporous materials with an average pore diameter between 2 and 50 nm, Table 2. Hysteresis profiles are very close to those of type H2, associated with more complex mesoporous structures, in which the distribution of pore sizes and their shape are not well defined (Guan-Sajonz et al., 1997). It is also evident that the photocatalysts W1-50 and W1-75, synthesized by hydrolysis using the highest percentages of acetone, present slightly more steeper isotherms compared to the oxides W1 and W1-25, also exhibiting greater heterogeneity in pore distribution compared to these same oxides.

Figure 6: N2 adsorption–desorption isotherms obtained for the studied photocatalysts.
| Photocatalyst | Surface area (m2/g) | Porosity (%) | Mean pore diameter (nm) | Average particle size (nm) |
|---|---|---|---|---|
| W1 | 84 ± 2 | 21 | 8 | 14 ± 1 |
| W1-25 | 80 ± 2 | 17 | 7 | 17 ± 3 |
| W1-50 | 94 ± 2 | 21 | 7 | 10 ± 1 |
| W1-75 | 92 ± 2 | 20 | 7 | 13 ± 1 |
Table 2 presents the morphological parameters related to the synthesized oxides. In general, oxides obtained from hydrolysis using water/acetone mixtures did not undergo significant morphological changes, since for W1 the oxide porosity is practically the same presented by W1-50 and W1-75. On the other hand, the surface area of these two oxides is between 10% and 12% larger than that of W1. This may favor the adsorption of organic matter on their surfaces, which can consequently favor the photocatalytic efficiency. In addition, it was observed an inverse correlation between the surface area and the average particle size, except for the W1-25 that presented wide variation on its particle size.
The TEM images, Fig. 7, suggest a dense aspect to the particles, which have irregular spherical shape and a strong tendency to aggregation, giving rise to clusters of TiO2. This behavior should be related to the high level of hydrolysis provided by the synthesis method (Jiang, Herricks & Xia, 2003). However, agglomeration appears to have been minimized by addition of acetone as co-solvent in the hydrolysis, evidencing that its use decreased the hydrolysis rate of the precursor. This, consequently, should favor particle dispersion. On the other hand, the particle sizes estimated from these images do not suggest a role of acetone on this property, as can be seen by the values estimated for the particle size: (14 ± 1) nm, (17 ± 3) nm, (10 ± 1) nm and (13 ± 1) nm, respectively for W1, W1-25, W1-50 and W1-75. The histograms can be viewed in Fig. S2, in the Supplemental Information.

Figure 7: Images obtained by TEM for synthesized oxides (A) W1, (B) W1-25, (C) W1-50, (D) W1-75.
Photocatalytic activity: degradation/mineralization of organic compounds
Table 3 presents the photocatalytic performance of the synthesized oxides and of the commercial oxide TiO2-P25, in the degradation of the two azo dyes used in this study as oxidizable substrates. For comparative purposes, the dyes were also submitted to direct photolysis, in order to evidence the role of the photocatalysts in the photodegradation.
| Dye/reaction | Direct photolysis | W1 | W1-25 | W1-50 | W1-75 | P25 |
|---|---|---|---|---|---|---|
| P4R | ||||||
| Mineralization (%) | 13 ± 1 | 70 ± 3 | 74 ± 3 | 83 ± 3 | 87 ± 3 | 94 ± 3 |
| 1st kmin (×103 min−1) | 0.8 | 5.0 | 5.5 | 6.0 | 8.0 | 10 |
| R2 | 0.977 | 0.982 | 0.967 | 0.973 | 0.992 | 0.982 |
| 2nd kmin (×103 min−1) | – | 12 | 14 | 21 | 23 | 33 |
| R2 | – | 0.979 | 0.981 | 0.990 | 0.998 | 0.974 |
| Discoloration (%) | 30 ± 1 | 100 | 100 | 100 | 100 | 100 |
| 1st kdisc (×103 min−1) | 2.0 | 25 | 31 | 30 | 31 | 51 |
| R2 | 0.989 | 0.999 | 0,998 | 0.999 | 0.998 | 0.997 |
| 2nd kdisc (×103 min−1) | – | 43 | 73 | 73 | 97 | – |
| R2 | – | 0.972 | 0.937 | 0.932 | 0.876 | – |
| RR120 | ||||||
| Mineralization (%) | 17 ± 2 | 78 ± 2 | ** | 79 ± 2 | ** | 81 ± 1 |
| 1st kmin (×103 min−1) | 1.4 | 9.0 | ** | 8.5 | ** | 5.6 |
| R2 | 0.959 | 0.995 | ** | 0.997 | ** | 0.992 |
| 2nd kmin (×103 min−1) | * | 13 | ** | 14 | ** | 20 |
| R2 | – | 0.989 | ** | 0.961 | ** | 0.993 |
| Discoloration (%) | 21 ± 1 | 100 | ** | 100 | ** | 100 |
| 1st kdisc (×103 min−1) | 1.5 | 40 | ** | 44 | ** | 52 |
| R2 | 0.979 | 0.979 | ** | 0.977 | ** | 0.997 |
| 2nd kdisc (×103 min−1) | * | * | ** | * | ** | * |
| R2 | – | – | ** | – | ** | – |
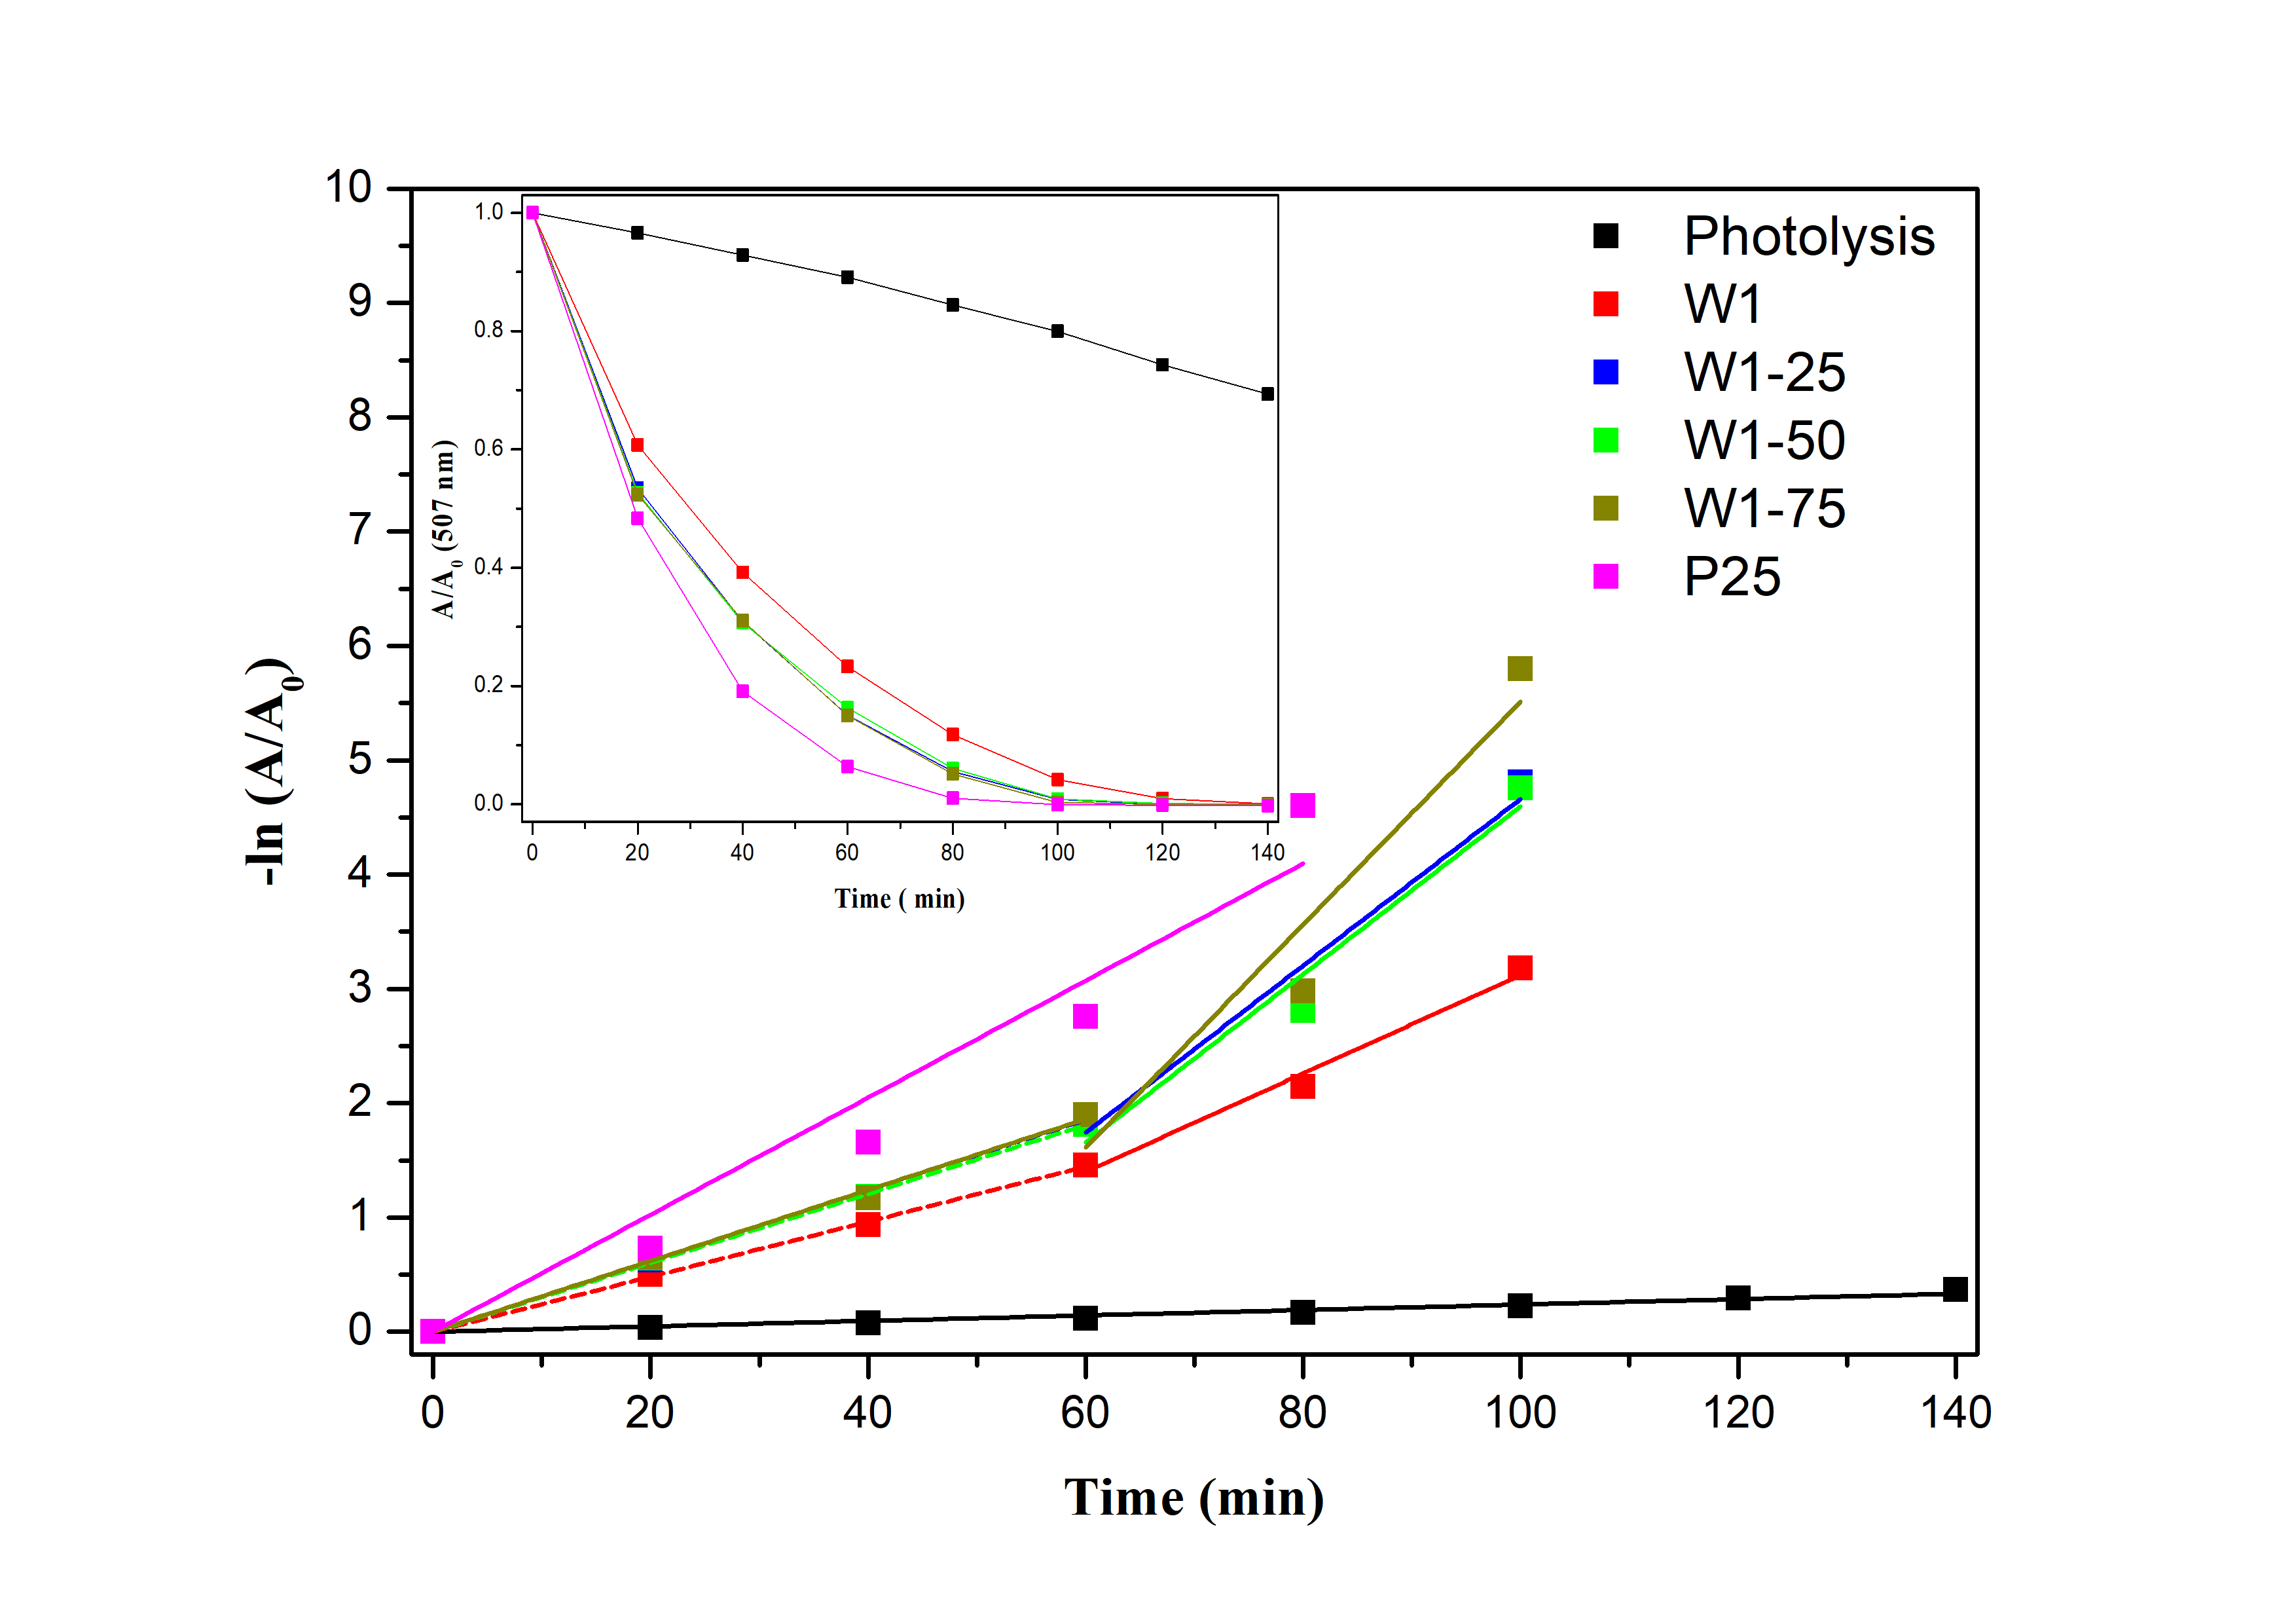
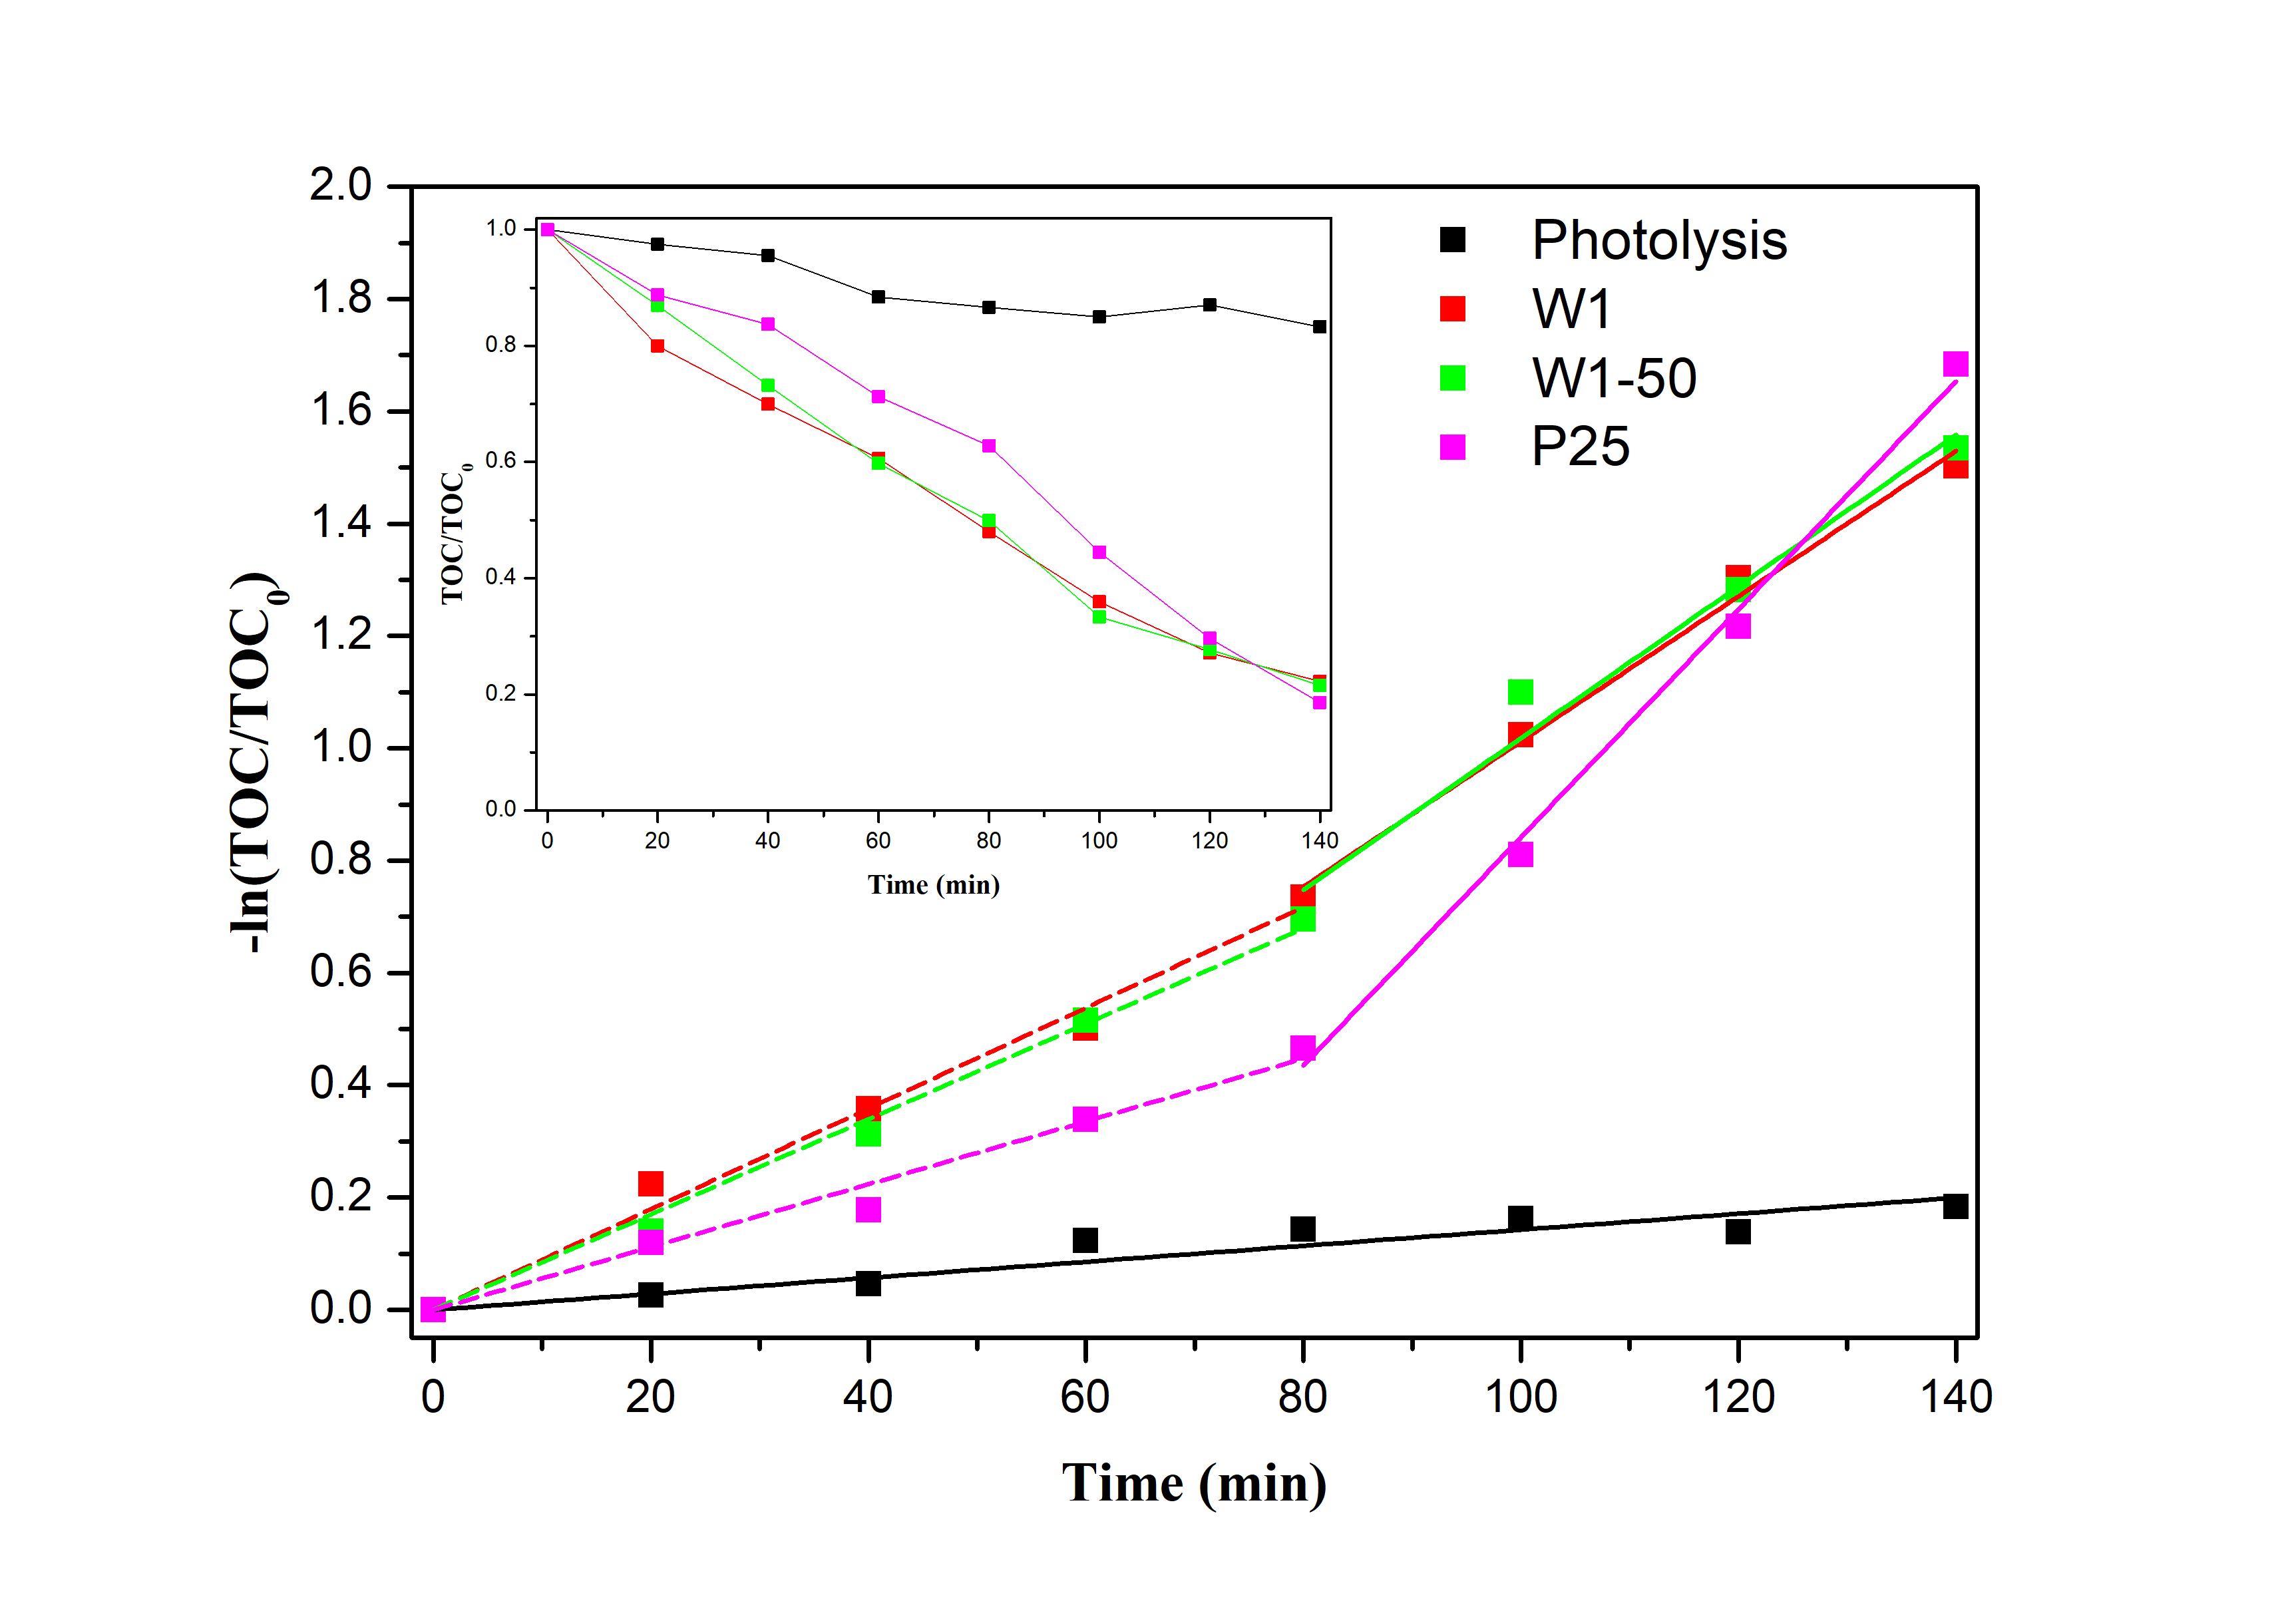
The discoloration (kdis) and mineralization (kmin) rate constants were estimated from the application of the kinetic model of Languimir–Hinschelwood (Hoffmann et al., 1995; Machado et al., 2012), considering that the kinetic regimen in these photocatalytic processes follows a pseudo-first order kinetics (Machado et al., 2003, 2012; Santos et al., 2015b; França et al., 2016). Graphs containing the kinetic data corresponding to these values are presented in the Suplemental Information (Figs. S3–S5).
The expected low efficiency both in degradation and discoloration via direct photolysis, compared to the results achieved by the photocatalysts can be related to the energy of the incident photons, provided by the radiation source (Machado et al., 2008), and to the very low rate of formation of radical species, produced by homolytic scission of labile bonds present in these dyes (Kumar et al., 1999).
In the experiments involving the participation of the photocatalysts, the degradation occurred more efficiently due the participation of reactive oxygen species, among them the hydroxyl radicals (HO∙) and superoxide radical-ions (O∙−2), generated mainly by water decomposition. Such species, due their low selectivity (Machado et al., 2012), together with secondary radical species produced during the photocatalytic process, tend to promote the oxidation of organic substrates present in the reactional medium (Oancea & Meltzer, 2014; Santos et al., 2015a). The dissolved oxygen, present in the aqueous medium, as example, when reduced by the semiconductor, contributes with the formation of O∙−2 and perhydroxyl radicals, which, although less oxidizing than HO∙ (Machado et al., 2012), are very important in promoting the degradation of organic substrates.
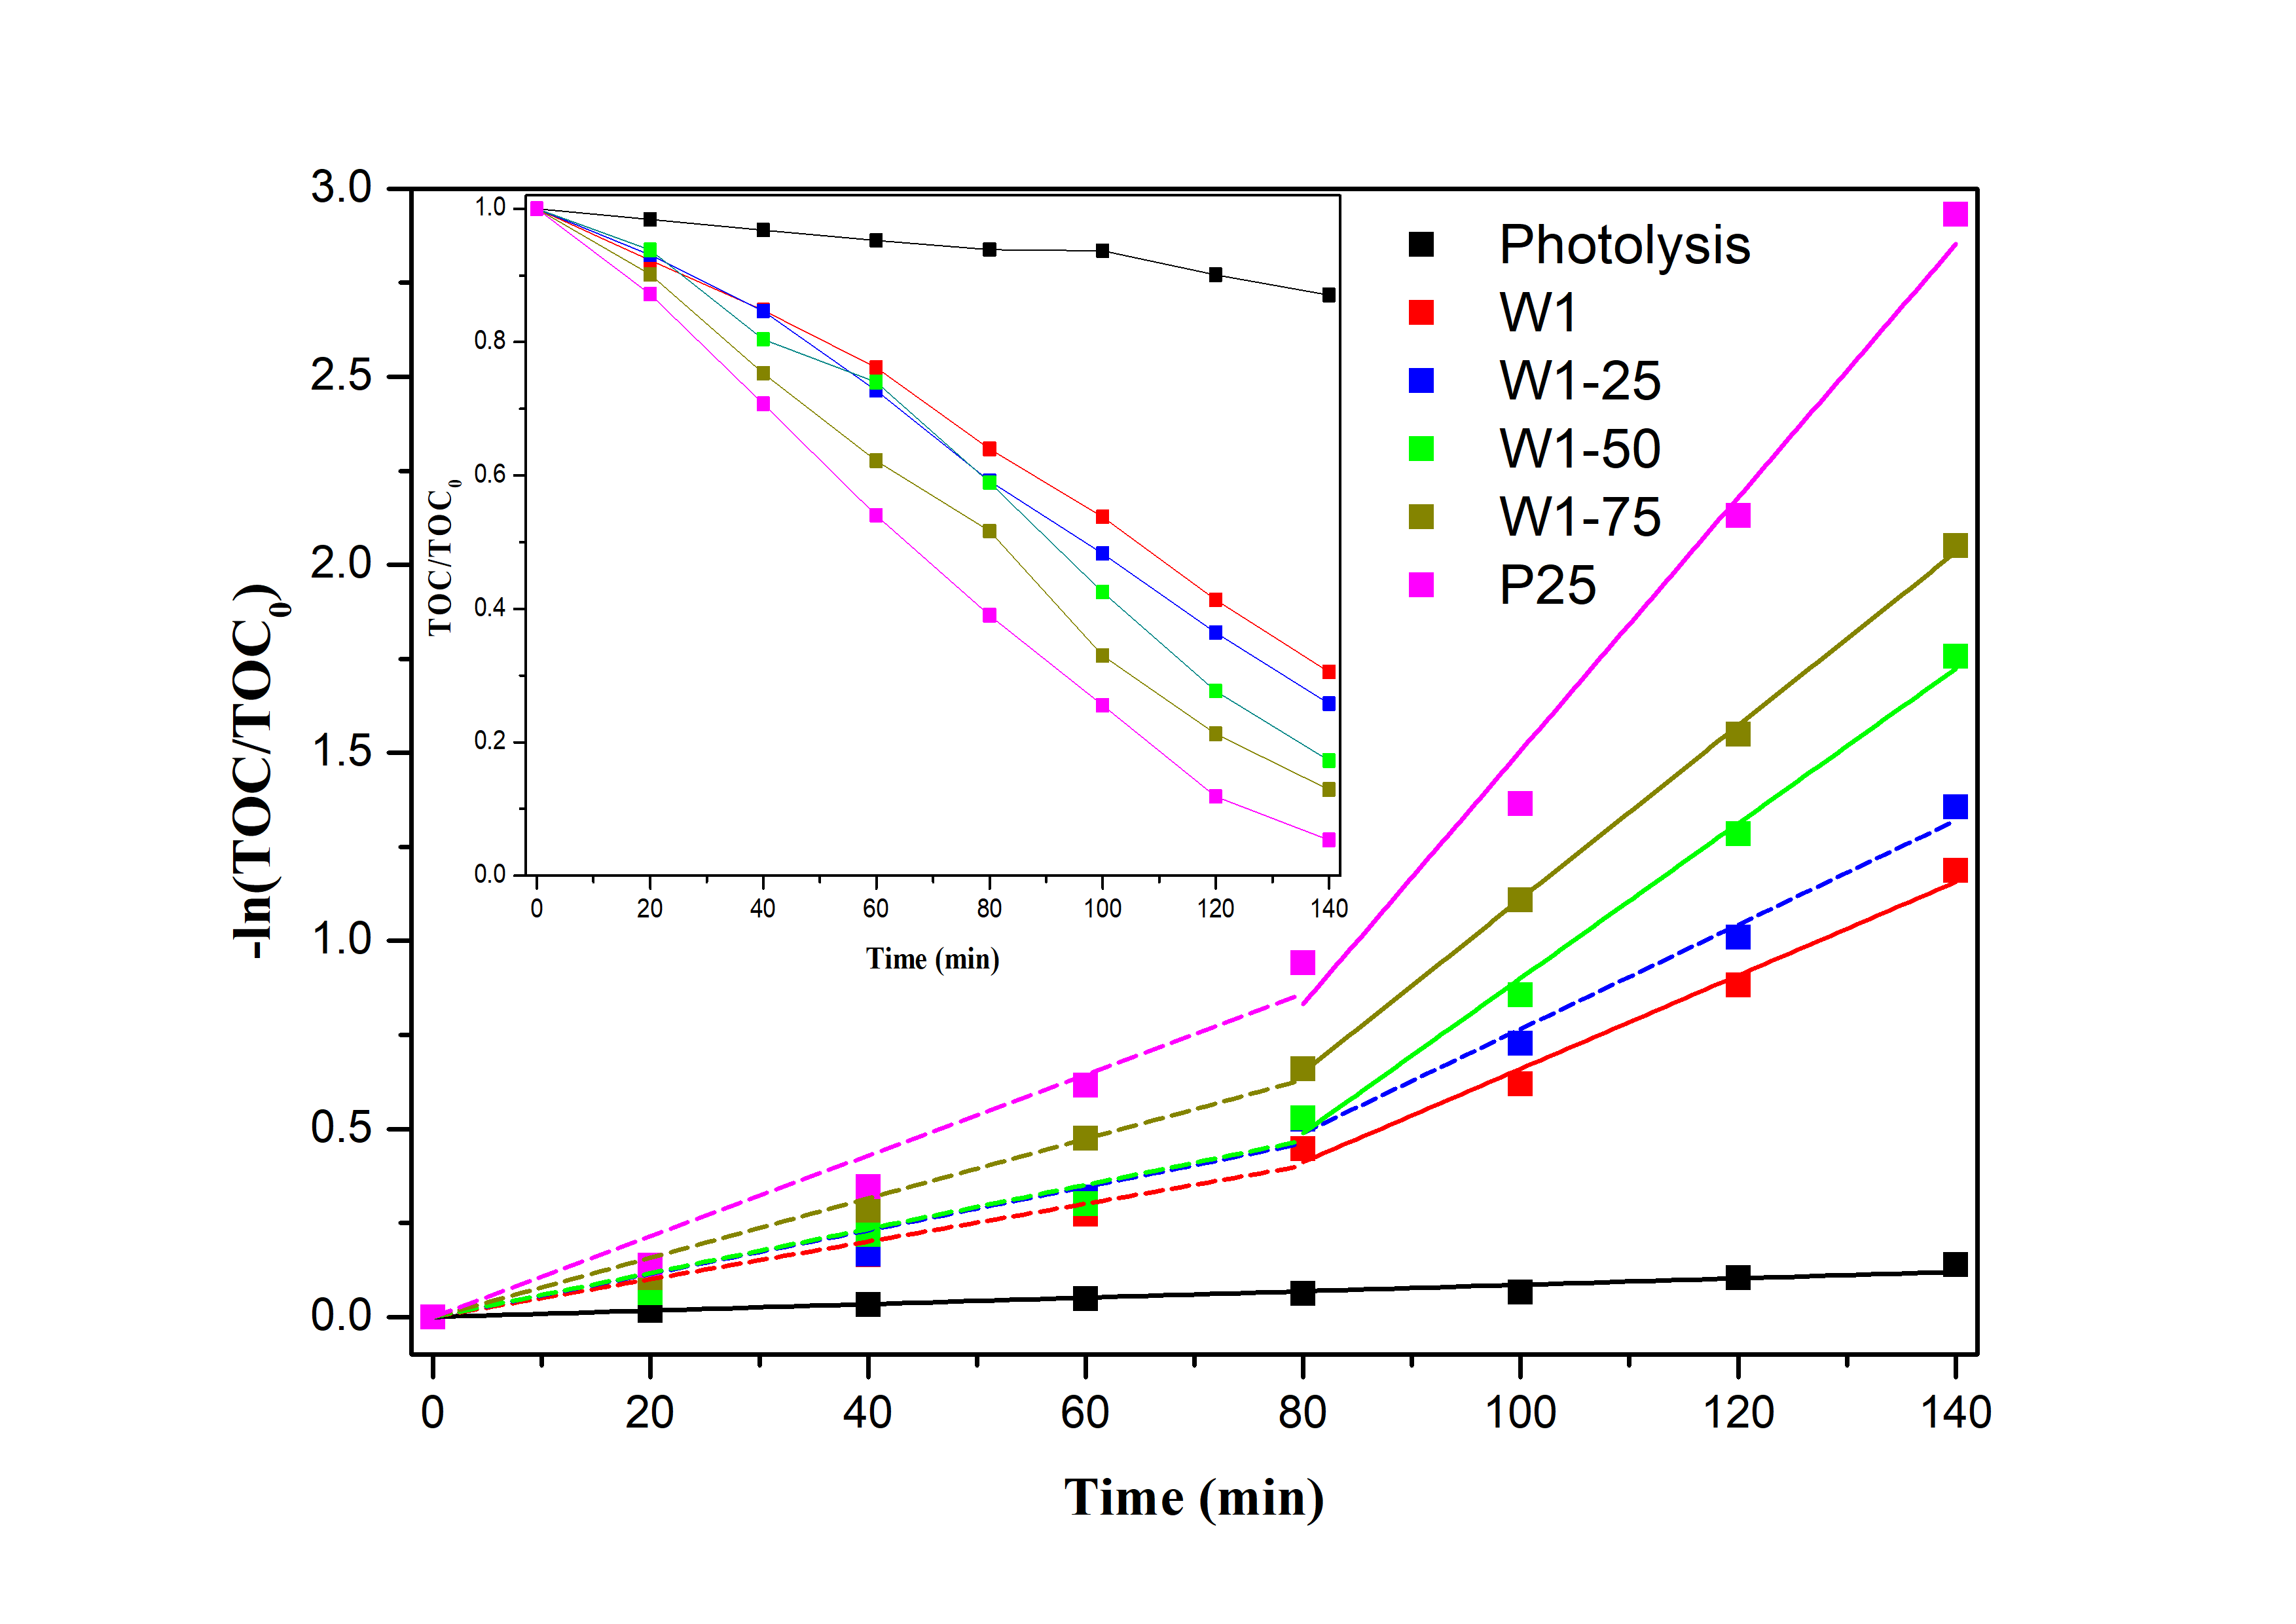
The values of the apparent rates of discoloration and mineralization, observed in the reactions mediated by the photocatalysts evaluated in the present study, Fig. S3—Supplemental Information, suggest that these reactions occur in two stages, following kinetics of apparent pseudo-first order. Initially, the reaction occurs at a rate lower than in the second stage, when the apparent rate constant, in some cases, is three times higher. The higher rate constant in the second stage should be a consequence of the more favored adsorption of the fragments of organic matter formed in the first stage of the process, combined with the good availability of oxygen and water, important for the formation of radicals responsible for the oxidation of organic matter (França et al., 2016).
The mineralization of P4R mediated by the oxides W1-25, W1-50 and W1-75 increased respectively 5.7%, 18.6% and 24.3% more than the result obtained using W1, when 70% mineralization was achieved. It is noteworthy that the hydrolysis process which gave rise to this oxide, occurred exclusively in the presence of water. It should be noted that the mineralization achieved using TiO2 P25 as photocatalyst was only 8% higher than that obtained when W1-75 was employed.
Although the mineralization and discoloration of P4R conducted using W1-75 presented the best performance among the synthesized oxides, the result observed was only 4.8% higher than that achieved using W1-50. Considering the proportion of acetone used in the synthesis of W1-75 and its limited photocatalytic performance, W1-50 was considered as the most effective catalyst for mineralizing P4R, being therefore preferably applied in the following stages of the present study. Since W1-25 presented intermediate performance to that observed for W1 and W1-50 catalysts, evaluating its efficiency, regarding the degradation of RR120, was therefore considered unnecessary.
The good photocatalytic activity presented by these oxides, in particular the W1-50, can be attributed mainly to the mixed composition of the phases and high crystallinity obtained after heat treatment, confirmed by the XRD and Raman spectra. The presence of an additional phase tends to introduce defects that tend to favor the photocatalytic activity of a photocatalyst (Kandiel et al., 2010). Brookite, for having conduction band approximately 0.14 eV more negative than anatase, ends up favoring the interfacial electron transfer by imposing an energy barrier for the return of the excited electrons to the valence band of anatase, which tends to favor the coexistence of charge carriers (Kandiel et al., 2010; Di Paola, Bellardita & Palmisano, 2013; Patrocinio et al., 2015).
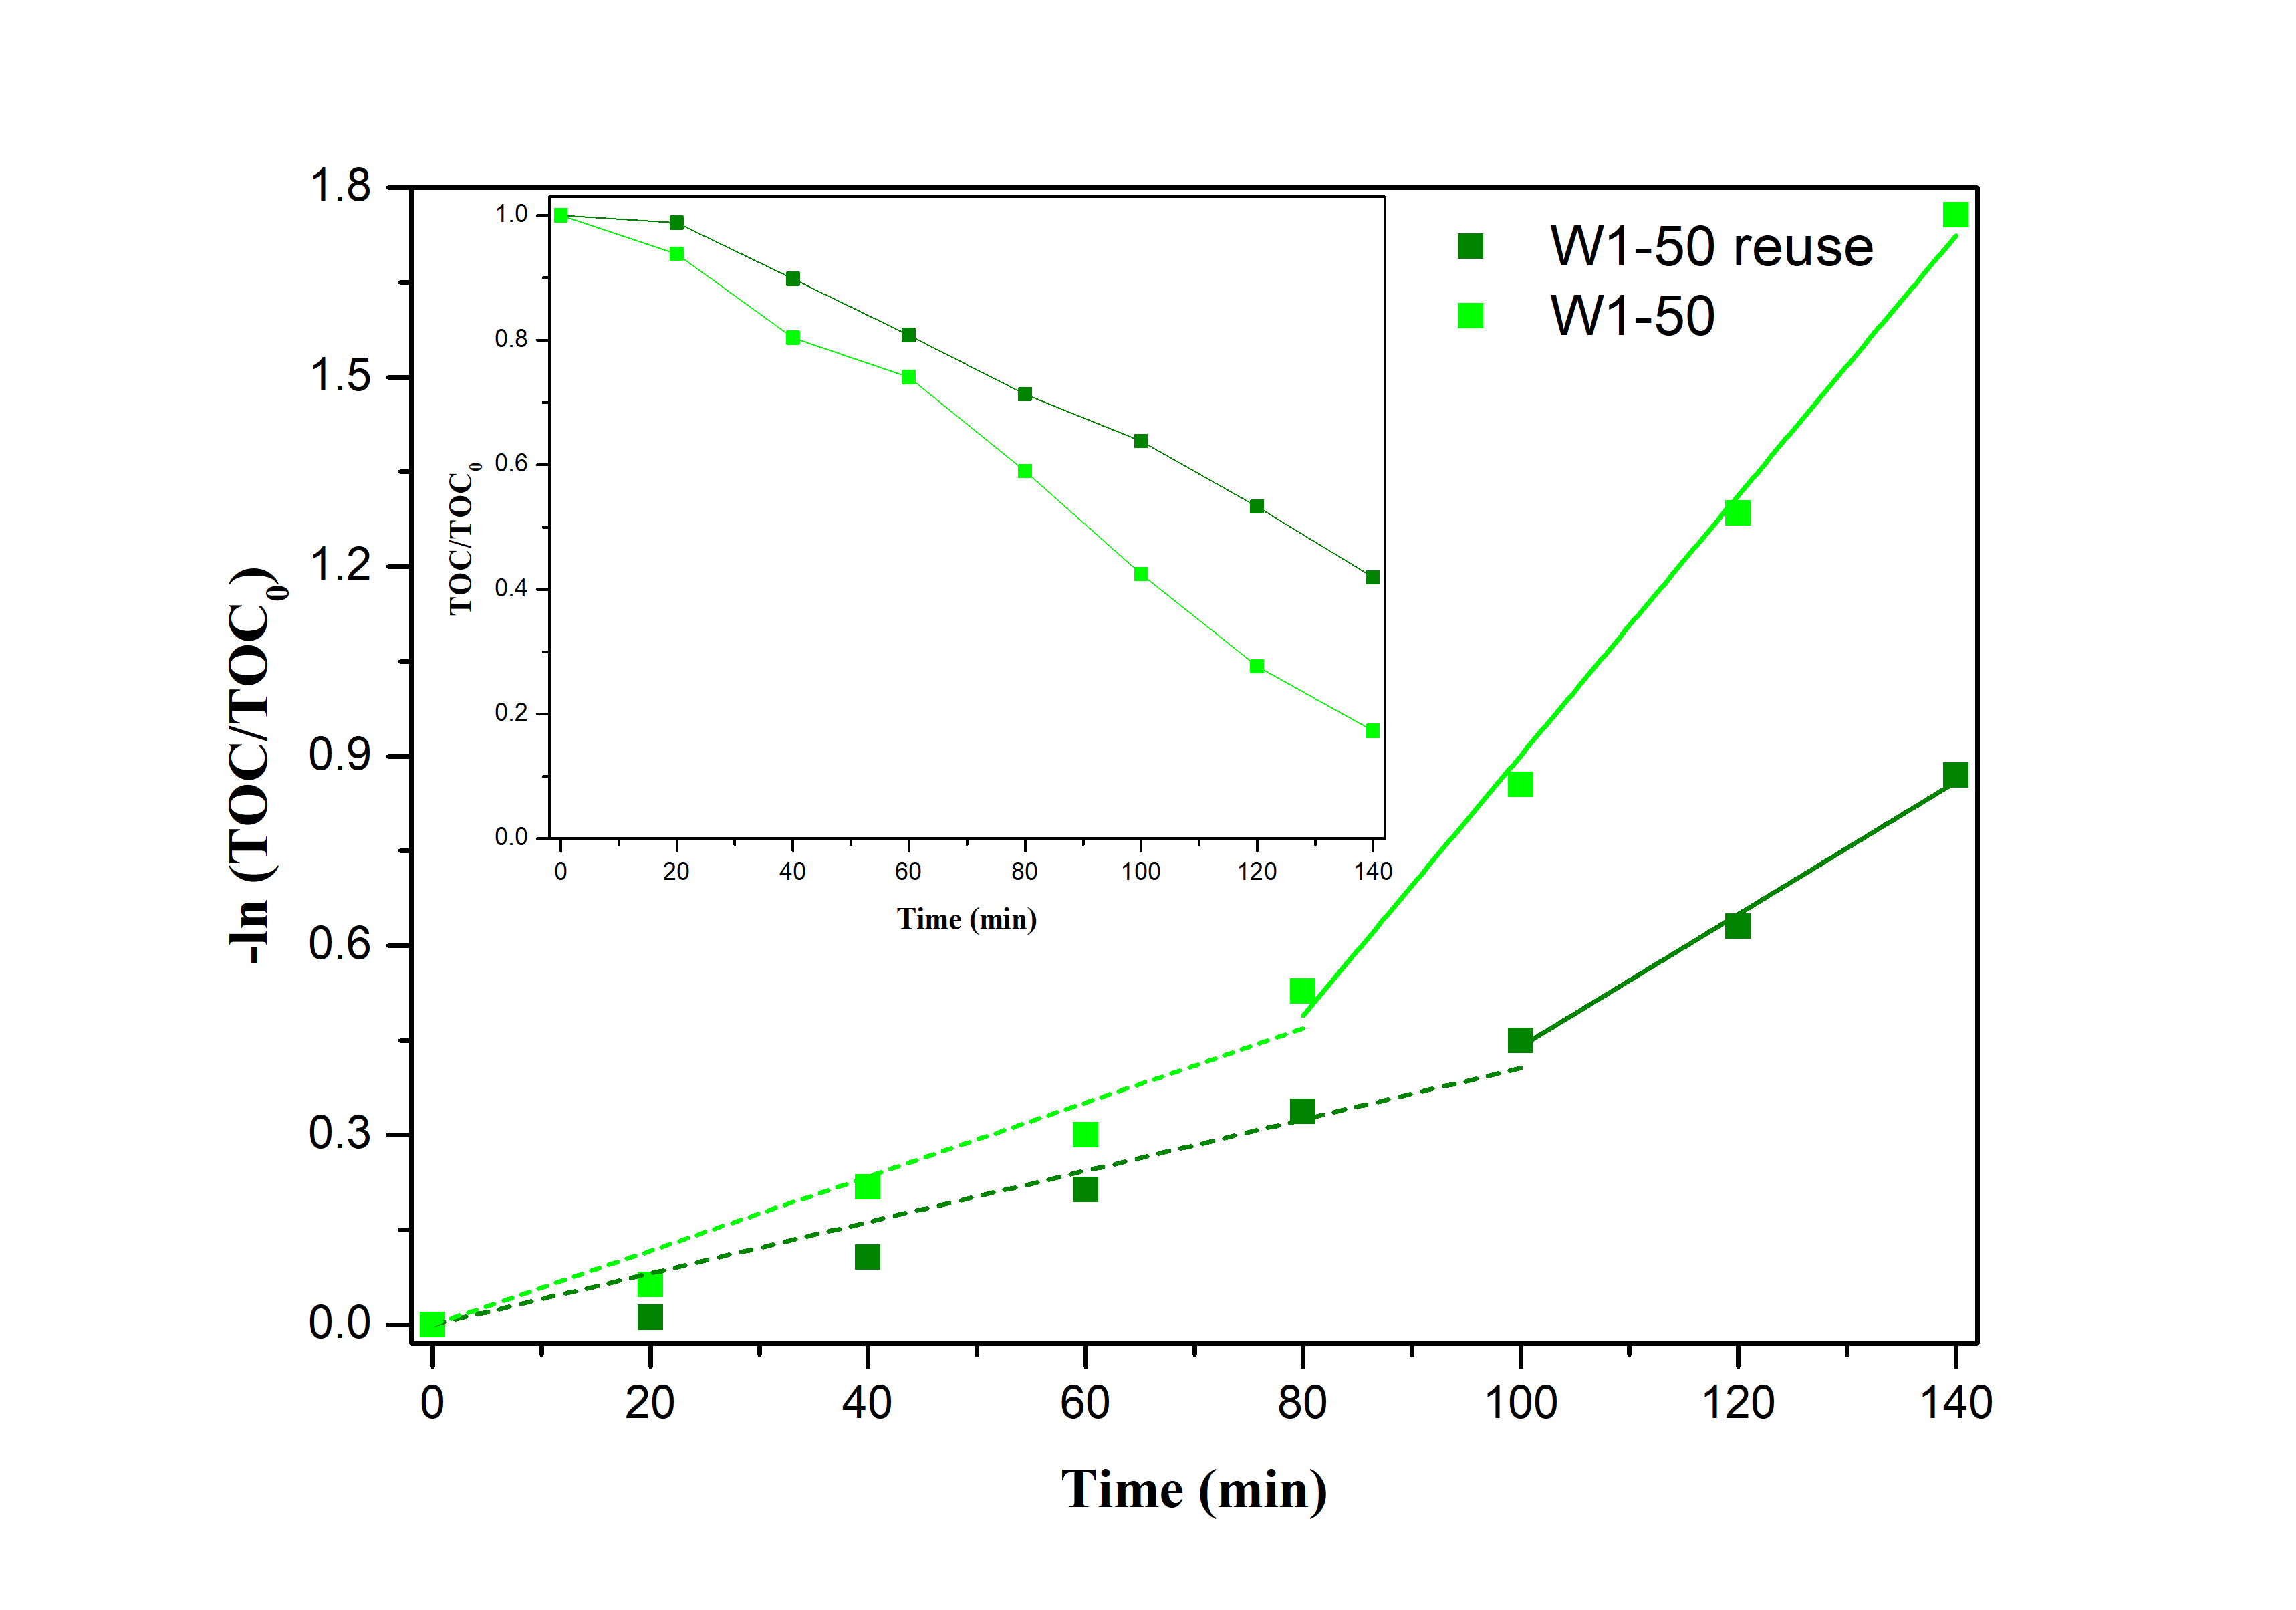
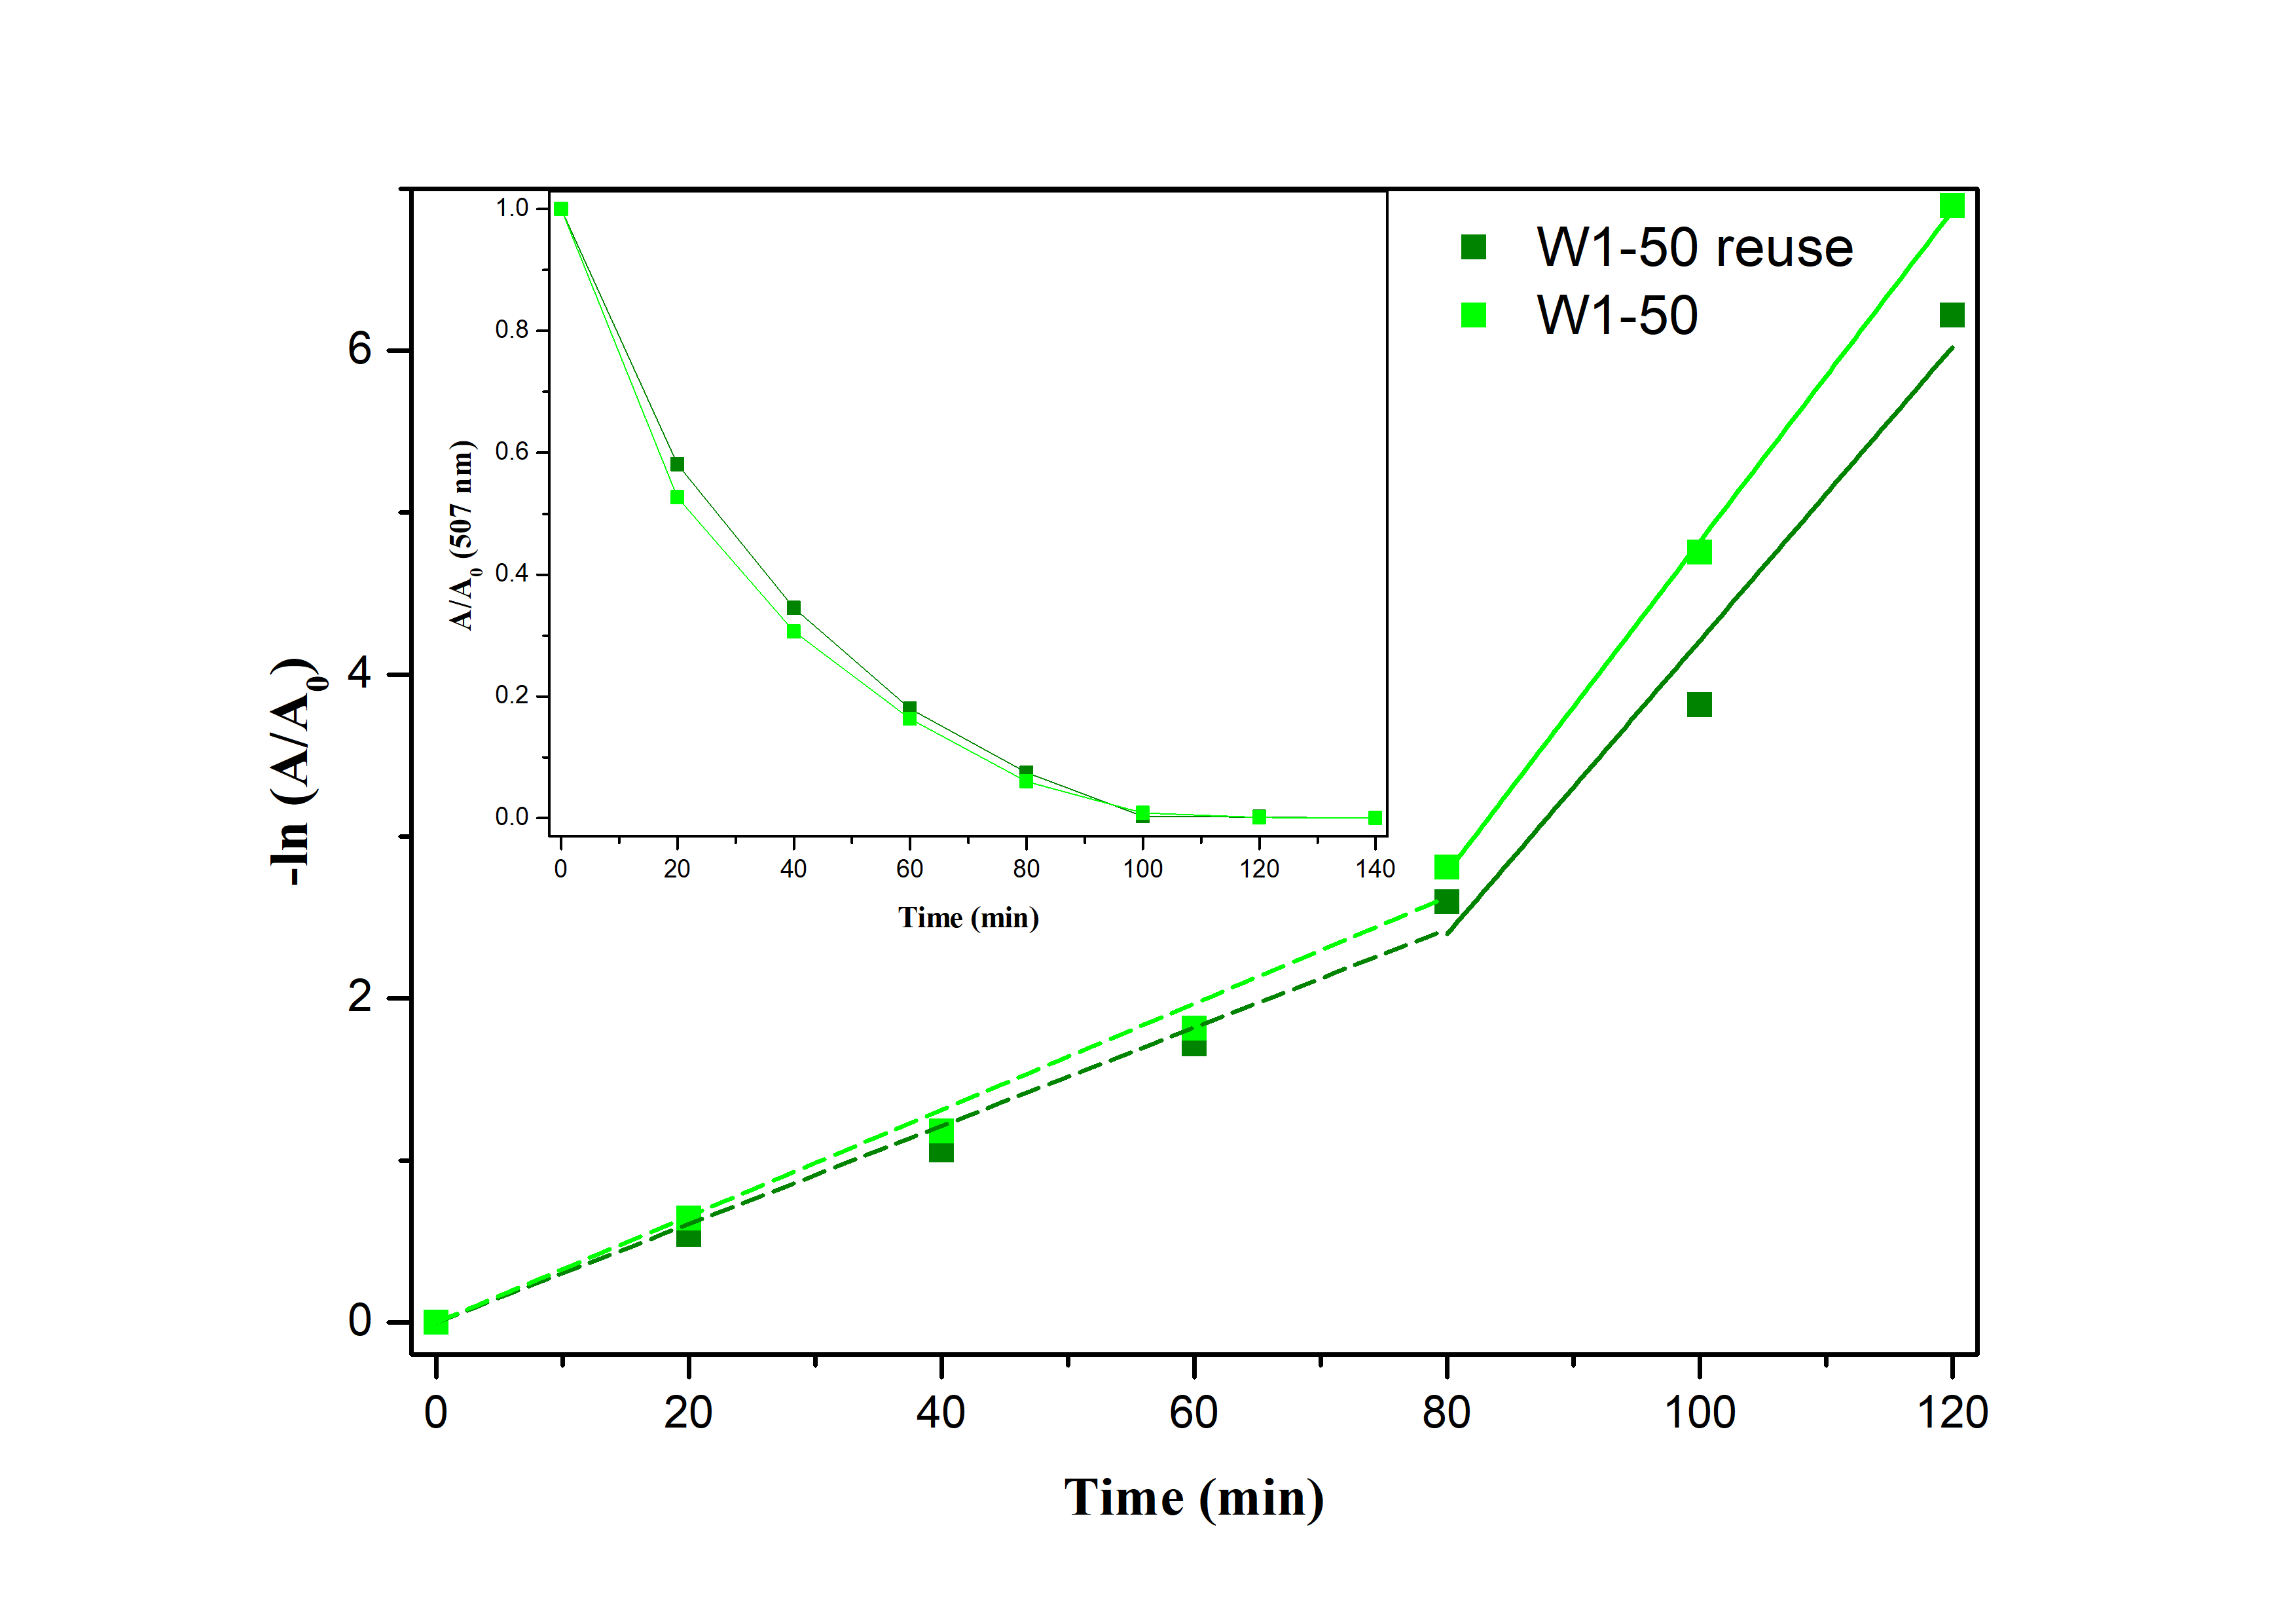
Reuse assays were performed using the recycled W1-50 in the photocatalytic degradation of the dye P4R. The recycled W1-50 was separated by decantation after the first photocatalytic test. It was then washed with distilled water, centrifuged and dried at 70 °C for 24 h. After this procedure, the recycled oxide was used to promote the degradation of P4R present in a new solution. The discoloration level remained at 100% while the mineralization performance decreased about 30%. This loss of performance should be related to photocatalyst poisoning caused by species adsorbed on the catalyst at the end of each photocatalytic cycle, compromising the availability of active sites (Nakhjavani et al., 2015). It is important to consider that the recycled catalyst was not submitted to any prior purification procedure aiming the removal of contaminants incorporated by adsorption the previous cycles. The discoloration and mineralization profiles, as well as the kinetics of discoloration and mineralization in this reuse assay, are available in the Supplemental Information, Fig. S4.
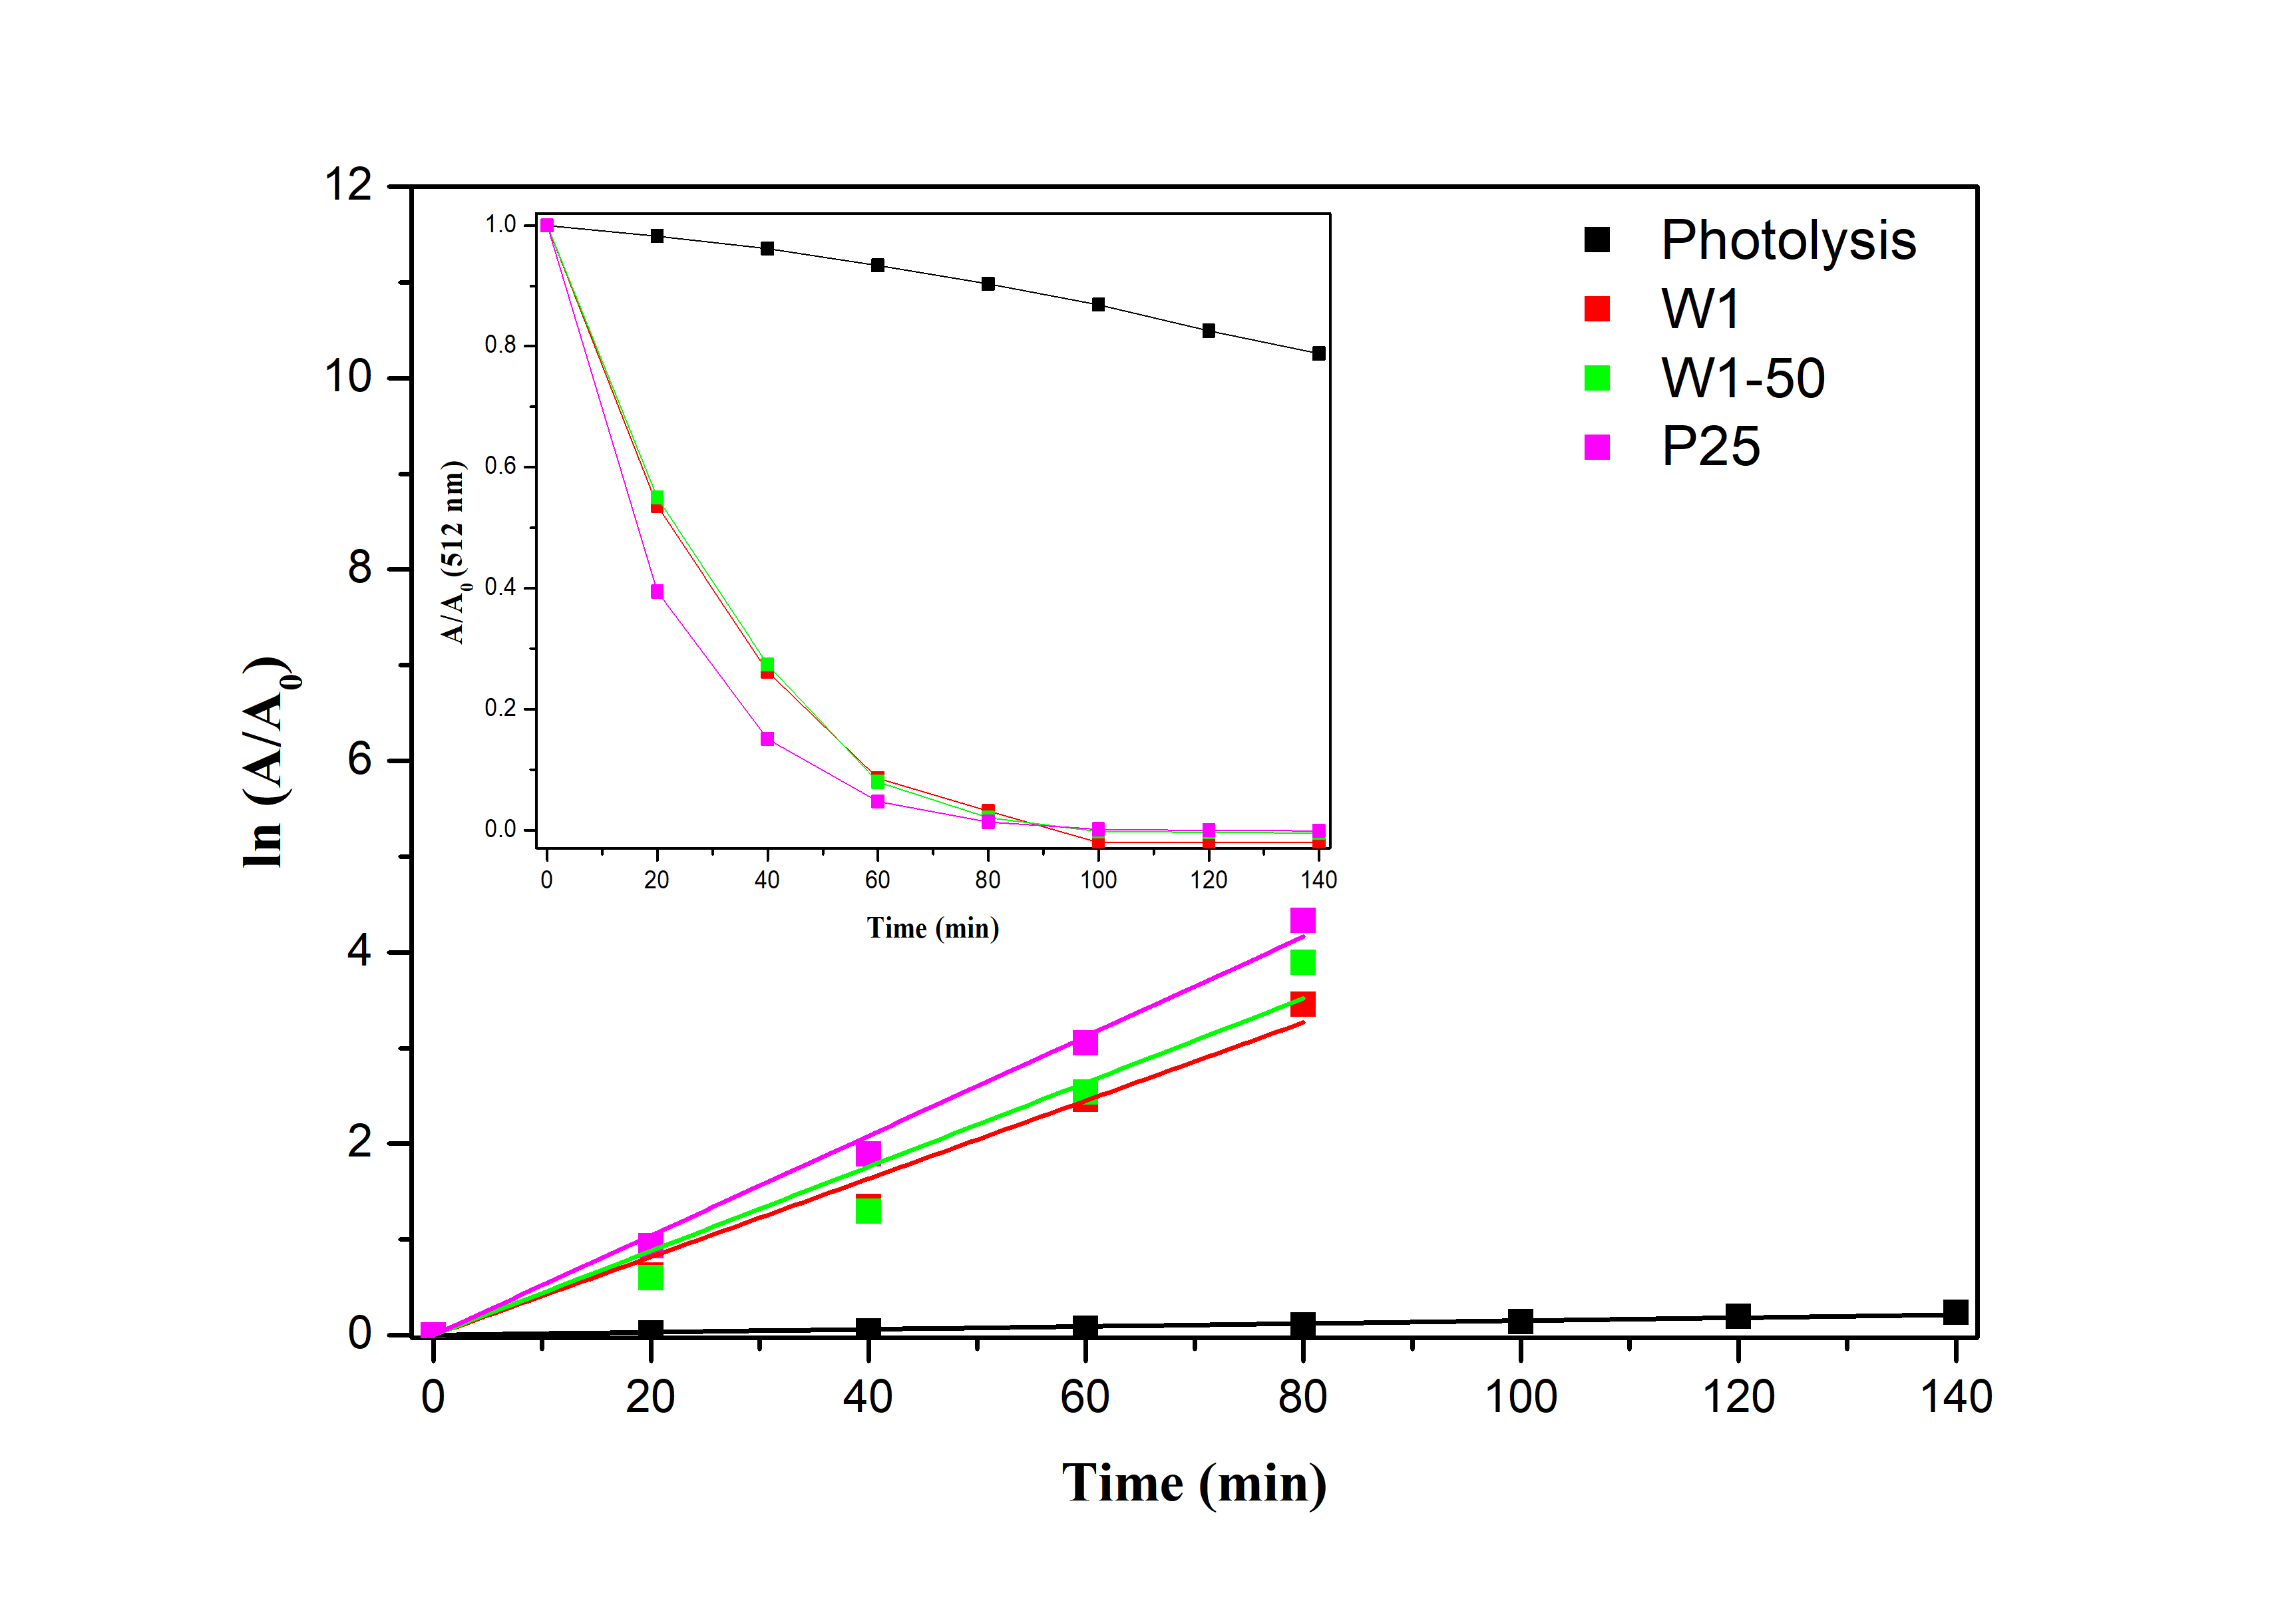
Table 3 also presents the performance of the oxides W1, W1-50 and TiO2 P25 in the mineralization and discoloration of the dye RR120. In this case, although RR120 has a more complex chemical structure than P4R, presenting two azo groups and two triazine groups, the performance achieved by W1-50 was comparable to that presented when using TiO2 P25 differing only by the kinetic constants of mineralization (kmin). The residual total organic carbon (TOC) observed after degradation of both P4R and RR120 (Figs. S3 and S5; Supplemental Information), should be related to the presence of short-chain carboxylic acids, recalcitrant to photocatalytic degradation (França et al., 2016). Studies have shown that the triazine groups present in the chemical structure of RR120, when photocatalytically oxidized, give rise to cyanuric acid, very resistant to degradation (Chun & Yizhong, 1999; Wang, 2000; Camarillo & Ricón, 2011).
Photocatalytic hydrogen production
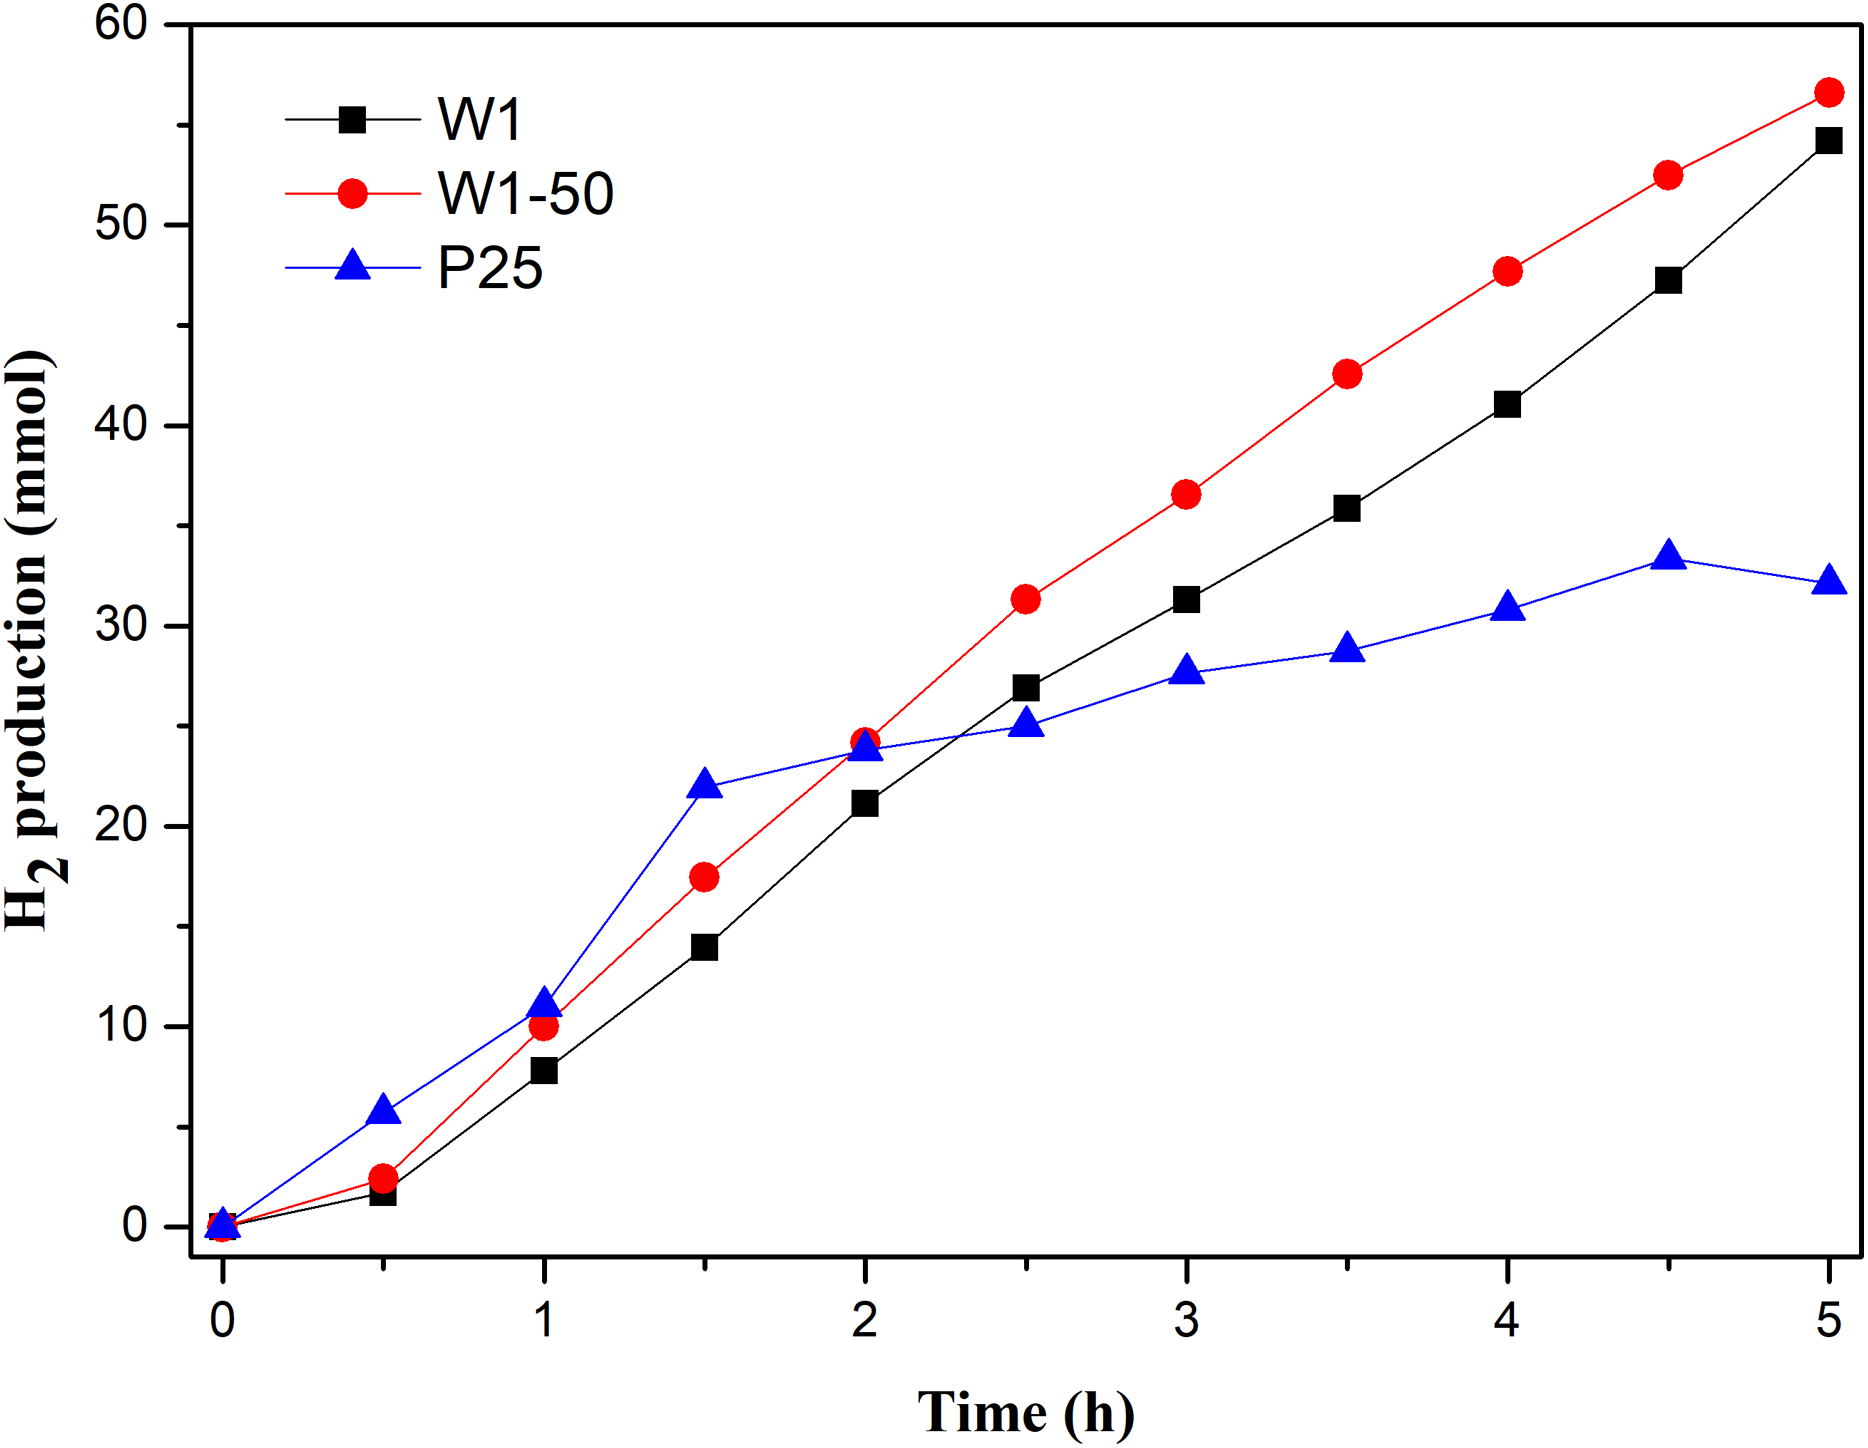
The profiles of hydrogen production as function of the reaction time, Fig. 8, show a superior performance of W1 and W1-50 compared to TiO2-P25.
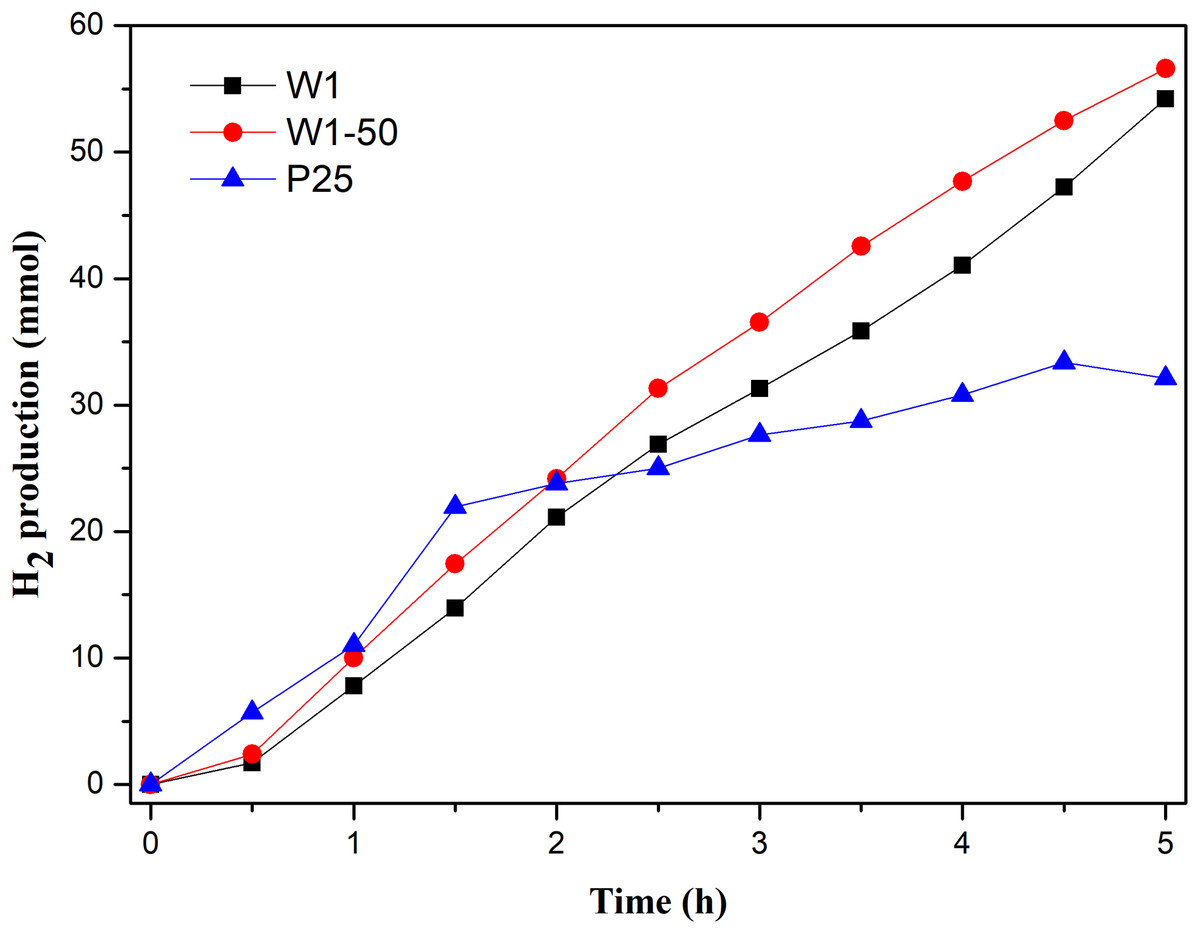
Figure 8: Photocatalytic hydrogen production vs reaction time.
The process mediated by W1-50 produced approximately 56 mmols of gaseous H2, while in the same period TiO2 P25 produced 43% less. On the other hand, W1 produced approximately 3% less hydrogen than W1-50. In addition, it is explicit that the production of H2 using the oxides presented in this study increased until the end of the assay, suggesting that the photocatalytic process was still in its propagation stage. H2 production using TiO2 P25 presented a different profile, suggesting typical accommodation of processes in stages near termination. It is known that TiO2 P25 is the result of the crystalline composition between anatase and rutile. The advantage of the photocatalysts presented in this work should be in the combination of anatase and brookite that tends to increase the photocatalytic efficiency of the semiconductor. Liu et al. (2014), for example, demonstrated that the recombination of the photoinduced charge carriers is minimized when the semiconductor oxide have a structure based on this kind of phase composition. This behavior occurs due to the most negative cathode potential of the conduction band of the brookite phase, more negative than the proton reduction potential and the cathode potential of the conduction band of anatase, thus favoring its conversion to H2 (Kandiel et al., 2010; Patrocinio et al., 2015; Tay et al., 2013). Besides, this phenomenon facilitates the interfacial transfer of electrons while an energy barrier is established, which hinders their return, thereby prolonging the coexistence of the charge carriers. With this, both the oxidative (metanol oxidation) and the reductive process (H2 production) end up being favored.
In terms of specific hydrogen production rate (SHPR), the production mediated by W1-50 (138.5 mmol h−1 g−1) was 60% higher than the achieved using TiO2 P25 (86.4 mmol h−1 g−1). Even the SHPR of W1 (126.5 mmol h−1 g−1) was higher than that of the commercial photocatalyst. It is observed, therefore, that the variant of the sol–gel synthesis proposed in this study resulted in pure photocatalysts, such as the W1-50, which present SHPR much higher than that of TiO2 P25, as well as of photocatalysts recently reported in the literature. Selcuk, Boroglu & Boz (2012), in a study involving a catalyst resulting from TiO2 codopage with platinum and nitrogen, reported, under the best operating conditions, a SHPR of 13 µmol h−1 g−1, a value significantly lower than the achieved using W1-50. This study involved the use of a 400 W mercury lamp as a source of radiation and a solution containing 10% methanol. In another study, Lin & Shih (2016) using a TiO2 doped with copper and nitrogen, obtained a SHPR equal to 27.4 mmol h−1 g−1, a value approximately 5 times lower than the achieved using the W1-50 in the present study. These authors also used a 400 W mercury lamp as a source of radiation. In this case, the catalyst was suspended in a solution containing 20% methanol.
In addition, the reuse of the W1-50 was evaluated for the collection of information related to its photostability. These tests consisted in evaluating the reproducibility of the catalytic action of this oxide by performing three consecutive photocatalytic cycles of 5 h each using the same initial conditions applied to the system, with the exception of the pH of the medium, adjusted at the beginning of each additional cycle. These results are presented in Fig. 9.
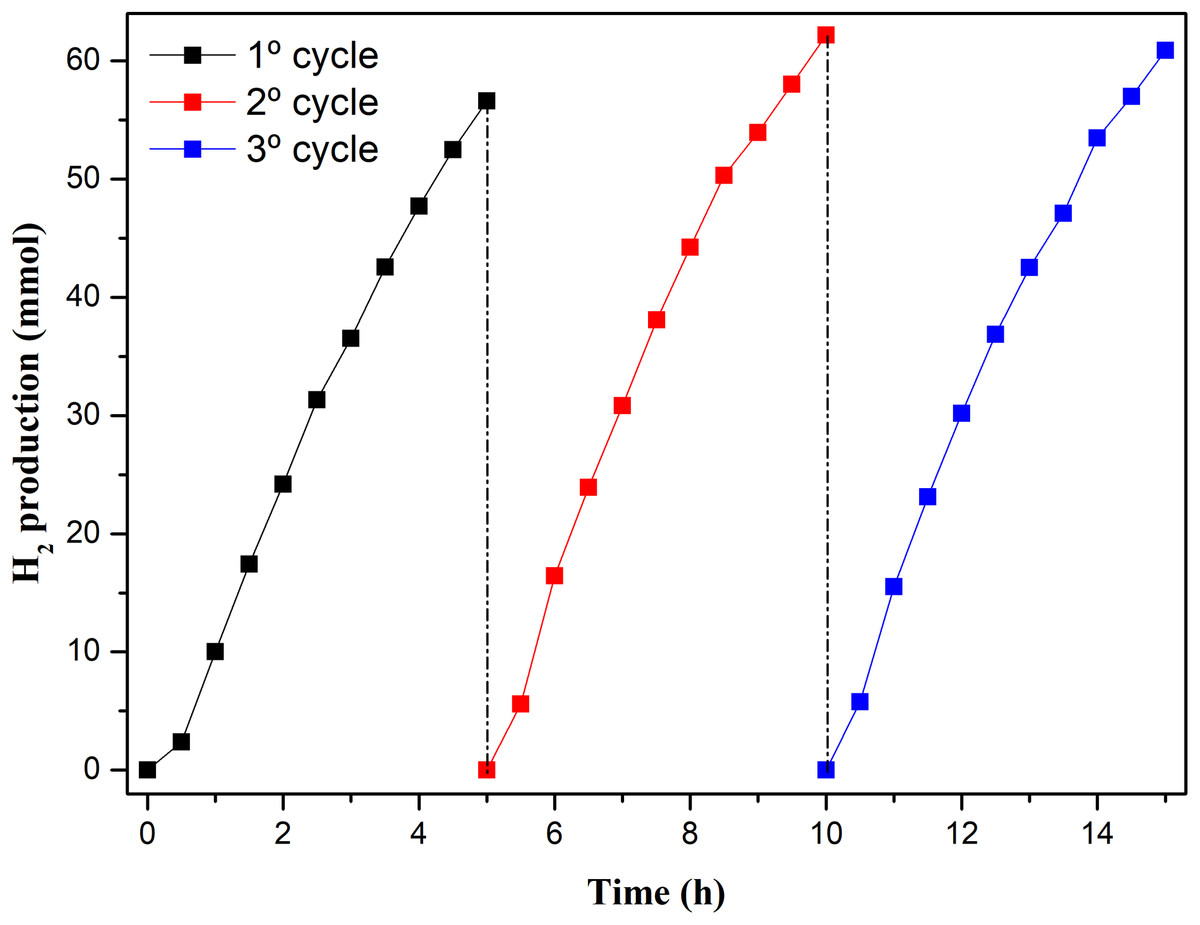
Figure 9: Amount of H2 produced by W1-50 in three photocatalytic cycles.
Although there is an increase in H2 production in the other cycles, compared to the first cycle, during the photocatalytic cycles W1-50 presented a similar profile of H2 production in the three cycles, Fig. 9. In the second cycle, the SHPR increased by about 10% (154.7 mmol h−1 g−1) compared to the first cycle, whereas in the third cycle this increase was of 9%. The good photostability, reproducibility and significant yield in H2 production during these experiments may be related to the absence of contaminants in the catalyst in the different cycles. Certain oxides based on TiO2, obtained from associations, anchoring and doping with other substances, show losses in the capability of H2 production as the photocatalytic cycles succeed. The reason for this has been pointed out as being due the photodesorption of compounds associated or anchored or by photoreduction of metals on TiO2 surface, thus contaminating the reaction sites (Zhang et al., 2013; Yuan et al., 2015).
Conclusions
In the present study, we show that the use of acetone as a cosolvent in the hydrolysis of titanium tetraisopropoxide interfered favorably in the organization of critical nuclei in the oligomeric network of Titanium, in order to preorder phase crystallization brookite, thereby expanding the photocatalytic activity of the synthesized oxides. The results obtained by DRX analysis, together with the subsequent Rietveld refinement, demonstrated that the synthesized oxides are crystalline, with the percentage of brookite phase ranging from 13% to 22%, from W1 to W1-50. The changes in the surface area are influenced by the presence of acetone during the hydrolysis process, verified by the increase of 12% for W1-50 compared to that of W1. On the other hand, the estimated band gap energies have not undergone significant changes in view of the synthesis conditions.
During the photodegradation assays, the W1-50 was defined as the most effective photocatalyst, considering P4R degradation, when 83% mineralization and 100% discoloration were achieved. In reuse assays using the same catalyst and new charges of the same dye, it was possible to achieve the same level of discoloration. However, the mineralization was impaired by the lack of previous treatment of the catalyst between the cycles of reuse, reaching only 58% of mineralization. On the other hand, in the degradation of the dye RR120 the performance of W1-50 was comparable to that obtained using TiO2 P25, with 100% discoloration and 79% mineralization.
Regarding the photocatalytic production of hydrogen using W1-50 as a catalyst, 56 mmols of gaseous hydrogen were produced in 5 h of reaction, which corresponds to a specific hydrogen production rate (SHPR) of 138.5 mmol h−1 g−1, a value 60% higher than that achieved when TiO2 P25 was employed. In addition, the reuse assays demonstrated the very good photostability and effectiveness of W1-50, which also ensured an increase of 10% in SHPR in the succession of cycles.
Thus, the changes introduced in the structure of TiO2 by the use of water-acetone mixtures during the hydrolysis of titanium tetrahydropropoxide resulted in materials with improved photocatalytic performance both in the degradation/mineralization of organic dyes and in the photocatalytic production of hydrogen. The reason for this good performance may be related to hydrolysis retardation, favoring the obtaining of more ordered and mesoporous oxides, with expressive surface area. It is important to emphasize that the synthesis process favored the increase in the composition of crystalline phases, stimulating the increase in the proportion of brookite, which tends to favor the delay in the recombination of the photoinduced charge carriers (electron/hole), expanding the photocatalytic performance and especially regarding the production of gaseous hydrogen.
Supplemental Information
Diffratograms obtained after Rietveld refinement for the synthesized oxides: (a) W1, (b) W1-25, (c) W1-50 and (d) W1-75.
Particle size distribution histograms of the synthesized oxides: (a) W1, (b) W1-25, (b) W1-50, and (d) W1-75.
Degradation of P4R by direct photolysis, and photocatalytic performance in the mineralization (a) and discoloration (b) of P4R by the studied oxides.
Degradation of P4R by direct photolysis, and photocatalytic performance in the mineralization (a) and discoloration (b) of P4R by the studied oxides.
Degradation of P4R by direct photolysis, and photocatalytic performance in the mineralization (a) and discoloration (b) of P4R by the studied oxides.
Photocatalytic performance in a reuse assay of W1-50 in mineralization (a) and discoloration (b) of P4R.
Obtaining a mineralization constant of 4.0 × 10³ min−1 in the first stage, and 10.0 × 10³ min−1 in the second of the reaction using the recycled catalyst.
Photocatalytic performance in a reuse assay of W1-50 in mineralization (a) and discoloration (b) of P4R.
Obtaining a mineralization constant of 4.0 × 10³ min−1 in the first stage, and 10.0 × 10³ min−1 in the second of the reaction using the recycled catalyst.
Degradation of RR120 by direct photolysis, and photocatalytic performance in the mineralization (a) and discoloration (b) of RR120 by the studied oxides.
Degradation of RR120 by direct photolysis, and photocatalytic performance in the discoloration (b) of RR120 by the studied oxides.
Data treatment: N2 adsorption–desorption isotherms obtained for the studied photocatalysts.
Origin (opj file) is a graphical software for data analysis and statistics developed by Originlab for running on Windows platform. This file was used to create Figure 6.
Data treatment: Photocatalytic hydrogen production vs Reaction time.
Origin (opj file) is a graphical software for data analysis and statistics developed by Originlab for running on Windows platform. This file was used to create Figure 8.
Data treatment: Amount of H2 produced by W1-50 in three photocatalytic cycles.
Origin (opj file) is a graphical software for data analysis and statistics developed by Originlab for running on Windows platform. This file was used to create Figure 9.
N2 adsorption-desorption isotherms obtained for the studied photocatalysts.
This file was used in the analysis of data from Figure 6 and can be opened through the Excel program, spreadsheet editor produced by Microsoft.
Photocatalytic hydrogen production vs Reaction time.
This file was used in the analysis of data from Figure 8 and can be opened through the Excel program, spreadsheet editor produced by Microsoft.
Amount of H2 produced by W1-50 in three photocatalytic cycles.
This file was used in the analysis of data from Figure 9 and can be opened through the Excel program, spreadsheet editor produced by Microsoft.