
Empirical evaluation of an architectural technical debt index in the context of the Apache and ONAP ecosystems
- Published
- Accepted
- Received
- Academic Editor
- Robert Winkler
- Subject Areas
- Computer Architecture, Software Engineering
- Keywords
- Technical debt, Software architecture, Index, Software metrics, Software portfolio analysis, Empirical evaluation
- Copyright
- © 2022 Verdecchia et al.
- Licence
- This is an open access article distributed under the terms of the Creative Commons Attribution License, which permits using, remixing, and building upon the work non-commercially, as long as it is properly attributed. For attribution, the original author(s), title, publication source (PeerJ Computer Science) and either DOI or URL of the article must be cited.
- Cite this article
- 2022. Empirical evaluation of an architectural technical debt index in the context of the Apache and ONAP ecosystems. PeerJ Computer Science 8:e833 https://doi.org/10.7717/peerj-cs.833
Abstract
Background
Architectural Technical Debt (ATD) in a software-intensive system denotes architectural design choices which, while being suitable or even optimal when adopted, lower the maintainability and evolvability of the system in the long term, hindering future development activities. Despite the growing research interest in ATD, how to gain an informative and encompassing viewpoint of the ATD present in a software-intensive system is still an open problem.
Objective
In this study, we evaluate ATDx, a data-driven approach providing an overview of the ATD present in a software-intensive system. The approach, based on the analysis of a software portfolio, calculates severity levels of architectural rule violations via a clustering algorithm, and aggregates results into different ATD dimensions.
Method
To evaluate ATDx, we implement an instance of the approach based on SonarQube, and run the analysis on the Apache and ONAP ecosystems. The analysis results are then shared with the portfolio contributors, who are invited to participate in an online survey designed to evaluate the representativeness and actionability of the approach.
Results
The survey results confirm the representativeness of the ATDx, in terms of both the ATDx analysis results and the used architectural technical debt dimensions. Results also showed the actionability of the approach, although to a lower extent when compared to the ATDx representativeness, with usage scenarios including refactoring, code review, communication, and ATD evolution analysis.
Conclusions
With ATDx, we strive for the establishment of a sound, comprehensive, and intuitive architectural view of the ATD identifiable via source code analysis. The collected results are promising, and display both the representativeness and actionability of the approach. As future work, we plan to consolidate the approach via further empirical experimentation, by considering other development contexts (e.g., proprietary portfolios and other source code analysis tools), and enhancing the ATDx report capabilities.
Introduction
Architectural Technical Debt (ATD) in a software-intensive system denotes architectural design choices which, while being suitable or even optimal when adopted, lower the maintainability and evolvability of the system in the long term, hindering future development activities (Avgeriou et al., 2016). With respect to other types of technical debt (TD), e.g., test debt (Samarthyam, Muralidharan & Anna, 2017) or build debt (Morgenthaler et al., 2012), ATD is characterized by being widespread throughout entire code-bases, mostly invisible to software developers, and of high remediation costs (Kruchten, Nord & Ozkaya, 2012b).
Due to its impact on software development practices, and its high industrial relevance, ATD is attracting a growing interest within the scientific community and software analysis tool vendors (Verdecchia, Malavolta & Lago, 2018). Notably, over the years, numerous approaches have been proposed to detect, mostly via source code analysis, ATD instances present in software intensive-systems. Such methods rely on the analysis of symptoms through which ATD manifests itself, and are conceived to detect specific types of ATD by adopting heterogeneous strategies, ranging from the model-based analysis of heterogeneous architectural artifacts (Pérez, 2020), the combination of technical and business factors to support architectural decision-making (Ampatzoglou et al., 2021), the analysis of dependency anti-patterns (Arcelli Fontana et al., 2017), and the evaluation of components modularity (Martini, Sikander & Madlani, 2018). Additionally, numerous static analysis tools, such as NDepend (https://www.ndepend.com), CAST (https://www.castsoftware.com/products/code-analysis-tools), and SonarQube (https://www.sonarqube.org), are currently available on the market, enabling to keep track of such symptoms of technical debt and architecture-related issues present in code-bases. These existing academic and industrial approaches focus on fine-grained analysis techniques, considering ad-hoc definitions of technical debt and software architecture, in order to best fit their analysis processes to technical debt assessment. Nevertheless, to date, how to gain an informative and encompassing viewpoint of the potentially highly heterogeneous (Verdecchia et al., 2021) ATD present in a software-intensive system is still an open question.
In order to fill this gap, in this study we present an improved version of ATDx (Verdecchia et al., 2020), an approach designed to provide data-driven, intuitive, and actionable insights on the ATD present in a software-intensive system. ATDx consists of a theoretical, multi-step, and semi-automated process, concisely entailing (i) the reuse of architectural rules supported by third-party analysis tools, (ii) the calculation of the severity of architectural rule violations based on the comparison of normalized values across a software portfolio, and (iii) the aggregation of analysis results into a set of customizable ATD dimensions.
The vast majority of state-of-the-art TD and ATD indexes relies on predefined remediation costs and metric thresholds, e.g., the TD index provided by SonarQube (see ‘Related Work’ for further details on related work). In contrast, ATDx distances itself from predefined ATD severities and remediation efforts, as recent literature pointed towards their potential inaccuracy (Baldassarre et al., 2020). In order to avoid utilizing ATD severities and remediation efforts defined a priori, ATDx deduces in a data-driven manner the severity of ATD instances in relation to the other projects belonging to a given software portfolio. Regarding the severity of ATD instances, it is important to note that the ATD severities calculated by ATDx are based on a quantitative approach considering source code analysis results, and point to potential “hotspots” where ATD resides (for more information of the concept of “hotspots” refer to the work of Procaccianti et al., 2015). Hence, while the ATDx analysis results can support software developers and architects by providing a bottom-up overview of the ATD detectable via such approach, the results require in any case to be interpreted by practitioners in order to plan future development and maintenance activities.
Similarly to other studies in the literature (e.g., the work by Kuipers & Visser, 2004), in this paper we refer to software portfolio as the set of software projects (also referred to as software assets) owned by a single company.
The portfolio analysis performed by ATDx allows not only to mitigate potential threats entailed by utilizing predefined remediation costs and metric thresholds, but also to consider the specific context in which a software product is developed and maintained. Furthermore, differently from most state-of-the-art TD and ATD indexes (Avgeriou et al., 2020), ATDx provides a decomposition of its value into different ATD dimensions, allowing to gain an informed overview of the nature of the calculated ATD values. Finally, most state-of-the-art ATD indexes and identification approaches are context-independent, i.e., they do not consider the implementation characteristics of software-intensive systems, that may vary according to the specific domain considered (e.g., as observed by Malavolta et al., 2018), in the context of Android code clones are directly dictated by the templating phenomenon of the activity-intent-based nature of the Android programming idiom, and hence should be considered as a widespread programming practice, rather than a maintainability issue). In order to mitigate this potential shortcoming of context-independent approaches, in ATDx the context can be considered by focusing the analysis on a portfolio of software projects sharing a similar context. Adopting a context-specific portfolio allows to base the severity calculation of ATD issues by comparing software project of similar nature, hence acknowledging that prominent issues in a certain context could be instead a programming norm in another context.
It is important to highlight that ATDx is specifically tailored to the analysis of the implemented architecture of a software-intensive system, i.e., ATDx is capable of reporting exclusively the results regarding the ATD that is identifiable via source code analysis.
ATDx is designed to serve two types of stakeholders: (i) researchers conducting quantitative studies on source-code related ATD and (ii) practitioners carrying out software portfolio analysis and management, to suitably detect ATD items and get actionable insights about the ATD present in their systems according to their organizational and technical needs.
This study builds upon the research in which ATDx was preliminarily reported (Verdecchia et al., 2020) by (i) refining the ATDx in order to address some of its drawbacks (see ‘The ATDx Approach’), and (ii) conducting an empirical evaluation of the approach.
We carry out an empirical evaluation of the ATDx approach involving two open-source software ecosystems (Apache and ONAP), 237 software projects, and 233 open-source software contributors. The gathered results shed light on the representativeness and actionability of ATDx, and provide further insights of the benefits and drawbacks which characterize the approach. Among other, the most relevant characteristics of ATDx are: (i) analysis tool and programming language independence, (ii) data-driven results, rather than based on a priory defined severities, remediation costs, and metric thresholds (iii) extensibility, and (iv) customizability to specific application domains and portfolios.
The main contributions of this paper are the following:
-
the evolution of ATDx, an approach providing a multi-level index of architectural technical debt; refined by replacing the outlier-based calculation of the original approach (Verdecchia et al., 2020) with a severity clustering algorithm;
-
a detailed description of the process for building an instance of ATDx, supporting the independent implementation of an instance of ATDx by researchers and practitioners;
-
an empirical evaluation of the representativeness and actionability of the ATDx approach based on SonarQube, involving two software ecosystems, 237 software projects, and 233 software contributors, supported by the complete replication package (https://github.com/S2-group/ATDx_replication_package), and a thorough discussion of the uncovered ATDx advantages and drawbacks.
The reminder of the paper is structured as follows. In the next section, we present the theoretical framework underlying the ATDx approach, followed by the formalization of the approach, and the description of the steps required to implement an instance of ATDx. In ‘Empirical Evaluation Planning’ and ‘Empirical Evaluation Execution’ we document the planning and execution of the empirical evaluation, respectively. The results of the evaluation are then reported in ‘Results’. In ‘Discussion’ the discussion of the results is reported, while in ‘Threats to Validity’ we elicit the potential threats to validity which may have influenced our results. In ‘Related Work’ we present and discuss the related work. Finally, ‘Conclusions and Future Work’ draws conclusions and hints at future work.
The ATDx Approach
In this section, we provide the definitions of attributes on which the calculation of ATDx relies (‘Definitions’), the ATDx formalization (ATDx Formalization’), and describe the steps for building ATDx (‘ATDx Building Steps’).
Definitions
Definition 1. Architectural rule. Given a source code analysis tool T and the set of its supported analysis rules RT, the architectural rules ART supported by T are defined as the subset of all rules such that:
-
is relevant from an architectural perspective, i.e., strongly influences one choice of structures for the architecture (Keeling, 2017);
-
is able to detect a technical debt item, i.e., “design or implementation constructs that are expedient in the short term but that set up a technical context that can make a future change more costly or impossible” (Avgeriou et al., 2016).
In ATDx, we consider every as a function , where E is the set of architectural elements according to a granularity level (see below). In case that an element e ∈ E violates rule , then returns 1, and 0 otherwise.
For example, a rule checking that method overrides should not change contracts is (i) architectural since it predicates on the high-level structure of a Java-based software project (i.e., its inheritance tree), and (ii) related to technical debt as violating such rule might not lead to immediate repercussions, but could potentially cause unexpected behaviour and cumbersome refactoring as the software project evolves.
Definition 2. Architectural rule granularity level
(Granularity level). Given an architectural rule , its granularity level is defined as the smallest unit of the software project being analysed which may violate , e.g., a class, a method, or a line of code. As an example, if we consider a rule which deals with cloned classes, its corresponding granularity level is “class”. Such mapping of architectural rules to different granularity levels enables us to evaluate and compare the occurrence of rules violations across different software projects at a refined level of precision, instead of trivially adopting a single metric for the size of software projects for all the rules in ART, e.g., source lines of code (SLOC). In addition, it enables us to assess the scope of the technical debt and as needed differentiate from defects.
Definition 3. ATD dimension. Given a set of architectural rules ART for an analysis tool T, the set of ATD dimensions ATDDT contains subsets of architectural rules with similar focus. One architectural rule can belong to one or more ATD dimensions and the mapping between and is established by generalizing the semantic focus of . For example, if an architectural rule deals with the conversion of Java classes into Java interfaces, the could fall under the general Interface ATD dimension. In ATDx, we use the 3-tuple to represent the mapping of each architectural rule to its granularity level and ATD dimensions . It is important to note that, while an can be associated to one and only one granularity level , an can be mapped to multiple dimensions s, and vice versa.
ATDx formalization
ATDx aims to provide a birds-eye view of the ATD present in a software project by analyzing the set of architectural rules ART supported by an analysis tool T, and subsequently aggregating the analysis results into different ATD dimensions ATDDT.
The goal of ATDx is portfolio analysis of projects in respect to their level of ATD. Intuitively, starting from a dataset of ART and GrT values belonging to a set of software projects S. ATDx performs a statistical analysis on the elements contained in the dataset, in order to classify the severity of the architectural rule violations of the software projects. The level of severity the system-under-analysis (SUA) exhibits for each rule , is then reported as a constituent part of the ATD dimension mapped to . Notice that the ATDx analysis results of a specific SUA are relative to the other projects S in the same portfolio, and hence should not be interpreted as absolute values.
ATDx is based on the calculation of the number of architectural rule violations of a software project S (normalized over the size of S) in order to compare the occurrence of rule violations across projects of different sizes. Specifically, for each architectural rule , we first calculate , defined as the set of architectural elements in S violating , i.e., (1) where is the set of all elements e in S according to the granularity (e.g., the set of all Java classes in a Java-based project), and is a function returning e if the element e violates the architectural rule , the empty set otherwise.
Subsequently, we calculate , defined as the normalized number of architectural rule violations over the total number of elements e according to granularity , i.e., (2) where is the size of S expressed according to granularity level (e.g., the total number of Java classes in S), and is the total number of violations of rule (see Eq. (1)).
Once the for rule in S is calculated, we statistically establish its severity. In order to do so, we require the set , which contains the values of for each software project belonging to the portfolio, i.e., (3) where n is the total number of projects belonging to the considered portfolio of software projects.
Given the calculation of , we can establish the severity of the measurement by comparing its value with the other ones contained in . More specifically, given the set of values and the value of , we define the function severity as: (4) where X = [0, 1] and m is the total number of software projects belonging to the portfolio. The severity function returns a discrete value between 0 and 5, indicating the level of severity of w.r.t. the other values in . In order to do so, we adopt a clustering algorithm, namely CkMeans (Wang & Song, 2011), which guarantees optimal, efficient, and reproducible clustering of univariate data(i.e., in our case, values). Consequently, this step consists of identifying the severity cluster of that contains similar values of other software projects within the portfolio. The usage of the CkMeans algorithm replaces the outlier-based calculation of ATD on which the original ATDx approach was based (Verdecchia et al., 2020); this decision allows us to gain finer-grained results (i.e., a discrete value between 0 and 5 instead of a boolean value).
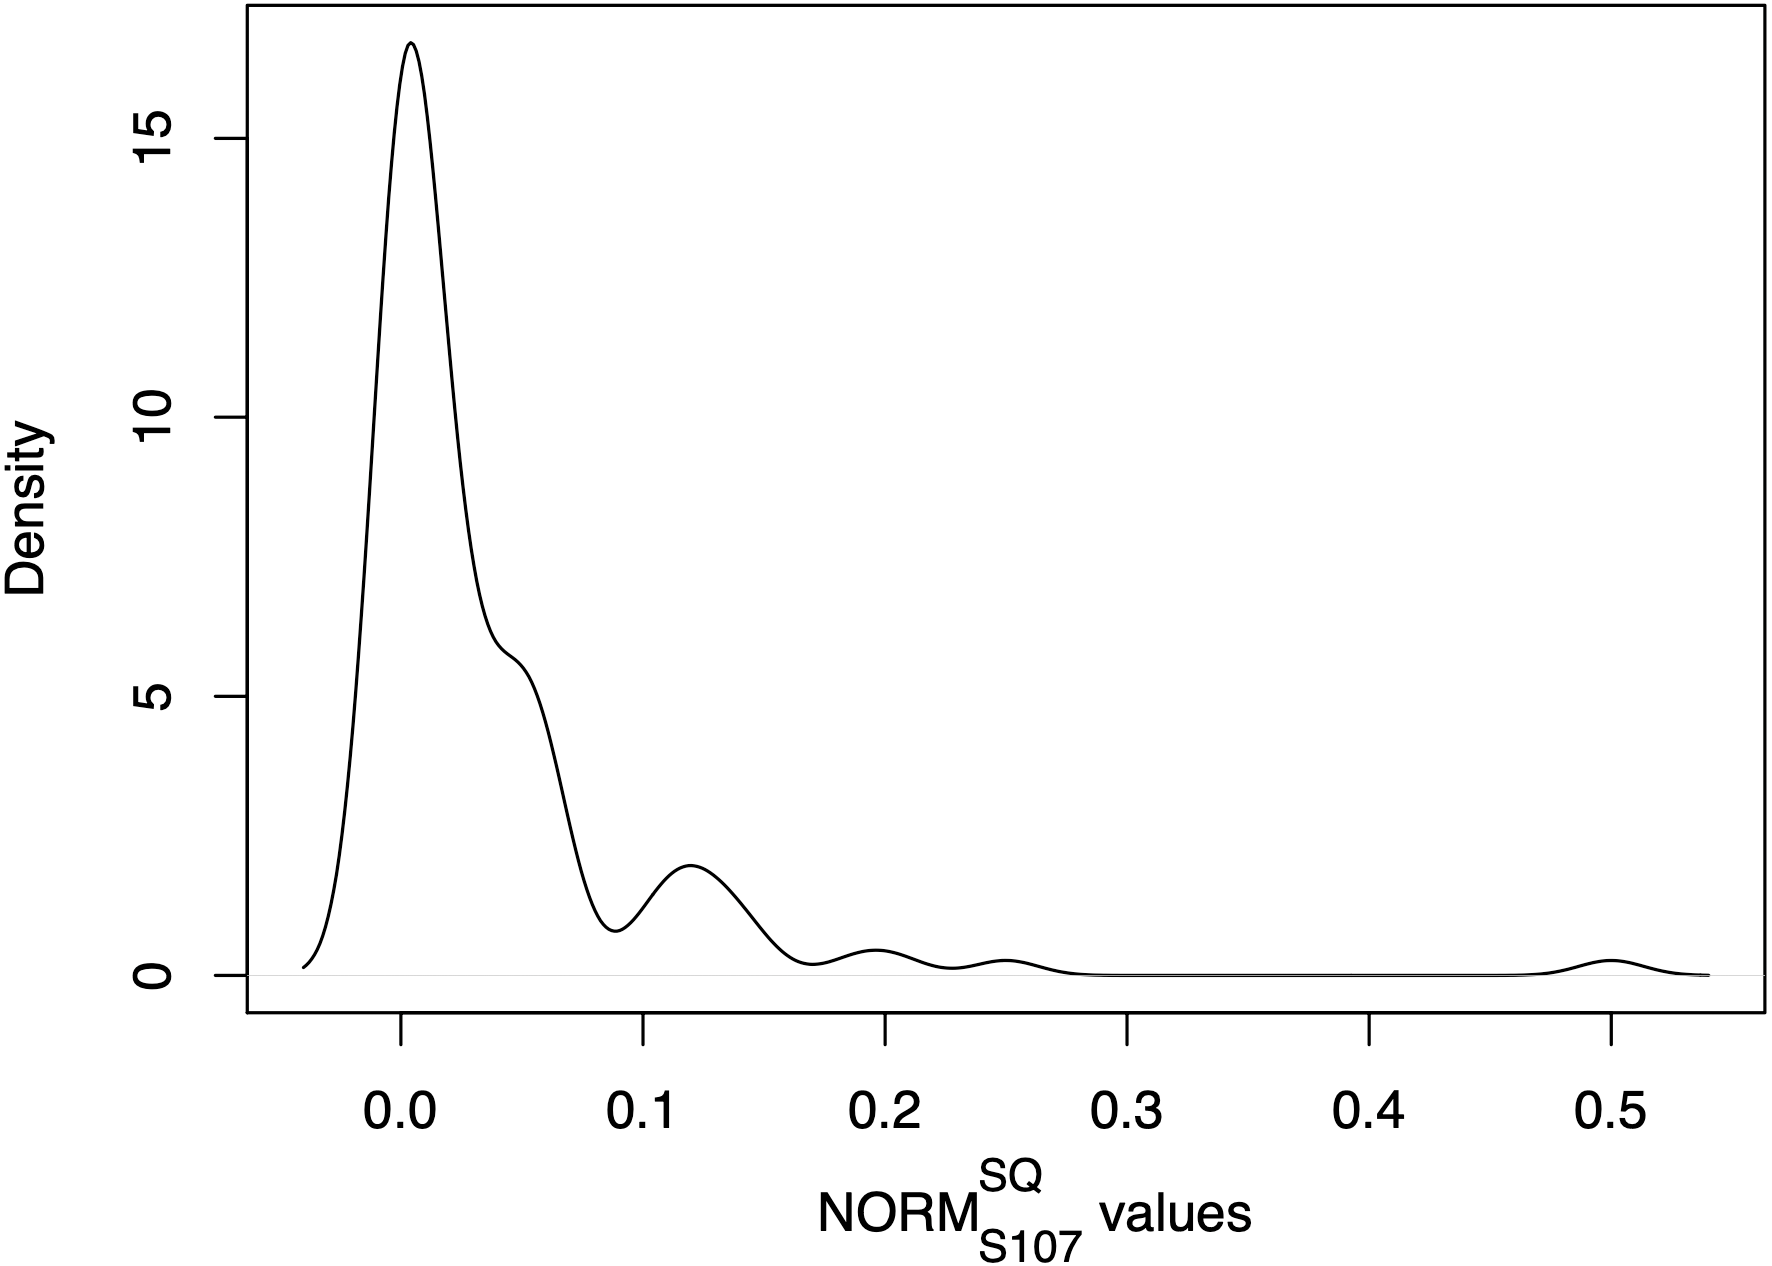
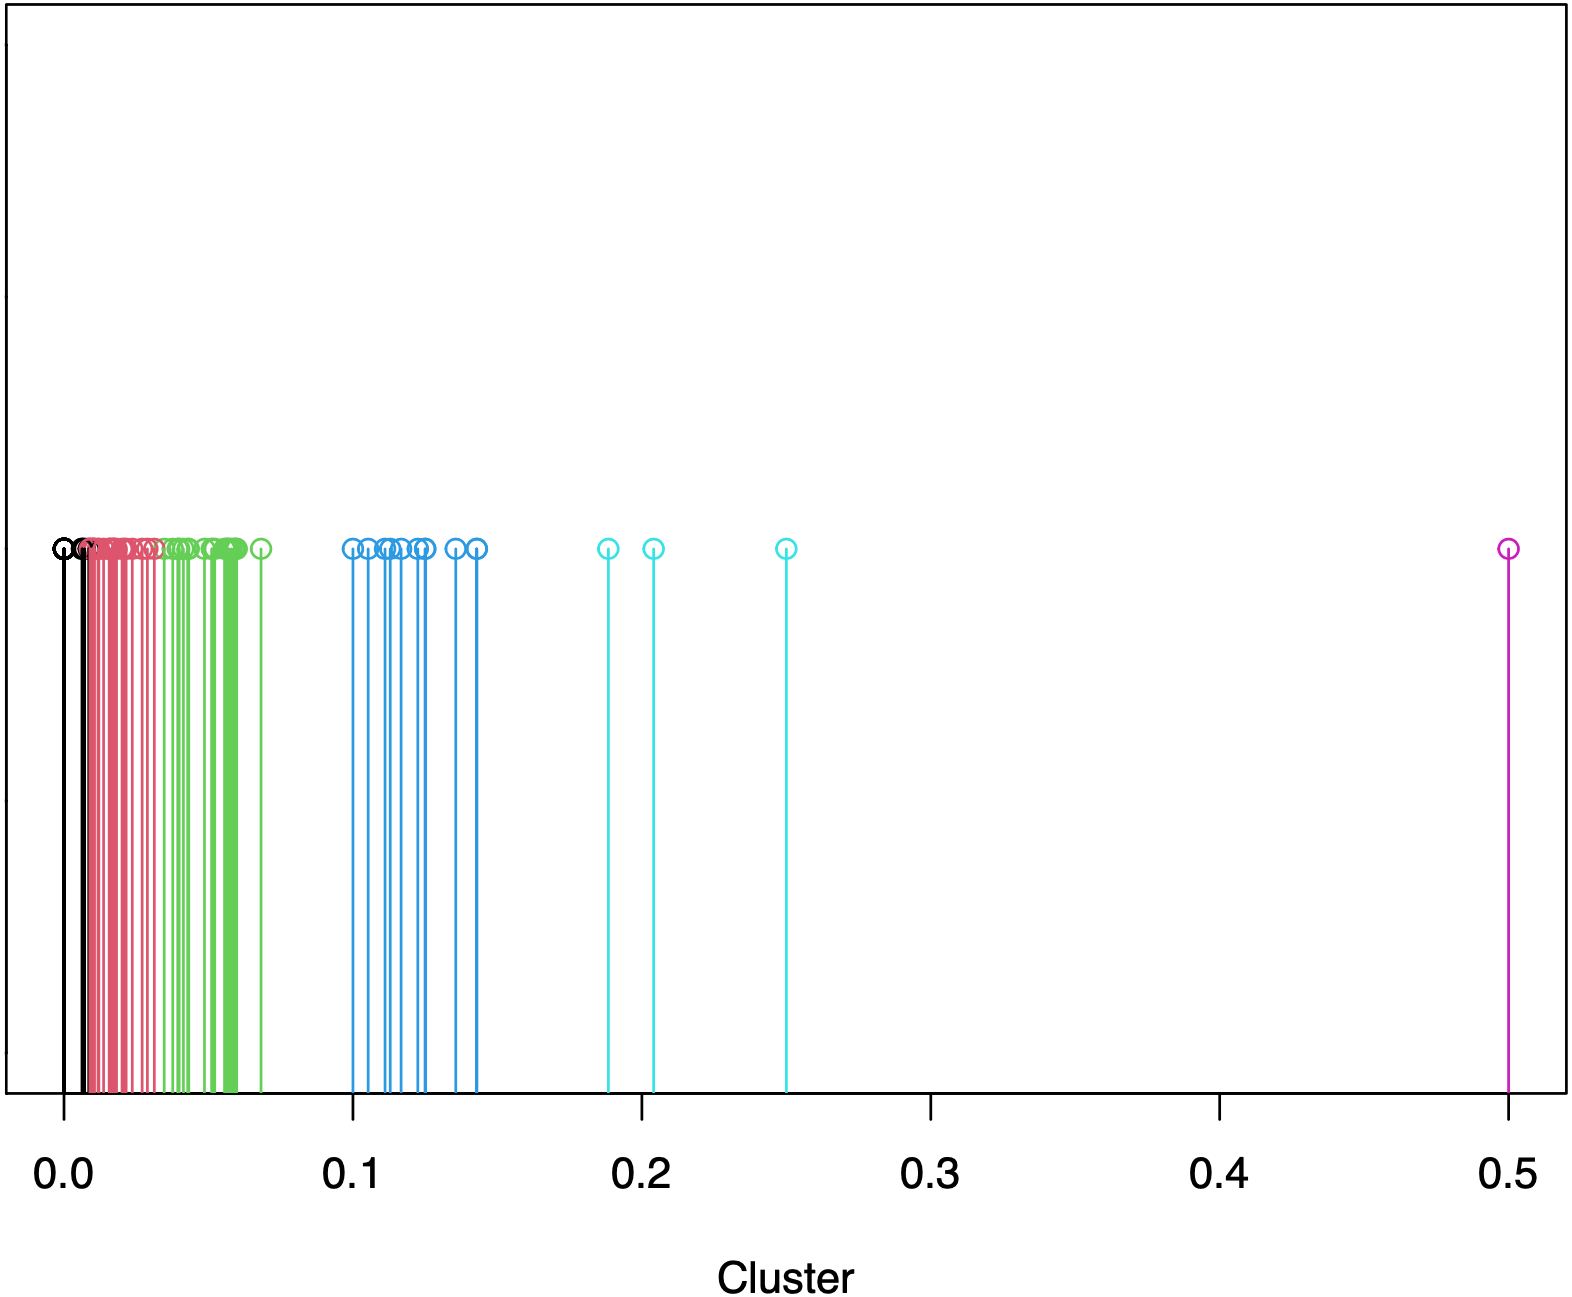
An example of ART values distribution, and relative severity clustering, is provided in Figs. 1, 2. As we can observe in Fig. 1, the majority of the projects possess values between 0.0 and 0.1, which are grouped via CkMeans into three distinct clusters, as depicted in Fig. 2. Such clusters correspond to the lowest levels of severity, namely severity 0, 1, and 2 respectively. The other three clusters, possessing centers (i.e., weighted mean of cluster) of respectively 0.12, 0.21, and 0.5, correspond to the higher levels of severity, namely severity levels 3, 4, and 5. From the clustering depicted in Fig. 2 we see that, according to their distribution, most projects are classified as possessing low severity (severity < = 2), while only a smaller number of projects possesses a relatively high severity (severity > = 3).
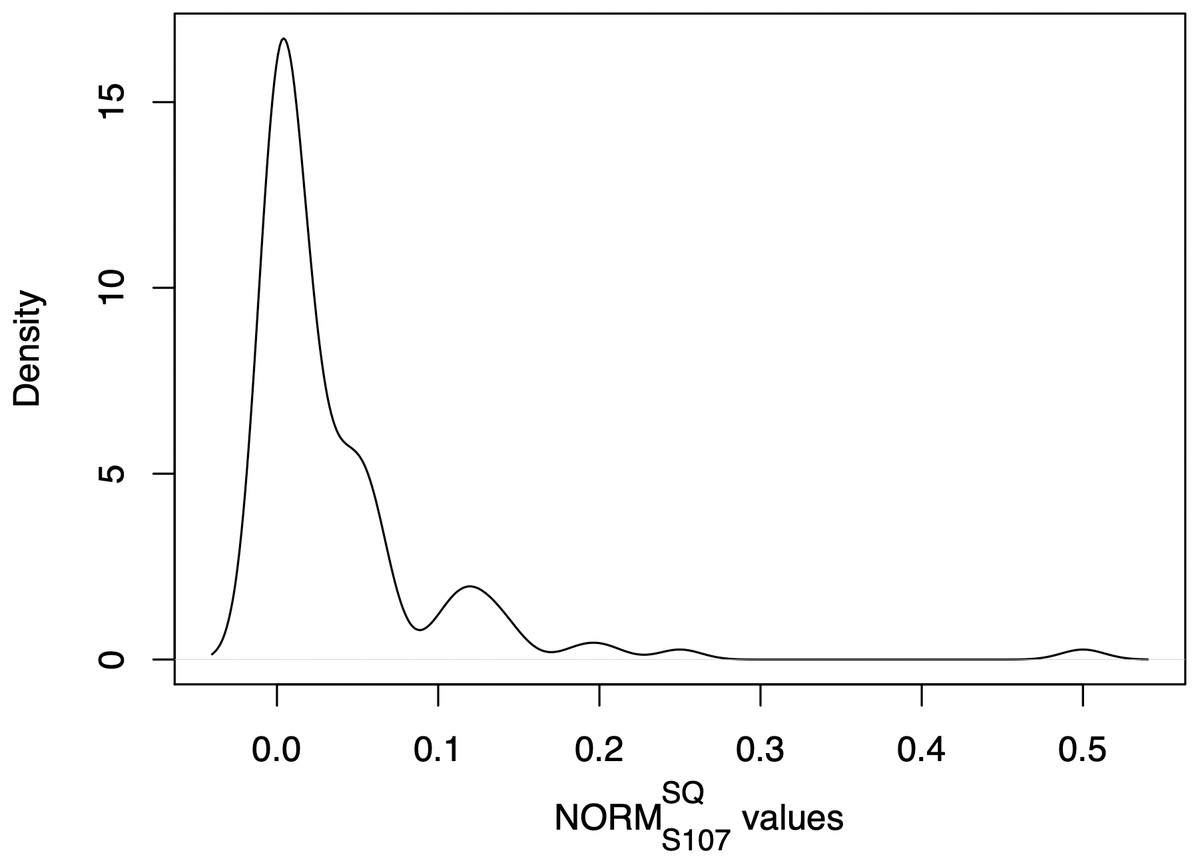
Figure 1: Example of kernel density plot (Givens & Hoeting, 2012) representing a NORM distribution of SonarQube rule “java:107” (see Table 2) of the Apache portfolio.
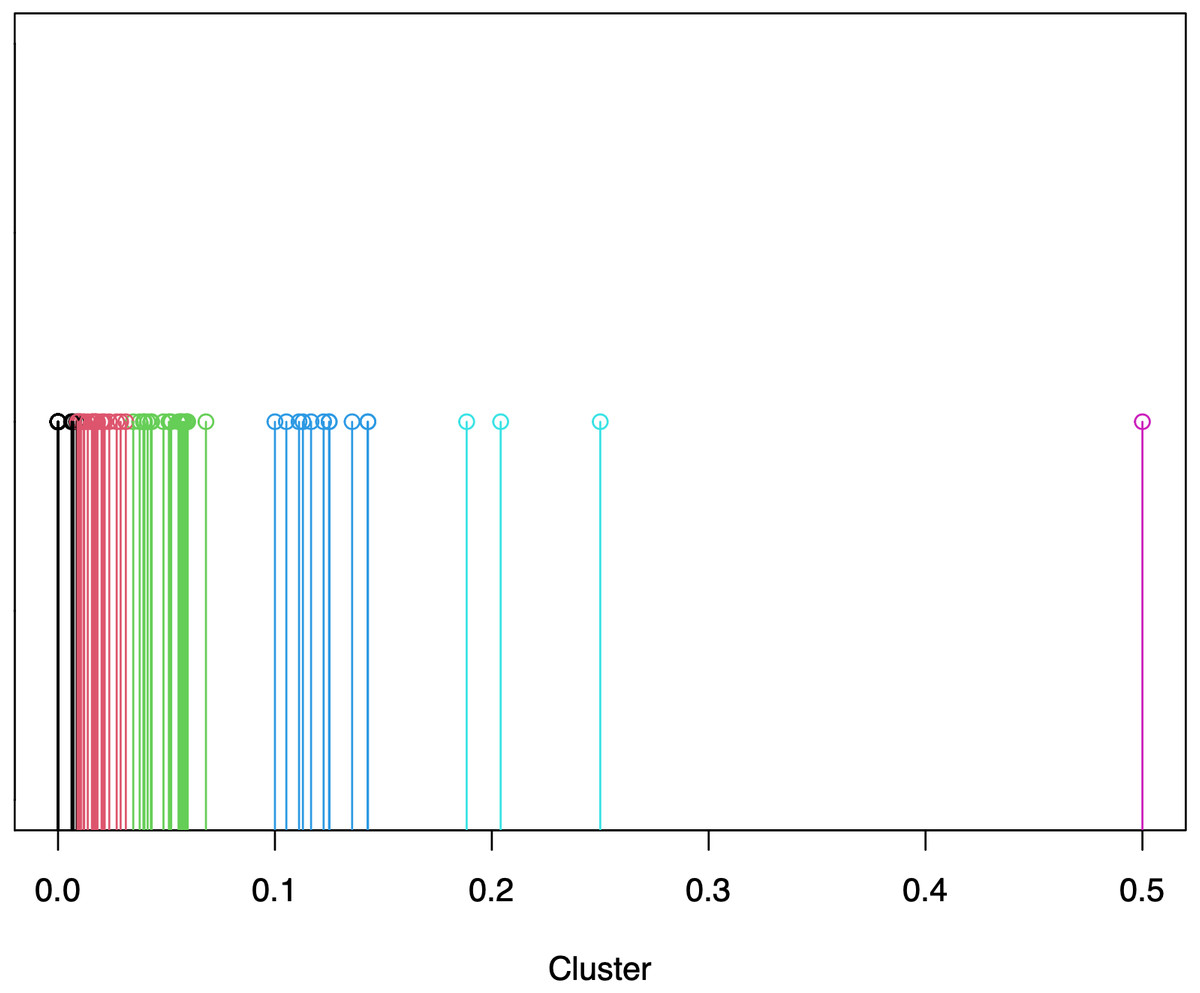
Figure 2: Example of severity calculation via CkMeans clustering of SonarQube rule “java:107” (see Table 2) of the Apache portfolio, where different colours indicate different clusters with growing severity (from 0 to 5) from the left- to the right-hand side.
In order to provide an overview of the ATD dimensions of a software project S, for each ATD dimension we define the value of as the average severity of the mapped to it, i.e., (5)
where j is the total number of rules in ART mapped to ATDD.
Finally, we define an overall value ATDxT(S), embodying the overall architectural technical debt of S calculated via our approach, as the average value of all the defined ATD dimensions ATDDT, i.e., (6)
where k is the total number of ATD dimensions ATDDT considered in the specific implementation of ATDx.
ATDx building steps
In this section, we report the steps for building ATDx. It is important to note that the whole process is generic, i.e., it is not bound to any specific analysis tool or technology and extensible. The described process can be performed by both (i) researchers investigating ATD phenomena and (ii) practitioners analyzing their own software portfolios. In fact, following the steps of the process allows its users to implement the instance of ATDx which best fits their specific technical, organizational, and tool-related context.
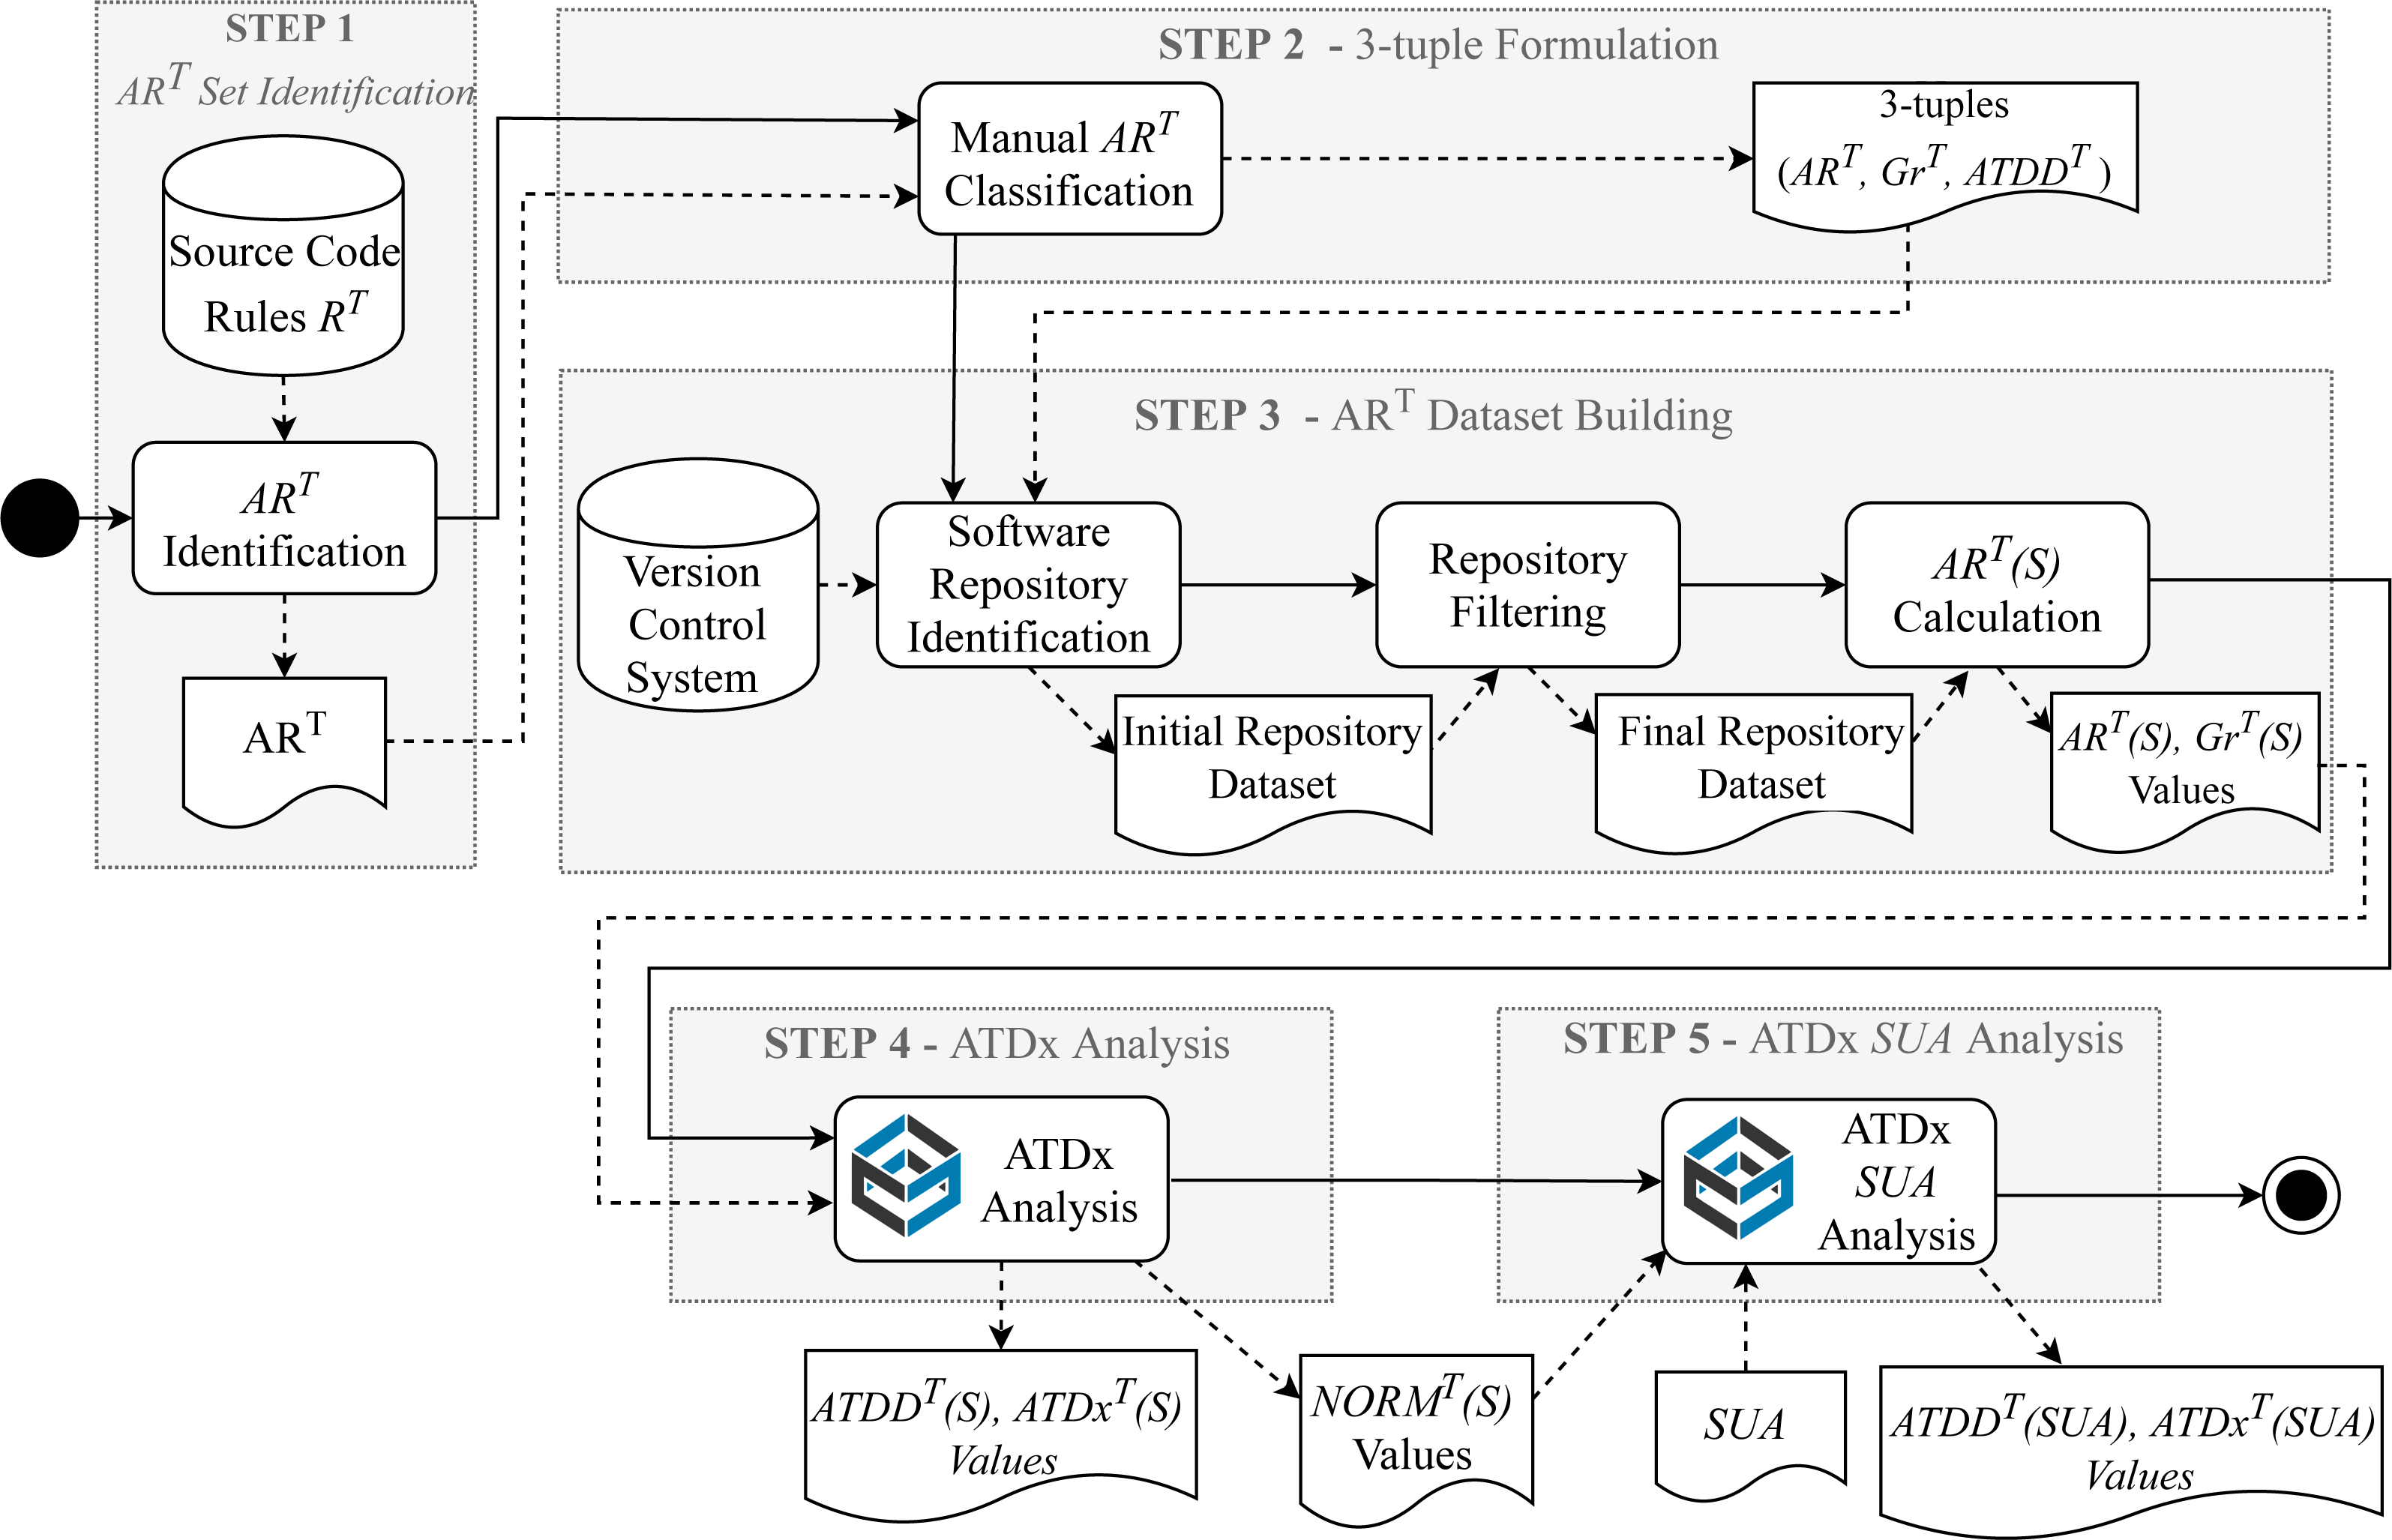
Figure 3 presents the building steps for implementing the ATDx approach. Given an analysis tool T (e.g., SonarQube), five steps are required to build an instance of ATDx, namely: (i) the identification of the set of architectural rules belonging to ART, (ii) the formulation of the 3-tuples in the form , (iii) the execution of T on a set of already available software projects to form the dataset of measurements, (iv) the execution of the ATDx analysis on the constructed dataset, and (v) the application of the ATDx approach on the specific SUA.
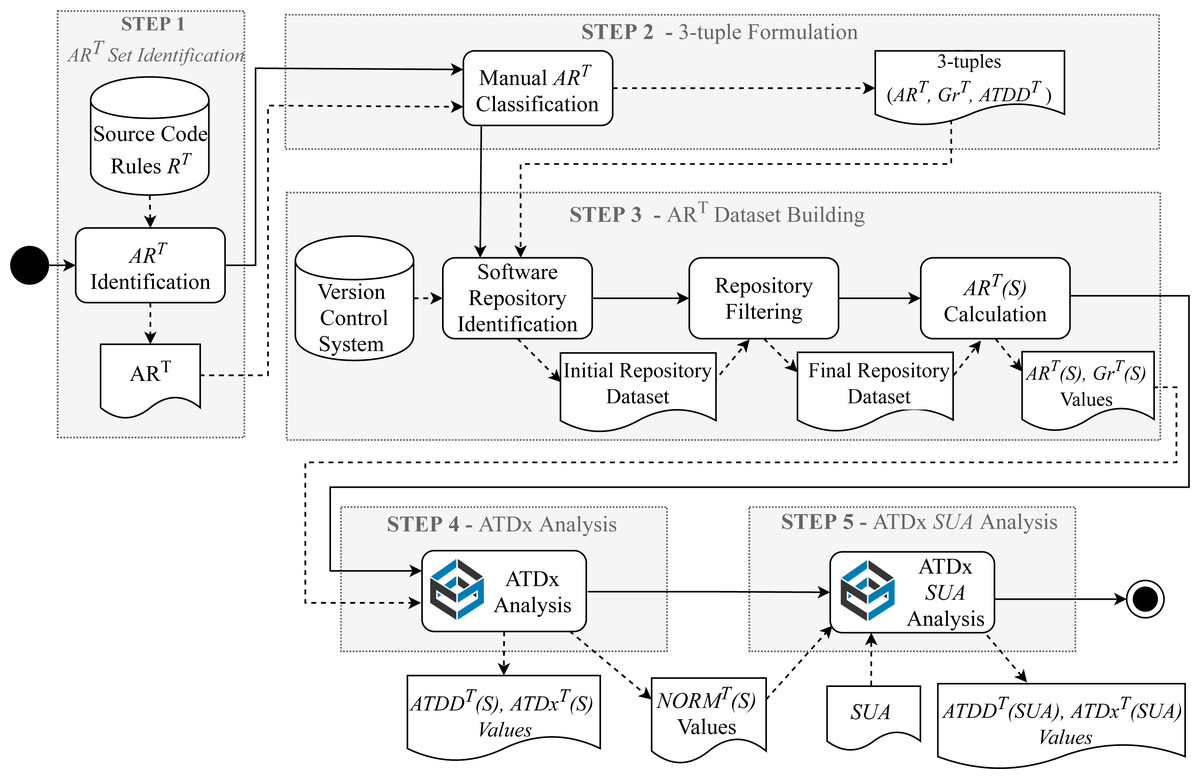
Figure 3: Overview of the ATDx building steps (Verdecchia et al., 2020).
Step 1: Identification of the ART set
The first step of the ATDx building process is the identification of a set of architectural rules ART that will be used as input to the subsequent steps of the process. Specifically, given an analysis tool T and its supported analysis rules RT, a manual inspection is carried out in order to assess which of its rules qualify as ART according to the criteria presented in Definition 1. This process can be carried out either by inspecting the concrete implementation of the rules RT under scrutiny, or by consulting the documentation of T, if available.
Step 2: Formulation of 3-tuples , ,
After the identification of ART, the 3-tuples 〈ARi〉, ATDDj, 〈Gri〉 are established by mapping each rule to (i) one or more architectural technical debt dimensions and (ii) the granularity level of the rule. The process of mapping an to its corresponding architectural dimensions is conducted by performing iterative content analysis sessions with open coding (Lidwell, Holden & Butler, 2010) targeting the implementation or documentation of the rule in order to extract the semantic meaning of the rule. More in details, once the semantic meaning of each rule is well understood, the under scrutiny is labeled with one or more keywords expressing schematically its semantic meaning. Such analysis is carried out in an iterative fashion, i.e., by continuously comparing the potential associated to the under analysis with already identified dimensions, in order to reach a uniform final ATDDT set.
The process of mapping an architectural rule to its corresponding level of granularity is also carried out via manual analysis of the architectural rule, and subsequently identifying the unit of analysis that the rule considers (e.g., function, class, or file level)1.
It is important to note that Steps 1 and 2 are performed only once for the whole portfolio and, depending on the tool and its rules, their corresponding 3-tuples can be reused as is across different portfolios.
Step 3: Building the ART(SUA) dataset
After the identification of the ART set (Step 1), it is possible to build the dataset of ART(S) measurements. This process consists of (i) identifying an initial set of projects to be considered for inclusion in the portfolio, (ii) carrying out a quality filtering process in order to filter out irrelevant projects (e.g., demos, examples) and (iii) calculating the ART(S) sets and extracting the |GrT(S)| values of each project included in the portfolio. The selection of the initial portfolio of projects to be considered for inclusion is a design choice specific to the concrete instance of ATDx. In other words, such choice is dependent on the analysis goal for which ATDx is adopted, the availability of the software projects to be analyzed, and the tool T adopted to calculate the ART(S) sets. It is important to bear in mind that, given the statistical nature of ATDx, having a low number of projects in this step would not lead to meaningful ATDx analysis results (as further discussed in ‘Discussion’).
As for the selection of the projects to be considered, the step of carrying out a quality-filtering process on the initial set of projects depends on the setting in which ATDx is implemented. In the case that ATDx is used for an academic study, e.g., by considering open-source software (OSS) projects, this step must be carried out to ensure that no toy software-projects (like demos or software examples written for educational purposes) are included in the final software portfolio to be considered (Kalliamvakou et al., 2016).
After the identification of a final set of projects to be considered for analysis, the ART(S) sets are calculated for each software project S in the portfolio. The execution of such process varies according to the adopted analysis tool T. In addition, during this step also the cardinalities of the granularity dimensions are computed for each project S in the portfolio. Such values will be used in the next ATDx steps.
Step 4: ATDx analysis
Once the ART(S) and GrT(S) sets are calculated for the whole portfolio, the architectural technical debt of the projects can be assessed (see ‘The ATDx Approach’). Specifically, this step takes as input ART(S) and GrT(S) sets for all the projects in the portfolio, and outputs the ATDDT(S) and ATDxT(S) values of each project. It is worth noticing that this process is incremental. Indeed, after a first execution of the ATDx approach on the whole portfolio, it is possible to carry out further ATDx analyses on additional projects by relying on the previously formulated 3-tuples and the pre-calculated intermediate values of the ATDx analysis .
Step 5: Applying ATDx to a SUA
After the execution of ATDx on all projects in portfolio, the resulting ATDDT and atdxT values of a specific SUA can be computed.
_______________________
 Algorithm 1: Computing the ATDDT dimensions and the ATDxT value
  for a single SUA                                                                           ____
  Input: SUA, ART, NORMT, ATDDT
  Output: ATDDT(SUA), ATDxT(SUA)
  1  dimensions ← empty dictionary
  2  atdx ← 0
  3  for all dimensions j in ATDDT  do
     4   dimensions[j] ← 0
  5  end
 6  for all rules ARTi  in ART  do
     7   violations ← ARTi(SUA)
8   normalizedViolations ← NORMT
           i (SUA)
9   dimensions[j] ← dimensions[j] + severity(NORMT
          i ,
   normalizedViolations)
10  end
11  for all entries j in dimensions do
     12   dimensions[j] ← dimensions[j] / getNumRules(j)
13   atdx ← atdx + dimensions[j]
14  end
15  atdx ← atdx / |ATDDT|
16  return dimensions, adtx
As shown in Algorithm 1, the computation of ATDDT and atdxT takes as input 4 parameters: (i) the SUA, the set of rules ART, the NORMT values computed in the step 4, and the set of dimensions ATDDT defined in step 2. The outputs of the algorithm are two, namely: (i) the set of ATD values of the SUA ATDDT(SUA) (one for each dimension) and (ii) ATDxT(SUA). The outputs of the algorithm serve two different purposes; Specifically, the ATDDT values provide support in gaining more insights in the severity of the ATD according to the identified ATD dimensions, while the atdxT value provides a unified overview of the ATD present in the SUA. After setting up the initial variables for containing the final output (lines 1–2), the algorithm builds a dictionary containing an entry for each dimension in ATDDT, with the name of the dimension as key and 0 as value (lines 3–4). Then, the algorithm iterates over each rule in ART (line 5) and collects the number of its violations, both raw (line 6) and normalized by the level of granularity of the current rule (line 7). Then the entry of the dimensions dictionary corresponding to the dimension of the current rule is incremented by the severity level of as defined in Eq. (4) (line 8). For each dimension j (line 9) we (i) average its current value within the total number of rules belonging to j in order to mitigate the potential effect that the number of rules belonging to the dimension may have (line 10) and (ii) increment the current ATDxT with the computed score (line 11). Finally, the ATDxT value is normalized by the total number of dimensions supported by all ART rules (line 12) and both dimensions and ATDx values are returned (line 13).
Differences with respect to the original ATDx approach
As indicated in ‘Introduction’, the ATDx approach presented in this research constitutes an evolution of the original approach first introduced by Verdecchia et al. (2020). While all the building steps of the approach remain unvaried (see Fig. 3), one crucial aspect was redesigned, namely the technique with which the severity of violations are calculated. This design choice constitutes a change to the logical core of ATDx, overcoming one of the most prominent drawbacks of the original approach, namely the “emphasis on outlier values” (Verdecchia et al., 2020). The severity calculation in the original ATDx approach relied exclusively on the identification of “outlier” values, i.e., only the values greater than the upper inner fence2 of . By focusing exclusively on “outlier” values, the naive statistical technique used by the original ATDx posed two major disadvantages. On one hand, ATDx would provide only a boolean severity level of granularity, i.e., if values were “outliers” or not. On the other hand, the approach would focus exclusively on anomalously high values, disregarding via a lossy statistical analysis all values that were not identified as “outliers”. In order to overcome this drawback, in the version of ATDx presented in this research the “outlier” identification was substituted with a clustering algorithm, namely CkMeans (Wang & Song, 2011). By providing optimal, efficient, and reproducible clustering of univariate data, CkMeans allows ATDx to (i) provide finer-grained results by considering a range of severity levels, namely 0, 1, 2, 3, 4, 5, where 0 is the lowest severity and 5 the highest, instead of a simple boolean value, and (ii) considering the totality of the input , instead of exclusively the “outlier” values. In addition, by considering the totality of rather than only outlier values, CkMeans mitigates the “potential empirically unreachable ATDD” that noticeably affected the analysis results of the original ATDx. Finally, the set of predefined number of clusters used by CkMeans allows for ad-hoc customization of the severity calculation, providing the capability to increase or decrease the number of clusters, i.e., the discrete levels of severity of values according to the specific needs of the users.
Empirical Evaluation Planning
We conduct an in vivo evaluation to assess the viability of ATDx. In the remainder of this section we report (i) the goal and research questions of the empirical evaluation (‘Goal and Research Questions’) and (ii) its design (‘Empirical Evaluation Design’).
Goal and research questions
Intuitively, with our empirical evaluation we aim to understand if the ATDx analysis results faithfully represent the ATD present in real life software projects. In addition, we aim to assess if the ATDx analysis results are actionable, i.e., they motivate practitioners to refactor their ATD. More formally, we formulate the goal of our empirical evaluation by following the template proposed by Basili & Rombach (1988) as follows: Analyze ATDx analysis results For the purpose of evaluating their representativeness and their ability to stimulate action With respect to architectural technical debt From the viewpoint of software practitioners In the context of open-source software projects
It is important to note that ATDx can be applied to both open-source and proprietary software. In this study we focus on open-source software projects due to (i) the availability of rich data about their source code and development process and (ii) the ease of mining of such type of software projects with respect to proprietary ones (Hassan, 2008). Further considerations on the this empirical evaluation design decision are reported in ‘Threats to Validity’.
By taking into account our research goal, we can derive the following two research questions:
-
To what extent are the ATDx results representative of the architectural technical debt present in a software project?
By answering this research question, we aim at assessing the representation condition (Fenton & Bieman, 2014) of ATDx, i.e., the extent to which the characteristics of the ATD present in a software intensive-system are preserved by the numerical relations calculated via the ATDx approach. In other words, this research question evaluates to which extent the ATDx analysis results are representative of the ATD in a software project, both by considering individually the results for each software-intensive system, than by comparing results across different systems.
-
To what extent do the ATDx results stimulate action of developers to address their architectural technical debt?
By answering this research question, we aim to assess the extent to which the ATDx analysis results stimulate developers to address ATD, i.e., if the results motivate developers to actively manage the ATD detected via ATDx.
Empirical evaluation design
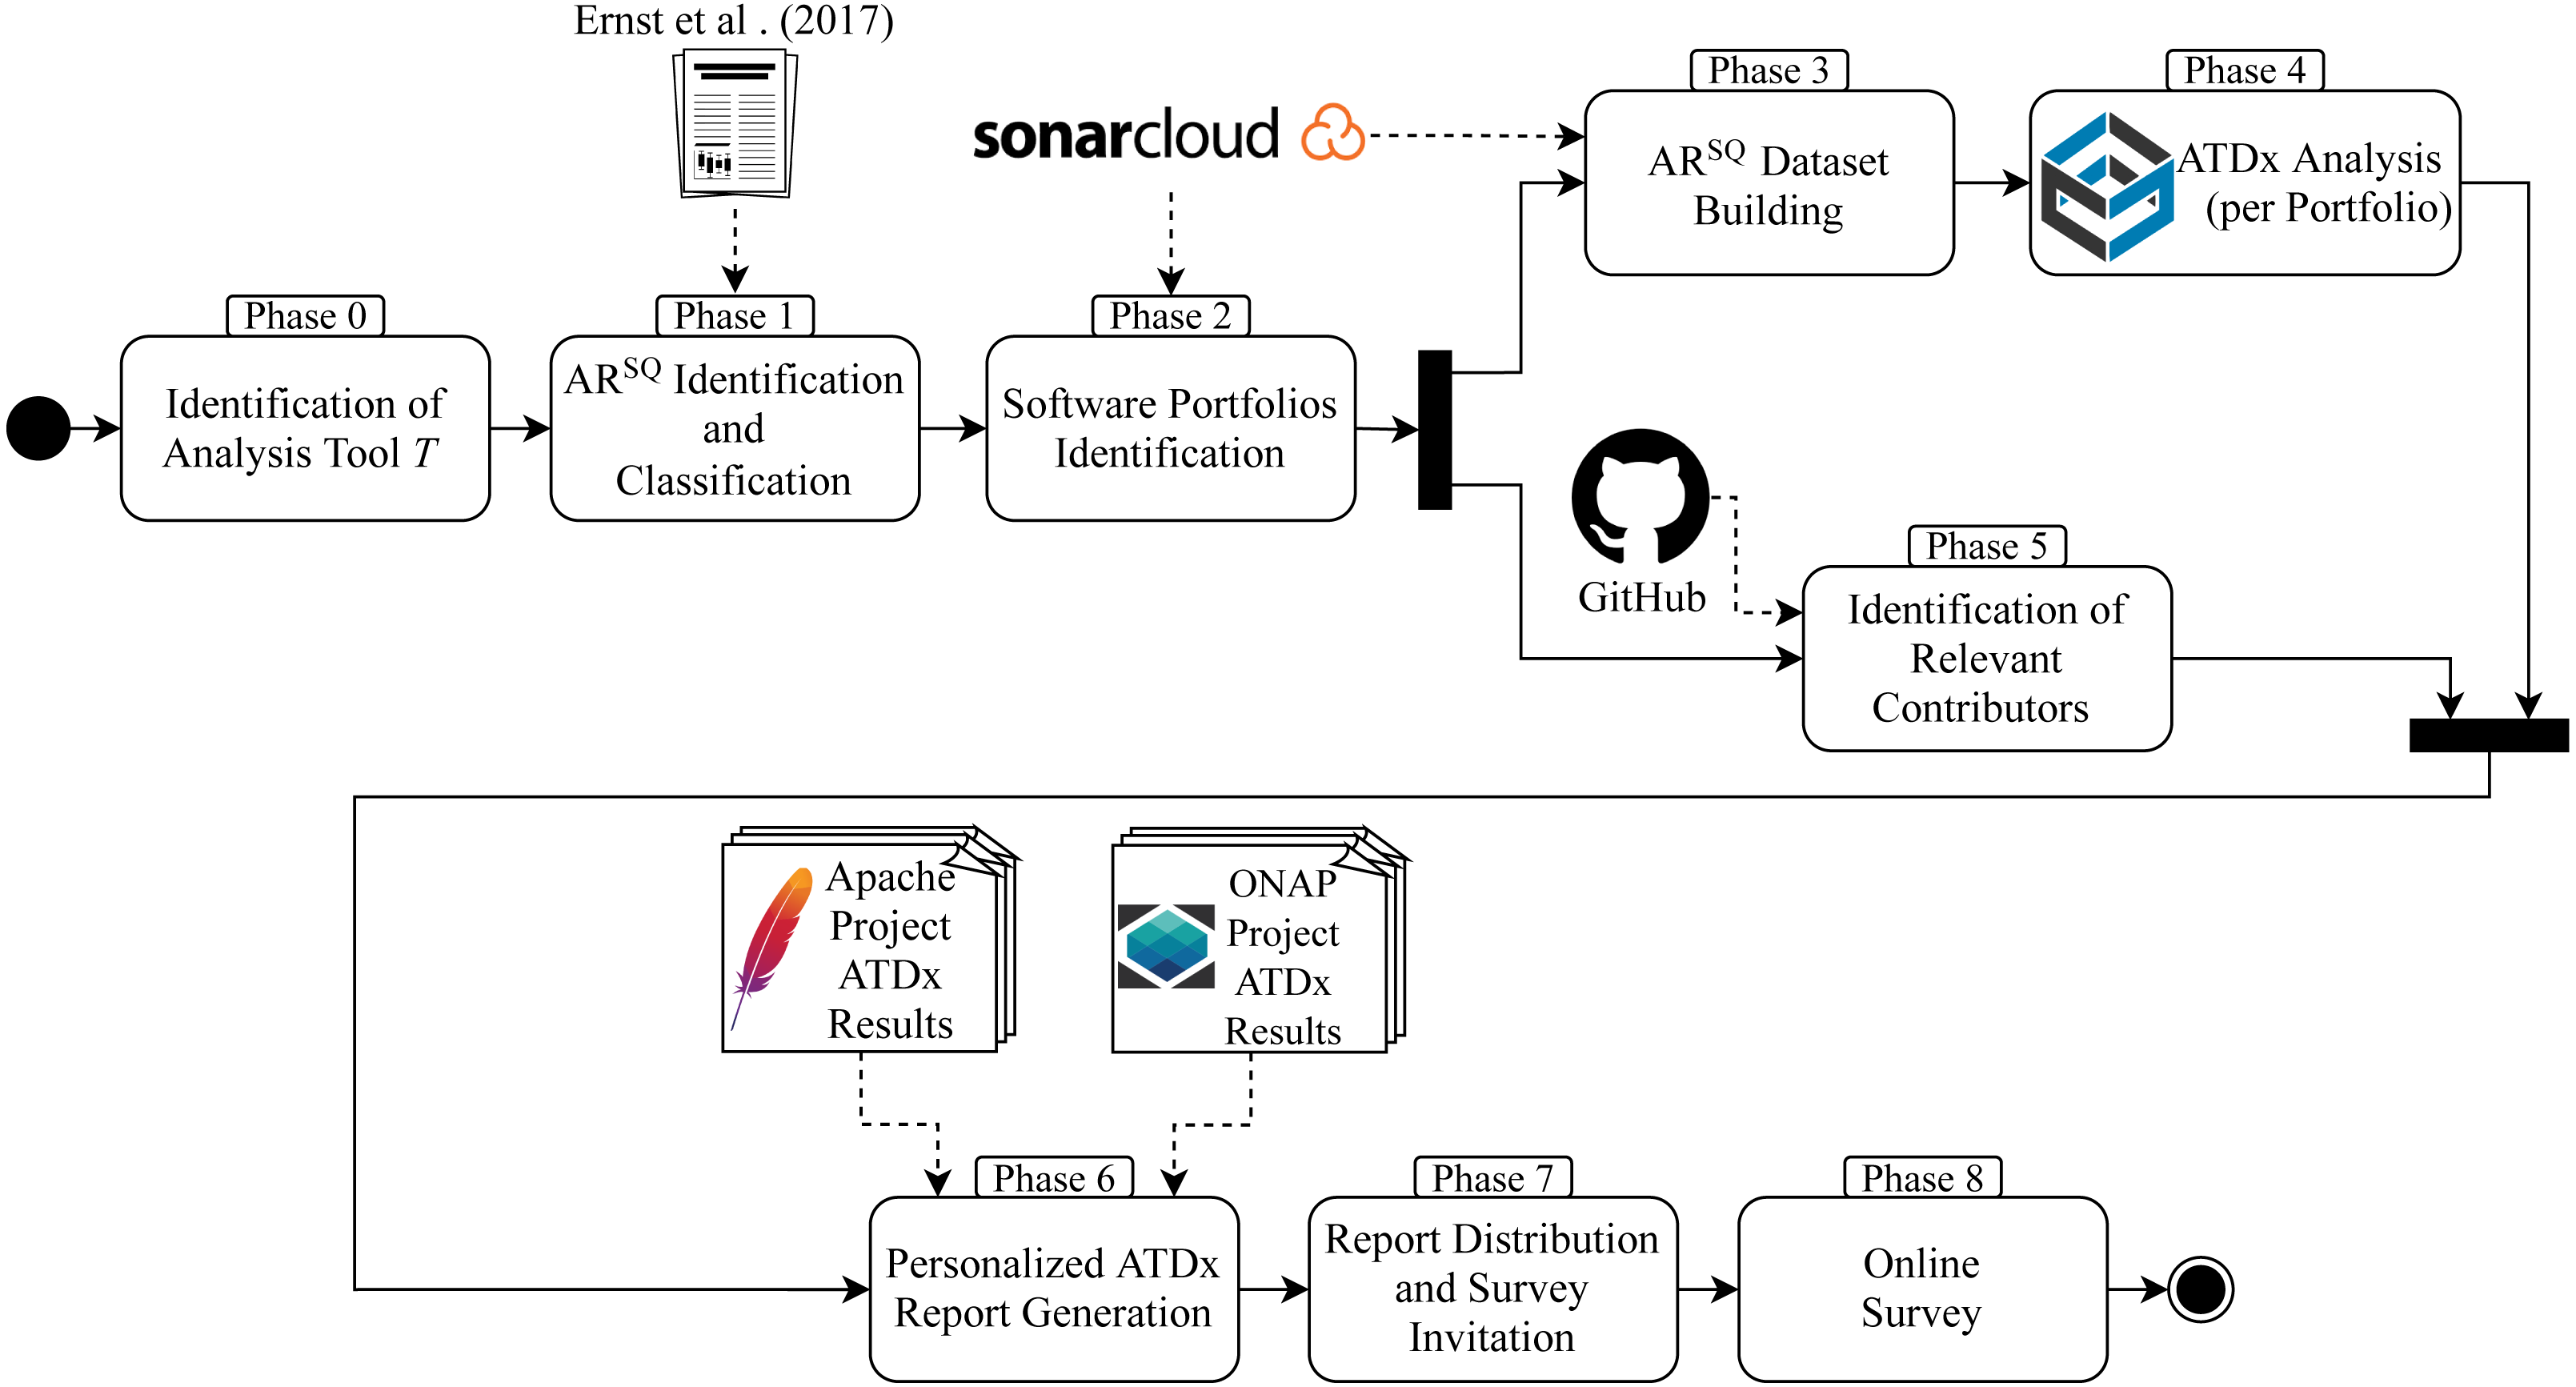
The empirical evaluation is designed according to our research questions and includes all the building steps of the ATDx approach described in ‘The ATDx Approach’. The empirical evaluation is composed of nine main phases:
-
Phase 0 – Identification of the analysis tool T to be used in the empirical evaluation.
-
Phase 1 – Identification and classification of the set of architecturally-relevant rules (i.e., ART); this step corresponds to the ATDx building Steps 1 and 2 in Fig. 3.
-
Phase 2 – Identification of one or more software portfolios to be analyzed.
-
Phase 3 – Establishment of the ART dataset(s) for the selected software portfolio(s); this step corresponds to Step 3 in Fig. 3.
-
Phase 4 – Analysis of the dataset(s) via ATDx; this step corresponds to Steps 4 and 5 in Fig. 3.
-
Phase 5 – Identification of a curated set of contributors of the selected software portfolio(s).
-
Phase 6 – Generation of personalized ATDx reports.
-
Phase 7 – Distribution of the ATDx reports.
-
Phase 8 – Online survey on the ATDx analysis results.
In the remainder of this section we explain each phase of our empirical evaluation; we present the phases in general terms, so that independent researchers can fully reuse them in future replications of this study. Then, in ‘Empirical Evaluation Execution’ we provide the technical details about how we implemented and executed each phase in the context of (i) Java projects, (ii) the SonarQube analysis tool, and (iii) the Apache and ONAP software ecosystems.
In order to evaluate ATDx, we implement a concrete instance of ATDx by following the building steps presented in ‘The ATDx Approach’. As a first step, in Phase 0 we select a source code analysis tool T, implementing the RT rules.
Phase 1 aims at identifying a set of ART rules on which the ATDx approach will be based. Specifically, the ART identification process is conducted by considering: (i) the soundness of the ART rules, demonstrated by industrial adoption and scientific evidence, (ii) the industrial relevance of the tool implementing the ART rules, and (iii) the feasibility of calculating ART values. In addition, during this phase, the identified ART rules are manually classified, in order to derive the 3-tuples required by the ATDx approach.
As discussed in ‘The ATDx Approach’, the ATDx calculation relies on a portfolio of software projects. Hence, in order to gather ATDx analysis results, in phase 2 we identify the software portfolio(s) that will be used as experimental subject in our evaluation. The focus on software portfolios, rather than a collection of unrelated software projects, allows to focus on software projects that potentially share a similar context, and overlapping contributors, and hence are closer to the envisioned usage scenario of ATDx. Accordingly, in case of more than one portfolio is identified during this phase, the portfolios will be analyzed via ATDx independently. Driving factors for the identification of software portfolios is the availability of the software projects contained in the portfolio, and the possibility to calculate ART values for the portfolio, according to the ART rule set identified in the previous evaluation phase.
In phase 3 we automatically compute the values of ART and GrT for the software projects in the identified portfolio(s). This process is carried out either by gathering the source code of the projects, automatically extracting the GrT values, and executing the tool implementing the ART rules locally, or by directly mining pre-computed ART and GrT values made available remotely (e.g., if provided by contributors of the software portfolios, or a cloud service of the tool implementing the ART rules).
In phase 4, we execute the ATDx analysis, and calculate the ATDDT(SUA) and ATDxT(SUA) for each project of the identified portfolios.
In phase 5 we identify the relevant contributors of the selected software portfolio(s). Such contributors will then be contacted, in a following evaluation phase, in order to gather insights into the obtained ATDx analysis results. Specifically, we are interested in contributors who are familiar with multiple software projects of the portfolio(s), in order to enable them to compare ATDx results across different projects. Hence, we select out of the all contributors of the software portfolio(s), the ones who contributed to at least two projects of the portfolio in the past 12 months.
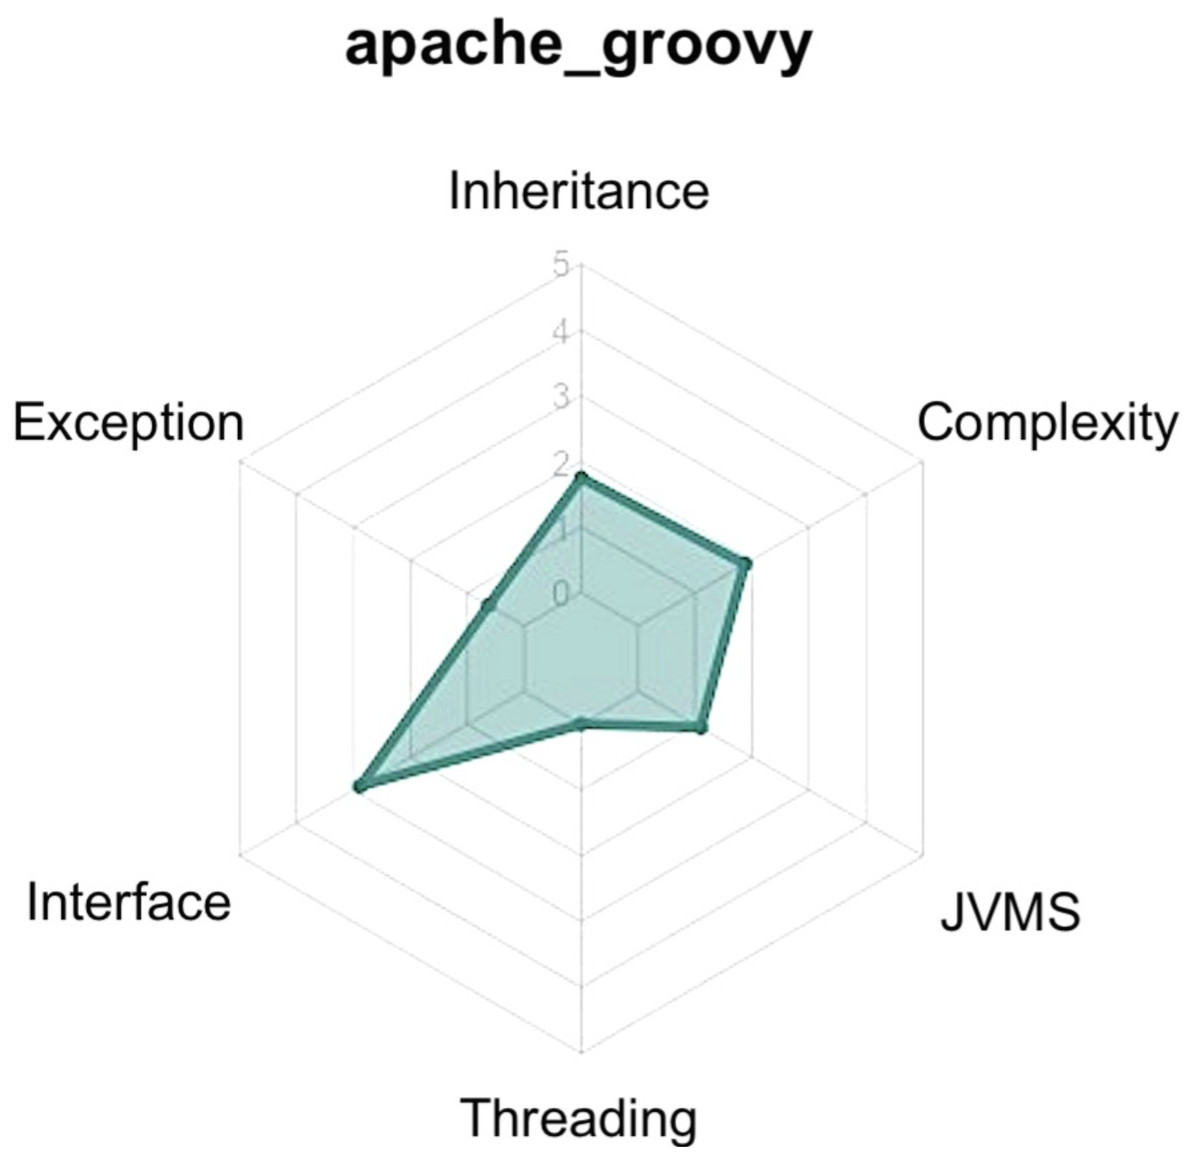
Figure 4: Example of ATDx radar-chart of the project Apache Groovy (https://github.com/apache/groovy), generated by considering the SonarQube rules utilized in the empirical evaluation.
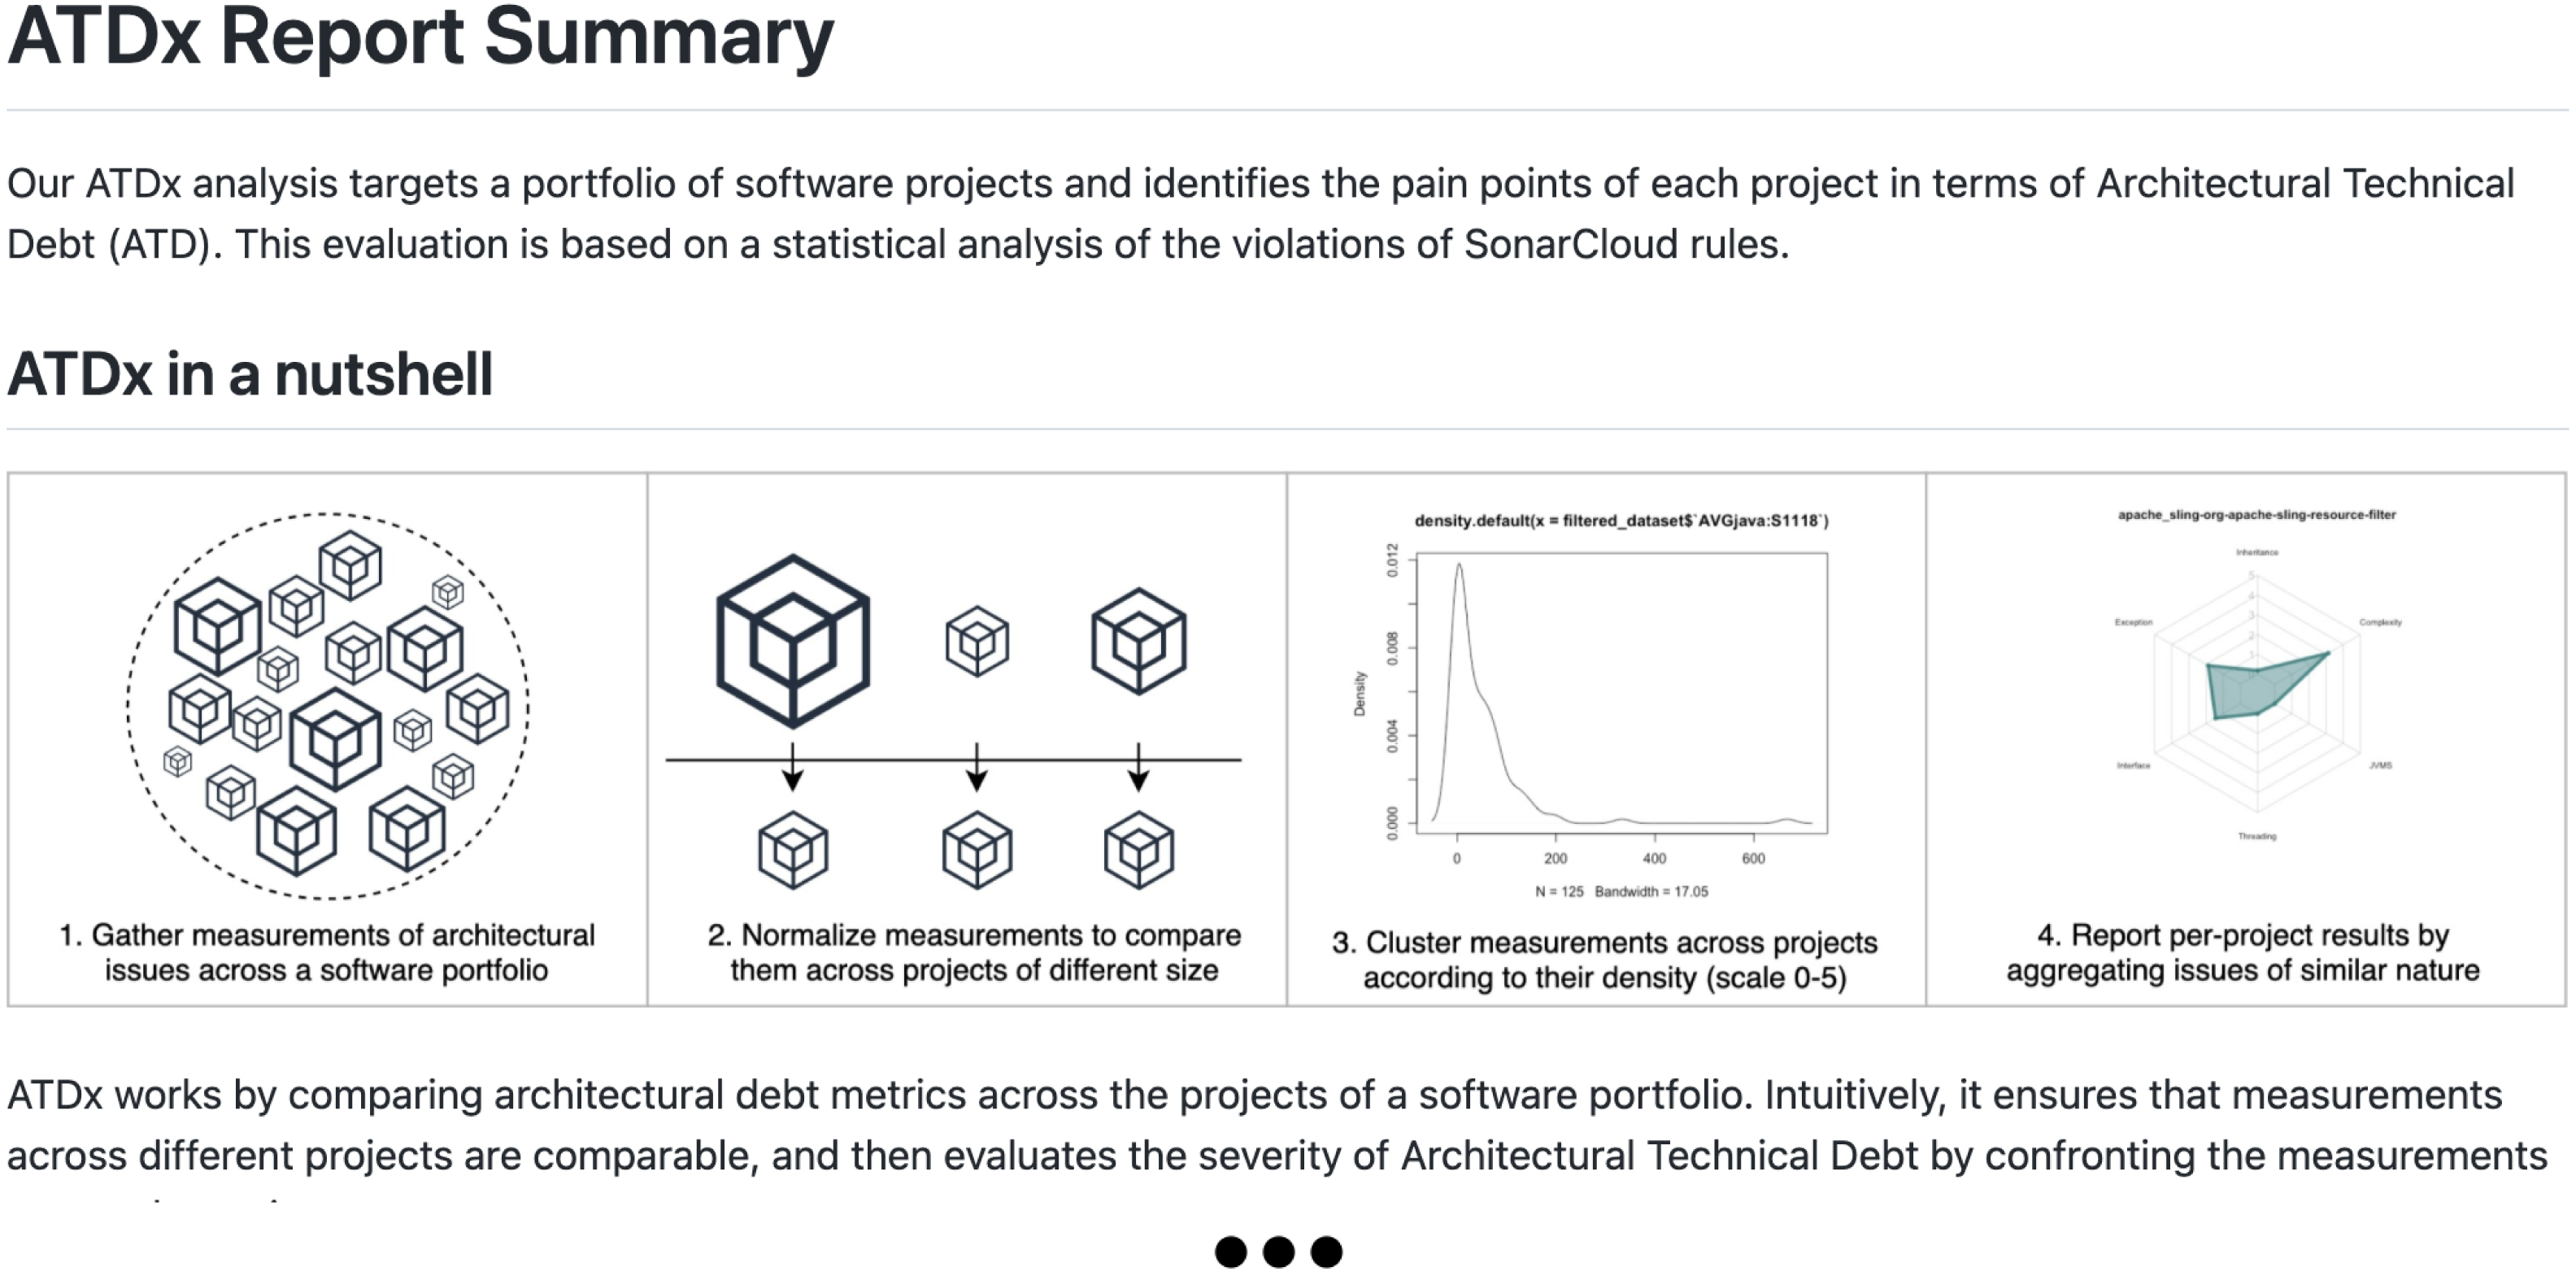
Once we obtained the ATDx analysis results for each project of the portfolio(s), and established a curated set of contributors to be contacted, in phase 6 we generate a personalized report for each contributor. Such report contains the ATDx summary results of each project of the contributor. The ATDx summary presents radar-charts (see Fig. 4 for an example) and further insights into the obtained results, e.g., architectural elements most affected by ATD (refer to ‘Phase 6: ATDx Report Generation’ for more information regarding the data provided in the ATDx reports).
In phase 7, the reports are shared with the contributors via a customized email, jointly with an invitation to participate to an online survey.
Finally, in phase 8 we collect insights on the ATDx analysis results via an online survey. The survey is designed in order to require a short amount of time to be filled (this helps in terms of both response rate and participants fatigue). Moreover, various factors that influence response rates of developers are considered while designing the survey, such as authority, brevity, social benefit, and timing (Smith et al., 2013). An overview of the questions composing the survey is reported in Table 1.
| Question ID | Question text | Response type | Compulsory | Targeted RQ |
|---|---|---|---|---|
| Q1 | How many years have you been developing software? | Integer | Yes | Demographics |
| Q2 | How many open source software projects have you contributed to in your career? | 1, 2–5, 6–10, >10 | Yes | Demographics |
| Q3 | On average, how familiar are you with the projects? | 5-point Likert Scale | Yes | Demographics |
| Q4 | By looking individually at each project: The radar-chart values reflect the project’s current state of architectural debt | 5-point Likert Scale | Yes | RQ1 |
| Q5 | By looking at all projects together: The radar charts reflect the differences in architectural debt present in the projects | 5-point Likert Scale | Yes | RQ1 |
| Q6 | The architectural debt types displayed in the radar-chart are a good representation of architectural debt | 5-point Likert Scale | Yes | RQ1 |
| Q7 | Do you miss any architectural debt type? If so, which one(s)? | Open-ended | No | RQ1 |
| Q8 | The results displayed in the radar charts inspire me to take action | 5-point Likert Scale | Yes | RQ2 |
| Q9 | How would you use the radar-charts in your current practice? | Open-ended | No | RQ2 |
The survey is designed with a two-step approach. In the first step, a pilot version of the survey is drafted and shared with 5 industrial practitioners within our personal network. In the second step, the questionnaire is reviewed and finalized by taking into account the collected feedback.
Questions Q1–Q3 assess the experience of the participants in terms of their experience (Q1–Q2) and familiarity with the open source projects included in the personalized ATDx report (Q3). To ensure the quality of the data gathered via the survey, survey responses of contributors not familiar with the projects included in their personalized report will be discarded. The subsequent 6 questions are designed to collect the data relevant to answer our RQs. Specifically, Q4–Q7 aim at assessing the core RQ of our study (RQ1), namely if the ATDx results are representative of the ATD present in the software projects. More in detail, with Q4 and Q5 we aim at evaluating if the inter- and intra-relations of the ATD present in software projects are preserved by the numerical relations calculated via ATDx (Fenton & Bieman, 2014). With Q6 instead, we assess if the ATD dimensions (ATDDT) identified during the building Step 2 of the ATDx approach (see ‘Step 2: Formulation of 3-tuples , , ’) are a faithful representation of the overall ATD present in the software projects3. As a follow up to the previous question, Q7 investigates if any prominent ATD dimensions are missing in the used instance of ATDx. We opted to include two separate questions, Q6 and Q7, both focusing of ATD dimensions, in order to provide participants with a swift mean to provide input via a closed-ended question, Q6, while enabling them provide further details via the open-ended question, Q7. In order to evaluate if the ATDx results stimulate the active management of ATD (RQ2), we use the final two survey questions (Q8 and Q9). Specifically, with Q8, we directly assess the extent to which contributors are inspired to take action based on the ATDx results. With Q9 we gather further insights on the potential use of the ATDx in development practices. In addition to the questions reported above, the closed-ended questions targeting RQs (Q4, Q5, Q6, Q8) are supported by a complementary question (“Comments?”), allowing participants to add further detail into their closed-ended answer. In addition, the survey closes with a final complementary question (“Do you have any final comments or suggestions?”), designed to gather any additional input the participants may like to provide. To ensure that participants would be able to freely express themselves, an informative note is included in the survey invitation text, to assure them that all collected data would be anonymous.
The complete survey, comprising the aforementioned questions and supporting text clarifying terms and questions, is made available for review and replication in the publicly available supporting material of the paper.
In the following section, we report the details of our empirical evaluation execution, which was conducted by rigorously adhering to the evaluation design presented in this section.
Empirical Evaluation Execution
As shown in Fig. 5, we executed the evaluation by following the nine phases discussed in the previous section. In the following we give the details on the execution of each phase.
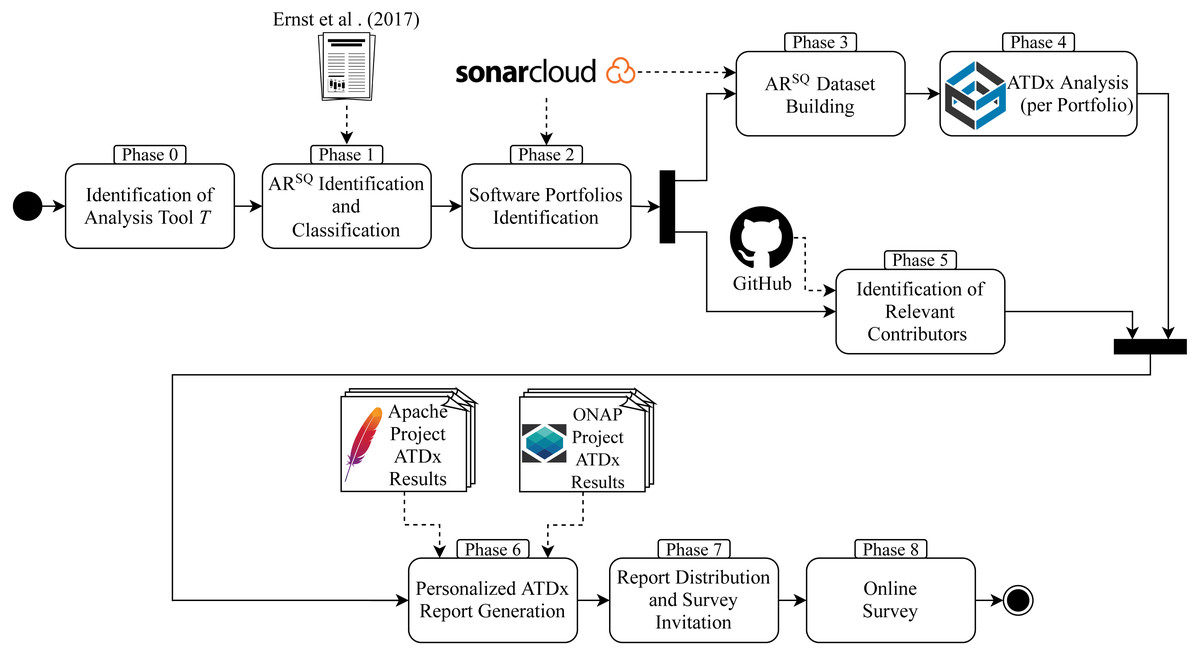
Figure 5: Overview of the empirical evaluation of ATDx conducted in this study.
Phase 0: selection of the SonarQube tool
For this empirical evaluation we implement ATDx based on the (https://www.sonarqube.org/) static analysis tool. The rationale behind the adoption of SonarQube to implement the experimental ATDx instance is multifold: (i) SonarQube is widely used in industrial contexts (Janes, Lenarduzzi & Stan, 2017), allowing us to have an ATDx instance potentially with high industrial relevance (which could be used by practitioners independently of our empirical evaluation), (ii) SonarQube was previously utilized in academic literature to identify design issues, hence providing us a sound initial set for the identification of ARSQ rules, (iii) SonarQube is open-source, hence the source code of each of its rules can be inspected and associated to its granularity level with relatively low effort, and(iv) the pre-computed SonarQube analysis results of several OSS projects are publicly available via the SonarCloud (https://sonarcloud.io/) platform, hence easing the SUA measurement retrieval process; those projects are actively maintained by several well-known organizations, such as the Apache Software Foundation (https://sonarcloud.io/organizations/apache/), Microsoft (https://sonarcloud.io/organizations/microsoft/), and the Wikimedia Foundation (https://sonarcloud.io/organizations/wmftest/).
Phase 1: ARSQ identification and classification
The goal of this phase is to establish the set of architectural rules ART from SonarQube. As input to this phase, we use a set RSQ of Java-based SonarQube rules that were identified as design rules in a previous research (Ernst et al., 2017). Those rules represent a sound starting set of rules of potential architectural relevance, according to our definition of architectural rule presented in ‘Definitions’.
To select the architectural rules among the ones presented by Ernst et al. (2017), we carry out a manual inspection of the definition of each single rule. Such inspection is based on the publicly-available official documentation of SonarQube (https://docs.sonarqube.org/latest/user-guide/rules/). The identification process is carried out by (i) analyzing the content of each rule description and (ii) evaluating it against the two criteria presented in ‘Definitions’. To mitigate potential threats to construct validity, two researchers independently carry out the identification. The identification process results in a 72.2% of agreement between the two researchers, with a substantial inter-rater agreement calculated via Choen’s Kappa (k = 0.62). Then, a third researcher with several years of experience in software engineering takes over by (i) resolving possible conflicts and (ii) reviewing the the final set of architectural rules ARSQ. From the initial set of 72 SonarQube design rules presented by Ernst et al. (2017), we identify 45 architectural rules. As detailed in ‘Phase 3: ARSQ Dataset Building’, we further refine the set of identified rules during Phase 3 by removing the architectural rules which are not included in the SonarQube quality profiles (https://docs.sonarqube.org/latest/instance-administration/quality-profiles/) of the selected software portfolios, leading us to a final set of 25 included rules. An overview of the final set of architectural rules used in this study is reported in Table 2.
Once we established the set of architectural rules ARSQ, we classify them in order to derive their associated granularity level GRSQ and ATD dimensions ATDDSQ, i.e., we formulate the ATDx 3-tuples , . This classification process is carried out collaboratively by three researchers, who utilize open and axial coding to label ARSQ to their respective GRSQ and ATDDSQ, and discuss potential divergences until a consensus is reached among all researchers. Columns 1, 3, and 4 in Table 2 give an overview of the final mapping between the rules , their granularity , and ATD dimensions .
Regarding the granularity levels GrSQ, we identify the four levels of granularity reported in column 3 of Table 2. The identified granularity levels are: Java non-comment lines of code (NCLOC), Java method, Java class, and Java file.
As for ATD dimensions ATDDSQ, we elicited 6 core dimensions, namely Inheritance, Exception, Java Virtual Machine Smell (JVMS), Threading, Interface, and Complexity (see column 4 in Table 2). The Inheritance dimension (9 rules) clusters rules evaluating inheritance mechanisms between classes, such as overrides and inheritance of methods or fields. The Exception ATDDSQ (6 rules) groups rules related to the Java throwable class “Exception” and its subclasses. JVMS (5 rules) contains rules which assess potential misuse of the Java Virtual Machine, e.g., the incorrect usage of the specific Java class “Serializable”. Rules associated with the Threading dimension (5 rules) deal with the potential issues arising from the implementation of multiple execution threads, which could potentially lead to concurrency problems. The Interface dimension (5 rules) encompassess rules assessing fallacies related to the usage of Java interfaces. Finally, the Complexity dimension (2 rules) encompasses rules derived from prominent complexity measures, e.g., McCabe’s cyclomatic complexity (McCabe, 1976). This phase lasts approximately 1.5 h, and includes both the ARSQ identification and classification.
Phase 2: software portfolio identification
Subsequent to Phase 1, we can proceed with the identification of software portfolios, i.e., the experimental subjects of our empirical investigation. In order to collect ARSQ values, we opt to use the SonarCloud platform, which enables us to efficiently and effectively gather the data required for the ATDx analysis (see also ‘Phase 0: Selection of the SonarQube Tool’). Hence, we want to identify portfolios that (i) are implemented in Java and (ii) make available pre-computed ARSQ values via SonarCloud. In order to do so, we mine SonarCloud via its web-based API and (i) collect information about all public projects hosted on SonarCloud and (ii) identify the SonarCloud organizations4 having the highest number of Java-based software projects. This leads us to identify two different software ecosystems, namely (i) Apache (https://www.apache.org), covering general-purpose software components like the well-known Apache HTTP server, Apache Hadoop, and Apache Spark, and (ii) ONAP (https://www.onap.org), focusing on orchestration, management, and automation of network and edge computing services. In this study we choose to target two different ecosystems as experimental subjects5 in order to mitigate possible external threats to validity. Indeed, focusing on Apache and ONAP allows us to study ATDx results for software portfolios developed for different contexts, and having different development processes, cultures, and technical backgrounds.
| SonarQube ID | Short description | Granularity level (GrSQ) | ATD Dimension (ATDDSQ) |
|---|---|---|---|
| java:S107 | Methods should not have too many parameters | Method | Interface |
| java:S112 | Generic Exceptions should never be thrown | Java NCLOC | Exception |
| java:S1104 | Class variable fields should not have public accessibility | Class | Interface |
| java:S1113 | The Object.finalize() method should not be overriden | Class | Inheritance |
| java:S1118 | Utility classes should not have public constructors | Class | Interface |
| java:S1130 | Throws declarations should not be superfluous | Java NCLOC | Exception |
| java:S1133 | Deprecated code should be removed eventually | Method | Interface, Complexity |
| java:S1161 | @Override annotation should be used on any method overriding (since Java 5) or implementing (since Java 6) another one | Method | Inheritance |
| java:S1165 | Exception classes should be immutable | Class | Exception |
| java:S1182 | Classes that override ”clone” should be ”Cloneable” and call ”super.clone()” | Class | Inheritance |
| java:S1185 | Overriding methods should do more than simply call the same method in the super class | Method | Inheritance |
| java:S1199 | Nested code blocks should not be used | Java NCLOC | Complexity |
| java:S1210 | ”equals(Object obj)” should be overridden along with the ”compareTo(T obj)” method | Method | Inheritance, JVMS |
| java:S1217 | Thread.run() and Runnable.run() should not be called directly | Java NCLOC | JVMS |
| java:S1610 | Abstract classes without fields should be converted to Interfaces | Class | Interface |
| java:S2062 | readResolve methods should be inheritable | Class | Inheritance |
| java:S2157 | ”Cloneables” should implement ”clone” | Class | Inheritance, JVMS |
| java:S2166 | Classes named like ”Exception” should extend ”Exception” or a subclass | Class | Exception |
| java:S2222 | Locks should be released | Java NCLOC | Threading |
| java:S2236 | Methods ”wait(...)” ”notify()” and ”notifyAll()” should never be called on Thread instances | Java NCLOC | Threading |
| java:S2273 | ”wait(...)” ”notify()” and ”notifyAll()” methods should only be called when a lock is obviously held on an object | Java NCLOC | Threading |
| java:S2276 | ”wait(...)” should be used instead of ”Thread.sleep(...)” when a lock is held | Java NCLOC | Threading |
| java:S2638 | Method overrides should not change contracts | Method | Inheritance, JVMS |
| java:S2885 | ”Calendars” and ”DateFormats” should not be static | Class | Threading |
| java:S2975 | Clones should not be overridden | Class | Inheritance, JVMS |
Among all the Java projects in each ecosystem, we filter out those without a corresponding GitHub repository. This filtering steps allows us to (i) have full traceability towards the source code of the system (useful for further inspections) and (ii) retrieve the names and email addresses of projects’ contributors to be contacted for the survey (see ‘Phase 5: Identification of Relevant Contributors’). In order to avoid potential selection bias, we do not perform any other filtering step of the selected software projects, e.g., by removing those with relatively low number of Java classes or few violations of the rules in ARSQ.
| Apache | |||||||
|---|---|---|---|---|---|---|---|
| Min. | Max. | Mean | Mdn | σ | CV | Total | |
| Projects | – | – | – | – | – | – | 126 |
| Java NCLOC | 90 | 383K | 19.1K | 2.9K | 50.4K | 2.6 | 2.3M |
| Java Files | 5 | 4.4K | 243.9 | 36 | 608.4 | 2.5 | 30.4K |
| Java Classes | 3 | 4.6K | 276.3 | 37 | 700.2 | 2.5 | 34.5K |
| Java Methods | 21 | 34.9K | 1.9K | 241 | 5K | 2.5 | 24.2K |
| ONAP | |||||||
|---|---|---|---|---|---|---|---|
| Min. | Max. | Mean | Mdn | σ | CV | Total | |
| Projects | – | – | – | – | – | – | 111 |
| Java NCLOC | 753 | 239.9K | 12.4K | 5K | 28.1K | 2.3 | 1.3M |
| Java Files | 10 | 3.6K | 199.4 | 79 | 440.5 | 2.2 | 22.1K |
| Java Classes | 9 | 3.2K | 189.2 | 76 | 394.2 | 2 | 21K |
| Java Methods | 49 | 22K | 1.3K | 518 | 2.8K | 2.2 | 14.1K |
| Total | |||||||
|---|---|---|---|---|---|---|---|
| Min. | Max. | Mean | Mdn | σ | CV | Total | |
| Projects | – | – | – | – | – | – | 237 |
| Java NCLOC | 90 | 383K | 15.9K | 3.7K | 41.5K | 2.6 | 3.6M |
| Java Files | 5 | 4.4K | 223 | 57 | 535.4 | 2.4 | 52.5K |
| Java Classes | 3 | 4.6K | 235.4 | 61 | 577.3 | 2.4 | 55.5K |
| Java Methods | 21 | 34.9K | 1.6K | 352 | 4.1K | 2.5 | 38.3K |
Notes:
- Mdn
-
Median
- σ
-
standard deviation
- CV
-
coefficient of variation
The final set of software projects is composed of 126 Apache projects and 111 ONAP projects, for a total of 3.6 millions of non-commenting lines of Java code across 237 software projects. Table 3 and Fig. 6 show the summary statistics of the selected ecosystems. From Table 3, we can observe that the smallest software project is included in the Apache ecosystem, and is implemented by only 90 Java NCLOC. From Fig. 6, we can see that this small project constitutes an outlier with respect to the other project of the ecosystem. In the ONAP ecosystem instead, the smallest software project is constituted by 753 NCLOC. The presence of small projects in the ecosystems is justified by the presence of “periferal” or “utility” software projects in the ecosystems, as further discussed in ‘Discussion’. The largest software project considered is also present in the Apache ecosystem, and includes 383K Java NCLOC. By considering the distributions reported in Fig. 1, we observe that both ecosystems present some software projects possessing a high outlier size, that will considerably contribute to the total number of ARSQ violations of the two ecosystems (as further detailed in the following section). Regarding the mean size of projects of the two ecosystems, we note that the ONAP ecosystem possesses overall projects of bigger size (cf. columns Mdn of Table 3). The median instead is higher in the Apache ecosystem, due to the presence in the ecosystem of some projects of exceptionally high size, as previously discussed. The variability in size is overall higher in the Apache ecosystems (cf. columns σ of Table 3), which is also reflected in the coefficient values (CV) of the two ecosystems.

Figure 6: Overview of identified ecosystems demographics.
Phase 3: ARSQ dataset building
After the identification of the software portfolios, we proceed with building the dataset of ARSQ values for each portfolio. As a preliminary activity, we check the SonarQube quality profiles used by Apache and ONAP in order to ensure that all rules in ARSQ are included (see Phase 1). This activity led to the exclusion of 20 rules from the ARSQ set; the final set of ARSQ rules is presented in Table 2. This quality assurance step is needed only in the context of our empirical evaluation and it is necessary to ensure that all rules in ARSQ rules contribute to the calculation of the ATDDSQ and ATDxSQ values. After the consolidation of the ARSQ set we retrieve the ARSQ values for each project included in the identified portfolios. This process is executed via automated queries to the SonarCloud API. We obtained a total of 22.8 K ARSQ rule violations across the 237 projects. For each rule violation, additional metadata is mined e.g., the Java class where the violation occurs, the affected lines of code, and the textual description of the issue. Such information is then used for further analysis during the report generation phase (see ‘Phase 6: ATDx Report Generation’), and is provided as complement to the ATDx report shared with the contributors.
An overview of the mined ARSQ rule violations is reported in Table 4. As we can observe from the table, the total number of ARSQ rule violations is much higher in the Apache ecosystem if compared to the ONAP one. We attribute this result to the presence, in the Apache ecosystem, to some large projects (cf. columns “Max.” of Table 3), which are also characterized by a high number of ARSQ violations (see column “Max.” of Table 4). Both ecosystems include projects that do not present ARSQ violations. The Apache and ONAP ecosystems have a median number of ARSQ violations equal to 12 and 11, respectively. The standard deviation (σ) of ARSQ violations instead results much higher for the Apache ecosystem instead. As before, this result can be attributed to the presence of few projects of considerable size in the Apache ecosystem (see Fig. 6). the same consideration can be made for the coefficient of variation (CV), as the projects belonging to the Apache ecosystem display a higher heterogeneity in sizes if compared to the ONAP projects.
Phase 4: ATDx analysis
By following our empirical evaluation design, the ATDx analysis is run independently for each portfolio, i.e., the analysis is based on the intra-portfolio comparison of ARSQ values. As detailed in ‘Empirical Evaluation Design’, this ensures that the clustering on which ATDx relies is executed by considering exclusively software projects sharing a similar context, hence reflecting the envisioned usage scenario of ATDx.
Figures 7 and 8 gives an overview of the ATDx analysis results. While the ATDD values vary across the projects of the two ecosystems, both of them exhibit low ATDx values (with a median of 0.28 for Apache, and 0.25 for ONAP). In order to gain further insights into this finding, we consider the values of the various ATDDSQ dimensions, and observe that none of the ATDDSQ values reaches the maximum of the scale (i.e., 5—see ‘ATDx Formalization’). This has to be attributed to the potential empirically unreachable ATDDT maximum values property of ATDx, which is further discussed in ‘Discussion’. While it would be possible to convert the scale adopted in order to improve the presentation and intuitiveness of the results (e.g., by converting local maxima to absolute ones), we refrain to do so, in order to support the transparency and understandability of the results.
| Tot. | Min. | Max. | Mean | Mdn | σ | CV | |
|---|---|---|---|---|---|---|---|
| Apache | 17.4K | 0 | 3.2K | 139.5 | 12 | 457.2 | 3.2 |
| ONAP | 5.4K | 0 | 616 | 48.9 | 11 | 99.9 | 2 |
| Total | 22.8K | 0 | 3.2K | 96.9 | 12 | 342 | 3.5 |

Figure 7: ATDx analysis results for the Apache ecosystem.
Overview of the ATDx analysis results, reporting the distribution of ATDDSQ and cumulative ATDx values of Apache
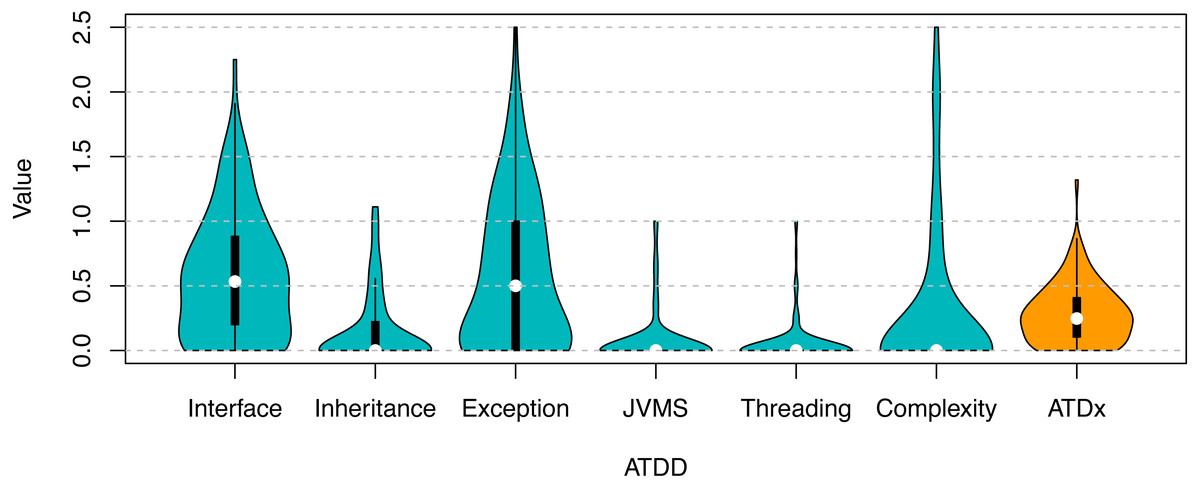
Figure 8: ATDx analysis results for the ONAP ecosystem.
Overview of the ATDx analysis results, reporting the distribution of ATDDSQ and cumulative ATDx values of ONAP.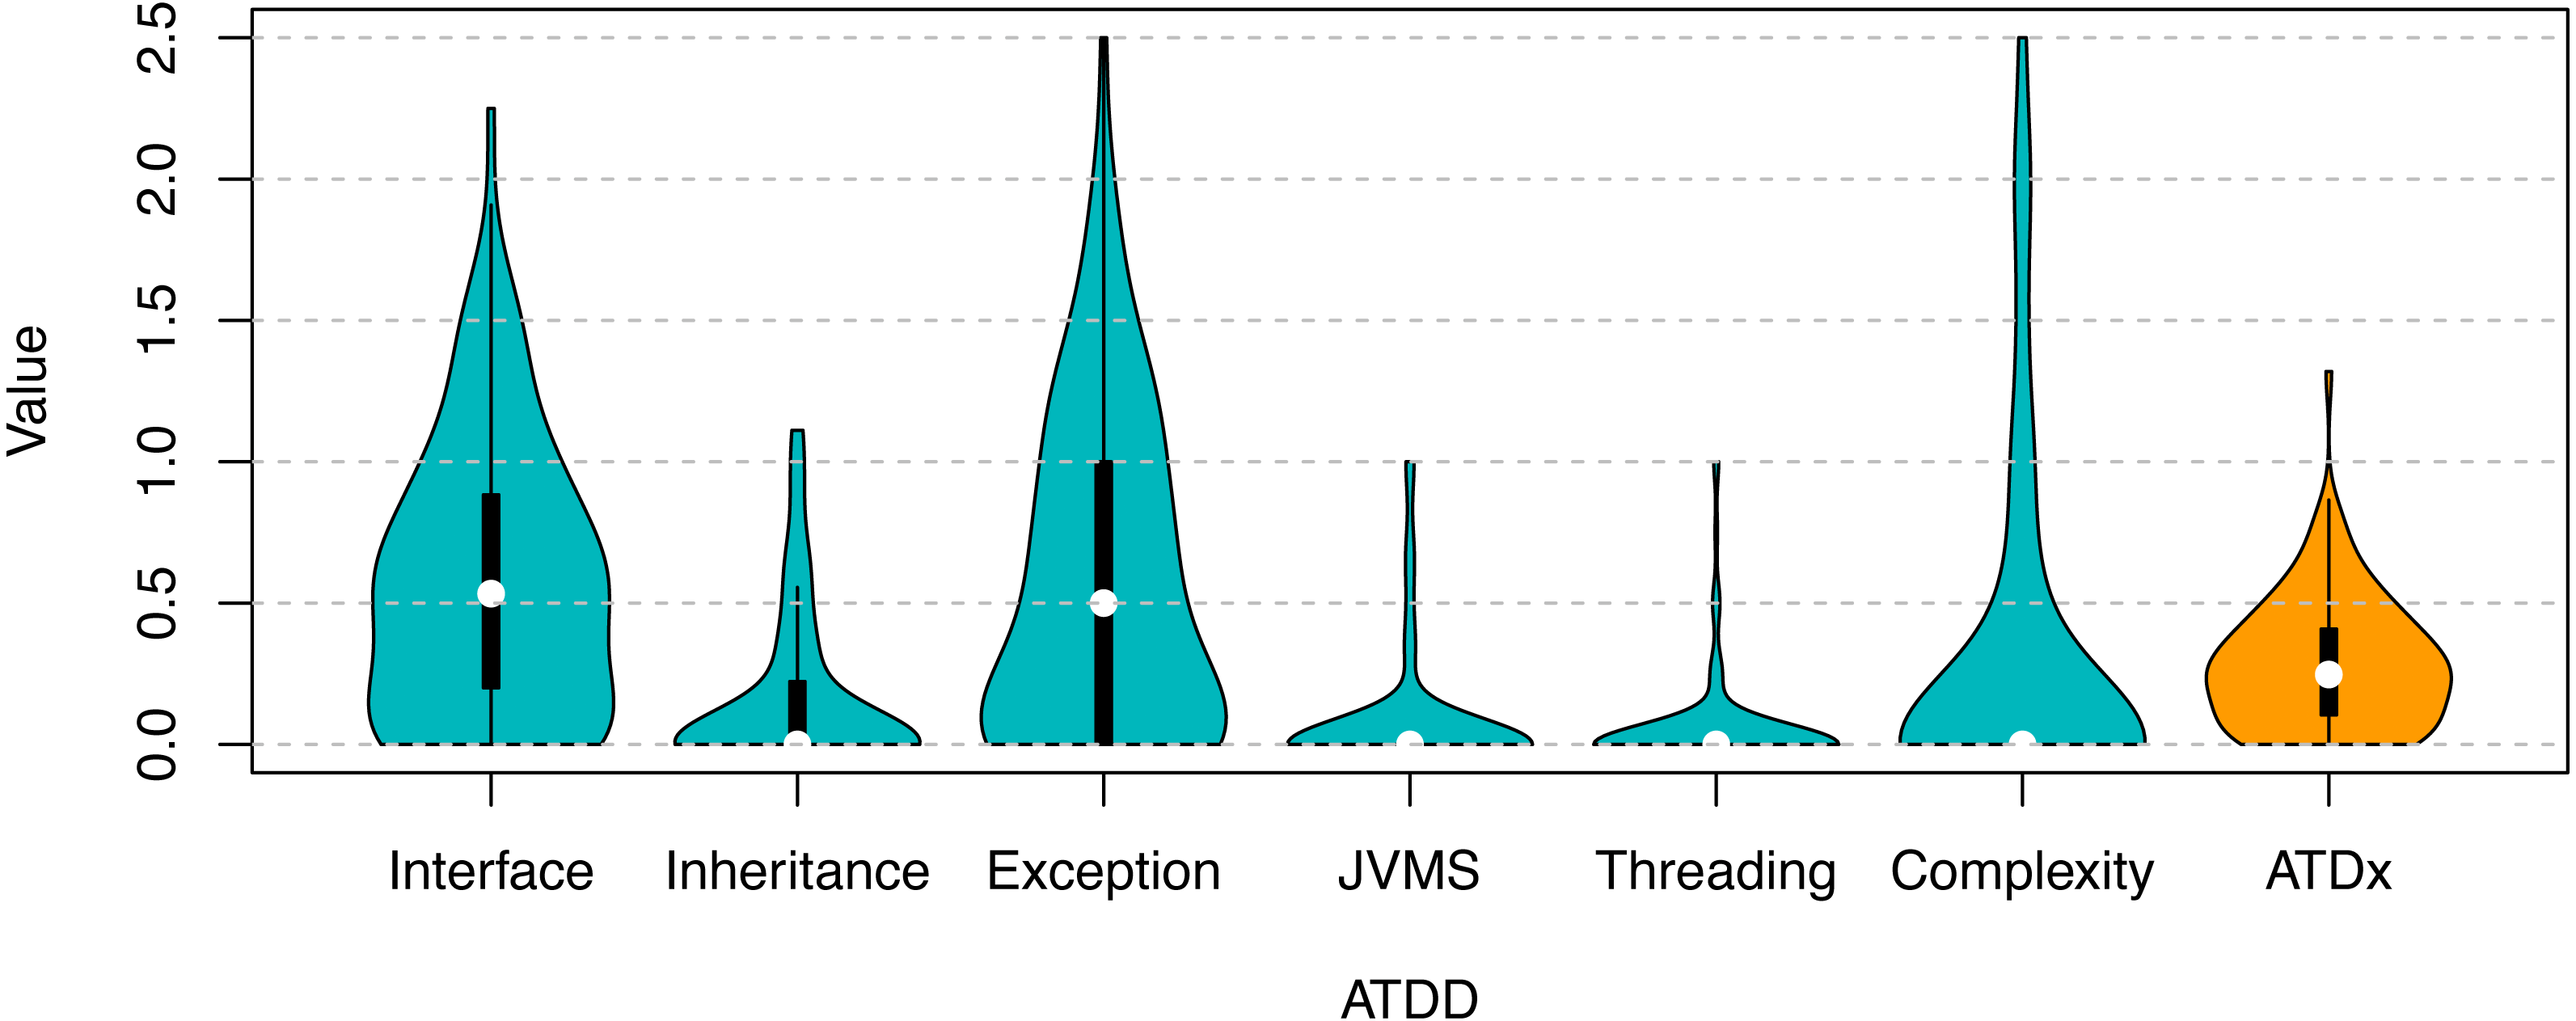
All together the ATDD values contribute in equal parts to the final ATDx value (as the ATDx value is calculated as the average of all ATDD values). This means that the highest ATDD values increase the most the overall value of ATDx. In particular, in our evaluation Interface is the dimension that increases the most the ATDx value of both portfolios, followed by the Exception dimension (see Figs. 7, 8). The other ATDDSQ dimensions increase less the ATDx value for both portfolios; nevertheless, some outliers are present, specially in the Complexity and Exception dimensions, meaning that some projects present an exceptional number of violations of rules belonging to such dimensions. Overall, the obtained results are in line with previous studies on other software metric indexes, e.g., the one by Malavolta et al., (2018).
Phase 5: identification of relevant contributors
In parallel to the ARSQ dataset building and ATDx analysis phases, we identify the relevant contributors for our study, i.e., the contributors who will be invited to participate in our survey. As detailed in ‘Empirical Evaluation Design’, we are interested in contributors who contributed to at least two software projects of a portfolio in the past 12 months. In order to identify such contributors, we first mine the GitHub repositories to identify contributors who pushed commits to the master branches of the software projects in the past 12 months. Subsequently, we identity all overlapping contributors, i.e., contributors who resulted to be active in two or more projects included in a portfolio in the past 12 months. This process leads to the identification of 233 relevant contributors, 72 for the Apache ecosystem, and 161 for the ONAP ecosystem. No contributor is identified as a relevant contributor for both the Apache and ONAP ecosystems. For each identified relevant contributor, we store their contact information, along with the projects their contributed to, which will then be used to generate their personalized ATDx report in the subsequent phase of the empirical evaluation.
Phase 6: ATDx report generation
After the ATDx analysis, and the identification of the relevant contributors, we proceed with the generation of a personalized report for each relevant contributor. In total, 233 personalized reports have been generated. The generated reports follow the Markdown format and are hosted in a dedicated GitHub repository (https://github.com/S2-group/ATDx_reports). Using the Markdown format for the reports allows us to (i) show the ATDx results in a familiar environment for the projects’ contributors and (ii) directly link the personalized report in the email inviting the contributors to participate to the survey.
An example of the content contained in a personalized report is shown in Figs. 9–11. Each report is composed of three main parts, namely:
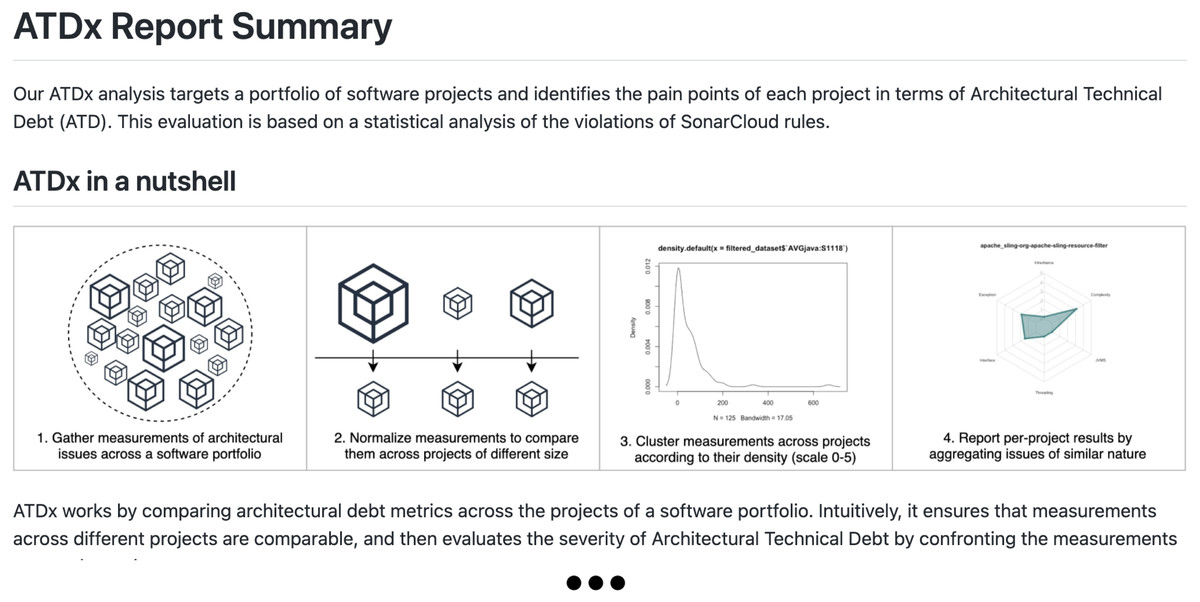
Figure 9: Report example: Snippet of the concise description of the ATDx approach and related background information (e.g., description of the ATDDSQ dimensions).
-
An introductory text providing the contributor with a concise explanation of the ATDx approach, the related background information (e.g., a brief definition of the ATDDSQ dimensions), and a summary of the report content (see Fig. 9);
-
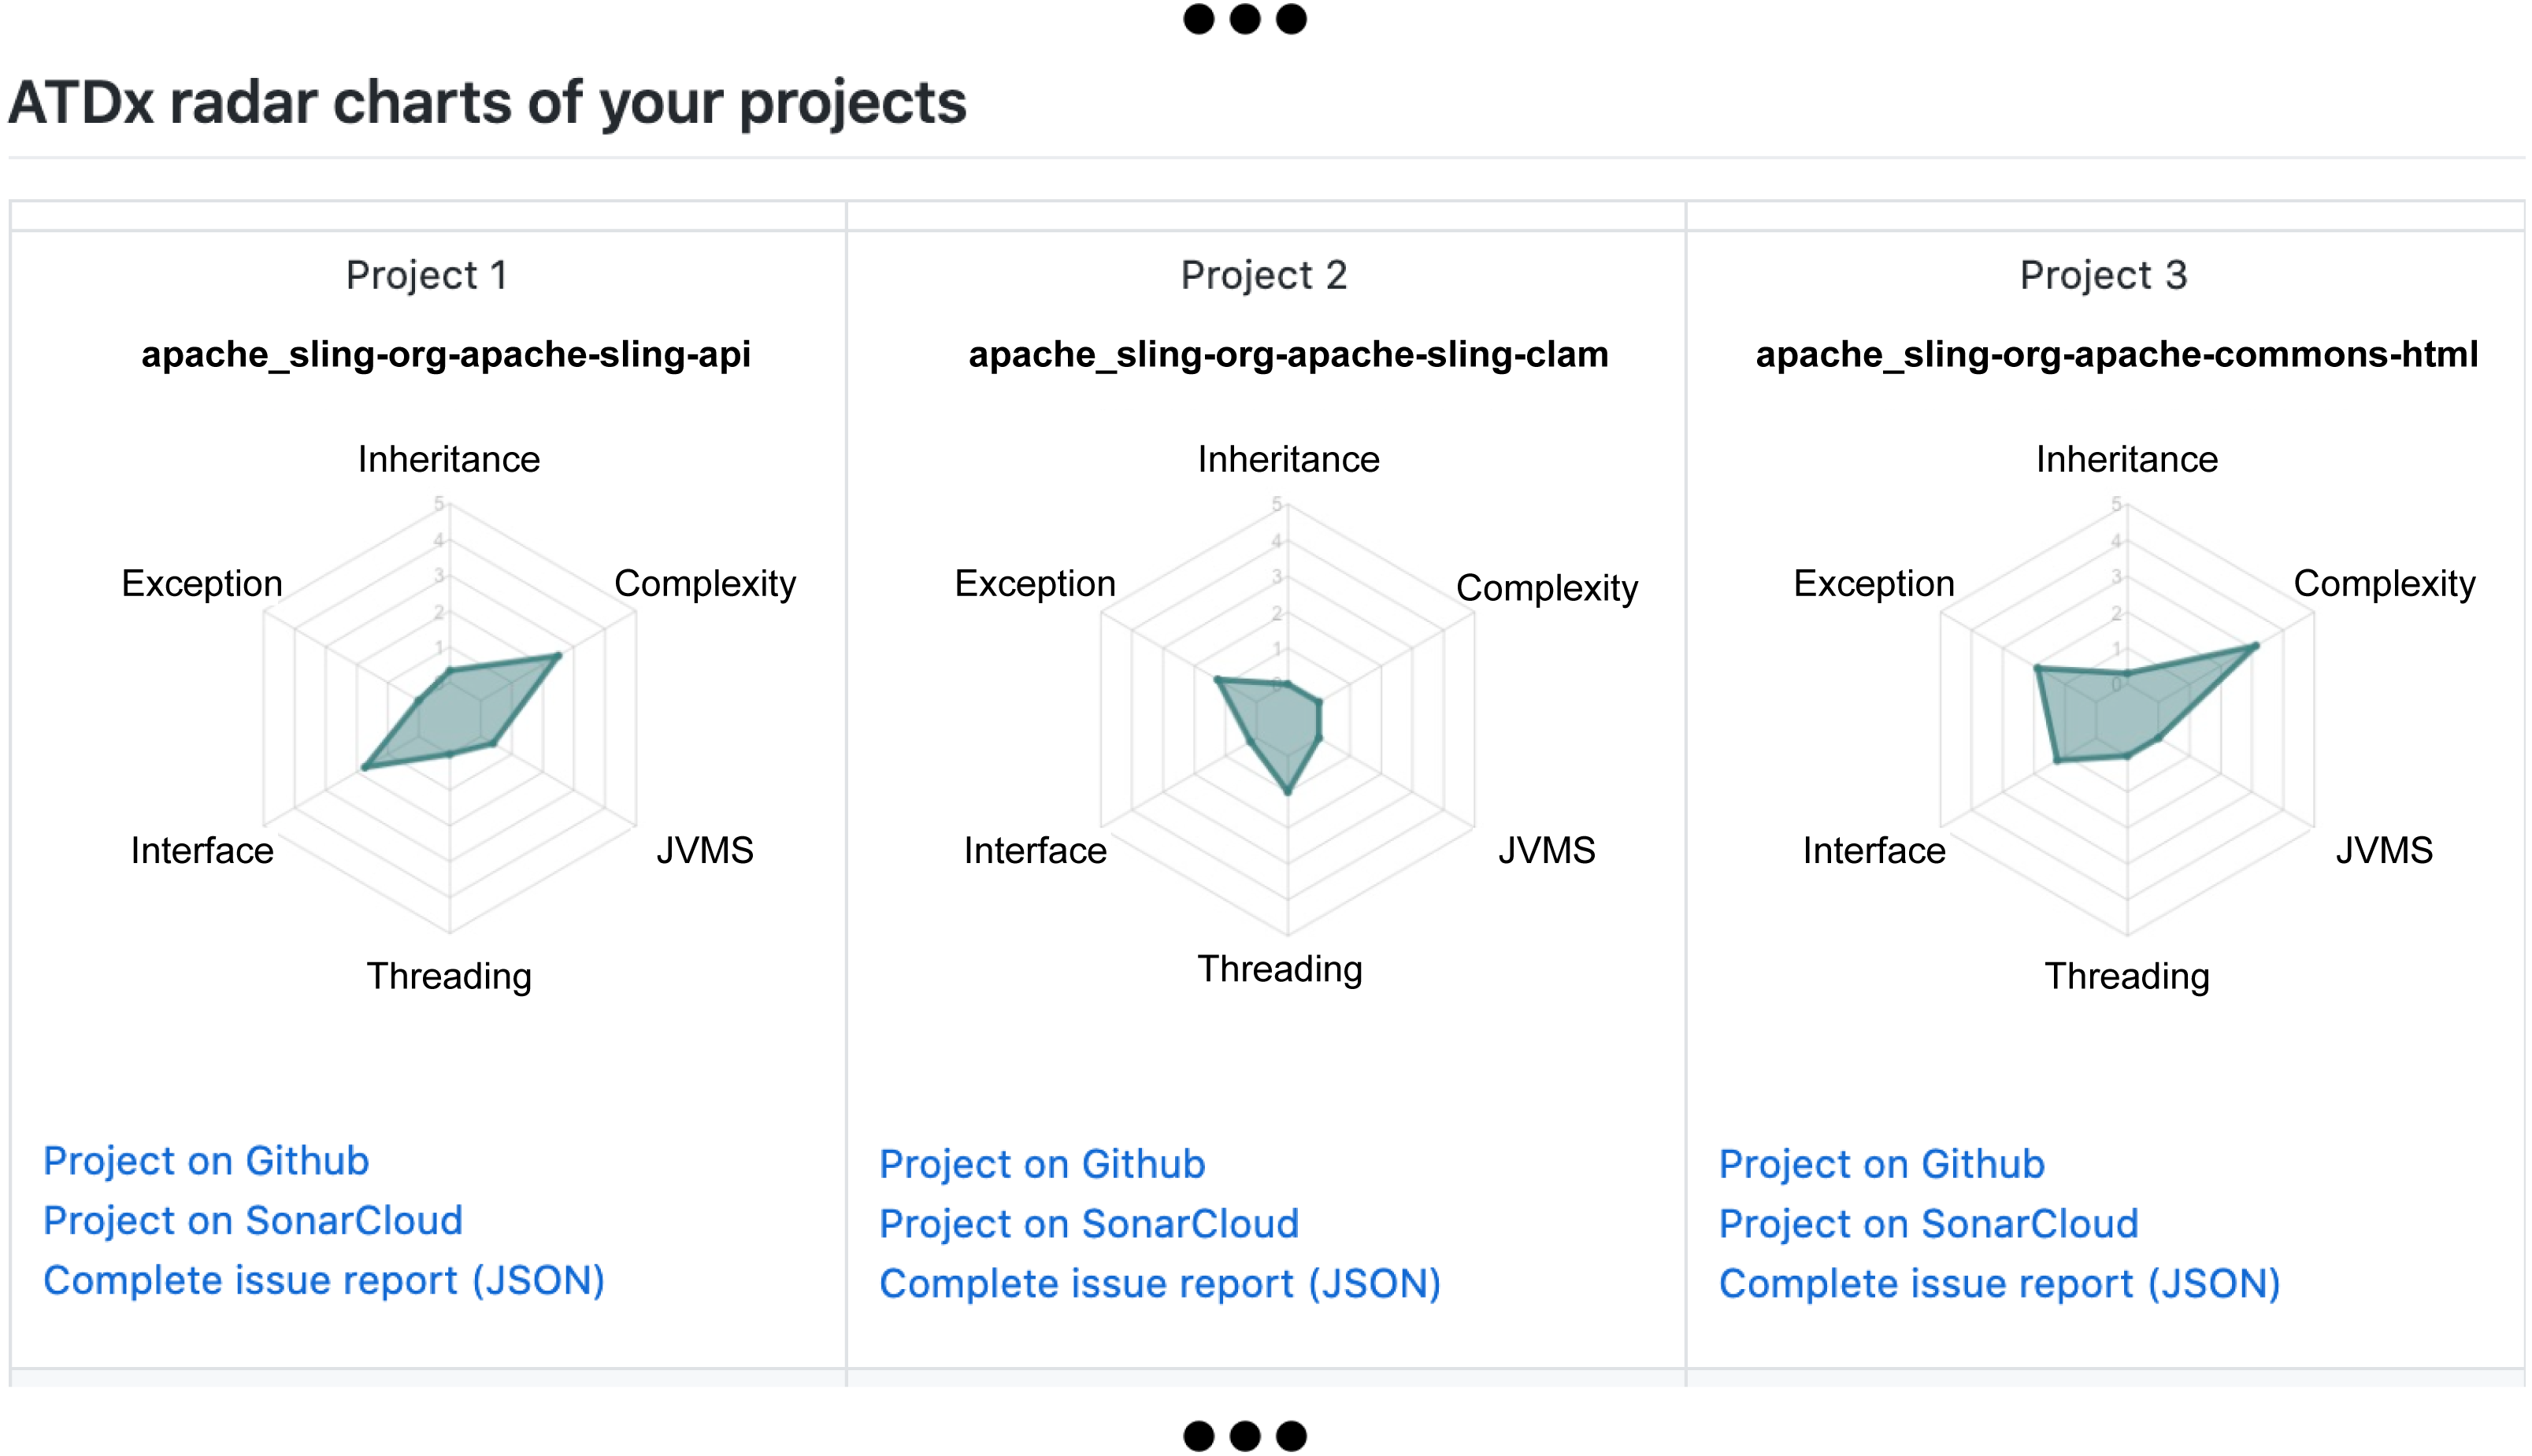
An overview of the ATDx analysis results for all projects of the contributor, provided in form of radar charts, to allow a swift comparison of ATDx analysis results across the projects (see Fig. 10);
-
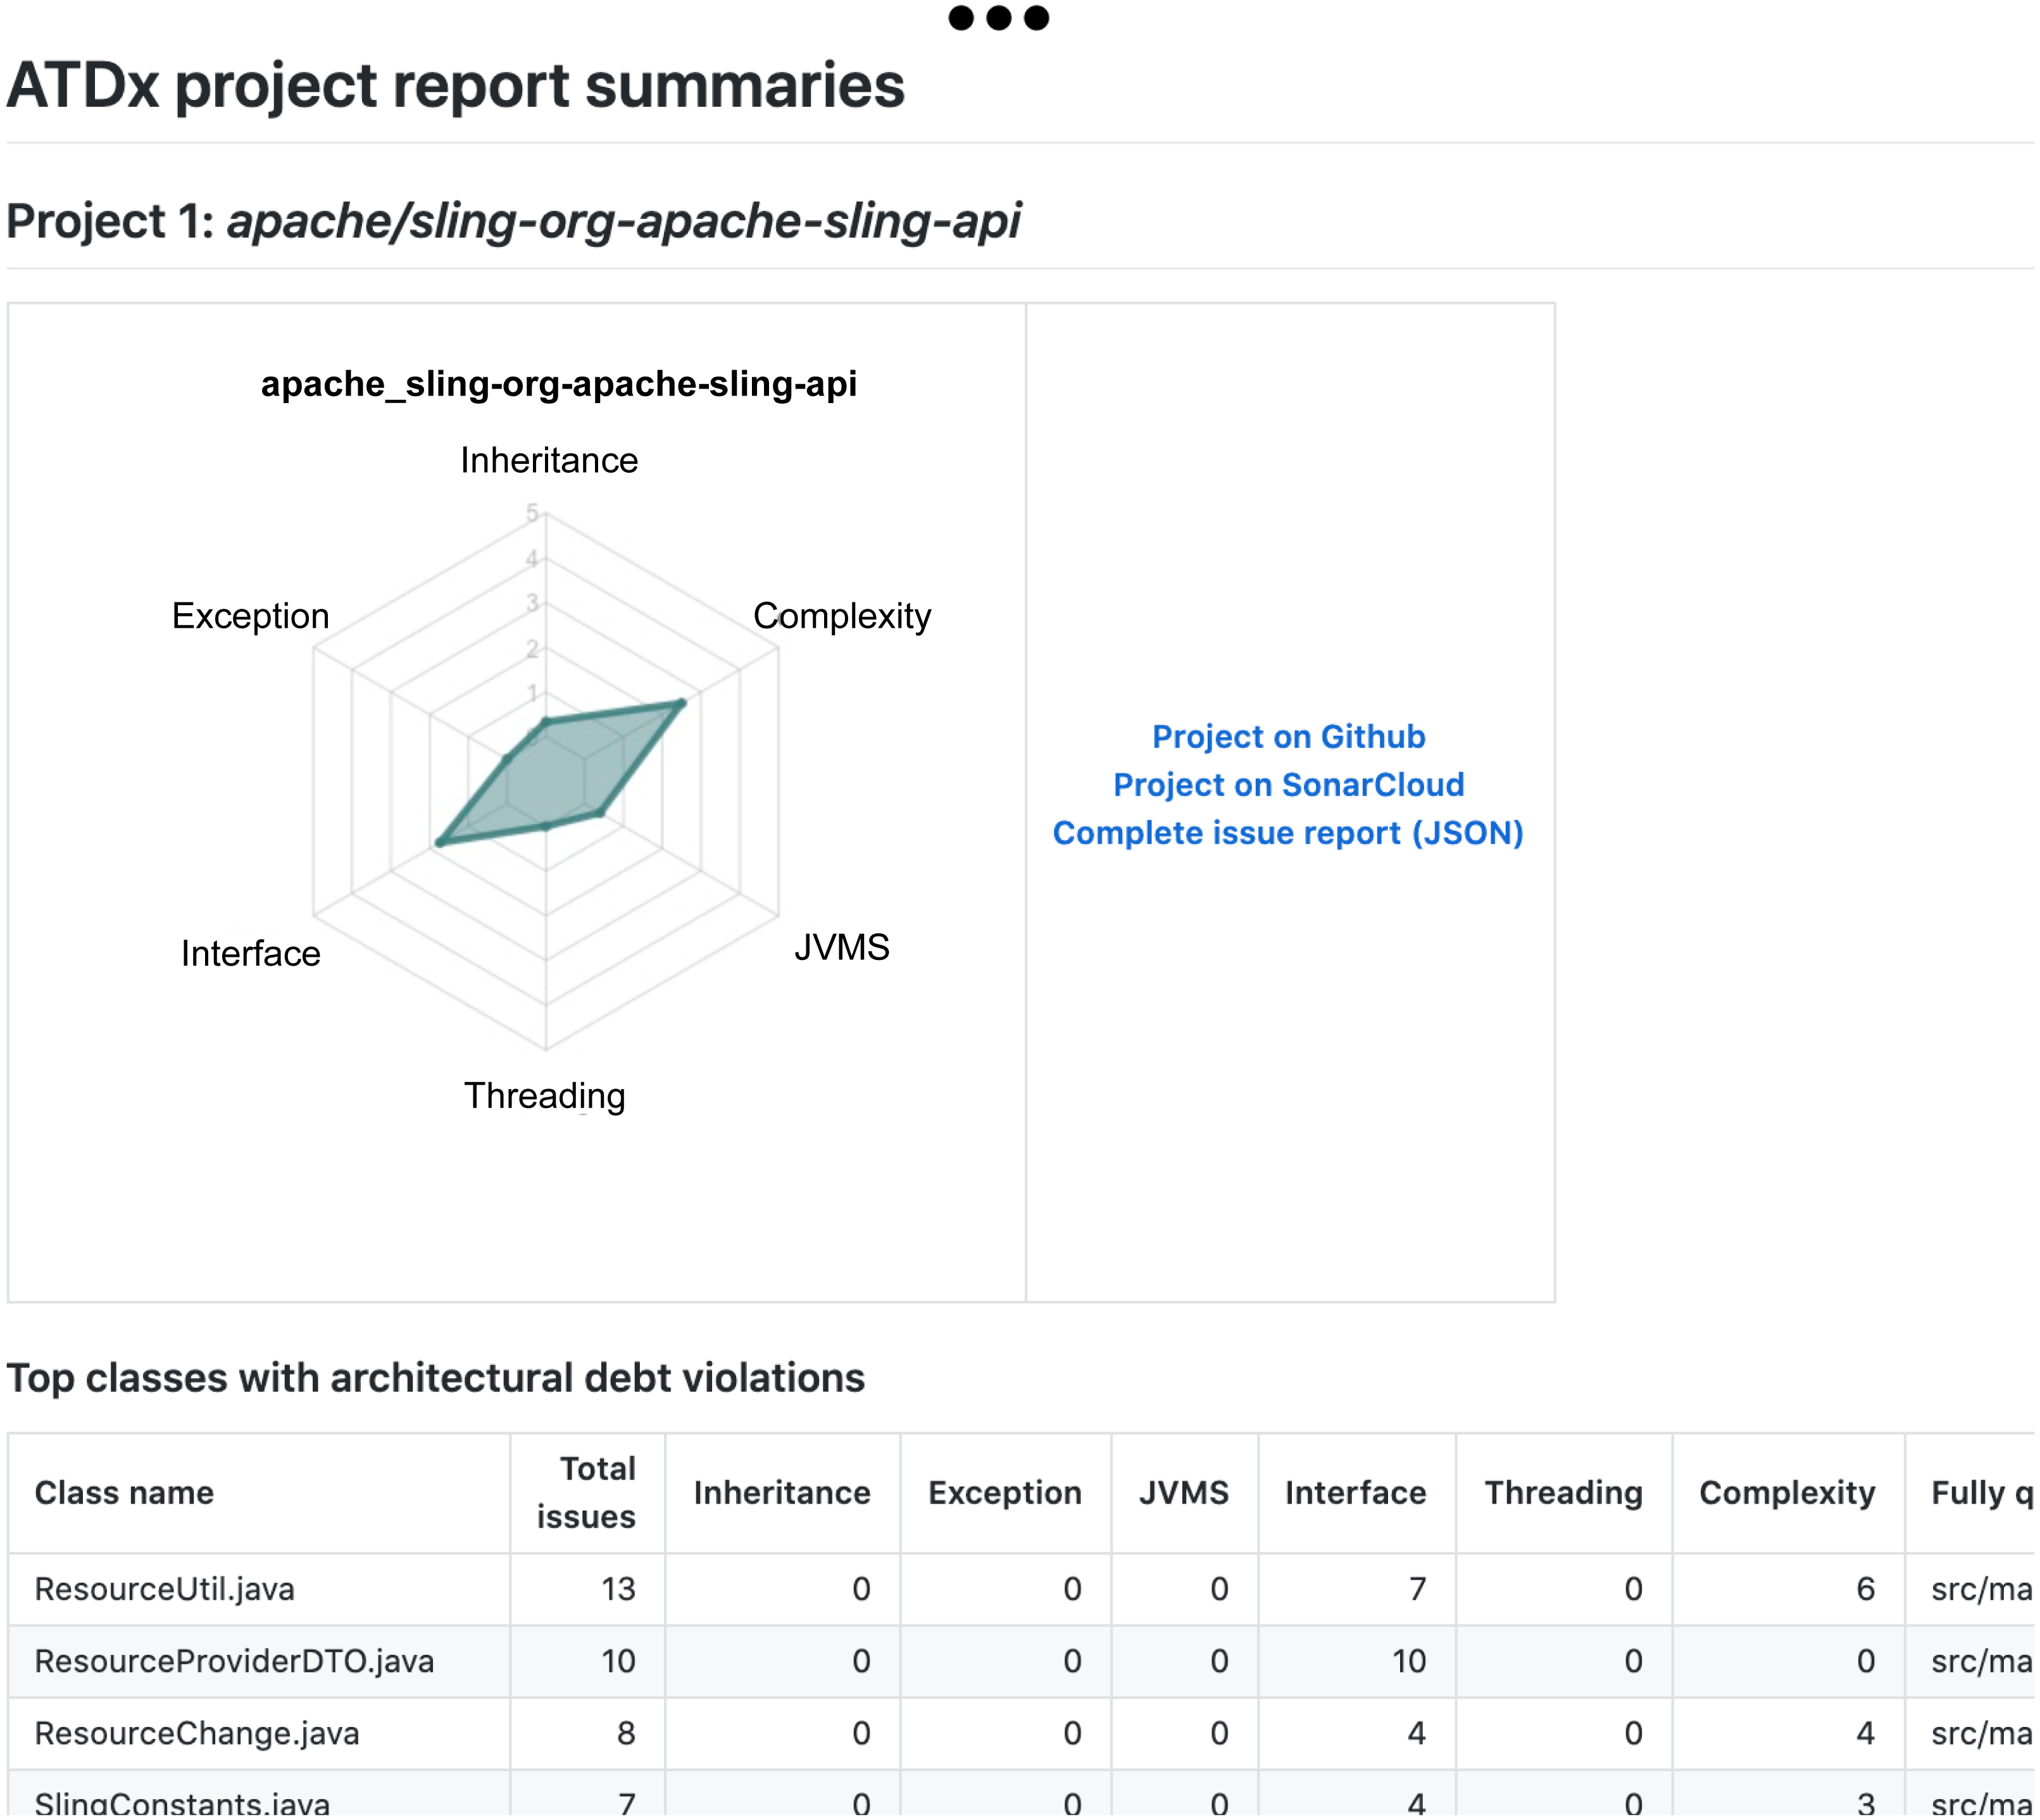
A documentation of the ATDx analysis results for each project, including the top-10 classes containing the highest ARSQ values, mapped to their ATDDSQ dimensions (see Fig. 11).
Additionally, in order to provide the contributors with further context regarding the projects included in the report, each radar chart is complemented with additional information about the system under analysis, specifically: (i) a link to the original GitHub repository of the software project, (ii) a link to its SonarCloud dashboard, and (ii) a link to the complete raw data resulting from the ATDx analysis.
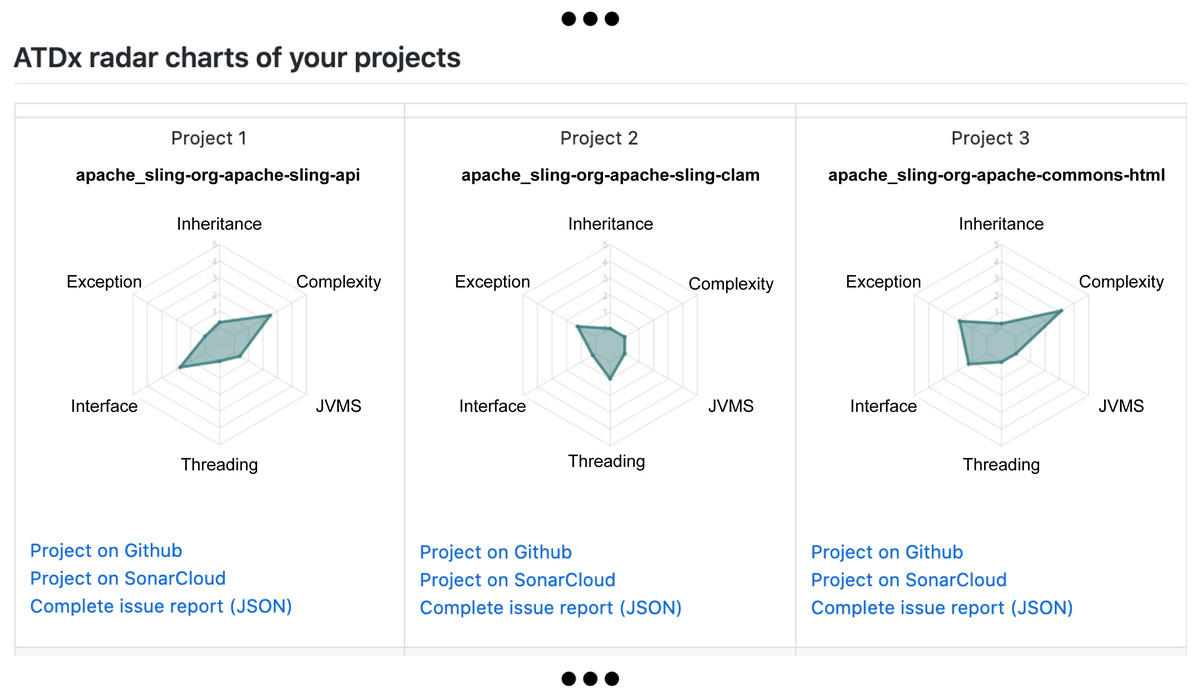
Figure 10: Report example: Snippet of an overview of the ATDx project analysis results.

Figure 11: Report example: Snippet of a per-project report, including the top-10 classes in terms of ATD violations.
Phase 7: report distribution and survey invitation
After the generation of the reports, we share the results to the 233 relevant contributors identified in Phase 5. In addition to the distribution of the personalized reports, during this phase, we also invite contributors to participate to the online survey described in Table 1. Striving for a high response rate, we kept the invitation email as short and engaging as possible and customized its contents based on their receivers and the project they contributed to. Two different rounds of invitation, executed in two subsequent weeks, are used to stimulate the relevant contributors to participate in the survey.
Phase 8: online survey
In the last step of our empirical evaluation, we gather the data required to answer our research questions via the online survey. This survey is implemented by rigorously adhering to the structure presented in ‘Empirical Evaluation Design’. We stop the data collection 4 weeks after the last round of invites are sent out. This allows us to finalize the results to be considered, while providing relevant contributors an adequate amount of time to participate to the survey.
Results
In this section, we present the results of our empirical evaluation: ‘Participants Demographics’ provides some demographic information regarding the participants of our survey; ‘(RQ1) On ATDx Representativeness’ reports on the results for RQ1, i.e., the representativeness of the ATDx analysis results; and ‘(RQ2) On ATDx Actionability’ documents the results for RQ2, i.e., the extent to which the ATDx analysis results stimulate developers to take action with respect to the ATD detected in their projects.
Participants demographics
In total, 47 out of 233 relevant contributors participated in our survey (i.e., ∼20% of the contributors participated in the survey). Participants have a median (average) of 12 (12.3) years of software development experience, with a minimum (maximum) of 2 (26). Most participants (97%) declared to have contributed to more than one OSS project, with the majority (38%) contributing to 6–10 OSS projects. All participants declared to be familiar with the analyzed software projects, with (i) 50% of them being very familiar with the projects (i.e., “occasional contributors”), (ii) 40% of them being extremely familiar with the projects (i.e., “regular contributors”), and 4% of them being moderately familiar (i.e., “have looked at its artifacts, read its code, and can contribute easily”). Based on the gathered demographic data, we are reasonably confident that all participant have a good level of development experience and enough familiarity with the projects to properly understand the ATDx results shown in their personalized reports.
(RQ1) On ATDx representativeness
In order to assess the representativeness of our approach, we examine the responses to questions Q4–Q7 of our survey (see Table 1). Figure 12 provides an overview of the responses given by the participants.
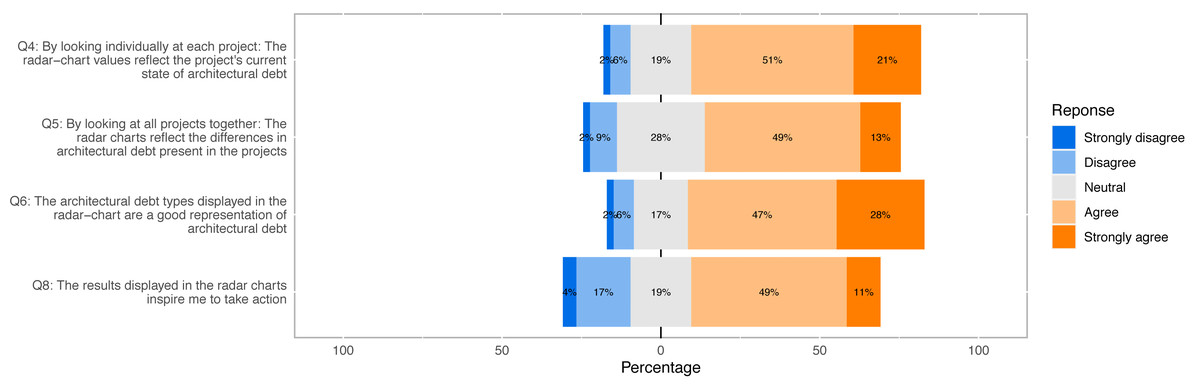
Figure 12: Response distribution of Likert scale survey questions used to answer our research questions (Q4, Q5, Q6, Q8).
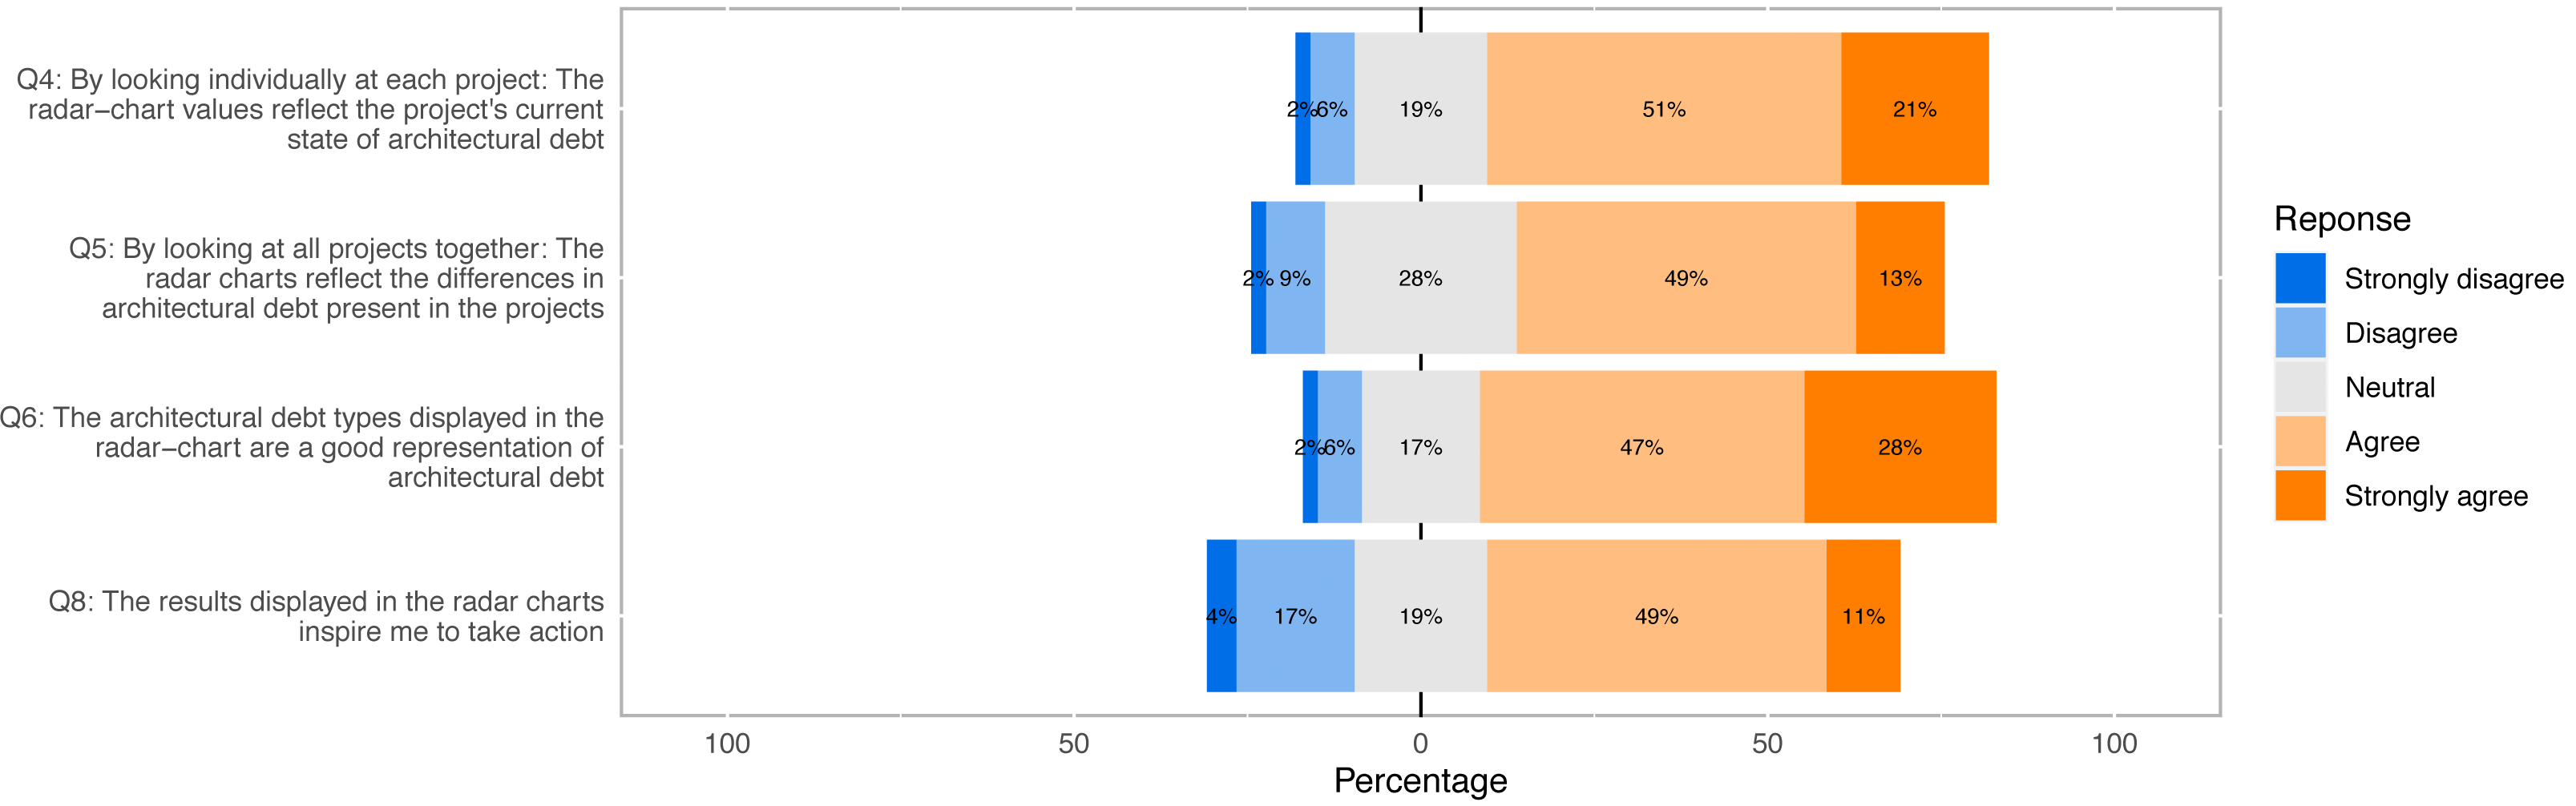
Question Q4 regards the extent to which ATDx analysis results reflect the actual ATD of a software project, by considering individually each project. The response distribution of this question reveals that most participants find the ATDx results representative (72%), with most participants agreeing with the statement formulated in Q4 (51%), or strongly agreeing with it (21%). Only a small portion of the participants does not find the ATDx results representative to various extents (8%), with only one participant strongly disagreeing with the statement. By considering the rather sporadic open-ended comments provided by participants for this question (6 data points), we note a characteristic lack of awareness of the ATD present in their projects, e.g., “Not sure how much technical debt we have” (4 data points), and a few acknowledgments of the results representativeness, e.g., “Results match my expectations”(2 data points). Overall, by considering the answers provided by the participants, we conclude that ATDx is representative when individual projects are considered.
Question Q5 focuses on comparing ATDx analysis results across all projects within each personalized report. Based on the results gathered with this question, we note that most participants find the ATDx results representative when compared across projects, albeit to a lower extent than when considering the results of individual projects. In particular, while the majority of participants agrees with the representativeness of ATDx results (62%), answers are also characterized by a higher disagreement (11%), and the highest number of neutral answers among all Likert-scale survey questions (28%). The few comments provided by participants for this question (5 data points), point to difficulties in comparing the ATD across different software projects. We conjecture that the lower agreement with respect to Q4 could be attributed to inherent challenges in comparing the ATD present in different software projects, that would also motivate the high number of neutral responses measured for this question.
Question Q6 regards the representativeness of ATDDSQ dimensions used in the empirical evaluation. By looking at Fig. 12, we observe that overall Q6 yields the highest agreement rate (75%), and the lowest neutral (17%) and disagreement rates (8%). The participants (7 data points) suggest in the open-ended comments: (i) adding more dimensions, (ii) adding specific dimensions (e.g., “tests”, “cloned code”), or (iii) adding more details about the dimensions already included.
The final question related to RQ1 (Q7 in Table 1) regards potentially-missing ATDDSQ dimensions of the specific ATDx instance used in the empirical evaluation. This question is optional and only three participants answered it. Nevertheless, the provided answers are informative and propose the following additional dimensions: “duplicated classes”, “testing”, and “cloned code”.
(RQ2) On ATDx actionability
With RQ2 we aim to assess the degree to which the ATDx analysis results stimulate developers to take action towards addressing their ATD. In the survey, this RQ is covered by two separate questions: a Likert scalequestion (Q8) and an open-ended question (Q9).
As shown in Fig. 12, participants generally agree with the statement that the results displayed in the radar charts inspire them to take action (60%). The remaining participants tend to either disagree with the statement (21%) or take a neutral stance (19%). By considering the additional comments provided by the participants to support their answer (6 data points), we observe the need for a finer-grained level of information in the ATDx report to address the identified ATD, as the provided documentation may not be sufficient to trigger concrete action on the analysis results. Examples of requested additional information include: “Give more information on problems” and “Add more technical debt aspects”.
Based on this finding, we conclude that the current information documented in the ATDx reports (namely ATDDSQ values, top classes with ART violations, and JSON files containing the raw SonarQube analysis results) is perceived as actionable. Nevertheless, participants also suggested interesting points for improvement, e.g., by providing (i) the ability to zoom in and out of ATD hotspots at different levels of abstraction, (ii) ATD visualizations, (iii) hints about ATD resolution strategies. Question Q9 is about the scenarios in which the ATDx analysis can be used in practice. Even though only 10 participants answered this question6, participants mention some interesting usage scenarios about visualization (e.g., “as a UI in SonarQube”), refactoring (e.g., “find code to fix” code review), and communication (e.g., “talk about problems in issue tracker”). Also, participants highlight the lack of a user interface to visualize the analysis results in an interactive manner. Driven by the results collected for RQ2, we envision to improve the reporting of ATDx analysis results, in order to improve its actionability, and directly support a set of selected usage scenarios, e.g., by enabling the composition of the analysis with continuous integration pipelines, issue trackers, and enabling a finer-grained scrutiny of the result via a dedicated dashboard.
Discussion
With our empirical evaluation, we gathered different insights regarding the in vivo application of ATDx . Overall, the empirical results demonstrated the representativeness of the approach and, even if to a lower extent, its actionability. Regarding the empirical evaluation, it is important to note that the results are bound to an experimental implementation of ATDx, and hence have to be considered only as a proxy of the general ATDx approach presented in ‘The ATDx Approach’. Nevertheless, implementing an ATDx instance is an inevitable step required to evaluate the approach. This leads to a potential threat to validity of our findings, as further discussed in ‘Threats to Validity’.
Implementing a concrete instance of ATDx allowed us also to gain further hands-on knowledge of the characteristics of the approach. Specifically, when considering the approach benefits, we took advantage of the (by design) tool independence of ATDx, allowing us to use a readily available rule set provided by Ernst et al. (2017) and the pre-computed measurements of SonarCloud.
The language independence property of ATDx instead allowed us to focus on the software portfolios deemed best fitted for the empirical evaluation, rather than having to follow potential constraints dictated by other analysis approaches.
As described by Verdecchia et al. (2020), the semantic metric aggregation on which ATDx is based, allows to provide multi-level granularity results. This characteristic of the approach was used in the empirical evaluation by including in the ATDx report architectural ATDDT dimension values at project-level, ART rule violations at class-level, and localization of single ART rule violations at line-of-code-level.
Actionability of ATDx resulted to be lower with respect to its representativeness (see ‘(RQ2) On ATDx Actionability’). We conjecture that this result did not depend considerably on the adopted levels of granularity, but rather on how the analysis results were documented in the ATDx report. As future work, we look forward to refine the ATDx report capabilities, which were only marginally considered for this investigation, by providing enhanced visualizations of analysis results (e.g., via dashboarding), and information on how to resolve the identified ATD issues.
The empirical evaluation conducted in this study provided us also further insights on the data-driven nature of ATDx, i.e., its reliance on inter-project measurement comparison, rather than predefined metric thresholds. This led to the establishment of two severity classification frameworks tailored ad-hoc for the two portfolios considered, implementing different empirically-derived severity thresholds.
Some of the envisioned benefits of ATDx described by Verdecchia et al. (2020) could instead not be assessed with our empirical evaluation design. Prominently, the ATDx instance was based on a single tool, namely SonarQube. This did not allow us to study the tool composability property of ATDx, i.e., the aggregation of analysis results gathered via heterogeneous tools. As future evaluation of the ATDx methodology, we plan to assess the effects of tool composition on the ATDx analysis results.
In addition to tool composability, we did not conduct any domain-specific customization of ATDx, other than filtering out the ARSQ rules that were not included in the SonarQube quality profiles of Apache and ONAP. While the Apache and ONAP ecosystems could be deemed as oriented towards specific domains (namely web servers, and networking/edge-computing respectively), upon further inspection we noted a high heterogeneity across projects of the same ecosystem. The heterogeneity of projects belonging to the same ecosystems has to be attributed to “periferal” and “utility” software project, that support the general domain of the organizations, but focus on narrow use cases or implementation concerns. As an example taken from the ONAP ecosystem, the ONAP SO project (https://github.com/onap/so) implements a core functionality in the ONAP domain, namely the orchestration of ONAP components. The ONAP SDC (https://github.com/onap/sdc) instead is a “utility” project, which does not focus directly on networking or edge-computing, as it implements a visual modeling and design tool. To carry out a fine-grained domain customization of ATDx, a curated portfolio including exclusively software projects belonging to a specific domain, e.g., safety-critical systems or mobile applications, should be considered.
Regarding future customization of ATDx, in the version of ATDx used for the empirical evaluation, the final value of ATDx is calculated by averaging the values of all ATDDT dimensions. By considering a context where ATDDT dimensions possess different levels of importance (e.g., “interface” in the networking context of ONAP), it could be possible to assign different weights to the different ATDDT dimensions, rather than let them equally contribute to the final ATDx value.
As further customization of ATDx, we note that the categorization of severities into the range [0, …, 5] was dictated by a design choice, rather than a limitation of the utilized clustering algorithm, namely CkMeans (Wang & Song, 2011). The adopted severity discretization was selected as it was deemed intuitive, while providing sufficient expressiveness on the severity of ATDDT dimensions. Nevertheless, according to the specific context considered, it would be possible to tune the range of severity of ATDDT dimensions by considering fewer or more severity levels, hence reflecting the desired level of severity granularity.
Regarding other characteristics of ATDx presented by Verdecchia et al. (2020), in this work we directly addressed the emphasis on outlier values, characteristic of the previous version of ATDx. To overcome this limitation, we substituted the outlier function used to calculate the constituent values of ATDD with the severity function (see Formula ??), which is based on the CkMeans clustering algorithm. This adjustment allowed us to calculate ATDD values at a refined level of granularity, by determining the severity of each ART violation of software project, rather than focusing on a Boolean characterization of its outlier violations.
For this research, we also carried out an ATDx implementation validation, required to assess the representativeness of an implemented instance of ATDx. Rather than utilizing focus-groups, as envisioned in the publication this research builds upon Verdecchia et al. (2020), we leveraged personalized reports and follow-up surveys (see ‘Empirical Evaluation Design’): this allowed us to contact in an efficient way a considerable number of developers who contributed to the analyzed software projects.
The ATDx approach is dependent, by definition, on a portfolio of software projects. Hence, while numerous ATD analysis approaches require exclusively the SUA (Verdecchia, Malavolta & Lago, 2018), our approach needs a portfolio of software projects to calculate the severity of ART violations. This implies that the ATDx results of a SUA are only “relative” to the other projects included in the portfolio, and are not representing an absolute result. As a consequence, the ATDx analysis results are not directly comparable across different portfolios. For example, by considering the distribution of ATDD violations of Figs. 7 and 8 it is important to remember that the results are intrinsically dependent on the portfolios considered. As a consequence, the distributions presented in Figs. 7 and 8 are not directly comparable. The ATDx dependency on a portfolio can be considered as both a benefit and a drawback of the approach. On one hand, ATDx resolves potential threats related to statically defined metric thresholds and debt values via severity clustering, allowing to fine-tune the ATDx analysis based on the specific portfolio and context considered. On the other hand, the approach can be utilized exclusively if a portfolio of software projects is available. The need of a portfolio to run ATDx might be considered as a steep requirement, as in numerous contexts a portfolio of software is not available. Nevertheless, it has to be considered that (i) ATDx is mostly targeted towards managers and developers who need to evaluate ATD across their software portfolio,(ii) “generic” datasets can be established and reused to efficiently run ATDx without domain-specific customization (iii) readily available datasets, such as the ones we provide in the replication package, can be utilized as starting sets, (iv) a business case can be made, where the ATDx analysis, and the underlying dataset, can be established and tailored by consultants according to the specific needs of an analysis customer. In addition, as further hinted to in our future work (‘Conclusions and Future Work’), we envision to implement a “light” version of ATDx, which leverages the semantic clustering of ART rules of ATDx, but does not use the severity clustering logic presented in this paper, and hence will not require a portfolio of software projects as input.
Numerous state-of-the-art ATD identification tools and indexes provide a “monetization” of the identified ATD issues, either by considering as units of measurement refactoring time, refactoring cost, or other similar measurement units. This ATD principal quantification is generally based on the multiplication of violations’ recurrence times the effort required to fix the violations, rather than relying on a data-driven and inter-project comparison-based severity calculation. For example, the index provided by CAST (https://www.castsoftware.com/products/code- analysis- tools) is calculated by multiplying the number of rule violations times the criticality of the rules violated times the effort required to fix the rule violations. With ATDx, we distantiate from a priori defined rule severity and remediation effort, as recent literature pointed towards their potential inaccuracy and subjectivity (Baldassarre et al., 2020). In a sense, ATDx is designed to quantify the principal of ATD via the objective classification of architectural rule violation severities, but without attaching any arbitrary mapping between of architectural rule violations to their remediation times. To the best of my knowledge, such potential fallacy is also avoided by Arcan (Arcelli Fontana et al., 2017), which further mitigates potentially lossy aggregations by separately reporting the dependency issues it is designed to identify.
A characteristic inherent to the ATDx design is the potential empirically unreachable ATDx maximum values. While reaching a maximum value in a certain dimension ATDDT is by definition theoretically possible, it is empirically extremely improbable. By design, a software project reaches the maximum in one dimension if and only if it possesses maximum severity values in all ARs mapped to a ATDDT dimension. If the software project possesses a maximum value of ATDDT, this would indicate that the project is characterized by exceptionally severe and recurrent issues in that dimension. In our empirical evaluation, such project was not present for any dimension. As reported in ‘Phase 4: ATDx Analysis’, a possible heuristic to improve this characteristic of ATDx would be to rescale the values of a dimension i to the [0, maxi] range, where maxi is the maximum value in the dimension i across all rules in ART mapped to i. Nevertheless, we refrained from such solution in order to support the transparency and interpretability of the results.
Building an ATDx instance entails a human-in-the-loop (as implied in the second building step of ATDx, see ‘Step 1: Identification of the ART set’). In fact, the classification of 3-tuples relies on manual classification, and hence is inherently characterized to a certain extent by subjectivity. Despite our best efforts to document a systematic classification process, mitigation mechanisms should be adopted in order to reduce potential sources of bias during the execution of this step (e.g., by involving different individuals in this step, and systematically tracking inter-rater agreement levels).
Finally, a last characteristic of ATDx is its reliance on a predefined set of ART. As detailed by Verdecchia et al. (2020), ATDD values are computed by considering distinct sets of ARs. It is necessary that the number of rules across the different sets is balanced as, if the distinct sets exhibit notable differences in cardinality, the weight of under-represented sets could lead to their unfair representation. In the ATDx instance utilized in our empirical evaluation, this characteristic was meticulously considered and mitigated by carefully selecting ART from existing academic literature provided by Ernst et al. (2017), and by considering the ART recurrence, relevance, and the cardinality of the mapped ATDDs. Regarding the predefined set of ART, a consideration has to be made regarding the potential need to update the set as time passes by. In fact, the tools on which ATDx relies can be regarded as e-type programs according to the Lehman classification (Lehman, 1980), i.e., these tools are change-prone, and may evolve according to context and environment changes. As tools evolve, new ART rules may be introduced, removed, or deprecated. This led numerous tool producers to implement custom profiles, e.g., the SonarQube quality profiles, to allow users to utilize ad-hoc configurations. ATDx is designed with modifiability and extensibility in mind, allowing to change the rule set ART according to the rule changes in the utilized tools T, provided that time is invested in creating the 3-tuples (see ‘The ATDx Approach’) for new rules. As documented in our empirical evaluation execution section (see ‘Phase 1: ARSQ Identification and Classification’), the 3-tuple creation process requires a rather negligible amount of time, allowing to update an ATDx implementation with only marginal effort.
Overall, our empirical evaluation shows how ATDx can be a valuable approach to gain awareness of the ATD present in a software-intensive system. The approach can be tailored to the specific context one considers, by utilizing measurements gathered via the tools available, and relate the severeness of architectural rule violations with respect to other similar projects included in a software portfolio. The ATDx report results provide an intuitive yet meaningful overview of ATD, which can be enhanced via further visualization techniques to provide actionable guidance of ATD hotspots and their resolution.
Threats to Validity
Despite our best efforts, the presented results could suffer from potential threats to validity. Following the classification of Wohlin et al. (2012), we consider four different threat types.
Conclusion validity
Conclusion validity regards if the experimental measurements are measuring the theoretical constructs they are intended to measure. As the results of our empirical evaluation are gathered via a survey, a possible thread to conclusion validity is the face validity of the survey (Weiner & Craighead, 2010), i.e., the extent to which the survey conveys the concept it purports to measure. In order to mitigate potential threats to face validity, supporting text explaining the goal of the survey, concepts related to ATD, and the ATDx approach purpose and functioning, were integrated in all material shared with the survey participants, namely the survey invitation message, the ATDx report, and the survey itself. Additionally, to ensure that the survey questions were sufficiently clear to participants, and no important aspect was missing in the questions, each closed-ended question was accompanied by an open-ended question(“Comments?”), were participants could add clarifications to their answers, doubts, and remarks.
To avoid potential threats related to the extent to which the survey answers are fitted to answer our RQs, we designed the survey questions by deriving them directly from the RQs and the goal of our empirical investigation. This led to the formulation of different survey questions, covering the various aspects the RQ purported to assess. To ensure full traceability of the mapping between survey questions and RQs, the complete process leading to the formulation of each survey question is documented in ‘Empirical Evaluation Design’, while the explicit mapping between survey question and RQ is also schematically reported in Table 1.
Potential threats related to low statistical power are mitigated by documenting separately the distributions of answers to each single question of the survey, allowing for independent scrutiny and interpretation of the gathered results. Additionally, the 20% response rate results to be aligned with other survey-based software engineering investigations (Malavolta et al., 2020). Hence, we are confident that this threat may have only marginally influenced our results, if at all.
Internal validity
Internal validity regards if the observed results are actually due to the treatment. Regarding the experimental subject utilized for the ATDx analysis, i.e., the Apache and ONAP ecosystems, we note that the projects considered may also contain non-Java source code, even if tagged as “Java” software projects on SonarCloud. To mitigate potential threat to internal validity, we consider for the ATDx analysis exclusively SonarQube rules pertaining to Java. To avoid instead potential bias when selecting the ARSQ rules, three researchers were involved in Step 1 of the ATDx building process, their level of agreement was measured statistically, and disagreements were jointly discussed with the help of a third researcher. The same mitigation strategy was also applied for the definition of the Java-based 3-tuples in step 2.
Regarding the survey adopted, an internal threat to validity regards the potential influence that the invitation, ATDx report, and survey text may have had on survey answers. In order to mitigate this threat, all text was kept as neutral and formal as possible. Additionally, survey participants were informed that the survey was completely anonymous, so to allow them to freely express themselves.
A threat to validity which could have affected our results regards maturation (Wohlin et al., 2012). Specifically, the positioning of optional open-ended questions towards the end of the survey may have influenced their response rate. Nevertheless, we prioritized clarity and flow of the survey over this potential threat, and mitigated it by ensuring that answering all survey questions would require as little time as possible.
An incorrect understanding by the participants of the notion of ATD, and its difference from TD, might have negatively influenced the internal validity of our study. To mitigate this threat, we shared with the participants an intuitive definition of ATD at the beginning of both the invitation mail, the ATDx report, and the survey. Such definition was supported by the description of the different architectural technical debt dimension (ATDD) we used, in order to provide the participants with further context on the multiple facets of ATD considered in the study.
Finally, potential selection biases were mitigated by defining a priory a rigorous selection process to identify the portfolios and survey participants used in our empirical evaluation (see ‘Empirical Evaluation Design’). Additionally, to ensure the soundness of the selected participants, a set of demographic questions, including the familiarity with the shared software projects, was included in the survey.
Construct validity
Construct validity regards if our empirical evaluation is appropriate to answer the RQs. A prominent threat to construct validity, presented in ‘Discussion’, regards the evaluation of a specific instance of ATDx in order to evaluate the approach. As this step is required, we could not completely avert this threat, which has to be considered while interpreting the results. To mitigate its influence, we based our ATDx implementation on a widely popular static analyser, a starting set of design-related rules presented in the academic literature (Ernst et al., 2017), and two prominent OSS ecosystems, one of which was already adopted in various other TD studies (Digkas et al., 2017; Lenarduzzi, Saarimaki & Taibi, 2019; Tan, Lungu & Avgeriou, 2018; Li et al., 2020).
Another potential threat to construct validity is constituted by the adoption of OSS software ecosystems as portfolios for the ATDx analysis. To mitigate potential threats related to the selection of the portfolios, we ensured that they included a considerable number of software projects (237 in total), belonged to established OSS organizations (Apache and ONAP), and utilized SonarQube in their continuous integration pipeline. Additionally, for our survey we selected exclusively participants who contributed to at least two software projects of the portfolios, hence allowing them to compare ATDx analysis results across different projects.
A related threat regards the use of the Apache ecosystem as one of the two portfolios considered for our experimental evaluation. In fact, the Apache portfolio covers heterogeneous application domains and is maintained by many different contributors. Similarly, industrial portfolios can comprise hundreds or even thousands of projects (Jeffery & Leliveld, 2004), and hence display a similar variety in terms of project heterogeneity and distribution of developers across projects. Nevertheless considering the Apache ecosystem inhibits us to study one specific characteristic of ATDx, namely the possibility to tailor the results to a specific business domain. This threat was partially mitigated by considering also the ONAP ecosystem, which specifically focuses on network and edge computing services. In any case we note that the lower agreement rate to RQ5 (see Fig. 12) might be partially due to the heterogeneity of projects considered, leading to difficulties in comparing the ATD across the projects the participants contributed to.
In order to mitigate potential threats to mono-operation and mono-method bias described by Wohlin et al. (2012), in our survey design, we formulated it as a mix of open-ended and closed-ended questions, with different questions mapped to each RQ.
External validity
External validity regards whether and to what extent our observations can be generalized. A potential threat to external validity concerns the representativeness of the portfolios selected for our empirical evaluation. As reported in the previous section, we mitigated potential threats to external validity by ensuring that only relevant portfolios, and their contributors, were considered. In addition, the tool on which our experimental instance of ATDx is based, namely SonarQube, is one of the most frequently used static analysis tools for Java-based software projects (Janes, Lenarduzzi & Stan, 2017), making us reasonably confident about the relevance of its rules in real-world projects. Despite our best efforts to mitigate external validity threats, such could potentially influence our obtained results, especially if proprietary portfolios or other source code analysis tools are considered. Future research will naturally further strengthen the external validity of the results reported in this research, e.g., by experimenting with ATDx in industrial settings, and by considering additional source code analysis tools.
Related Work
In this section we discuss the academic and industrial work related to this study. Specifically, we consider as related work approaches aimed at detecting ATD, approaches aimed at providing indexes of ATD and TD, and additional work that share conceptual similarities with ATDx.
To the best of our knowledge, ATDx is the first approach designed to take as input results of other TD identification approaches (e.g., SonarQube in our experimental evaluation) to provide an overview of ATD. In this regard, we can consider ATDx as positioned at a higher level of abstraction than the other state-of-the-art ATD identification approaches. In fact, current ATD-related approaches with similar goals to ATDx are based on the static and/or dynamic analysis of source code. In contrast, ATDx builds on the analysis of precomputed software measures provided by third-party analysis tools, which can be considered as black-box components in ATDx.
Regarding approaches aimed at identifying ATD, numerous software analysis approaches have been proposed during the years. Among the most prominent and current ones, the approach of Arcelli Fontana, Roveda & Zanoni (2016); Martini et al. (2018), and Roveda et al. (2018) focus on the identification of ATD by analyzing dependency architectural smells, which could lead to the emergence of an additional ATDD dimension, namely “Dependency”. Similarly, Kazman et al. (2015); Xiao et al. (2016), and Cai & Kazman (2017) analyzed ATD by inspecting antipatterns of semantically related architectural components, e.g., by the analysis of bug-prone components. Building on the notions presented in such previous studies, in a follow-up research, Cai & Kazman (2019) introduce DV8, a tool designed to measure software modularity, detect architecture anti-patterns, and quantify the maintenance cost of each anti-pattern instance. Among the most prominent differences, ATDx deviates methodologically from the approaches presented in studies reported above by utilizing inter-project severity clustering and semantic aggregation of violations into different ATD dimensions. Another related study of Nord et al. (2012), differentiating from ATDx for the same reasons, presented an ATD metric based on rework associated to changing dependencies of architectural components and values of features delivered. Among the studies considered so far, the most closely related one is the work of Roveda et al. (2018) as it presents another ATD index. Differently from ATDx, this index focuses on architectural smells, notably related to dependency violations.
Le et al. (2018) instead reported an empirical investigation of architectural decay via the analysis of 8 architectural smells of different nature. Interestingly, in such study, smell violation severity is evaluated by adopting interquartile analysis (Tukey, 1977), similar to the first iteration of ATDx (Verdecchia et al., 2020). As a further difference with ATDx, the analysis proposed by Le et al. utilizes intra architectural rule level analysis and values are not normalized per system-size.
More ATD identification approaches are reported in a secondary study of Verdecchia, Malavolta & Lago (2018), albeit none of the included primary studies present an ATD index, with exception of the work of Roveda et al. (2018) previously discussed. In another related survey study, Fontana, Roveda & Zanoni (2016) present a preliminary discussion on technical debt indexes provided by tools. In contrast to the other studies considered so far, the work of Arcelli Fontana et al. focuses on proprietary tools. Among these, the tools that share most commonalities with ATDx are CAST (http://structure101.com/products/workspace/), inFusion7, Sonargraph (https://www.hello2morrow.com/products/sonargraph), and Structure101 (https://structure101.com/). While such tools focus to various extents on ATD and provide indexing capabilities, they are conceptually different with respect to ATDx. In fact, the calculation of the indexes implemented in such tools is generally based on the multiplication of violations’ recurrence times the effort required to fix the violations, rather than relying on a data-driven and inter-project comparison-based severity calculation. For example, the index provided by CAST is calculated by multiplying the number of rule violations times the criticality of the rules violated times the effort required to fix the rule violations. With ATDx, we distantiate from a priori defined rule severity and remediation effort, as recent literature pointed towards their potential inaccuracy (Baldassarre et al., 2020). An additional proprietary tool is the Software Analysis Toolkit (SAT) developed by the Software Improvement Group (SIG) (Kuipers & Visser, 2004). Such tool, similar to ATDx, is intended to carry out software portfolio quality monitoring. Nevertheless, the implementation details, internal workings, and metrics used do not appear to be disclosed to the public. To the best of our knowledge, SAT differentiates from ATDx in multiple ways, e.g., it is not a tool-agnostic approach (as it implements its own quality metrics and rules), and does not consider clustering for dynamic issue severity classification.
Regarding the identification of metrics thresholds, similarly to the first version of ATDx, Alves, Ypma & Visser (2010) adopt an interquartile strategy to identify the severity of metric values. As additional differences, such study does not focus on ATD and, while adopting a system-size normalization strategy, it considers only one level of granularity (NCLOC). Finally, in a recent work, Ulan et al. (2019) proposed a software metric aggregation approach based on their distribution. Our approach is different by (i) adopting a clustering algorithm to determine violation severity, (ii) considering sizes according to distinct granularities, and (iii) clustering results into different semantic dimensions.
From a methodological standpoint, to the best of our knowledge only a handful of approaches related to ATD identification and management were empirically evaluated. In the study of Martini & Bosch (2016) AnaConDebt, a decision-making tool for ATD refactoring is presented. The tool was developed iteratively in collaboration with industrial parties, and was evaluated by applying it 11 times, after which several architects provided feedback based on a survey comprising 6 different questions. The questions of the survey focused primarily on the efficacy of the tool, in terms of usefulness and ATD management support. In contrast to this research ATDx was not developed iteratively, and the empirical evaluation of the approach, focusing on the meaningfulness and actionability of the results, relied on the experience of 47 OSS contributors (for further discussion regarding threats related to the adoption of OSS as experimental subject, refer to ‘Construct validity’). Mo et al. (2018) evaluated DV8, a tool focusing on architecture anti-patterns identification and architectural degradation management, by analyzing 8 industrial projects, presenting the results to 5 practitioners, and follow up with telephone conferences and interviews. A total of 6 questions were posed to the practitioners, focusing on the representativeness of the analysis results, their usefulness, and actionability. While the evaluation goal of DV8 is similar to the of this study, differences can be noted from an evaluation methodology point of view. In fact, the evaluation of DV8 was based on industrial projects, relied on interviews, and comprised a rather small set of participants,. The evaluation of ATDx instead was based on OSS projects, was conducted by utilizing an online survey, and comprised a wider pool of participants. In the work of Arcelli Fontana et al. (2017) the tool Arcan, focusing on architectural smells detection, was validated by analyzing two OSS software projects and presenting the analysis results to 3 professional software designers for each project. The practitioners reported on (i) whether Arcan uncovered known or unknown architectural issues, (ii) whether the issues were actually issues, and (iii) whether refactoring was needed or planned following the analysis results. In this case the validation of ATDx resembles the one of Arcan, as both considered on OSS projects, and evaluated the representativeness of the results. As a rather minute difference, the ATDx evaluation focused on the actionability of the analysis results, while the Arcan evaluation on the plan of action based on the analysis results. As further discussed on the secondary study of Mumtaz, Singh & Blincoe (2020), Arcan results to be the only tool focusing on architectural smells detection that has been empirically validated.
Conclusions and Future Work
Over the years, numerous approaches have been proposed to detect ATD instances present in software intensive-systems. Such methods rely on the analysis of symptoms through which ATD is manifested, and consider ad-hoc definitions of technical debt and software architecture, in order to best fit the conceived analysis processes. When ATD indexes are provided by approaches and proprietary tools, they are most commonly based on formulae considering a priori defined values, such as severity, remediation cost, and metric thresholds, that are potentially prone to human estimation and approximation inaccuracies, and disregard the context of the analyzed software. Furthermore, to the best of our knowledge, such indexes do not aim at providing an encompassing view of the (potentially highly heterogeneous) ATD present in a software-intensive system, but rather focus on a specific facet of ATD.
To fill this gap, in this research we presented ATDx, an approach leveraging the analysis of a software portfolio, pre-computed architectural rule violations, and granularity levels, to compute severity levels of ATD violations via a clustering-based algorithm. Results of ATDx are aggregated into a purely data-driven index, which is composed of different “ATD dimensions”, providing information on the facets of the ATD measured.
In order to evaluate the representativeness and actionability of ATDx, we implemented an instance of the approach based on SonarQube, and run the analysis on two software ecosystems, Apache and ONAP. We then shared the results with targeted contributors, and invited them to participate in a survey designed to collect their feedback on ATDx.
The gathered answers showed that ATDx analysis results are representative, especially when considered for each project individually, and that the used ATD dimensions are an indicative representation of ATD. Results also showed the actionability of the approach, although to a lower extent when compared to the ATDx representativeness.
The collected results are promising, but we deem this investigation as a preliminary step towards the consolidation of ATDx. As future research activities, we envision to mitigate potential threats to validity associated to our results by conducting further empirical experimentation by considering also e.g., proprietary portfolios, different programming languages, source-code analysis tools, and software domains. Additionally, based on our findings, we envision to enhance the reporting capabilities of results, in order to strengthen its actionability, and directly support a set of selected usage scenarios, e.g., by enabling the composition of the analysis with continuous integration pipelines, issue trackers, and providing a finer-grained scrutiny of the results via a dedicated dashboard.
As an evolution of ATDx, we plan to implement a “light” version of ATDx. Such version, simply referred to as “ATDx light”, will move away from the ART severity calculation via clustering, in order to eliminate the requirement of having at disposal a software portfolio to analyze a single SUA. More specifically, ATDx light will still leverage the semantic clustering of ART rules into different ATDDD dimensions but, in contrast to ATDx, will derive severities based on the ones provided by the utilized tool(s) T or, if not available, on the simple cumulative values of ART violations.
In conclusion, with ATDx we do not aim at providing a “silver bullet” to identify the ATD present in a software-intensive system: the multifaceted nature of ATD comprises a plethora of different ATD items, symptoms, causes, and consequences, which hinders a holistic general-purpose approach. Rather, with ATDx we strive for the establishment of a sound, comprehensive, and intuitive architectural view of the ATD detectable via source-code analysis, which helps facilitate conversations, understanding, and awareness of the current state of ATD in software-intensive systems.