
Tolerance-based interaction: a new model targeting opinion formation and diffusion in social networks
- Published
- Accepted
- Received
- Academic Editor
- Filippo Menczer
- Subject Areas
- Network Science and Online Social Networks, Scientific Computing and Simulation, Social Computing
- Keywords
- Social networks, Opinion diffusion, Phase transition, Discrete event simulation, Tolerance
- Copyright
- © 2016 Topirceanu et al.
- Licence
- This is an open access article distributed under the terms of the Creative Commons Attribution License, which permits unrestricted use, distribution, reproduction and adaptation in any medium and for any purpose provided that it is properly attributed. For attribution, the original author(s), title, publication source (PeerJ Computer Science) and either DOI or URL of the article must be cited.
- Cite this article
- 2016. Tolerance-based interaction: a new model targeting opinion formation and diffusion in social networks. PeerJ Computer Science 2:e42 https://doi.org/10.7717/peerj-cs.42
Abstract
One of the main motivations behind social network analysis is the quest for understanding opinion formation and diffusion. Previous models have limitations, as they typically assume opinion interaction mechanisms based on thresholds which are either fixed or evolve according to a random process that is external to the social agent. Indeed, our empirical analysis on large real-world datasets such as Twitter, Meme Tracker, and Yelp, uncovers previously unaccounted for dynamic phenomena at population-level, namely the existence of distinct opinion formation phases and social balancing. We also reveal that a phase transition from an erratic behavior to social balancing can be triggered by network topology and by the ratio of opinion sources. Consequently, in order to build a model that properly accounts for these phenomena, we propose a new (individual-level) opinion interaction model based on tolerance. As opposed to the existing opinion interaction models, the new tolerance model assumes that individual’s inner willingness to accept new opinions evolves over time according to basic human traits. Finally, by employing discrete event simulation on diverse social network topologies, we validate our opinion interaction model and show that, although the network size and opinion source ratio are important, the phase transition to social balancing is mainly fostered by the democratic structure of the small-world topology.
Introduction
Social network analysis is crucial to better understand our society, as it can help us observe and evaluate various social behaviors at population level. In particular, understanding the social opinion dynamics and personal opinion fluctuation (Golbeck, 2013; Geven, Weesie & Van Tubergen, 2013; Valente et al., 2013) plays a major part in fields like social psychology, philosophy, politics, marketing, finances and even warfare (Easley & Kleinberg, 2010; Pastor-Satorras & Vespignani, 2001; Fonseca, 2011). Indeed, the dynamics of opinion fluctuation in a community can reflect the distribution of socially influential people across that community (Kempe, Kleinberg & Tardos, 2003; Hussain et al., 2013; Muchnik, Aral & Taylor, 2013); this is because the social influence is the ability of individuals (agents) to influence others’ opinion in either one-on-one or group settings (Maxwell, 1993; Wang & Chen, 2003; McDonald & Wilson, 2011). Without social influence, the society would have an erratic behavior which would be hard to predict.
Existing studies on opinion formation and evolution (Axelrod, 1997; Riolo, Cohen & Axelrod, 2001; Acemoglu et al., 2013; Yildiz et al., 2013; Valente et al., 2013; Hussain et al., 2013; Guille et al., 2013; Ruan et al., 2015) rely on the contagion principle of opinion propagation. However, such studies offer limited predictability and realism because they are generally based on opinion interaction models which use either fixed thresholds (Deffuant et al., 2000; Javarone & Squartini, 2014), or thresholds evolving according to simple probabilistic processes that are not driven by the internal state of the social agents (Fang, Zhang & Thalmann, 2013; Deng, Liu & Xiong, 2013). To mitigate these limitations, we reveal new dynamical features of opinion spreading. The consistent and recurring real-world observations are then explained by introducing a new social interaction model which takes into account the evolution of individual’s inner state. We finally validate the proposed model by analyzing empirical data from Yelp, Twitter and MemeTracker, and by using our opinion dynamics simulation framework—SocialSim1 (Topirceanu & Udrescu, 2014)—which includes multiple complex topological models, as well as customizable opinion interaction and influence models. Consequently, our main contributions are threefold:
-
Identification of four distinct phases in opinion formation: this aspect is not entirely captured by existing models (Sznajd-Weron & Sznajd, 2000; Li et al., 2012; Acemoglu et al., 2013; Chen, Wang & Li, 2014; Guille et al., 2013; Fang, Zhang & Thalmann, 2013) although previous research (Hołyst, Kacperski & Schweitzer, 2000) has noticed that there are some stages in opinion evolution. We argue that the succession of opinion formation phases is critical to the social balancing phenomenon (i.e., the general opinion becomes stable despite constant local oscillations). We also identify a phase transition from an unstable opinion to social balancing which is related to the dynamics of opinion formation phases.
-
Modeling opinion dynamics: we propose a new graph and threshold based interaction model with stubborn agents (SA) (Acemoglu & Ozdaglar, 2011) which is able to reproduce the phenomena that we observe in real-world datasets. Inspired by social psychology, our new model assumes that individual’s willingness to accept new opinions (i.e., tolerance) changes over time according to his/her inner state.
-
Validation of the newly proposed tolerance model via our discrete-event simulator SocialSim (Topirceanu & Udrescu, 2014). The analysis we provide reveals the deep connection between social balancing and the relevant parameters of social networks such as network size, topology, and opinion source ratio (i.e., stubborn agents distribution)(Acemoglu et al., 2013); this correlates well with our empirical observations on large social networks.
Taken together, these new contributions show that opinion dynamics in social networks exhibit specific patterns that depend on network size and ratio of stubborn agents (which we consider to be opinion sources), as well as underlying network topology. Consequently, our findings can be used to improve our understanding of opinion formation and diffusion in social networks, and predictability of social dynamics.
Methods
Our empirical analysis is based on three full datasets from the SNAP online collection2 and Yelp,3 which contain opinion fluctuation data with time information.
The Yelp dataset: contains graded (1–5 stars) user reviews of American businesses, each with a timestamp. One can obtain insights on the popularity of a business at a given time. The usable information is the number of reviews at a given moment in time (interpreted as network size of individuals with an opinion), the average grade in time (the average opinion over time), and the number of votes to each review (ratio of agents with strong or “stubborn” opinions, because when an agent votes, his opinion is already made up). The dataset contains 366,715 users, 61,814 businesses and 1,569,264 reviews. Out of this data, we processed and filtered businesses with at least 100 reviews (i.e., we need a significant number of reviews for a relevant dynamical analysis). As such, we obtained 2,331 businesses for further analysis.
MemeTracker and Twitter hashtags with time information from the Stanford Large Network Dataset Collection (SNAP); which contain the history (repost rate in time) of diverse, popular hashtags. We can use this data to analyze the evolution of a particular opinion in time. MemeTracker phrases are the 1,000 highest total volume phrases among 343 million phrases collected within 2008–2009. Twitter hashtags are the 1,000 highest total volume hashtags among 6 million hashtags from Jun–Dec 2009. We filtered the Twitter and MemeTracker data so that only the memes or hashtags which can be related to opinions remain, e.g., we have excluded those related to rare events like natural disasters. As such, we rendered a number of 500 re-tweets and 500 hashtags for further processing.
Discrete simulation methodology
We test and validate our new opinion interaction model based on tolerance with the Java-based opinion dynamics simulator SocialSim (Topirceanu & Udrescu, 2014).
Like any discrete event simulation, we define the salient properties of the experimental setup which was used to obtain the simulation results. Events are synchronized by the simulation clock; we call the period of this clock a simulation day. One day is a simulation period in which agents can interact with their neighbors. However, an agent does not interact daily; in fact, each agent picks a random number of days to be inactive after each active day. In our simulation, we use a random timeout interval between 1 day and 50 days. Only after this time has elapsed, will an agent interact again with one random neighbor. After that interaction, the agent will again choose to be inactive for a random period of days.
Results
By analyzing data on opinion evolution using Twitter and MemeTracker hashtags, as well as user reviews and votes for local businesses from Yelp, we identify unique temporal patterns in all these datasets. When defining phases of opinion dynamics, we are tracking the opinion change of the social networks, denoted as ω. For Yelp there is a clear link between the opinion state of the participants (denoted as s) and the number of stars awarded by the users. We also assume that Yelp users are agents in a social network with a typical structure; this underlying social network influences opinion dynamics in Yelp. As such, opinion change is simply the variation in time of the stars awarded by users: ω = s(t) − s(t − 1). For the Twitter and MemeTracker datasets, we interpret the number of replies as a proxy for opinion strength, e.g., more replies indicate a stronger opinion. When previously unopinionated people reply or re-tweet, they do so because they have formed a clear opinion on a particular subject (say, reflected in a hashtag) and they feel the need to express it publicly. As such, the assumption is that we can interpret the change in the number of people that retweet or reply to a hashtag as representing the opinion change ω.
Opinion formation phases and social balancing
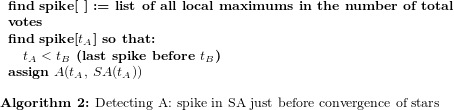
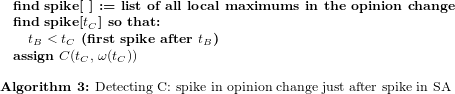
Using the Yelp context, we explain how the opinion formation phases (I-initiation, F-fusion, T-tolerance and -intolerance) are detected. For each business, we have automatically detected all spikes in the number of total votes (interpreted as opinion sources which never change their state, or stubborn agents SA) and have corroborated these with the point at which the state (average stars) has a variation of less than 1 star between maximum and minimum stars awarded. The reason behind considering the variation interval is that 1 star is the psychological threshold represented by the unit of measurement. Using an algorithmic explanation, we describe the pseudocode for detecting three points of interest—A (start of convergence of state), B (spike in SA concentration just before the convergence of state), C (spike in opinion change just after the spike in SA). 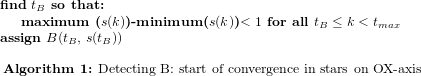
By automatically performing this methodology on all 2,331 businesses, we find that the average distance between the closest spike on the time axis OX (point A in the example from Fig. 1) which occurred before the convergence of stars (i.e., point B in Fig. 1, where the variation of awarded stars becomes lower than 1 star) is dconv = 4.131 time units. Distance dconv is relatively small with respect to the observation interval of 100 time units or days, suggesting the fact that spikes in SA trigger a (shortly delayed) convergence of stars.
Further, we show that the spike in SA (point A) also triggers a maximum spike in the opinion change (point C). By running this methodology on all businesses, we obtain an average distance between the spike in SA and maximum spike in opinion change of dfusion = 4.828 time units. These statistical results support the fact that spikes in SA trigger a maximum spike in opinion change.
Moreover, when we corroborate the average delays between the spike in SA and spikes in stars and opinion change, namely 4.131 and 4.828 time units, we can conclude that the convergence of opinion and the fusion phase are distanced, on average, by only dcorr = 0.697 time units. Backed up by this data, we can admit that the convergence of opinion (point B) and the triggering of the fusion phase (point C) are closely correlated.
Apart from the above statistical analysis, in order to improve the readability of our insight, we also present an illustrative example. As such, in Fig. 1, the phase transition happens at OX = 28 (point A) as the spike in the total votes (green line) coincides with a delayed stabilization (point B at OX = 33) of the average stars awarded (blue line). The triggered spike in opinion change is marked with point C (at OX = 32).
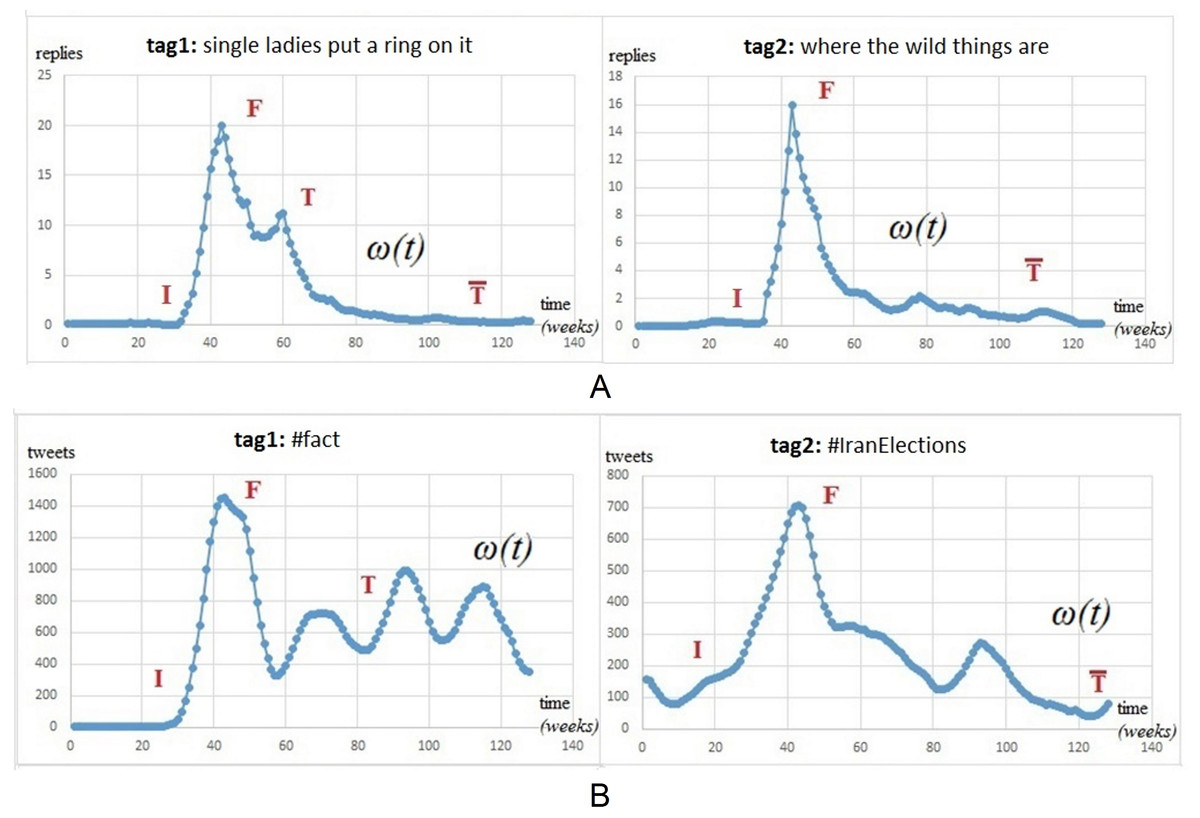
We also extend our interpretation of Yelp dynamics in terms of opinion change ω by presenting some relevant examples from Twitter and MemeTracker datasets. Figure 2 illustrates a few cases of memes that can be related to users opinion about, for instance, Beyonce’s song (“single ladies put a ring on it”), a movie (“where the wild things are”), or the significance of elections outcome (#IranElections).
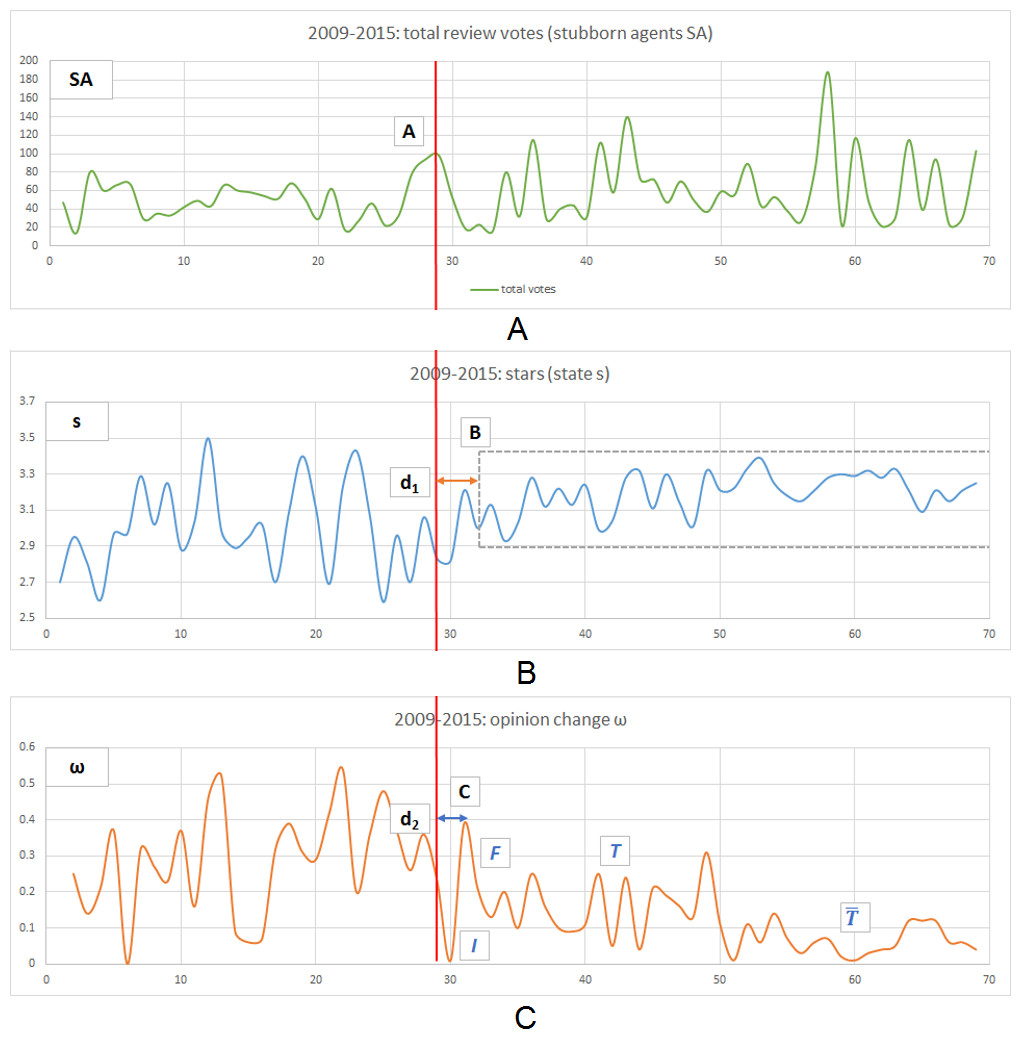
Figure 1: Representative example for the evolution of reviews count and reviews votes for a popular businesses on Yelp.
(A) The ratio of review votes with respect to the review count, represented with the green line, is interpreted as stubborn agent SA (or opinion source) concentration. (B) The average user defined popularity of the respective business over the same period of time represents the state of the social network. (C) The variation of the stars (blue) is represented with orange and it is interpreted as the participants opinion change ω. Point A depicts the SA concentration which triggers the delayed convergence in opinion (point B), and spike in opinion change (point C). In this example we have A(OX = 28), B(OX = 33), C(OX = 32), d1 = 5, d2 = 4.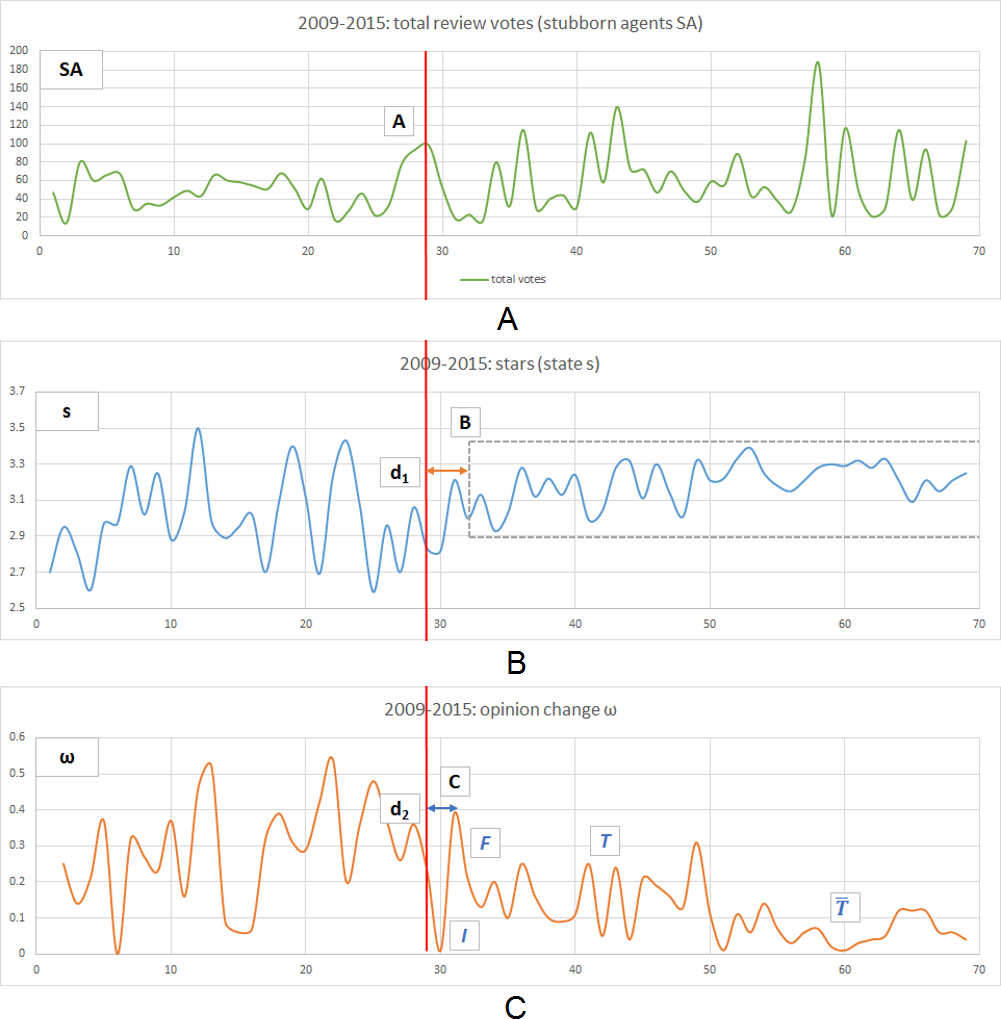
Inspired by a similar approach on Twitter data (Lehmann et al., 2012), we have conducted a statistical analysis on all three datasets. Using all datasets from Twitter (1,000 hashtags), MemeTracker (1,000 keywords) and Yelp (2,331 businesses) we have algorithmically detected the following characteristic phases in the opinion dynamics:
-
Fusion (2nd phase) is the spike centered around the previously detected point C(tC, ω(tC)) with tC being the time projection and ω(tC) the corresponding opinion change of point C. For convenience, we will refer to the local spike in opinion change ω(tC) as fs (fusion spike).
-
Initiation (1st phase): starting from time k = 0 (on OX-axis), find 0 ≤ k < tC so that ω(k) < 0.5 ⋅ fs AND ω(k + 1) > 0.5 ⋅ fs. In other words, time k represents the first point at which the opinion change ω exceeds 50% of the fusion spike fs. We have used this threshold value because it represents the half amplitude of the fusion phase, which it precedes.
-
Intolerance (4th phase): starting from time k = tmax (the highest registered time on the OY-axis), find tC < k < tmax so that ω(k) < 0.1 ⋅ fs AND ω(k − 1) > 0.1 ⋅ fs. In other words, time k represents the first point, from end to beginning of time, at which ω exceeds 10% of the fusion spike. We consider that a social network reaches intolerance if tolerance θ < 0.1, so we use the 10% threshold for opinion change. Any higher than 10%, and opinion change is still in the tolerance phase, any lower, and opinion change is likely to converge towards 0.
-
Tolerance (3rd phase): starting from time k = tC + 1 (start of social balance), find tC < k < tmax so that ω(k) > 0.1 ⋅ fs AND ω(k + 1) < 0.1 ⋅ fs (end of social balance). In other words, time k represents the point at which ω decreases below the 10% threshold which we consider a transition into the intolerance phase.
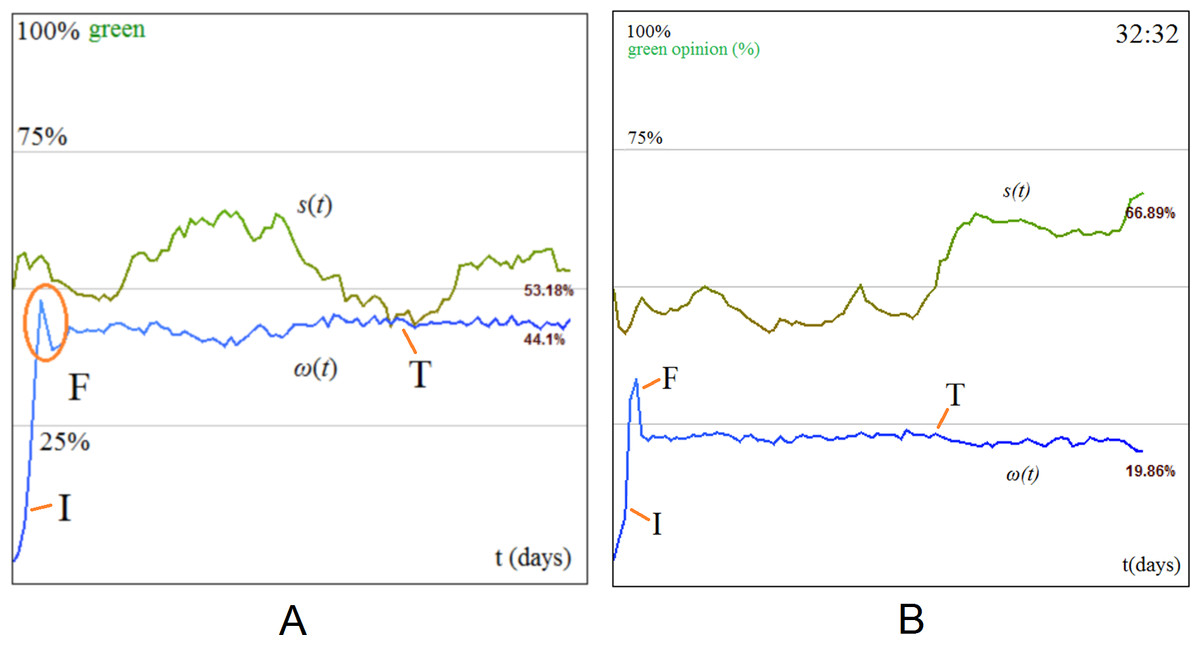
Figure 2 displays the popularity of two hashtags on MemeTracker and Twitter, expressed as posts/time evolution (posts are replies and tweets). Based on the observed fluctuations, we identify the following phases in opinion formation: an initiation phase (I) when new opinions are injected into the social network and the number of replies starts to increase rapidly; a fusion phase (F) when the opinion dynamics reaches a maximum and different opinions start to collide; a tolerance phase (T) which represents a fluctuating yet convergent behavior; and, occasionally, an intolerance phase () when the fluctuations of opinion decrease and converge towards zero. Based on network topology and/or ratio of opinion sources, the diffusion process may reach the fourth phase of intolerance. Opinion sources, or stubborn agents (Acemoglu, Ozdaglar & Yildiz, 2011; Acemoglu et al., 2013), are agents within the social network (i.e., Twitter or Yelp users) who try to instill a certain opinion by influencing their peers; they are represented by those people within the network who hold strong opinions that do not change over time. The concentration of opinion sources is expressed as their ratio relative to the entire population.
Additionally, the analysis of Twitter and MemeTracker results in Fig. 2 shows that all tags exhibit a clear F phase (first spike). In Fig. 2B, tag 2 converges towards intolerance ( phase), while tag 1 enters a balanced oscillation (T phase) which supports the empirical observation of a phenomenon that we call social balancing, i.e., oscillations at microscopic scale of individuals opinion become stable and predictable at the macroscopic scale of the society. As such, social balancing is defined as the succession of I − F − T phases, whereas social imbalance occurs if either the society does not reach T or, after reaching T, it decays into a phase. For example, tag 2 (#IranElections) in Fig. 2B has a shorter, more abrupt oscillation. In this case, we consider that the number of opinion sources is not high enough (i.e., above a critical threshold) for social balancing to happen. Tag 2 is an example of social imbalance with a decisive crystallization of just one opinion, as there is no T phase.
The averages of opinion change obtained for each considered dataset and for each phase are the following (their representation is given in Fig. 3). Within square brackets are the minimum, maximum and standard deviation for each statistical average:
-
Twitter: initiation starts at OX = 0 and ends and OX = 33 [0, 39, 9.06], and has an average amplitude OY = 21% [0%, 49%, 5.08]. Fusion happens at OX = 42 and has an amplitude of 100% (i.e., it represents the maximum spike). Tolerance starts on average at OX = 48 (43, end of time series, 4.07), and has an average amplitude OY = 44% [13%, 83%, 4.01]. Intolerance starts on average at OX = 68 (44, end of time series, 26.54), and has an average amplitude OY = 5% [0%, 21%, 4.06].
-
MemeTracker: initiation starts at OX = 0 and ends and OX = 37 [0, 40, 6.24], and has an average amplitude OY = 13% [0%, 49%, 10.59]. Fusion happens at OX = 42 and has an amplitude of 100% (i.e., it represents the maximum spike). Tolerance starts on average at OX = 50 (43, end of time series, 4.88), and has an average amplitude OY = 56% [45%, 97%, 3.90]. Intolerance starts on average at OX = 62 (44, end of time series, 17.95), and has an average amplitude OY = 5% [2%, 20%, 3.74].
-
Yelp (all measurements are translated to the left on the time axis so that t = 0 coincides with the spike in SA, namely point A): initiation starts at OX = 0 and ends and OX = 2 [0, 6, 2.1], and has an average amplitude OY = 0.34 [0.1, 1.35, 0.14] stars. Fusion happens at OX = 6 [3, 23] and has an amplitude of OY = 2.25 [0.93, 4.9] stars. Tolerance starts on average at OX = 33 [15, 73], and has an average amplitude OY = 0.475 [0.275, 1.36] stars. Intolerance starts on average at OX = 77 [47, end of time series], and has an average amplitude OY = 0.175 [0.095, 0.46] stars.
By corroborating the four obtained intervals, and also by analyzing the shapes rendered in Fig. 3, on both the OX axis (time axis) and OY axis (opinion change), we can conclude that the four phases recurrent in all datasets and, indeed, representative for opinion formation.
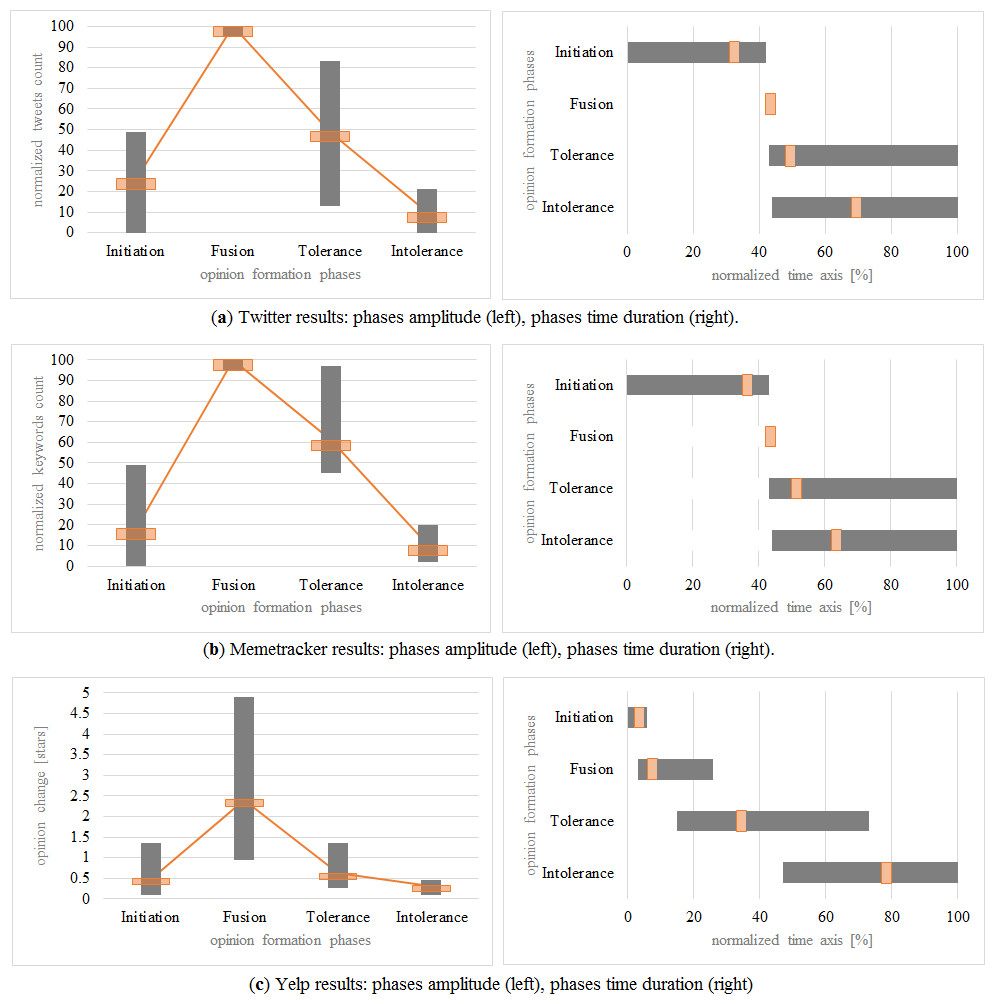
Figure 3: The four opinion formation phases represented in terms of: normalized amplitude (number of tweets/maximum number of tweets or opinion change in Yelp/maximum opinion change in stars), with each bar-plot depicting the minimum, maximum and average variation of opinion change; and time duration (on OX time-axis), with each horizontal bar depicting the minimum, maximum durations of the phase (gray), and the time at which it occurs on average (orange).
All datasets indicate the same shape of opinion dynamics and the same succession of phases: I-initiation, F-fusion, T-tolerance and -intolerance.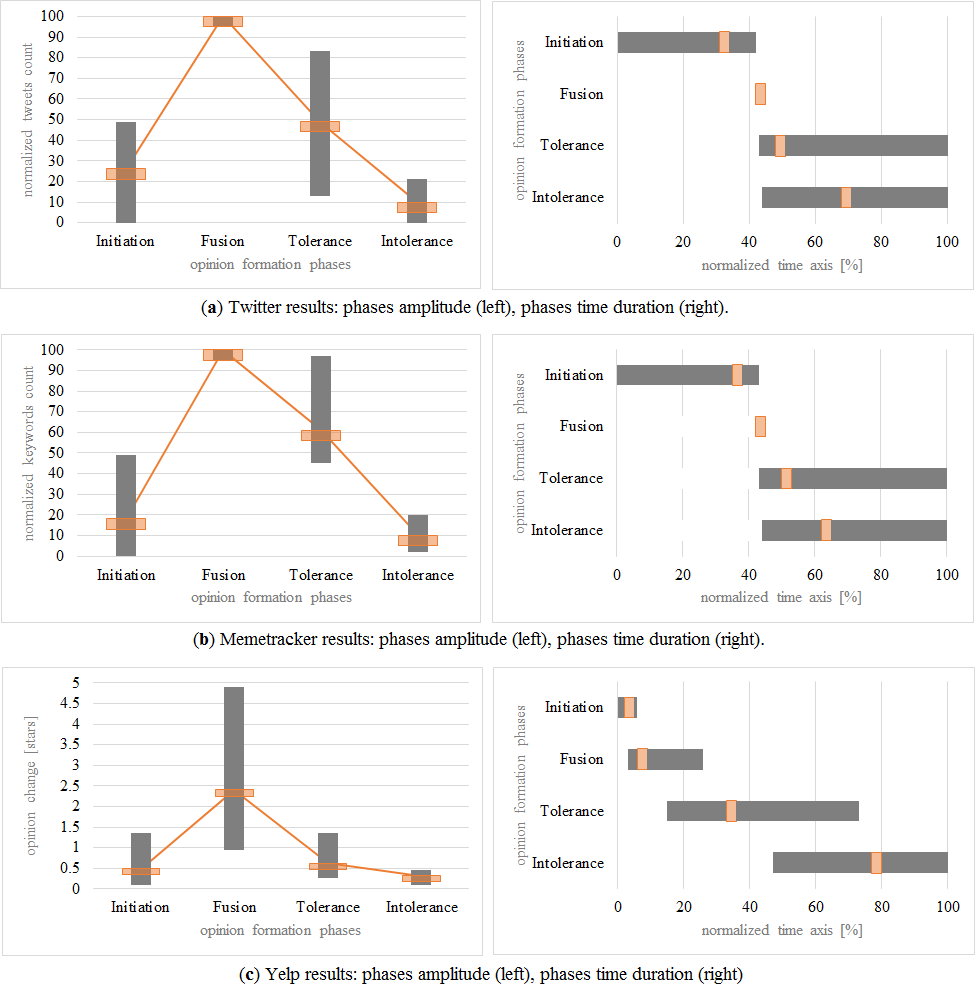
Phase transition
With data from Yelp, we show the effects of a phase transition from social instability to social balancing which can occur when a critical concentration of opinion sources is reached in a social network. Figure 1 highlights the fact that opinion (i.e., the stars given by users to a particular business) stabilizes only after reaching a critical ratio of opinion sources (i.e., votes representing strong opinions). This can be viewed in Fig. 1 at time point OX = 28. We interpret this phenomenon as a rise beyond a σ threshold for the concentration of opinion sources, which determines the social balancing, i.e., the average opinion stabilizes despite of opinion oscillations at local level.
Corroborating all these empirical observations with the statistical analysis, we can state that Twitter and MemeTracker illustrate a responsive type of behavior, i.e., an immediate evolution towards the F phase, so a high opinion change is quickly reached for a relatively small ratio σ of opinion sources. This behavior, in turn, correlates well with another study which shows that Twitter online networks have a strong random and small-world component (Duma & Topirceanu, 2014).
In contrast, the Yelp dataset can be associated with a saturated type of behavior, as the ratio σ (relative to the maximum number of votes) needed to trigger the phase transition towards social balancing is high in all three cases. Balancing does not occur until a high concentration of opinion sources (we interpret them as similar to opinion-influencing “stubborn agents” (Acemoglu et al., 2013) or “blocked nodes” (Ruan et al., 2015)) are inserted into the social network.
New tolerance-based opinion model
This section analyzes the characteristics of a new opinion model that can reproduce this kind of real-world phenomena, i.e., the four opinion formation phases and phase transition towards social balancing. Our interaction model is tested on synthetic networks and compared to the empirical data—introduced in the previous section—through qualitative means.
In terms of network structure, our analysis includes the basic topologies such as mesh, random (Erdös & Rényi, 1960), small-world (Watts & Strogatz, 1998), and scale-free networks (Barabási & Albert, 1999). Also, based on the last decade of research on realistic social network topology generation which either adds the small-world property to scale-free models (Holme & Kim, 2002; Fu & Liao, 2006; Li, Qian & Wang, 2012), or adds a power-law degree distribution to the small-worlds (Jian-Guo, Yan-Zhong & Zhong-Tuo, 2006; Chen, Zhang & Huang, 2007; Wang & Rong, 2008; Zaidi, 2013), we also consider the Watts–Strogatz with degree distribution (WSDD) (Chen, Zhang & Huang, 2007).
In terms of opinion dynamics, we rely on a predictive opinion interaction model that can be classified as being graph- and threshold-based (Guille et al., 2013). Generally speaking, previous models use fixed thresholds (Javarone & Squartini, 2014; Biswas et al., 2011; Li et al., 2012; Das, Gollapudi & Munagala, 2014; Li et al., 2013) or thresholds extracted from real-world examples (Galuba et al., 2010; Saito et al., 2011). However, there are a few models which use dynamic thresholds (Fang, Zhang & Thalmann, 2013; Deng, Liu & Xiong, 2013; Li et al., 2011), but their evolution is not driven by the internal states of the social agents. On the other hand, our empirical references (i.e., Twitter, MemeTracker and Yelp) indicate that opinion does not cease to oscillate and consensus is a rare case in real world. Therefore, we propose an opinion interaction model based on stubborn agents, because it assumes that the society does not reach consensus. Based on recent research on stubborn agents which use a discrete (Yildiz et al., 2013) or continuous (Acemoglu et al., 2013) representation of opinion, we integrate the following opinion models: one-to-one (simple contagion) versus one-to-many diffusion (complex contagion) (Centola & Macy, 2007), and discrete (0 or 1) versus continuous (0–1) opinion representation. By combining opinion representation and opinion diffusion, we obtain 4 distinct models; they are defined in Fig. 4A and exemplified in Figs. 4B and 4C. We build our tolerance-based opinion interaction model by using the SD (1) and SC (2) opinion representations as defined in Fig. 4A.
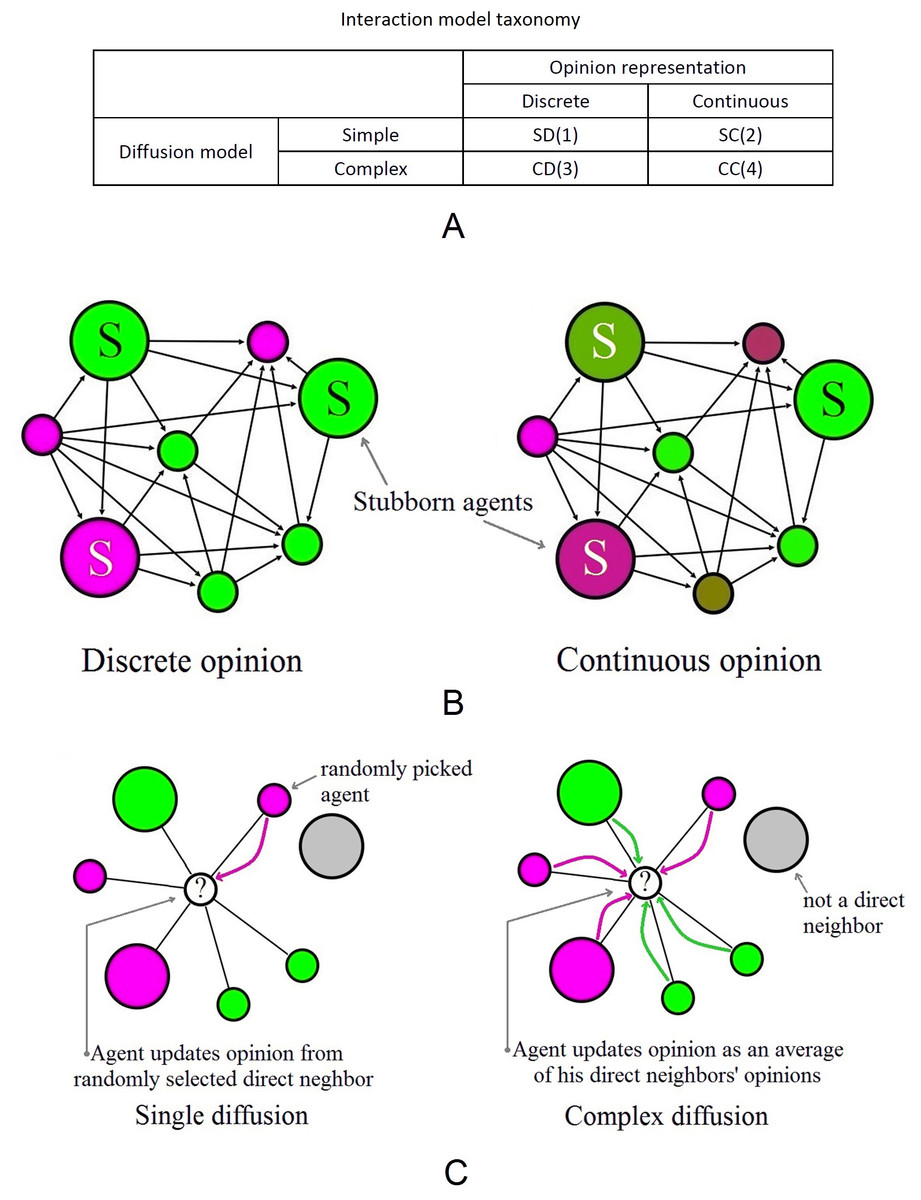
Figure 4: The interaction models, based on the two types of opinion representation and two types of diffusion.
(A) Taxonomy. (B) Opinion representation types where the larger nodes (labeled with S) represent stubborn agents (or opinion sources) which can also have any value for opinion, with the property that their opinion value never changes. Discrete opinion (left): nodes have opinion 0 (red) or 1 (green) at any time (SD). Continuous opinion (right): nodes have any opinion between 0 and 1, highlighted by the color gradient transitioning from red to green (SC). (C) A scenario highlighting the two opinion diffusion models for discrete representation. Single diffusion (left): the central white node picks one random neighbor and adopts his opinion (SD). Complex diffusion (right): the white node polls all neighbors for their opinion and then adopts an averaged opinion (CD). Note that only direct neighbors can influence opinion, not friends of friends etc. (e.g., the gray node).
Given a social network G = {V, E} composed of agents V = {1, 2, …, N} and edges E, we define the neighborhood of agent i ∈ V as Ni = { j ∣ (i, j) ∈ E}. The disjoint sets of stubborn agents V0, V1 ∈ V (opinion sources), and null agents Vnull ∈ V (non-participants with no opinion) never change their opinion, while all other (regular) agents V ∖{V0∪V1∪Vnull} update their opinion based on the opinion of one or all of their direct neighbors.
We use xi(t) to represent the real-time opinion of agent i at time t. Normal (regular) agents can start with a predefined random opinion value xi(0) ∈ [0, 1]. The process of changing the opinion of regular agents is triggered according to a Poisson distribution and consists of either adopting the opinion of a randomly chosen direct neighbor, or an averaged opinion of all direct neighbors.
We represent with si(t) the discrete opinion of an agent i at moment t having continuous opinion xi(t). In case of the discrete opinion representation SD (1) (Fig. 4A), xi(t) = si(t); in case of the continuous opinion representation SC (2) (Fig. 4A), si(t) is given by Eq. (1). (1)
Furthermore, s(t) denotes the average state of the population at a certain time t by averaging the opinion of all individual agents i ∈ V. (2)
The previous social interaction models (Deffuant et al., 2000; Javarone & Squartini, 2014; Li et al., 2012; Chau et al., 2014; Das, Gollapudi & Munagala, 2014; Fang, Zhang & Thalmann, 2013; Li et al., 2011) do not assign nodes (i.e., individuals or social agents) the basic properties of humans, i.e., humans evolve, learn, react, and adapt in time. The reason for the simplicity behind the existing models is twofold: first, the state-of-the-art models are only suited for theoretical contexts so bringing additional complexity to the interaction model would significantly increase the difficulty of mathematical analysis; second, involving measures of human personality (e.g., quantifying an individuals trust, credibility, or emotional state) is a complicated endeavor, in general; this was not the main goal of previous work.
Individual tolerance: interpretation and formalism
In order to improve the existing opinion interaction model based on a fixed threshold, we consider the evolution of personal traits by taking inspiration from social psychology. As a new contribution to the state-of-the-art, we introduce the concept of tolerance which reflects the individual’s inner state and personal beliefs regarding surrounding opinions. For instance, egocentrism, as it is called in psychology, is highly correlated with individual’s emotional state (Elkind, 1967). We choose to extend this model because the egocentrism-emotional state correlation is a trait that has been shown to influence and evolve with individual opinion (Windschitl et al., 2008).
Corroborating literature on attitude certainty (Clarkson et al., 2013), consensus (Clarkson et al., 2013), confirmation bias (Nyhan & Reifler, 2010), social group influence (Roccas & Amit, 2011), and ingroup emotion (Moons et al., 2009), we extrapolate the mechanism that leads to the formation of opinion into a measurable parameter. As such, we define tolerance θ as a parameter that reflects the willingness of an agent to accept new opinions. Similar to real life, individuals with higher tolerance will accept the others opinion easier; thus, this parameter can be defined as a real number 0 ≤ θ ≤ 1. An agent with a tolerance value of 1 is called fully tolerant, whereas an agent with a tolerance of 0 is called fully intolerant (i.e., stubborn agent). Tolerance values which are greater than 0.5 describe a tolerance-inclined agent, while values smaller than 0.5 describe an intolerance-inclined agent.
Similar to the threshold-based continuous opinion fluctuation model described by Acemoglu et al. (2013), tolerance can be used as a trust factor for an agent relationship; however, as opposed to the trust factor, tolerance changes its value over time: (3) where the new opinion xi(t) is a weighted sum of the agent’s prior opinion xi(t − 1) and the current opinion xj(t) of one randomly selected direct neighbor. The weights for the two opinions are given by the current tolerance θi(t) of the agent, thus, the extent of how much it can be influenced depends on its internal state.
As can be inferred from Eq. (3), the greater the tolerance of an agent, the easier it can accept external opinions from others. At the beginning of the opinion formation process (t = 0), all agents are considered as having a high tolerance (θi(0) = 1), but, as the society evolves, agents become intolerant, therefore segregated in clusters which tend to have a more stable opinion. We further define the tolerance θ of the entire population as a normalized average of all individual tolerances: (4)
We also introduce the concept of opinion change ω as the ratio of agents which have changed their current state (discrete time step t) since the last observation (time t − 1): (5) If an agent changes its state from one opinion to another, then the absolute difference |si(t) − si(t − 1)| will be 1; conversely, it will be 0 if the agent state does not change. This change, averaged over all agents at the interaction (discrete) moment t, defines the opinion change of the population ω(t). This metric is used to draw insights regarding the current tolerance level across the entire society.
Progressive tolerance model
Our model for tolerance evolution stems from the idea that the evolution towards both tolerance and intolerance varies exponentially (Hegselmann & Krause, 2002; Weidlich, 2002), e.g., a person under constant influence becomes convinced at an increased rate over time. If that person faces an opposing opinion, it will eventually start to progressively build confidence in that other opinion. Thus, our proposed progressive model represents the tolerance fluctuation as a non-linear function, unlike other models in literature. For the first time, we integrate these socio-psychological characteristics in the dynamical opinion interaction model; as such, the new tolerance state is obtained as: (6) In Eq. (6), tolerance decreases by a factor of α0ε0 if the state of the agent before interaction, si(t − 1), is the same as the state of the interacting neighbor (randomly chosen from all direct neighbors) sj(t). If the states are not identical, i.e., the agent comes in contact with an opposite opinion, then the tolerance will increase by a factor of α1ε1. Variable t represents the time step where an opinion update is triggered; these moments are considered as being randomly distributed. The two scaling factors, α0 and α1, both initially set as 1, act as weights (i.e., counters) which are increased to account for every event in which the initiating agent keeps its old opinion (i.e., tolerance decreasing), or changes its old opinion (i.e., tolerance increasing). Therefore, we have: (7) (8) On even terms with the observation of the majority illusion (Lerman, Yan & Wu, 2015), which explains that globally rare opinions and bias may be strongly present in local neighborhoods as a result of the topology of social networks, we dynamically model bias using the two scaling factors α0 and α1. Whenever an event occurs, the counter corresponding to the other type of event is reset. These factors are used to increase the magnitude of the two tolerance modification ratios ε0 (intolerance modifier weight) and ε1(tolerance modifier weight). The two ratios are chosen with the fixed values of ε0 = 0.002 and ε1 = 0.01. To determine these values, we have tried various ε0 : ε1 ratios as follows: if ε0 is increased such that ε0 : ε1 = 1 : 1, most nodes will quickly become intolerant, as opinion will cease to diffuse; conversely, if ε0 is decreased closer to a 1:10 ratio, then the society will become tolerance-inclined, with random opinion fluctuations. The used ε0 : ε1 ratio of 1:5 was chosen through consistent experimentation in order to provide a good balance between the deviations towards tolerance and intolerance, respectively.
As an illustration of the 1:5 ratio for ε0 : ε1, Fig. 5 represents the non-linear tolerance function as implemented in Eq. (6). The displayed examples show that a total of 10 consecutive steps are required to maximize the tolerance if an agent starts with θi(0) = 0.5, because the cumulative sum of reaches 1 after 10 iterations. Similarly, in Fig. 5B, the sum requires t = 45 iterations to reach intolerance (θi(t) = 0), having started from θi(0) = 1.
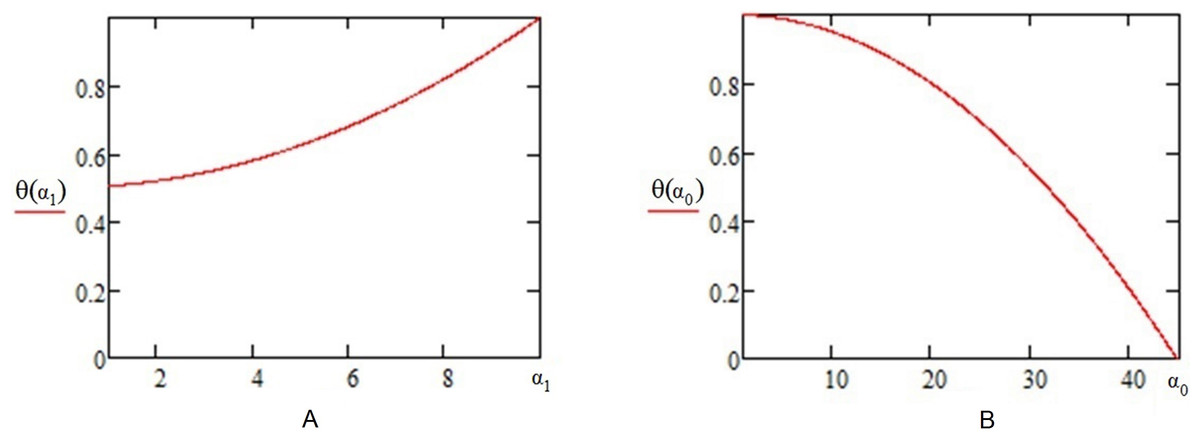
Figure 5: The tolerance function as defined by the progressive tolerance model.
(A) Tolerance scaling: shows how tolerance θ increases with the α1ε1 scaling, as a result of continuous opinion change for an agent i. (B) Intolerance scaling: shows how tolerance θ drops with the α0ε0 scaling, from an initial tolerance θi(0) = 1 to complete intolerance (θi(t) = 0).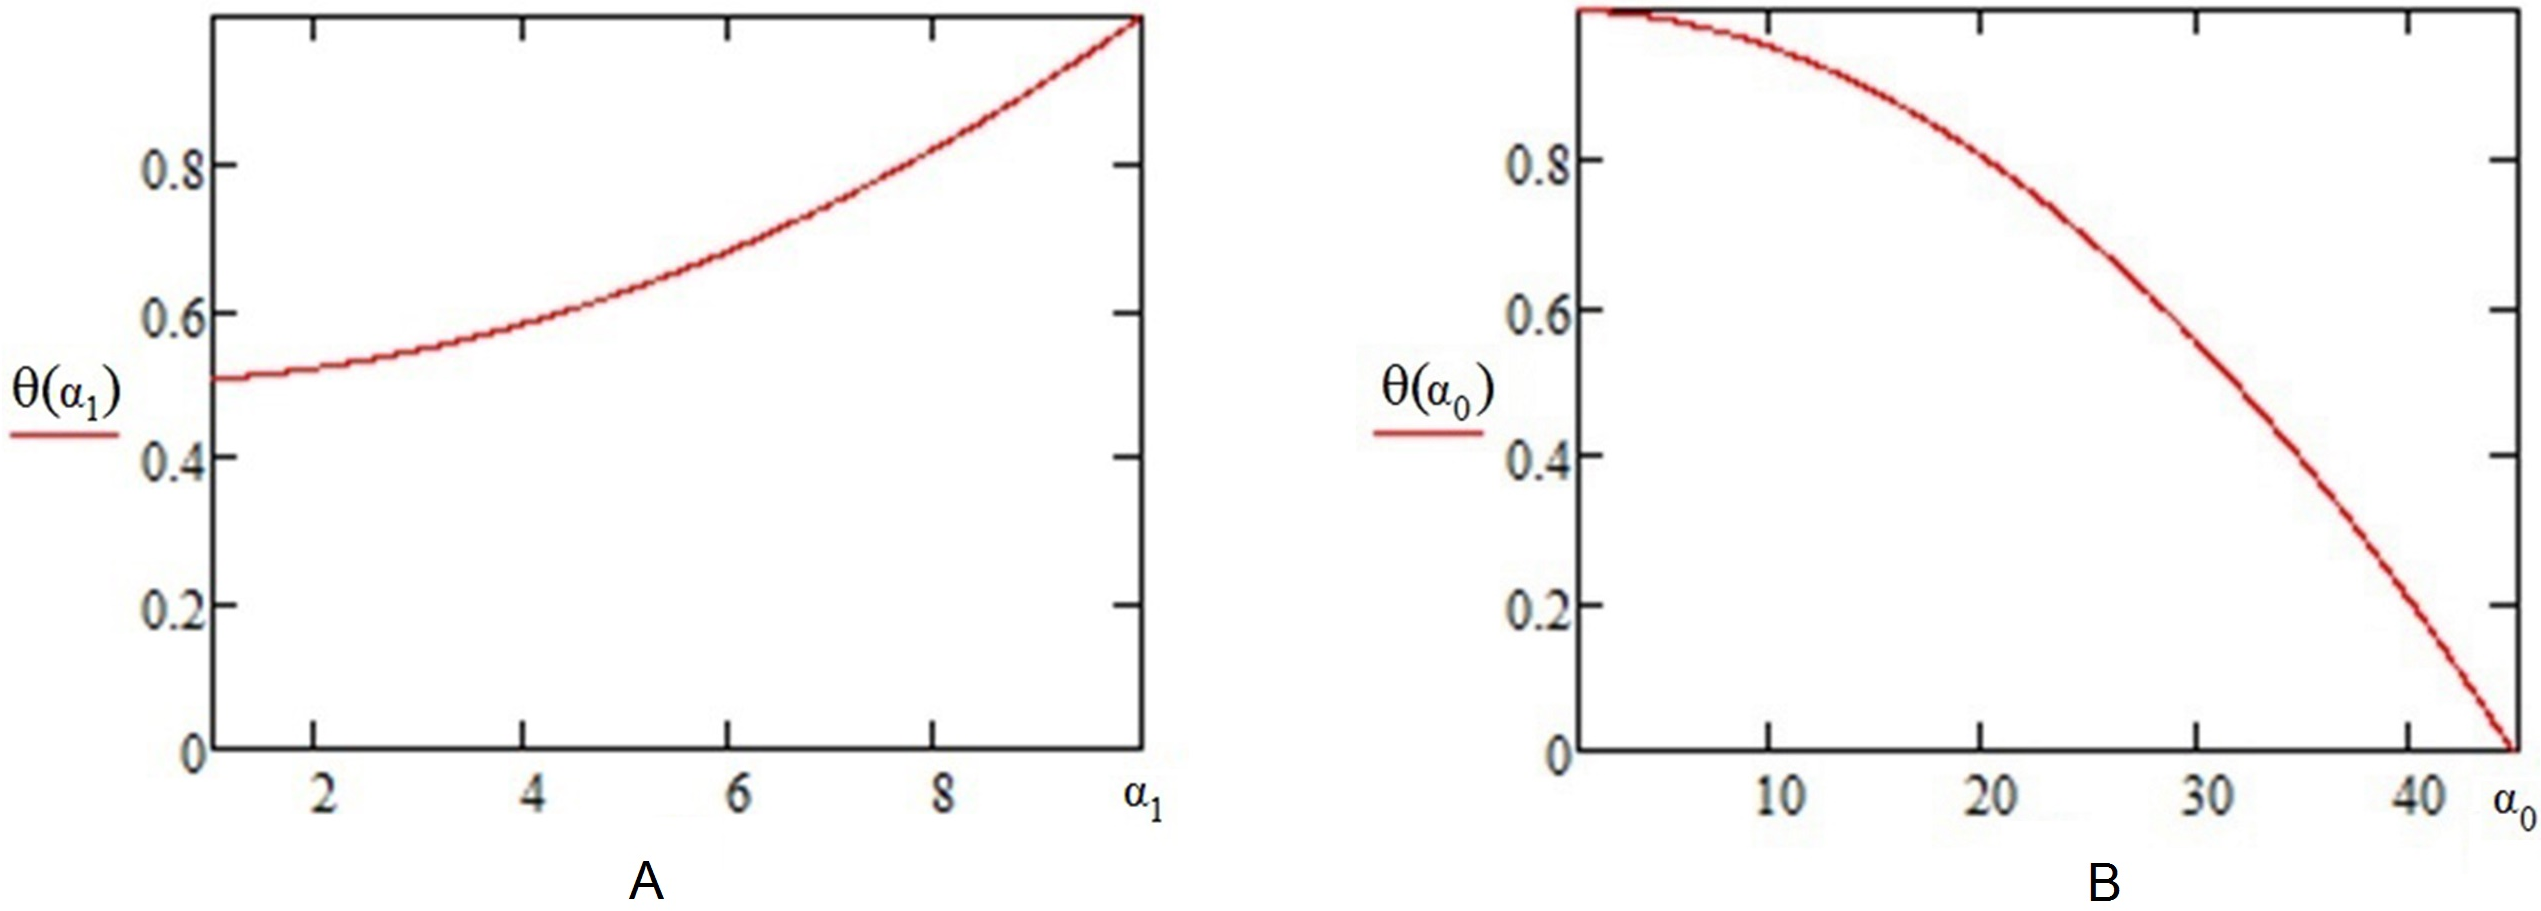
Model validation
Our dynamical opinion model adds significant complexity to the opinion interaction model. Therefore, we use discrete event simulation (SocialSim (Topirceanu & Udrescu, 2014)) over complex social network topologies, in order to validate our model’s capability to reproduce real-world phenomena like the opinion formation phases and the phase transition towards social balancing.
An important aspect is that our model is based solely on the simple SD/SC contagion principles. We have also implemented a complex contagion model in SocialSim, and performed extensive simulations to compare it against our simple contagion results and we have found that when using complex contagion, the dynamics of the society is accelerated and the I, F phases occur very fast, the T phase is omitted, and the society enters the intolerance phase. This is due to the fact that averaging the opinion of neighbors does not allow a node to be in contact with the likely divergent opinions of his neighbors, one by one, and thus tolerance cannot increase. As a consequence, nodes tolerance θ will decrease after each interaction. Conceptually, we have defined the tolerance model to keep nodes tolerant through individual interactions which present diversity in opinion, like we would have in real life. Even if humans usually evolve towards the average opinion of their social group, they do so through sequences of individual interactions, as our model tries to capture.
Simulation on basic topologies
Regular networks
The first simulation setup is based on regular topologies, i.e., lattice and mesh. The results show that a homogeneous cluster of stubborn agents divides the overall society opinion (i.e., green (1) vs. red (0)) with a ratio that is directly proportional with their initial distribution. Figure 6 is used as an exemplification of the four phases, as obtained in SocialSim, and shows how a mesh network of 100,000 agents (generated by placing nodes uniformly in a 1,000 by 1,000 unit space and connecting them within a radius of 10 with link probability p = 0.15) evolves under the influence of 64 stubborn agents—32 of each opinion evenly distributed among the population. This way, we observe the same opinion formation phases as identified by our empirical observations: initiation I (Fig. 6A), fusion F (Fig. 6B), tolerance T (Fig. 6C), and intolerance (Fig. 6D). The situation in Fig. 6C may lead to one of two scenarios: a perpetual (proportional) balance of the two opinions, introduced by us as social balancing (the society remains in the T phase, and is never reached), or a constant decrease in opinion dynamics which ultimately leads to a stop in opinion change (the society reaches the phase), as depicted in Fig. 6D.
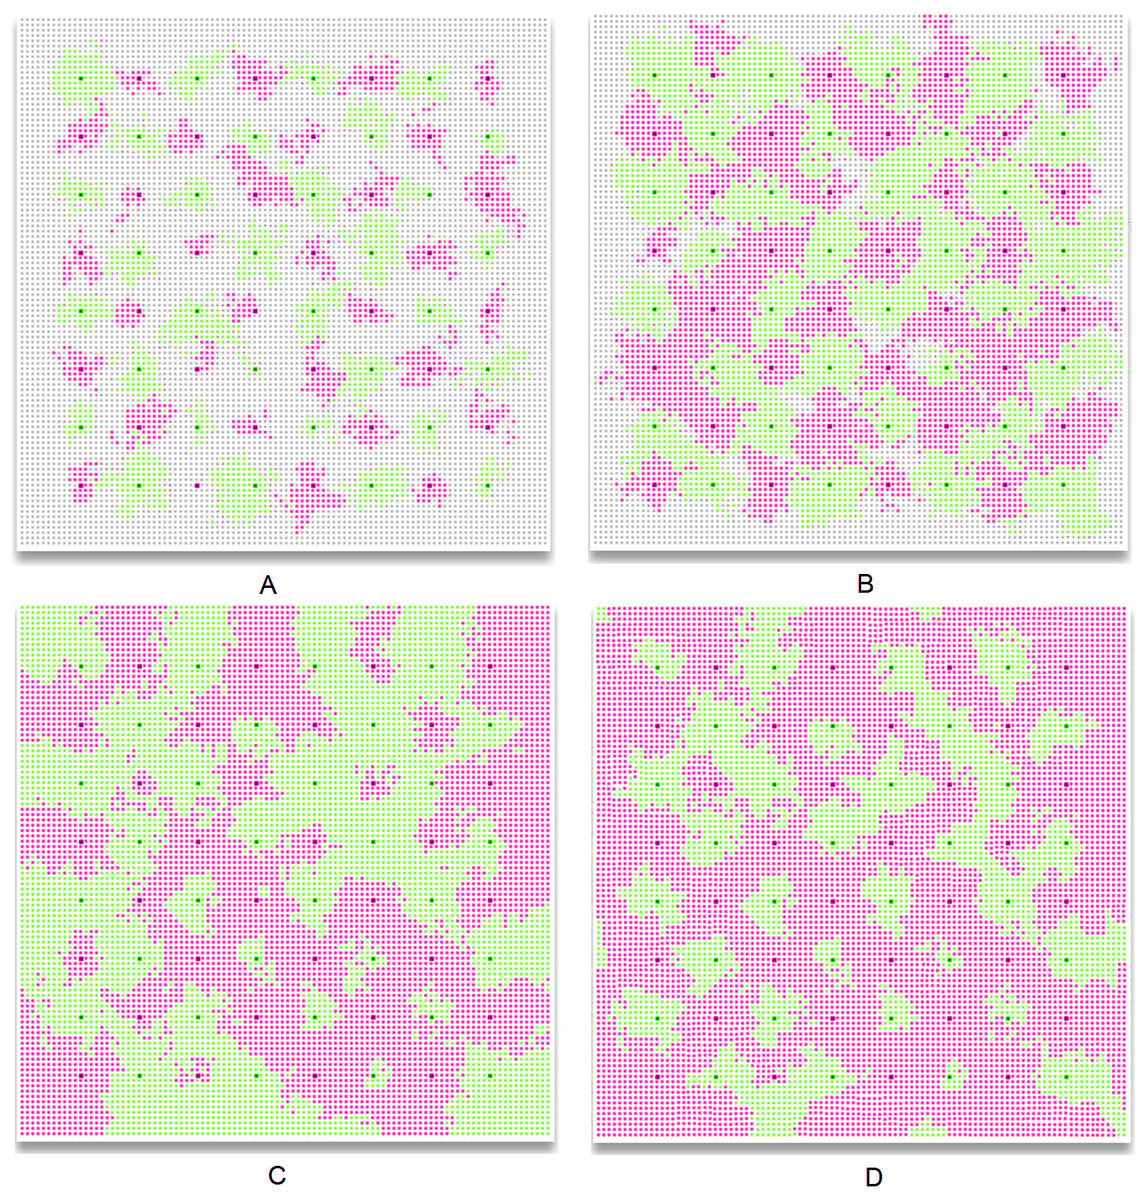
Figure 6: Green (1) vs. red (0) opinion evolution with homogeneous stubborn agent distribution in a 100,000 node social network.
The network is initialized with 32 red and 32 green stubborn agents (represented as the darker nodes) which start influencing the neighboring regular agents. Initially, the regular agents have no opinion and are colored with grey. We distinguish between the following phases of opinion formation: (A) the initiation phase I where the society has no opinion, i.e., the stubborn agents exercise their influence to the surrounding neighborhood without being affected by any other opinion. The opinion change ω(t) rises during this phase, whereas tolerance θ(t) remains high. (B) The fusion phase F where the society is now mostly polarized (green or red) and different opinion clusters expand and collapse throughout the society. The opinion change ω(t) reaches a maximum, and tolerance θ(t) begins to slowly decrease. (C) Tolerance phase T, where the cluster interaction stabilizes and new, larger, more stable clusters emerge. Most of the individuals within the society have been in contact with both opinions; each agent’s opinion si(t) begins to converge, and the tolerance θ(t) is steadily declining or becomes stable. (D) Intolerance phase , where the overall tolerance of agents has decreased to a point where opinion fluctuation ceases and the red opinion becomes dominant (θ(t) < 0.1). The society may or may not reach this phase.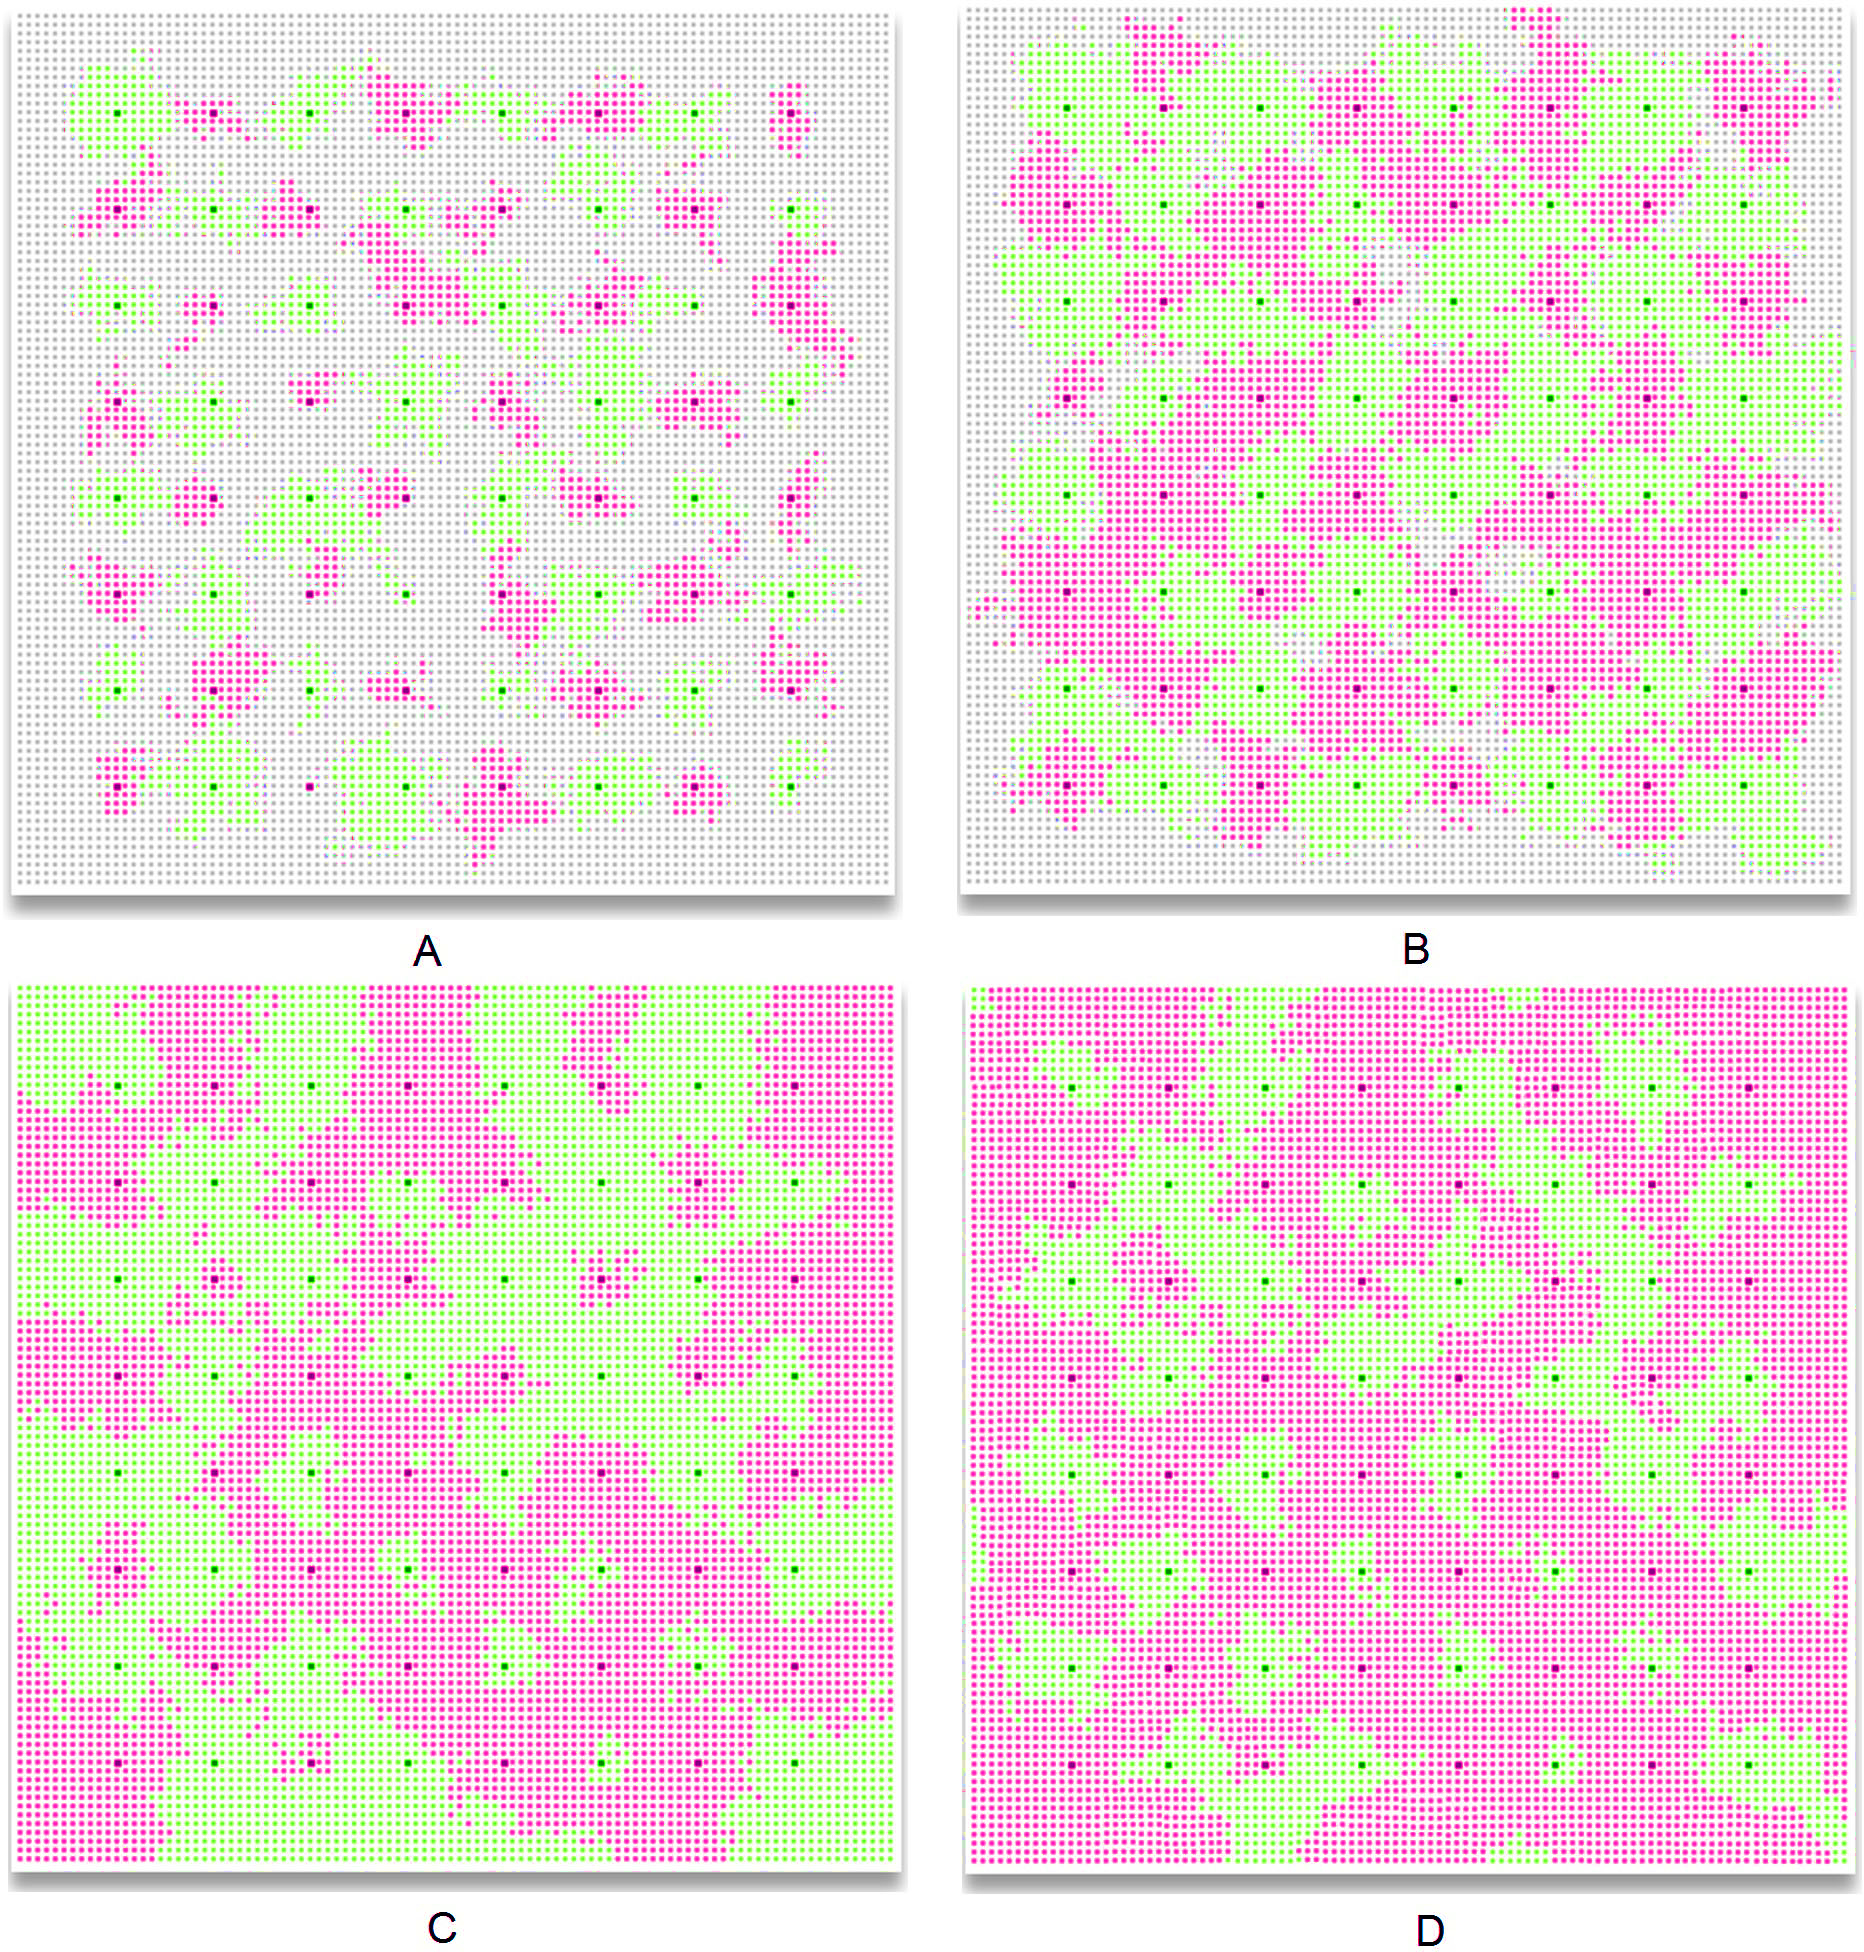
Figure 7 provides illustrative, single experiment results, which intend to capture the specific behavior of opinion evolution. Again, the same patterns were observed throughout all our multiple simulations. Figure 7A illustrates a society which tends towards the tolerance phase T and social balance, by providing the evolution of the overall society state s(t) (as defined in Eq. (2)), tolerance θ(t) (see Eq. (4)), and opinion change ω(t) (Eq. (5)). For the society described in Fig. 7A, the initiation phase I is revealed by the early increase of ω(t), as the number of individuals with opinion increases. The climax of ω(t) represents the fusion phase F. At this stage, there is a maximum number of bordering agents with distinct opinions (a situation that is also depicted in Fig. 6B) and s(t) evens out. In the tolerance phase T, the agents tend to stabilize their opinion, i.e., θ(t) stabilizes and s(t) converges towards the ratio of stubborn agents (which was chosen as 1:1).
Another observation is that opinion fluctuation is determined by the stubborn agents density (see Fig. 7B, 7C and 7D). Because of the regular topology, the fewer stubborn agents (regardless of their opinions) there exist in the society, the more the opinion fluctuates. This is explained by the fact that having few stubborn agents means few points of opinion control and stabilization in the local mesh structure; conversely, many stubborn agents make possible the control of more regular agents. Because of this, s(t) may drastically get biased in someone’s favor until the entire society stabilizes (Fig. 7B). Also, due to the small influencing power of a few agents, the opinion will not necessarily stabilize with the same distribution ratio. As expected, the opinion distribution of a society with a high opinion source concentration will tend towards the ratio of the two stubborn agent populations (Fig. 7C).
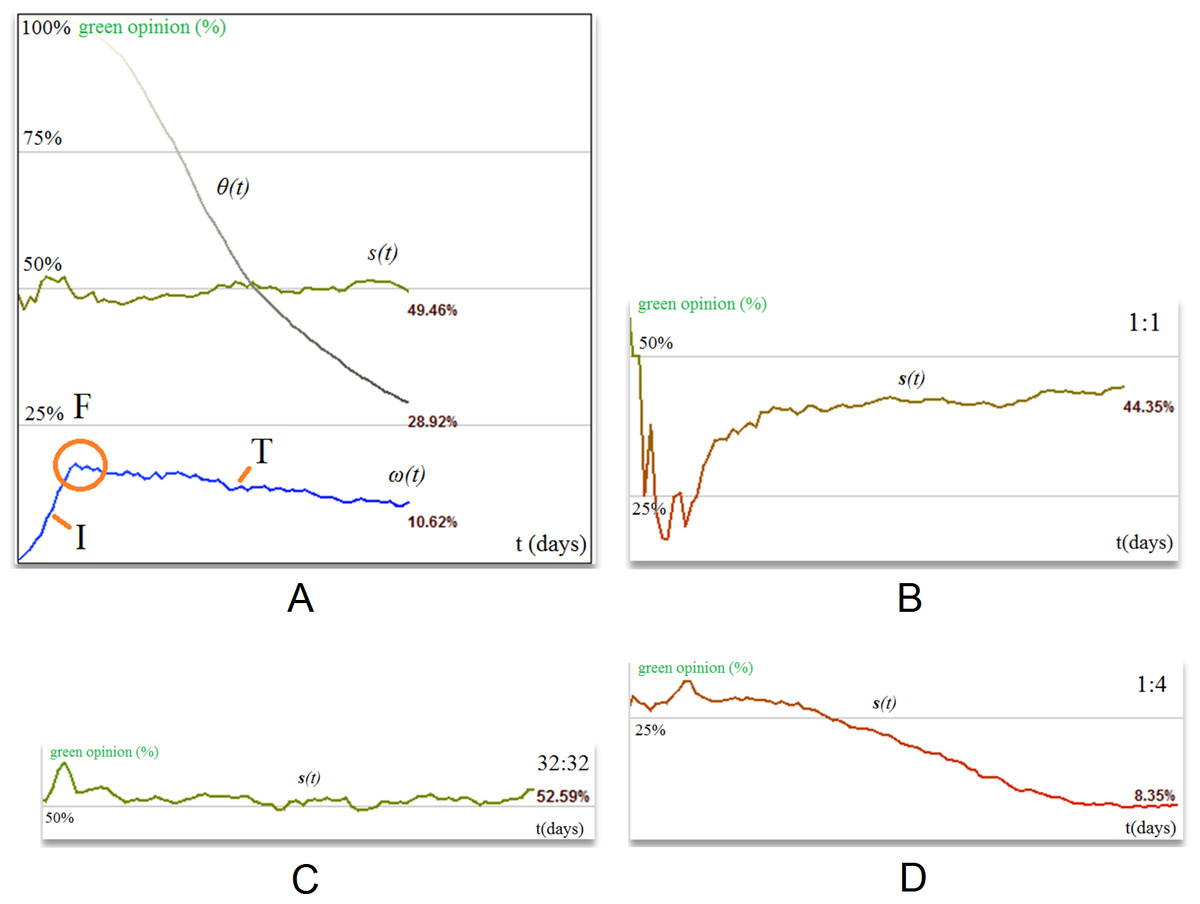
Figure 7: Simulation of a 100,000 mesh network with SocialSim (Topirceanu & Udrescu, 2014), displaying a representative example for the evolution of s(t), θ(t), and ω(t), as well as the opinion evolution s(t) with various stubborn agents distributions.
(A) Representative setup for the mesh topology, where the lowest panel displays the opinion change (ω) evolution over three simulation phases: (I) initiation, (F) fusion, and (T) tolerance. The opinion state (s) and its tolerance (θ) are also displayed in the middle and upper panels. (B) Opinion evolution s(t) with few and evenly distributed stubborn agents SA (1:1 ratio: 1 green, 1 red). (C) Opinion evolution with many and evenly distributed stubborn agents (1:1 ratio: 32 green, 32 red), (D) opinion evolution with few and unevenly distributed stubborn agents (1:4 ratio: 1 green, 4 red).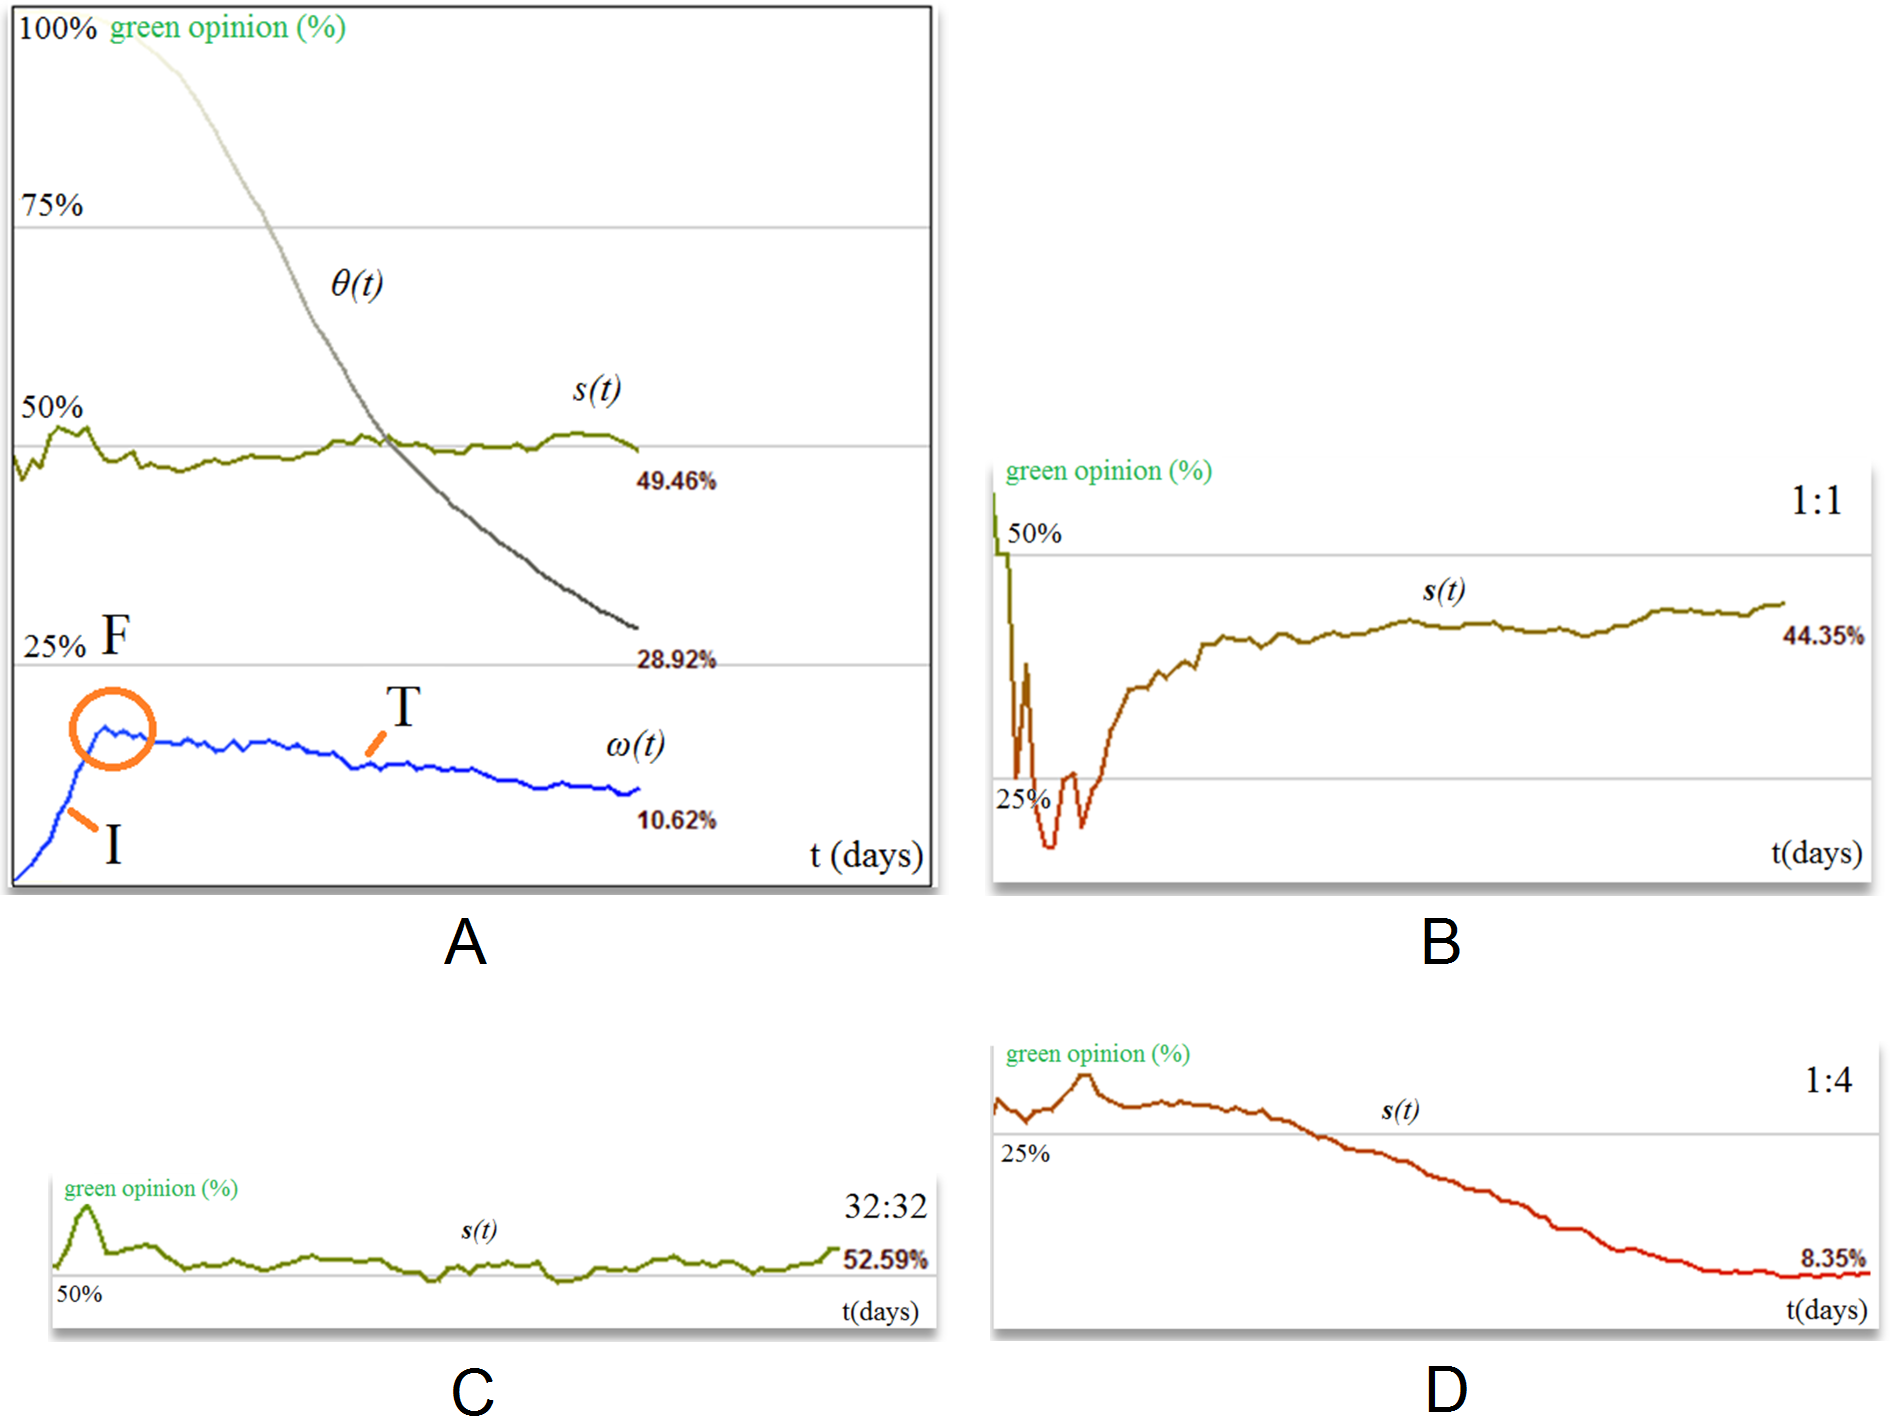
If the ratio of the two stubborn agent populations is not 1:1, then the opinion fluctuation will be around that ratio only during the initiation phase I. Afterwards, the overall opinion will get more biased towards the opinion of the larger stubborn agent population. In Fig. 7D the ratio is 1:4 between green and red stubborn agents, therefore the fluctuation starts around 20% green opinions, but eventually stabilizes at 8%.
The scenarios presented above hold true for lattices. Consequently, these conclusions are more of theoretical interest, as real social networks are typically not organized as such regular topologies. Next, we consider more realistic network topologies.
Random networks
In order to generate random topologies, we have implemented both Erdos–Renyi networks (Erdös & Rényi, 1960) (see Fig. 8A), as well as uncorrelated networks with preferential attachment (uncorrelated scale-free) as defined by (Catanzaro, Boguna & Pastor-Satorras, 2005) (see Fig. 8B). We create networks of 100,000 nodes with the Erdos–Renyi algorithm (Erdös & Rényi, 1960) with wiring probability p = 10−4, and the algorithm described in Catanzaro, Boguna & Pastor-Satorras (2005) with 10,000 nodes with power-law distributed node degrees within the range 1–100. We use an exponent of γ = − 2.41, which is within the power-law interval −3 < γ < − 2.
Because of the random nature of this second topology, the results obtained with SocialSim are much closer to what we obtain for random networks. Figure 8 represents the opinion formation phases. Due to the disassortative connectivity, opinion dynamics leads to an evolution towards social balance.
The explanation for this balancing is due to the the fact that nodes may be connected to any random hubs, so neighboring nodes will not adhere to the same community influenced by the exact same hubs. This diversity in connections keeps tolerance high, so that opinion is kept in balance.
Small-world networks
By constructing Watts–Strogatz small-world networks of 100,000 nodes (Watts & Strogatz, 1998; Strogatz, 2001; Wang & Chen, 2003; Tsvetovat & Carley, 2005; Chen, Zhang & Huang, 2007; Bandyopadhyay et al., 2011), we show experimentally that a different type of behavior can emerge. Specifically, we used multiple simulation settings with rewiring probabilities p = 0.1, p = 0.2 and p = 0.5 respectively, and keep the results for p = 0.1 as being the most representative, because the clustering coefficient remains high (i.e., 0.368). As such, Figs. 9A and 9B present the society as having a mixed opinions distribution with clusters forming around stubborn agents. Similar to the representation in Fig. 6, this topology allows multiple agents to cluster around the stubborn agents and converge towards their opinion. A higher rewiring parameter p is associated with a more random topology which is found to increase tolerance and dissolve agent clusters around opinion sources. Consequently, this model not only increases the dynamics of opinion fluctuation, but also keeps the society in social balance. The fourth and final phase of opinion evolution—the intolerance phase—does not occur, and opinion change ω(t) is maintained at a (high) constant level. Moreover, the state of the society s(t) is stable.
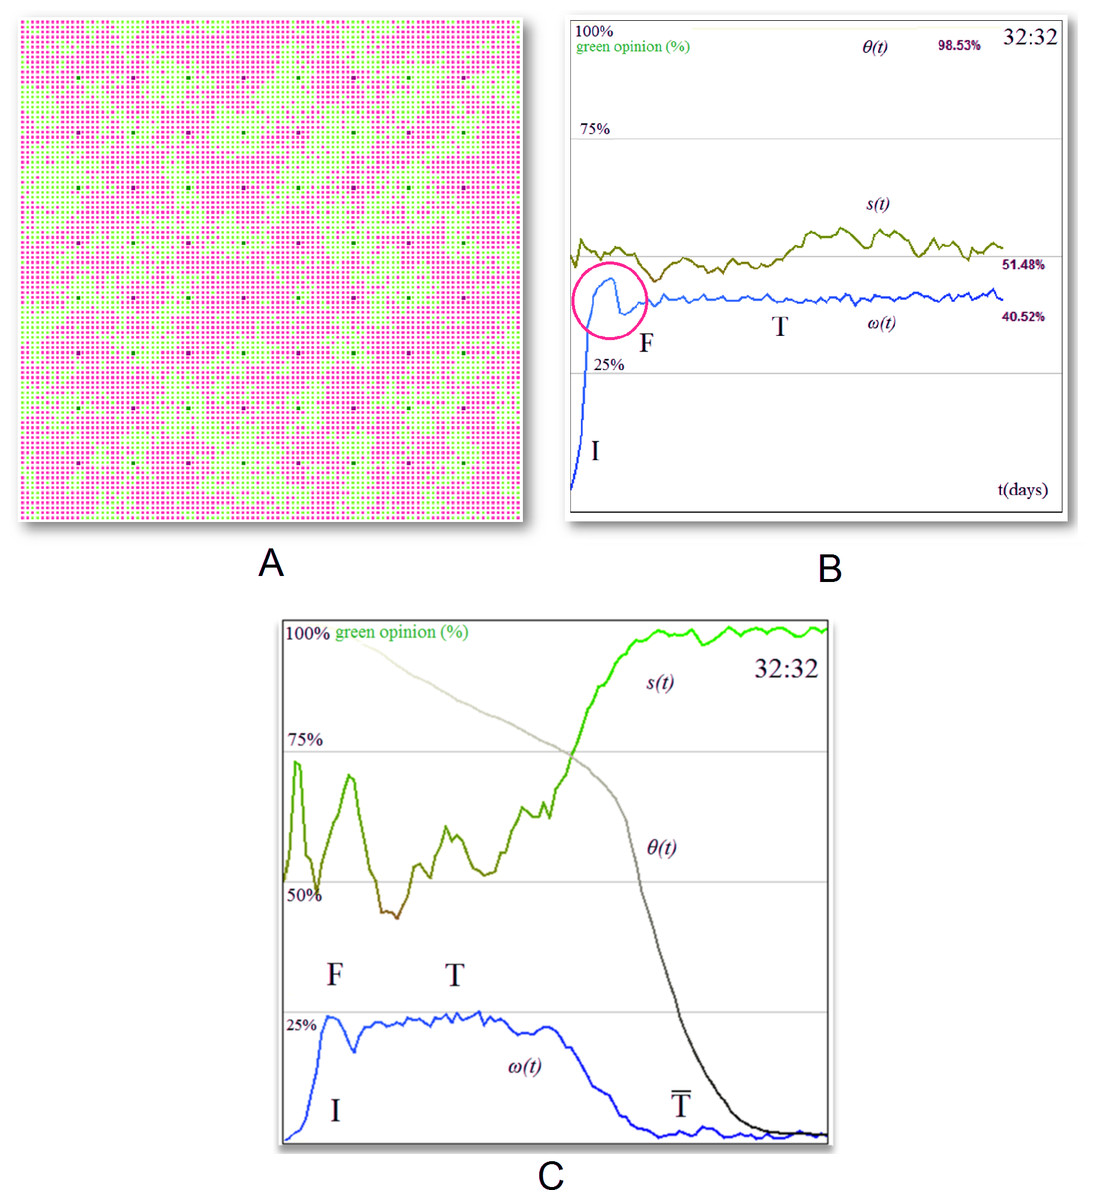
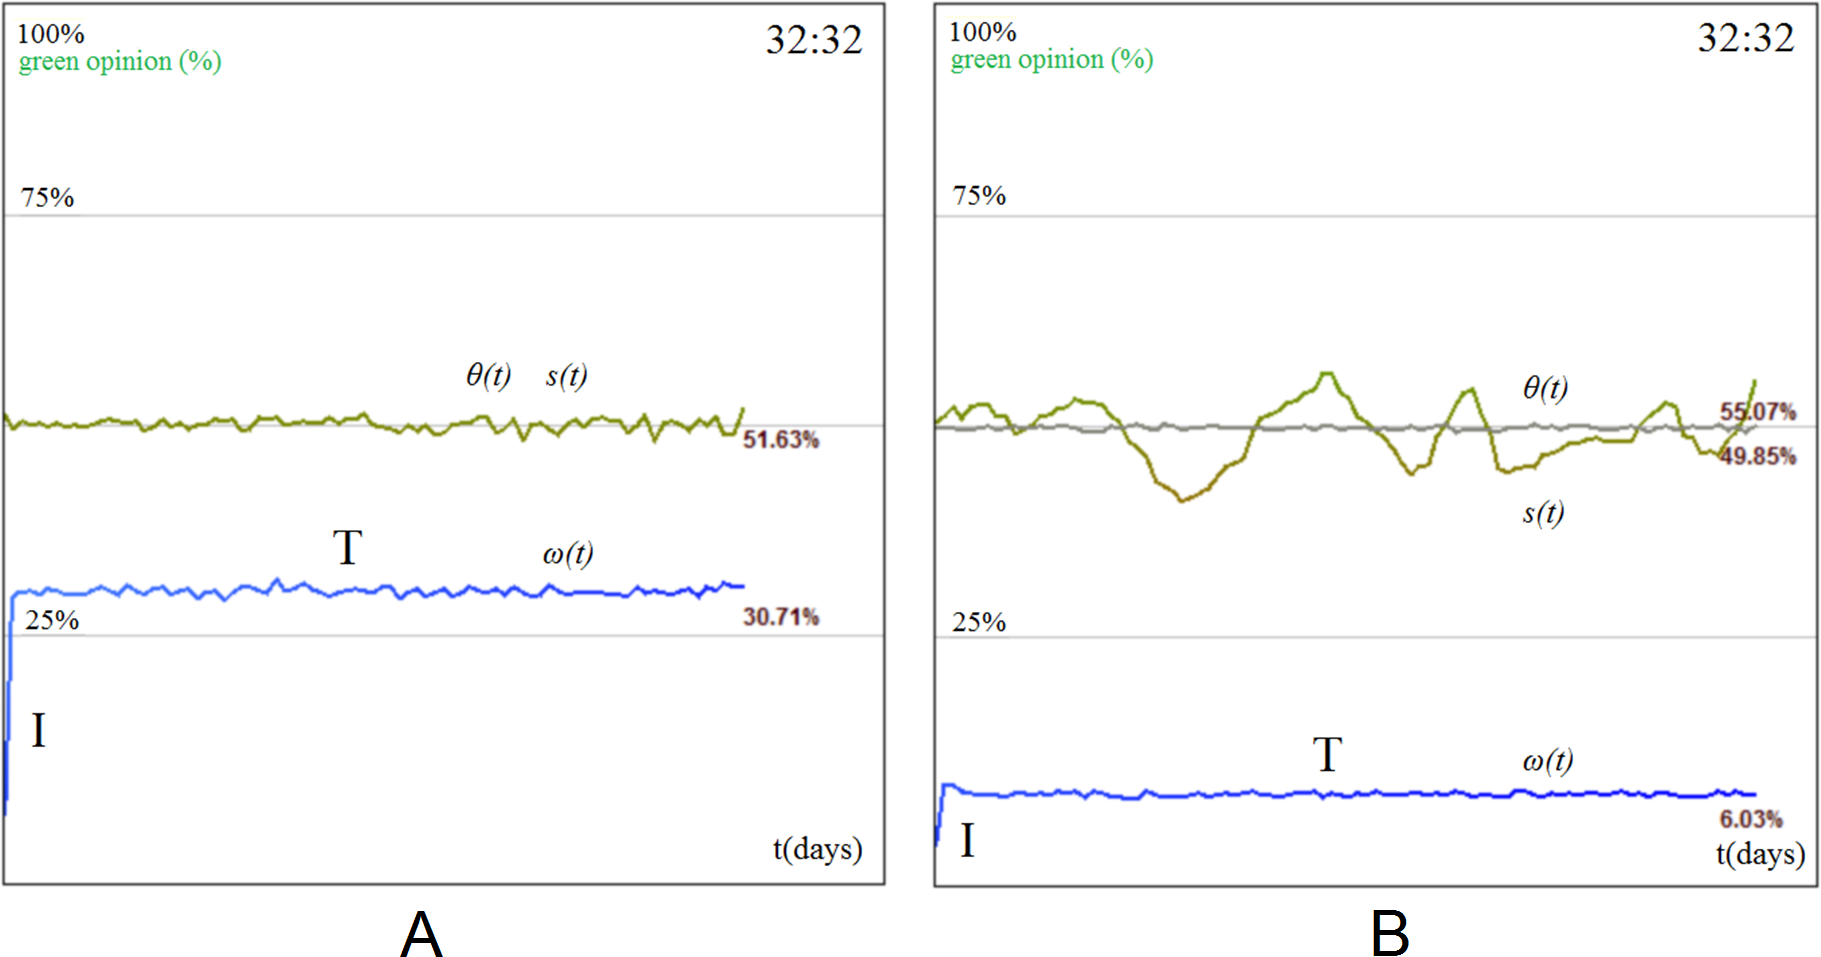
Figure 9: Opinion evolution with homogeneous stubborn agent distribution (32:32) in small-world and BA networks.
(A) Tolerance phase where visible clusters emerge for small-world networks. (B) For small-world networks, social balancing is attained because tolerance remains extremely high (θ(t) > 90%), opinion change (ω) exhibits the three opinion evolution phases (initiation I, fusion F, and tolerance T), and never reaches intolerance. The state of the society s(t) is stable. (C) Social balancing is not achieved for BA networks: tolerance drops constantly and the society reaches the intolerance phase (). The state of the society s(t) is unstable during the first three phases of opinion change, then stabilizes as tolerance (θ) and opinion change (ω) fall.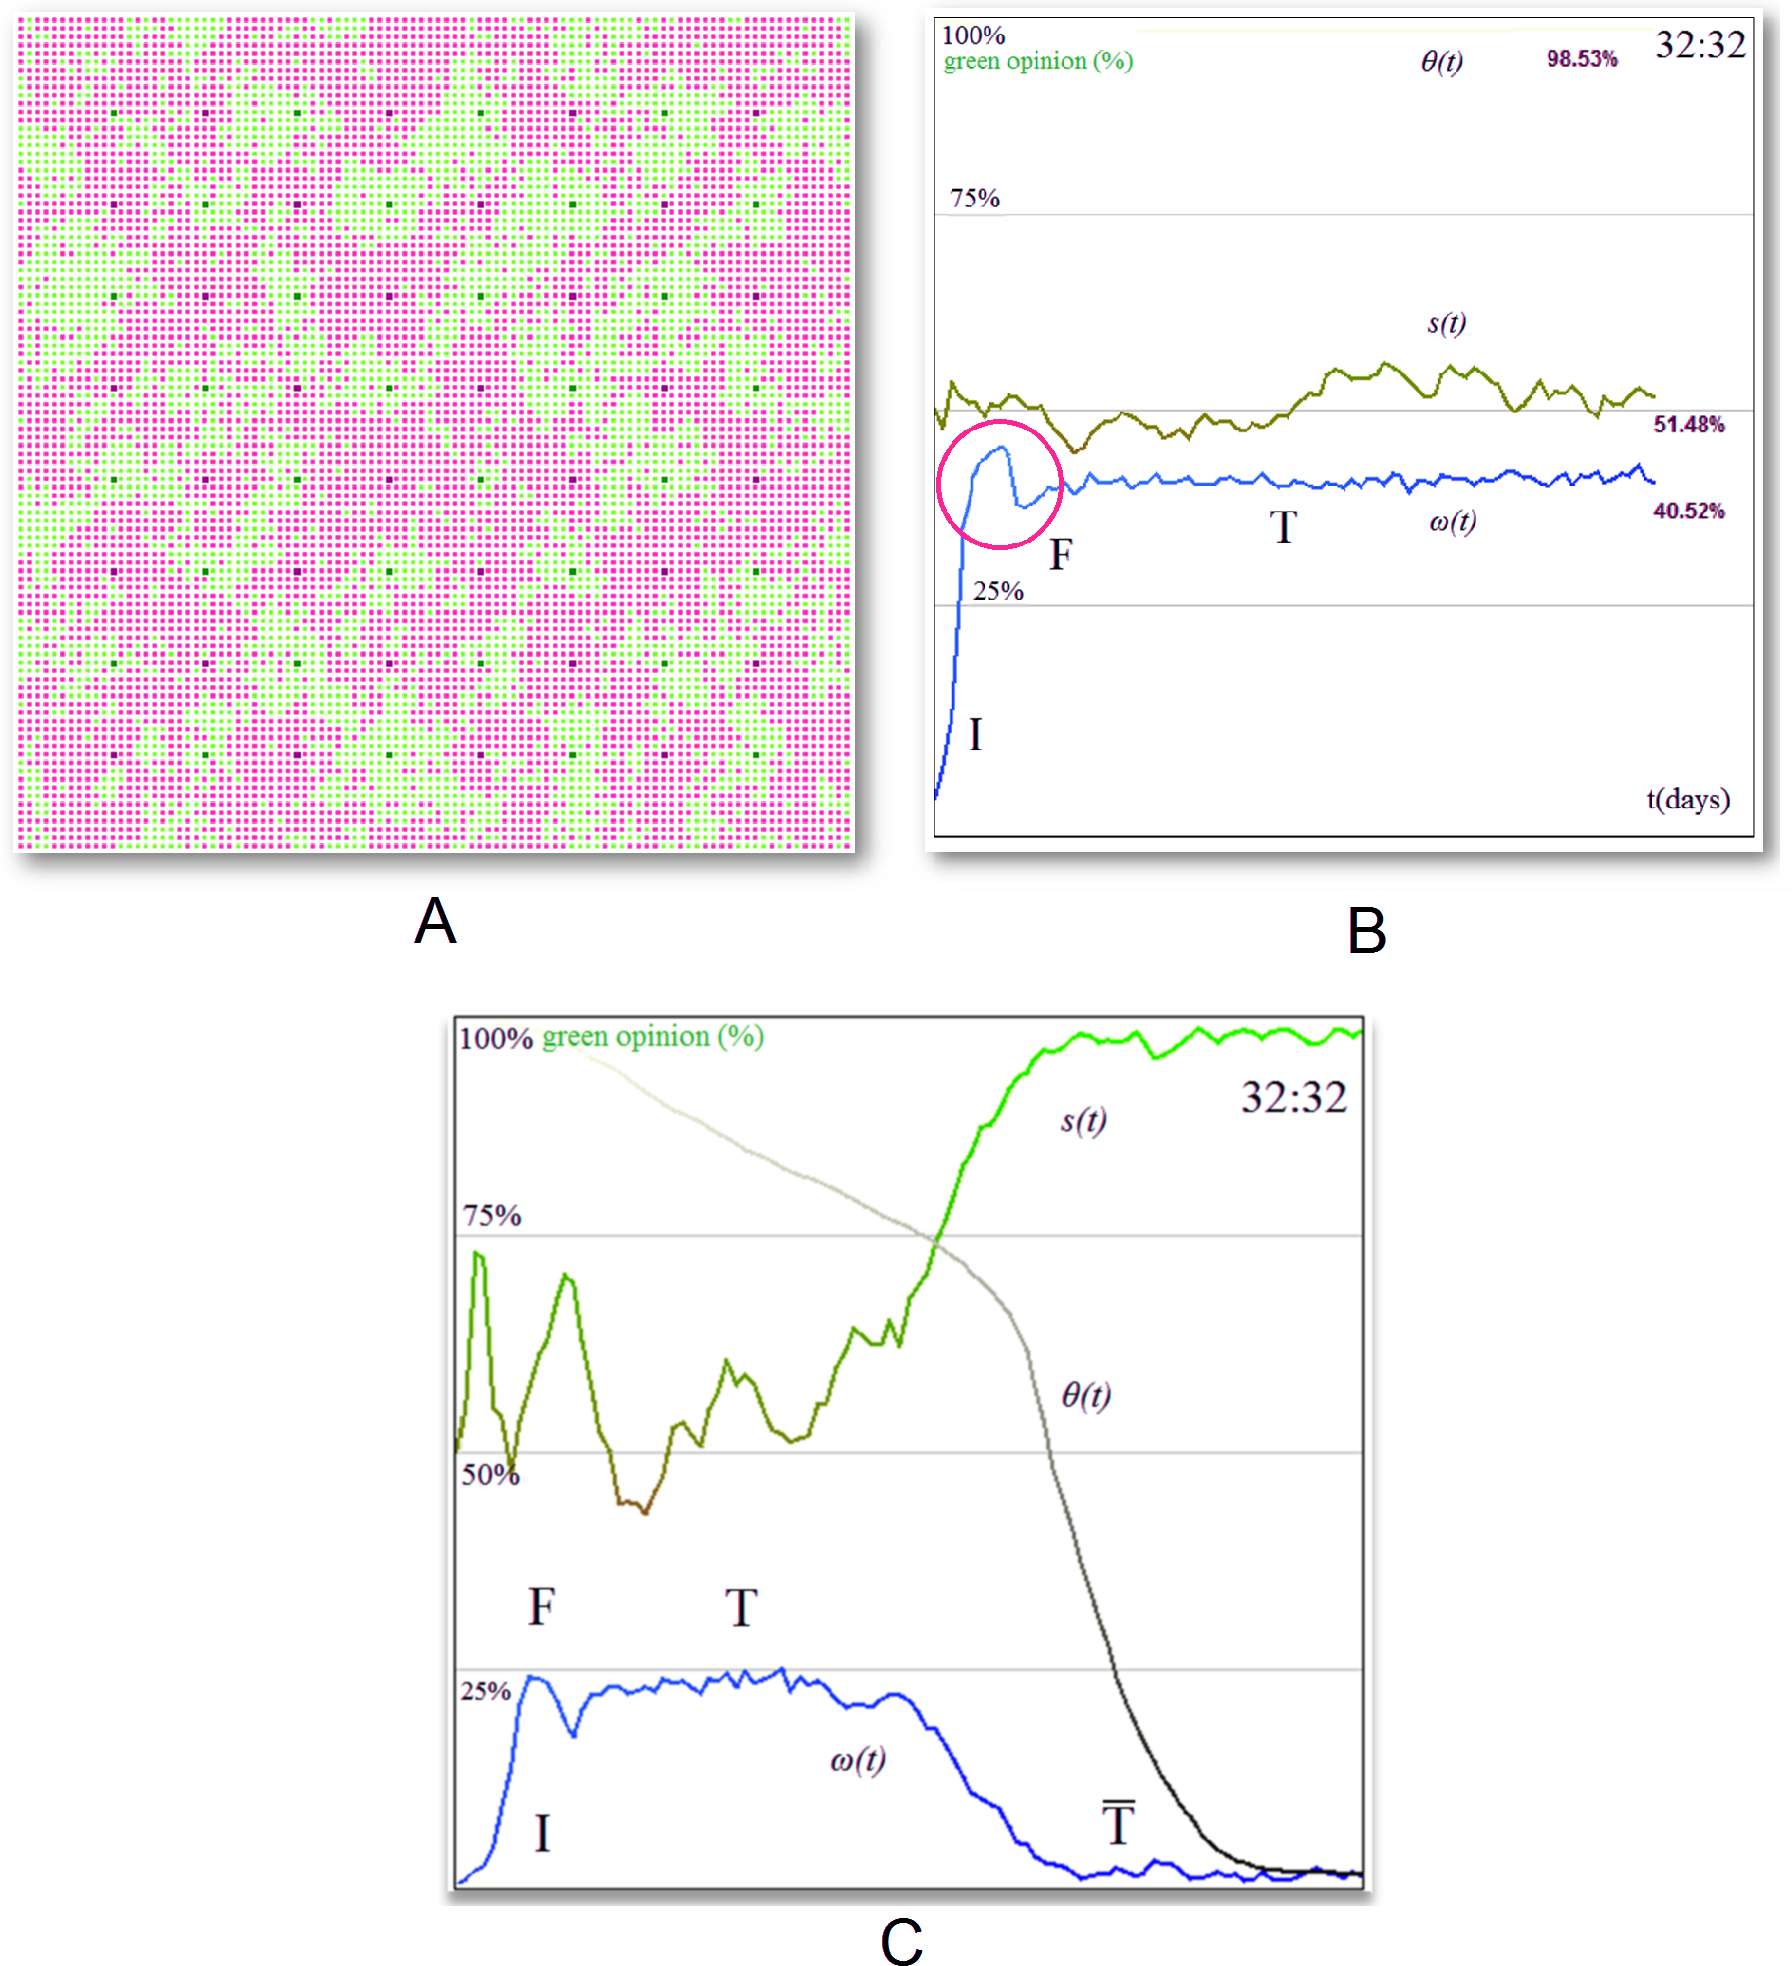
The society depicted in Fig. 9A is homogeneously mixed from an opinion standpoint. Clusters do not form because many agents have long range links to other distant agents whose opinion can be different from the local one. This leads to a perpetual fluctuation which remains in balance. The noticeable effect on a small-world network is that the opinion stabilizes very fast and always at the ratio of the two stubborn agent populations (i.e., 1:1 in our case). In a mesh network, having few stubborn agents leads to an imbalance of opinion, but in the case of small-world topologies, opinion across the entire population always stabilizes. Opinion change ω(t) is also much higher compared to the mesh (i.e., 42% versus 10% under the same conditions) due to the long range links.
Networks with preferential attachment
We apply the same methodology by constructing a 100,000 node Barabasi–Albert (BA) network with preferential attachment and highlight the unique behavior it enacts (Barabási & Albert, 1999; Pastor-Satorras & Vespignani, 2001; Albert & Barabási, 2002; Wang & Chen, 2003; Song, Havlin & Makse, 2005; Chen, Zhang & Huang, 2007). As Fig. 9C shows, the society does not reach a balance at the expected value (32 : 32⇒50%); instead, it gets biased towards one opinion or another. The reason behind this behavior is related to the power-law degree distribution (Wang & Chen, 2003). As such, BA scale-free networks behave more like a tree-structure with hubs rather than as a uniform graph. Indeed, as opinion flows from one agent to another, the higher impact of the hub nodes on the opinion formation at the society level becomes clear. If, for example, a green stubborn agent is placed as the root of a sub-tree filled with red stubborn agents, that sub-tree will never propagate red opinion as it cannot pass through the root and connect with other nodes. Experimentally, this is illustrated in Fig. 9C. The green agents have been placed over nodes with higher degrees, and this can be seen in the evolution of the opinion. There is some initial fluctuation in the society and although the stubborn agent distribution is even, the fluctuation rapidly imbalances as the overall tolerance θ(t) plummets and all agents become sort of “indoctrinated” by the green opinion. The rapid drop in tolerance coincides with the drop in opinion change ω(t) and the stabilization of the state s(t) at over 90%. Simulations were also run on the WSDD topology (Chen, Zhang & Huang, 2007), which has a strong preferential attachment component, and yield similar results which lead to the same set of observations. We generated the WSDD topology based on 10 communities, each with 1,000 nodes. The nodes are connected with K = 2 neighbors on each side and a rewiring probability p = 0.1.
Validation hypotheses
In order to strengthen the idea of social balancing, which is observed in our experimental data, we propose to validate the tolerance model against a null/random model. This is addressed by the implementation of random interacting agents in our simulation tool, followed by a replication of the experiments, and a final conclusion. We have added randomness in two ways:
-
Fully-random interaction model: all agents have random tolerance values, random initial opinions, interact with random neighbors who posses random opinions, and tolerance is updated randomly after each interaction. Looking at the simulation results with random interaction model, we obtain the same output regardless of topology and SA concentration.
-
Random-tolerance interaction model: similar with our proposed opinion interaction model, but here each agent receives a static tolerance initialized with a random value in the [0,1] interval at startup.
Figure 10 depicts a small-world with 32 green and 32 red stubborn agents. The state of the society remains balanced at 50% and there are no visible opinion formation phases. With the random-tolerance interaction model, the state of the society oscillates much more in comparison with the fully random model, but less when compared with our proposed tolerance interaction model. As for the fully-random model, the opinion formation phases are not clear. We can only conclude that using a random/null model for validation shows that tolerance actually plays an important role in the statistical results obtained in our paper.
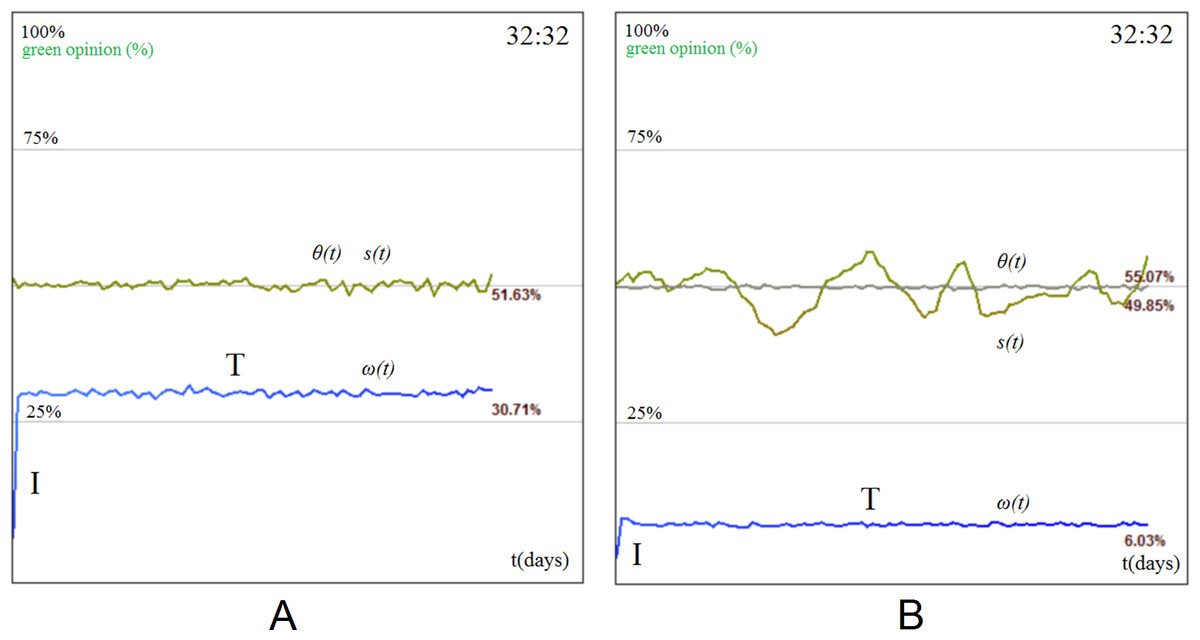
Figure 10: Simulation results on a small-world network with 32 red and 32 green stubborn agents for the: (A) fully random interaction model: there are no opinion formation phases, the society is balanced all the time and the opinion has almost no oscillations; (B) random-tolerance interaction model: there are no clear opinion formation phases, the society is balanced all the time, while the opinion has oscillations.
In real-world social networks there are agents which do not hold any opinion, and they simply do not participate the diffusion process. We have covered this scenario in Eq. (1) as an agent which has opinion x(t) = 0.5 will carry the state NONE. These agents are called null agents (NA) and do not take part in the opinion interaction. Theoretically, we consider that NAs should act like edge-disconnections in the graph. By adding NAs in SocialSim, we were able to test them with all our synthetic topologies. The higher the population of randomly distributed NAs, the fuzzier the four phases become. Initiation (I) is less steeper, fusion (F) isn’t that spiky anymore, tolerance (T) is achieved harder/later as the state oscillates more, but the society is still in balance and predictable; opinion change stabilizes with some delay. The phases tend to dissolve after a concentration of approximately 30% population of null agents.
Additional simulations have been run with NAs and all obtained results lead to the same observations as those presented in Figs. 11A–11F. All tests from Fig. 11 were run on small-worlds with 10,000 nodes.

Figure 11: Simulation results for the tolerance-based opinion interaction on a small-world network with 10,000 nodes, of which are 32 green SAs and 32 red SAs.
The social network consists of (A) 20% null agents, (B) 30% null agents, (C) 40% null agents, (D) 80% null agents.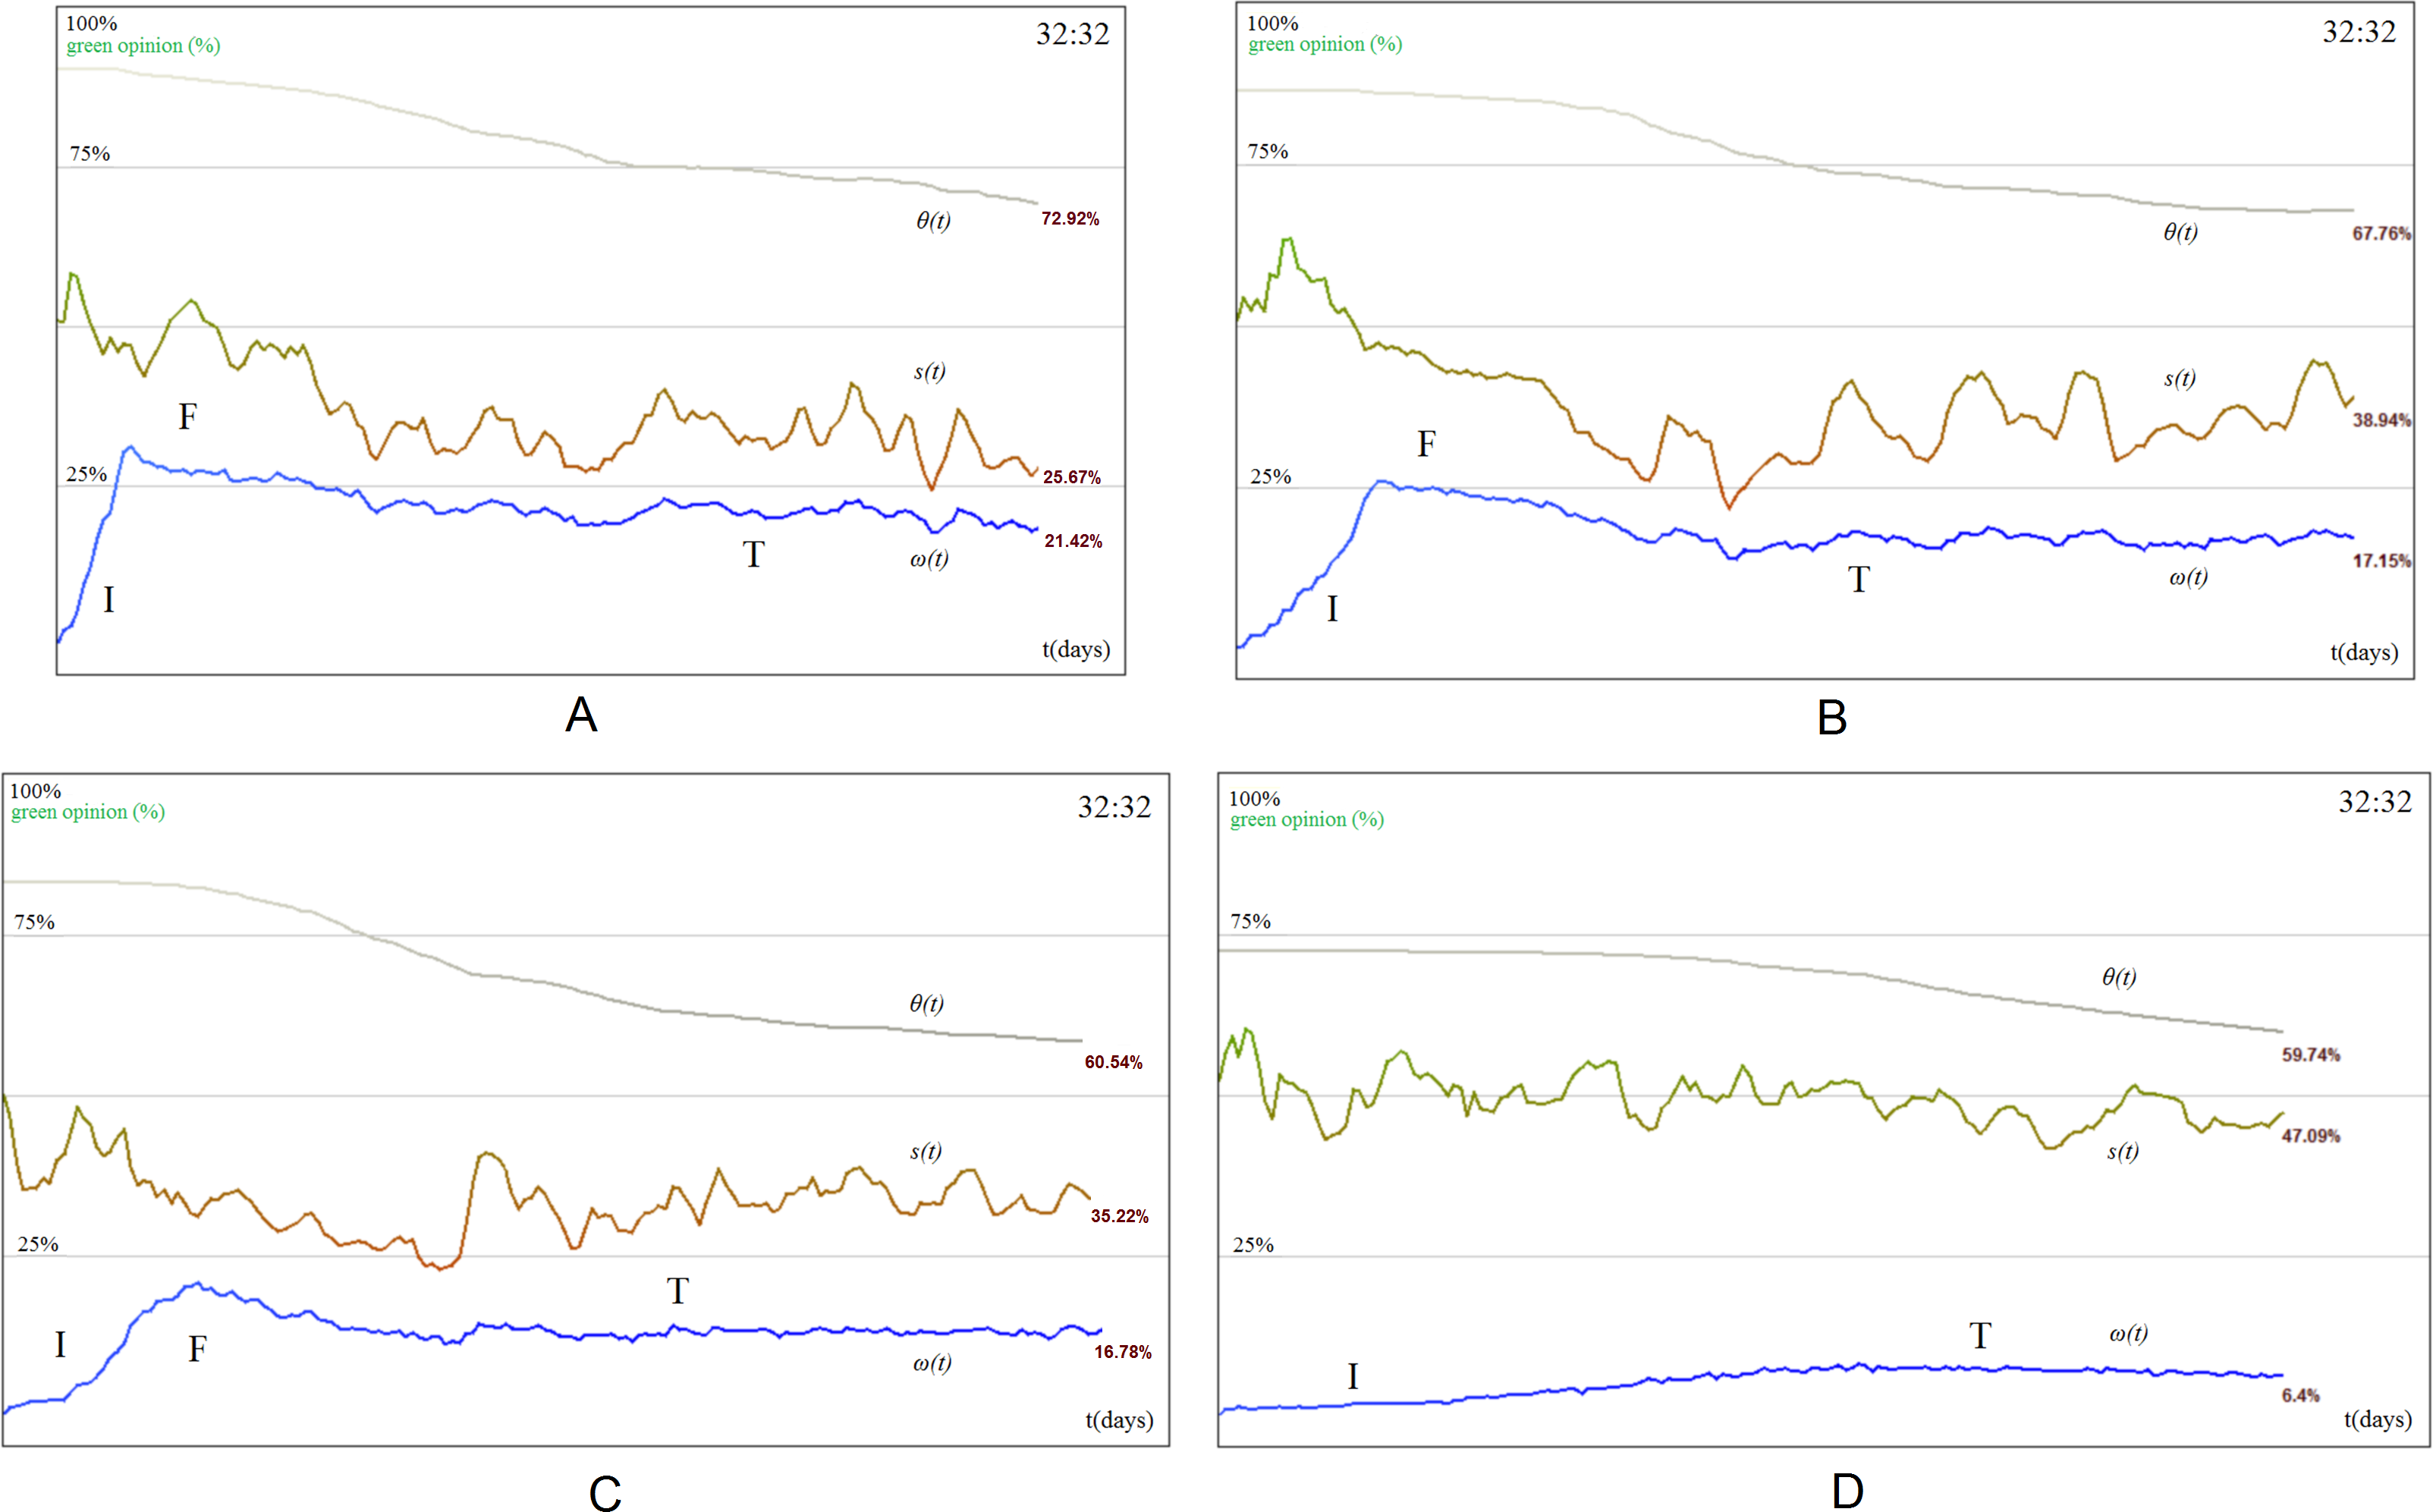
In reference Acemoglu et al. (2013) the authors try to solve the equations that describe the stationarity of opinion evolution by using random walks from regular agents to stubborn agents which influence their state. Even if their model is simpler than the model proposed in our paper, they have to come up with some simplifying assumptions in terms of network topology (only regular topologies are tractable) and number of agents (they solve equations on small networks and then generalize the results in a qualitative discussion). Because our paper adds significant complexity to the model (i.e., node tolerance is not a fixed threshold, but a dynamic one which depends on the interactions with neighbors), solving the stationarity equations would require even stronger simplifying assumptions. This is the reason for using simulation in order to analyze the stationarity distribution. Nonetheless, in all simulation scenarios, the obtained stationarity described in the paper coincides with one of two (mutually exclusive) cases:
-
The society reaches intolerance as overall tolerance converges towards 0 (i.e., θ(t) ≃ 0 for t → ∞). When this happens, no further modifications to the state of the society can be achieved. We obtain this behavior on mesh and BA topologies. Meshes imply only local connectivity to neighbors that converge towards a similar state, thus tolerance is bound to decrease to 0 (see Fig. 7A). BA networks imply connections to hub nodes, which means that all neighbors are influenced by the same local hubs, which in turn decreases tolerance to 0 (see Fig. 9C). Such a situation, in the case of regular small networks, was already mathematically described by Acemoglu et al. (2013). The authors measure the probability of being influenced by a SA using random walks. In our case, Eq. (3) can be simplified, for the majority of nodes with θi(t) ≃ 0, to: xi(t) = xi(t − 1), so the state of the society becomes stable.
-
The society remains in social balance, as the overall tolerance converges towards a non-zero constant in time (i.e., θ(t) > 0 for t → ∞), which causes the state and opinion change to also stabilize (for t → ∞). We obtain this phenomenon on random and small-world topologies. Small-worlds have the unique feature of being both regular and random in a proportion p, given by the rewiring parameter of the Watts–Strogatz algorithm. Thus, nodes interact with equal probability (for p = 0.5, as used in our experiments) with neighbors with similar opinion, and with distant random nodes with different opinion. A proportional value p = 0.5 will keep tolerance at maximal value as can be seen in Fig. 9B. Due to the random distribution of initial opinion and links (in random networks and small-worlds with p = 0.5), nodes will oscillate ergodically, and both Eqs. (7) and (8) will be activated with relatively equal probability. This keeps the tolerance variation of each node around a certain convergence value: θi(t) = θi(t − 1) ± α0/1ε0/1, where both α0ε0 = 0 and α1ε1 = 0 imply small variation in θi(t). In such a case, for a relatively stable tolerance, the stationarity can also be described as in Acemoglu et al. (2013) (where θ is assumed as fixed).
Phase transition in opinion dynamics
This section aims at analyzing the impact of topology, network size, interaction model, stubborn agent placement, ratio and concentration on the opinion change (ω), and on convergence towards intolerance (θ).
Simulations show that, in a society with a fixed stubborn agent distribution, the topology τ determines if:
-
the society enters the intolerance phase I: θ → 0 (with θ < 0.1), which also results in ω → 0;
-
the society balances and never enters the intolerance phase I: θ → θlimit, where θlimit > 0.1 and maintains a high ω;
-
the society continues to oscillate for 0.1 < θ < 1, but the tolerance level does not stabilize.
In case of the Yelp dataset, we notice that for a given topology τ, and a network of size N, when the concentration of stubborn agents is bigger than a critical ratio σ, the society never becomes intolerant. In such cases, the society becomes balanced, with slight oscillation in tolerance or opinion change. The goal is therefore to find the tuples (τ, N, σ) at which this phenomenon occurs.
To obtain our results we have used five topologies τ (mesh, random, small-world, BA and WSDD), network sizes N of 400 up to 100,000 nodes, our new tolerance interaction model, a ratio of 1:1 between green (1) and red (0) stubborn agents, and an increasing concentration of stubborn agents ranging from 1% to 36%.
Impact of topology
The tolerance and opinion change with respect to the number of stubborn agents, as depicted in Figs. 12A and 12B highlight a clear difference between the five topologies, namely mesh, random, small-world, BA, and WSDD. There is a total of three clearly distinguishable behaviors: a responsive behavior (present in small-worlds and random graphs), a linear behavior (for mesh networks), and a saturated behavior (corresponding to BA and WSDD networks).
The tolerance increases linearly for the mesh, as the population of stubborn agents increases. Consequently, there is no critical σ for which a phase transition occurs due to the high regularity of the network, but there is a visible saturation point (when the blue graph begins to drop in Fig. 12A). This happens because the society is physically filled with more stubborn agents than regular ones and because all stubborn agents have θ = 0, the overall tolerance begins to drop.
The responsive behavior exhibited by the random network and small-world networks suggests that these two topologies behave similarly in the context of opinion source saturation. The two topologies are almost identical under the conditions defined here, as they behave almost as the opposite of mesh networks: once the critical point σ is reached, their tolerance rises to the maximum value. Then, as the stubborn agents population increases, the tolerance and opinion change values decrease proportionally. The random and small-world topologies are equivalent with the mesh topology as the society becomes saturated with stubborn agents (i.e., see Figs. 12A and 12B in terms of tolerance θ and opinion change ω, respectively).
Finally, the saturated behavior groups together the BA and WSDD topologies, both of which have the feature of degree-driven preferential attachment. The two topologies show smaller responsiveness to social balancing. As depicted in Figs. 12A and 12B, the critical point of stubborn agents concentration for BA is by far the greatest one (i.e., σ = 16%) and the maximum tolerance θ reached is the smallest among the simulations aiming at the impact of topology (20%). The WSDD topology shows a better response, at a much lower critical stubborn agents concentration point (σ = 4%) and reaches social balance at θ = 30%.
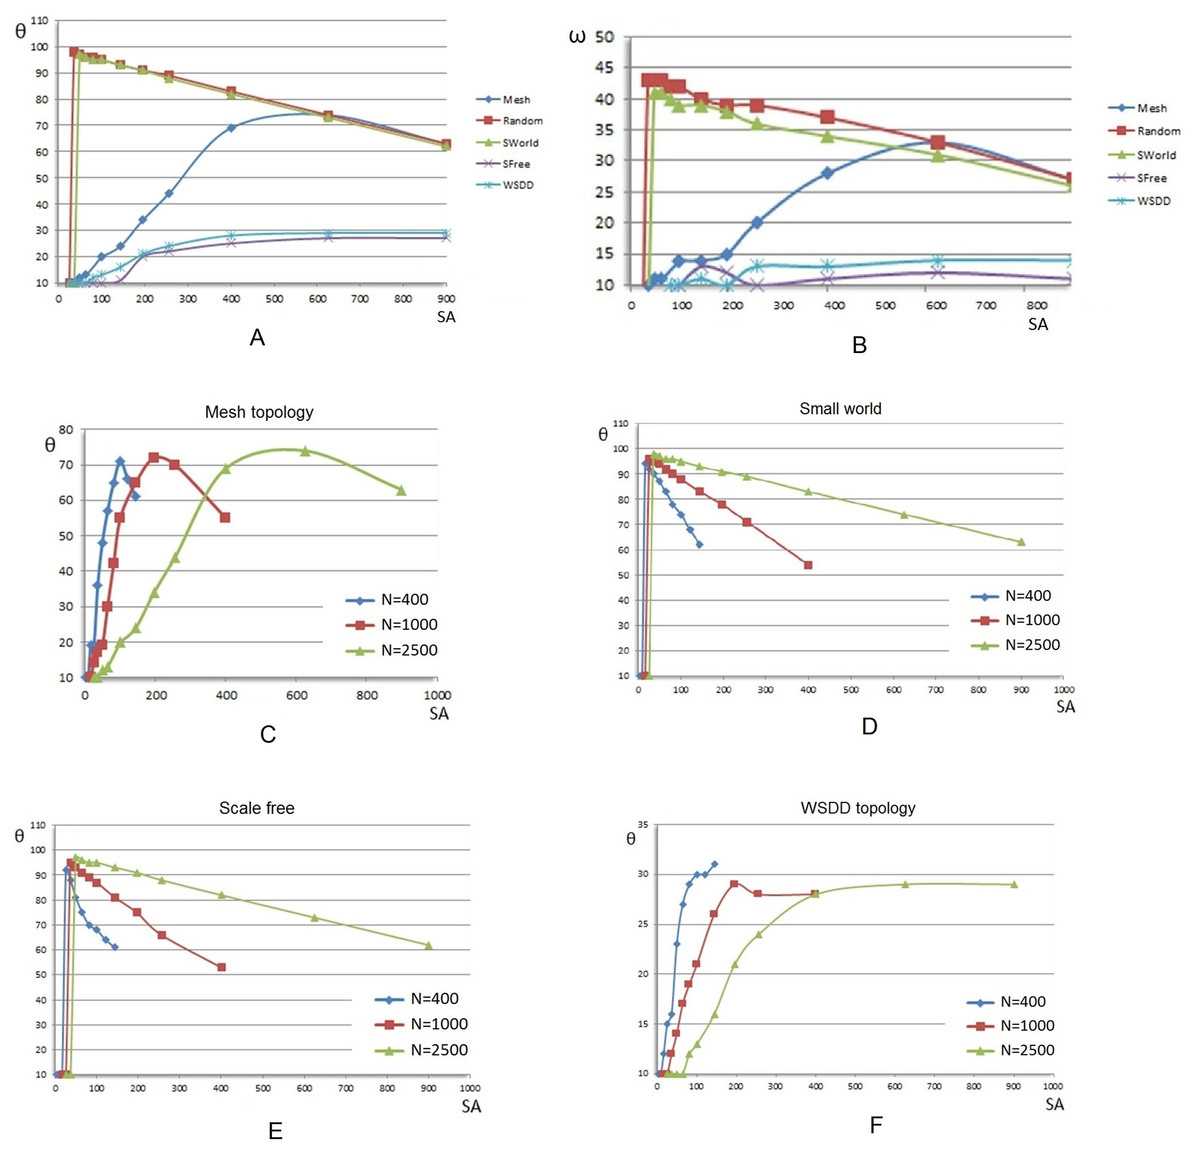
Figure 12: Tolerance (θ) and opinion change (ω) evolution with the increasing concentration of evenly distributed stubborn agents (SA) and increasing network sizes.
values over the five topologies for an increasing concentration of evenly distributed stubborn agents. (A) and (B) θ and ω respective values, over the five topologies when the size of the network is fixed as N = 2,500, and the concentration of stubborn agents ranges from 4% to 36%. (D), (D), (E), and (F) Tolerance θ stabilization values at which social balancing occurs over increasing network sizes (N = 400–2,500 nodes) on mesh, small-world, BA, and WSDD networks, respectively.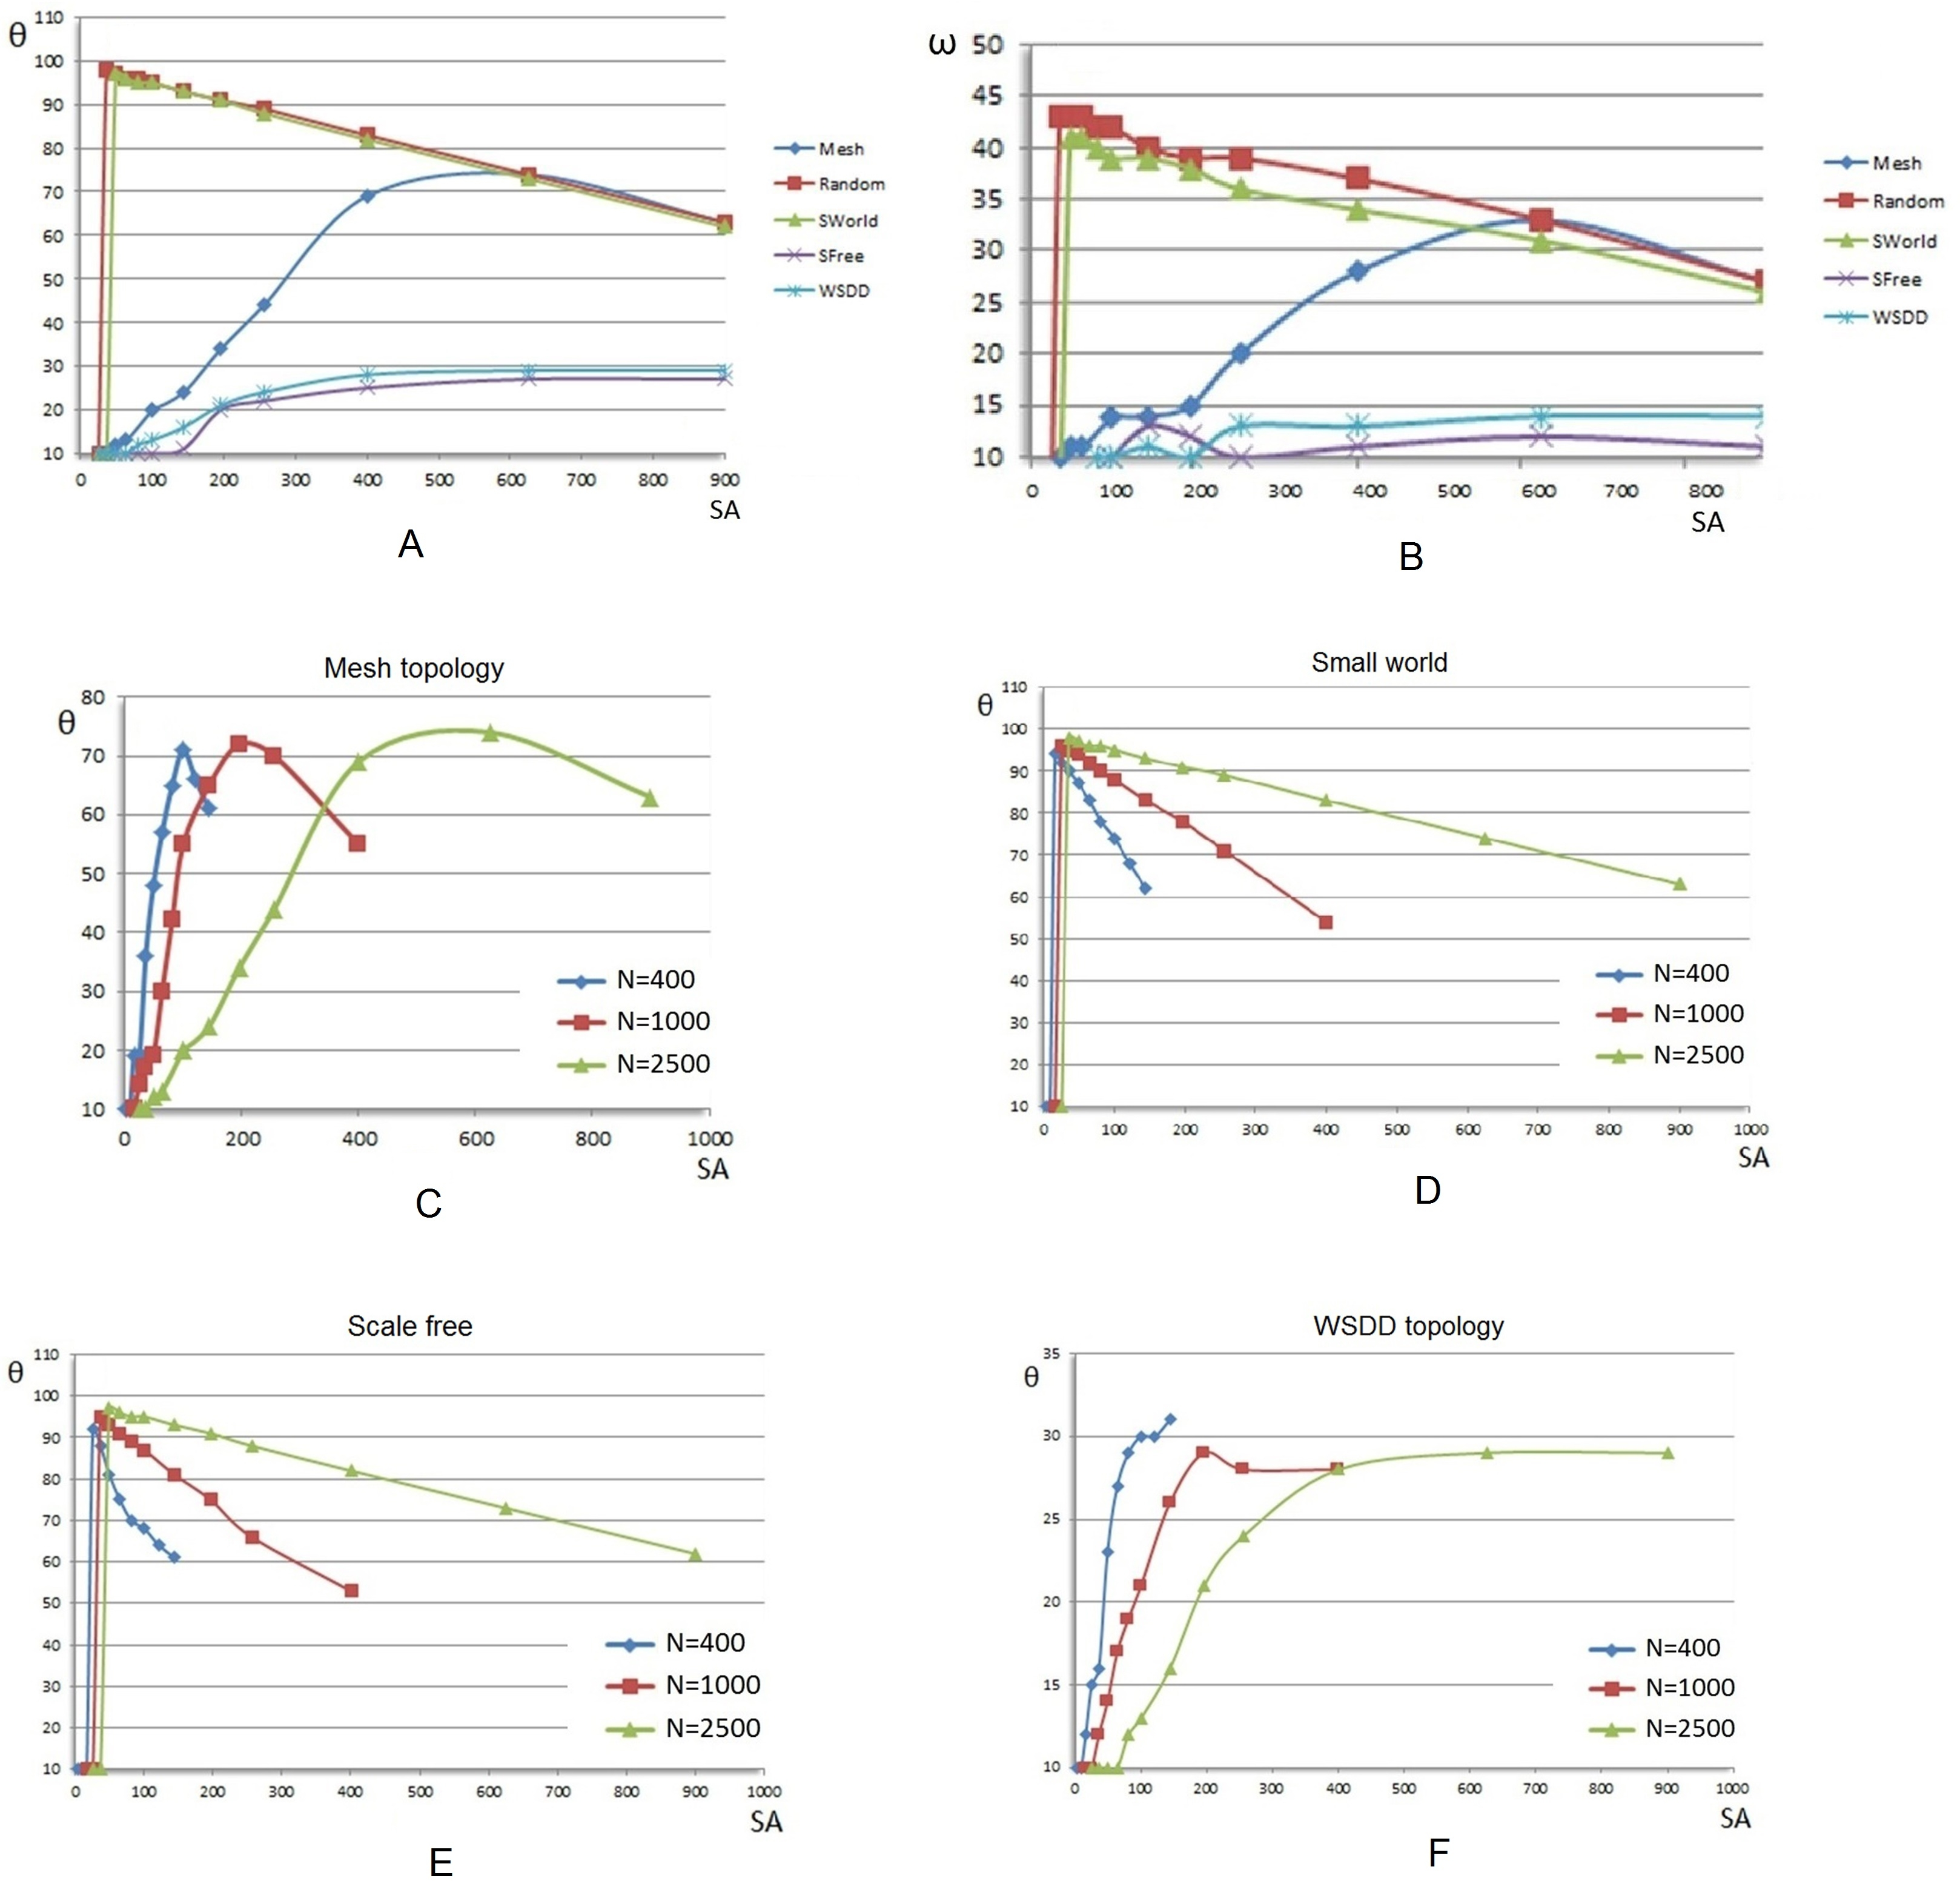
Impact of network size
When analyzing the opinion change at society level, the same observations and classification are valid for all other network sizes. The larger the size N is, the more accurate the delimitation shown in Figs. 12A and 12B becomes.
The impact of size offers a comparison of different tolerance stabilization on the same topology. The results in Figs. 12C–12F show how well the social balancing effect scales with increasing sizes of the network.
The behavior of meshes, presented in Fig. 12C, shows a linearly proportional increase of the critical stubborn agents concentration σ (around 20–25%) in accordance with the network size N. A similar evolution is visible in Fig. 12F, on networks with preferential attachment, where the required σ is also proportionally bigger on larger networks. In Figs. 12D and 12E, the random and small-world networks exhibit similar behavioral patterns: they achieve the critical point σ with maximal opinion change, and then evolve towards intolerance at a pace that is corroborated with N (i.e., a slower drop in tolerance for larger networks occurs).
The results presented in Fig. 12 contains averages stemming from multiple experiments run in SocialSim, then processed separately in Microsoft Excel. In Figs. 12C–12F, the points on the OX axis are fixed SA concentrations which are used throughout these experiments, and the values on the OY axis are averages obtained from multiple runs (i.e., 10). An individual graph from one sub-figure is based on 8 (different SA concentrations) ×10 experiments = 80 simulations. One subfigure is the result of 3 × 80 = 240 simulations, therefore Fig. 12 is based on 4 × 240 = 960 simulations. All simulations presented in this section confirm our main observations (Twitter, MemeTracker, Yelp) on opinion formation phases and phase transition towards social balancing.
Discussion
The results for the proposed tolerance-based opinion interaction model show that, if individual traits are considered for modeling social agents, then we can realistically reproduce real-world dynamical features of opinion formation such as opinion formation phases, as well as their evolution towards social balancing. At the same time, we demonstrate that the dynamics of opinion formation is influenced by topology, network size and stubborn agent (opinion source) distribution across the entire population. Overall, the topology seems to have the strongest influence on opinion formation and spread; this can be summarized by the following different tendencies:
-
Responsive behavior: Tolerance stabilization is attained right after reaching a relatively low critical ratio of stubborn agents. Inserting additional stubborn agents entail a drop in autonomy and opinion flow. Such a behavior is achieved by random and small-world topologies, and it can be motivated by the uniform degree distribution and the existence of both local and long-range links, which foster opinion diversity and social balancing; this can be representative for a decentralized and democratic society.
-
Linear behavior: The critical threshold at which tolerance becomes stable for mesh topologies increases linearly with the stubborn agents concentration. The mesh topology corresponds to a limited, almost “autistic” social interaction behavior (where each agent only interacts with close proximity neighbors); therefore, the probability of opinion diversity only increases with the proportional addition of stubborn agents. For meshes, social balancing is attained only if a substantial number of stubborn agents is inserted.
-
Saturated behavior: Tolerance converges slowly around a specific low value. This behavior is achieved in BA and WSDD networks. Due to the nature of these topologies, even though long-range links exist, nodes tend to be preferentially attached to the same hub nodes, meaning the same opinion sources. The amount of stubborn agents required to reach social balance is much higher and the resulting balance saturates quickly. It is thus a conservative, stratified and oligarchic type of society which reacts later and slower to new stimuli. Most individuals within this type of society remain intolerant and opinion change is treated as suspicious and non-credible.
Besides these original contributions, the results obtained with our model confirm prior studies which show how individuals converge towards the state of their ingroup (Moons et al., 2009; Van Der Schalk et al., 2011). This is especially noticeable on networks with high modularity, like the WSDD network in which every member in a community converges towards the community’s dominant opinion, yet every community converges towards a different state.
An important real-world aspect of our new tolerance model (which assumes that the level of acceptance of neighboring opinions evolves over time) is that the tolerance level of an agent θi(t) is proportional to the degree of the node. In other words, the more neighbors a node has, the more likely it is to receive different influences which can guarantee a higher tolerance level. This observation is backed up by a recent study which proves that individuals with a higher (in)degree are less likely to be influenced, and the influence of friends is not significantly moderated by their friends’ indegree and friendship reciprocity (Geven, Weesie & Van Tubergen, 2013).
The results rendered with our tolerance model also fall in line with a research direction started by Gross & Blasius (2008) where the authors show that there is a self-organization in all adaptive networks, including multi-agent opinion networks. Our real-world observations and opinion simulation results show a similar topological self-organization based on stubborn agent topological properties.
Finally, the study of opinion dynamics through our proposed concept of social balancing shows key features that may be used in practical applications, like marketing or conflict resolution. Under the requirement of keeping the social state stable, while never reaching intolerance, we provide a classification of network topologies based on the social balancing property. Networks with the democratic small-world structure promote balancing; the phenomenon is also exhibited if there is a high concentration of stubborn agents to stabilize opinion in mesh networks. If there are significantly fewer stubborn agents in the network, balancing will only be achieved if one side is using a placement strategy to counter its rivals (Gionis, Terzi & Tsaparas, 2013). A small-world network will not offer an advantage to any of the opinions due the link layout and uniform degree distribution. On the other hand, the oligarchic scale-free topology shows a clear importance of strategically placed agents in hub nodes which intrinsically render the opposing nodes on lower levels of the tree virtually powerless. The balancing phenomenon does not occur in networks with scale-free properties. Clearly, the social balancing concept remains open for further debate, improvement, and real-world validation.