
Popularity bias reduction in multi-criteria recommender systems: the RelPref and PriRelPref approaches
- Published
- Accepted
- Received
- Academic Editor
- Giovanni Angiulli
- Subject Areas
- Data Mining and Machine Learning, Data Science
- Keywords
- Multi-criteria recommender systems, Popularity bias, User priority, Preference model, Tendency
- Copyright
- © 2026 Ballı and Turkoglu Kaya
- Licence
- This is an open access article distributed under the terms of the Creative Commons Attribution License, which permits unrestricted use, distribution, reproduction and adaptation in any medium and for any purpose provided that it is properly attributed. For attribution, the original author(s), title, publication source (PeerJ Computer Science) and either DOI or URL of the article must be cited.
- Cite this article
- 2026. Popularity bias reduction in multi-criteria recommender systems: the RelPref and PriRelPref approaches. PeerJ Computer Science 12:e3658 https://doi.org/10.7717/peerj-cs.3658
Abstract
Popularity bias represents a critical challenge in multi-criteria recommender systems, as collective trends may dominate individual preferences during personalization, thereby complicating the accurate modeling of users’ multi-dimensional preference structures. To address this issue, existing approaches for popularity bias mitigation are reviewed, and two novel methods, Relative Preference Model (RelPref) and Criterion-Aware Relative Preference Model (PriRelPref), are proposed. These methods model multi-criteria user--item interactions in a more precise and balanced manner by explicitly incorporating users’ criterion priorities. RelPref dynamically evaluates user ratings across multiple criteria, whereas PriRelPref further integrates user-specific criterion prioritization to more effectively control the influence of popularity. By aligning users’ most important criteria with the criteria in which items perform strongly, the proposed approaches generate recommendation lists that better reflect individual preferences while maintaining balance across criteria. Experimental results indicate that the proposed methods improve the overall quality of recommendations by enhancing personalization and supporting more balanced item exposure.
Introduction
With the rapid advancement of digital technologies and the increasing integration of online platforms into everyday life, users are now confronted with an unprecedented number of product and service options. While this expansion provides individuals with a broader pool of choices across various domains, it also renders decision-making processes more complex and time-consuming (Sarwar et al., 2001). For instance, selecting a movie that aligns with personal preferences from among thousands of titles on a streaming platform, or identifying the most suitable accommodation from hundreds of hotel options during travel planning, can impose a significant cognitive burden on users (Pazzani & Billsus, 2007). In this context, recommender systems have emerged as critical tools in digital interaction environments, designed to help users manage the overwhelming abundance of information and facilitate decision-making processes (Burke, 2002).
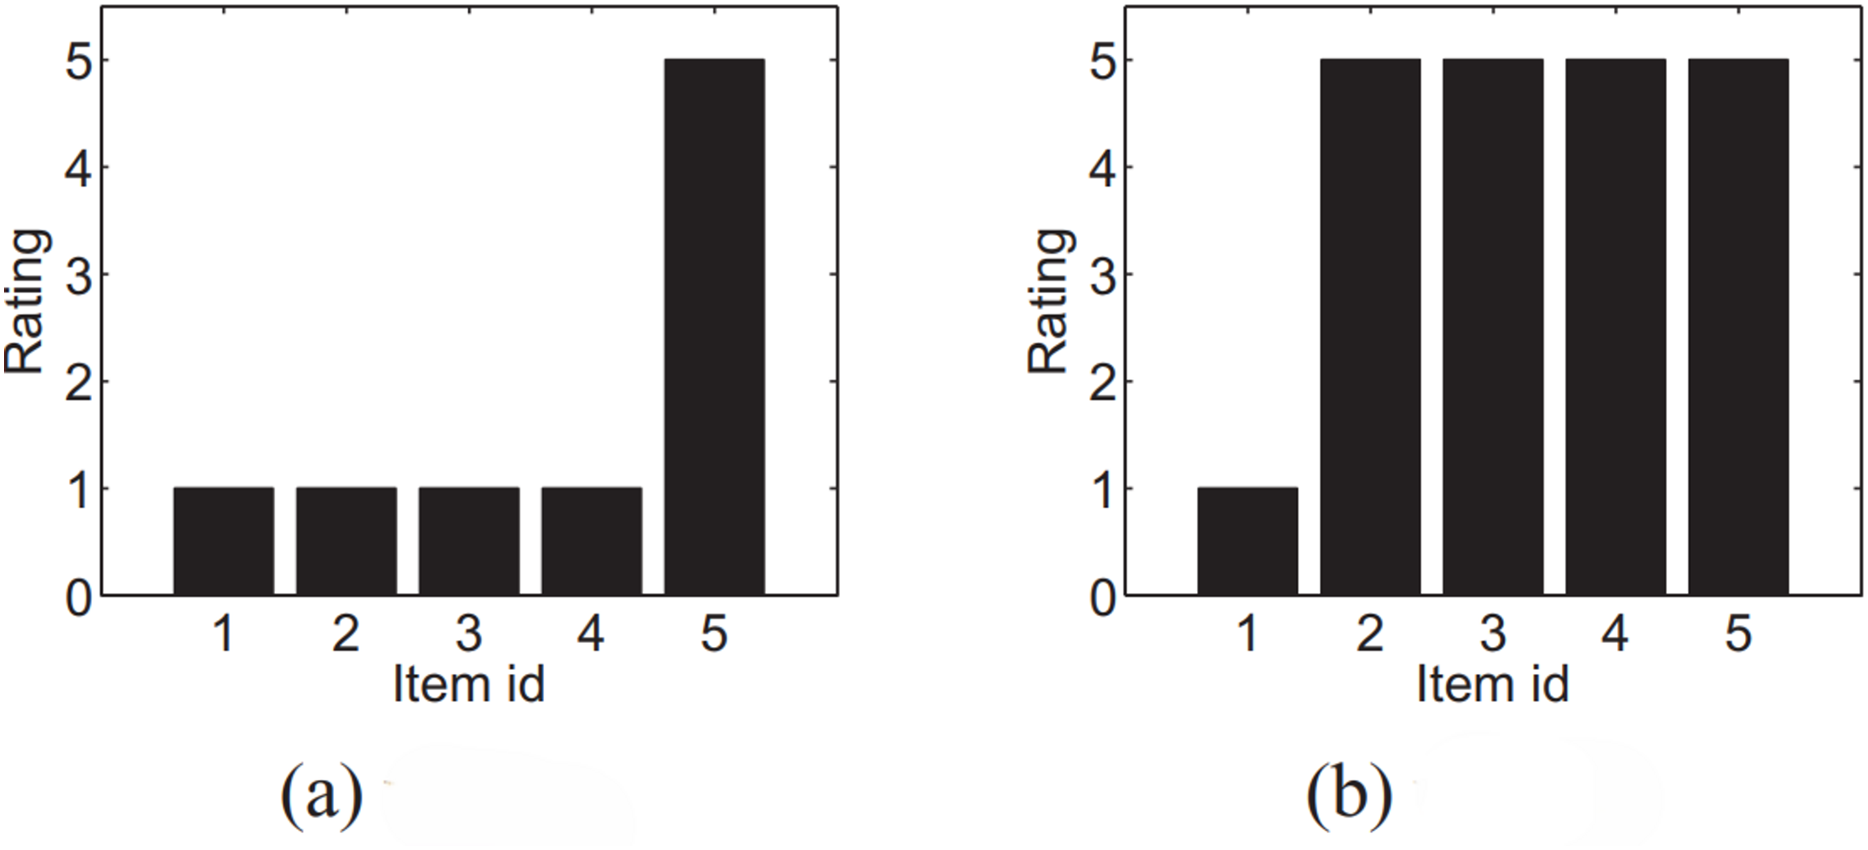
Recommender systems aim to predict items or content that users are likely to prefer by analyzing their historical interactions or explicitly stated preferences. Traditional approaches generally rely on a single overall rating to measure item quality and to identify similarities between users or products (Adomavicius & Kwon, 2012). While such methods can be effective in certain cases, they fail to capture the inherently multidimensional structure of items and the heterogeneity of user preferences (Lakiotaki, Matsatsinis & Tsoukias, 2011). For instance, in movie recommendation scenarios, one user may emphasize the importance of story and acting, whereas another may value visual effects or the director’s style. Similarly, in hotel recommendations, some users may prioritize location, while others focus more on cleanliness, customer service, or available amenities (Sahoo, Singh & Mukhopadhyay, 2012). To address this diversity, Multi-Criteria Recommender Systems (MCRS) have been developed, enabling users to evaluate items along multiple dimensions rather than providing only a single overall score (Chen, Chen & Wang, 2015). By analyzing ratings for each criterion separately, MCRS are capable of generating more comprehensive and personalized recommendations, highlighting items that may not have the highest overall rating but perform strongly in the criteria that matter most to a specific user (Lee et al., 2016). However, the effectiveness of such systems largely depends on accurately interpreting user rating behaviors. Identical scores may convey different meanings depending on individual rating tendencies and contextual preferences. For example, consider two users, and , who both assign a score of 5 to item within the set (Fig. 1). If user frequently gives maximum ratings, this score may reflect a generally lenient rating behavior. Conversely, if user rarely assigns five stars, the same score may indicate a particularly strong level of satisfaction. Therefore, user ’s preference for is stronger than that of user , despite the identical absolute ratings assigned by both users. This observation highlights the importance of modeling relative rating behaviors and contextual tendencies to achieve genuinely personalized and reliable recommendations.
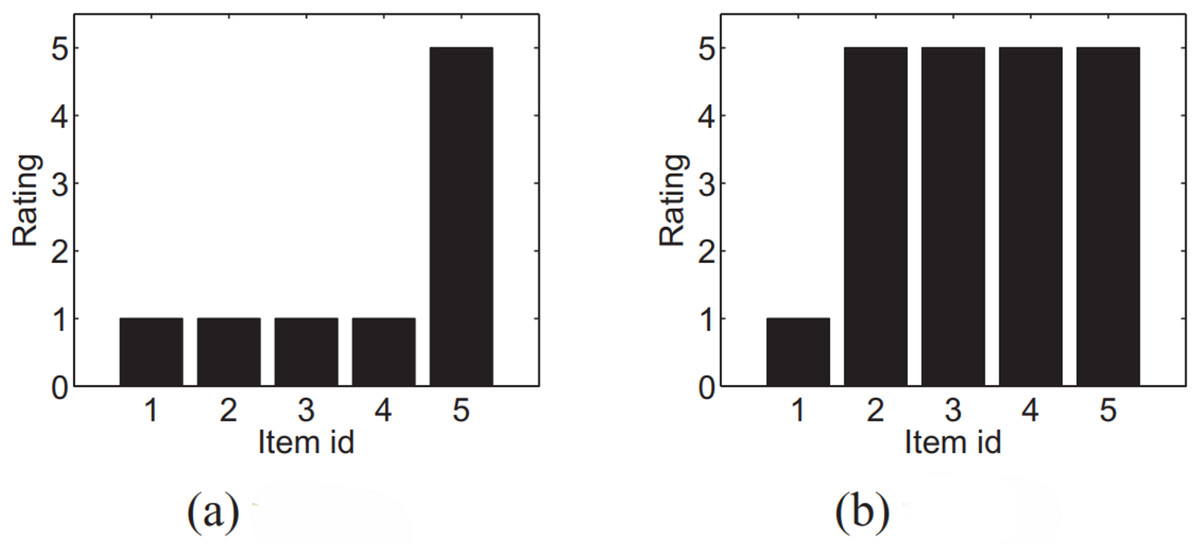
Figure 1: The rating distribution of two users (A) u and (B) v.
Therefore, structurally modeling users’ rating behavior is a critical factor in enhancing the personalization quality of recommendations. Relative interpretations of ratings, based on individual tendencies and rating distributions, offer a more nuanced understanding of user preferences—something that MCRS is uniquely equipped to exploit.
Although MCRS extend the capabilities of traditional single-criterion systems by capturing users’ preferences across multiple dimensions, they also introduce unique challenges. Among these, one of the most critical is popularity bias, which undermines fairness, diversity, and long-term user satisfaction (Abdollahpouri, Burke & Mobasher, 2017). Popularity bias refers to the tendency of recommendation algorithms to disproportionately favor items with high visibility, such as those with many ratings or frequent interactions. Consequently, niche or long-tail items lose exposure, reducing overall discoverability (Park & Tuzhilin, 2008). In multi-criteria contexts, this problem becomes even more complex: an item may appear favorable based on its aggregated overall score, even if it performs poorly in the specific criteria most valued by a user. This discrepancy weakens personalization quality and diminishes the fairness of recommendations.
Recent studies such as Dynamic User-oriented re-Ranking (DUoR), Popularity-aware item weighting (Paiw), and other popularity-debiasing models have primarily focused on single-criterion recommendation settings, aiming to balance accuracy and diversity or to mitigate popularity bias through re-ranking and calibration strategies (Gulsoy et al., 2025). However, these conventional approaches overlook the inherently multi-dimensional nature of user evaluations in MCRS, where popularity bias may arise and propagate differently across distinct criteria. In this context, the present study focuses on evaluating classical re-ranking methods (DUoR, Paiw, Augmentative (Aug), Multiplicative (Mul)) that are specifically designed to alleviate popularity bias. These methods provide an interpretable and methodologically consistent comparison framework, which enables a transparent and systematic assessment of bias mitigation performance. Although recent neural approaches, such as neural graph collaborative filtering and counterfactual debiasing, have demonstrated promising potential for addressing bias and fairness issues in recommendation tasks (Wang et al., 2019; Wei et al., 2021), the present work deliberately excludes deep learning–based recommenders from its experimental scope. This design choice aims to maintain analytical clarity and isolate the effects of re-ranking strategies without introducing additional representational or optimization complexities that could confound the comparative analysis.
Building on this limitation, despite the increasing attention toward fairness and bias mitigation in recommender systems, there remains a notable gap in understanding how popularity bias manifests, interacts, and propagates within multi-criteria structures. Addressing this research gap, the current study presents the first systematic analysis of popularity bias in MCRS and proposes a novel framework that incorporates users’ criterion-level priorities into the recommendation process. By aligning item strengths with the aspects most valued by individual users, the proposed approach effectively reduces the dominance of overly popular items and promotes recommendation lists that are balanced, diverse, and fairness-aware.
The main contributions of this study are as follows:
A baseline model tailored to multi-criteria recommender systems is proposed to address popularity bias. This foundational approach offers a systematic reference point for objectively evaluating the performance of new methods designed to mitigate the bias.
A novel method is developed to reduce popularity bias in next-generation multi-criteria recommender systems. Unlike traditional approaches, this method considers the alignment between users’ most valued criteria and the dimensions in which items excel, fostering a more user-sensitive and impartial recommendation mechanism.
To better analyze the effects of popularity bias in multi-criteria settings, three distinct scenarios centered on user rating behavior are proposed. These scenarios allow for a detailed examination of users’ rating tendencies, scale perceptions, and criteria-based sensitivities, thus enhancing the integration of rating dynamics into the recommendation model and improving personalization accuracy.
The impact of the proposed method on mitigating popularity bias is comprehensively evaluated using multi-dimensional metrics such as long-tail item visibility and diversity (Gini index). This evaluation not only assesses user-level benefits but also illustrates the method’s implications for system-level fairness and inclusivity.
This study is the first to systematically address popularity bias within the context of multi-criteria recommender systems. By filling a critical gap in the literature, it lays an important theoretical and methodological foundation for future research in this domain.
The remaining parts of our article are organized as follows: ‘Preliminaries’ provides a comprehensive review of the literature on recommender systems and popularity bias. ‘Proposed Approaches for Popularity Bias Mitigation in Multi-Criteria Recommender Systems’ details the methods and algorithms employed in the study. The proposed methodologies and algorithms are introduced in ‘Experiments’. ‘Experimental Results’ describes the experimental design and the performance metrics utilized for evaluation. The results of the experimental analysis are presented in ‘Discussion’. Finally, ‘Conclusion and Future Work’ presents the discussion of the findings, followed by the conclusions and directions for future research.
Related work
The evolution of recommendation systems and the problem of popularity bias has become a significant research area attracting attention from researchers across different disciplines in recent years. When examining the studies in the literature, a clear evolutionary process can be observed, ranging from the fundamental building blocks of recommendation systems to today’s complex multi-criteria approaches. Throughout this evolution, it is evident how both technical and user-oriented aspects of the systems have developed, and how the popularity bias problem has been addressed from different dimensions.
In early studies, introduced the collaborative filtering approach, laying the foundation for recommendation systems by computing user similarities based on single rating values. This idea was later extended by Sarwar et al. (2001) through matrix factorization techniques, enabling more efficient handling of user-item interactions. Similarly, Pazzani & Billsus (2007) developed content-based filtering approaches that generated user profiles using single-criterion evaluations, while (Burke, 2002) proposed hybrid recommendation models to enhance diversity and mitigate the limitations of pure collaborative or content-based systems. The introduction of latent factor models by Koren, Bell & Volinsky (2009) further improved the modeling of user-item interactions, and (Su & Khoshgoftaar, 2009) provided a comprehensive overview of similarity-based and content-driven prediction methods for single-criterion systems. However, the major limitation of these studies was one-dimensional treatment of user preferences. This limitation motivated the emergence of MCRS, which allow users to evaluate items across multiple aspects. Adomavicius & Kwon (2012) conducted one of the pioneering studies highlighting the significance of incorporating multiple criteria, while Lakiotaki, Matsatsinis & Tsoukias (2011) analyzed detailed criterion-weighting mechanisms. Sahoo, Singh & Mukhopadhyay (2012) explored the influence of different criteria in movie recommendations, and (Chen, Chen & Wang, 2015) demonstrated the importance of multi-dimensional evaluation in hotel recommendation systems. Collectively, these studies revealed the necessity of modeling the multi-faceted nature of user preferences and set the foundation for modern MCRS research.
Building on this foundation, recent studies have aimed to improve the accuracy, diversity, and robustness of multi-criteria recommender systems through hybrid and deep learning-based models. Batmaz & Kaleli (2019) proposed an autoencoder-based MCRS (AE-MCCF) that effectively captured nonlinear user–item relationships, while (Batmaz & Kaleli, 2024) extended this approach with a hybrid similarity-based model integrating latent features from reviews and criteria ratings to alleviate sparsity. In addition, Kaya & Kaleli (2022) introduced an intuitionistic fuzzy set-based top- method enhancing diversity and novelty, and (Kaya & Kaleli, 2023) analyzed the robustness of multi-criteria top- algorithms against shilling attacks. To address such vulnerabilities, Kaya, Yalcin & Kaleli (2023) proposed a classification-based detection model that distinguishes genuine and malicious profiles using behavioral and popularity-based features. Furthermore, Adomavicius & Kwon (2012) demonstrated that ranking-based post-processing techniques can enhance aggregate diversity without compromising accuracy, inspiring subsequent research to balance personalization, diversity, and robustness in multi-criteria environments.
In addition to the detailed discussion above, Table 1 provides a summary of key studies in the field of multi-criteria recommender systems, highlighting methodological contributions and comparative performance characteristics.
| Method category | Representative studies | Main strengths | Key limitations/Gaps |
|---|---|---|---|
| Conceptual and Taxonomy-Based MCRS | Adomavicius & Kwon (2012), Manouselis & Costopoulou (2007), Zheng & Wang (2023) | Established theoretical foundations and taxonomies for multi-criteria recommender systems | Static criterion modeling; lack of empirical validation; no analysis of popularity bias or fairness |
| Classical Multi-Criteria Recommendation Models | Jannach, Karakaya & Gedikli (2012), Al-Ghuribi & Noah (2019), Musto et al. (2017) | Improved relevance and accuracy using feature weighting, reviews, and sentiment analysis | Focus mainly on accuracy; scalability limitations; popularity bias and fairness not explicitly addressed |
| Re-ranking and Robustness-Oriented MCRS | Kaya & Kaleli (2022), Kaya & Kaleli (2023) | Enhanced robustness, diversity, and resistance to shilling attacks | High computational complexity; limited datasets; no explicit modeling of popularity bias propagation |
| Attack Detection in MCRS | Kaya, Yalcin & Kaleli (2023) | Effective detection of multi-criteria shilling attack profiles | Security-focused; recommendation quality, fairness, and diversity not jointly evaluated |
| Machine Learning-Based MCRS | Jannach, Karakaya & Gedikli (2012), Anwar et al. (2025) | Improved predictive accuracy using regression, SVM, fuzzy, and soft computing techniques | Limited interpretability; survey-based or theoretical focus; bias mitigation not analyzed |
| Neural Network-Based MCRS | Hassan & Hamada (2017), Shambour (2021), Batmaz & Kaleli (2019) | Strong ability to model nonlinear user–item relationships and improve accuracy | Computationally intensive; low interpretability; fairness and popularity bias largely ignored |
| Hybrid Deep Learning MCRS | Batmaz & Kaleli (2024), Zhang et al. (2021) | Improved sparsity handling, cold-start performance, and predictive accuracy | Domain-specific evaluation; scalability and bias mitigation not systematically studied |
| Survey and Review Studies | Zhu et al. (2019), Anwar et al. (2025) | Comprehensive overviews of deep learning and hybrid recommender systems | Conceptual focus; lack of experimental validation; limited discussion on multi-criteria popularity bias |
Following these advancements in accuracy and robustness, another critical line of research has focused on addressing popularity bias, a pervasive issue observed in both single-criterion and multi-criteria recommender systems. Popularity bias arises when recommendation algorithms disproportionately favor frequently rated or well-known items, thereby reducing exposure to less popular but potentially relevant alternatives. Recent studies in this area, summarized in Table 2, provide a methodological synthesis of prior studies on popularity bias in recommender systems. Existing research mainly focuses on analyzing popularity dominance, improving calibration, or enhancing long-tail exposure. However, most approaches address popularity bias within single-criterion settings and do not explicitly model how bias propagates across multiple evaluation dimensions. Moreover, user-specific criterion priorities and multi-criteria preference structures are largely overlooked, highlighting a critical research gap addressed by the proposed framework.
| Method category | Representative studies | Main contributions | Key limitations/Trade-offs |
|---|---|---|---|
| Popularity Bias Analysis and Measurement | Ekstrand, Riedl & Konstan (2011), Elahi et al. (2021) | Empirical analysis of popularity dominance and bias amplification effects in recommender systems | Primarily analytical; lacks explicit mitigation mechanisms and personalization-aware bias control |
| Calibration-Based and Popularity-Aware Re-Ranking | Liu, Chen & Wang (2023), Yalcin & Bilge (2021), Gulsoy et al. (2025) | Reduced popularity bias through calibration, re-ranking, and user-oriented modeling strategies | User-side modeling required; scalability and real-time deployment challenges |
| Causal and Counterfactual Debiasing Approaches | Wei et al. (2021) | Distinguished the causal effects of popularity bias using counterfactual and matching-based analysis | Methodologically complex; difficult to scale to large datasets or online settings |
| Multi-Domain and Group-Based Popularity Bias Studies | Kowald & Lacic (2022), Yalcin & Bilge (2023) | Analyzed popularity bias across domains, group settings, and personality traits | Limited mitigation strategies; requires large and diverse user samples |
| Fairness-, Calibration-, and User-Centered Bias Modeling | Abdollahpouri, Burke & Mobasher (2017, 2019), Abdollahpouri et al. (2021) | Established relationships among popularity bias, fairness, calibration, and user tolerance | Does not explicitly address dynamic user preference evolution or multi-criteria structures |
| Long-Tail and Diversity-Oriented Popularity Analysis | Tacli, Yalcin & Bilge (2022), Carnovalini, Rodà & Wiggins (2025) | Improved understanding of long-tail visibility and diversity effects under popularity bias | Mostly metric-driven or qualitative analysis; limited generalizability |
| Survey and Taxonomy Studies | Klimashevskaia et al. (2024), Ahanger et al. (2022) | Provided systematic reviews and taxonomies of popularity bias mitigation techniques and metrics | Conceptual focus; lacks empirical validation or novel mitigation models |
| Hybrid and Injection-Based Debiasing Frameworks | Lin et al. (2022), Gulsoy, Yalcin & Bilge (2025) | Proposed hybrid debiasing frameworks combining learning, injection, and balanced rating strategies | Increased computational cost; reliance on controlled or synthetic data settings |
Overall, the studies summarized in the related tables reveal a clear methodological separation in the existing literature. On the one hand, a substantial body of work investigates multi-criteria recommender systems, yet these approaches largely overlook the presence and impact of popularity bias within multi-dimensional preference structures. On the other hand, studies that explicitly address popularity bias and fairness concerns predominantly focus on single-criterion recommendation settings, where user preferences are modeled along a single evaluation dimension. As a result, the interaction between popularity bias and multi-criteria preference modeling remains insufficiently explored.
The present study bridges this gap by jointly considering popularity bias mitigation and multi-criteria recommendation modeling within a unified framework. By integrating criterion-level user preferences into the debiasing process, the proposed approach combines the strengths of both research streams and addresses their respective limitations. This integration enables a more realistic and comprehensive treatment of popularity bias as it manifests across multiple evaluation dimensions, thereby providing a novel contribution to the literature on fair and personalized recommender systems.
Preliminaries
In this section, necessary information about the methods used in the study is given.
User popularity bias metrics in recommender systems
Many methods proposed to mitigate popularity bias in recommender systems aim to reorder recommendation lists using post-processing techniques, penalizing head items while promoting tail items. However, such approaches often overlook users’ actual preferences regarding item popularity. In practice, some users tend to favor popular items, whereas others are more inclined toward less well-known content. Therefore, in order to provide personalized and satisfactory recommendations, it is crucial to accurately identify users’ popularity tendencies and reflect them in the recommendation process. To this end, this section introduces widely adopted methods from the literature that are used to quantify users’ popularity inclination.
Ratio of popular items
Ratio of Popular Items (RPI) is a metric that measures the extent to which an individual user tends to interact with popular items, based on the user’s historical rating behavior. In this approach, item popularity is determined according to the Pareto principle (Abdollahpouri et al., 2021; Sanders, 1987). Specifically, all items are ranked based on the total number of ratings they have received. Following the Pareto rule, the most frequently rated items that account for approximately 20 of the total number of ratings in the system are labeled as popular (head) items, while the remaining items are classified as tail items.
(1) where is popularite ratio of user u, , H are the set of all items rated by user u, the set of popular (head) items, respectively.
Average popularity of rated items
Average Popularity of Rated Items (APRI) is a metric designed to quantitatively assess the extent to which users tend to engage with popular items. In this approach, the popularity of each item is defined as the ratio of the number of users who have rated the item to the total number of users in the system. Subsequently, a user’s APRI score is computed as the arithmetic mean of the popularity values of all the items the user has rated. This metric provides a valuable indicator for examining the relationship between individual rating behavior and system-wide popularity trends (Abdollahpouri, Burke & Mobasher, 2019).
(2) here, U is the set of all users in the system, is the set of items rated by user.
Better than average
In the proposed Better Than Average (BTA) method by researchers (Tacli, Yalcin & Bilge, 2022), it is assumed that only the items a user likes—rather than all rated items—should be considered when estimating user popularity tendencies. For this purpose, a threshold preference level is defined for each user, which is calculated as the average of all rating scores the user has provided. Items rated above this threshold are assumed to be preferred by the user.
In the method, the popularity tendency of a user is computed as follows: First, items are labeled as head or tail based on the Pareto principle, similar to the original RPI method. Then, the user’s average rating score is calculated and used as the threshold preference level. The proportion of preferred items (i.e., items rated above this threshold) that belong to the head category is then computed as an indicator of the user’s popularity inclination.
(3)
In the equation, u denotes a user, and represents the set of items rated by user u. The value refers to the rating given by user u to item i. The average of all ratings provided by user u, expressed as , is used as the user’s threshold liking level. Items that receive a rating above this threshold are considered liked by the user. The set H denotes the head (i.e., popular) items, which are determined based on popularity distributions, typically using the Pareto principle. The value quantifies the proportion of these liked items that fall into the head category, thereby indicating the user’s inclination toward popular items.
In the method, a similar procedure is followed. However, instead of a binary count, the weighted average of the popularity scores of the user’s preferred items (i.e., those above the threshold) is calculated to determine the user’s popularity tendency.
(4)
In the equation, denotes a user and is the set of items rated by that user. The rating given by user to item is denoted by . The average rating across all items rated by , written as , serves as the user’s threshold liking level. Items rated above this threshold are assumed to reflect genuine user preference. The term represents the popularity score of item , which may be based on frequency of ratings, purchases, or views. The score calculates the weighted average popularity of the items liked by the user (i.e., those above the threshold), thereby estimating the user’s general interest in popular content.
In both approaches, only the items rated above the individual threshold are taken into account, thereby aiming to provide a more accurate estimation of a user’s genuine popularity preference, rather than relying on all rated items indiscriminately.
Benchmark algorithms
Popularity bias in recommender systems is a significant issue that negatively impacts both system performance and user experience (Abdollahpouri, Burke & Mobasher, 2019). To address this problem, various algorithms have been proposed in the literature (Castells, Vargas & Wang, 2011), each of which is examined in this section.
Dynamic user-oriented re-ranking
The Dynamic User-oriented Re-ranking (DUoR) algorithm is a re-ranking approach that aims to mitigate popularity bias by incorporating users’ individual popularity tendencies into the recommendation process (Gulsoy et al., 2025). The algorithm operates in several stages. First, a candidate item set C is generated, and its elements are partitioned into head (high popularity) and tail (low popularity) groups using Pareto analysis (Castells, Vargas & Wang, 2011). This partitioning is based on item popularity scores and is intended to better reflect the diverse preference patterns among users (Jannach & Adomavicius, 2017).
DUoR dynamically adjusts the recommendation list according to the user’s popularity tendency score . At each step of the re-ranking process, the algorithm decides whether to include a head or tail item, guided by the user’s inclination toward popular or less popular content (Vargas & Castells, 2020). As a result, the final recommendation list achieves a balance between popular and niche items, tailored to individual user preferences. One of DUoR’s key strengths lies in its dynamic adaptation to each user’s popularity bias, enabling the generation of personalized recommendation lists while effectively reducing overall popularity bias in the system.
Popularity-aware item weighting
The Popularity-aware item weighting (Paiw) is a post-processing re-ranking technique designed to mitigate popularity bias in recommender systems. The primary objective of this method is to reduce the dominance of popular (head) items in recommendation lists and increase the visibility of less popular (tail) items. The method operates in two main stages.
In the first stage, logarithmic inverse weight values are computed for each item based on item popularity scores, which are typically derived from interaction frequencies such as rating counts. The logarithmic transformation ensures that popular items receive lower weights, while less popular items are assigned higher weights, thereby encouraging the recommendation of tail items.
In the second stage, these computed weights are integrated with the predicted recommendation scores of the items. The integration is governed by a tuning parameter, , which balances the influence of the original recommendation score and the inverse popularity weight. A value of is typically selected to achieve a fair trade-off between recommendation accuracy and diversity.
The strength of the Paiw method lies in its ability to promote underrepresented content without significantly compromising recommendation performance. In the study conducted by (Abdollahpouri, Burke & Mobasher, 2018), setting to 0.5 demonstrated an effective reduction in popularity bias while maintaining high recommendation quality.
Augmentative
The Augmentative (Aug) approach is a re-ranking method designed to mitigate popularity bias in recommender systems by computing synthetic ranking scores through the combination of original predicted ratings and inverse popularity-based weights. In this method, predicted scores act as the primary driving factor—reflecting the user’s estimated interest—while the popularity-based inverse weights serve as a secondary adjustment factor to enhance the visibility of less popular (tail) items.
By integrating these two components, the method aims to reduce the dominance of highly popular items while preserving overall ranking accuracy. This trade-off ensures that while fairness and diversity are improved through de-emphasizing popular items, the recommendation system does not significantly compromise its predictive performance. Hence, Aug effectively balances bias mitigation with ranking quality (Yalcin & Bilge, 2021).
Multiplicative
The Multiplicative (Mul) approach is a re-ranking strategy designed to penalize popular items more aggressively in the recommendation process. Similar to the Aug method, Mul seeks to counteract popularity bias by incorporating inverse popularity weights into the recommendation pipeline. However, the key distinction lies in the method of integration: while Aug applies a linear combination of predicted scores and weights, Mul employs a multiplicative mechanism.
More specifically, the final ranking scores are computed by multiplying each item’s predicted rating with its inverse popularity weight. This multiplicative structure strongly suppresses the scores of highly popular items, thereby significantly reducing their chances of appearing at the top of the recommendation list. As a result, the Mul method prioritizes the inclusion of less popular (tail) items and aims to generate recommendation lists enriched with niche content. This strict penalization framework is particularly effective in promoting diversity and mitigating the dominance of mainstream items (Yalcin & Bilge, 2021).
Proposed approaches for popularity bias mitigation in multi-criteria recommender systems
In this study, two novel algorithms are proposed to mitigate popularity bias in recommender systems: the Relative Preference Model (RelPref) and the Criterion-Aware Relative Preference Model (PriRelPref). These algorithms are designed to overcome the limitations of existing approaches and provide a more balanced distribution of content in recommendation lists. Also, RelPref and PriRelPref are first approaches that performed on multi-criteria systems.
Relative preference model
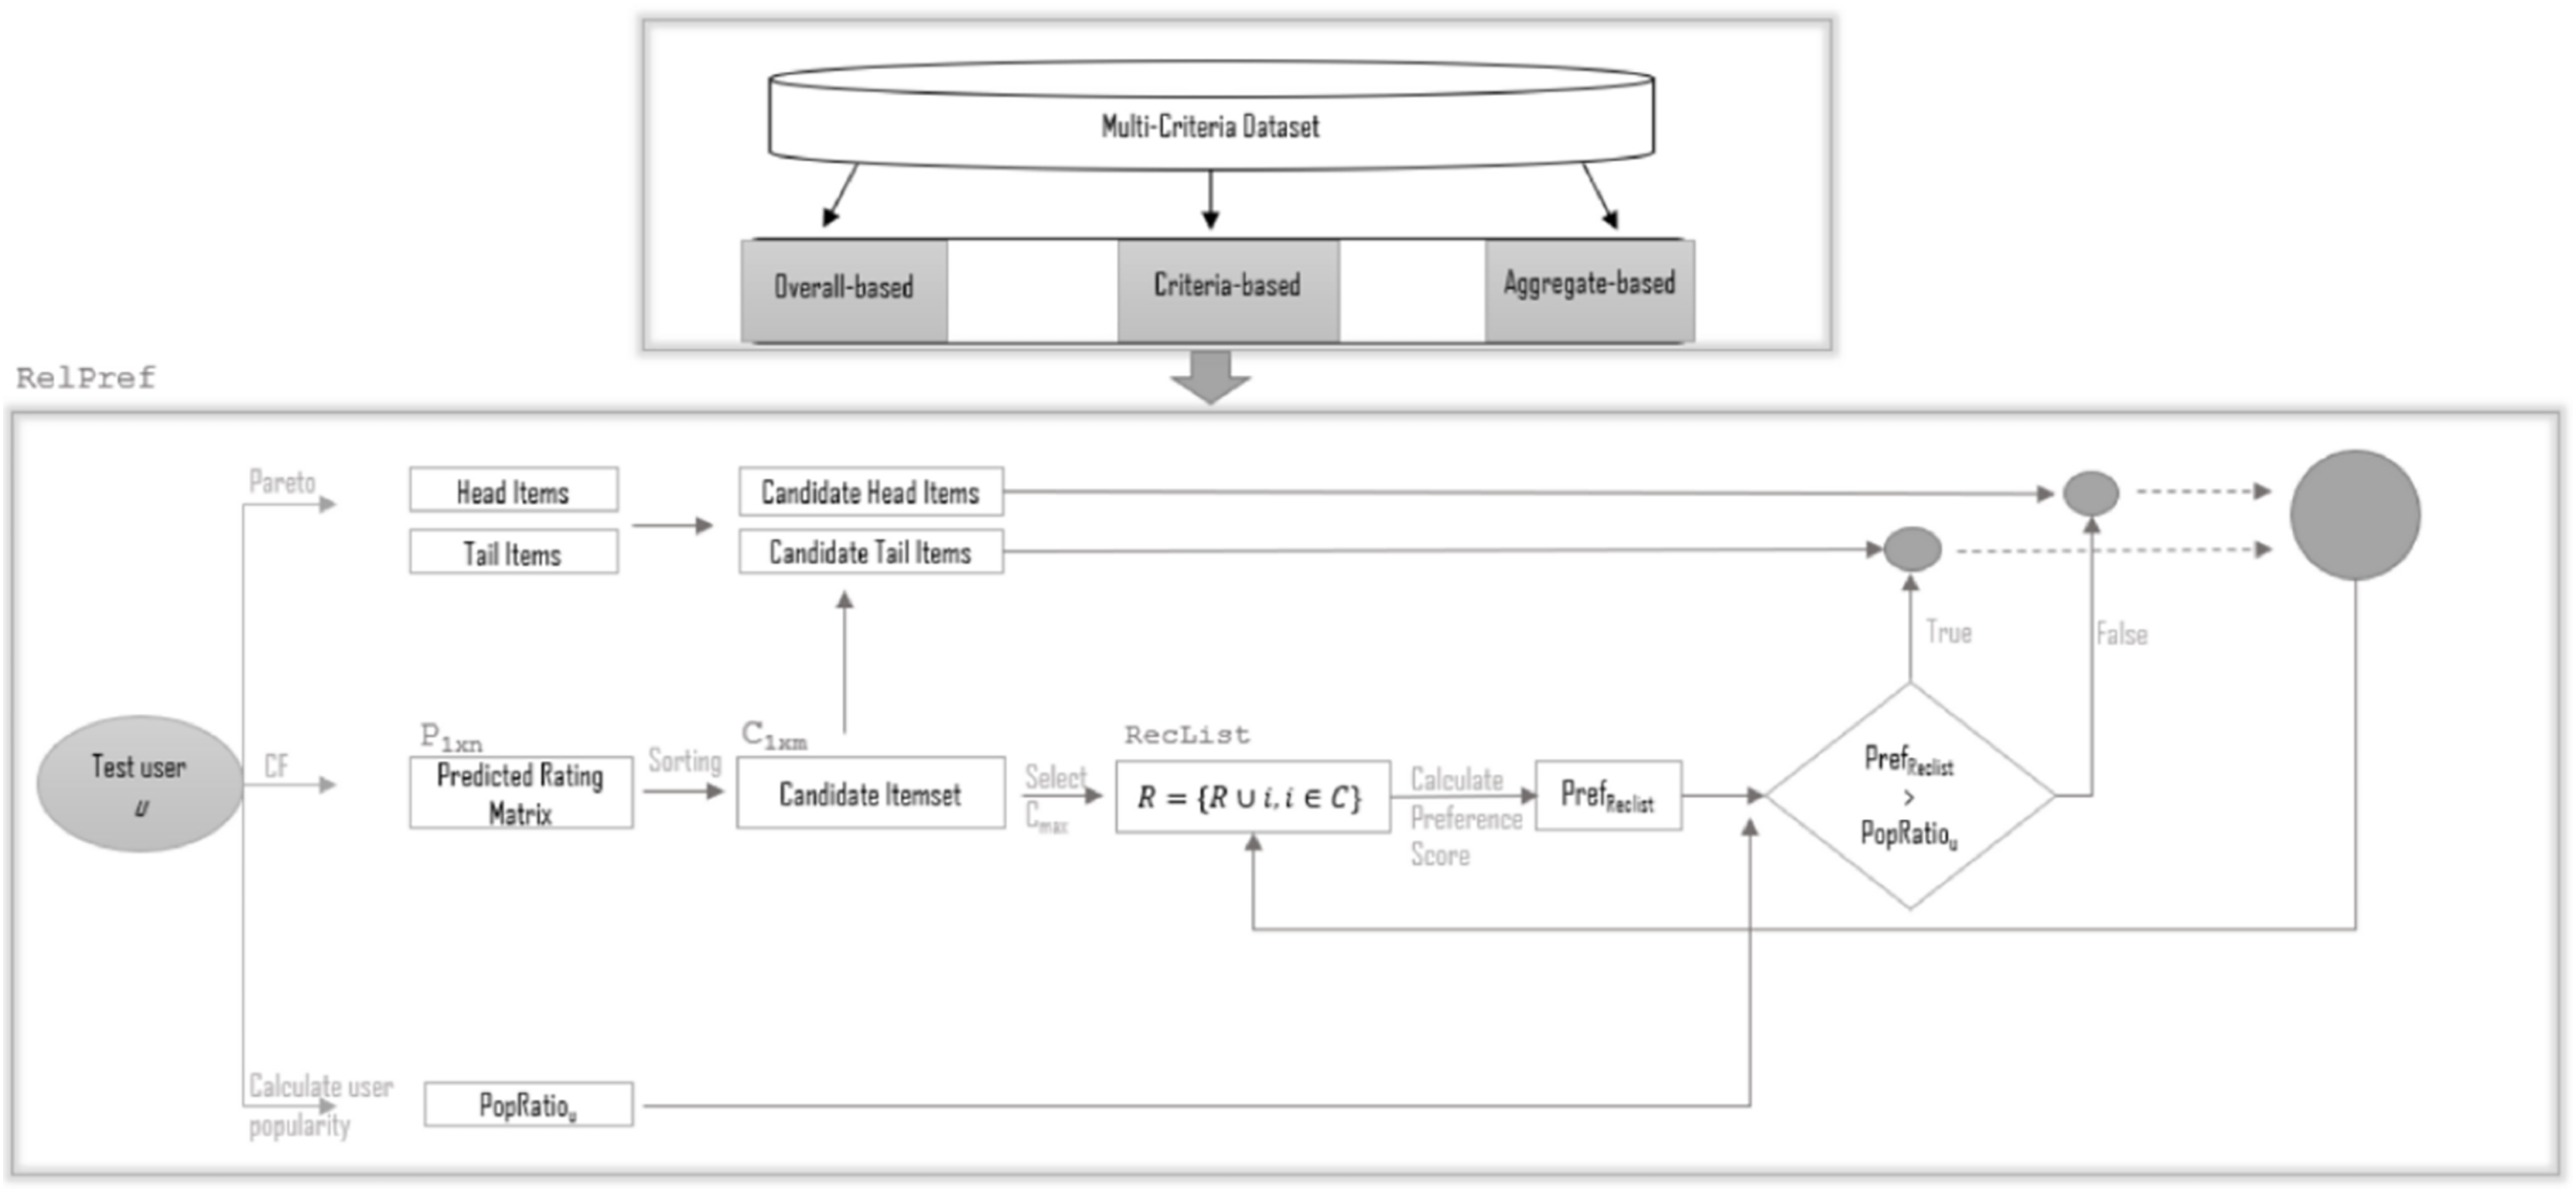
The RelPref is a dynamic and user-centric re-ranking approach designed to mitigate the widespread popularity bias commonly observed in recommender systems. The system architecture, illustrated in Fig. 2, outlines the operational workflow of the algorithm on multi-criteria datasets. This algorithm focuses on understanding users’ tendencies toward item popularity and aims to generate fairer and more personalized recommendations by balancing these tendencies throughout the recommendation process.
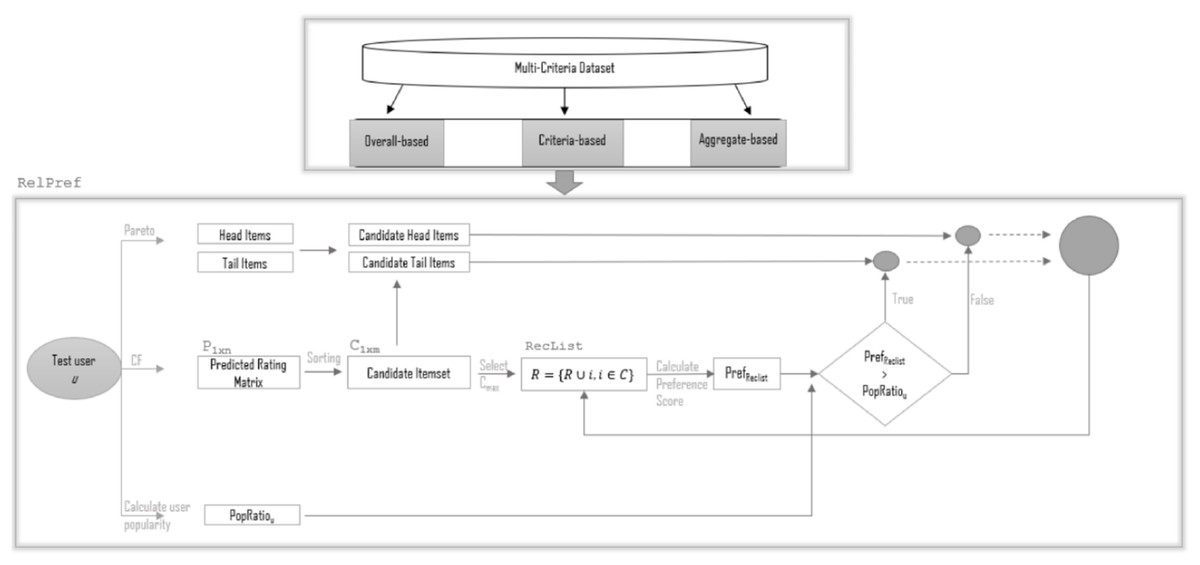
Figure 2: The framework of RelPref.
The proposed RelPref framework is structured around two main components: the Multi-Criteria Dataset and the re-ranking module called RelPref. The first component comprises three distinct types of data representations: overall-based, criteria-based, and aggregate-based. These representations allow for a multidimensional analysis of user rating behaviors, enabling the estimation of popularity at the level of individual criteria (e.g., story, acting, directing, visuals), which are then integrated into the decision-making process of the algorithm. The core component, RelPref, is responsible for the user-focused re-ranking procedure. The process begins by generating a prediction matrix for the test user u using a standard Collaborative Filtering model. This matrix contains the predicted scores for items that the user has not yet rated but may find relevant. The predicted scores are sorted to form a candidate item set . Items in the candidate set are then categorized into head (popular) and tail (less popular) groups based on relative item popularity levels. Subsequently, the user’s individual popularity tendency, referred to as the popularity ratio ( ), is computed (see ‘User Popularity Bias Metrics in Recommender Systems’). This ratio serves as a personalized metric indicating the user’s historical preference toward popular items. The item with the highest predicted score is selected from the candidate set and added to the recommendation list ( ). During this selection, the popularity degree of the current recommendation list ( ) is calculated based on the category of the selected item.
At this stage, item selection is no longer governed solely by predicted scores but also incorporates a metric reflecting the user’s relative preference tendencies. For each candidate item, a user-specific preference score is computed. This score is inspired by the Borda count method and accounts for the item’s relative position within the user’s rating history. Specifically, for each rated item i with rating , the following are calculated:
-
•
The number of items rated lower:
-
•
The number of items rated equally:
-
•
These components are linearly combined to obtain the final relative preference score: where and are weighting parameters, typically set to and in the literature. This method allows for more nuanced ranking distinctions among equally rated items, reflecting the user’s overall rating distribution.
The computed is compared against the user’s . If the list’s popularity level is lower than the threshold, the next item is selected from the candidate head category; otherwise, from the candidate tail category. This iterative procedure continues until the recommendation list reaches the desired length ( ). Consequently, the RelPref module balances both predicted relevance and inferred user preferences, leading to more personalized and diversity-aware recommendations. One of the most distinctive features of the algorithm is its ability to dynamically shift between popularity categories based on individual user tendencies. The RelPref framework continuously monitors the popularity balance of the recommendation list at each step, thereby maintaining diversity while enhancing personalization. Compared to the classical DUoR algorithm, this framework presents a significant advancement. By leveraging criterion-specific popularity analysis, it enables detailed examination of user behavior patterns across different aspects, which are then seamlessly incorporated into the recommendation logic. The RelPref algorithm offers notable advantages in mitigating popularity bias, increasing recommendation diversity, and enhancing user satisfaction, particularly in multi-criteria datasets. As illustrated in Fig. 2, the modular and adaptive architecture of the framework clearly demonstrates how recommendation generation can be both preference-aware and popularity-sensitive.
Table 3 outlines the core steps of the RelPref algorithm along with the methods employed at each stage. The process begins with the representation of multi-criteria user feedback, supporting various data types including overall-based, criteria-based, and aggregate-based formats. Subsequently, items are classified into head and tail categories based on the Pareto principle and global popularity measures. The collaborative filtering is then used to generate predicted scores, from which a candidate set of items is formed. The user’s popularity tendency is computed using the RPI, APRI, and BTA-extended variants, which informs the selection of items for the recommendation list. If necessary, the list is re-ranked according to the user’s preferences and popularity orientation. Finally, a fixed-length recommendation list is produced. This structured approach aims to enhance personalization and diversity by accounting for individual user tendencies toward popular or less-known items.
| Step no | Step description | Method/Process used |
|---|---|---|
| 1 | Multi-Criteria Data Input and Representation | Data types: Overall-based, Criteria-based, Aggregate-based |
| 2 | Separation of Head/Tail Items | Pareto principle, classification based on global popularity |
| 3 | Predicted Rating Matrix ( ) | Collaborative Filtering |
| 3.1 | Generation of Candidate Item Set ( ) | Sorting by predicted scores, selection of top 1 items |
| 3.2 | Construction of Recommendation List ( ) | Item selection from candidate head/tail based on user tendency, computation of |
| 3.3 | Re-ranking Within the Recommendation List | Item selection based on comparison of and |
| 4 | Calculation of User Popularity Tendency ( ) | RPI, APRI, , methods |
| 5 | Termination of the Process | Creation of final recommendation list with fixed length |
Criterion-aware relative preference modell
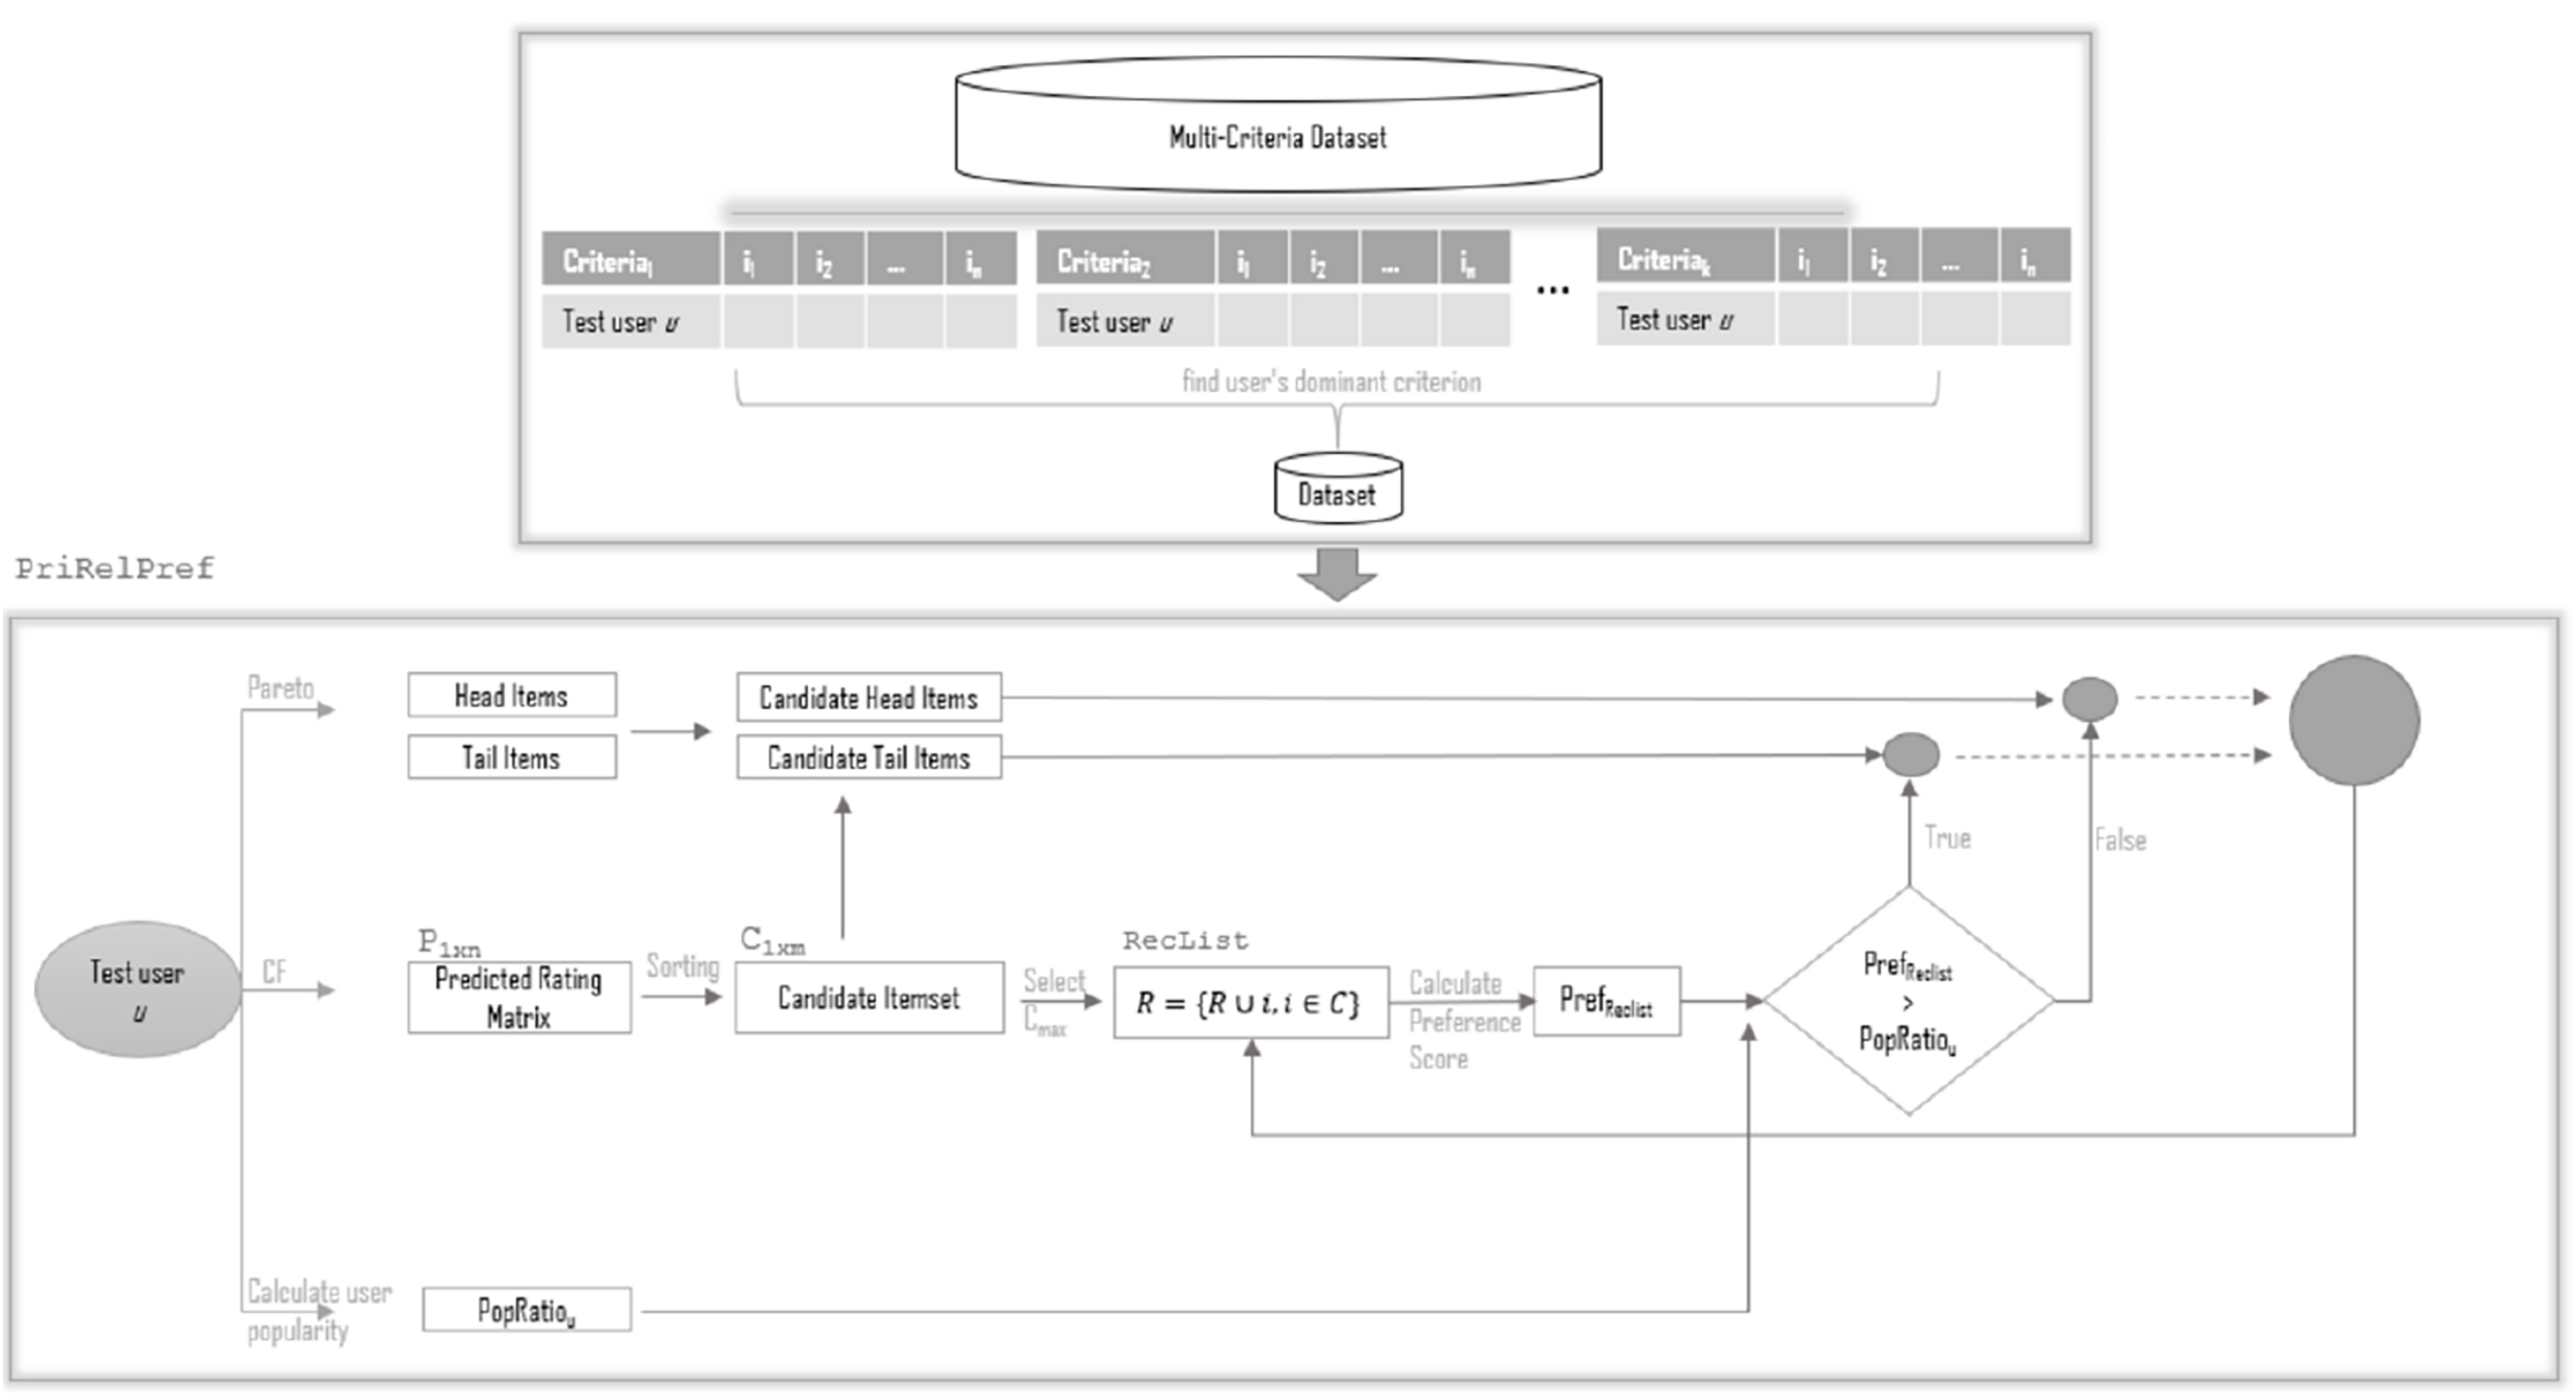
The Criterion-Aware Relative Preference Model (PriRelPref) is an advanced re-ranking framework designed to enhance the fairness and personalization of recommendations by explicitly incorporating user-specific dominant criteria into the recommendation logic. As an extension of the RelPref, the PriRelPref framework preserves the popularity-aware and diversity-sensitive characteristics of its predecessor while refining personalization through multi-criteria learning. The architecture of the proposed PriRelPref model is depicted in Fig. 3.
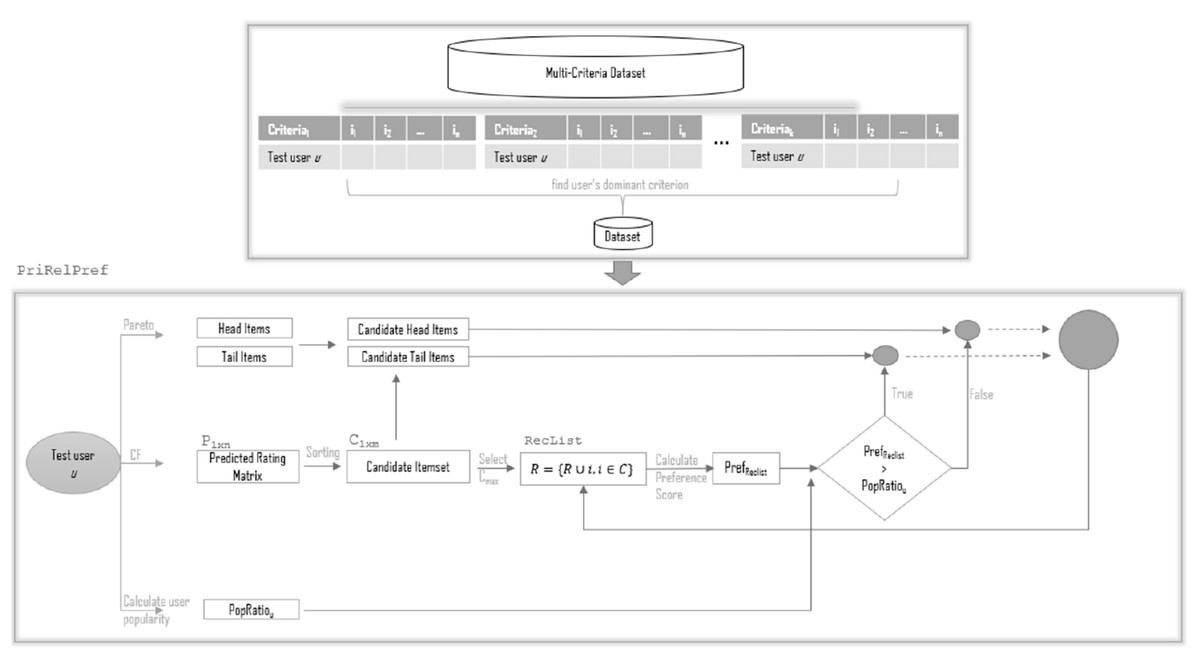
Figure 3: The framework of PriRelPref.
The framework consists of two key modules: (i) the Dominant Criterion Identification Layer, and (ii) the Criterion-Aware RelPref Engine.
Dominant Criterion Identification: The first module introduces an essential personalization enhancement by determining the dominant evaluation dimension (criterion) for each user in a multi-criteria rating dataset. This is accomplished through a Multiple Linear Regression (MLR) model trained to predict the user’s overall rating as a function of multiple sub-criteria (e.g., story, acting, directing, visuals). For each user , the following linear model is employed:
(5) where:
is the predicted overall rating for user ,
is the rating of user on the -th criterion,
is the learned weight for criterion ,
is the residual error.
The criterion with the highest regression coefficient is designated as the dominant criterion for that user. This dominant criterion reflects the most influential aspect of user evaluation and guides the subsequent re-ranking stage.
Criterion-Aware RelPref Engine: Once the dominant criterion for user is identified, the re-ranking phase proceeds similarly to the RelPref model, but with all popularity analysis and preference calculations based on the dominant criterion.
By embedding user-specific criterion importance into the re-ranking logic, PriRelPref introduces a nuanced personalization approach that significantly enhances both the relevance and diversity of recommendations. This makes the model particularly effective for domains such as movies, hotels, or multi-attribute products, where user evaluations span multiple dimensions.
Experiments
In this section, a set of experiments are conducted to evaluate baseline, RelPref, and PriRelPref methods. Firstly, the experimental methodology, dataset, and performance evaluation measures are briefly mentioned.
Testing methodology
In order to evaluate the performance of the proposed approach, we employed the widely adopted leave-one-out cross-validation strategy. According to this methodology, at each evaluation step, a single user from the dataset is randomly selected as the test user ( ), while the remaining users are used to form the training set. Using the training data, a collaborative filtering algorithm (user-based) is applied to generate predicted ratings for all items that the test user has not yet rated. In this implementation, the number of nearest neighbors (k) is set to 50, and the similarity between users is computed using the Pearson correlation coefficient. These predicted scores are then sorted in descending order, and the top-M items with the highest predicted scores are selected to construct the candidate item set C for further re-ranking by the proposed methods.
In the experimental setup, the value of M is fixed at 250, while the length of the final recommendation list N is set to 20. The evaluation primarily focused on top-N recommendation performance, particularly analyzing the top-10 items in the final ranked list.
This experimental framework ensures a personalized evaluation scenario for each user by simulating a real-world recommendation context, where the recommender system must infer user preferences based solely on past interactions. As such, the leave-one-out strategy provides a rigorous and user-centric evaluation of the model’s effectiveness.
Dataset
In the study, Yahoo! Movies (YM) and TripAdvisor (TA) (https://github.com/tugba7203/mcrs-popularityBias), a well-known multi-criteria data set in the field of RS, is used as the data set (Lakiotaki, Matsatsinis & Tsoukias, 2011; Wang et al., 2019). In the YM dataset, users provide preference information based on four criteria, namely acting, story, direction, and visuals. In addition to the individual criteria ratings, users made an overall grade for each movie to reflect overall opinion. We utilize two subsets of the dataset: the YM10 and YM20 data sets, which have a minimum of 10 and 20 ratings for both user and movie, respectively. For in this study, we convert it to a 1–5 scale where [13, 12, 11], [10, 9, 8] corresponds to [5, 4]-stars, respectively, and 1 to 1-star. In the other data set TA, we select a subset in which each user had at least three rating values. The subset contains 4,798 multi-criteria reviews from 1,346 users for 1,289 hotels. In the TA dataset, users make evaluations about hotels based on a discrete and numerical 5-level rating scale from 1 to 5, taking into account the general criteria as well as value, rooms, location, cleanliness, entrance, service and operation criteria. Information on the datasets are shown in Table 4.
| Name | #Users | #Items |
|---|---|---|
| YM20 | 429 | 491 |
| YM10 | 1,827 | 1,471 |
| TA | 1,346 | 1,289 |
Evaluation metrics
Popularity bias in recommender systems is evaluated using different evaluation metrics. This section discusses the metrics used in the study.
Precision is employed in this study as a key metric to assess the extent of popularity bias in recommender systems. It quantifies the proportion of relevant items among the total number of recommended items, thereby offering insight into the system’s ability to prioritize user-specific relevance over general item popularity. In scenarios where popularity bias is present, the system tends to recommend widely popular items regardless of individual user preferences, which can negatively affect precision. Particularly in cold-start situations, as the length of the recommendation list increases, the likelihood of irrelevant—albeit popular—items being included also rises. A high precision score, therefore, reflects the system’s capacity to minimize false positives and resist the tendency to favor popular items at the expense of personalization. Precision remains one of the most commonly applied metrics in studies examining relevance and bias in recommendation outputs (Alhijawi et al., 2022).
(6) where, is the set of relevant items for user u, is the set of top-K recommended items for user u.
Recall is another fundamental metric that is often considered alongside precision in the evaluation of recommender systems. It measures the proportion of relevant items successfully retrieved by the system out of the total number of relevant items available to the user. In contrast to precision, recall typically exhibits a positive correlation with the length of the recommendation list (Alhijawi et al., 2022). That is, as the number of recommended items increases, the likelihood of including a greater number of relevant items also increases. A high recall score indicates that the system is effective in capturing and presenting relevant items to the user, thereby ensuring broader coverage of user interests within the recommendation set.
(7) here, is the set of relevant items for user u, is the set of top-K recommended items for user u.
F1-measure is the harmonic mean of Precision and Recall, providing a balance between them. It is defined as:
(8)
Novelty is defined as the products that the user does not know but can be satisfied (Zhang et al., 2013).
(9) where R is the size of top-n recommended items, p(i) represents the probability for the item i to be rated by any user.
Average Percentage of Long Tail Items (APLT) measures the proportion of niche or less popular (long-tail) items within a user’s top-N recommendation list. Long-tail items are defined based on the Pareto principle (Sanders, 1987). In this study, the item set is divided into two parts according to popularity distribution: the top 20% most frequently rated items were considered as the head, while the remaining 80% are classified as the long-tail. For user K, with recommended list , APLT is calculated as:
(10) where T is the set of long-tail items. Averaged over all users, APLT indicates the system’s overall ability to suggest niche items. Low APLT values suggest poor diversity, while high values imply better inclusion of long-tail content, though not necessarily higher recommendation quality.
Long-Tail Coverage (LTC) quantifies the fraction of long-tail items recommended across all users. Let be the union of all users’ top-N recommendations, with duplicates removed. LTC is defined as:
(11) Higher LTC values indicate broader coverage of long-tail items by the recommender system, reflecting improved diversity and reduced popularity bias.
Gini Index is a metric used in decision tree algorithms to measure the impurity or diversity of a dataset. It quantifies how mixed the classes are within a node: a Gini index of 0 indicates perfect purity (all elements belong to the same class), while higher values indicate greater class diversity. Essentially, it reflects the likelihood of incorrectly classifying a randomly chosen element if it were labeled according to the class distribution in the node. The lower the Gini index, the better the split for classification purposes.
(12) where, D is the dataset, is the proportion of class i in dataset D.
Experimental results
In this study, we investigate the growing challenge of popularity bias in recommender systems, particularly within multi-criteria rating environments. Our primary objective is to introduce two novel algorithms, RelPref and PriRelPref, which aim to mitigate popularity bias by modeling contextual variations in user rating behavior. These algorithms capture user-specific tendencies and interpret rating patterns relative to individual behavioral contexts. For comparison, four established baseline methods—DUoR, Paiw, Mul, and Aug—are also included in the evaluation. The experiments are conducted on three multi-criteria datasets: YM20, YM10, and TA. The evaluation framework is designed to assess both recommendation accuracy and the extent to which each method mitigates popularity bias. To estimate users’ inherent inclination toward popular items, four distinct popularity tendency metrics are employed: APRI, RPI, , and . Each recommendation algorithm is evaluated under all four estimation strategies, enabling a detailed and nuanced analysis of performance across different user profiles. A comprehensive set of evaluation metrics is used to assess the recommendation outcomes, including Precision, Recall, F1-measure, Novelty, APLT, LTC, and the Gini index. The experiments follow a standard leave-one-out protocol in which one user is designated as the test subject and the remaining users constitute the training set. For each test instance, popularity tendency scores are computed using the four estimation methods, after which the recommendation algorithms generate top-N lists conditioned on these scores. This experimental design provides a systematic and equitable basis for comparing the proposed models with the baseline approaches, particularly regarding ability to balance accuracy and diversity while mitigating popularity bias.
The experimental results for the TA dataset are presented in Figs. 4–7. For the first popularity estimation method, , three different analytical perspectives are examined. The criteria-based analysis (Fig. 4B) evaluates user assessments of location, cleanliness, service quality, value-for-money, and room quality individually. The overall-based analysis (Fig. 4C) considers general user evaluations, while the aggregate-based analysis (Fig. 4A) derives results by combining all criteria through weighted averaging.
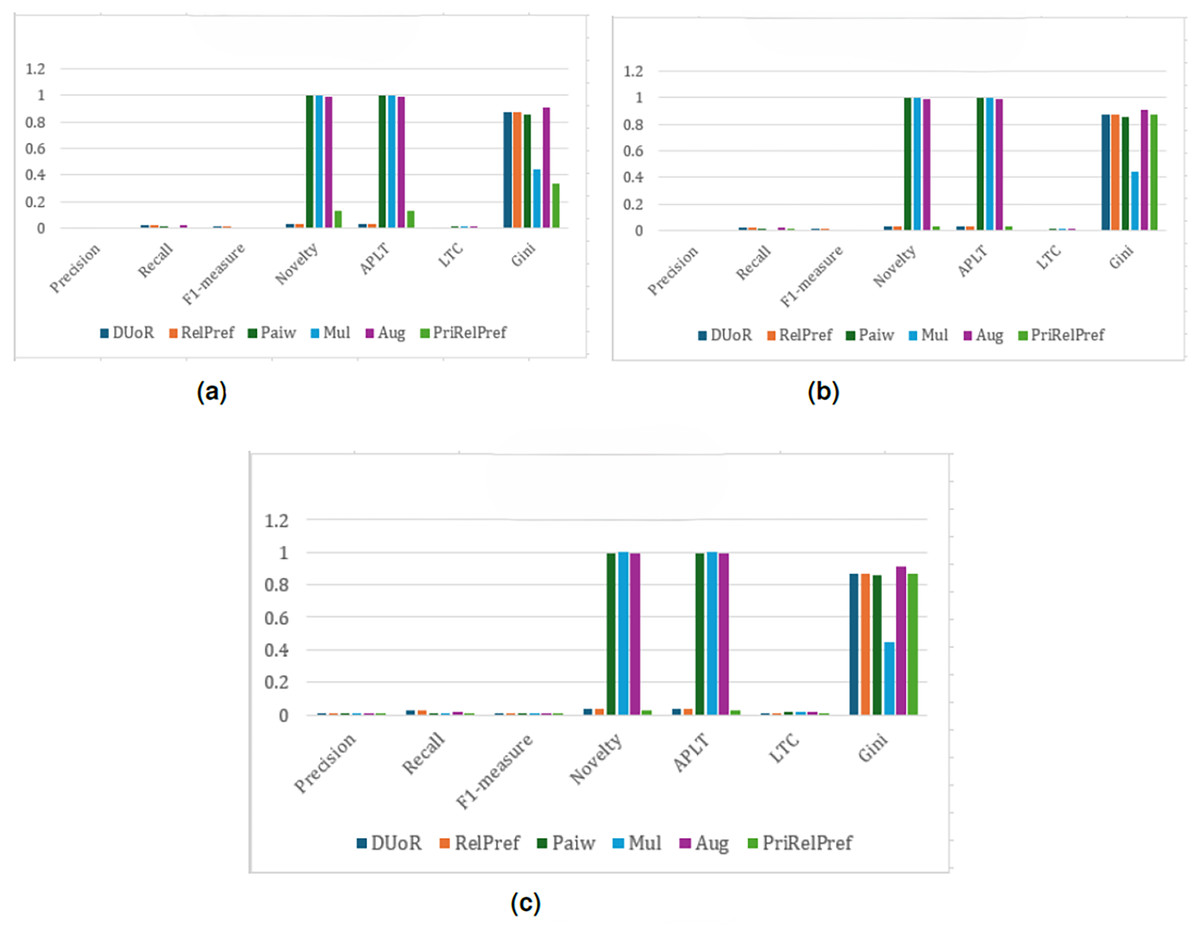
Figure 4: analysis results on the TA dataset.
(A) Aggregate-based, (B) criteria-based and (C) overall-based.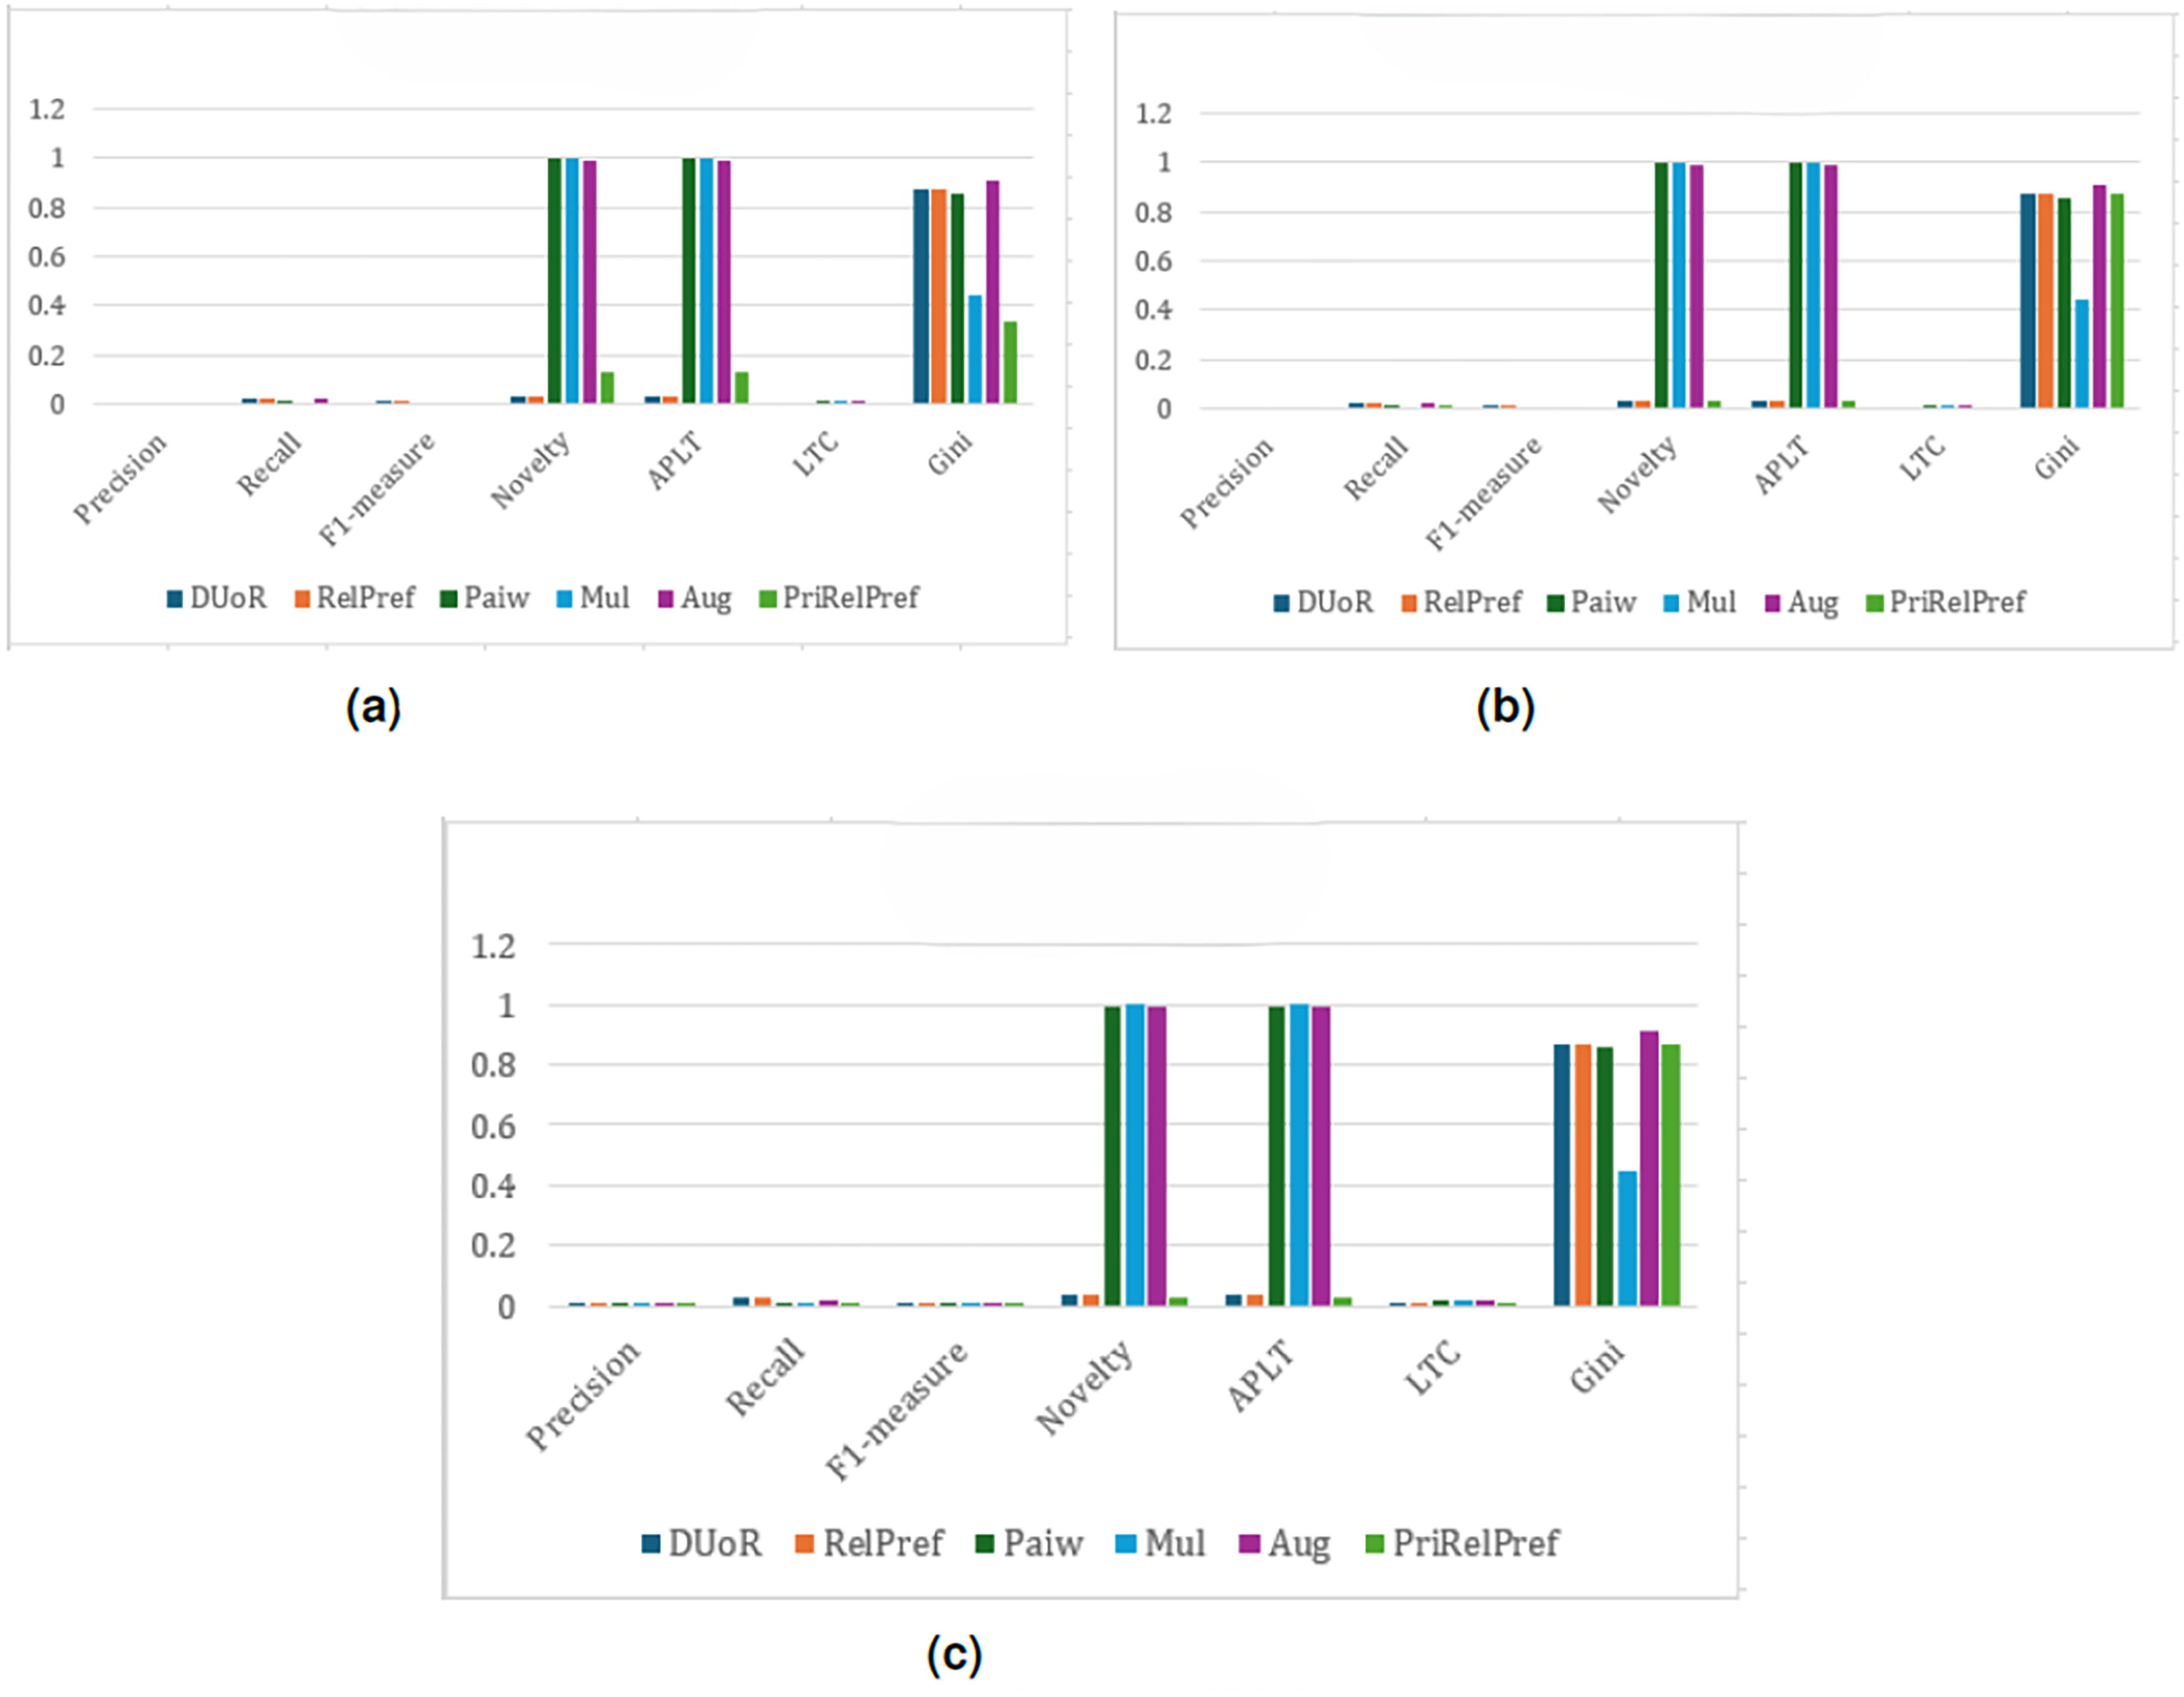
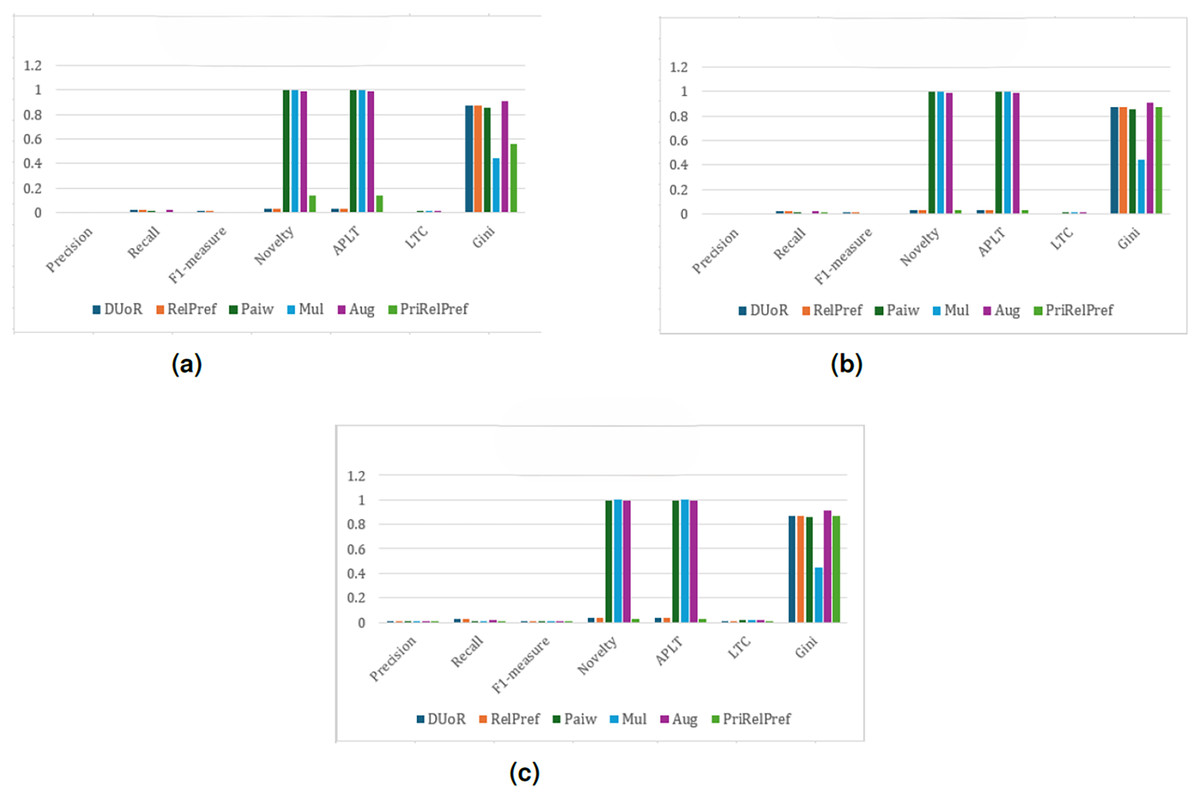
Figure 5: analysis results on the TA dataset.
(A) Aggregate-based, (B) criteria-based and (C) overall-based.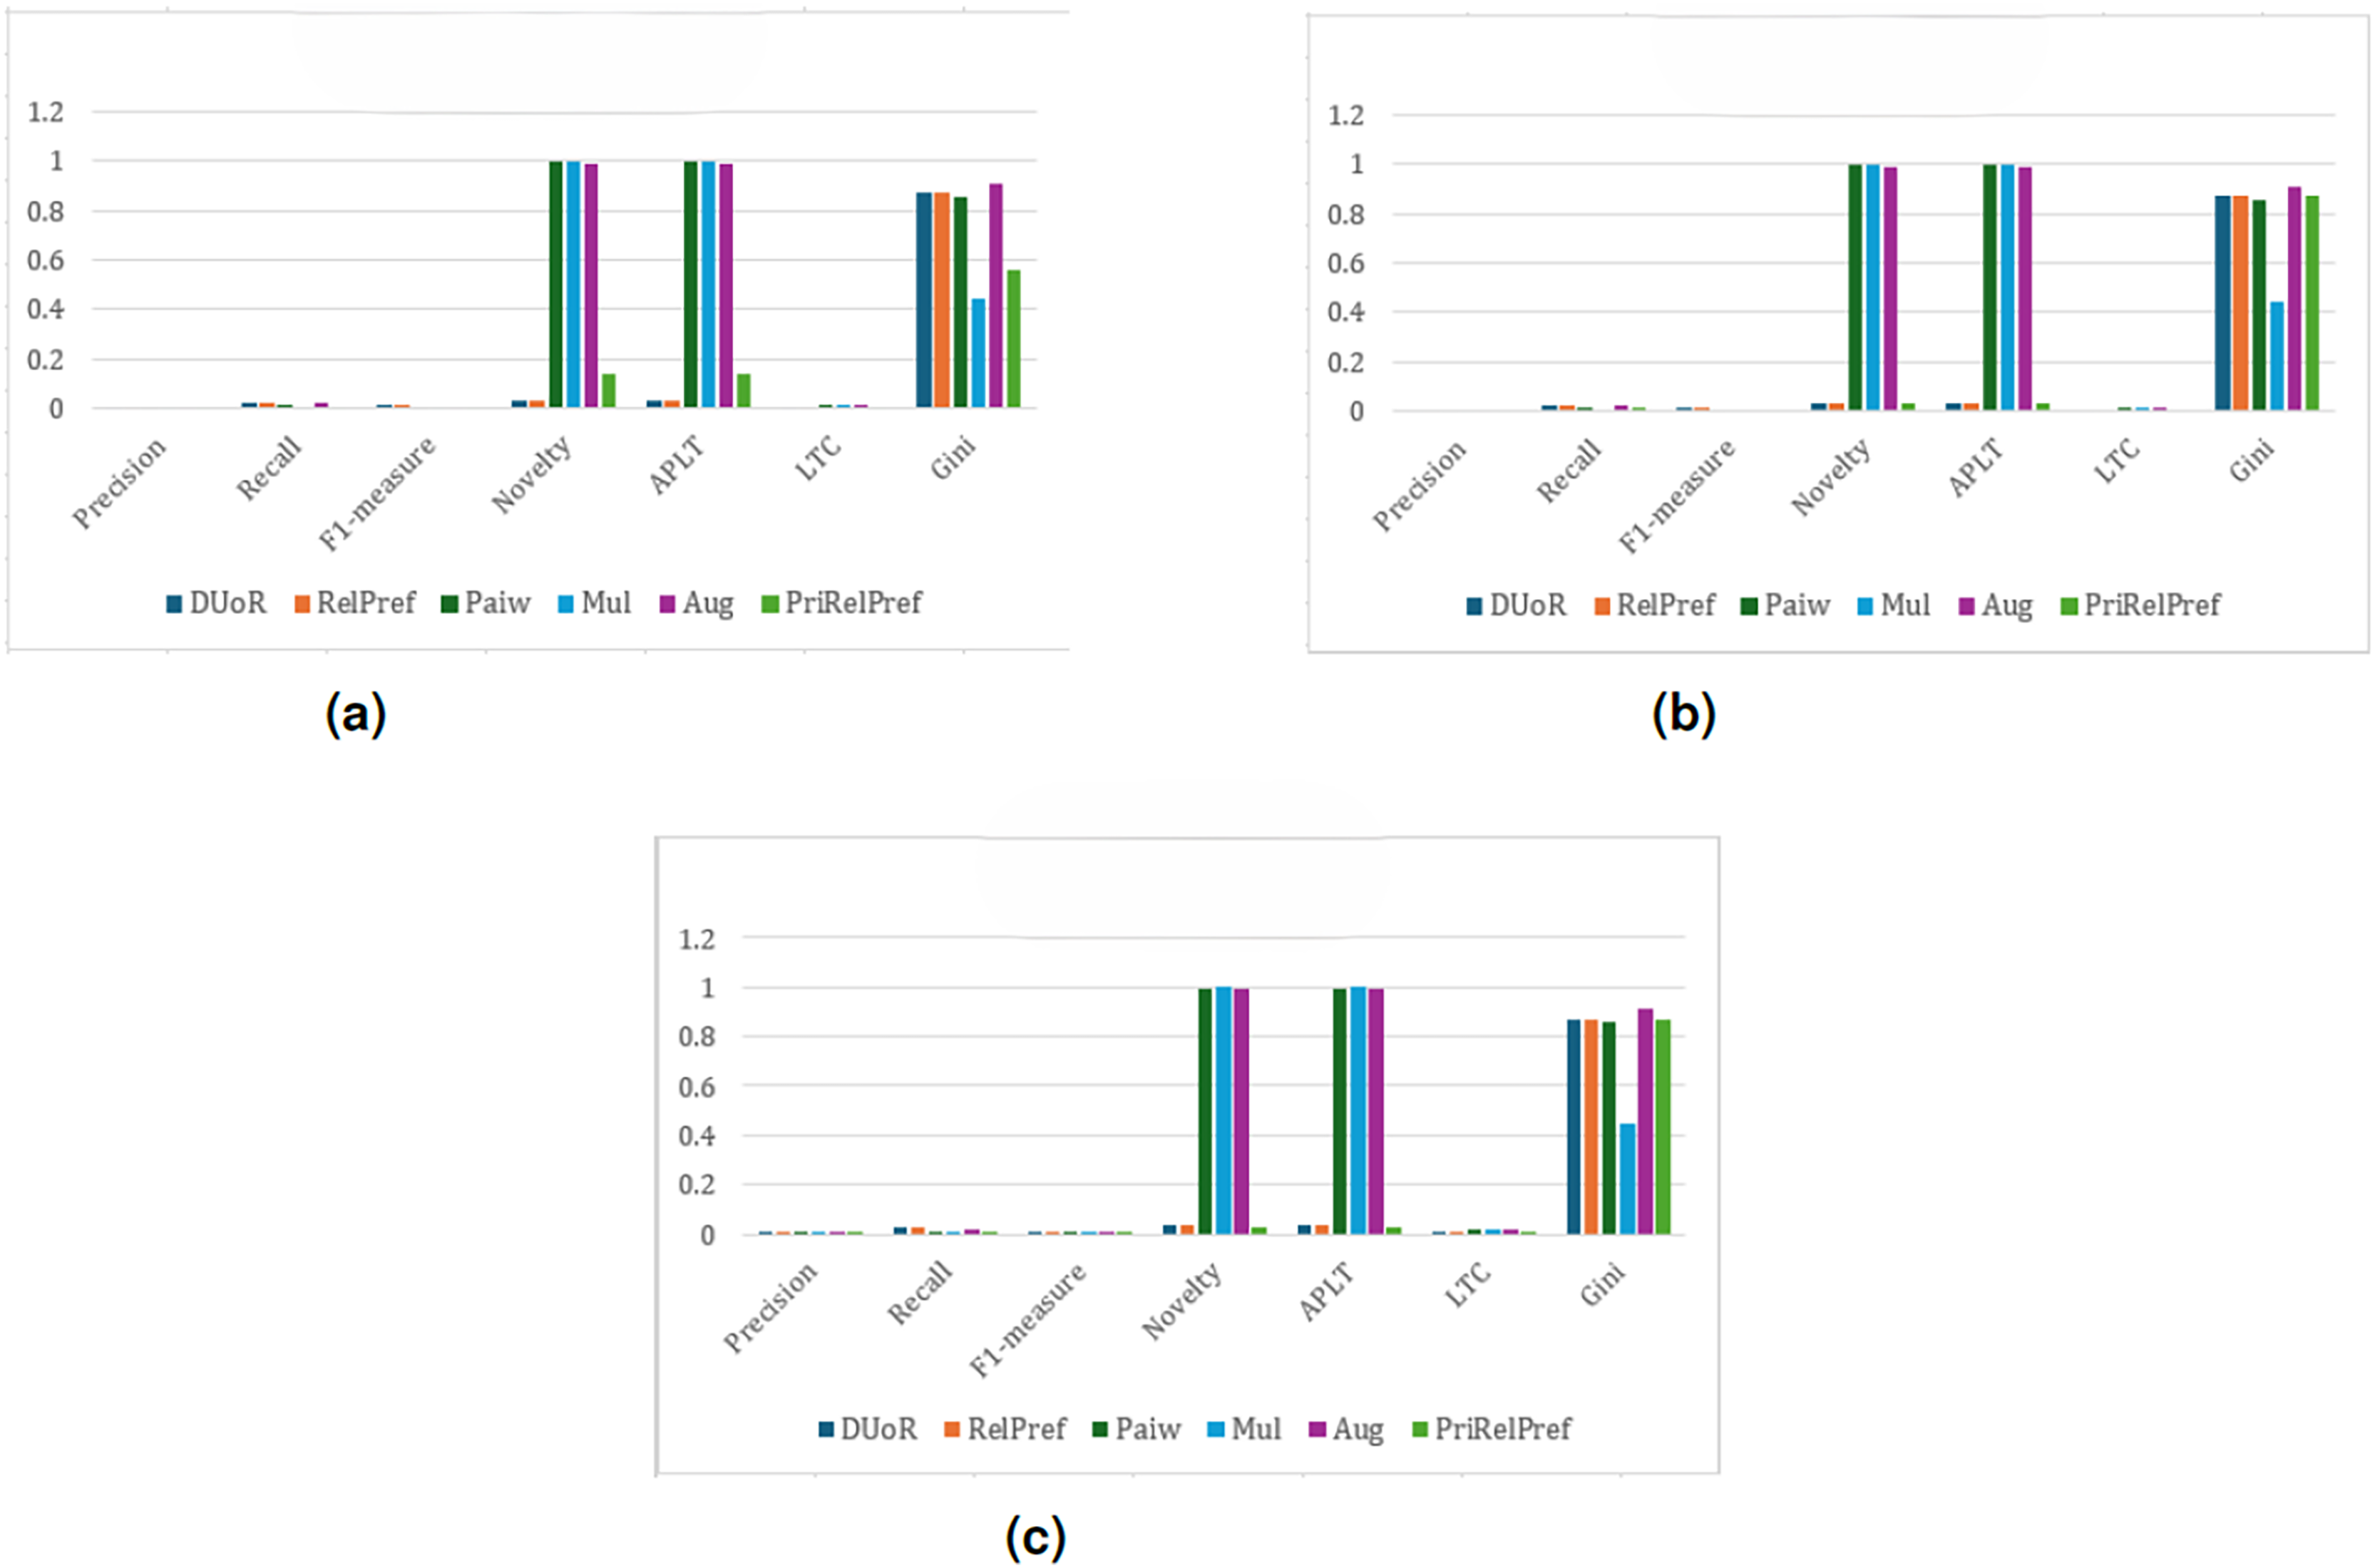
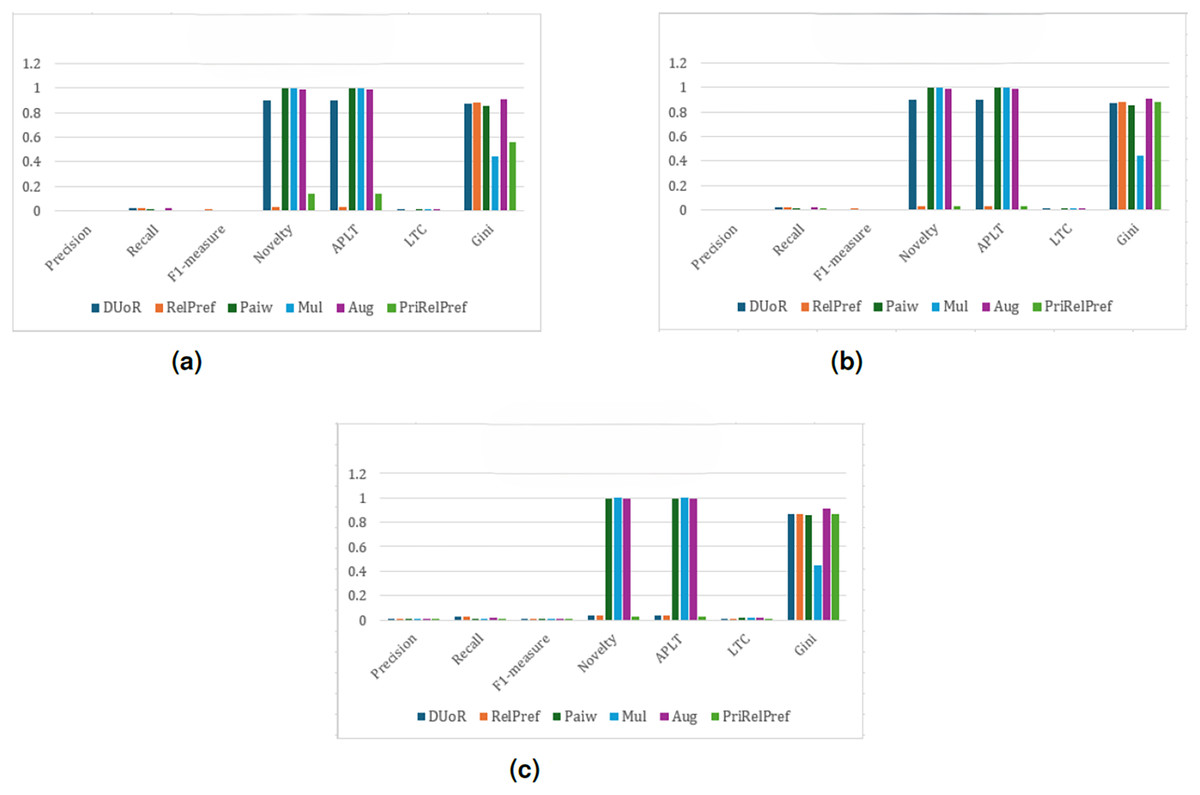
Figure 6: APRI analysis results on the TA dataset.
(A) Aggregate-based, (B) criteria-based and (C) overall-based.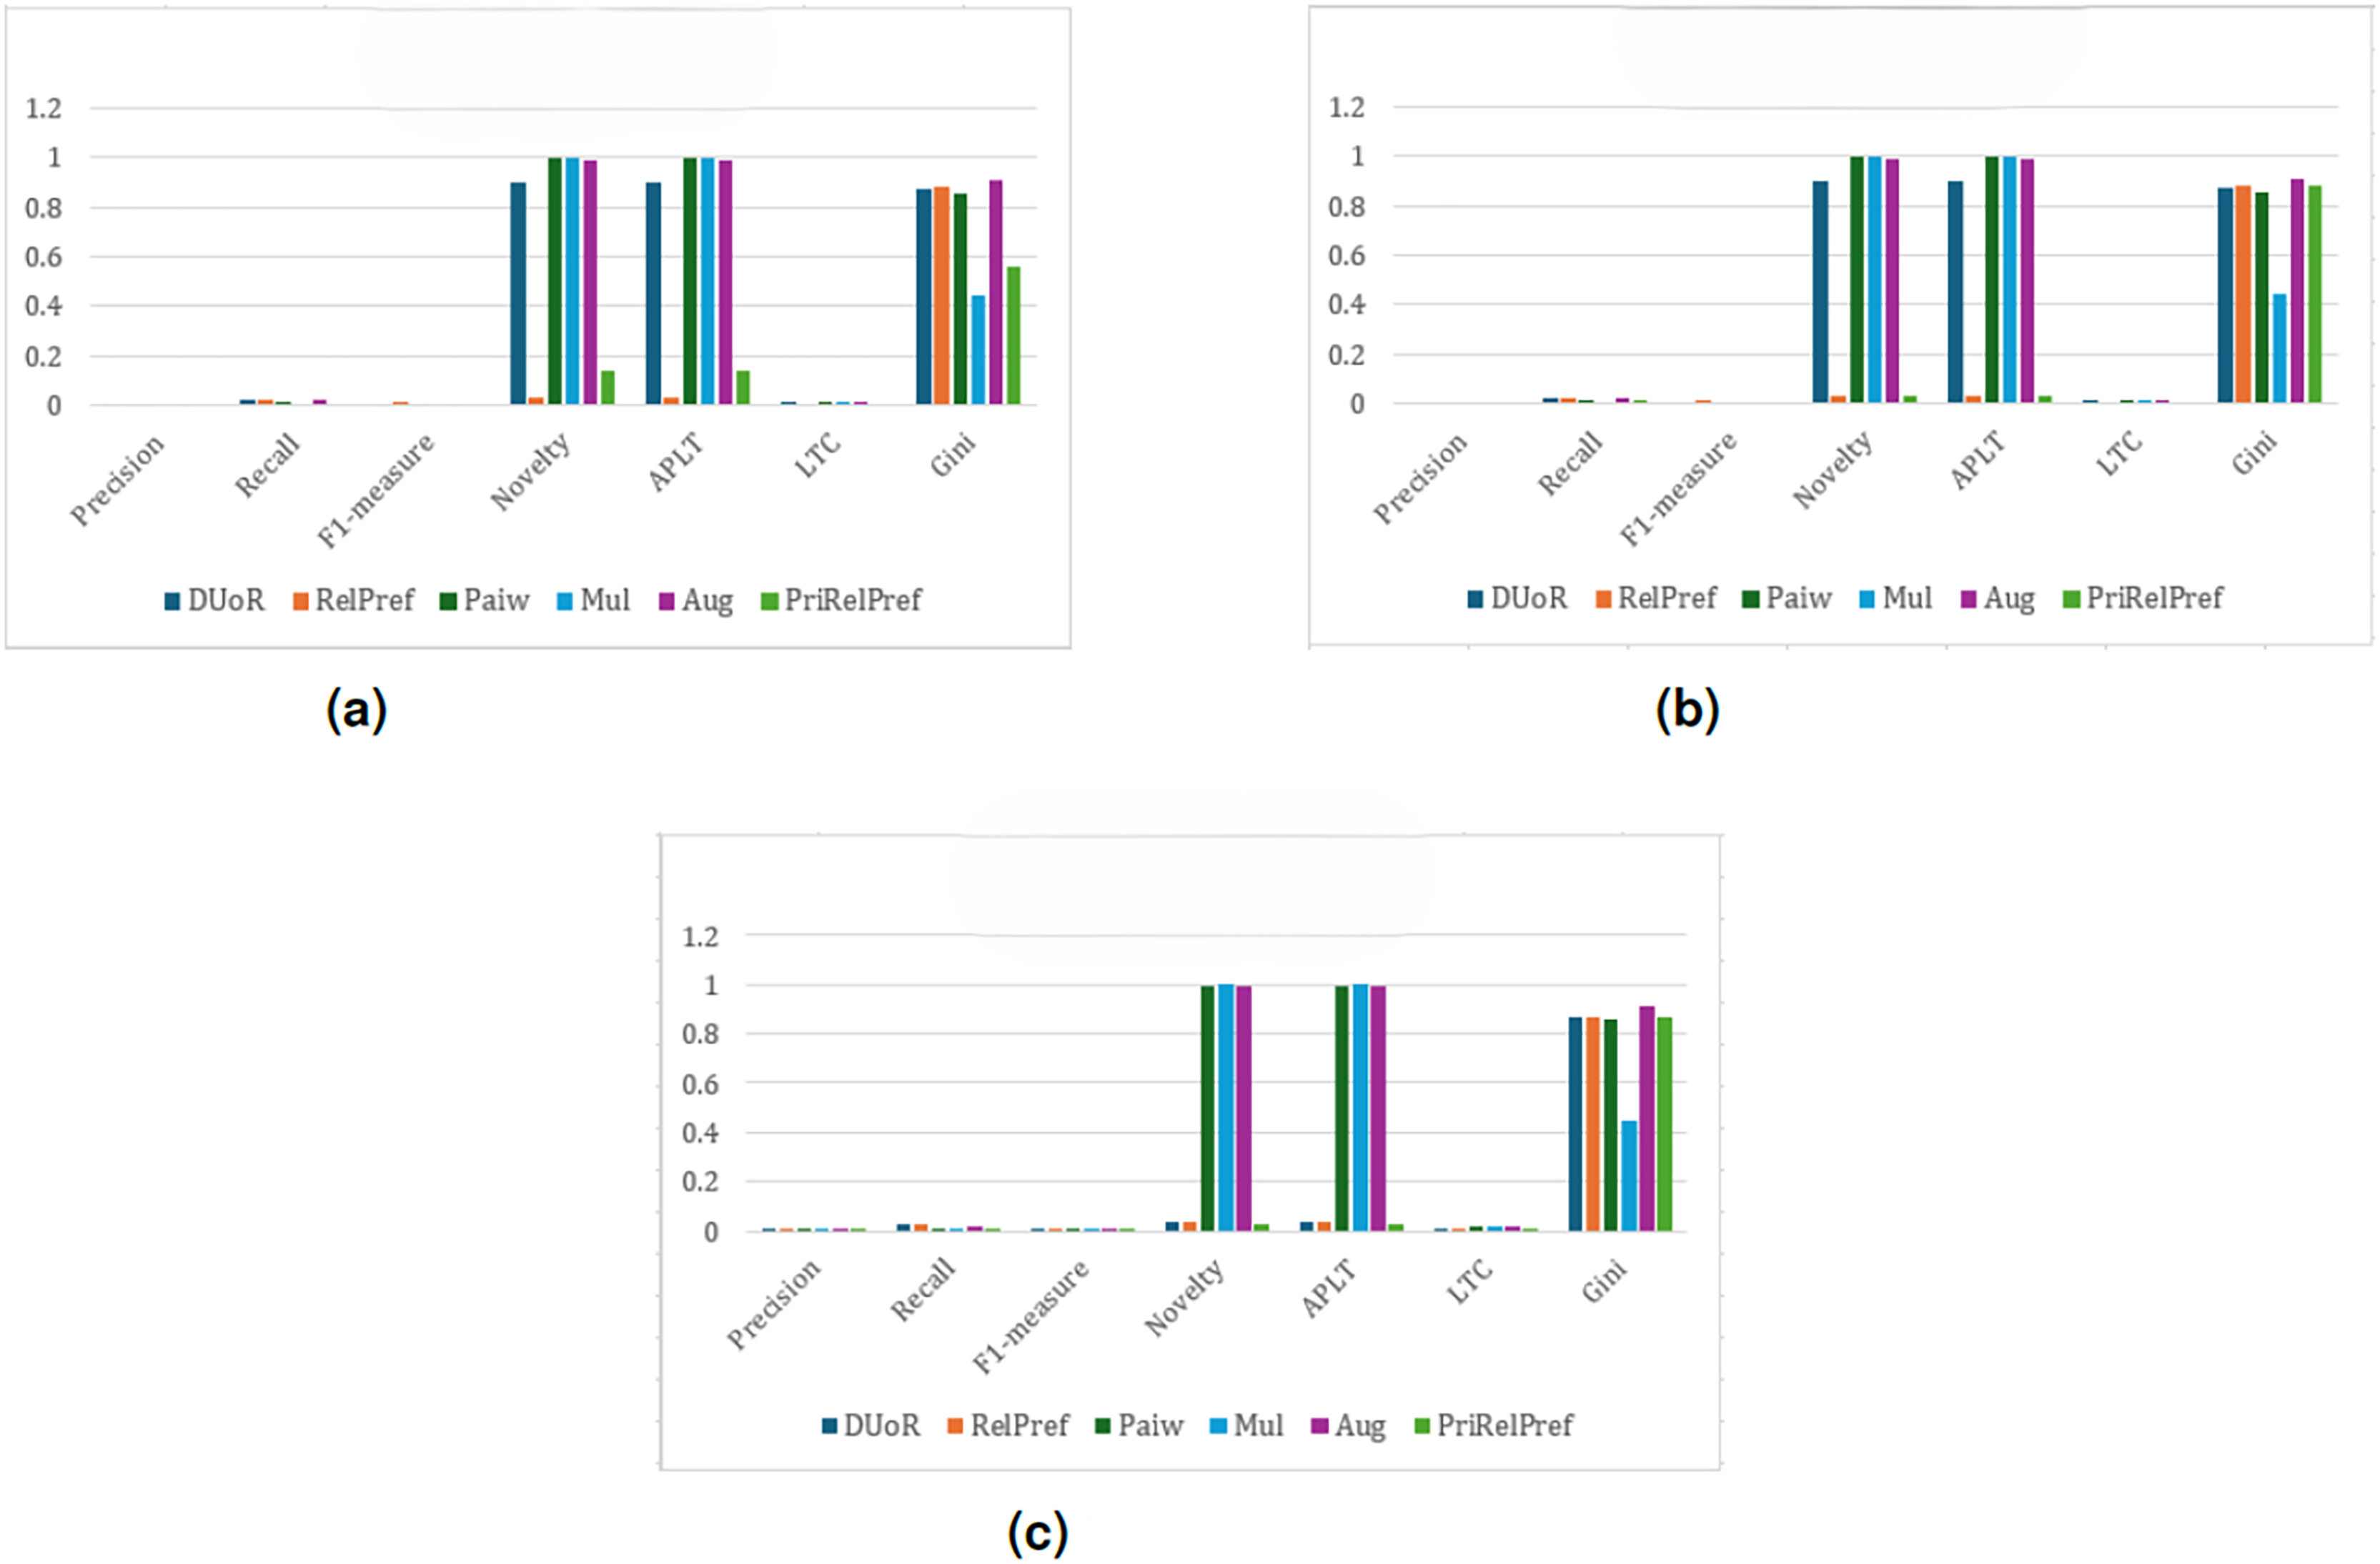
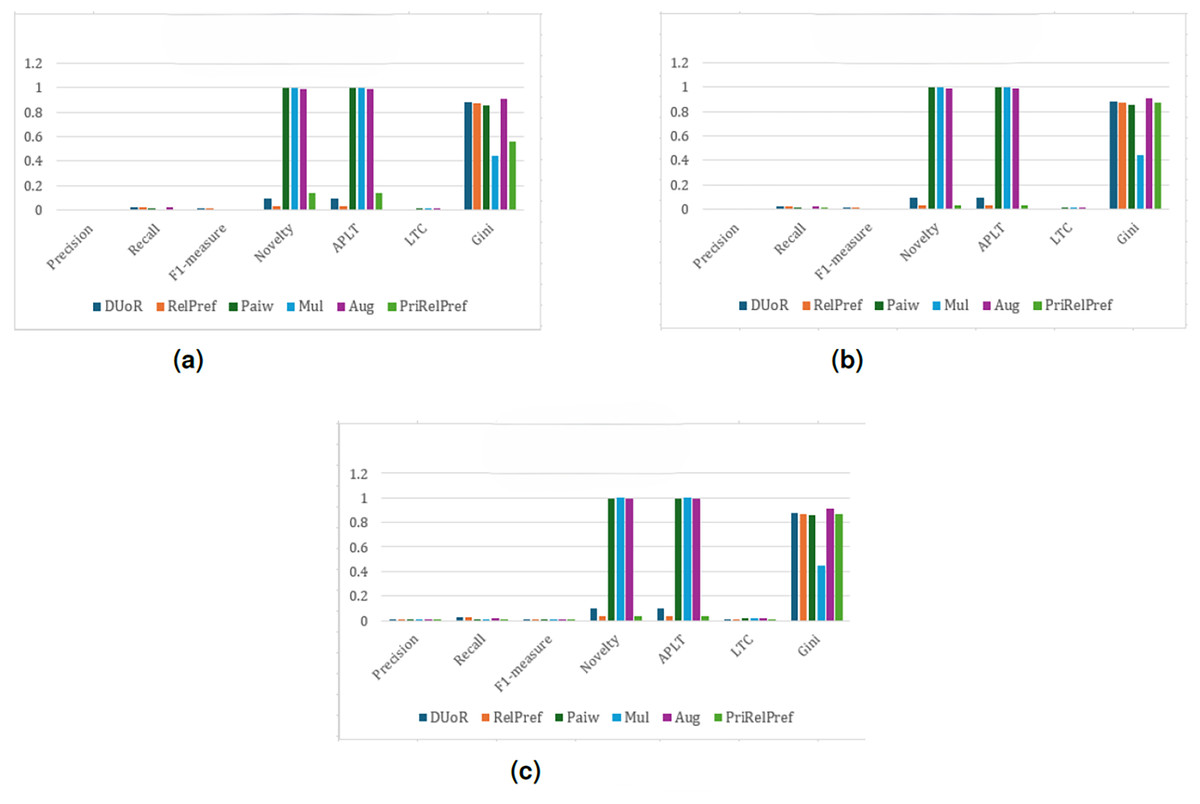
Figure 7: RPI analysis results on the TA dataset.
(A) Aggregate-based, (B) criteria-based and (C) overall-based.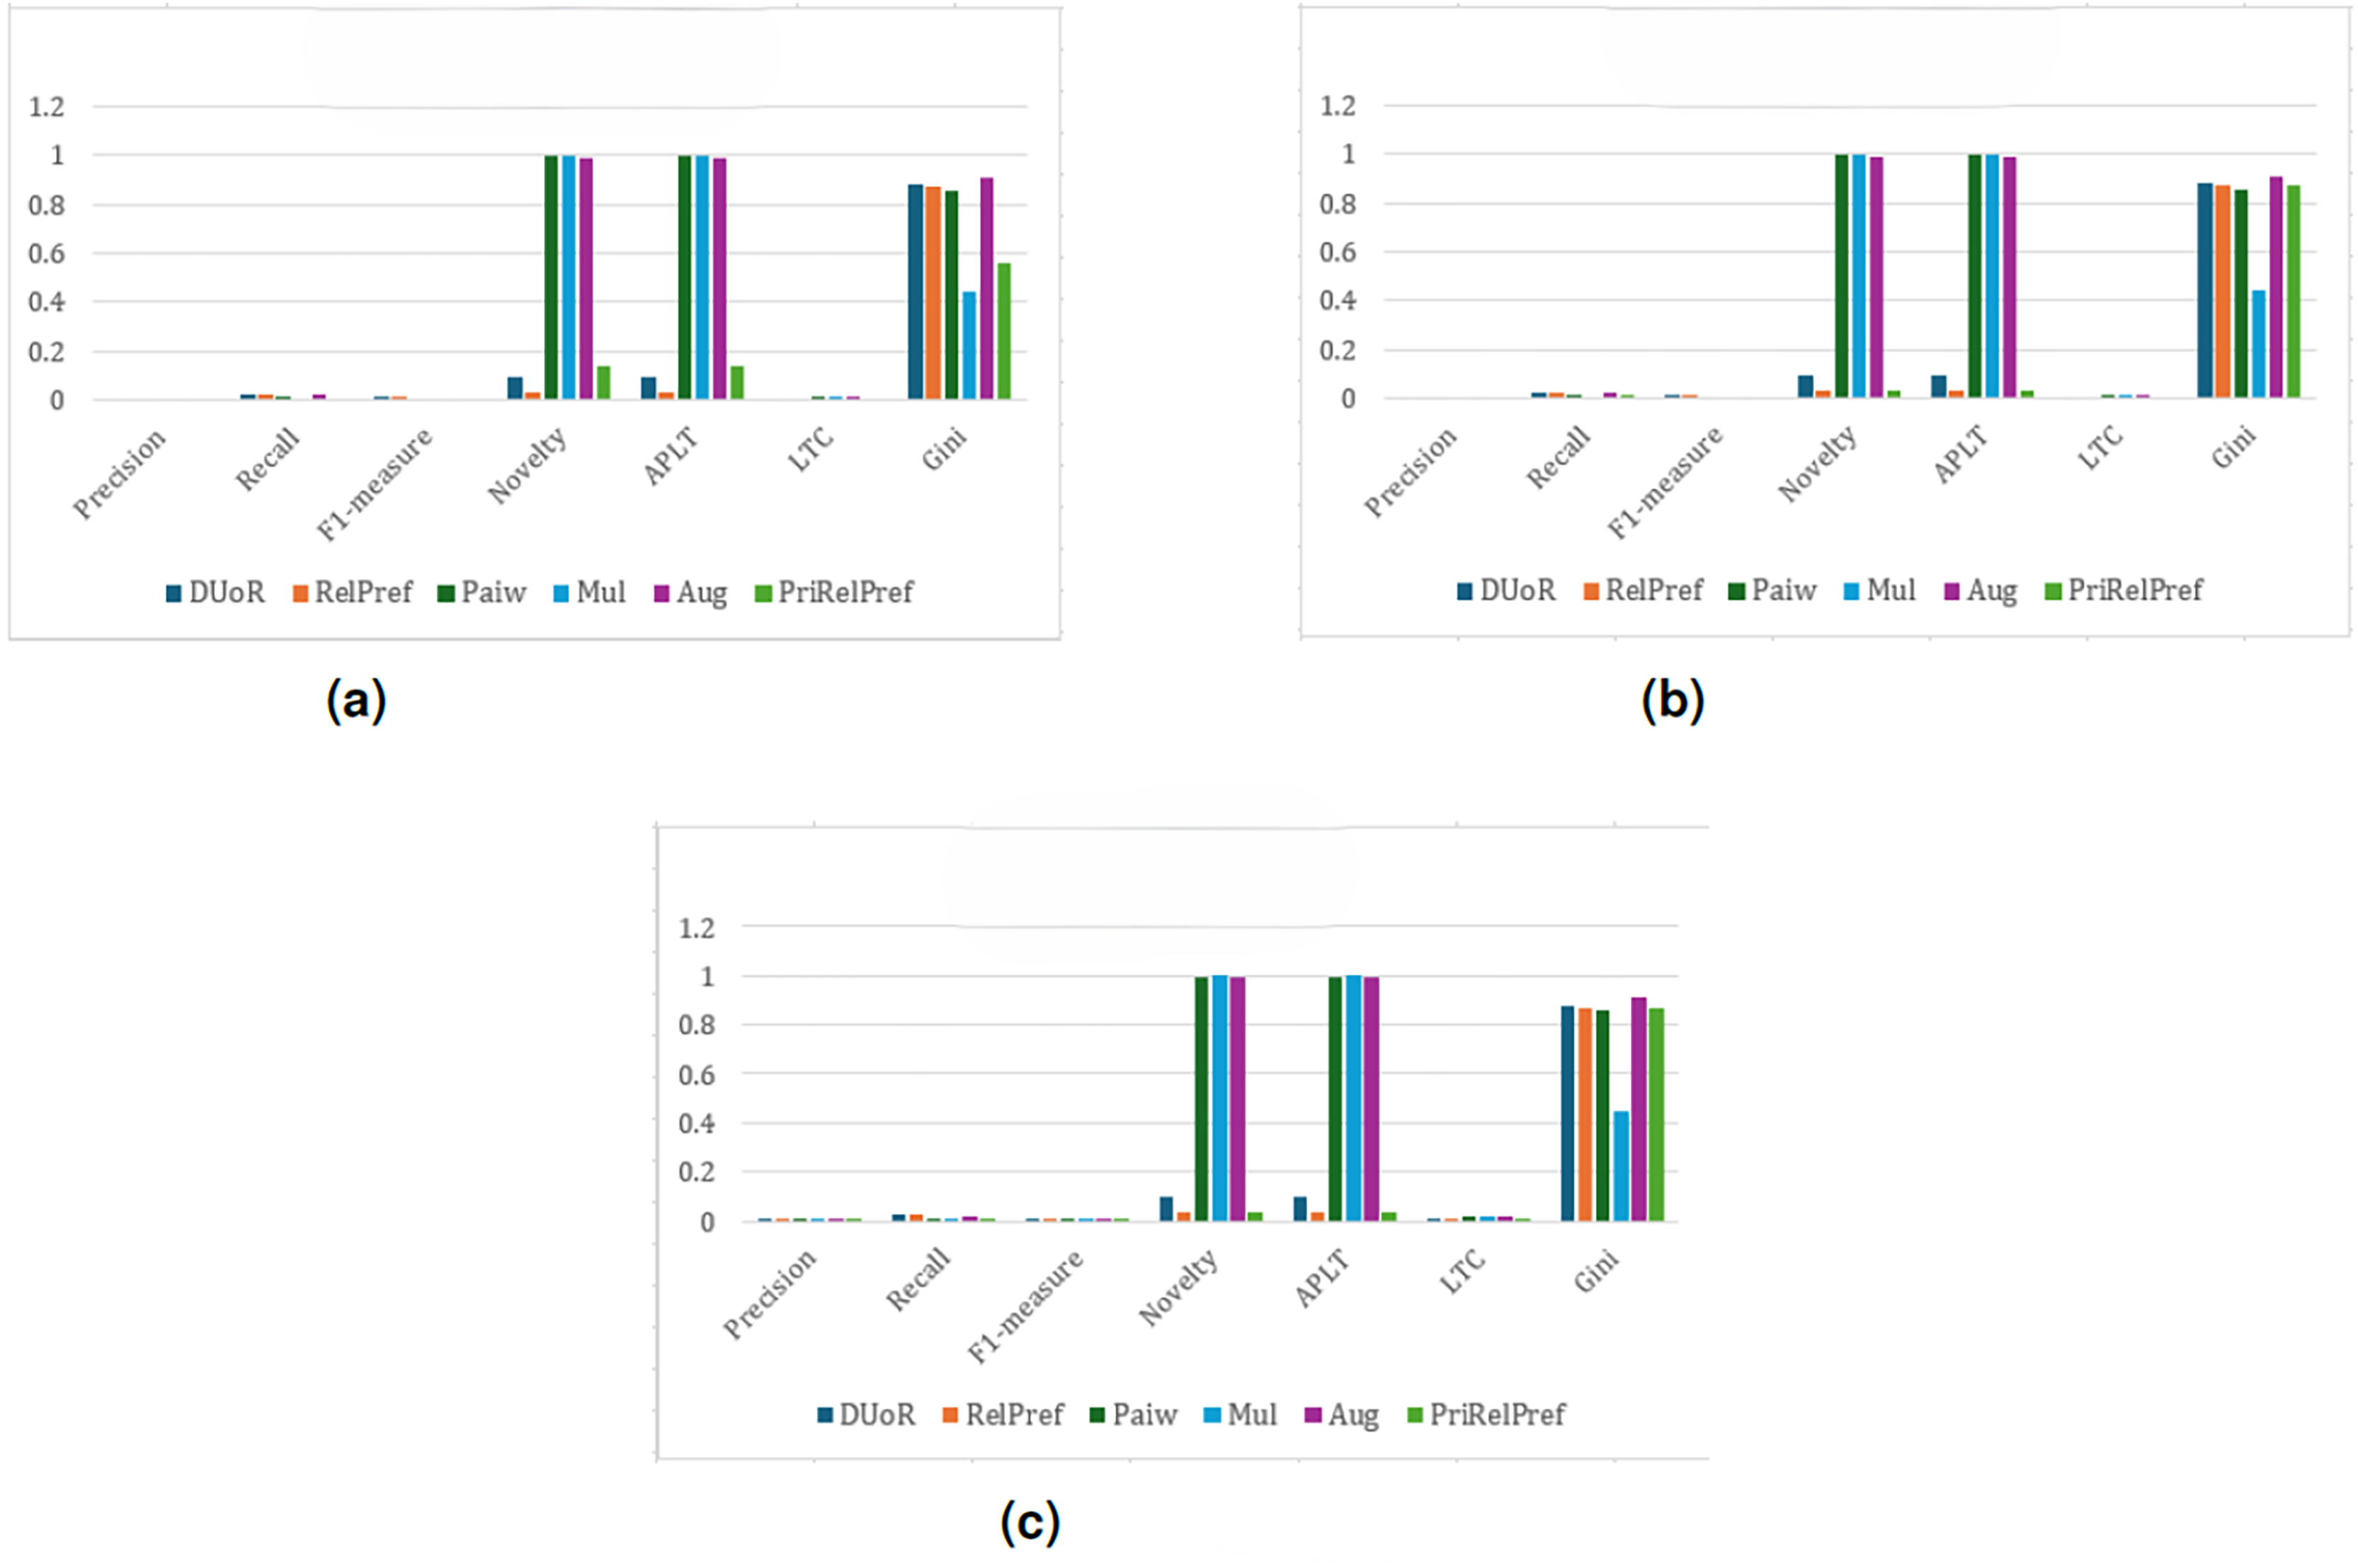
Overall and criteria-based scenarios show that RelPref demonstrates substantially higher percentage improvements in the Precision metric compared to the other methods (see Figs. 4C, 4B). In particular, RelPref achieves approximately a 130% improvement over Paiw, and this ratio increases even further when compared to Mul. Although the proportion of popular items in RelPref’s recommendation lists remains relatively high, this does not undermine performance; instead, it establishes a balanced structure between accuracy and diversity, ultimately enhancing user satisfaction. In contrast, methods such as Paiw, which excessively promote non-popular items, lead to significant declines in user satisfaction. This finding clearly indicates that reducing popularity bias alone is not sufficient to ensure effective recommendations. From the perspective of the Gini index, RelPref exhibits approximately 96% higher Gini values than Mul, highlighting its substantially more diverse recommendation distribution across these two scenarios. PriRelPref, on the other hand, presents a more fluctuating pattern in terms of Precision, outperforming some methods while falling behind others. However, when examined within the aggregate-based scenario, PriRelPref emerges as the superior approach. Although PriRelPref performs weaker in Precision relative to the other scenarios and methods, it demonstrates a stronger performance in Novelty and APLT. The approximately 61.86% improvement observed in this scenario indicates that PriRelPref achieves a notable advantage in terms of diversity. Moreover, the reduction of the Gini Index value to 0.3327 demonstrates that PriRelPref attains the most balanced recommendation distribution among all methods evaluated.
Another user popularity bias approach, the method, was also evaluated on the same dataset (see Fig. 5). The results revealed that this method exhibited trends largely similar to those of the method. In terms of accuracy, there was no notable difference between the two approaches (for example, Precision , i.e., approximately 0.65%), indicating that both models behave consistently in capturing user preferences and generating recommendations. Therefore, the interpretations made for the method can also be extended to . However, when examining the Novelty ratios, it is observed that methods such as Mul, Paiw, and Aug achieved significantly high values, exceeding 90%. This finding indicates that these algorithms tend to recommend items that users have not previously encountered, effectively mitigating popularity bias. Similar trends were also observed in the proportion of non-popular items within the recommendation lists. Nevertheless, it is important to note that a higher novelty or lower popularity ratio does not necessarily correspond to greater user satisfaction. Despite the presence of a large number of non-popular items in the recommendation lists, users were often dissatisfied with the generated recommendations, suggesting that these models fail to align with actual user preferences. In this context, the proposed RelPref method establishes a more balanced trade-off between accuracy and debiasing performance. RelPref succeeds in maintaining user satisfaction while reducing the dominance of popular items. The method increases diversity and fairness in recommendations while still preserving alignment with user interests. However, due to the high sparsity of the TA dataset, the proportion of popular items recommended by RelPref remained relatively low. This limitation stems from the limited number of user–item interactions available in the dataset, which can indirectly influence the overall recommendation performance.
In summary, the comparison between the method and other baseline approaches highlights that merely reducing popularity bias is insufficient. Instead, popularity mitigation should be harmonized with accuracy, diversity, and user satisfaction to achieve a fair and effective recommendation process. From this perspective, RelPref demonstrates a more stable and sustainable approach by preserving user satisfaction while effectively alleviating popularity bias.
The results of the APRI method indicate that, as presented in Fig. 6, the performance rankings of certain algorithms differ compared to previous methods across both criteria-based (Fig. 6B) and aggregate-based (Fig. 6A) scenarios. For instance, when examining the precision metric of the DuoR algorithm, the APRI method leads to an approximate 26.15% decrease, demonstrating a notable decline in accuracy. In contrast, an analysis of the RelPref method under the same scenarios reveals no substantial change in system accuracy; however, significant improvements are observed in terms of diversity, novelty, and the proportion of less popular items appearing in recommendation lists. These findings suggest that, within the APRI framework, the RelPref method provides a more balanced and effective structure, particularly in enhancing the diversity of recommendations presented to users.
The final popularity bias mitigation approach applied to this dataset, the RPI method, reveals only minor fluctuations compared to the previously examined techniques (see Fig. 7). Although the proposed RelPref method achieves relatively higher performance in terms of accuracy and user satisfaction (approximately 0.65%), this improvement is not consistently reflected in other evaluation dimensions such as novelty and diversity. Conversely, methods that perform strongly in beyond-accuracy metrics, including novelty and diversity, generally fail to deliver comparable levels of user satisfaction. This inverse relationship highlights the inherent trade-off between reducing popularity bias and preserving recommendation relevance.
Overall, when evaluating the results obtained from the TA dataset, it becomes evident that the dataset’s structural characteristics play a crucial role in shaping these outcomes. The TA dataset exhibits a high level of sparsity, meaning that many users have provided ratings for only a limited number of items. Furthermore, the analyses indicate a relatively high correlation among the evaluation criteria, suggesting that users tend to rate multiple aspects of a hotel (such as location, cleanliness, service quality, and value-for-money) in a similar manner. This strong inter-criteria correlation reduces the distinctiveness between different criteria and ultimately leads to comparable results across the criteria-, overall-, and aggregate-based analyses.
For the YM20 multi-criteria dataset, the first analysis is conducted using the method (see Fig. 8). The aggregate-based results show that DUoR and RelPref achieve the highest levels of user satisfaction. On average, users are satisfied with approximately two of the ten recommended items, one of which typically belongs to the long-tail. This indicates that the proposed methods not only maintain accuracy but also promote exposure to less popular items, thereby supporting diversity and discovery. In the criteria-based scenario, substantial performance differences emerge among the compared methods (can see Fig. 8B). Notably, RelPref and PriRelPref outperform the baselines, achieving more than a 20% improvement in Precision. These results demonstrate the superior ability of the proposed approaches to capture user-specific preferences under multi-criteria conditions. In contrast, Mul, Paiw, and Aug display overly aggressive debiasing behavior by recommending a large volume of niche, non-popular items, which results in a marked decline in user satisfaction. Under the configuration, the findings reaffirm users’ general tendency to prefer popular items. However, the proposed methods effectively sustain user satisfaction by selectively incorporating long-tail items without sacrificing accuracy. From a diversity perspective, RelPref (Gini: 0.8874) surpasses DUoR by 2.4%, reflecting its capacity to balance satisfaction with fair item exposure. Conversely, PriRelPref (Gini: 0.7651) performs 11.7% lower than DUoR, suggesting that it prioritizes user satisfaction at the expense of fairness.
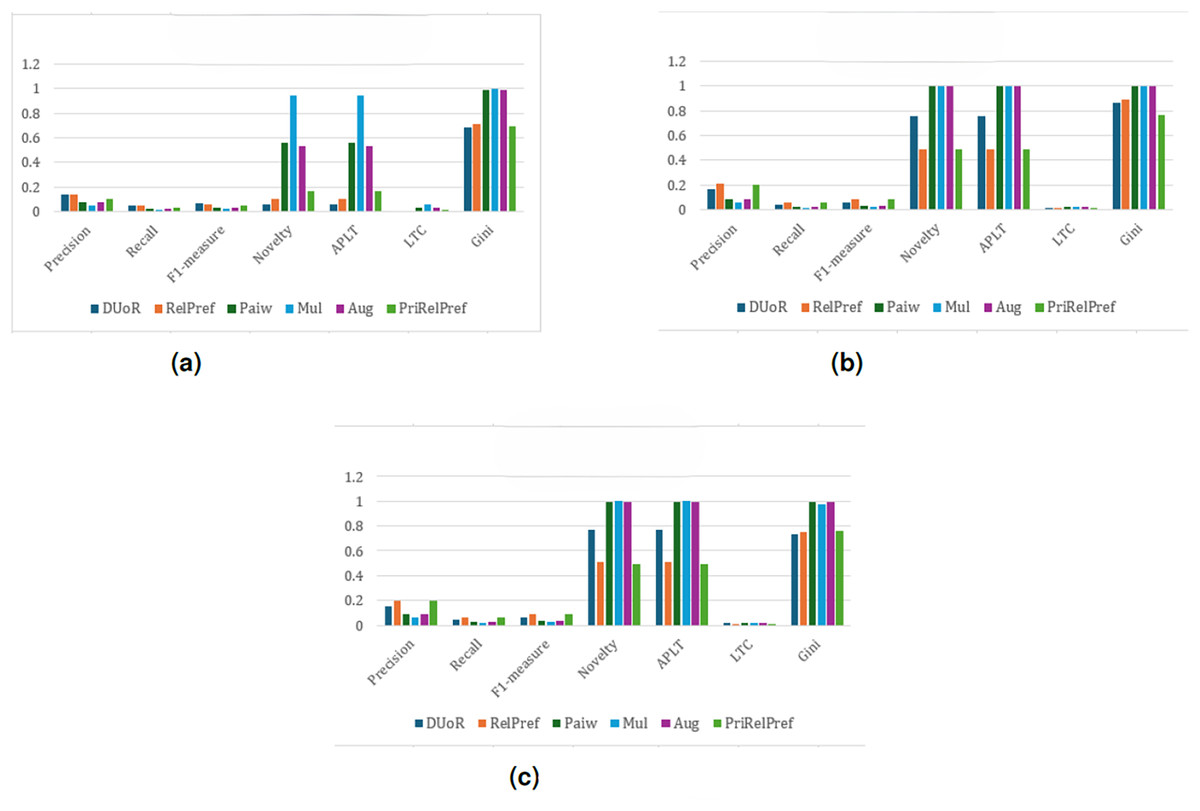
Figure 8: analysis results on the YM20 dataset.
(A) Aggregate-based, (B) criteria-based and (C) overall-based.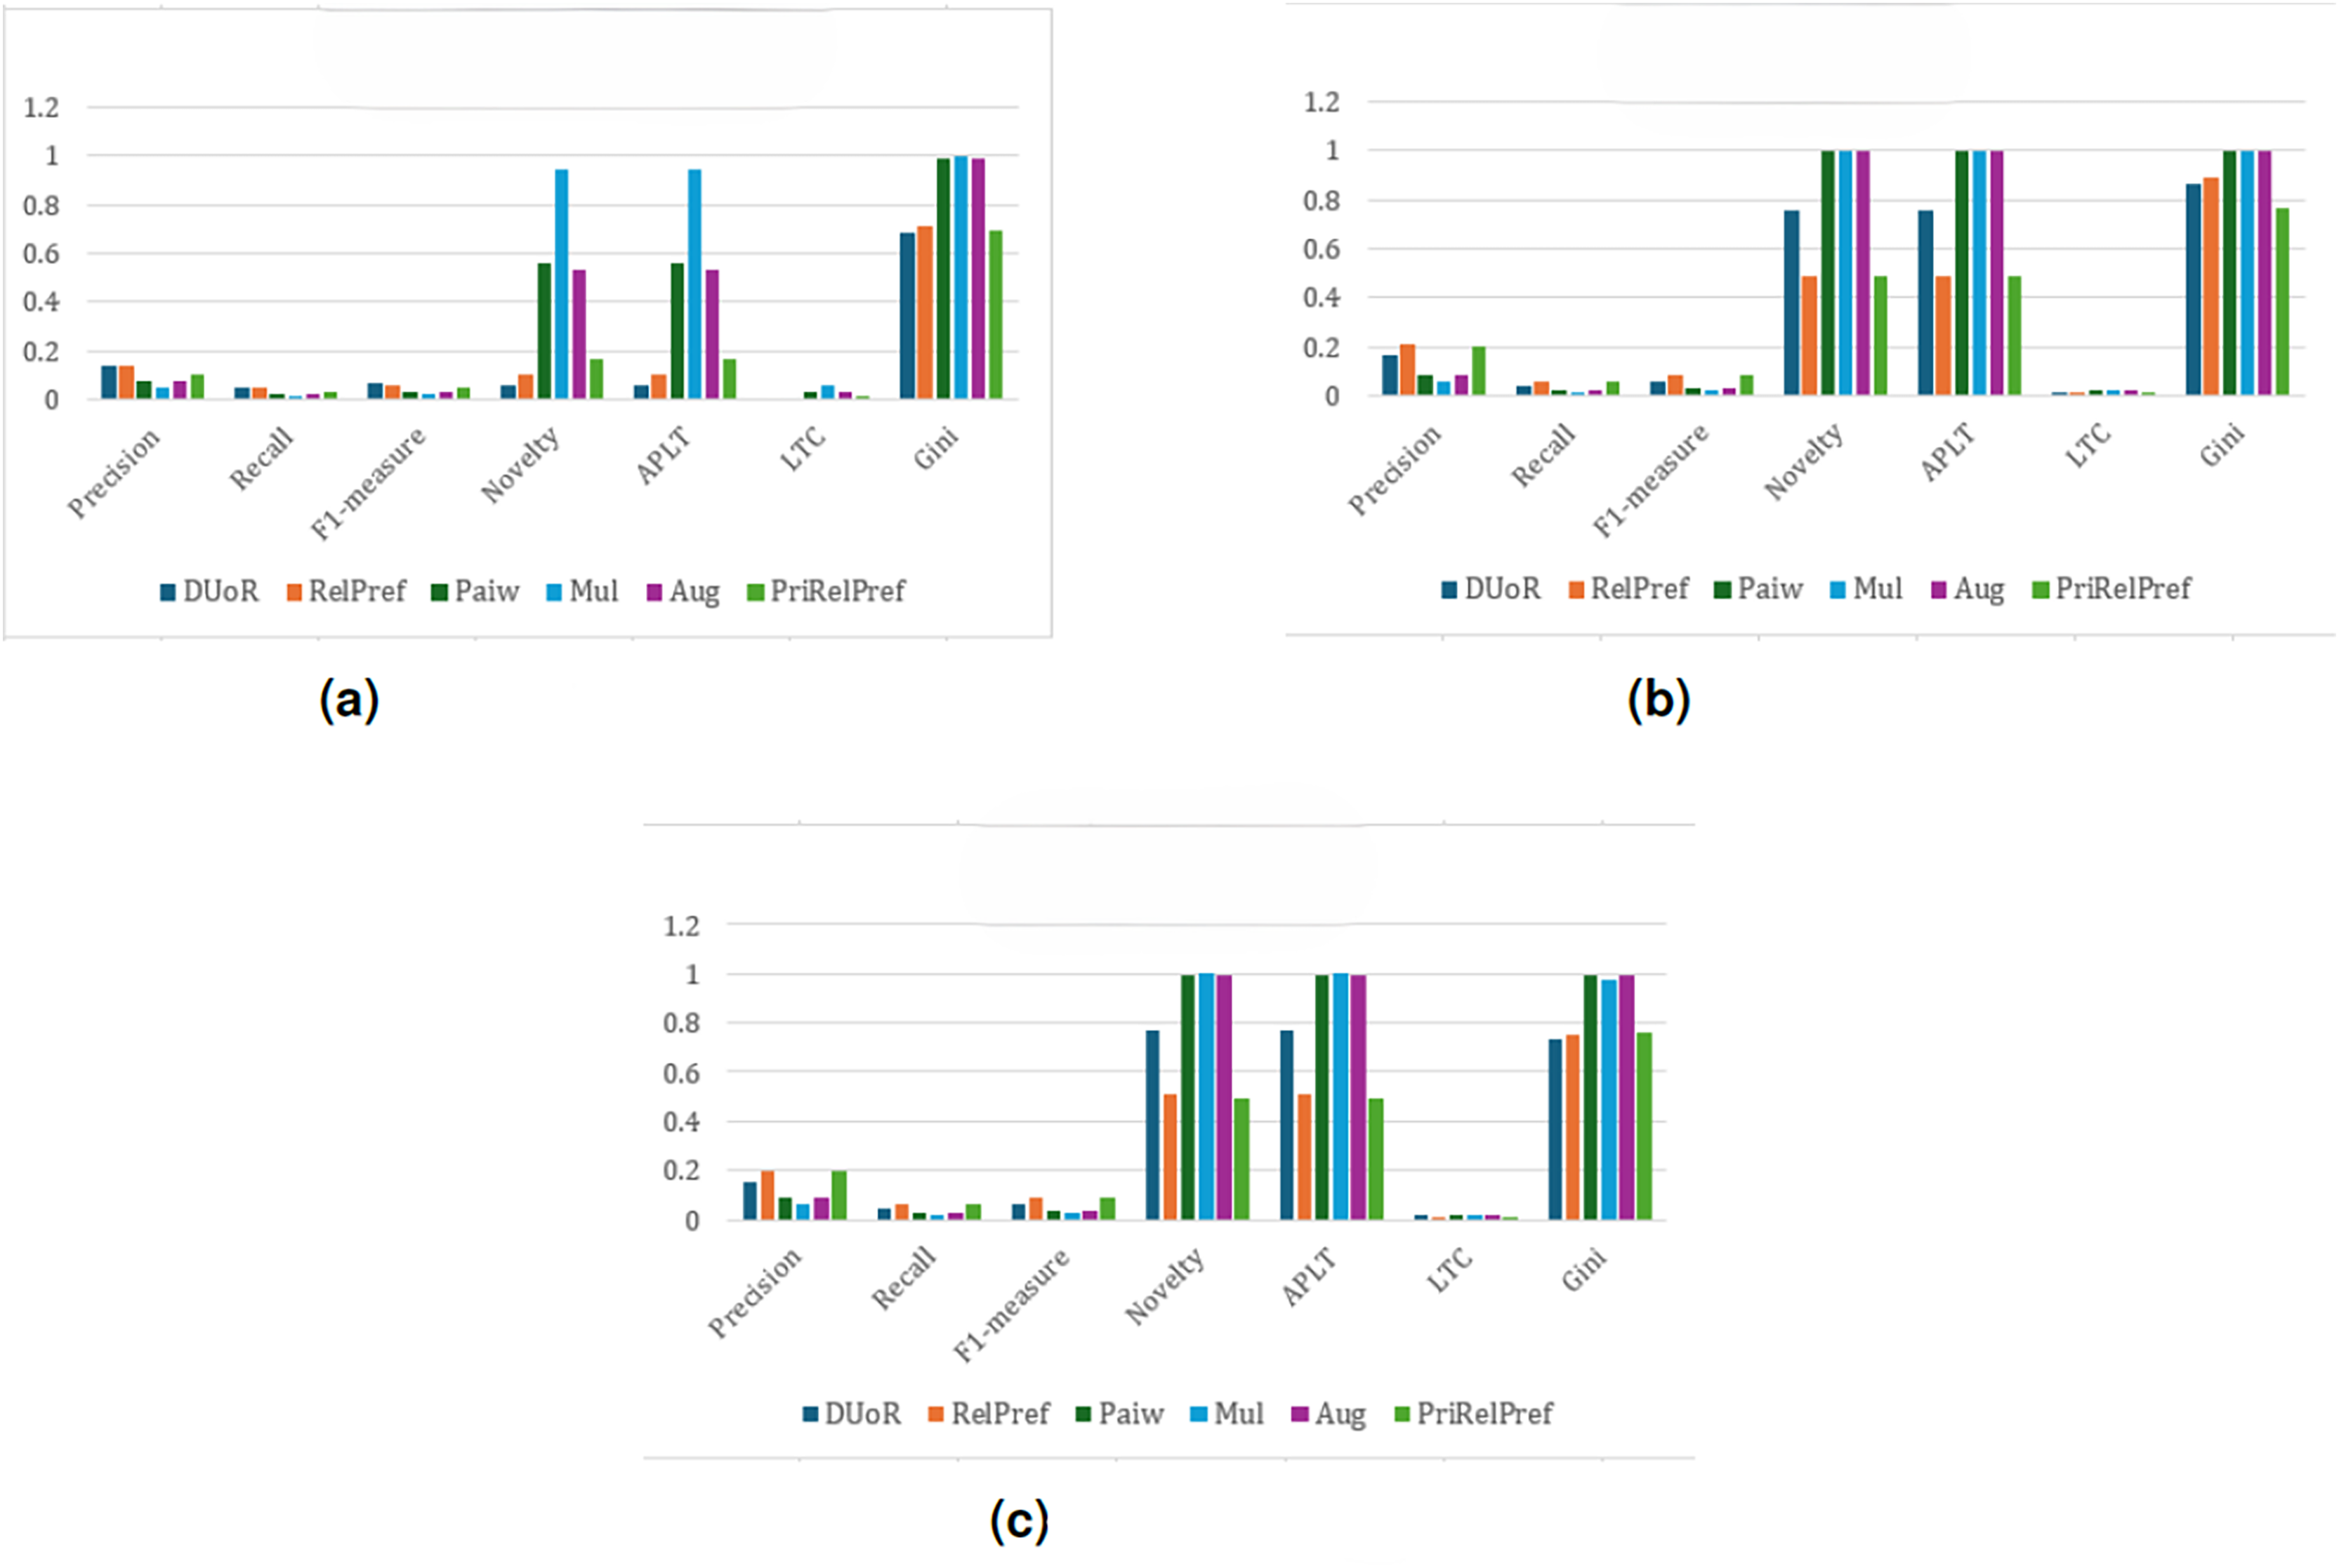
Within the framework, the proposed RelPref and PriRelPref methods demonstrate a clear improvement in performance, as illustrated in Fig. 9. Both approaches achieve higher user satisfaction while simultaneously increasing item diversity in the recommendation lists. The results indicate that the proposed methods effectively balance accuracy and diversity, outperforming baseline approaches that rely solely on aggressive popularity mitigation. In the overall-based and criteria-based scenarios (see Figs. 9C and 9B), the proposed methods consistently generate more satisfactory recommendation lists. For a top10 recommendation list, approximately three items meet user expectations, while diversity levels noticeably increase. This outcome highlights the ability of RelPref and PriRelPref to maintain alignment with user preferences without sacrificing exposure to less-popular items. In the aggregate-based scenario, RelPref achieves the strongest overall performance (Precision: 0.1431, Recall: 0.0475, F1-score: 0.064), whereas baseline methods such as Aug, Mul, and Paiw exhibit consistently low effectiveness (see Fig. 9A). Across all analyses, these baseline approaches also produce the highest Gini values, indicating lower fairness in item exposure. By contrast, the proposed methods adopt a more balanced strategy, preserving moderate fairness while delivering higher user satisfaction. Overall, the findings suggest that while DUoR remains effective in single-criterion settings, it is less capable of mitigating popularity bias in multi-criteria environments, where the proposed methods provide a more stable and effective solution.
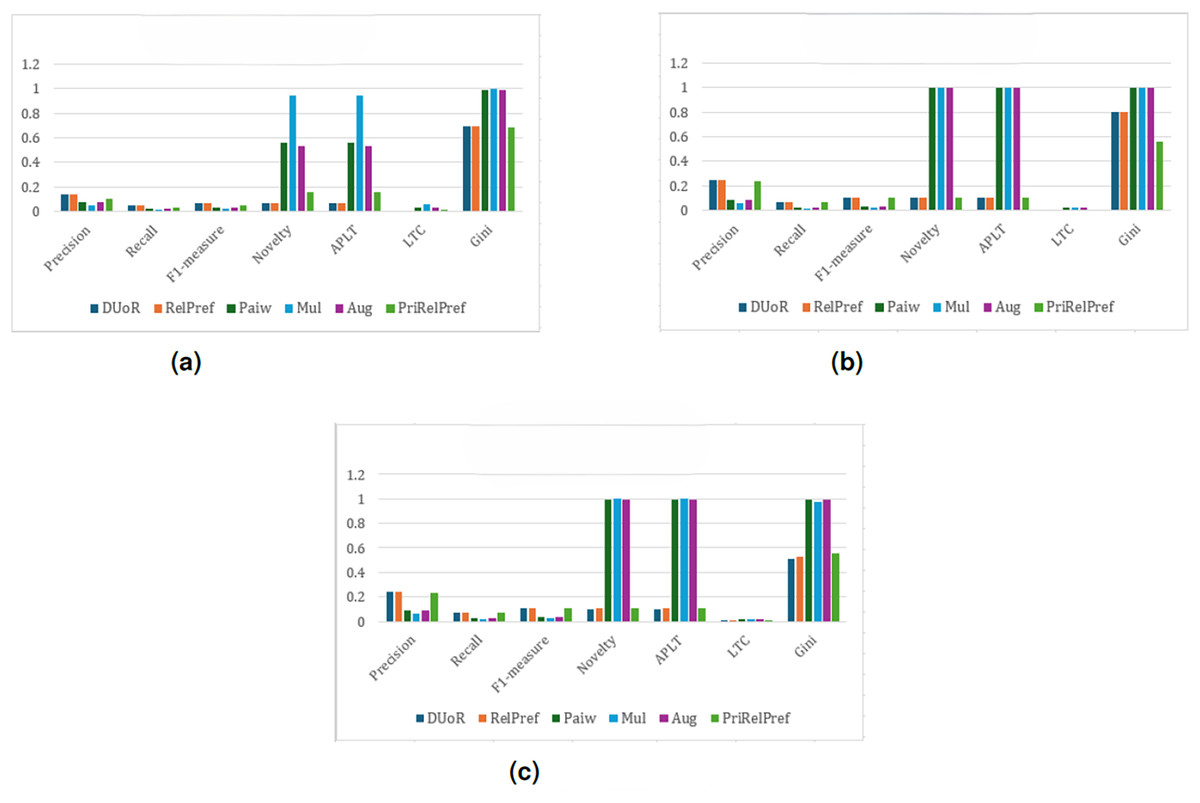
Figure 9: analysis results on the YM20 dataset.
(A) Aggregate-based, (B) criteria-based and (C) overall-based.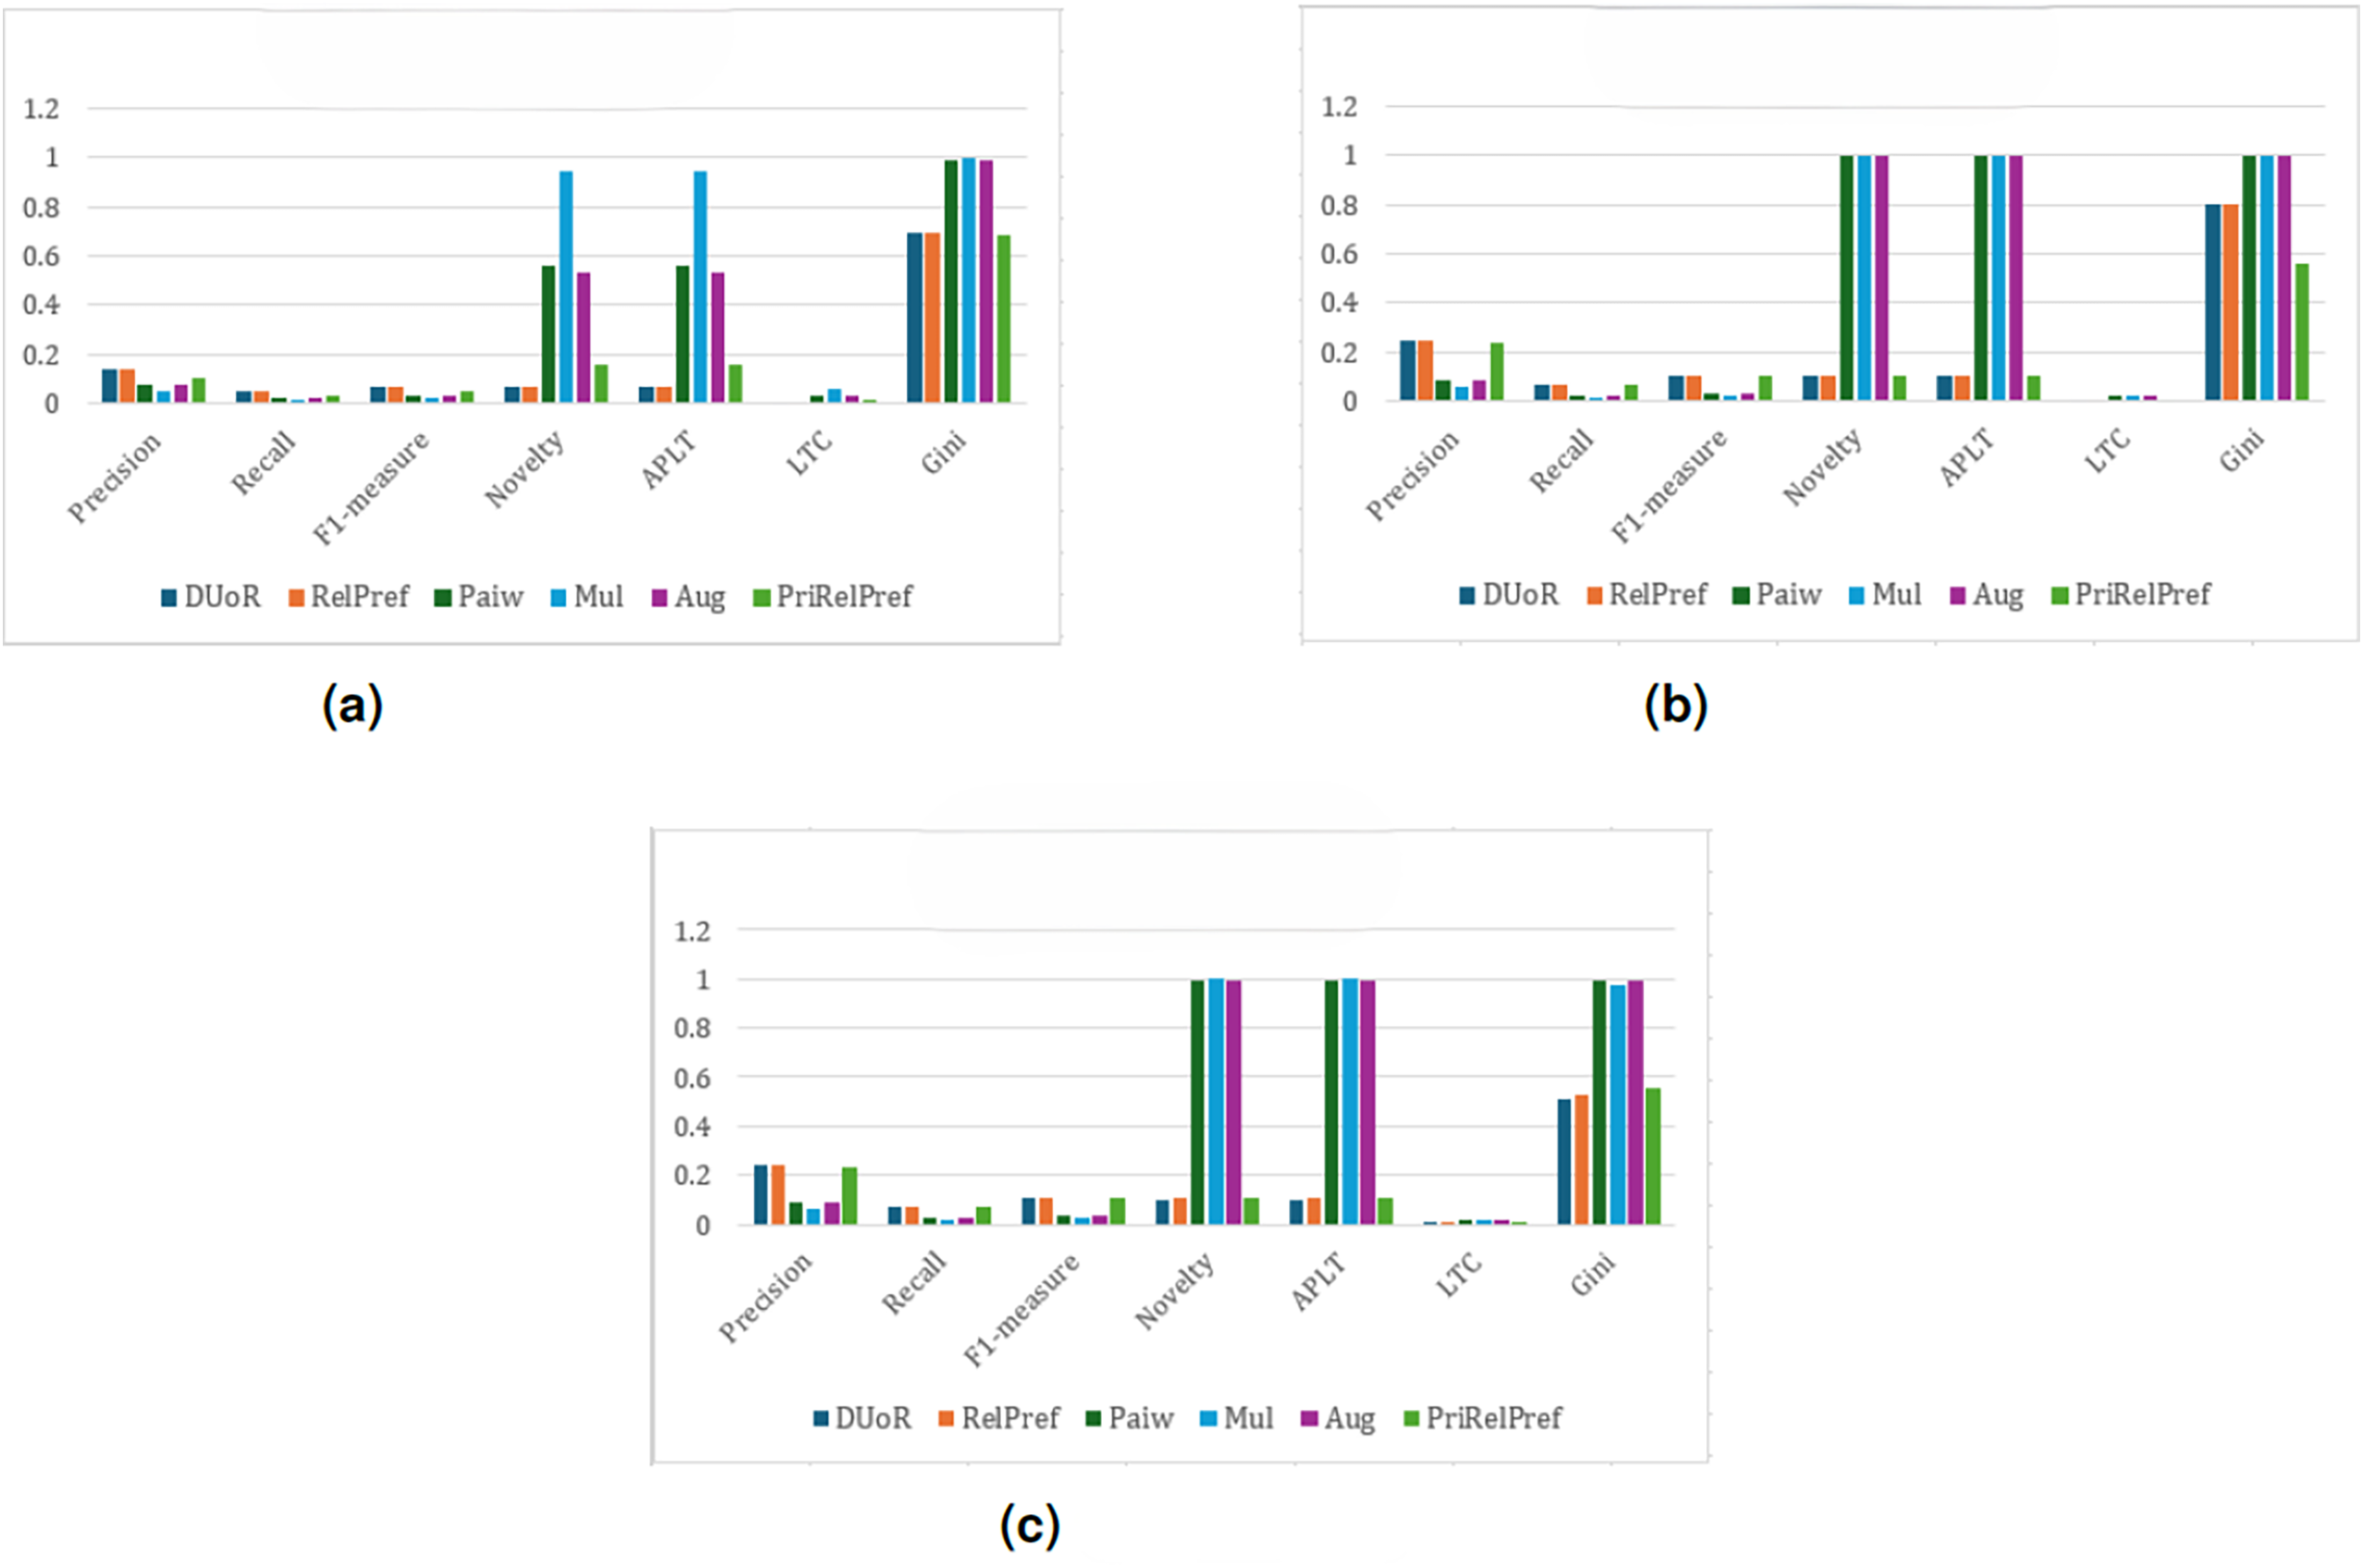
Under the RPI method, as presented in Fig. 10, the performance of the proposed approaches declines compared to the other two methods, with a noticeable drop observed particularly in the aggregate-based scenario (see Fig. 10A). Nevertheless, across all three evaluation types, the proposed RelPref method consistently achieves the highest levels of user satisfaction and system effectiveness, followed closely by PriRelPref. This consistent ranking confirms the superior capability of the proposed methods to capture users’ genuine preferences, even under less favorable popularity determination settings. In the criteria-based analysis (Fig. 10B), Mul, Aug, and Paiw report high novelty and popularity-bias mitigation values but perform poorly in terms of personalized recommendations. DUoR shows moderate performance (Novelty: 0.8922, APLT: 0.8922, LTC: 0.0189). In contrast, the proposed RelPref (Novelty: 0.7666, APLT: 0.7666, LTC: 0.0163) and PriRelPref (Novelty: 0.7736, APLT: 0.7736, LTC: 0.0164) achieve lower debiasing scores while delivering substantially higher user satisfaction. The overall-based analysis (Fig. 10C) closely mirrors these observations. Although baseline methods such as Mul, Paiw, and Aug aggressively mitigate popularity bias and improve diversity, this strategy leads to significant losses in user satisfaction. By contrast, the proposed methods maintain a balanced trade-off among user satisfaction, diversity, and popularity-bias mitigation, and they outperform DUoR in both criteria-based and overall-based evaluations.
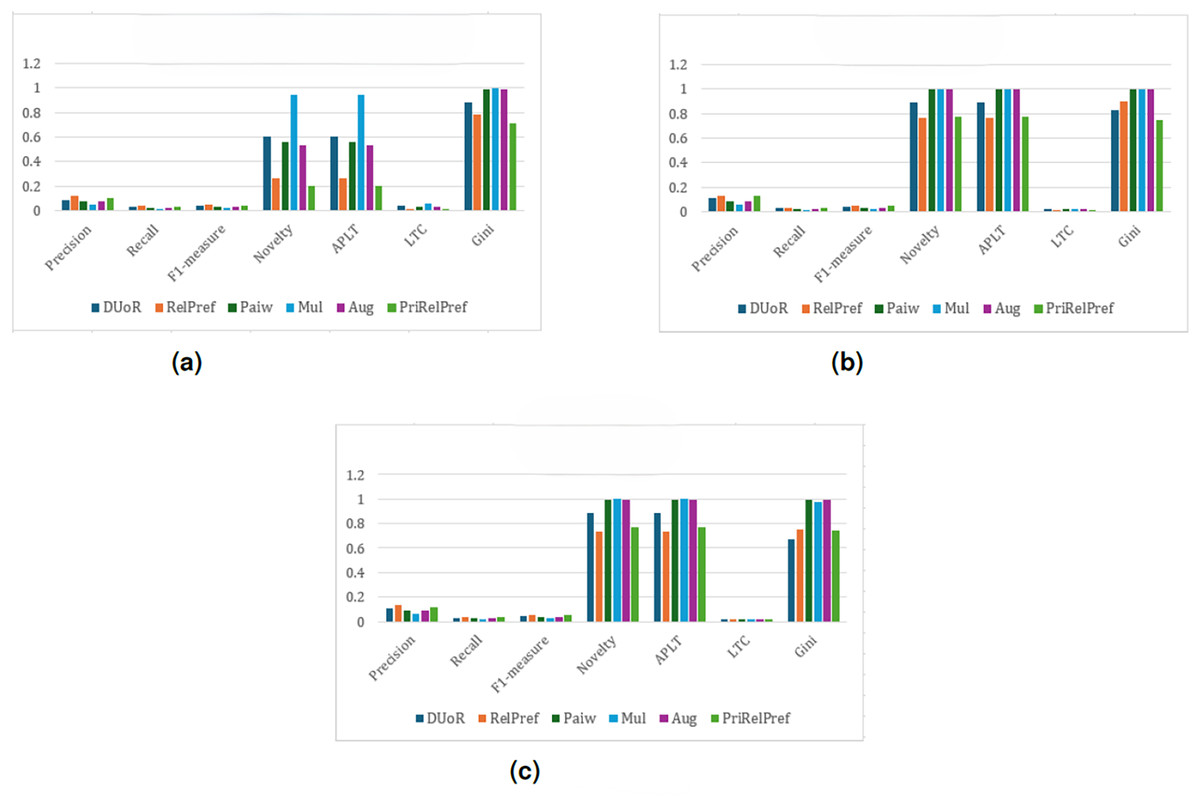
Figure 10: RPI analysis results on the YM20 dataset.
(A) Aggregate-based, (B) criteria-based and (C) overall-based.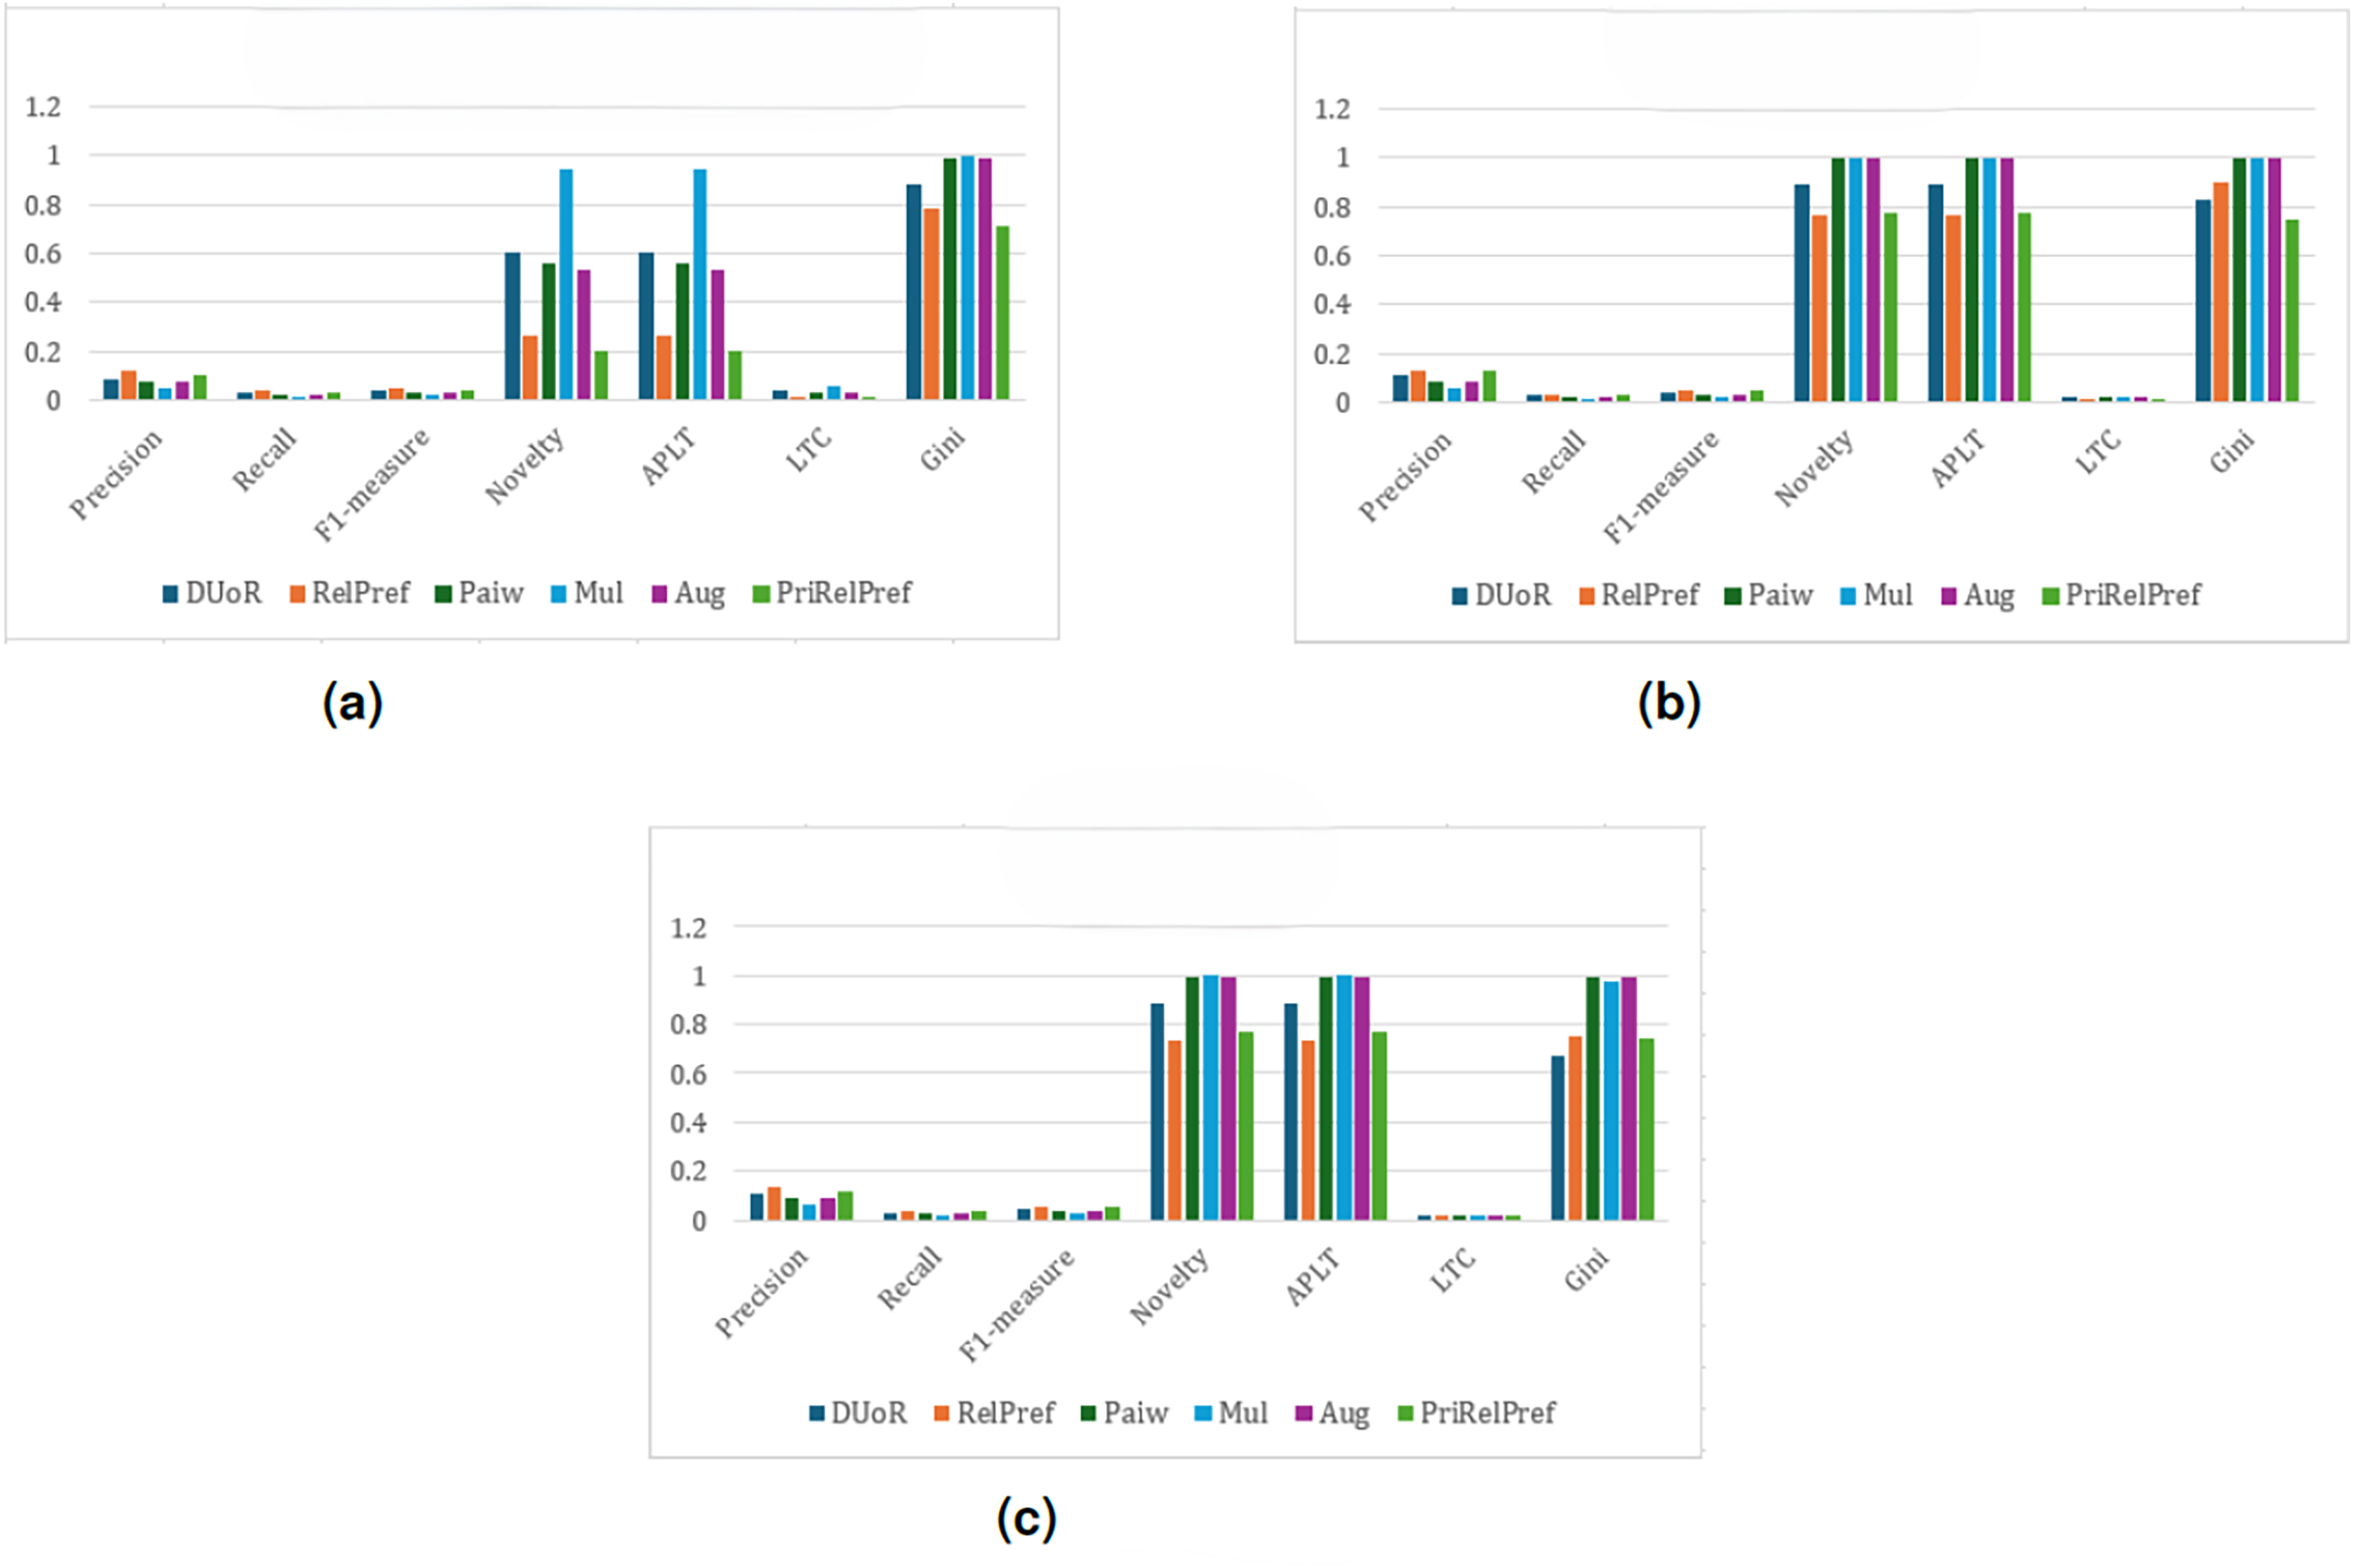
For this dataset, the results of the final analysis conducted using the APRI method are summarized as shown in Fig. 11. As shown in Fig. 11A, in terms of user satisfaction, the RelPref method achieves the highest performance, while PriRelPref (Precision: 0.0993, Recall: 0.031, F1-measure: 0.0441) remains at a moderate level. In contrast, the Paiw, Aug, and Mul methods exhibit the lowest performance. Regarding popularity bias mitigation, the observed results are consistent with those obtained from the previous methods and evaluation settings. Among all approaches, PriRelPref demonstrates superior capability in delivering diverse recommendations while maintaining user satisfaction. However, as shown in Fig. 11B, the criteria-based analysis indicates that RelPref achieves the best performance in terms of user satisfaction. Furthermore, RelPref shows strong effectiveness in providing novel and diverse recommendations, as eight out of the top 10 recommended items belong to different categories, and two of these items directly align with the user’s interests and preferences. The overall-based analysis presented in Fig. 11C yields accuracy results consistent with those observed in the criteria-based analysis. However, with respect to the Gini coefficient, the proposed PriRelPref method achieves the same value as in the criteria-based scenario. While the performance of other methods declines in terms of providing diverse items across different categories, PriRelPref maintains stable effectiveness, indicating that its performance remains robust across different analysis types.
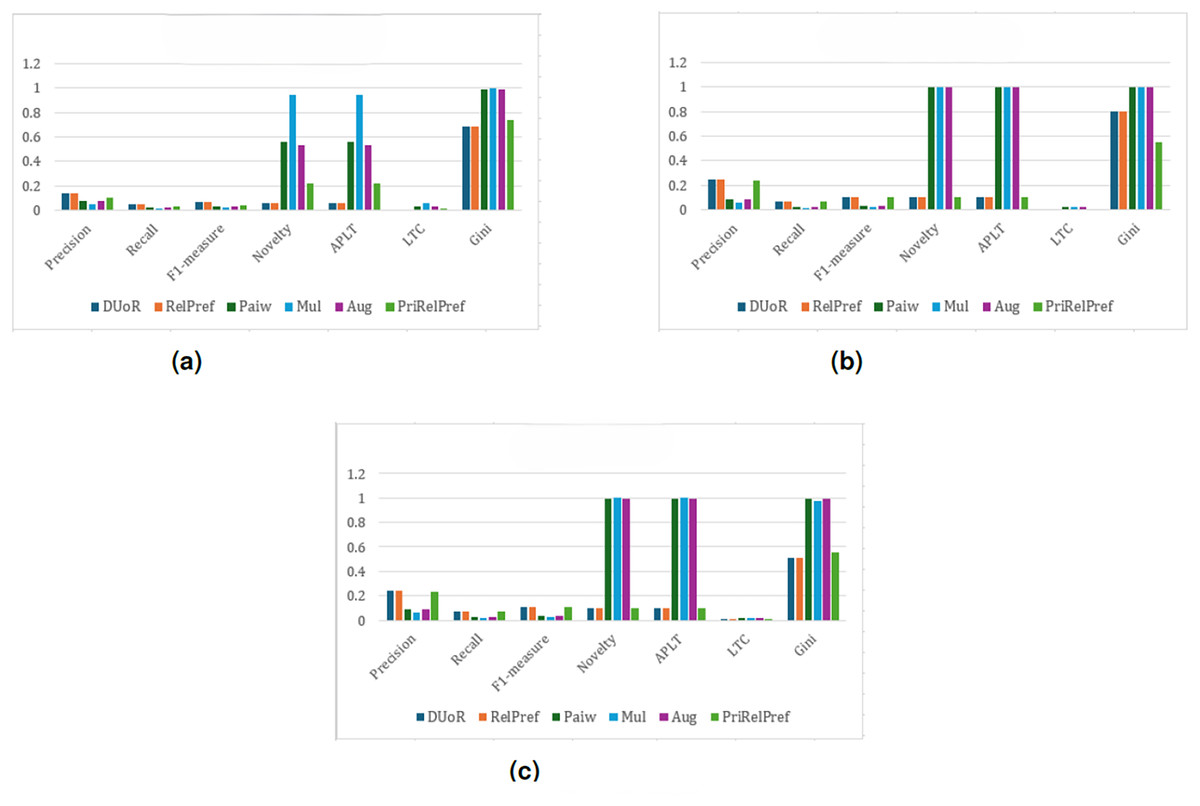
Figure 11: APRI analysis results on the YM20 dataset.
(A) Aggregate-based, (B) criteria-based and (C) overall-based.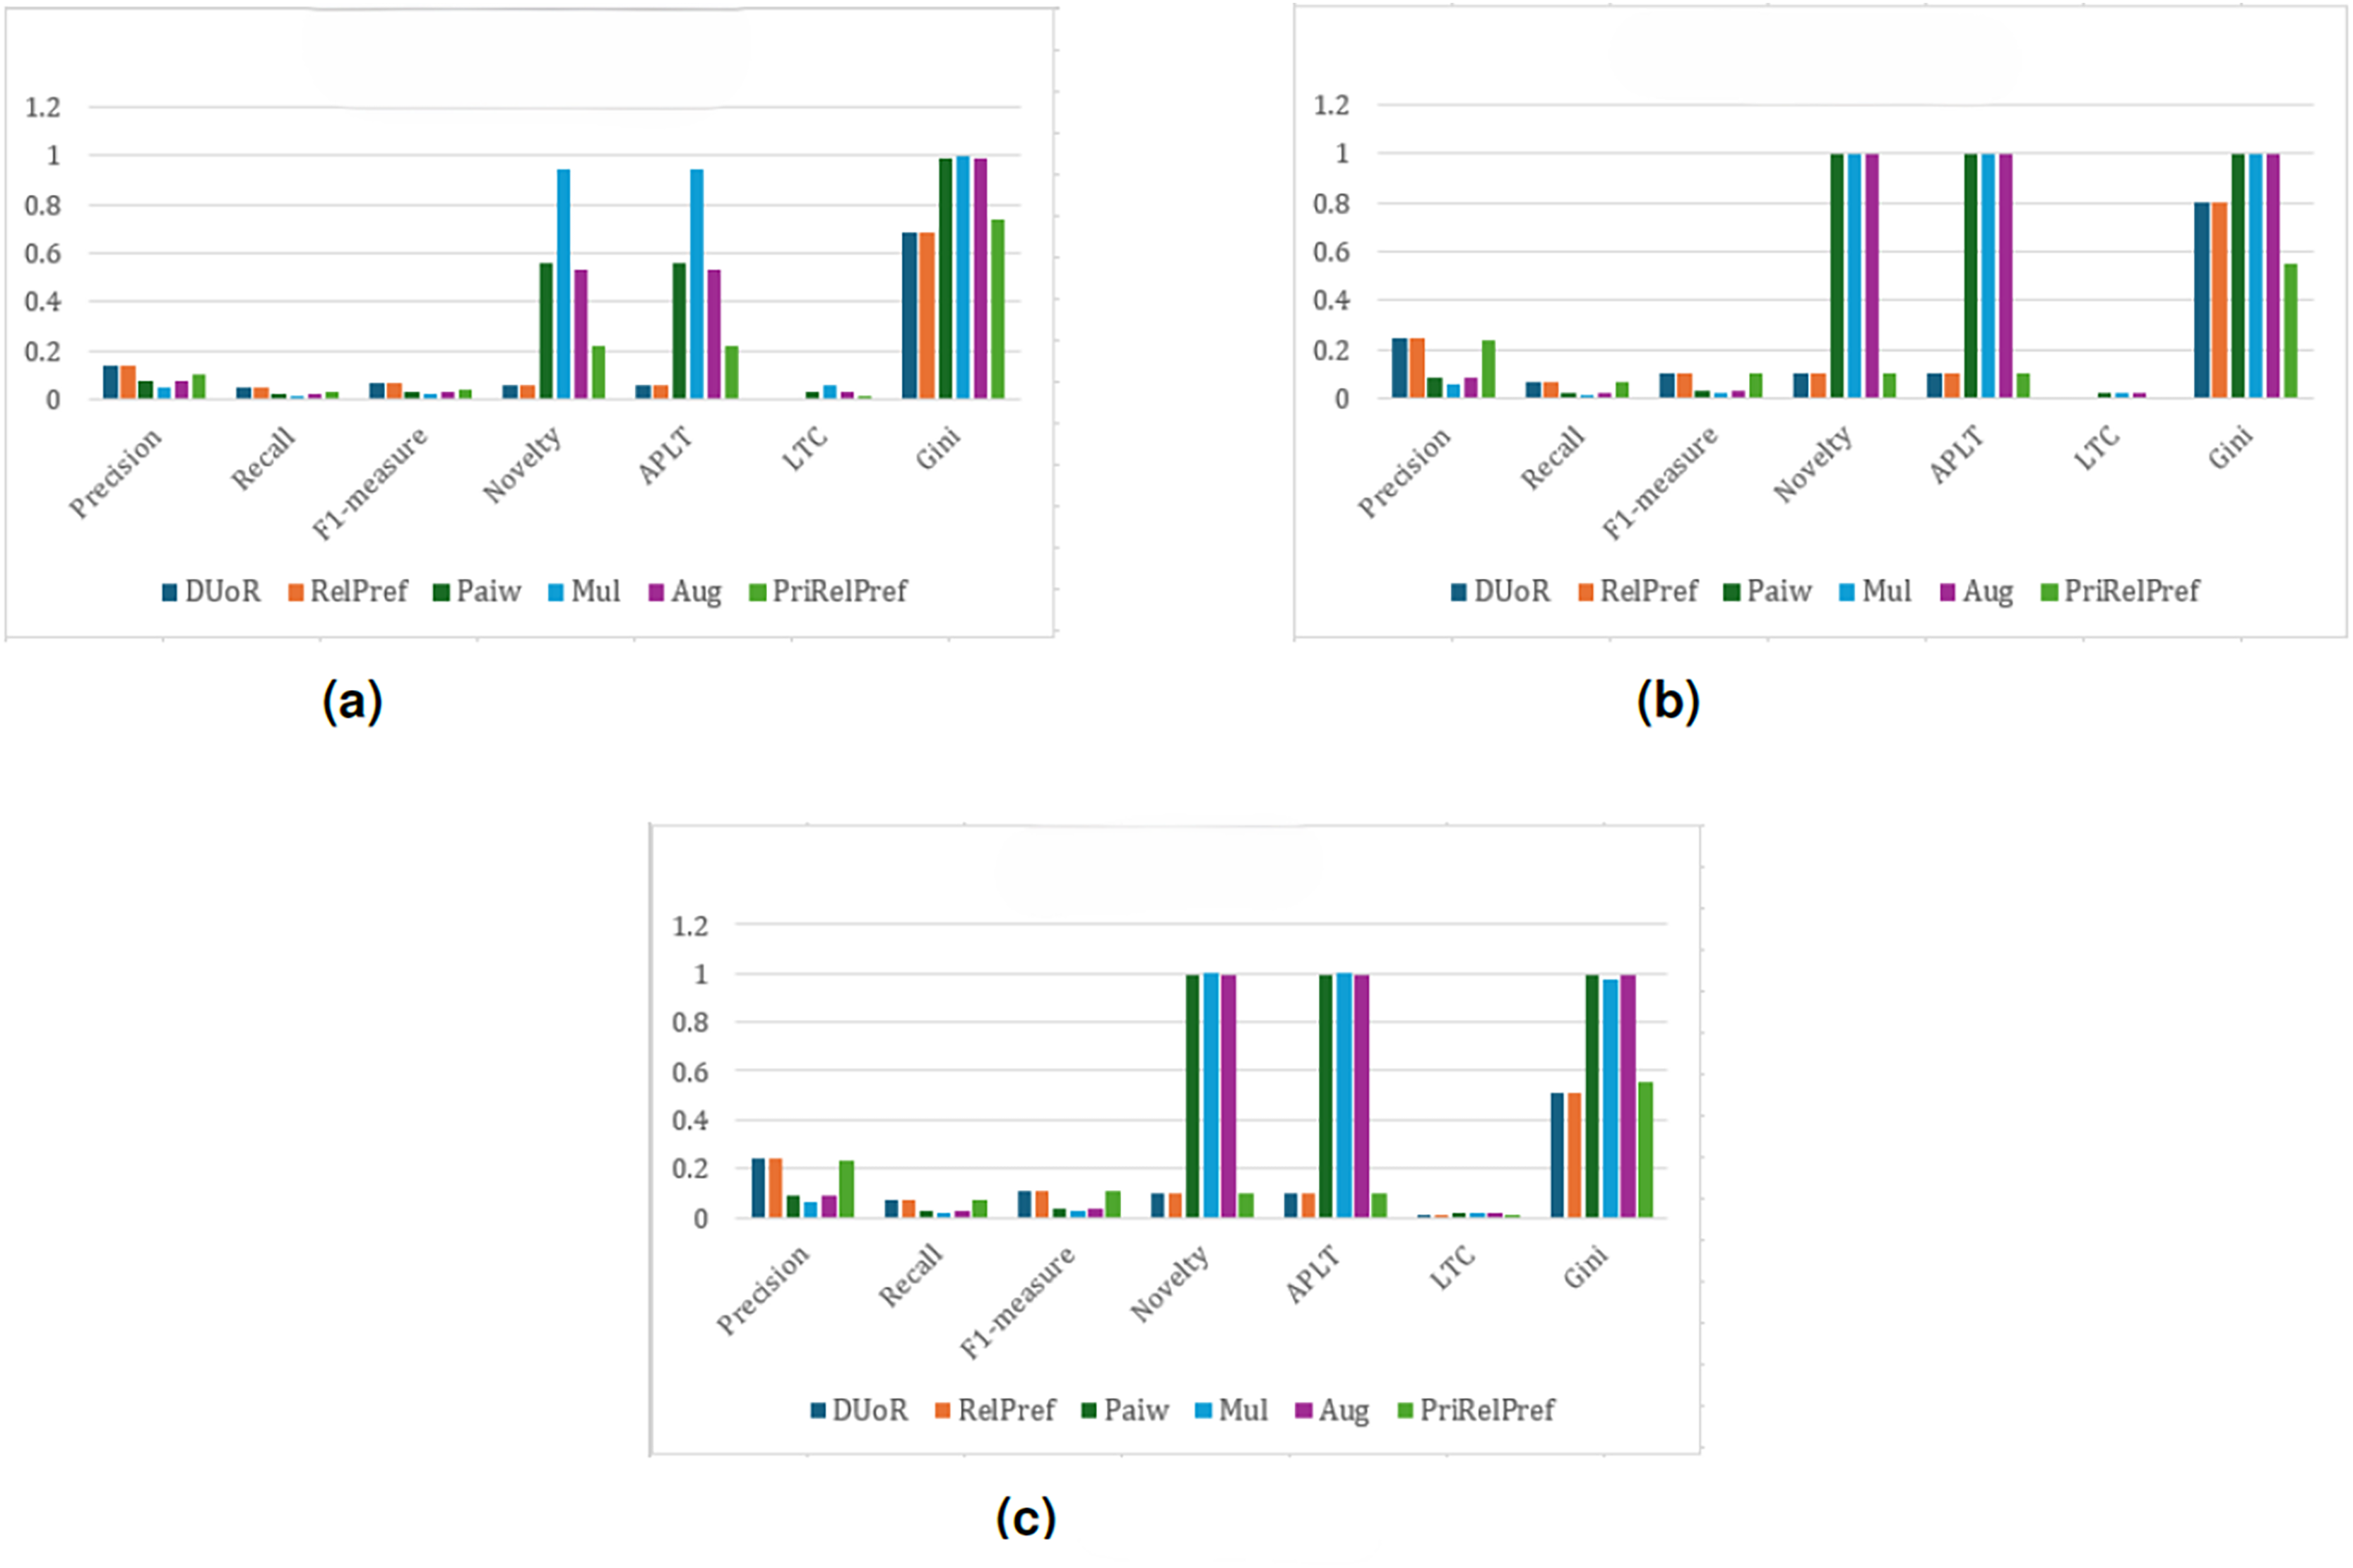
In conclusion, the results obtained from the YM20 dataset are notably more satisfactory than those from the previous datasets, reflecting a stronger balance between user satisfaction and the popularity distribution of recommended items. This improvement largely stems from the dataset’s higher density, which provides richer user–item interactions and more informative ratings. As a result, the models capture user preferences more accurately, yielding outcomes that are more stable and interpretable. Furthermore, the higher correlation observed among the multiple criteria indicates that users evaluate aspects such as acting, story, direction, and visuals in a coherent manner. This consistency enhances the reliability of preference learning and produces clearer distinctions across criteria-based, overall-based, and aggregate-based analyses. Overall, the YM20 dataset’s lower sparsity and more consistent user feedback enable the models to achieve a well-balanced performance in terms of accuracy, diversity, and user satisfaction. These findings underscore the importance of data density and evaluation consistency in the effectiveness of multi-criteria recommender systems.
For the final dataset, YM10, the results indicate that, under the setting and across all evaluation scenarios, DUoR and RelPref achieve relatively high levels of user satisfaction (Precision –0.053); however, they exhibit lower fairness in terms of item exposure due to elevated Gini values (see Fig. 12). In contrast, Mul, Paiw, and Aug generate extremely high novelty and long-tail coverage, but suffer from substantial accuracy losses, indicating weak alignment with user preferences. Among the proposed methods, RelPref demonstrates a more balanced performance, particularly in the criteria- and overall-based analyses (see Figs. 12B and 12C). RelPref maintains acceptable accuracy while achieving competitive results in diversity and fairness metrics. PriRelPref shows improvements in accuracy in certain scenarios; however, its overall contribution remains limited when compared to DUoR.
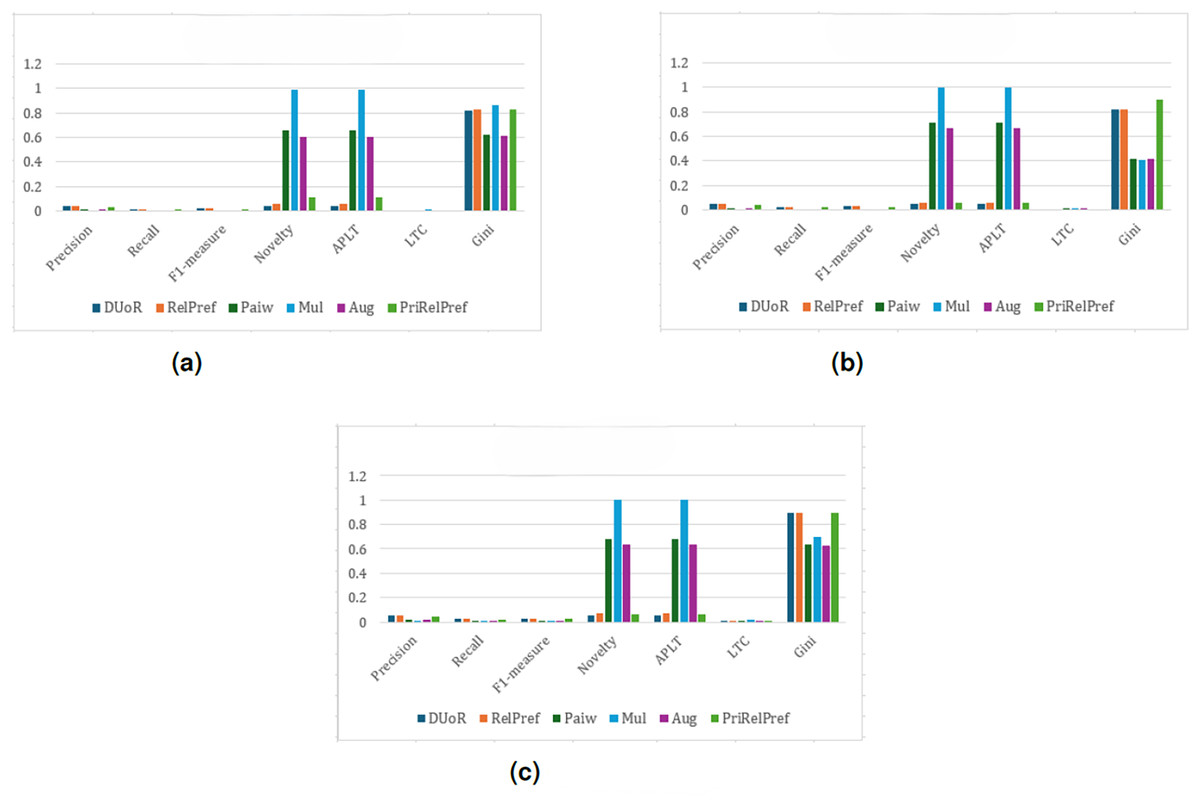
Figure 12: analysis results on the YM10 dataset.
(A) Aggregate-based, (B) criteria-based and (C) overall-based.
Figure 13 presents the analysis results obtained using the method. For metrics other than RelPref and PriRelPref, the use of this method results in either stable or declining performance. In contrast, the proposed methods achieve an improvement of approximately 2-3% in overall performance. In the overall-based scenario (see Fig. 13C), user satisfaction reaches its peak in the generated recommendation lists; however, this performance decreases in the criteria- and aggregate-based scenarios, as observed in Figs. 13B and 13A. Nevertheless, despite the observed gains in user satisfaction, a decline in item diversity is also evident.

Figure 13: analysis results on the YM10 dataset.
(A) Aggregate-based, (B) criteria-based and (C) overall-based.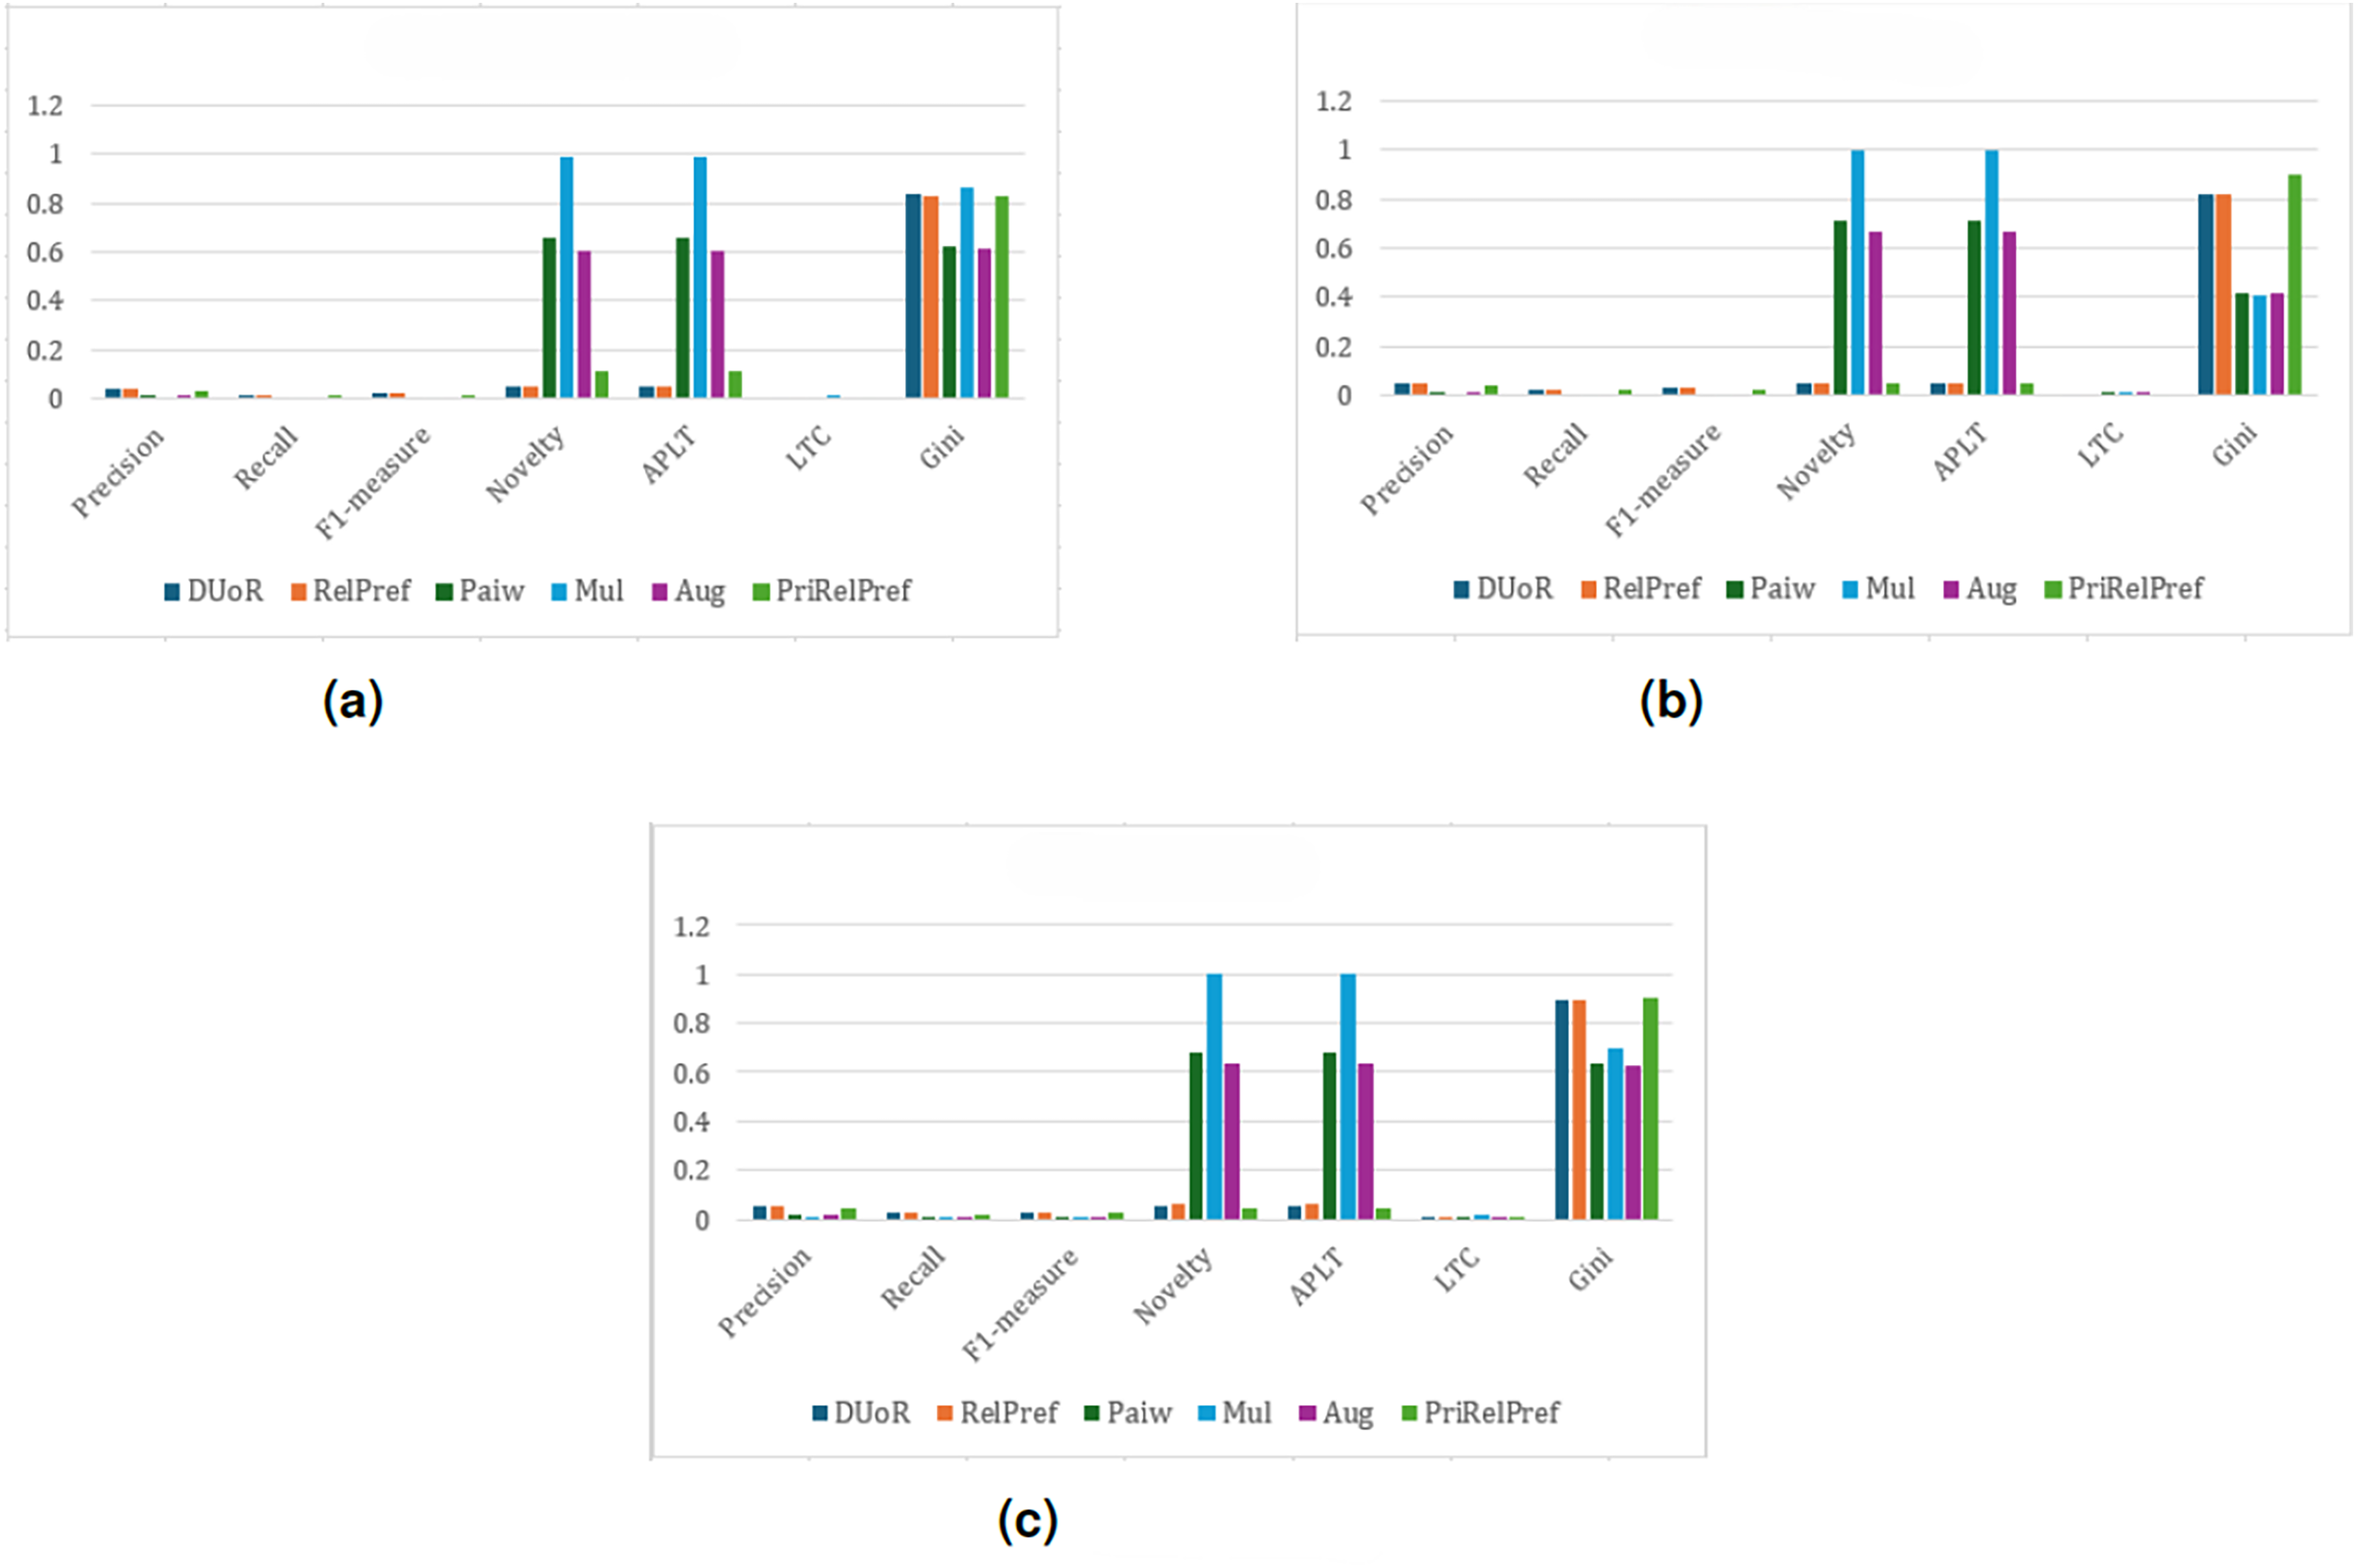
The comparative evaluation of the aggregate-based, criteria-based, and overall-based analyses using the RPI method on the YM10 dataset shows that RelPref consistently achieves the highest user satisfaction across all evaluation types. As illustrated in Figs. 14A–14C, RelPref outperforms the baseline methods in Precision, Recall, and F1-measure in each analytical perspective. In terms of popularity-bias mitigation, Mul, Paiw, and Aug perform best in the aggregate-based analysis, whereas DUoR, RelPref, and PriRelPref achieve higher Novelty and APLT values in the criteria-based and overall-based analyses, indicating that analysis type strongly influences debiasing outcomes. Diversity fairness also varies across scenarios, with Mul leading in the aggregate-based analysis and PriRelPref achieving the highest Gini values in the criteria- and overall-based evaluations.
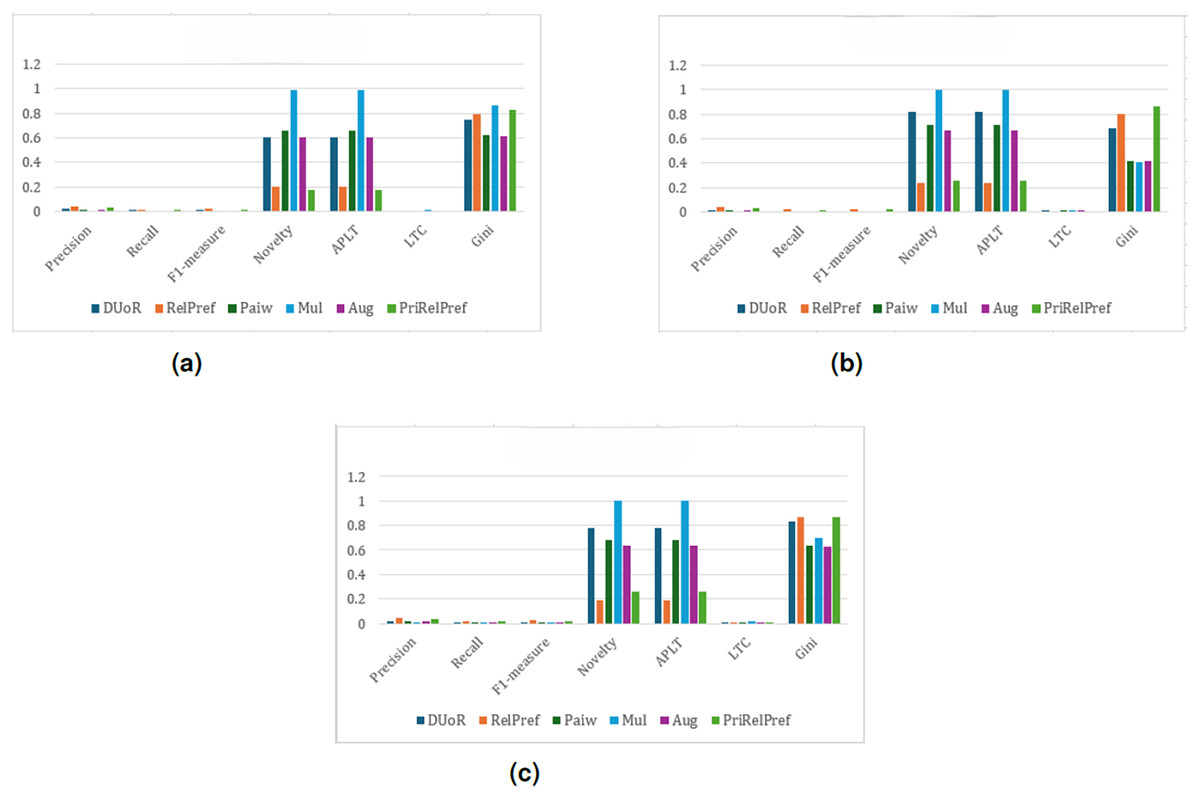
Figure 14: RPI analysis results on the YM10 dataset.
(A) Aggregate-based, (B) criteria-based and (C) overall-based.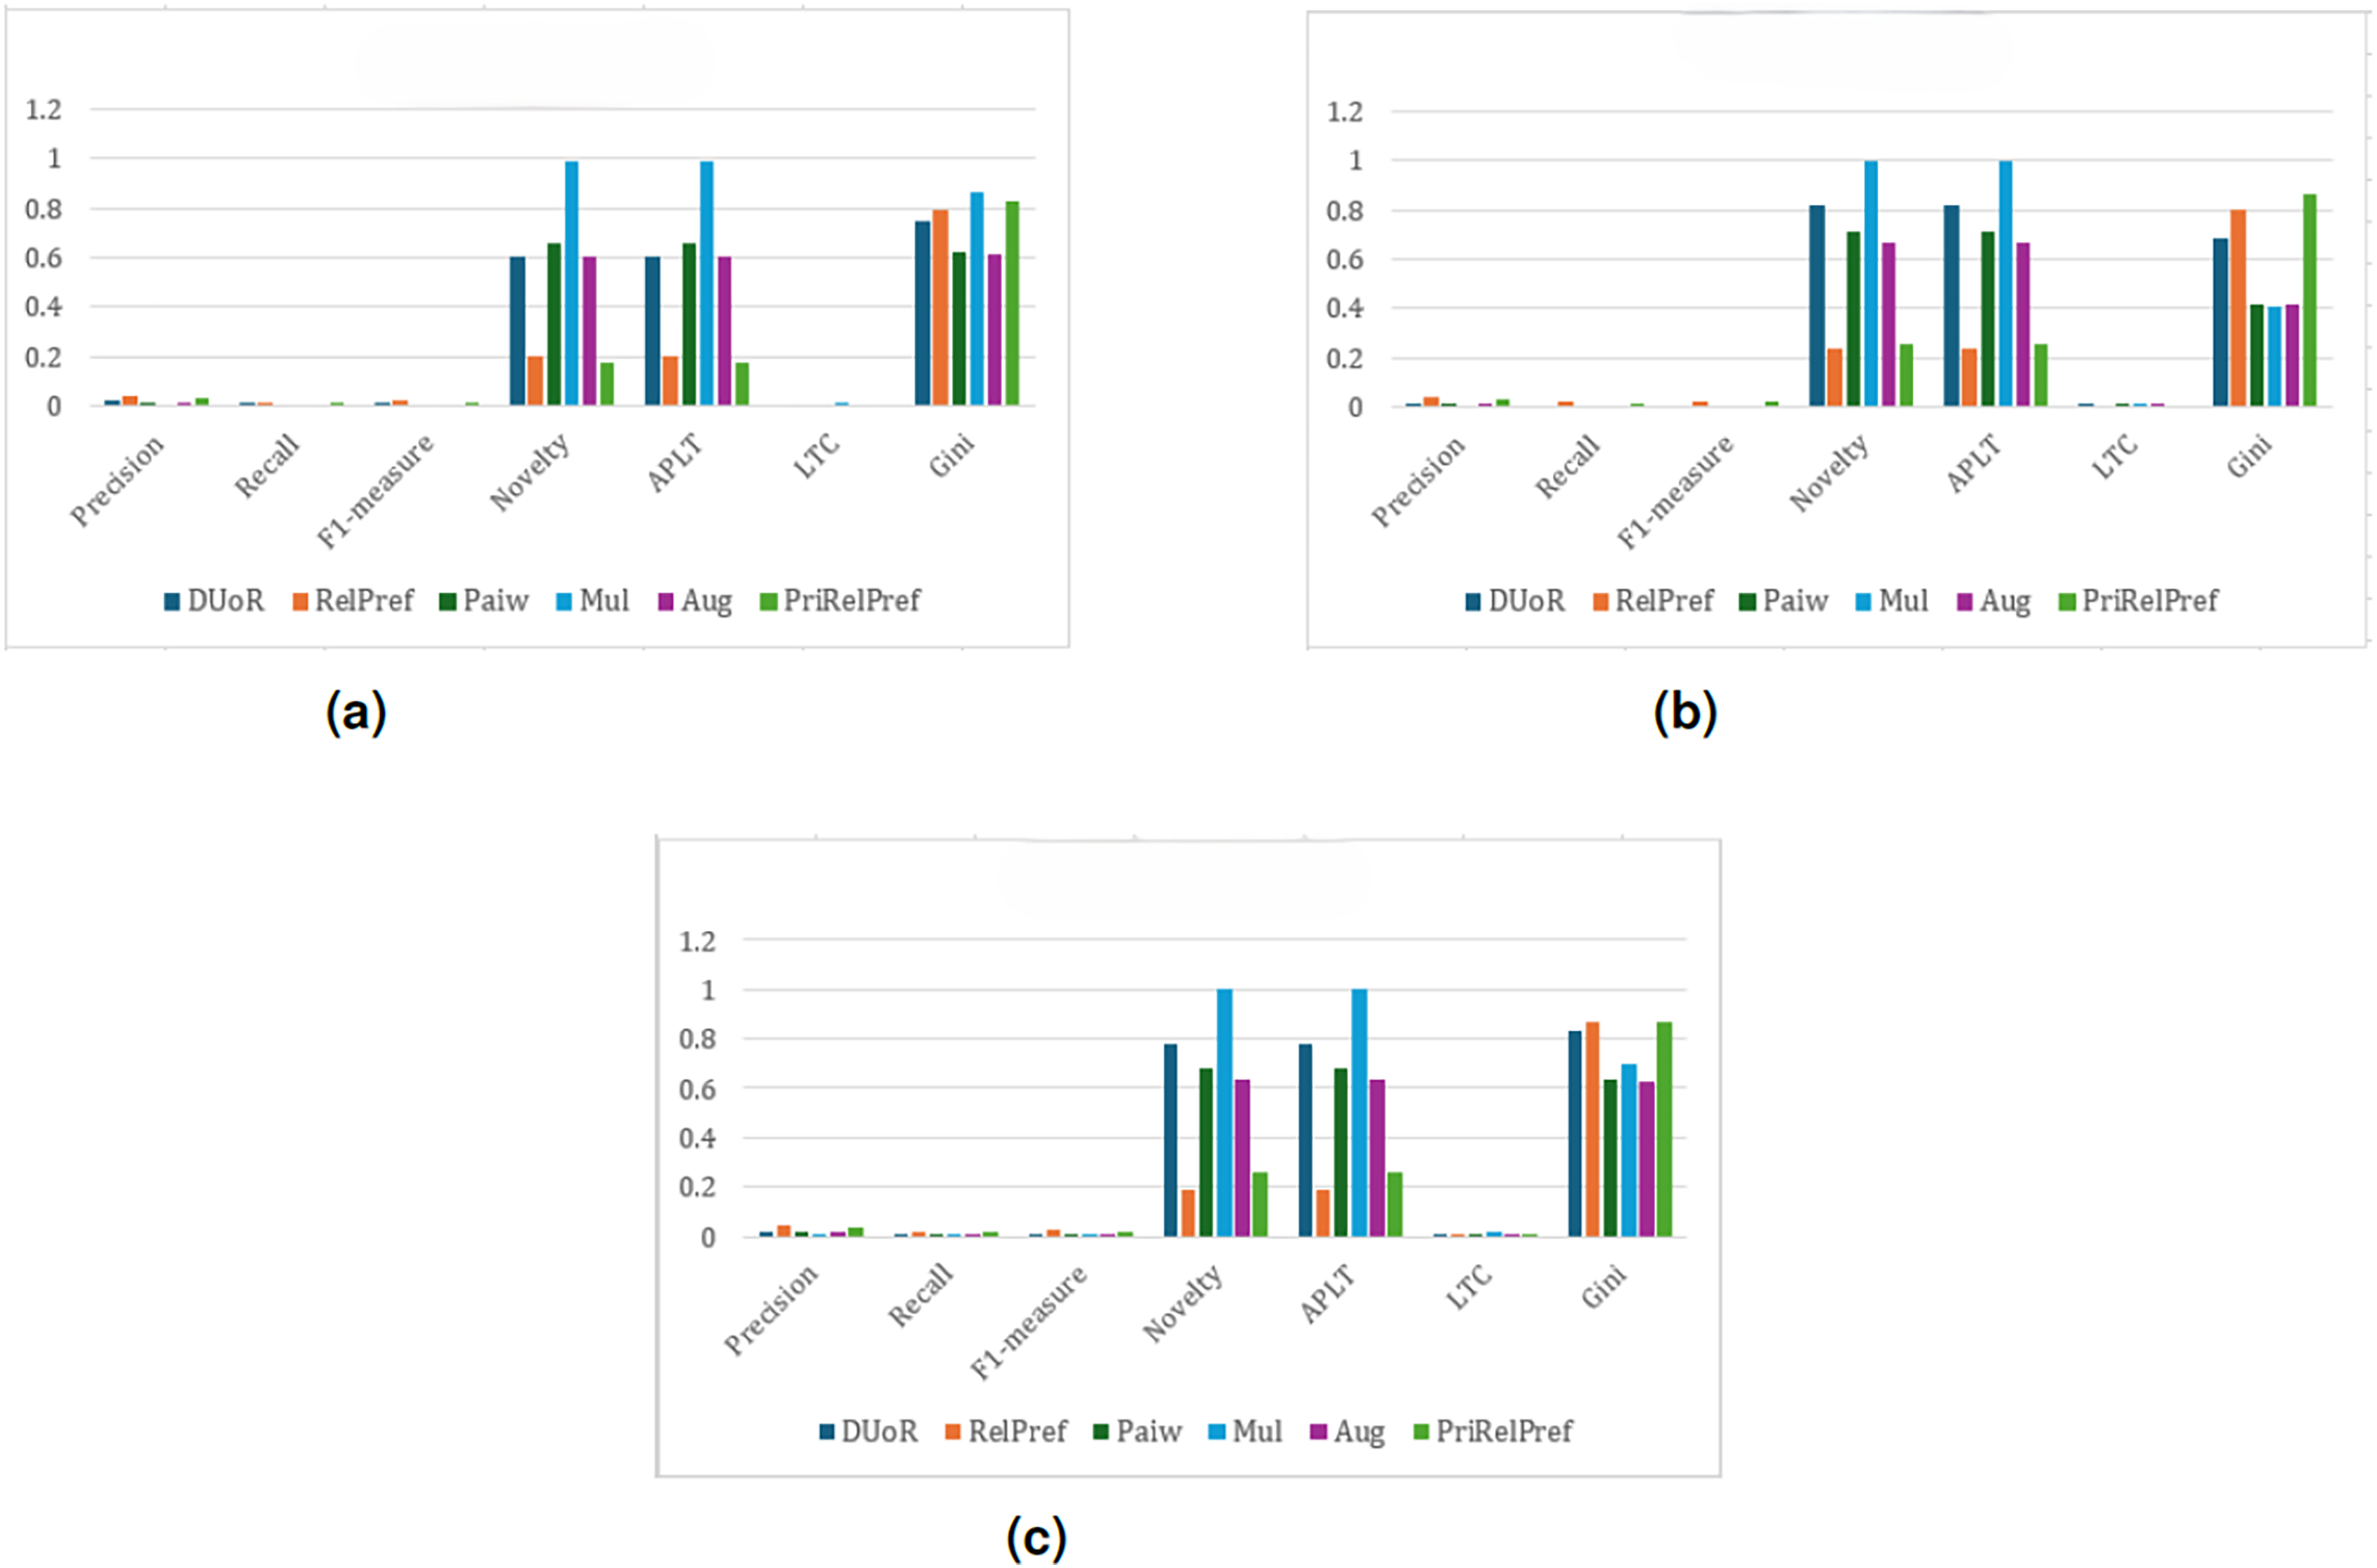
As illustrated in Fig. 15, the final evaluation results obtained under the APRI metric indicate that the RelPref methods achieve the highest performance in terms of user satisfaction while adopting a more conservative strategy for mitigating popularity bias. In contrast, Mul, Paiw, and Aug employ aggressive popularity-bias reduction strategies; however, this approach leads to substantial losses in user satisfaction. PriRelPref, on the other hand, demonstrates a balanced performance in both aspects. In terms of Novelty and APLT metrics, beyond the commonly preferred algorithms in the literature, PriRelPref outperforms RelPref and DUoR in delivering new and long-tail items. While Mul ensures the highest diversity in recommendations, PriRelPref closely follows. As shown in Fig. 15B, the criteria-based analysis results resemble those of the aggregate-based analysis in terms of accuracy metrics. Although DUoR achieves relatively higher values in providing new and non-popular items compared to the aggregate-based analysis, this does not translate into success in diversity or user satisfaction. Regarding diversity, the proposed RelPref and PriRelPref methods offer the most diverse recommendations. Finally, as presented in Fig. 15C, the overall-based analysis produces results consistent with both the aggregate- and criteria-based analyses. Paiw, Aug, and Mul display considerably lower performance in user satisfaction metrics. In terms of mitigating popularity bias, the outcomes are similar to those observed in the aggregate-based analysis.
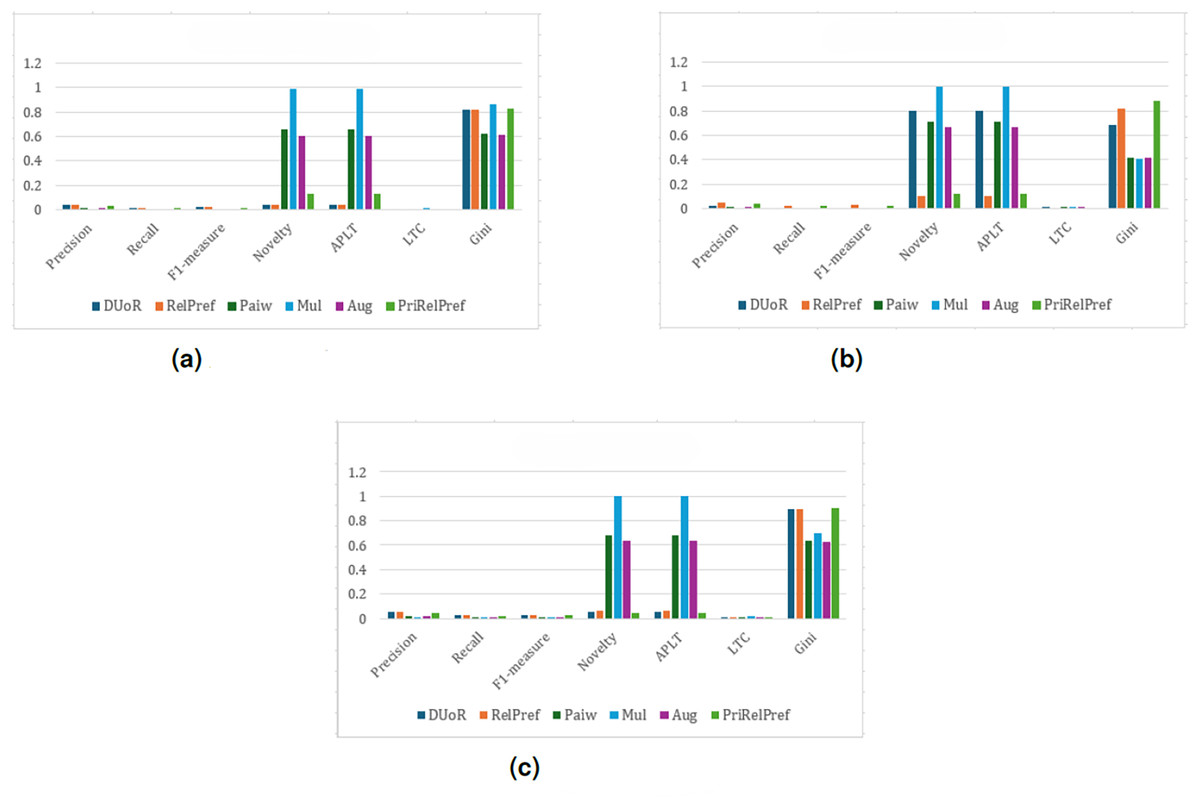
Figure 15: APRI analysis results on the YM10 dataset.
(A) Aggregate-based, (B) criteria-based and (C) overall-based.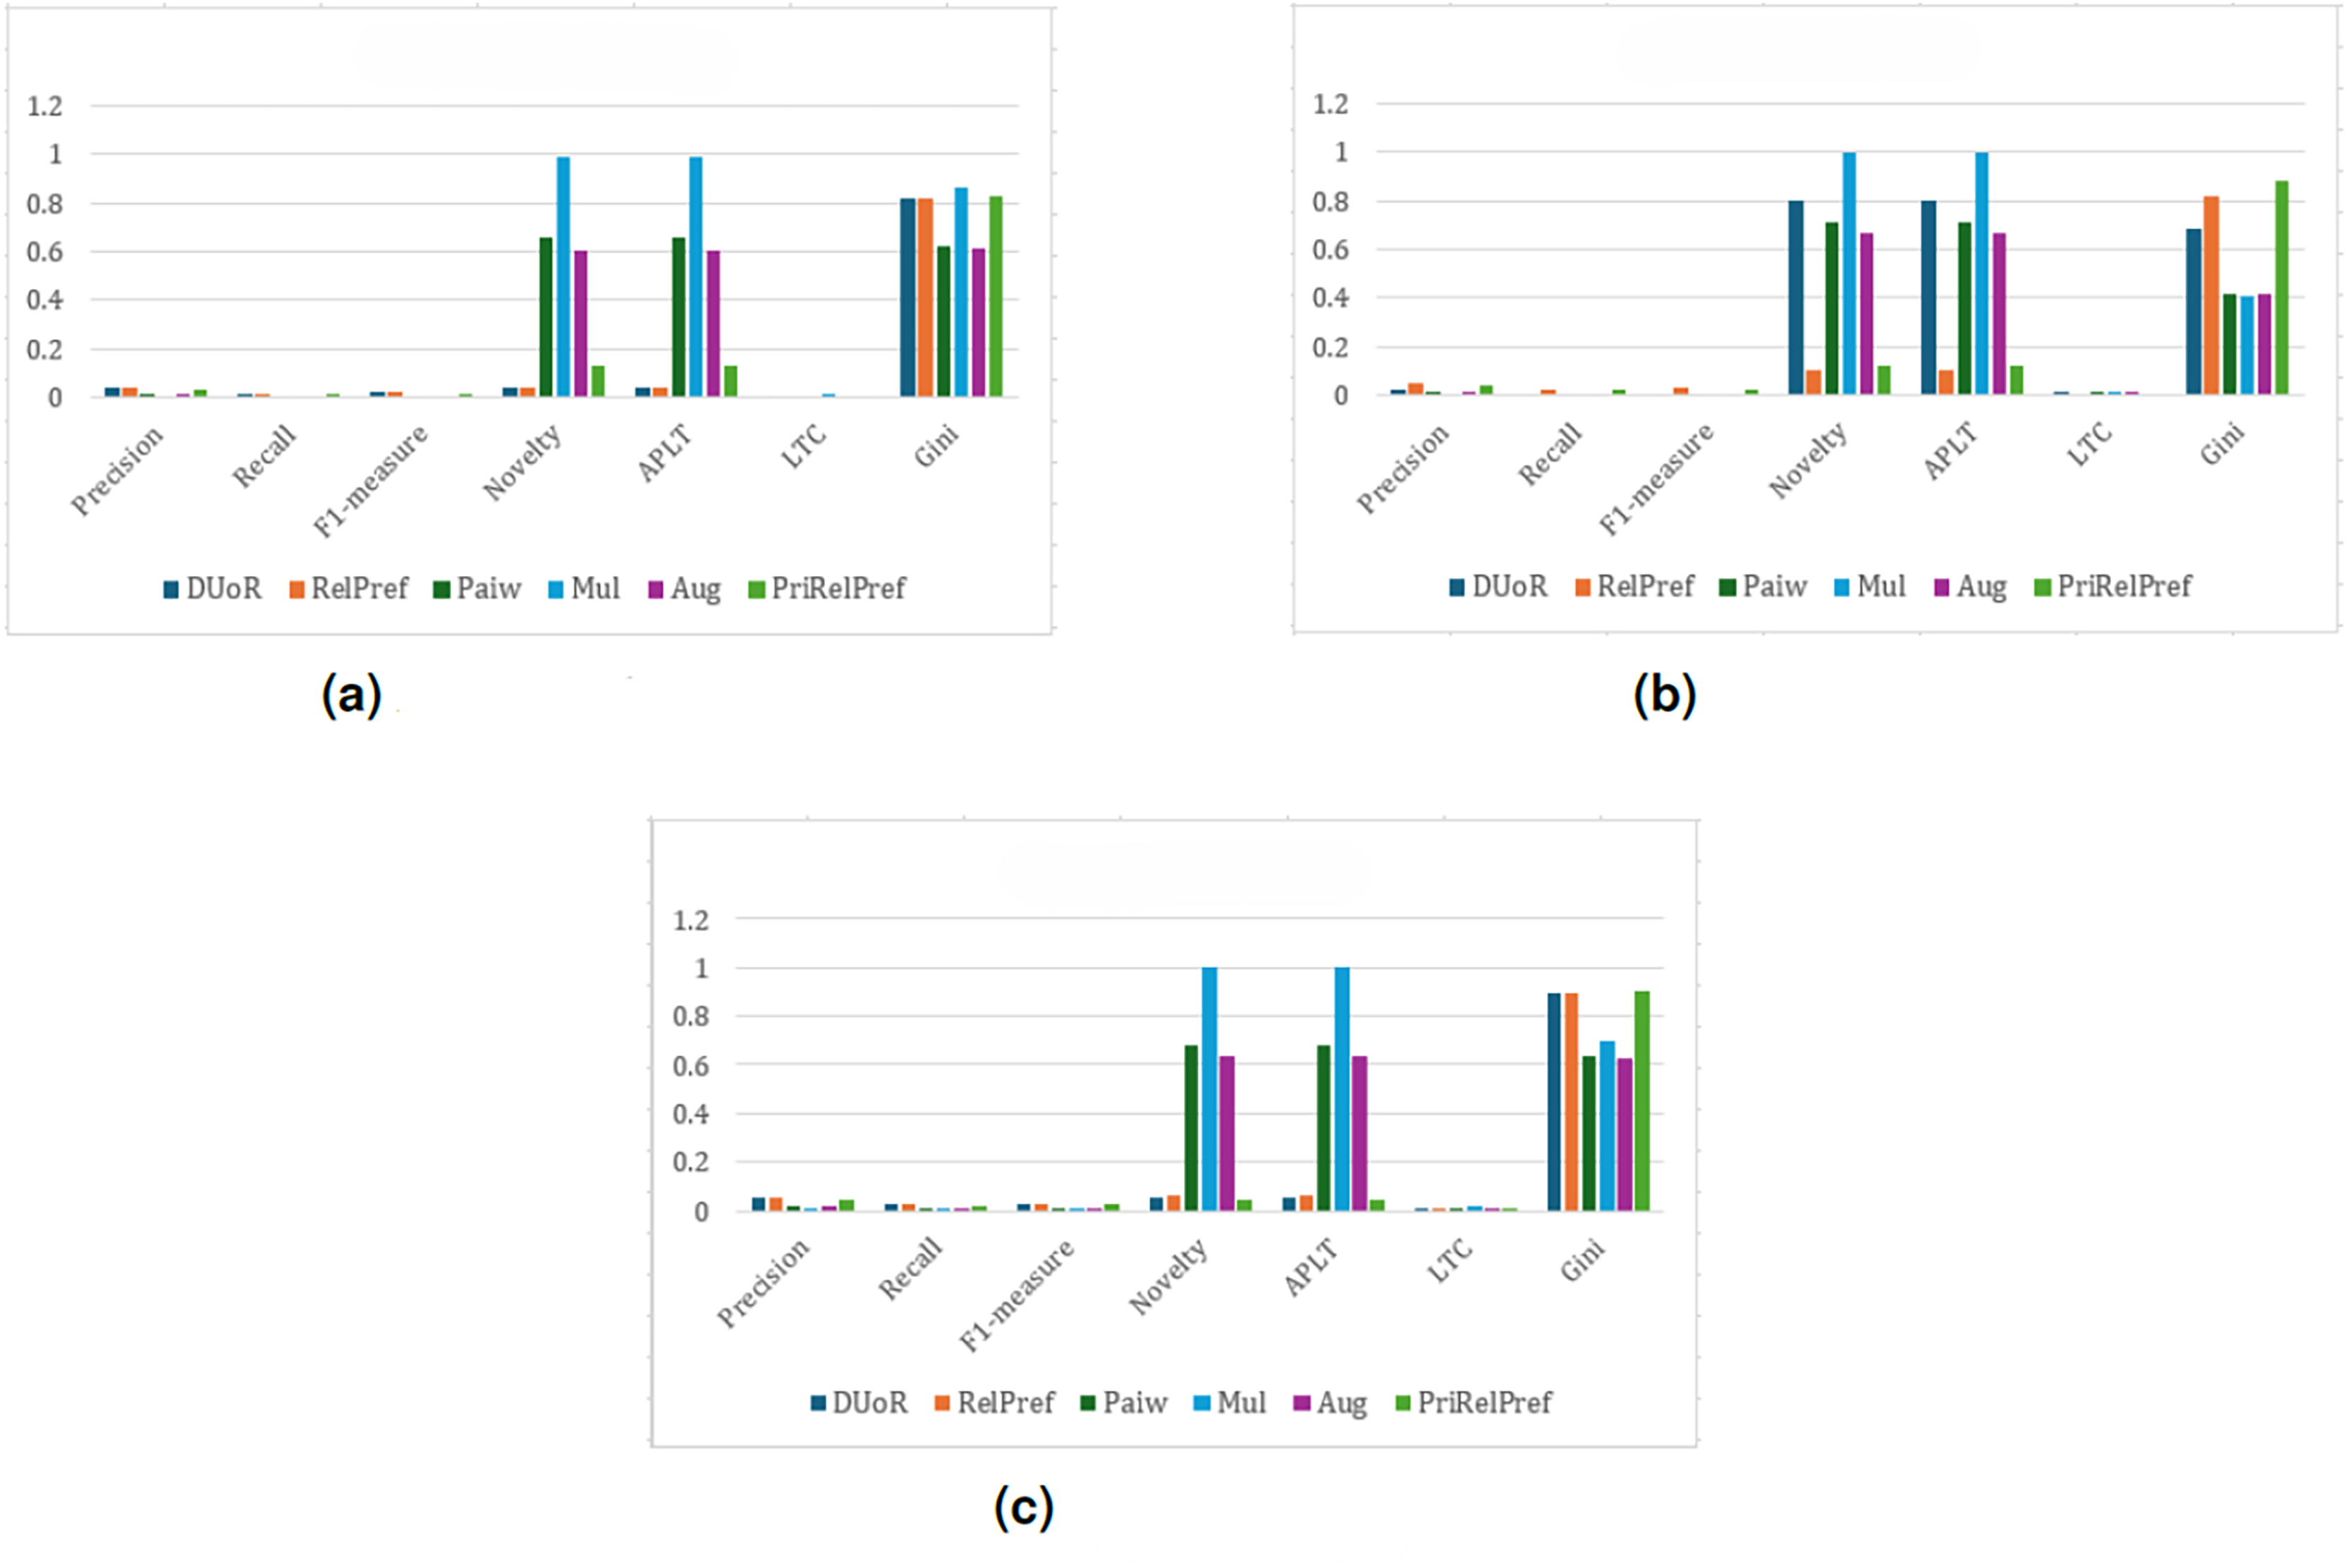
Based on all the evaluation results presented above, the relationship between Precision, which reflects user satisfaction, and APLT, which represents the popularity level of the recommended items, plays a decisive role in evaluating recommendation quality. In this context, the absolute difference between Precision and APLT emerges as a critical indicator of overall system effectiveness. A small difference reflects a desirable balance, where the system maintains high user satisfaction while reducing popularity bias through the inclusion of long-tail items. As summarized in Table 5, the proposed methods—particularly RelPref and PriRelPref—consistently achieve low differences across datasets. In Table 5, bold values indicate the lowest absolute differences between Precision and APLT for each dataset and popularity metric, highlighting methods that achieve a better balance between accuracy and long-tail item exposure. For example, in the YM20 dataset under the RPI strategy, RelPref obtains the lowest value (0.1503), while PriRelPref achieves similarly low differences under the (0.1604) and APRI (0.1213) methods. In the YM10 and TA datasets, PriRelPref yields the smallest differences (0.0011 and 0.0191), demonstrating superior balance between user satisfaction and popularity bias mitigation.
| Popularity metric | Algorithms | YM20 | YM10 | TA |
|---|---|---|---|---|
| DUoR | 0.3554 | 0.0151 | 0.0159 | |
| RelPref | 0.1503 | 0.0061 | 0.0159 | |
| Paiw | 0.5952 | 0.4519 | 0.6658 | |
| Mul | 0.6284 | 0.6646 | 0.6709 | |
| Aug | 0.5894 | 0.417 | 0.6585 | |
| PriRelPref | 0.1604 | 0.0011 | 0.0191 | |
| DUoR | 0.1434 | 0.0151 | 0.0159 | |
| RelPref | 0.1385 | 0.0133 | 0.0159 | |
| Paiw | 0.5952 | 0.4519 | 0.6658 | |
| Mul | 0.6284 | 0.6646 | 0.6709 | |
| Aug | 0.5894 | 0.417 | 0.6585 | |
| PriRelPref | 0.1196 | 0.0082 | 0.0191 | |
| RPI | DUoR | 0.5017 | 0.5164 | 0.0574 |
| RelPref | 0.3794 | 0.1036 | 0.0159 | |
| Paiw | 0.5952 | 0.4519 | 0.6658 | |
| Mul | 0.6284 | 0.6646 | 0.6709 | |
| Aug | 0.5894 | 0.417 | 0.6585 | |
| PriRelPref | 0.4031 | 0.1394 | 0.0194 | |
| APRI | DUoR | 0.1437 | 0.2465 | 0.3101 |
| RelPref | 0.1437 | 0.0049 | 0.0164 | |
| Paiw | 0.5952 | 0.4519 | 0.6658 | |
| Mul | 0.6284 | 0.6646 | 0.6709 | |
| Aug | 0.5894 | 0.417 | 0.6585 | |
| PriRelPref | 0.1213 | 0.0169 | 0.0198 |
These findings indicate that the proposed methods not only prevent the dominance of popular items but also succeed in providing users with more diverse and less popular content. Consequently, RelPref and PriRelPref enhance user satisfaction while also ensuring strong performance in terms of fairness and diversity within multi-criteria recommendation systems. However, it should also be recognized that these improvements in fairness and diversity may inherently come with minor reductions in traditional accuracy metrics. It should be noted that the relatively lower Precision, Recall, and F1 values observed in some cases do not contradict the purpose of a personalized recommender system. Rather, they reflect the well-known trade-off between accuracy and diversity, which is inherent to fairness-aware and popularity-debiasing models. By slightly compromising accuracy, the proposed methods achieve a fairer and more balanced recommendation process that maintains personalization while reducing overexposure to popular items. This balance between user relevance and item diversity is crucial for long-term user satisfaction and sustainable fairness in multi-criteria recommendation systems.
To further clarify this trade-off and provide a consolidated comparative perspective, the accuracy-diversity balance of the proposed and baseline algorithms is systematically summarized in Table 6. The table contrasts the methods in terms of accuracy (Precision, Recall, and F1-measure) and diversity-related metrics (Novelty, APLT, LTC, and Gini Index), offering a holistic view of performance characteristics. For the accuracy dimension, the average of Precision, Recall, and F1-measure is computed for each algorithm; values above the global mean are categorized as High, those below as Low, and values equal or close to the mean as Medium. An analogous procedure is applied to derive the categorical levels of the diversity dimension.
| Dataset | Algorithms | Overall-based | Criteria-based | Aggregate-based | |||
|---|---|---|---|---|---|---|---|
| Accuracy | Diversity | Accuracy | Diversity | Accuracy | Diversity | ||
| YM20 | DUoR | H | L | H | L | M | L |
| RelPref | H | L | H | L | H | L | |
| Paiw | L | H | L | H | L | M | |
| Mul | L | H | L | H | L | H | |
| Aug | L | H | L | H | L | M | |
| PriRelPref | H | L | H | L | H | L | |
| YM10 | DUoR | H | L | M | M | H | L |
| RelPref | H | L | H | L | H | L | |
| Paiw | L | H | L | M | L | M | |
| Mul | L | H | L | H | L | H | |
| Aug | L | M | L | M | L | M | |
| PriRelPref | H | L | H | L | H | L | |
| TA | DUoR | H | L | H | L | H | L |
| RelPref | H | L | H | L | H | L | |
| Paiw | L | H | L | H | L | H | |
| Mul | L | H | L | H | L | H | |
| Aug | M | H | M | H | M | H | |
| PriRelPref | L | L | L | L | L | L | |
Note:
H, High; M, Medium; L, Low.
For the YM20 dataset, the results obtained under the three evaluation scenarios show a highly consistent pattern. In this dataset, RelPref and PriRelPref generally achieve high accuracy while maintaining medium levels of diversity across most perspectives. In contrast, baseline methods such as Paiw, Mul, and Aug produce low accuracy but high diversity. This pattern indicates a clear trade-off in baseline algorithms, where gains in diversity come at the expense of substantial accuracy loss. The proposed RelPref and PriRelPref, however, offer a more balanced performance by delivering satisfactory diversity without compromising accuracy. The results for the YM10 dataset exhibit a similar trend. RelPref and PriRelPref once again maintain a high accuracy profile combined with medium-to-low diversity, demonstrating stable and balanced behavior. Baseline algorithms continue to display high diversity but low accuracy, reinforcing the observation that increased data density amplifies accuracy degradation in popularity-biased methods. The TA dataset, being more sparse and noisy, yields lower overall accuracy levels for all algorithms. Nevertheless, RelPref and the DUoR family achieve medium accuracy, preserving competitive performance, while Mul attains high diversity despite a marked reduction in accuracy. PriRelPref also maintains a relatively balanced profile, avoiding extreme deterioration in either accuracy or diversity.
Building on the previous findings, a statistical analysis of APLT and Precision metrics across the TA, YM20, and YM10 datasets further confirms the effectiveness of the proposed RelPref and PriRelPref methods (see Table 7). Across all datasets, the APLT results consistently indicate that the proposed methods significantly improve long-tail item exposure, thereby mitigating popularity bias. In comparisons with Aug, Mul, and Paiw, these improvements are statistically significant ( ) and supported by large to very large effect sizes, while differences with DUoR are generally not statistically significant.
| Dataset | Metric | Algorithms | Comparator | Wilcoxon | Significance | Effect size (Cohen’s ) |
|---|---|---|---|---|---|---|
| YM20 | Precision | RelPref | Aug | 0.00049 | ✓ | Very large |
| RelPref | DUoR | 0.074 | – | Medium | ||
| RelPref | Mul | 0.00049 | ✓ | Very large | ||
| RelPref | Paiw | 0.00049 | ✓ | Large | ||
| PriRelPref | Aug | 0.00049 | ✓ | Large | ||
| PriRelPref | DUoR | 1.000 | – | None | ||
| PriRelPref | Mul | 0.00049 | ✓ | Very large | ||
| PriRelPref | Paiw | 0.00049 | ✓ | Large | ||
| APLT | RelPref | Aug | 0.00049 | ✓ | Large | |
| RelPref | DUoR | 0.1289 | – | Medium | ||
| RelPref | Mul | 0.00049 | ✓ | Very large | ||
| RelPref | Paiw | 0.00049 | ✓ | Large | ||
| PriRelPref | Aug | 0.00049 | ✓ | Large | ||
| PriRelPref | DUoR | 0.5186 | – | Small | ||
| PriRelPref | Mul | 0.00049 | ✓ | Very large | ||
| PriRelPref | Paiw | 0.00049 | ✓ | Large | ||
| YM10 | Precision | RelPref | Aug | 0.00049 | ✓ | Very large |
| RelPref | DUoR | 0.6826 | – | Medium | ||
| RelPref | Mul | 0.00049 | ✓ | Very large | ||
| RelPref | Paiw | 0.00049 | ✓ | Very large | ||
| PriRelPref | Aug | 0.00049 | ✓ | Very large | ||
| PriRelPref | DUoR | 0.8652 | – | None | ||
| PriRelPref | Mul | 0.00049 | ✓ | Very large | ||
| PriRelPref | Paiw | 0.00049 | ✓ | Very large | ||
| APLT | RelPref | Aug | 0.00049 | ✓ | Very large | |
| RelPref | DUoR | 0.5195 | – | Medium | ||
| RelPref | Mul | 0.00049 | ✓ | Very large | ||
| RelPref | Paiw | 0.00049 | ✓ | Very large | ||
| PriRelPref | Aug | 0.00049 | ✓ | Very large | ||
| PriRelPref | DUoR | 0.4637 | – | Medium | ||
| PriRelPref | Mul | 0.00049 | ✓ | Very large | ||
| PriRelPref | Paiw | 0.00049 | ✓ | Very large | ||
| TA | Precision | RelPref | Aug | 0.00049 | ✓ | Very large |
| RelPref | DUoR | 0.0625 | – | Medium | ||
| RelPref | Mul | 0.00049 | ✓ | Very large | ||
| RelPref | Paiw | 0.00049 | ✓ | Very large | ||
| PriRelPref | Aug | 0.00049 | ✓ | Very large | ||
| PriRelPref | DUoR | 0.00049 | ✓ | Very large | ||
| PriRelPref | Mul | 0.00049 | ✓ | Very large | ||
| PriRelPref | Paiw | 0.00049 | ✓ | Large | ||
| APLT | RelPref | Aug | 0.00049 | ✓ | Very large | |
| RelPref | DUoR | 0.0625 | – | Medium | ||
| RelPref | Mul | 0.00049 | ✓ | Very large | ||
| RelPref | Paiw | 0.00049 | ✓ | Very large | ||
| PriRelPref | Aug | 0.00049 | ✓ | Very large | ||
| PriRelPref | DUoR | 0.2823 | – | Medium | ||
| PriRelPref | Mul | 0.00049 | ✓ | Very large | ||
| PriRelPref | Paiw | 0.00049 | ✓ | Very large |
The precision-based analysis yields complementary insights. For all datasets, RelPref and PriRelPref significantly outperform Aug, Mul, and Paiw ( ), with large or very large effect sizes, demonstrating robust gains in user satisfaction. In contrast, comparisons with DUoR do not consistently reach statistical significance, indicating comparable performance between these methods in terms of accuracy. Overall, the statistical results demonstrate that RelPref and PriRelPref achieve a favorable balance by significantly enhancing long-tail exposure without sacrificing Precision, thereby offering a consistent and effective solution for popularity bias mitigation across different datasets.
Building upon these statistical results, it is also essential to examine how user-level dominance influences the behavior of the proposed models. To analyze the effect of dominant criterion consideration on user preference modeling, a comparative evaluation between the base model and the model with dominant criterion is presented in Table 8. The table shows the differences between the two configurations: one that ignores user dominance and another that explicitly incorporates it.
| Dataset | Metric | RelPref (Base model) | PriRelPref (Dominant criterion) | Change |
|---|---|---|---|---|
| TA | Precision | 0.0065 | 0.0027 | −0.0038 |
| Recall | 0.0243 | 0.0091 | −0.0152 | |
| F1-measure | 0.0100 | 0.0040 | −0.0060 | |
| Novelty | 0.0336 | 0.0676 | +0.0340 | |
| APLT | 0.0336 | 0.0676 | +0.0340 | |
| LTC | 0.0005 | 0.0010 | +0.0005 | |
| Gini index | 0.8731 | 0.7494 | −0.1237 | |
| YM10 | Precision | 0.0468 | 0.0379 | −0.0089 |
| Recall | 0.0215 | 0.0175 | −0.0040 | |
| F1-Measure | 0.0255 | 0.0206 | −0.0049 | |
| Novelty | 0.0980 | 0.1179 | +0.0199 | |
| APLT | 0.0980 | 0.1179 | +0.0199 | |
| LTC | 0.0014 | 0.0016 | +0.0002 | |
| Gini index | 0.8395 | 0.8699 | +0.0304 | |
| YM20 | Precision | 0.1833 | 0.1684 | −0.0149 |
| Recall | 0.0551 | 0.0504 | −0.0047 | |
| F1-measure | 0.0789 | 0.0728 | −0.0061 | |
| Novelty | 0.2831 | 0.3087 | +0.0256 | |
| APLT | 0.2831 | 0.3071 | +0.0240 | |
| LTC | 0.0076 | 0.0089 | +0.0013 | |
| Gini index | 0.7339 | 0.6724 | −0.0615 |
Note:
Positive ( ) and negative ( ) changes indicate metric improvements or declines, respectively.
According to the results, the base model achieves higher values for accuracy-oriented metrics such as Precision, Recall, and F1-Measure across all datasets. This indicates that incorporating user dominance slightly reduces the model’s focus on popular and highly rated items, leading to a minor decline in accuracy. However, the model with dominant criterion achieves noticeable improvements in metrics related to novelty, long-tail coverage (APLT and LTC), and Gini index. These improvements demonstrate that considering user-level dominance reduces popularity bias and increases the exposure of less popular but relevant items. Regarding the Gini index, the model with dominant criterion produces lower values in the TA and YM20 datasets, confirming the reduction of popularity bias. In contrast, a slight increase in the Gini Index is observed for the YM10 dataset, which may result from the stronger concentration of dominant user preferences in this data. Overall, the results indicate that incorporating user dominance improves recommendation diversity and fairness, although with a small trade-off in accuracy-based metrics.
In the final stage, the proposed approaches are evaluated through a sensitivity analysis based on the and parameter values introduced in ‘Relative Preference Model’. Specifically, in order to examine the behavior of the PriRelPref and RelPref algorithms with respect to these two fundamental model parameters, a comprehensive sensitivity analysis is conducted. This analysis aims to assess how variations in and influence the stability and robustness of the proposed methods under different parameter configurations. The results of this analysis, illustrating the performance variations of both algorithms under different values and values , are presented in Fig. 16. While no metric change is observed across all metrics for the S1 and S2 scenarios, only the S3 scenario exhibits variations in certain metrics; these changes are also shown in Fig. 16. In addition, no performance variations are observed for the YM10 and TA datasets under different and parameter settings. In contrast, sensitivity effects with respect to parameter changes are observed for the YM20 dataset, which represents the densest interaction structure considered in this study. Accordingly, the results of the sensitivity analysis are reported based on the YM20 dataset, where the impact of varying parameter values is more clearly captured.
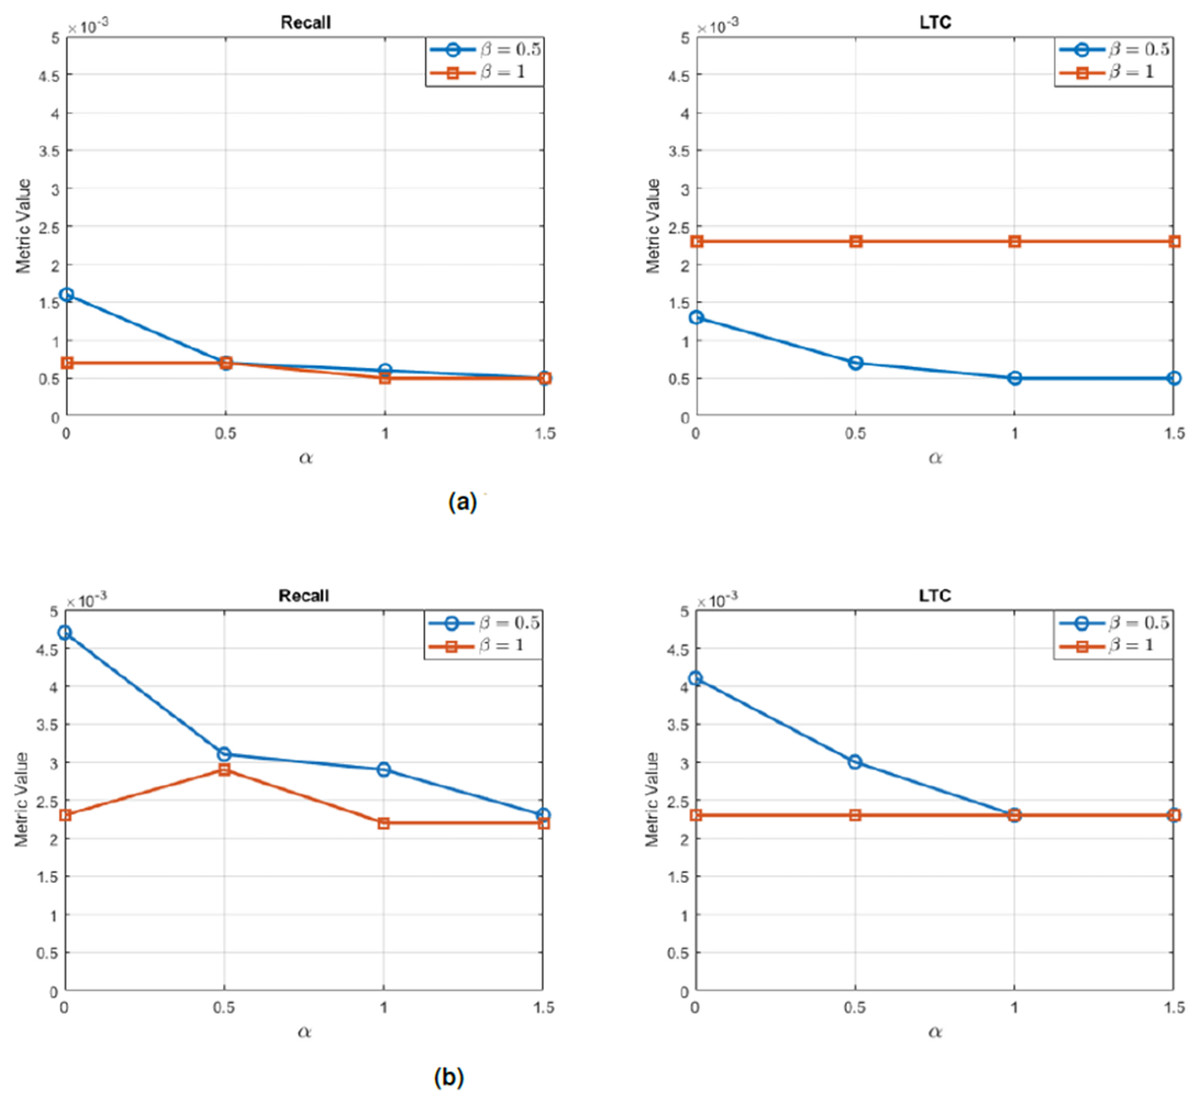
Figure 16: Sensitivity analysis of PriRelPref and RelPref algorithms according to and .
(A) RelPref and (B) PriRelPref.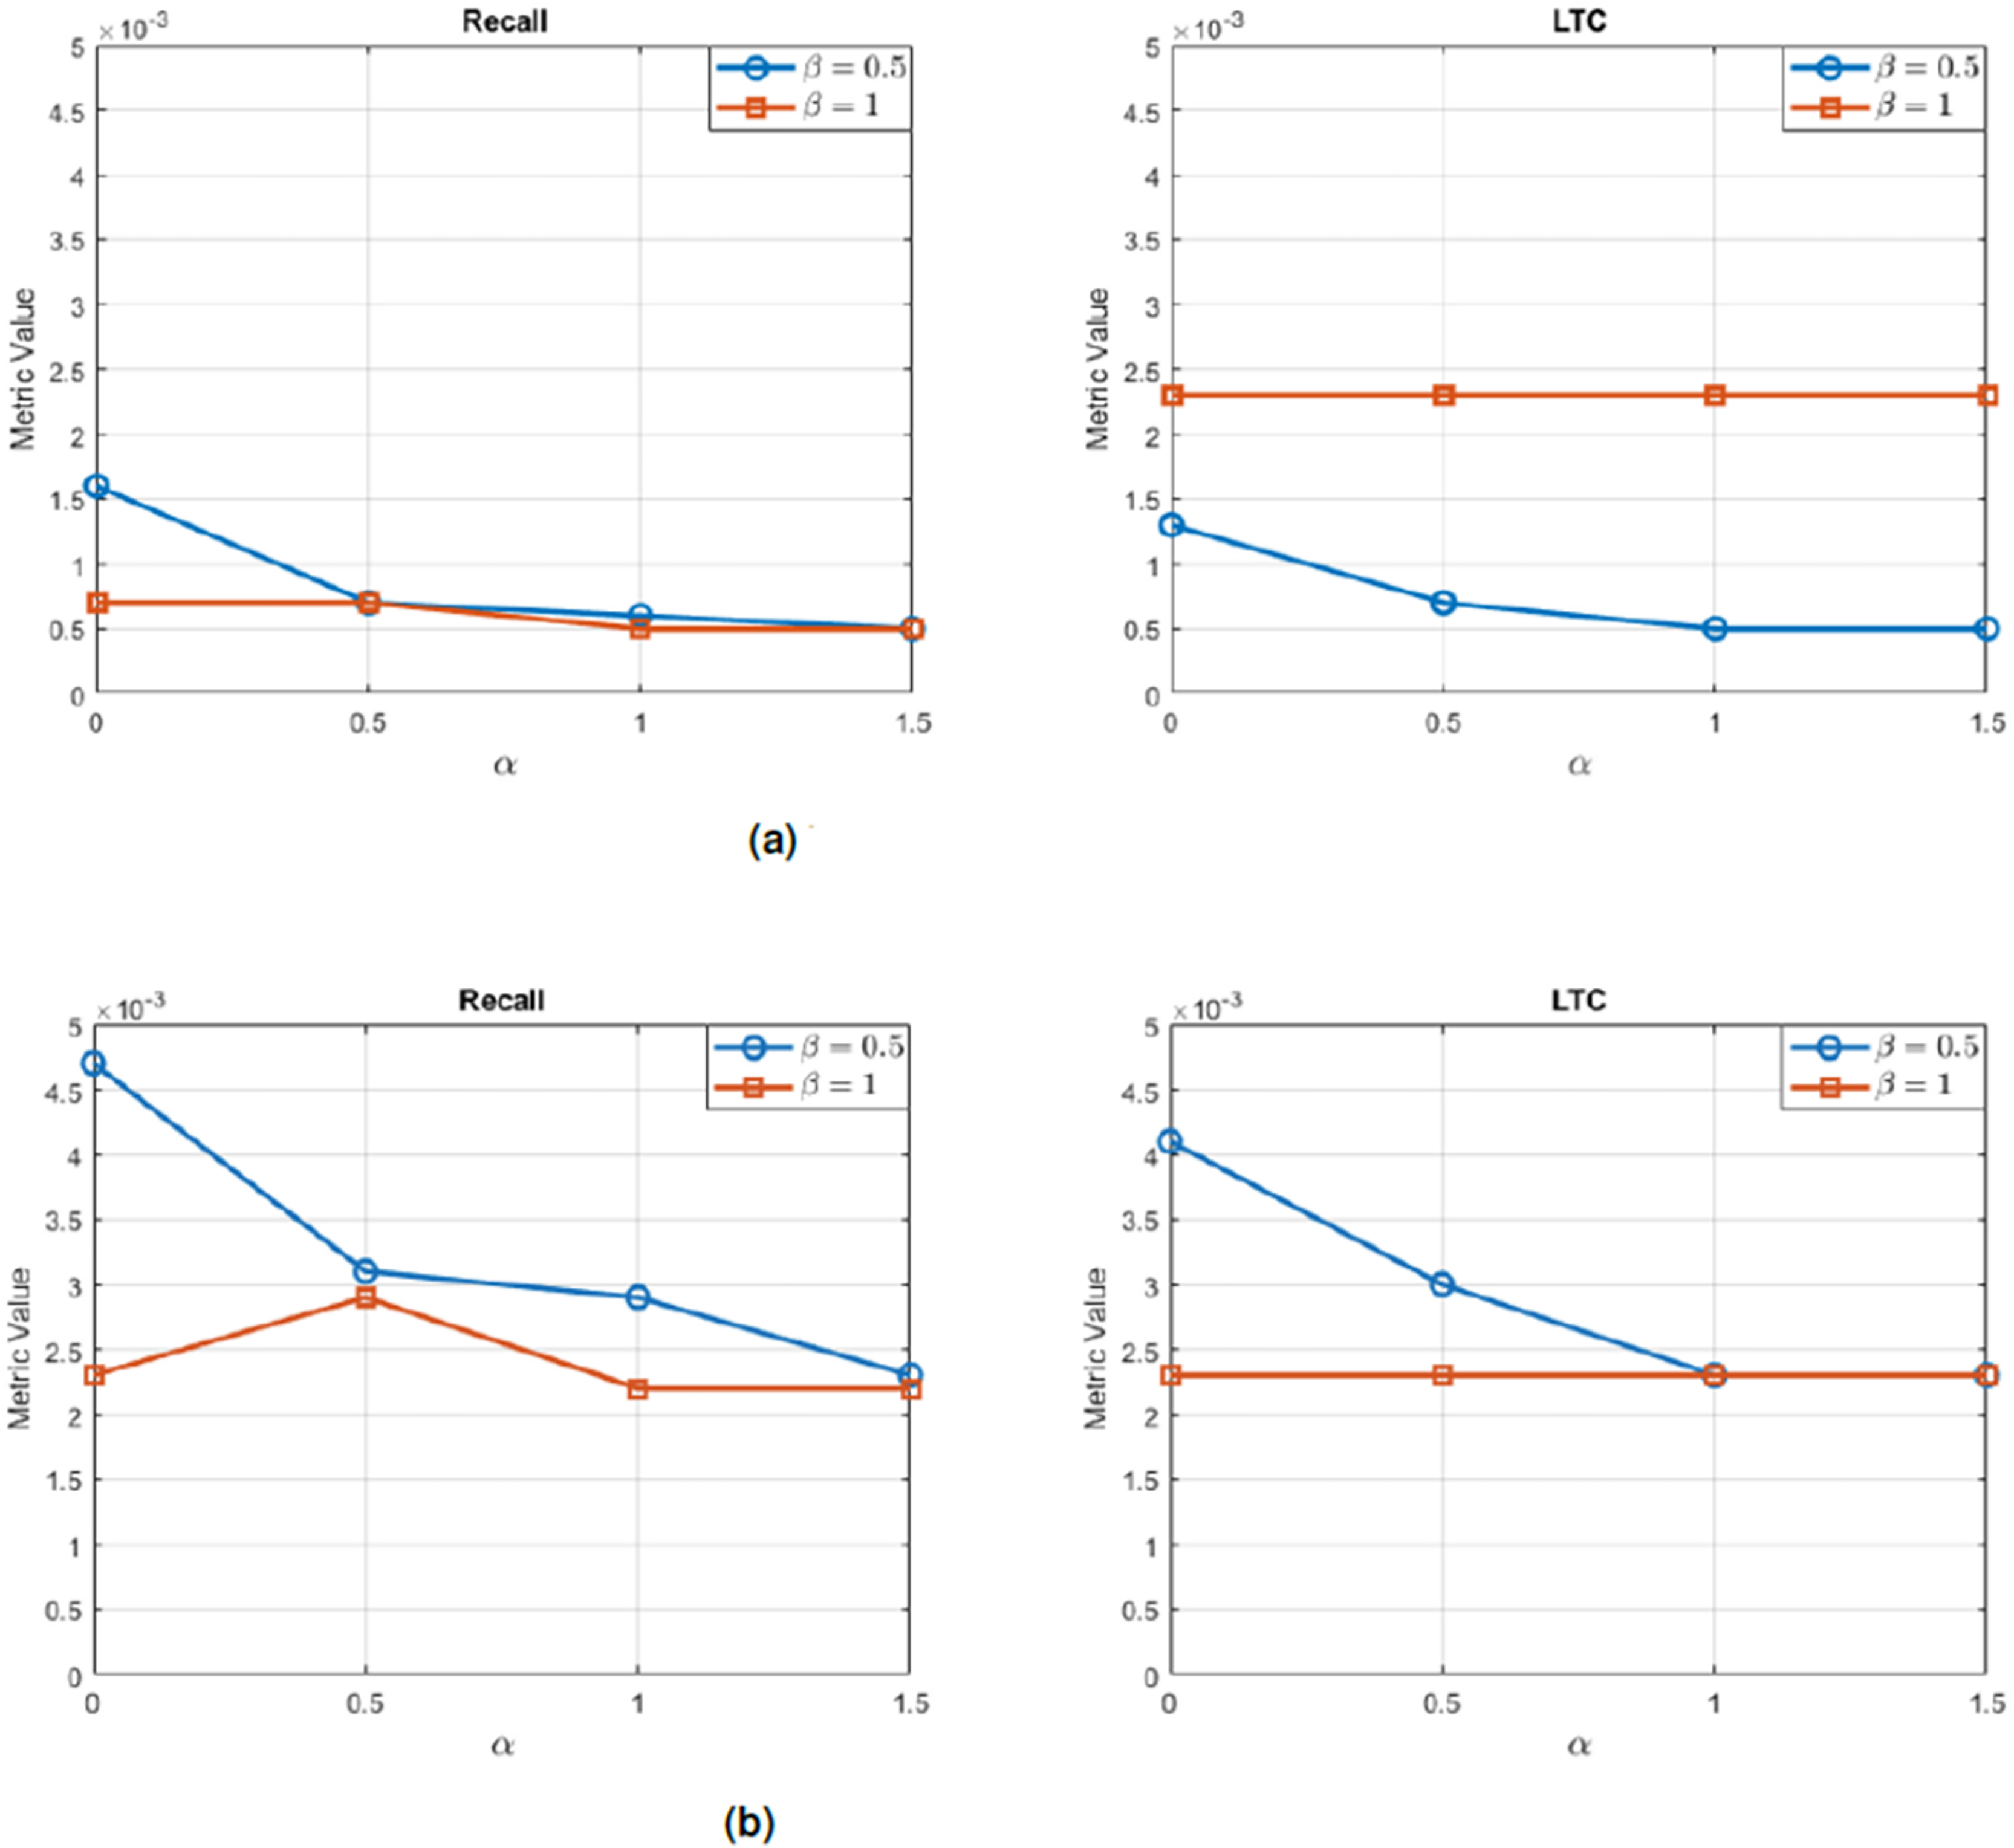
For the first algorithm, PriRelPref, the analysis indicates that variations in the parameter do not affect the Precision, F1-measure, Novelty, Gini index and APLT metrics, all of which remain stable across the tested parameter range. In contrast, changes are observed only in the Recall and LTC metrics, as illustrated in Fig. 16B. Among the evaluated metrics, only the LTC metric exhibits noticeable fluctuations, with changes reaching up to 0.11%, after which the metric stabilizes at the parameter configuration and . Additionally, although minor variations are observed in the Recall metric, these fluctuations remain limited to a maximum of 0.16% and eventually converge to a minimal variation of 0.06% at higher parameter values. Similarly, the second algorithm, RelPref, demonstrates parameter-induced variations only in the Recall and LTC metrics, as illustrated in Fig. 16A. The Recall metric shows an average fluctuation of approximately 0.01%, while the LTC metric stabilizes at the same parameter combination ( , ). When the results of both algorithms are collectively evaluated, it becomes evident that changes in the and parameters do not produce any meaningful impact on overall performance. This stability suggests that the models generate consistent outputs regardless of parameter adjustments, thereby demonstrating their robustness and reliability for real-world application scenarios.
In addition to its effectiveness in improving diversity and fairness, it is also important to evaluate the computational performance of the proposed approaches. The experimental results summarized in Table 9 indicate that both proposed methods, RelPref and PriRelPref, exhibit high computational efficiency across all datasets and evaluation perspectives. Among the algorithms, those executed on the YM20 dataset record the lowest CPU and clock times, which can be attributed to the smaller data density and the limited number of user–item interactions within this dataset. Conversely, algorithms executed on the YM10 dataset show slightly higher processing times due to its denser structure and larger user and item sets, while the TA dataset yields moderate execution times, reflecting the influence of sparsity on runtime performance.
| Dataset | CPU time (s) | Clock time (s) | ||||||||||
|---|---|---|---|---|---|---|---|---|---|---|---|---|
| RelPref | PriRelPref | RelPref | PriRelPref | |||||||||
| S1 | S2 | S3 | S1 | S2 | S3 | S1 | S2 | S3 | S1 | S2 | S3 | |
| YM20 | 0.0312 | 0.0000 | 0.0000 | 0.0469 | 0.0000 | 0.0000 | 0.000398 | 0.00046 | 0.000382 | 0.019119 | 0.000824 | 0.000824 |
| YM10 | 0.6562 | 0.3750 | 0.4531 | 0.3594 | 0.3125 | 0.1250 | 0.550113 | 0.553427 | 0.547962 | 0.548278 | 0.6562 | 0.505147 |
| TA | 0.5625 | 0.6250 | 0.6250 | 0.3438 | 0.5156 | 0.5156 | 0.575543 | 0.633332 | 0.609606 | 0.593591 | 0.566562 | 0.566562 |
Note:
S1 = overall-based, S2 = criteria-based, S3 = aggregate-based. CPU time represents active computation time, while clock time reflects total elapsed runtime including waiting and I/O operations.
This study not only evaluated processing times but also the compatibility of the methods with systems with real-time and dynamic item pools. The fundamental operating principle of RelPref and PriRelPref is based on computations that do not require global model training and make decisions solely based on local pairwise comparisons. This feature allows the method to operate without requiring retraining, particularly when a new user joins the system or a new product is added to the catalog. This allows recommendation lists to be updated instantly by performing additional computations only for relevant user-product pairs. Furthermore, the computational complexity of the methods increases linearly with the growth of user-product interactions, supporting scalability and real-time applicability even for high-volume and constantly changing item pools. In these respects, RelPref and PriRelPref are suitable, flexible, and cost-effective methods for updating online recommendation platforms.
Discussion
The empirical analyses conducted across the TA, YM20, and YM10 datasets provide a clear understanding of how the proposed RelPref and PriRelPref algorithms respond to varying levels of data sparsity, rating density, and multi-criteria structures. Across all datasets, both methods consistently achieve a more favorable balance between accuracy, diversity, and long-tail exposure compared to baseline approaches such as Mul, Paiw, and Aug. This balance is particularly meaningful in contexts where traditional models either sacrifice user satisfaction to increase diversity or disproportionately favor popular items, reinforcing popularity bias.
The results from the TA dataset, characterized by high sparsity, show that RelPref maintains accuracy even when user–item interactions are limited. Although PriRelPref performs modestly in aggregated evaluations, it demonstrates substantial improvements in criteria-based and overall-based analyses, suggesting that accounting for dominant user criteria enhances adaptability to heterogeneous rating behaviors. Conversely, methods like Mul and Aug generate highly novel recommendations but fail to align with user interests, underscoring the limitations of overly aggressive debiasing strategies.
In the denser YM20 and YM10 datasets, the benefits of the proposed methods become more pronounced. RelPref consistently yields the highest Precision scores, while PriRelPref excels in fairness and long-tail exposure, as reflected by Gini-based diversity measures. Statistical significance tests further confirm the robustness of these outcomes, with both methods exhibiting large to very large effect sizes across evaluation scenarios. The complementary strengths of RelPref and PriRelPref—one accuracy-oriented, the other diversity-focused—suggest strong potential for hybrid integration in multi-criteria recommender systems.
The superior performance of the proposed methods can be attributed to their (RelPref, PriRelPref) ability to incorporate user-specific contextual information. RelPref models the relative preference ordering of items within a user’s rating profile, capturing fine-grained behavioral signals overlooked by single-criterion or aggregated rating models. PriRelPref extends this approach by emphasizing each user’s dominant criterion, allowing it to better accommodate variations in rating priorities across users. These mechanisms collectively explain the observed improvements in accuracy–diversity trade-offs and long-tail coverage.
Overall, the findings offer meaningful implications for both theory and practice. Theoretically, the study introduces a behaviorally informed framework that integrates relative preference modeling with criterion-aware weighting, advancing existing approaches to mitigating popularity bias in multi-criteria environments. Practically, the computational efficiency and stability of RelPref and PriRelPref demonstrate the suitability of the proposed methods for real-time, large-scale systems. RelPref and PriRelPref maintain fairness while improving personalization performance, which highlights the potential applicability of the proposed framework in domains such as e-commerce, digital streaming services, and decision-support platforms. Together, these insights underscore the practical relevance and theoretical contribution of the proposed methods within the broader recommender systems literature.
Conclusion and future work
This study investigated the impact of popularity bias in multi-criteria recommender systems and evaluated different popularity tendency determination strategies together with multiple recommendation algorithms under diverse multi-criteria evaluation settings. The experimental results consistently show that modeling user preferences in a relative and criterion-aware manner leads to more balanced recommendation outcomes. The proposed methods, RelPref and PriRelPref, demonstrate strong performance by simultaneously improving personalization quality, mitigating the influence of popularity bias, and supporting diversity-oriented recommendation behavior. RelPref is particularly effective in accuracy-oriented scenarios, while PriRelPref achieves more balanced outcomes in terms of fairness and long-tail exposure by incorporating user-specific criterion priorities. These findings indicate that explicitly modeling relative preferences and criterion importance enables recommender systems to better align item strengths with users’ prioritized criteria. Overall, the results confirm that the proposed approaches provide stable and robust performance across different evaluation perspectives and data characteristics, offering an effective mechanism for controlling popularity bias while preserving recommendation quality in multi-criteria settings.
Although the experimental evaluation is conducted on movie-based datasets, the proposed methodology is inherently domain-independent and can be extended to other application areas such as books, music, or e-commerce, provided that multi-criteria ratings are available. Future research will focus on validating the generalizability of RelPref and PriRelPref across diverse user segments and domains with varying popularity distributions. Methodologically, we plan to integrate PriRelPref with neural embedding techniques—including deep contextualized representations and graph-based embeddings—to capture more complex user–item relationships. Another promising direction is the adoption of online and incremental learning strategies, enabling the models to adapt to dynamic environments where user preferences evolve continuously. The use of larger and more heterogeneous datasets will help assess the robustness of the proposed methods under diverse behavioral patterns and sparsity conditions. Additionally, enhancing the explainability and transparency of the methods remains a key priority for strengthening user trust in decision-support environments. Finally, real-world A/B testing with live user interaction will be conducted to validate the practical impact of the proposed models, offering valuable insights into their applicability in operational recommender system settings.