
DiscourseDash: designing and evaluating a tool for analysing social media discourses to support decision-making
- Published
- Accepted
- Received
- Academic Editor
- Ankit Vishnoi
- Subject Areas
- Human-Computer Interaction, Network Science and Online Social Networks, Social Computing, Visual Analytics
- Keywords
- Social media analysis, Social media discourses, Social media monitoring, Decision support tools, User-centered evaluation, Industry experts
- Copyright
- © 2026 Liew et al.
- Licence
- This is an open access article distributed under the terms of the Creative Commons Attribution License, which permits unrestricted use, distribution, reproduction and adaptation in any medium and for any purpose provided that it is properly attributed. For attribution, the original author(s), title, publication source (PeerJ Computer Science) and either DOI or URL of the article must be cited.
- Cite this article
- 2026. DiscourseDash: designing and evaluating a tool for analysing social media discourses to support decision-making. PeerJ Computer Science 12:e3632 https://doi.org/10.7717/peerj-cs.3632
Abstract
Social media discourses have become a significant source of information for decision-makers across various fields, including public health, policy, and brand management. Although analytical tools exist to support these practices, there is a limited understanding of how industry experts engage with and incorporate a discourse-level analysis perspective into their decision-making workflows. To address this gap, we developed DiscourseDash, a dashboard tool that integrates stance detection, sentiment analysis, harmfulness detection, and popularity analysis of evolving social media discourses. DiscourseDash provides a structured view of discourse-level dynamics to support users in interpreting not just what is happening, but why. DiscourseDash differentiates itself from existing tools that primarily visualise high-level statistics by emphasising transparency and collaborative decision-making. We conducted a two-phase study: (1) a mixed-method evaluation with general users to assess effectiveness in navigating social media discourses within a scenario-based decision-making compared to an unstructured method, and (2) in-depth interviews with industry experts to understand their workflows, gather perceptions of DiscourseDash, and explore alignment with real-world practices. Our findings underscore the value of qualitative understanding in social media analysis by demonstrating how discourse-level insights support interpretation and encourage strategic decision-making. In recognising the central role of human expertise, our work highlights the importance of collaborative design by facilitating human interpretation with the prototype. This article contributes practical insights through a conceptual and design-led approach to social media analysis for decision-making.
Introduction
The Global Digital Report 2024 reported that social media users in the United Kingdom comprise 82.8% of the total population (Kemp, 2024). This indicates that social media use is a necessity for most people (Subrahmanyam et al., 2008; Lupinacci, 2021; Kizgin et al., 2020). A prominent example showcasing the social media impact is through crises such as the pandemic, people increasingly turn to platforms to express their opinions, stay informed, and form connections (Bouvier & Machin, 2020; Appel et al., 2020; Saud, Mashud & Ida, 2020). Industries are evolving their decisions and strategies in response to these dynamic spaces to remain relevant (Persily, Tucker & Tucker, 2020). As Jim Coleman, CEO of We Are Social, a global socially led creative agency, highlighted the need for industries to remain responsive to evolving online behaviours by being “on top of these continuous shifts in the way that people are spending time online and adapt their approach” (Underwood, 2024). However, this shift raises a new set of challenges, e.g., the spread of misinformation (“infodemic”) (Cinelli et al., 2020), reputational harm (Jahng, 2021), and manipulation of public narratives or ideologies (Reisach, 2021). These challenges consequently impact vulnerable individuals or communities (Drouin et al., 2020), making it increasingly difficult for policymakers, fact-checkers, and government agencies to manage and navigate evolving narratives (Mahoney & Tang, 2024; Azzaakiyyah, 2023).
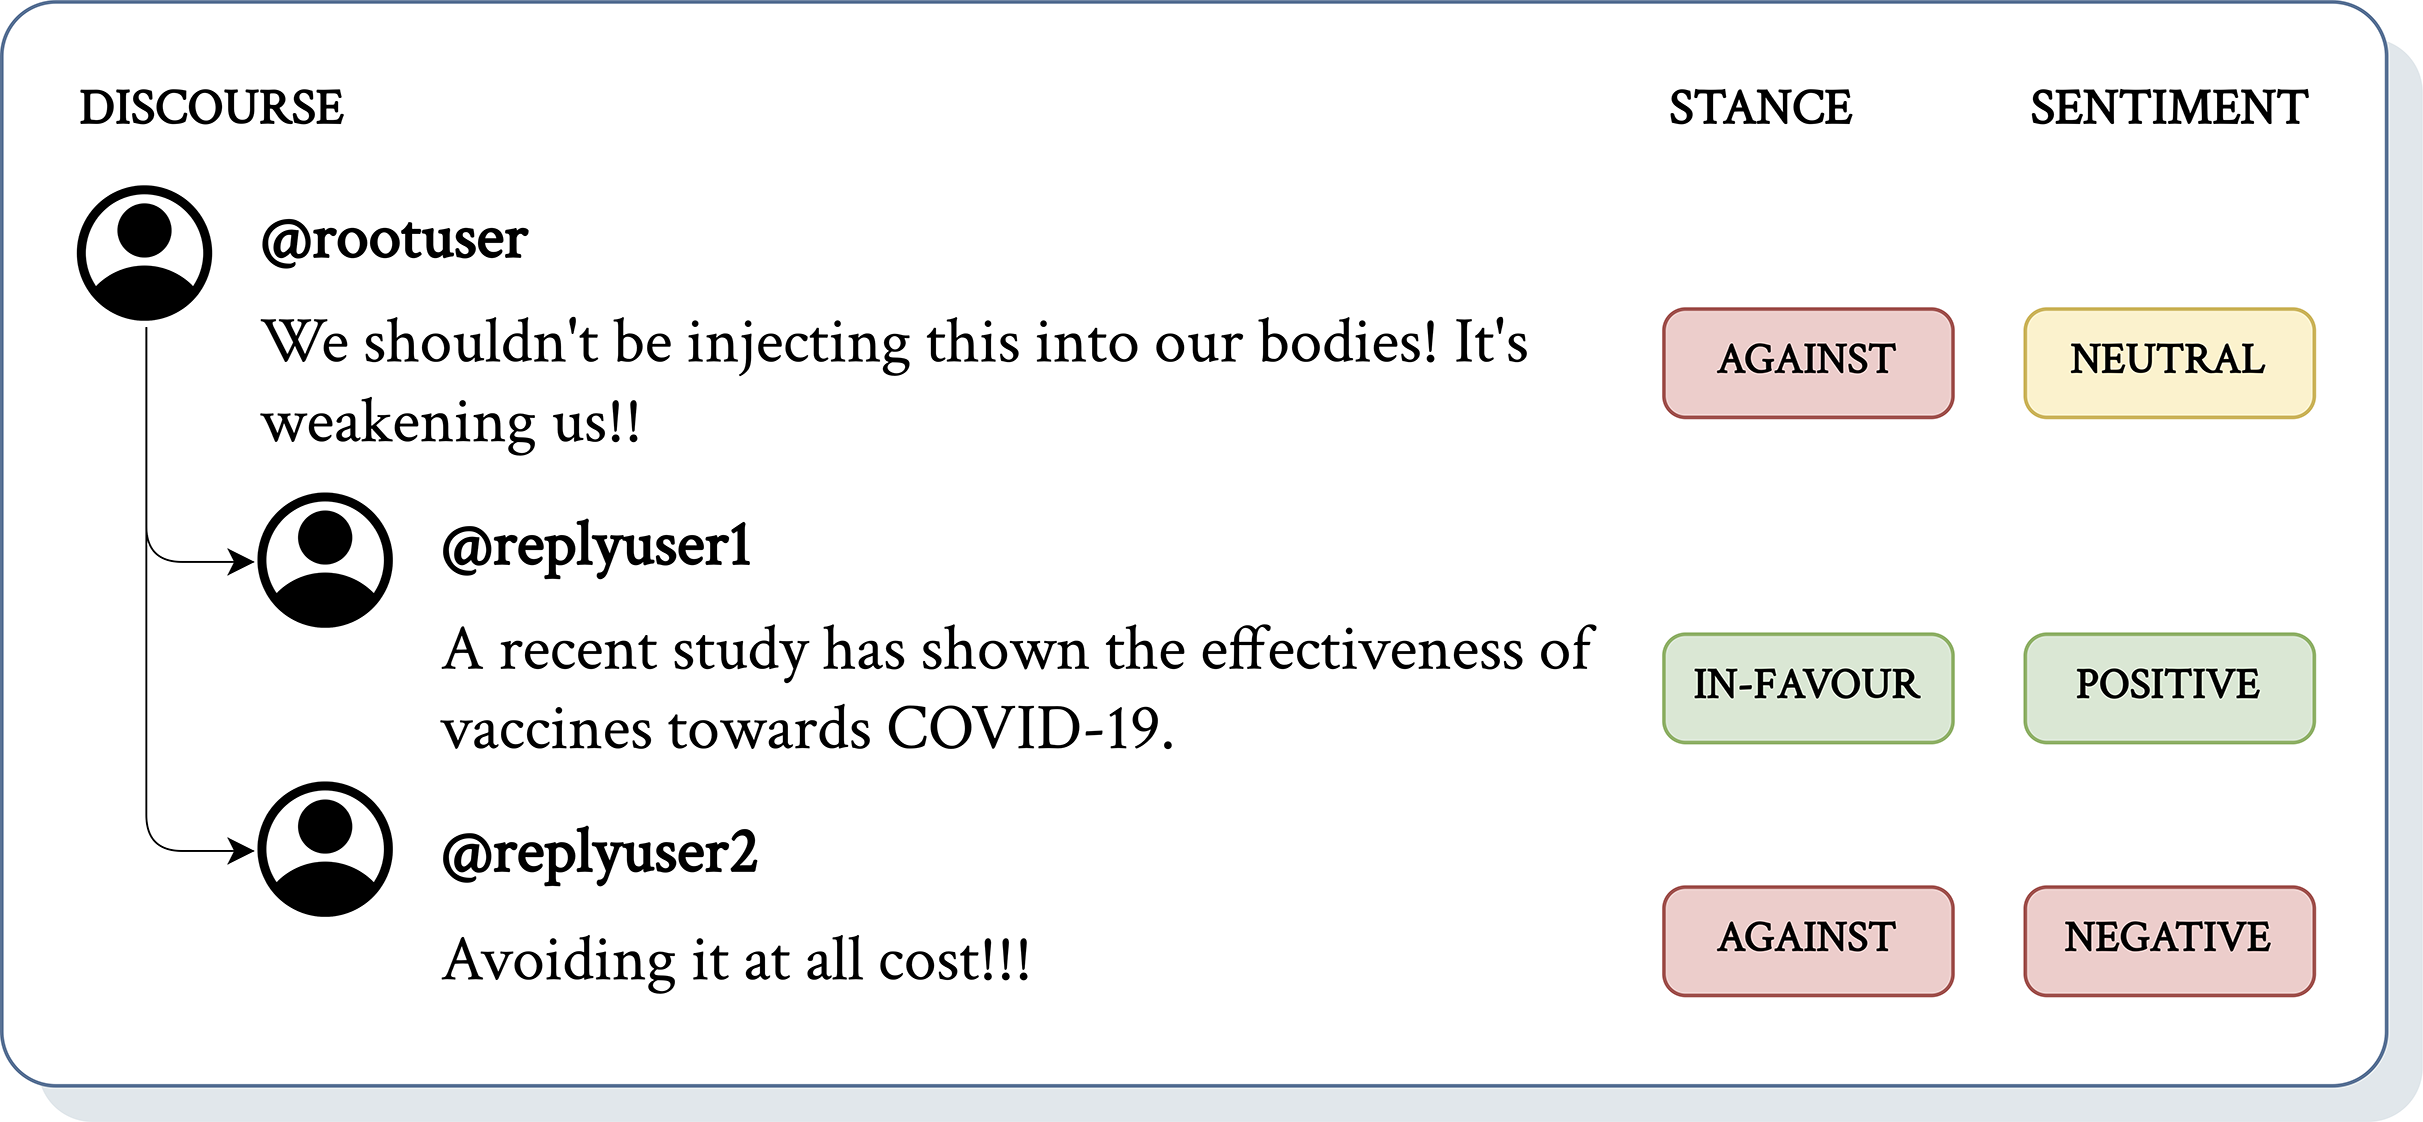
The study of misinformation is prominent in social media analysis through a substantial methodological basis for examining the application of analytical approaches within social media (Zhao et al., 2023; Aïmeur, Amri & Brassard, 2023). Early interventions have explored strategies such as content labelling (Spradling, Straub & Strong, 2021), removing misleading narratives (Sharma et al., 2019), and implementing suggestive measures (Vicario et al., 2019). With the advancement in machine learning, research efforts have shifted toward analysing stance (Hardalov et al., 2021) and sentiment (Bhutani et al., 2019; Alonso et al., 2021) to understand the scale of narratives. Findings from recent studies show that root-level comments often serve as ‘clickbait’ to attract attention (Lama et al., 2020; Bu et al., 2023). This frequently leads to computational ambiguity, as illustrated in Fig. 1, where machine learning models struggle to resolve what ‘this’ refers to without additional context, resulting in incomplete or inaccurate insights regarding what @rootuser is ‘against’. By broadening the analysis beyond the root-level context, we hypothesise that incorporating the full discourse provides a more accurate interpretation. In the same example, analysis of the full discourse reveals that ‘this’ refers to ‘vaccines’, as supported by follow-up textual interactions where @replyuser1 argues ‘for’ with reasons supporting vaccines and @replyuser2 argues ‘against’, illustrating how @rootuser influenced the spread. This highlights a problem where overlooking the context situated within evolving replies and comments limits analysis approaches.

Figure 1: An example of a (short) discourse with additional context from corresponding textual interactions (e.g., replies, comments).
Many existing analytical tools for social media focus on translating insights into summarised visualisations. While effective at highlighting large-scale trends, they are limited in capturing the complexity of social media discourse or supporting users in interpreting the meaning behind these measures. Without qualitative support, analyses struggle to investigate complex phenomena such as misinformation, polarisation, or controversy, as evolving discourse interactions can either contribute to debunking misinformation or exacerbate its dissemination (Alsaif & Aldossari, 2023). Discourse-level context introduces the perspective of narrative dynamics (De Fina & Georgakopoulou, 2011), identifies influential discourses driving dissemination (Shu et al., 2017), enhances contextual understanding in machine learning (Yu et al., 2020; Zubiaga et al., 2018; Poddar et al., 2018; Li et al., 2023a, 2023b), and tracks emerging trends or agenda shifts (Egelhofer & Lecheler, 2019). Yet, it remains unclear whether existing tools leverage surrounding discourses as contextual information in machine-driven or human analyses. Besides, there is a gap in creating tools that align with real-world workflows, as many are designed around technical affordances rather than the practical needs. This research addresses gaps in existing analytical tools by adopting a discourse-level design perspective that reduces computational ambiguity and the labour-intensive demands of qualitative analysis. We developed DiscourseDash, a visual analytics dashboard to support understanding social media analysis for decision-making (see Page 10). By connecting analysis with discourse-level insights, this research supports human users in interpreting these machine outputs. The long-term goal is to manage impactful information before it spreads widely by providing a better understanding of complex social media issues.
We conducted a two-phase evaluation of DiscourseDash. In the first phase, general users (non-experts) completed scenario-based decision-making tasks using DiscourseDash and a baseline platform, Reddit. This evaluation aims to investigate the efficiency and relevance of our design when compared to unstructured discourse. Building on these results, the second phase involved in-depth interviews with industry experts to explore how they use social media discourses, what informs their decisions, workflow limitations, and their perceptions of DiscourseDash. This article investigated how DiscourseDash can support human interpretation of social media discourses in real-world decision-making. To achieve this, we formulate the following Research Questions (RQs):
-
RQ1
How do both general users and industry experts perceive and interact with a dashboard tool that offers a detailed analysis with discourse-level context to make informed decisions?
-
RQ2
To what extent do the proposed features in DiscourseDash, such as stance detection, sentiment analysis, harmfulness labels, popularity insights, influence or support decision-making workflows?
-
RQ3
How do industry experts currently analyse social media discourses, and how well does DiscourseDash align with these real-world practices?
-
RQ4
What key design implications can we gather to guide future iterations of DiscourseDash to enhance support for diverse real-world decision-making scenarios?
In this article, our main contributions are as follows:
-
1.
Design of a dashboard tool: Informed by social media analysis literature, we developed and evaluated a conceptual dashboard that integrates stance detection, sentiment analysis, harmfulness detection, and popularity analysis as key analytical features (see 5). DiscourseDash supports informed decision-making by linking analytical outputs directly to the underlying discourses. This design allows users to trace the reasoning behind machine-summarised results. This connection encourages users to explore discourses with insight to support their organisational goals. Our approach emphasises that social media analysis should not rely solely on machine-summarised outputs; instead, human users should have access to interpretive analysis to reason about these measures in the context of the emerging narratives they represent.
-
2.
Proof of concept: We conducted a two-phase user study to evaluate DiscourseDash. In the first phase, general users interacted with the prototype to assess its usefulness, identify design strengths and weaknesses, and provide feedback for user-centred refinement. Our findings showed that DiscourseDash effectively supports users in exploring social media discourses and making informed judgments. In the second phase, we interviewed industry experts to examine how the DiscourseDash could fit into real-world decision-making workflows. This extended the initial evaluation and offered insights into practical adoption and long-term relevance.
-
3.
Transferable results: Given the limited research on dashboard design to analyse online discourses, little is known about how industry experts interpret and incorporate discourse insights into their existing workflows. This lack of understanding may result in designs that overlook critical needs or lead to solutions that are not applicable in real-world contexts. Our expert study addresses this by uncovering how industry experts make sense of social media discourses and what they require from computational tools to support this process. By combining insights from both general users and domain experts, our research provides an understanding of user interaction with an analytical tool and its applicability in professional contexts. Our findings demonstrate the effectiveness of our design, highlight design implications, and identify opportunities for future development. Importantly, this research emphasises the critical role of human-centred collaborative design that augments human interpretation rather than attempting to automate it in producing transferable insights for similar tools across domains.
Related work
This section reviews previous work that informs the design and evaluation methods of DiscourseDash by examining computational linguistic approaches to social media analysis, followed by an exploration of interactive systems developed for social media analysis. Finally, we review relevant Human-Computer Interaction (HCI) methodologies for designing tools that are focused on user needs and practices.
Computational linguistic measures for social media analysis
Natural Language Processing (NLP) techniques are widely used to identify linguistic patterns and extract important signals from textual data (Hirschberg & Manning, 2015). Drawing on their established use in previous work, our dashboard incorporates the following NLP measures: stance detection, sentiment analysis, harmfulness detection, and popularity analysis (summarised in Table 1).
| Computational measures | Definition |
|---|---|
| Stance detection | Categorising the opinion expressed in a piece of text towards a target premise, e.g., in favour, neutral, or against. |
| Sentiment analysis | Categorising the emotional tone of a piece of text, e.g., positive, negative, or neutral. |
| Harmfulness detection | Measuring the level of harm in a piece of text by measuring toxicity, hate, or other harm-related aspects. |
| Popularity analysis | Measuring the temporal view of the trend or virality of content. |
Stance detection: This is a domain-specific task to categorise viewpoints from in-favour, neutral to against (Mohammad et al., 2016; Hardalov et al., 2021). This computational approach is a target-specific task that reflects how a social media user positions themselves with respect to an entity, claim, or issue (Lillie & Middelboe, 2019). Recent advances in Large Language Models (LLMs) represent the improved approach of stance detection (Zhang et al., 2022). Multi-agent LLM systems have been proposed to address multi-aspect stance reasoning targeting scalability challenges in traditional approaches (Yan, Joey & Ivor, 2024; Lan et al., 2024). The use of synthetic data generated by LLMs was proposed to overcome data scarcity and imbalance. Studies proposed that augmenting stance detection datasets with LLM-generated examples improves robustness and reduces bias in domains like political discourse (Wagner et al., 2024b, 2024a). Applications of stance detection span misinformation detection (De Magistris et al., 2022), rumour verification (Pamungkas, Basile & Patti, 2019; Alsaif & Aldossari, 2023), credibility analysis (Karande et al., 2021), and uptake of misleading narratives (Weinzierl, Hopfer & Harabagiu, 2021). These applications highlight the broader significance of stance detection as an indicator for understanding public perceptions for informing decision-making around societal issues.
Sentiment analysis: Sentiment analysis refers to the computational study of affective states expressed in text by categorising emotional tone into positive, negative, or neutral classes (Liu, 2020). This differs from stance detection, which captures an author’s position towards a target; sentiment analysis reflects the emotional valence of the text. This distinction is important in analysing social media discourses because comments may convey strong emotions without explicitly revealing a position on a given issue. Recent approaches were proposed using transformer-based architectures and LLMs (Krugmann & Hartmann, 2024). The Generative Pre-trained Transformer (GPT) model was adopted to understand the surrounding context to improve the detection of sarcasm in sentiment analysis (Kheiri & Karimi, 2023). Studies have also highlighted the use of LLMs for cross-lingual sentiment analysis across different online communities in low-resource settings, such as minority languages (Chen, Shang & Wang, 2025; Miah et al., 2024). Sentiment analysis is used to track social media issues such as the spread of misinformation, which is frequently correlated to emotionally charged information (Alonso et al., 2021; Preston et al., 2021). Negative emotions like fear and anger have also been shown to increase the circulation of social media information regardless of its factual accuracy (Wang et al., 2019; Weeks, 2015). Sentiment can also serve as a proxy for reputation management for organisations to detect negative public reactions and implement corrective strategies in brand communication (Guo, Fan & Zhang, 2020). Monitoring sentiment in real time can support timely interventions in health, disaster, and humanitarian contexts within crisis informatics research (Reuter, Hughes & Kaufhold, 2018).
Harmfulness detection: Harmfulness, such as toxicity (Sheth, Shalin & Kursuncu, 2022) and hate speech (Cinelli et al., 2021), has increased in conjunction with research on false social media information (Alam et al., 2021). This occurs because malicious actors frequently use inflammatory language to amplify the reach and impact of misleading information (Sharevski, Jachim & Florek, 2020). Hence, research has linked harmfulness to the perpetuation of misinformation, showing how toxic language (Salminen et al., 2020; Pascual-Ferrá et al., 2021) and hate speech (Sharma et al., 2020; Evolvi, 2018) can direct attention to engagement. A recent study with fact-checkers found that harm assessment helped prioritise interventions (Sehat et al., 2024). The effectiveness of LLMs similarly extends to detecting hate speech (Albladi et al., 2025). Some benchmark work was conducted using GPT-3.5 and GPT-4 on Twitter datasets covering hate speech, offensiveness, and emotions (Bauer, Preisig & Volk, 2024). A structured evaluation framework and a toxicity metric were proposed by outlining the challenges of bias, reliability, and consistency when deploying LLMs for harmfulness detection at scale (Koh et al., 2024). A promising and emerging direction of research has used LLMs to uncover coded or evolving forms of harmful speech, such as novel antisemitic terms circulating in extremist communities (Kikkisetti et al., 2024). Recent surveys underline that although these models generalise across multiple forms of abuse (hate, harassment, toxicity), persistent issues remain around data imbalance, evolving vocabularies, and false positives (Diaz-Garcia & Carvalho, 2025).
Popularity analysis: Popularity, commonly discussed interchangeably with the term virality, denotes the degree of engagement a piece of content achieves on social media platforms (Güner, Cebeci & Aydemir, 2025; Ngai, Singh & Yao, 2022; Solovev & Pröllochs, 2022). This measures the engagement on social media to track the spread of information and develop intervention strategies (Shao et al., 2016; Bessi et al., 2015), emphasising the need for early intervention to manage social media content (Kim, 2018; Shu, Bernard & Liu, 2019). For example, monitoring the popularity of content helps gauge public opinion on topics such as vaccines to assess the influence on public health (Xu & Guo, 2018). Approaches like Latent Dirichlet Allocation (LDA) (Blei, Ng & Jordan, 2003) and newer topic modelling methods (Dieng, Ruiz & Blei, 2020; Srivastava & Sutton, 2017) are commonly used to group underlying themes in large-scale textual data. This will allow the identification of dominant concerns and recurring discussion threads within social media discourses (Chakkarwar & Tamane, 2020). More recently, a multi-layer temporal Graph Neural Network (GNN) framework for popularity prediction in social media (Jin, Liu & Murata, 2024). Their work primarily focused on understanding how information spreads across social media networks over time. A Popularity-Aligned Language Model (PopALM) was proposed to improve predictions of social media responses by aligning language representations with popularity trends (Yu, Li & Xu, 2024). Meanwhile, Twitter’s (currently known as X) “Viral Tweet” feature was examined, and it was pointed out that the ratio of retweets to followers offers a more reliable indicator of virality than absolute retweet counts (Elmas, Stephane & Houssiaux, 2023).
Discourse-level analysis: The following section reviews studies that specifically examine learning from context at the discourse level. This shifts the focus from analysing isolated posts (e.g., root-level comments) to learning contextual information from the discursive structure of discourses. This research work defines social media discourse as textual interactions on platforms, such as discussions, threads, and conversations. Our approach should not be confused with the social science ‘Discourse Analysis’ method, which generally refers to examining the social and linguistic aspects of language use.
This perspective is motivated by prior research examining discourse across various conversational contexts and linguistic patterns to improve model learning. Besides, many studies have highlighted the effectiveness of analysing interactions within discourse to improve the identification and management of online narratives and their impact on public opinion (Haupt, Li & Mackey, 2021; Silva et al., 2020; Kalantari, Liao & Motti, 2021). For example, recent stance detection for misinformation has integrated local and global context-based attention mechanisms. The Coupled Hierarchical Transformer model has been used to gain a deeper contextual understanding in discourses (Yu et al., 2020). Similarly, Long Short-Term Memory (LSTM) networks combined with attention mechanisms have improved conversation representation by modelling conversation branches (Zubiaga et al., 2018; Poddar et al., 2018). Further developments refined these approaches using Branch-Bidirectional Encoder Representations from Transformers (BERT) models, which more effectively capture discourse-level context (Li et al., 2023a). Subsequent accuracy improvements have also incorporated target-specific contexts (Li et al., 2023b).
More recent approaches continue to emphasise discourse-level contexts for model learning. A Global–Local Attention Network (GLAN) was proposed on a multi-turn conversational stance detection dataset (Niu et al., 2024). Their work demonstrated how both short-range and long-range dependencies across conversational threads influence stance prediction. Similarly, the Transformer-based Architecture for Stance Detection with Embeddings (TASTE) was proposed to integrate structural embedding of conversations with transformer-based text encoders to jointly capture content and discourse structure (Barel, Tsur & Vilenchik, 2024). Stance Reasoner was proposed to combine pre-trained models with explicit reasoning steps and background knowledge to improve zero-shot stance detection (Taranukhin, Shwartz & Milios, 2024). MultiClimate was proposed to integrate textual transcripts (similar to a format of social media discourse) from climate change videos with visual content to model multimodal context for stance detection (Wang et al., 2024). All of the mentioned literature demonstrated the relevance of discourse-level insights but failed to adapt them into an interaction tool.
Interactive systems for social media analysis
Visual analytics are commonly used to translate computational linguistic measures into actionable insights for human users (Endert et al., 2017; Salamkar, 2024; La Rosa et al., 2023). Furthermore, empirical studies show that presenting data in interpretable formats within visual analytics systems can reduce cognitive load and help users focus on key aspects of decision-making (Abdul et al., 2020).
Many existing interactive systems have been developed to support navigation on social media analysis through interactive visualisations. exRumourLens provides a social media analysis of rumours by summarising their spread and assessing their credibility (Phan et al., 2022). Although their work provided targeted support for rumour detection, its scope remains limited, as it does not support broader analysis of discourses or user-driven exploration beyond credibility evaluation. When X was previously known as Twitter, TweetCred offered real-time credibility analysis for Twitter content, supporting rapid user judgments (Gupta et al., 2014). However, their reliance on automated credibility scores may oversimplify social media content and overlook the evolving contexts that affect the trustworthiness of these scores. Besides, CrowdTangle was widely used by journalists and researchers to monitor public social media content and track trends (Garmur et al., 2019). However, its discontinuation by Meta underscores the uncertainty of relying on proprietary tools for research and public accountability. Before that, the system offered little transparency regarding how content was selected and ranked. This could constrain reproducibility and raise concerns about possible algorithmic bias.
MisVis is a web-based platform that analyses the prevalence of misinformation on websites by indicating reliability and visualising connections to other sources (Lee et al., 2022). Although valuable in highlighting misinformation trends, they primarily focus on static website content rather than the dynamics of social media. The focus on misinformation is narrow and may not generalise to other issues in the social media landscape. PeakMetrics offers a social media management dashboard for commercial purposes. This dashboard was designed to identify and counteract harmful narratives using indicators such as emerging narrative threats, threat scores, and sentiment analysis. However, the system lacks open-source documentation and transparency regarding its internal processes, making it difficult to assess its analytical robustness or biases. Finally, these existing interactive systems have demonstrated how computational insights can be useful in decision support tools. At the same time, they reveal important limitations around transparency and adaptability.
Multi-phase evaluations in HCI
In HCI, user studies are fundamental to developing and refining proof-of-concept systems by incorporating human factors throughout the design process (Hartson, 2012). Common approaches involve developing prototypes and conducting phased evaluations (Vermeeren et al., 2010). A fundamental distinction in HCI research is between expert users with specialised domain knowledge and general end-users with influence of broader general concerns (Sharp, Rogers & Preece, 2007). A common approach is mixed-method evaluation, which combines qualitative and quantitative techniques to capture complex user interactions, effectively validate conceptual designs, and gather interactive insights from general users (Creswell, 1999; Östlund et al., 2011; Edmonds & Kennedy, 2016). This is because while qualitative methods capture user behaviours and experiences, revealing why certain interactions occur or fail (Seaman, 1999). Meanwhile, quantitative methods provide measurable and statistically valid data that help generalise the findings to larger user groups (Nardi, 2018). This mixed approach ensures reliability and credibility for validating findings from multiple perspectives (Golafshani, 2003; Rolfe, 2006).
Incorporating real-world considerations is crucial when designing analytical tools for practical deployment. Prior studies have shown the benefits of involving expert participants (Atreja et al., 2023), healthcare experts (Patel, Kaufman & Kannampallil, 2021), and medical specialists (Lindgren, Winnberg & Winnberg, 2011) in shaping HCI efforts within specific domains. These investigations demonstrate the value of expert insight in developing systems that support domain-specific reasoning from expert users who have knowledge-based experiences. Such knowledge is fundamental for designing tools that facilitate complex analytical workflows and strategic decision-making in real-world environments. To bridge these two perspectives, it is common to synthesise user studies in HCI research in multi-phase evaluations to cover all-rounded aspects (Zimmerman, Stolterman & Forlizzi, 2010). Despite growing efforts to validate interactive systems with both general and expert users, relatively few studies have examined how tools designed for analysing social media discourses can balance human interpretation with alignment to professional decision-making workflows.
From literature gap to design goals
While prior research has demonstrated the strength of computer linguistics and analytical tools, there is still room for improvement to support the interpretive process for decision-making. Most existing studies do not adequately address the evolving and complex nature of online discourses. Plus, interactive systems mostly prioritise visualising quantitative outputs over qualitative insights. This presents limitations in tasks that require users to uncover deeper contextual interpretation, such as identifying the causes of specific issues on social media. Unlike many existing systems, our approach considers both the analytical depth and the interpretive needs of users to support their navigation in the social media space.
Transparency in design helps build user trust, but many Artificial Intelligence (AI)-driven tools lack proper documentation of their design processes (Deekshith, 2020). Previous work highlighted the importance of making model outputs interpretable and actionable to improve adoption (Rong et al., 2023). In response to these concerns, we employ a design approach that encourages human interpretation by incorporating a discourse-level perspective in social media analysis. A two-phase evaluation study that integrates insights from general users with validation from domain experts contributes an open-source design for a collaborative human–machine system that augments and facilitates human interpretation instead of seeking to automate it. Table 2 summarises how DiscourseDash addresses these limitations of prior systems.
| Limitations | DiscourseDash design |
|---|---|
| Lack of context around how automated analysis derives its outputs | Visualise the information (context from discourses) that informed the model’s output by displaying the same information for human users to inspect when using automated analyses. |
| Oversimplifies social media dynamics due to limited analytical depth to capture complexity | Allow users to explore discourses in depth and develop their own judgement on the reliability of the automated analyses. |
| Prioritise computational affordability and encourage dependence on automated analyses | Prioritise interpretative flexibility by encouraging humans to question, refine and reinterpret automated analyses instead of treating them as definitive outputs. |
Design process
This section outlines our design process for DiscourseDash. We begin with a technical definition of ‘discourse’. Next, we present the initial design concept. Finally, we describe how these insights were translated into a functional prototype for the next multi-phase evaluation studies.
Understanding discourse in social media
In our research, we technically define “discourse” for our tool development as consisting of two main components: root-level comments ( ), such as those initiated as a post or thread on social media, and child-level comments ( , where ), which are hierarchically structured replies to the root-level comments, also referred to as “replies.” A complete discourse (D), can be represented as: , where . This implies that a complete discourse must include both root-level comments ( ) and one or more child-level comments ( ). If a root-level comment ( ) does not have corresponding child-level comments ( ), we do not consider it as a discourse. These child-level comments ( ) represent a form of engagement on social media, contributing to the evolution of narratives and influence (Neubaum & Krämer, 2017; Epstein et al., 2021). For example, a root-level comment ( ) that does not generate engagement and therefore lacks a discourse ( where ), reflects a low impact on public narratives.
This focus enables us to capture discussions where ideas, opinions, and narratives evolve through replies and interactions over time. Prior research shows that these discursive structures of replies reflect relevant social engagement, shifts in stance, and influence dynamics, which are crucial factors for understanding phenomena such as misinformation and formulations of public opinions (Benamara, Inkpen & Taboada, 2018). For instance, a Reddit post without replies generally has limited impact, while one with multiple layers of interaction indicates a richer and more influential discourse (Choi et al., 2015). By defining discourse in this way, our tool aims to capture and visualise the complexity of online discourses to support informed decision-making.
Conceptualising the design approach
The design of our dashboard was guided by the objective of providing structured and actionable insights into online discourses. Drawing on our literature review (see Page 3), we identified four analytical features-stance detection, sentiment analysis, harmfulness detection, and popularity analysis-that facilitate navigating complex social media environments. These dimensions were selected to support decision-making processes in areas such as public health, communication, and policy response, where understanding the nature and dynamics of online discourses is important. By presenting discourses in detail, DiscourseDash enables users to investigate how the broader narrative landscape contributes to the analytical depths. The overall design is organised into two tabs: an overview of visuals for initial identification and prioritisation, and a detailed view for in-depth investigation and contextual understanding.
Providing a visual overview
The overview provides users with a high-level summary of trending discourse topics and their implications. It includes the following components:
Trending Topics: We use clustering techniques to identify the most actively discussed topics within a selected time window. This surface-level aggregation enables users to quickly understand which issues are dominating public discourse and assess their alignment or conflict with organisational goals.
Harmfulness: Each topic from the Trending Topics is assessed for its potential level of harm, based on the proportion of posts containing toxic, hateful, or otherwise harmful language. This classification helps users allocate priorities by identifying those that may require immediate attention or intervention.
Stance: We display the distribution of stances (favour, neutral, against) within each topic. We hypothesise that understanding the stance distribution on topics previously categorised as harmful can help gauge the urgency of a topic. For example, if a highly harmful topic receives predominantly favourable stances, it can inform the prioritisation of further investigation.
Sentiment: Sentiment (positive, neutral, negative) provides an additional emotional context to each topic. This helps users understand public emotions and make informed decisions about countermeasures.
Popularity: Engagement metrics over time reveal the relevance and impact of topics. Visual graphs showing the popularity of each topic help users understand the dynamics of discourses and identify emerging trends or sudden spikes that may indicate concerning impacts.
Further detailing the analyses
Building on the overview, users can select specific topics to investigate in detail, exploring analyses accompanied by discourse through the following features:
Summary An in-depth view of the selected topic, including visual graphs of stances and sentiments. This provides clarity and supports users in unfolding the progression and influence of different viewpoints within the discourse.
Discourses We present all the discourses on a selected social media platform that reflect the topic under investigation. The goal is to support effective countermeasures by providing a detailed view of the stances and sentiments labelled within each text in the discourse. It also facilitates the extraction of specific contexts and dynamics revealed through the analysis. Presenting these discourses in detail, accompanied by visuals and interactive elements, is a key design goal aimed at enhancing transparency and explainability.
Prototyping DiscourseDash
Our interactive dashboard was developed using the Dash Open Source Framework, created by Plotly, chosen for its robust integration with Python libraries and its flexible integration with machine learning frameworks in future iterations. This framework allowed us to customise functionalities to meet our research requirements. For example, we implemented a custom collapsible table using React boilerplate JavaScript UI libraries to represent the hierarchical structure of discourses. The full code is available at GitHub. In Algorithm 1, we briefly illustrate how the system constructs hierarchical conversation trees from root posts and replies. Each post and reply is annotated with stance, sentiment, and other metadata for the hierarchical visualisation in the prototype.
| Input: root_posts, comments |
| Output: rows of hierarchical discourse |
| Function create_rows (root_posts, comments): |
| rows = []; |
| foreach root_post in root_posts do |
| row = {id, text, date, stance, sentiment, num_replies}; |
| row.replies = generate_rows(root_post.id); |
| rows.append(row); |
| end |
| return rows; |
| Function generate_rows(parent_id): |
| subrows = []; |
| foreach reply where reply.Parent == parent_id do |
| subrow = {id, text, date, stance, sentiment, num_replies}; |
| if reply has replies then |
| subrow.replies = generate_rows(reply.id); |
| end |
| subrows.append(subrow); |
| end |
| return subrows; |
To ensure that the prototype closely reflects a realistic scenario, we used a dataset of open-access Reddit discourse on COVID-19 vaccination for the evaluation studies (Brambilla & Kharmale, 2022). As of its retrieval in October 2023, this dataset consisted of 1,726 Reddit posts and 11,189 corresponding replies, posted between April 2020 and May 2021. Each entry was labelled with a stance (favour, none, against) towards the topics of “General about vaccine”, “Second Dose”, “Vaccine side effects”, “General after vaccination”, “Thankful.” Additionally, they provided labels of sentiments (positive, neutral, negative). We included all entries containing one or more replies to ensure every data point represents a discourse structure. The labels for stance and sentiment were directly taken from the dataset.
Since they did not include labels for harmfulness, we manually and randomly assigned harmfulness values in the prototype. This means that harmfulness labels were distributed without any specific pattern or criteria, solely to demonstrate the feature within DiscourseDash. We determined that this approach was suitable given that the focus of the user study was to evaluate the conceptual design rather than the accuracy of the labels. Each row in the dataset includes timestamps and the total number of child-level comments for each row belonging to a root-level comment. These columns are used to illustrate the popularity of topics in the prototype. Overall, the dataset was sufficient to support the prototyping for DiscourseDash’s evaluation.
System overview
Figure 2 illustrates the client-server architecture of the developed web application prototype following a Model-View-Controller (MVC) architecture. For accessibility and ease of deployment, DiscourseDash was hosted on Heroku, a cloud-based platform-as-a-service (PaaS). This facilitated a web-based access to the prototype for convenience throughout the user evaluation.
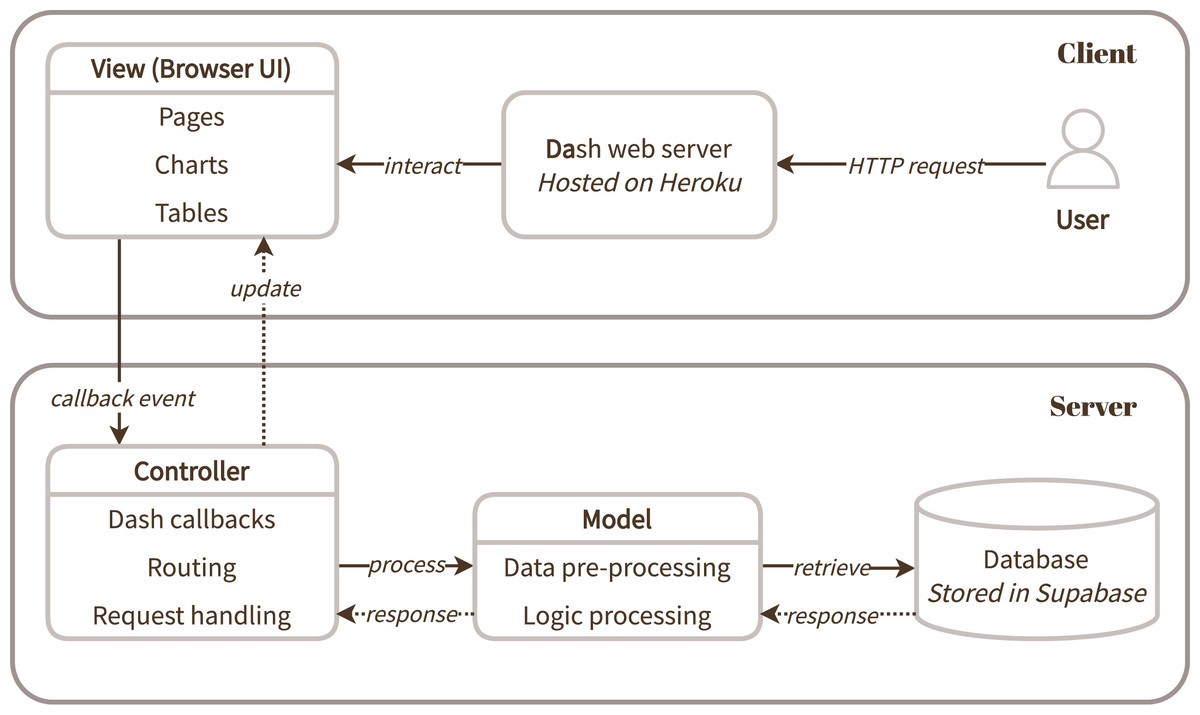
Figure 2: A system overview of DiscourseDash presented based on a model-view-controller (MVC) architecture.
The dashboard
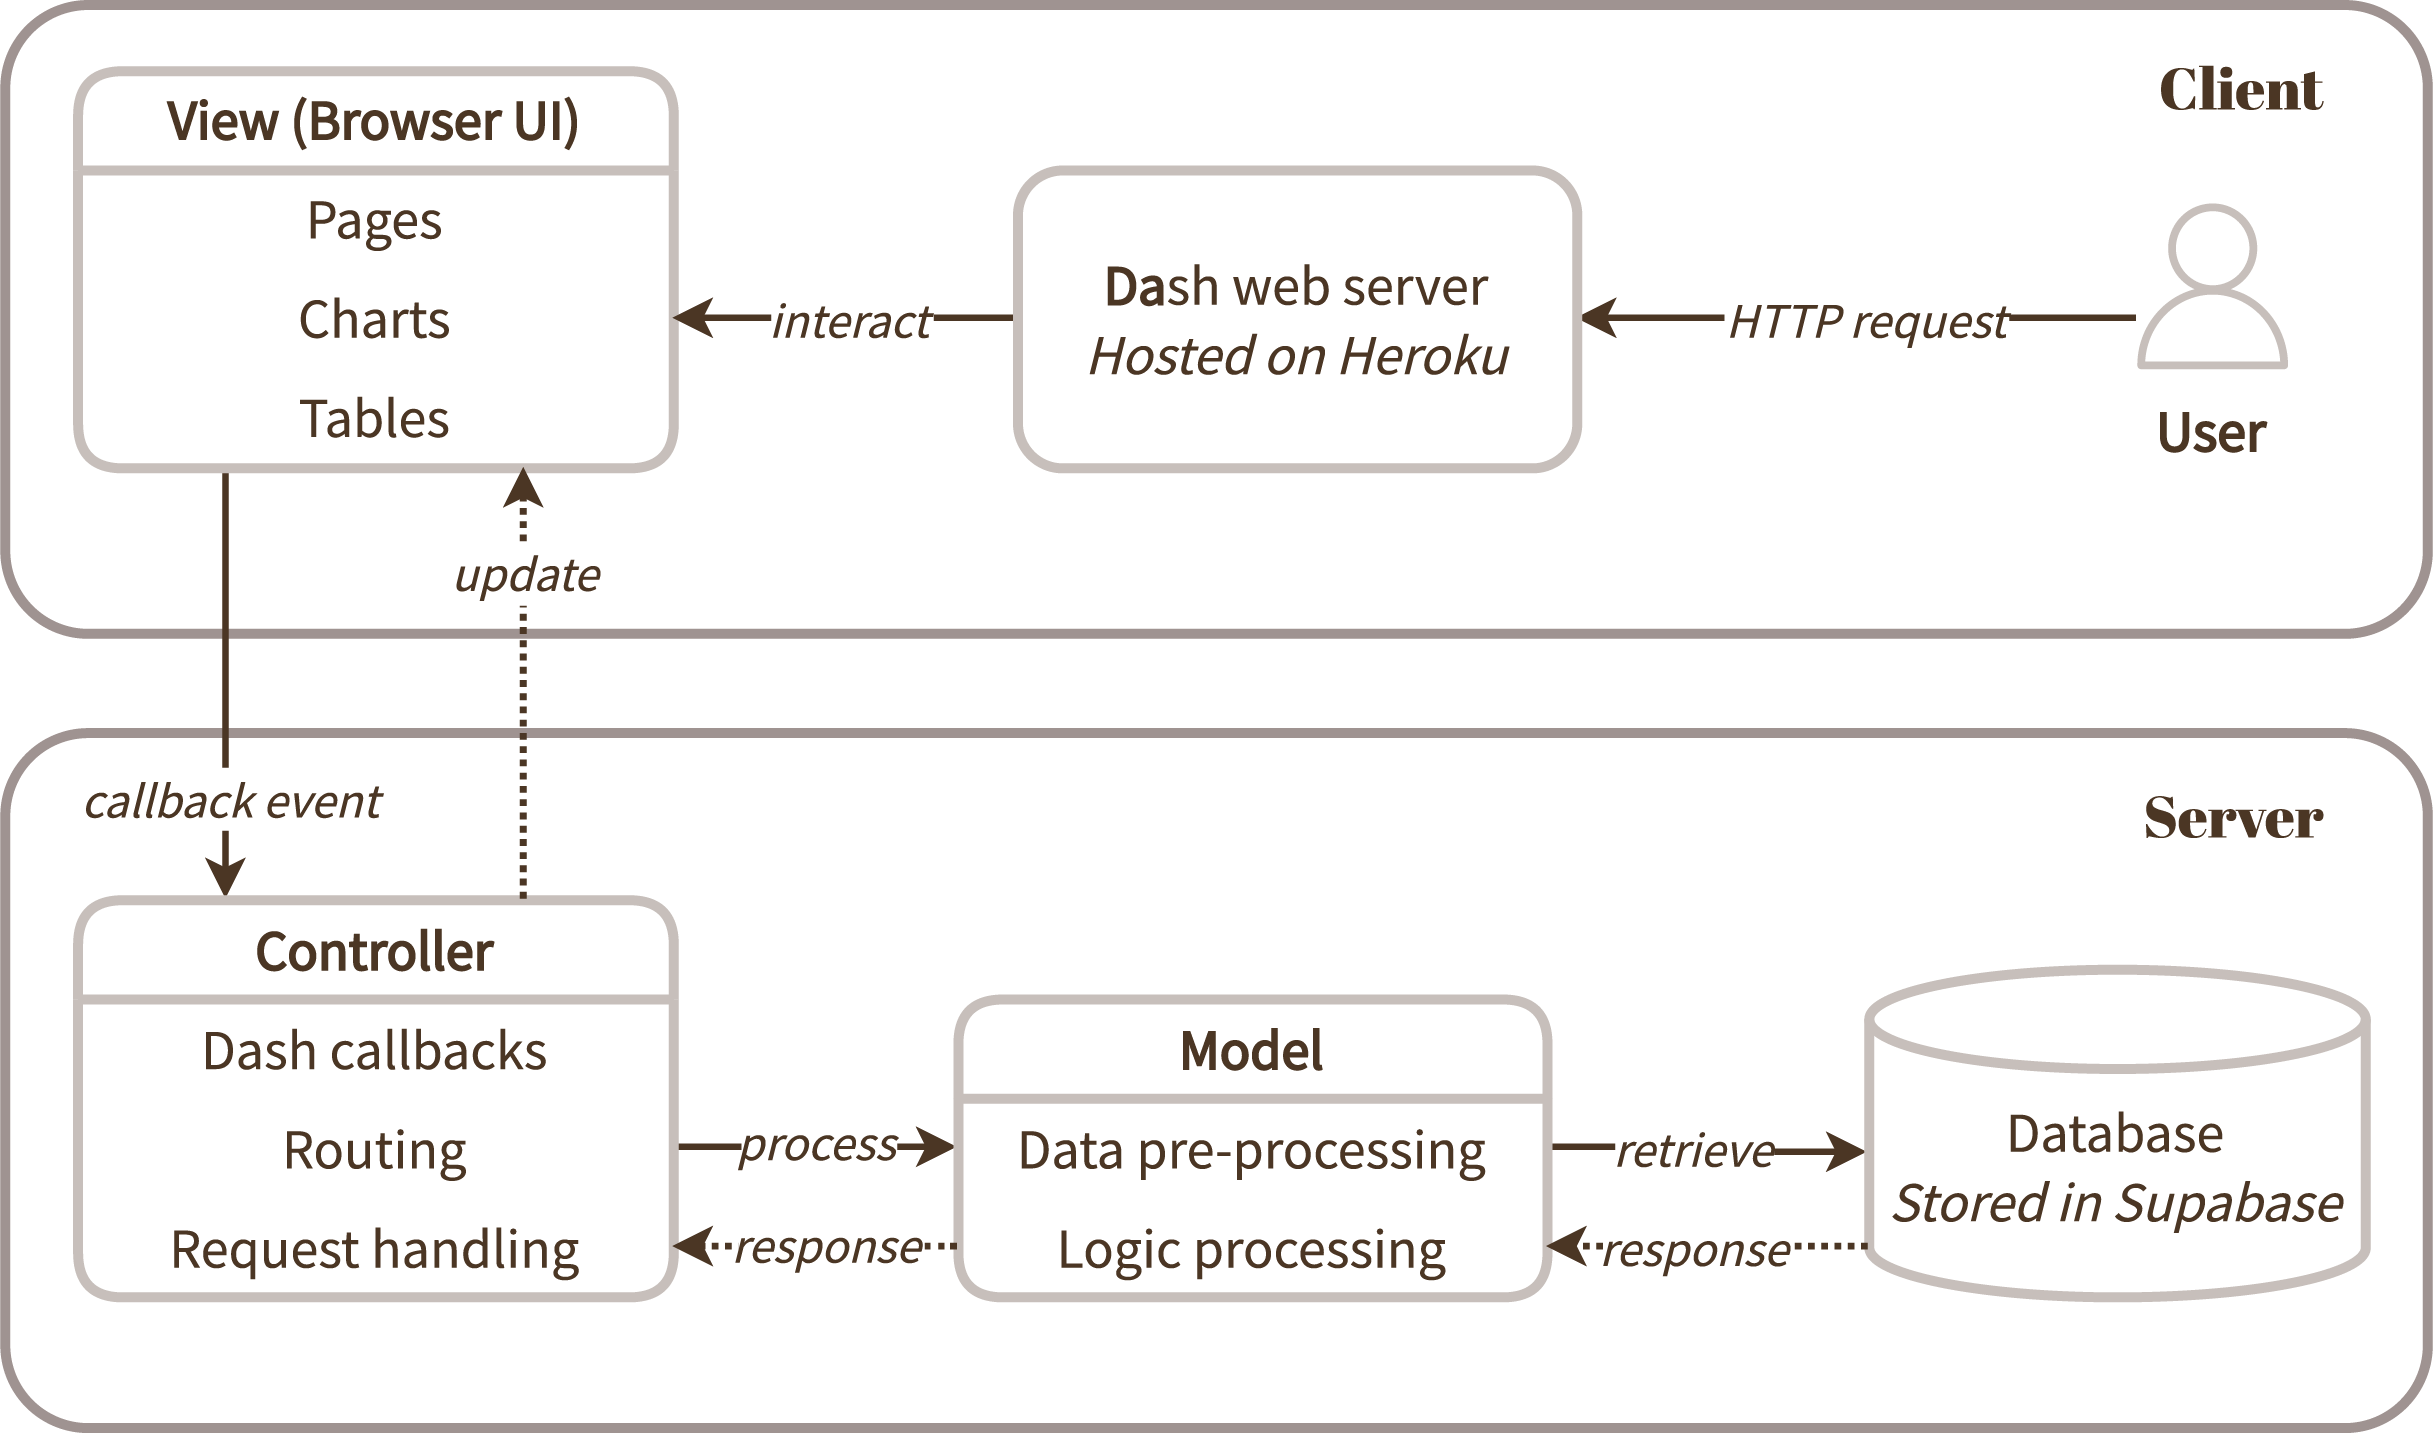
Figure 3 illustrates the intended interactive flow for DiscourseDash by showing the sequence of interactions between a user and the prototype across its key components. The core dashboard is divided into two main pages: (1) the Overview Page (see Figs. 4, 5, 6) and (2) the Detailed Analysis Page (see Figs. 7, 8). The final prototype used for this research is publicly accessible here: DiscourseDash.
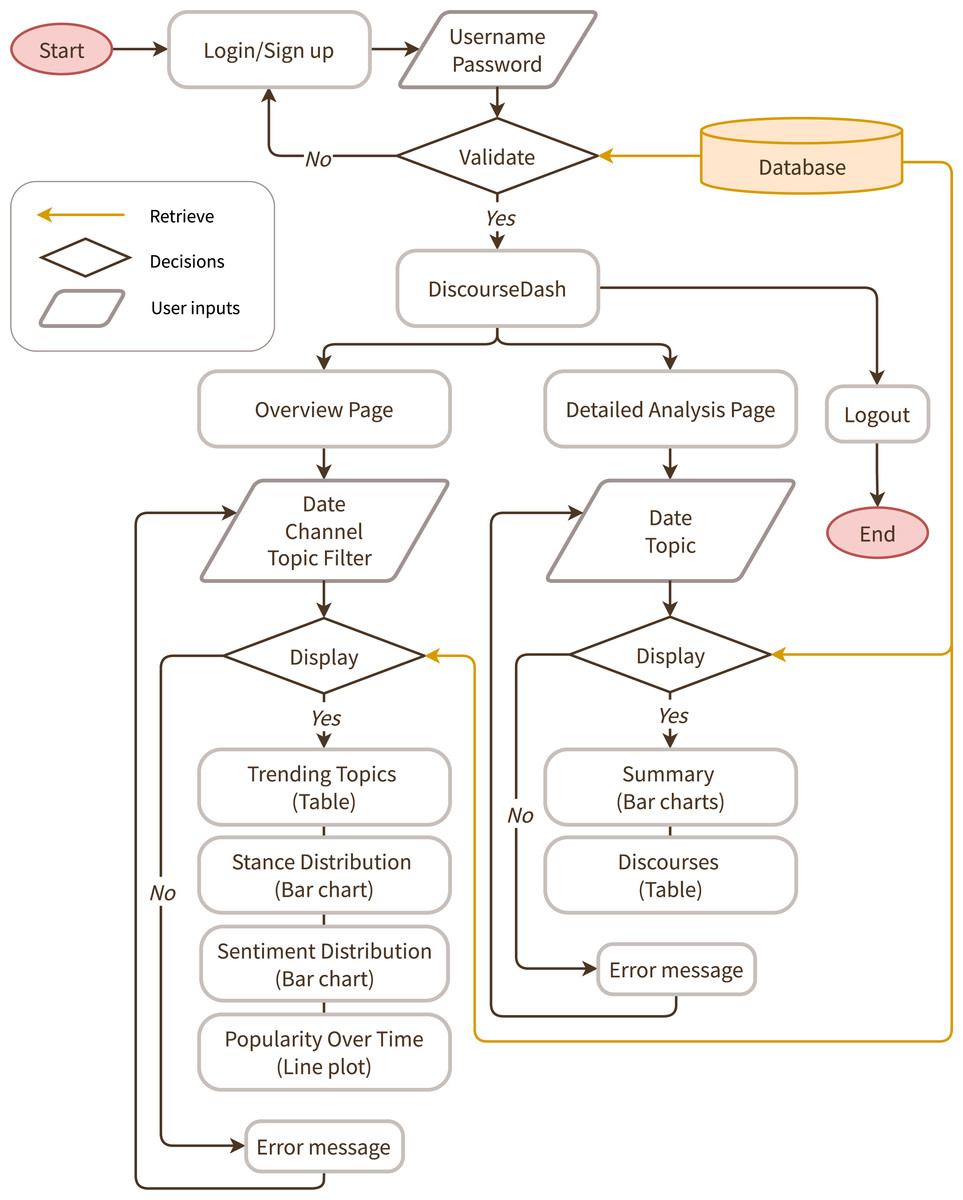
Figure 3: A user flow diagram for DiscourseDash.
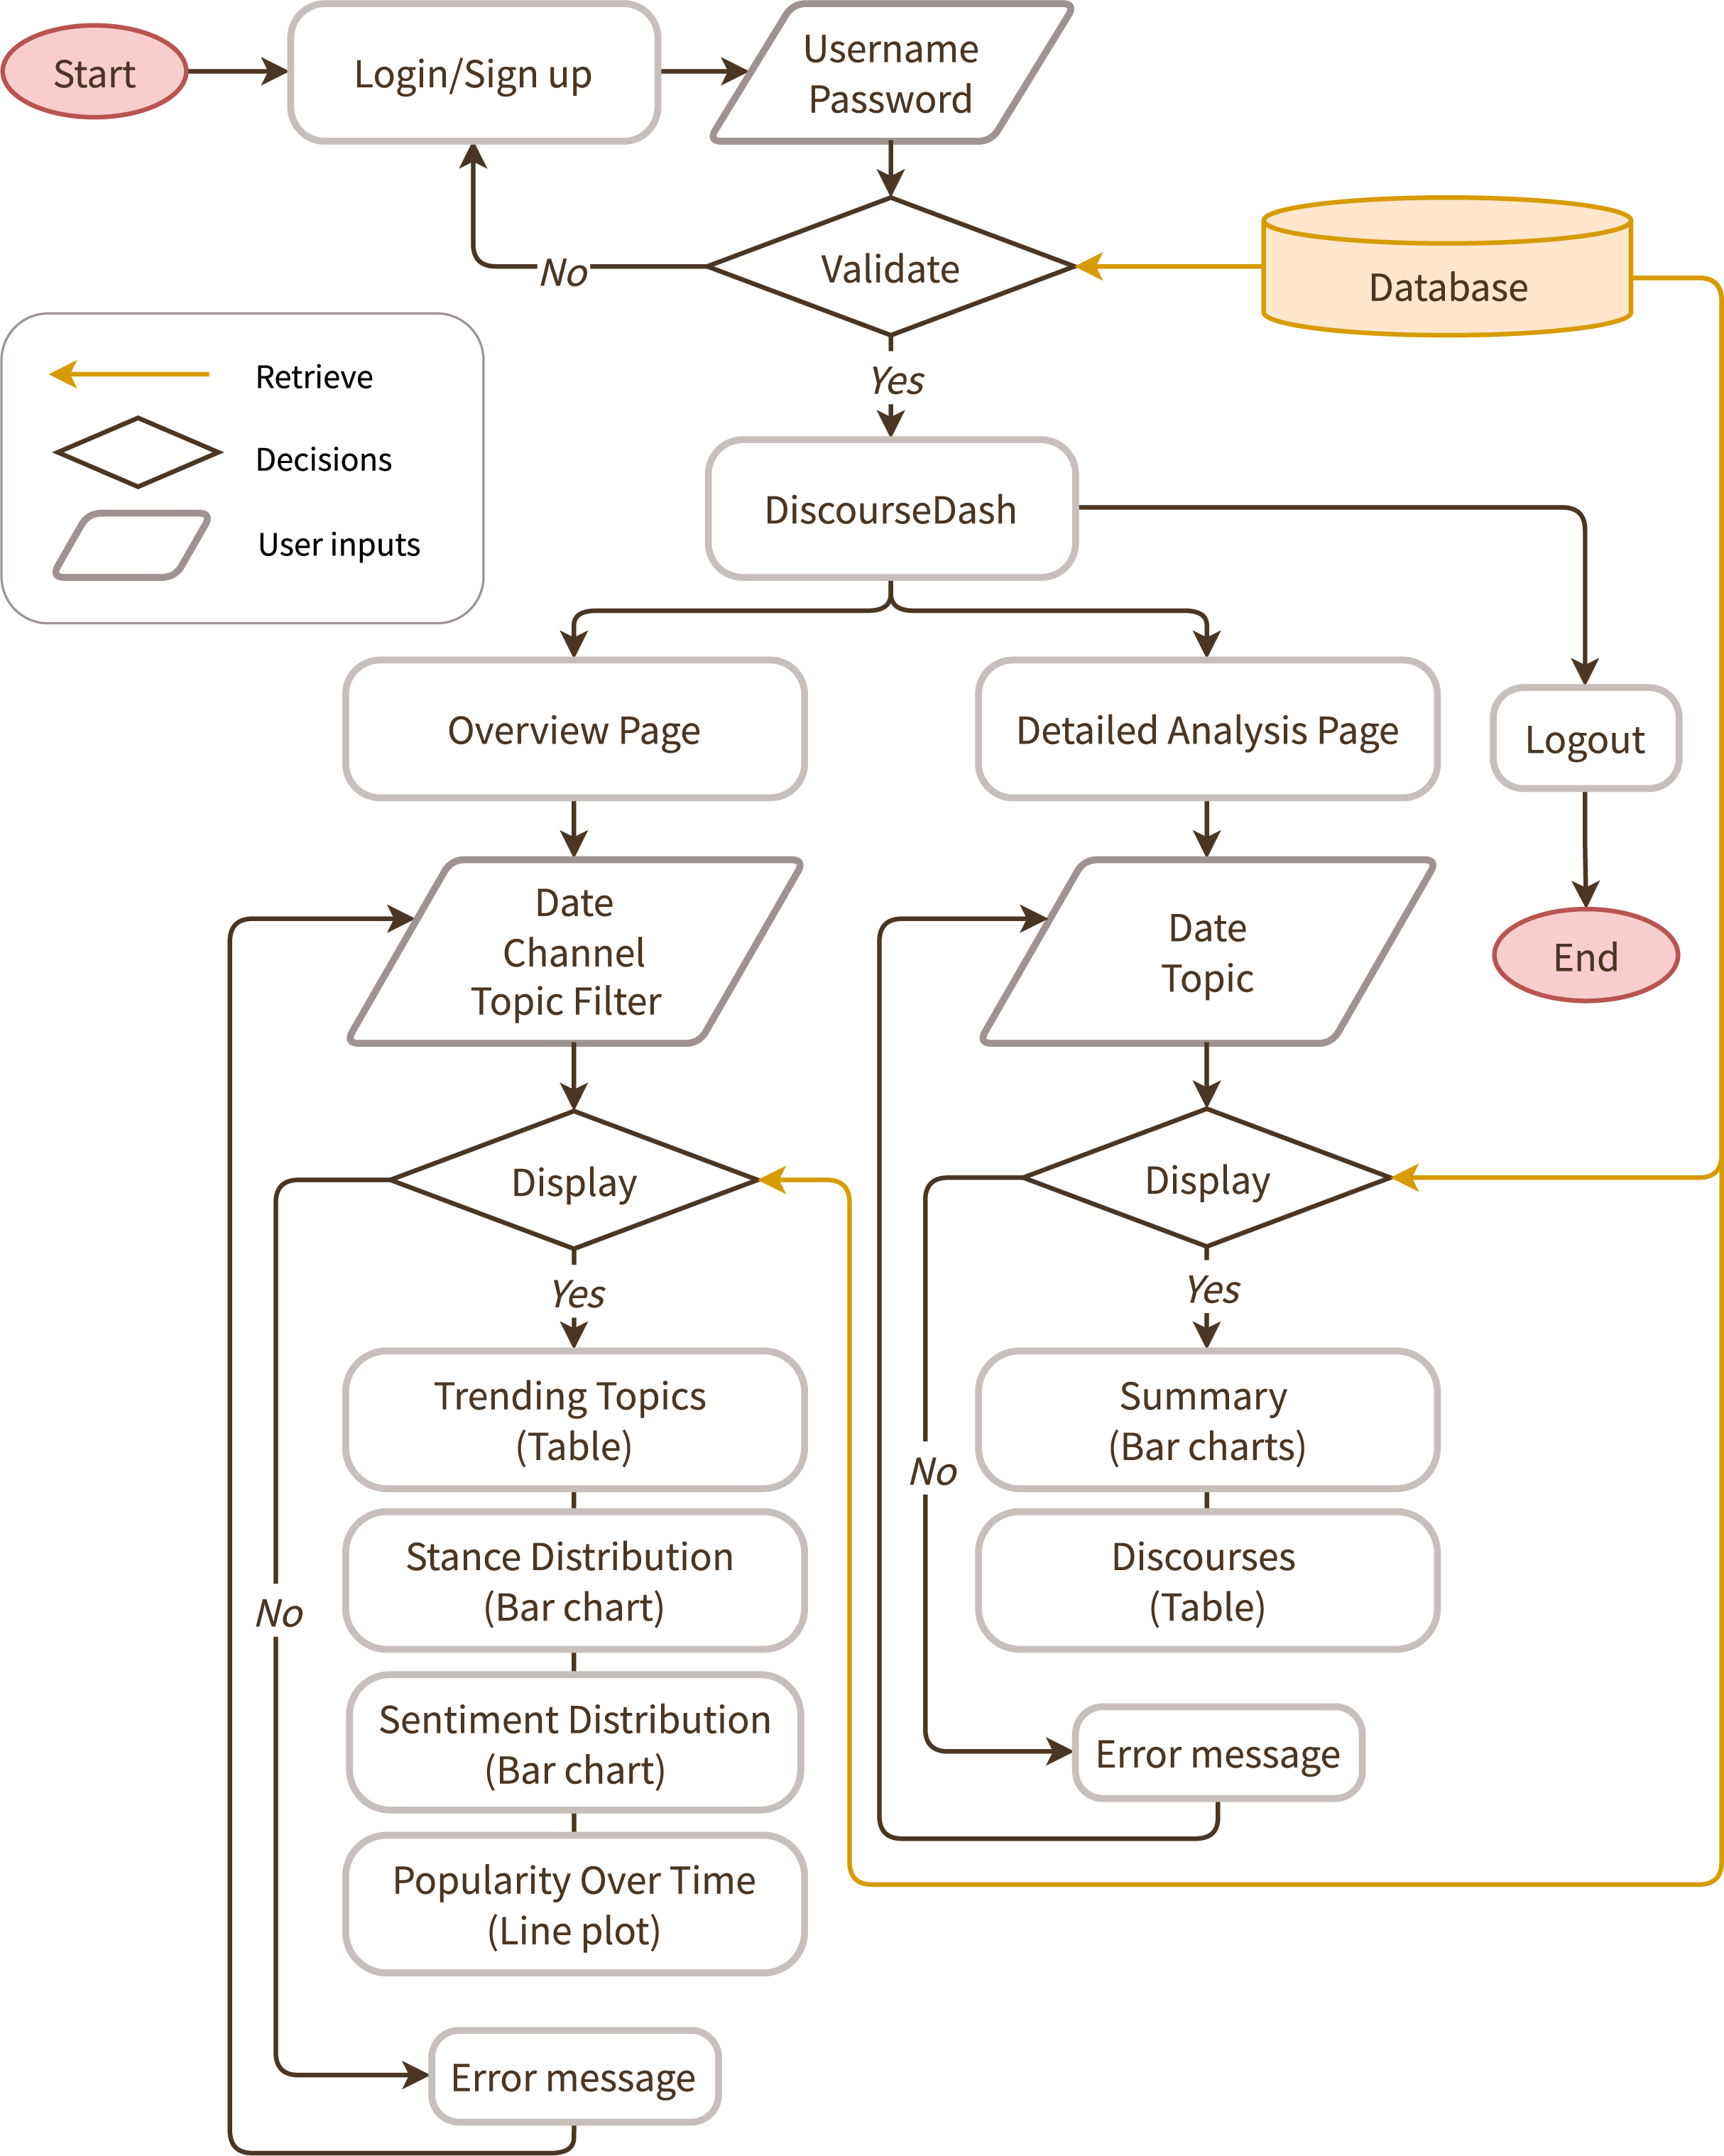
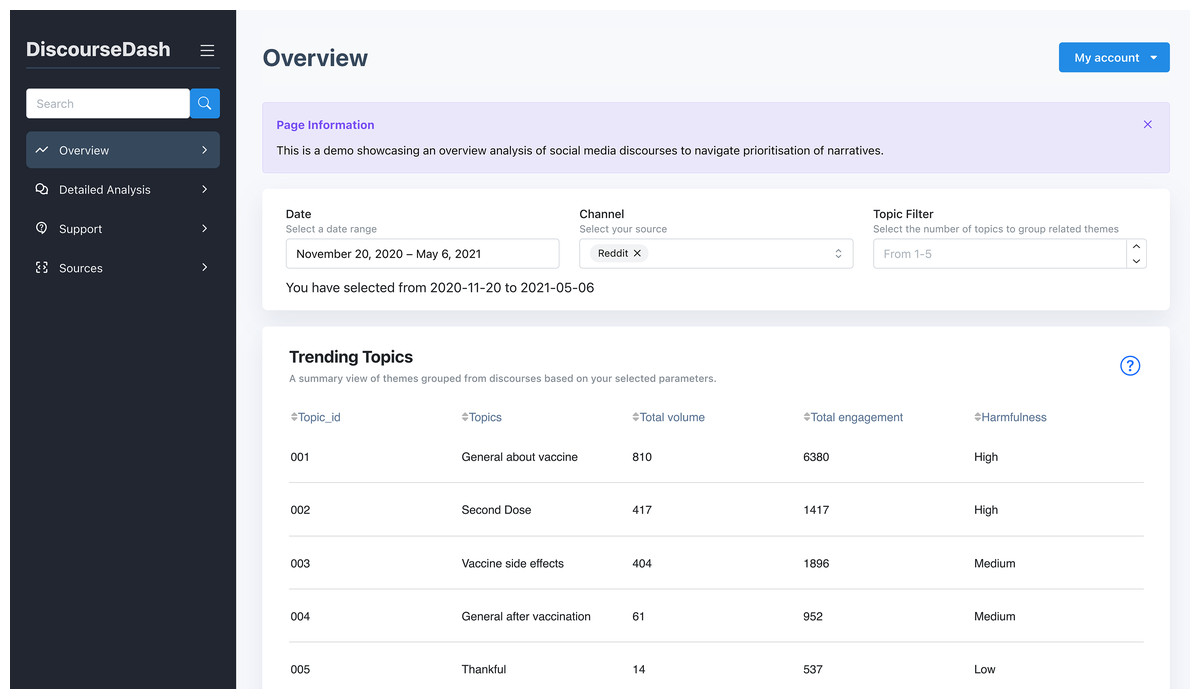
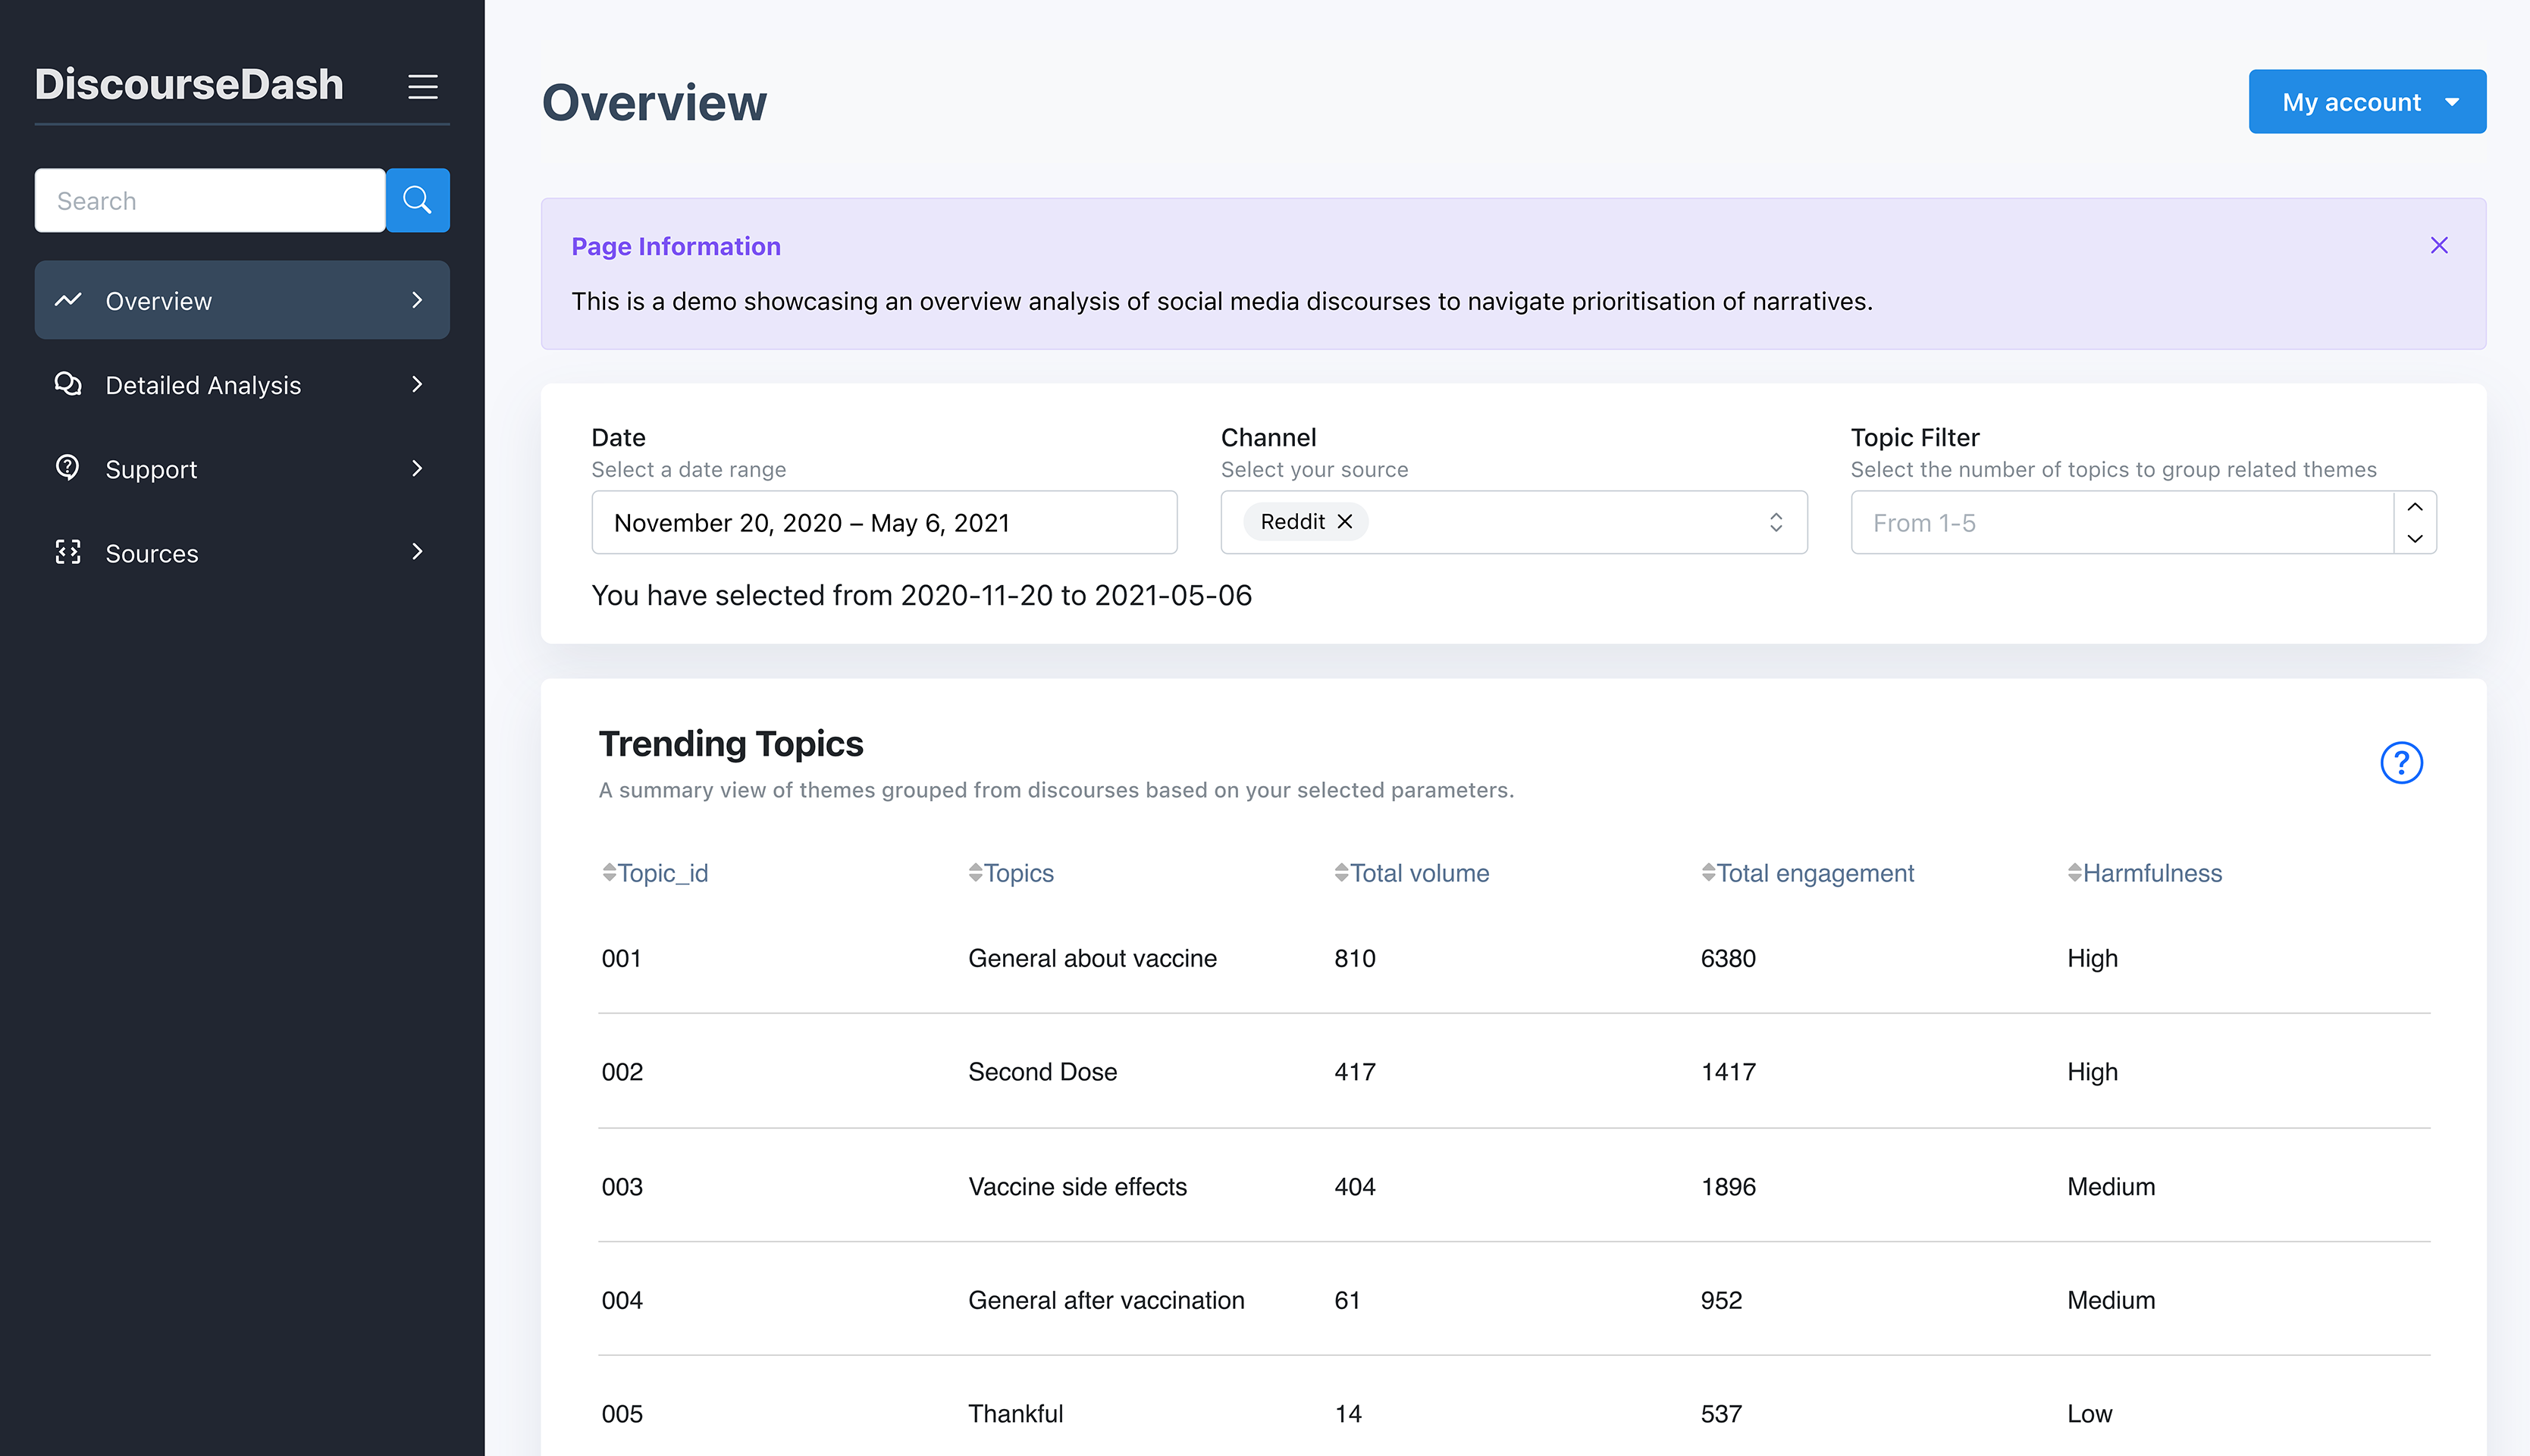
Figure 4: Overview page showing user inputs and the Trending Topics table.
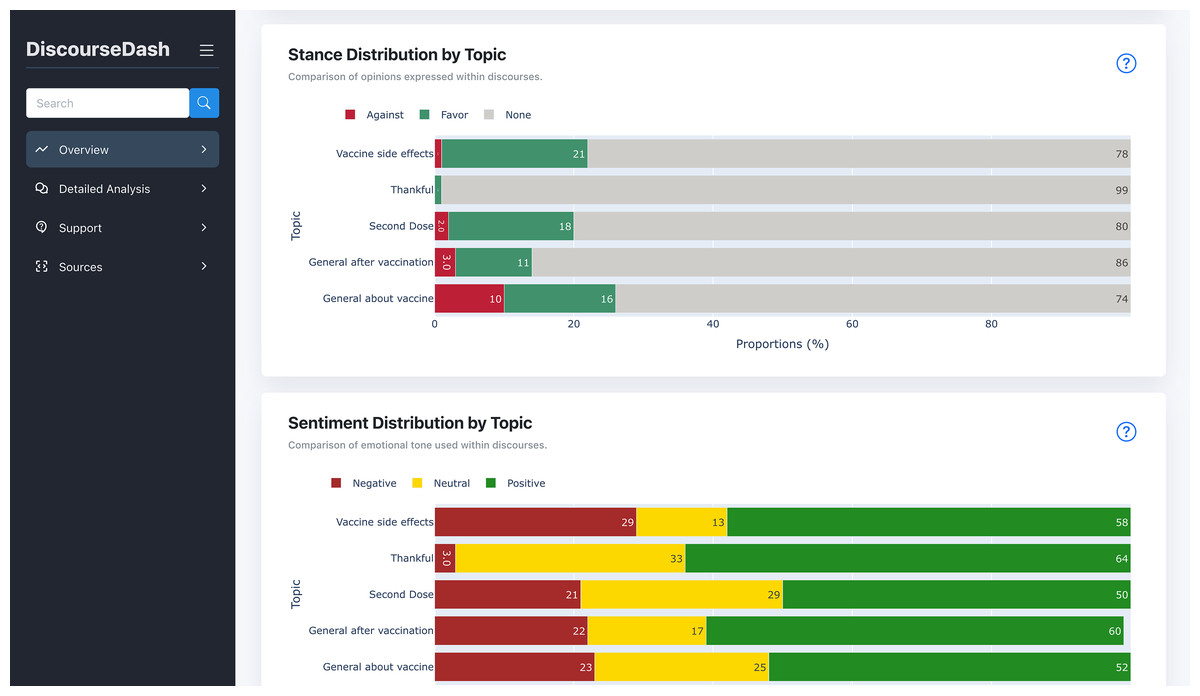
Figure 5: Overview page displaying stance distribution by topic and sentiment distribution by topic charts.
These charts are positioned below the “Trending Topics” table, scrolling down the page.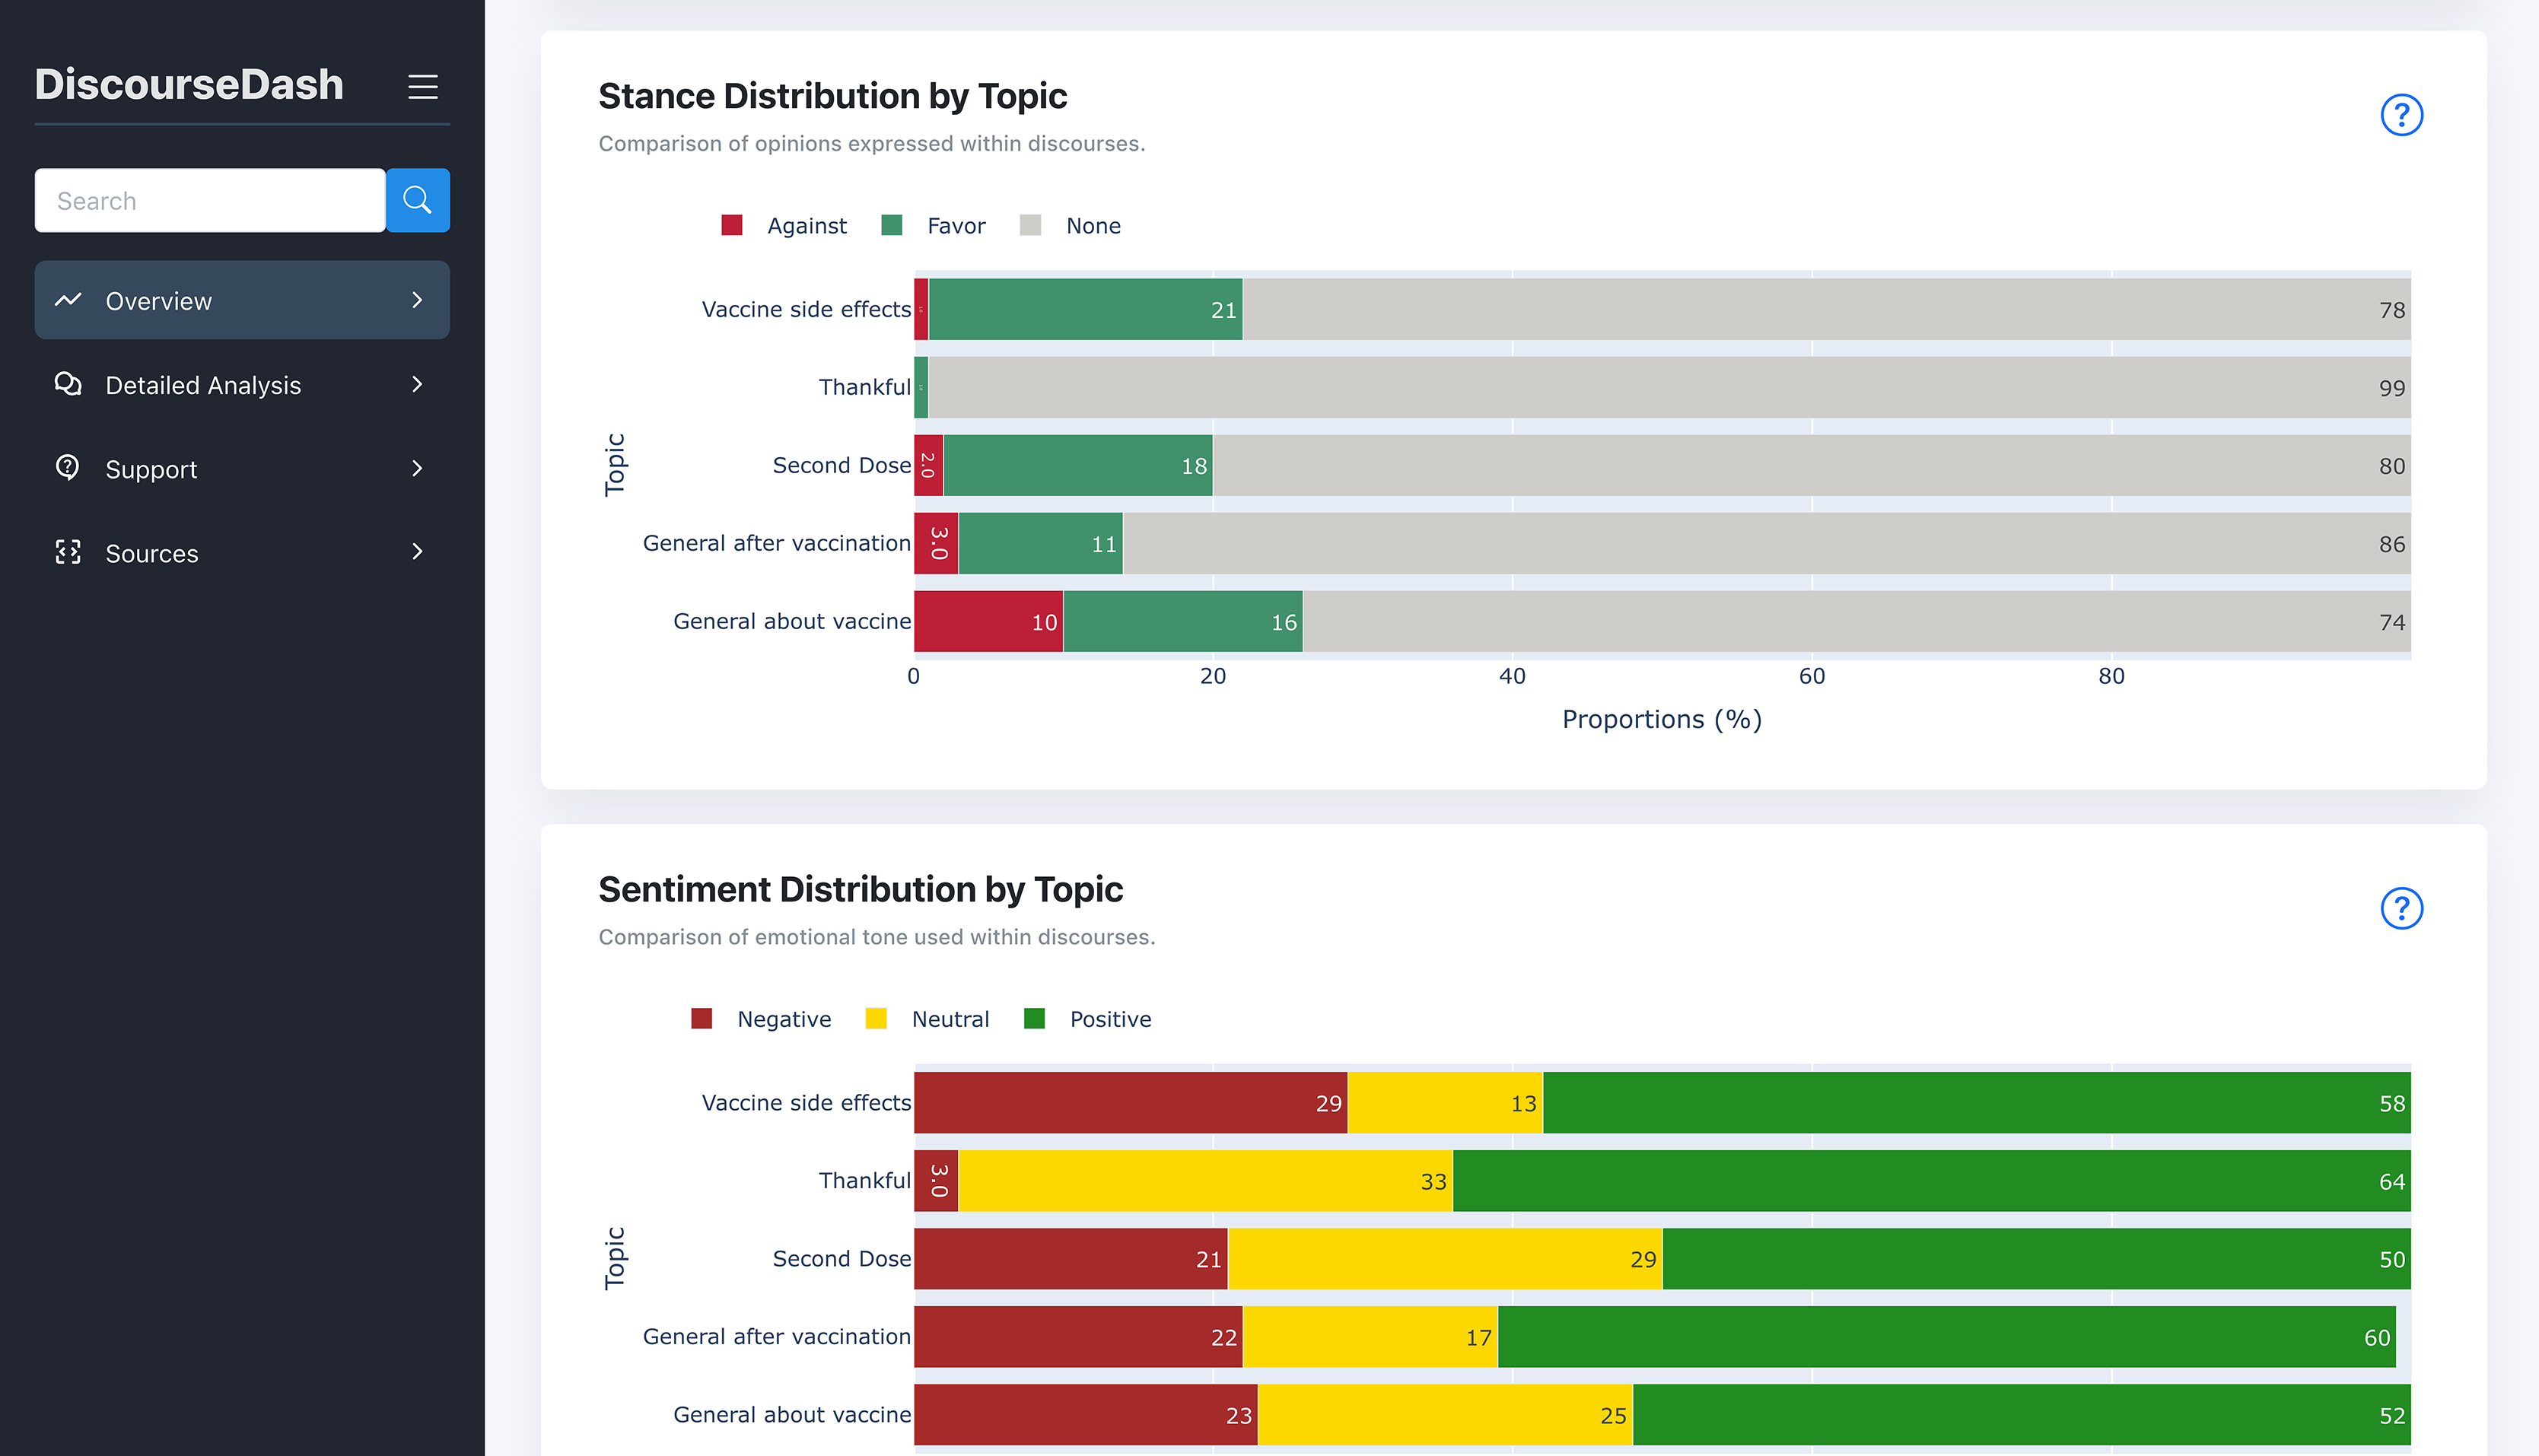
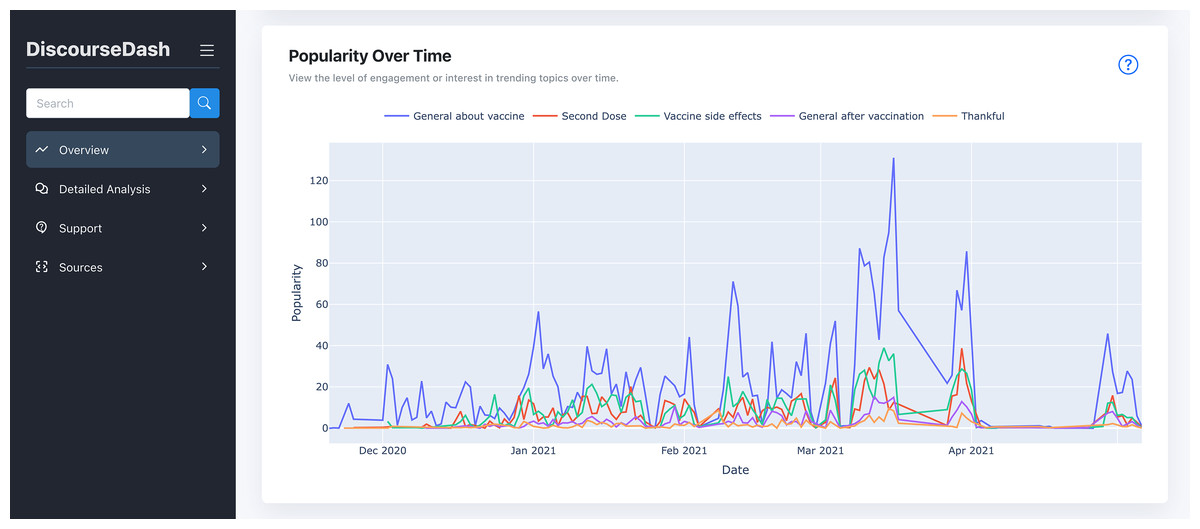
Figure 6: Overview page with popularity over time.
This graph is located further down the page from the previous figure.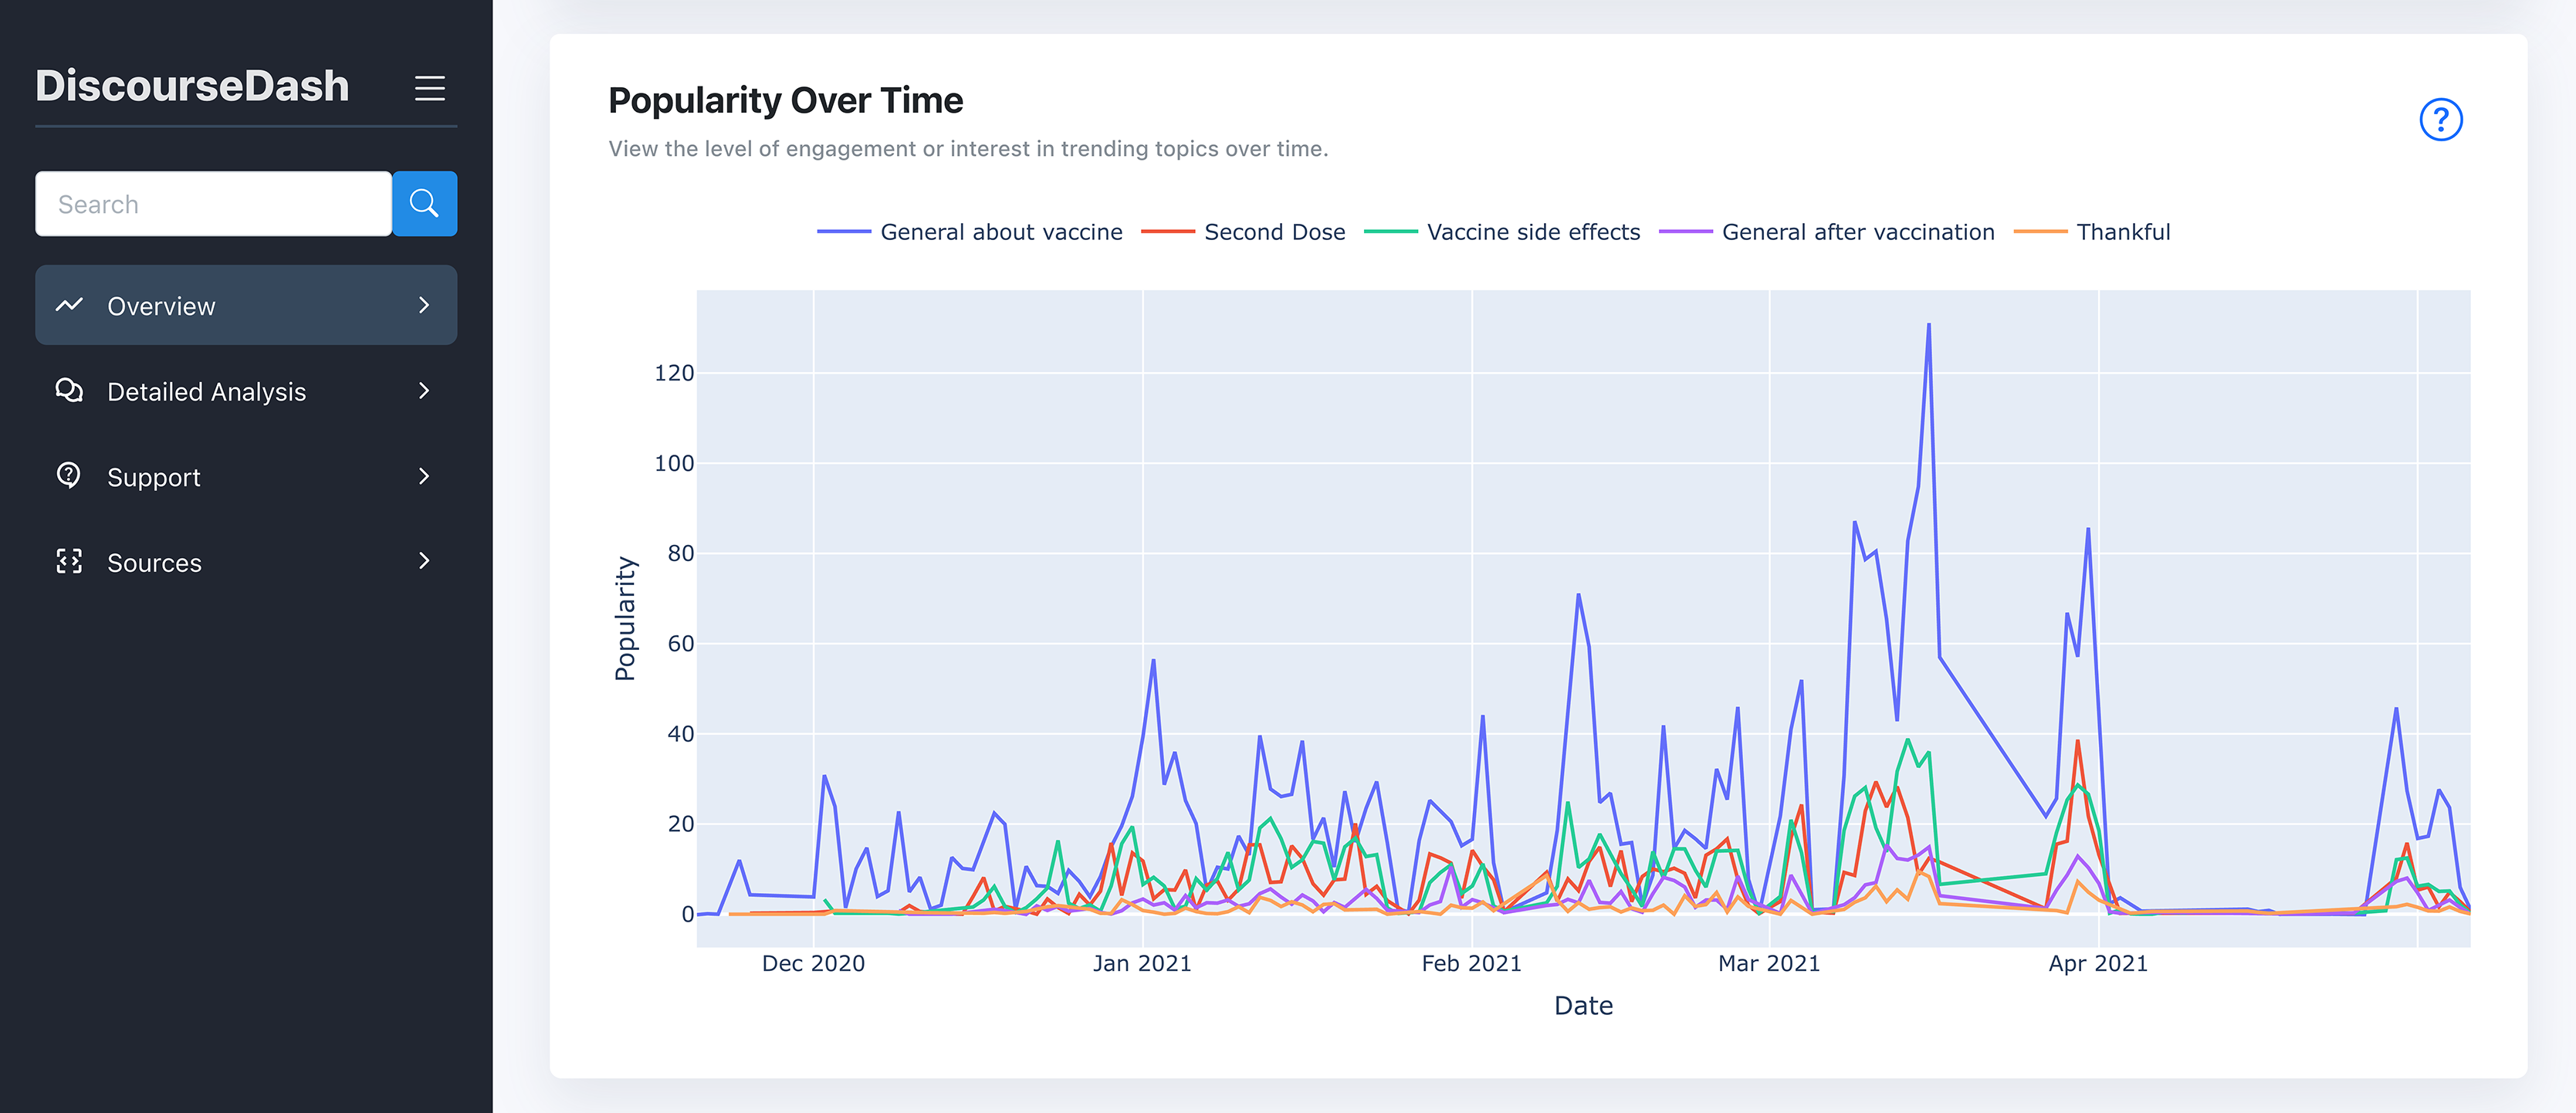
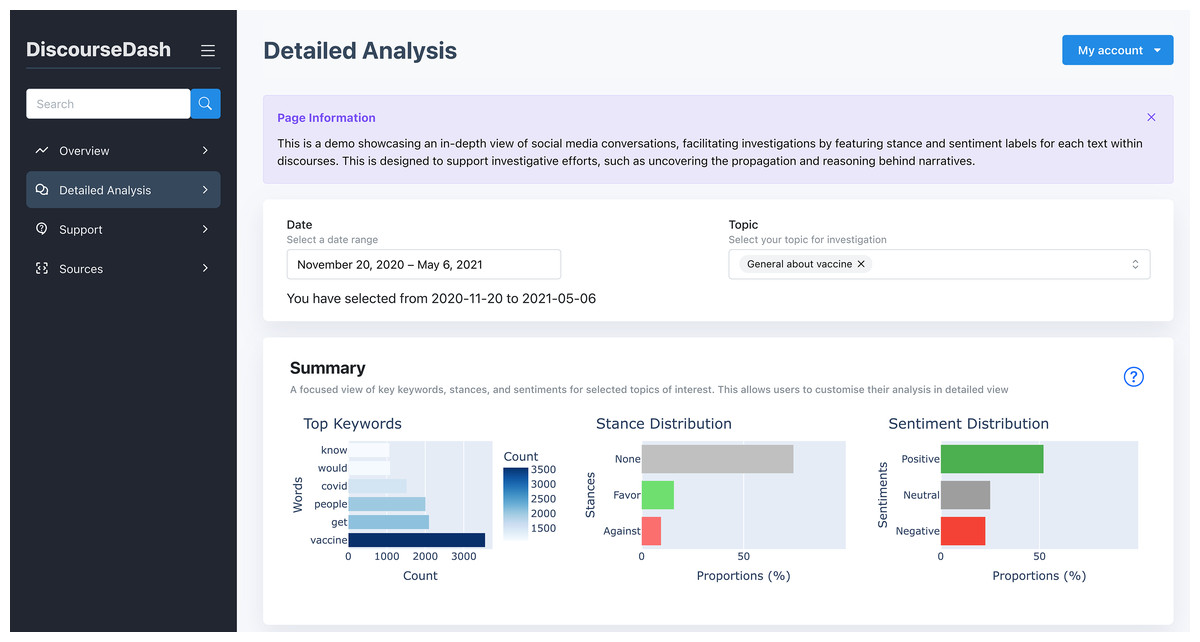
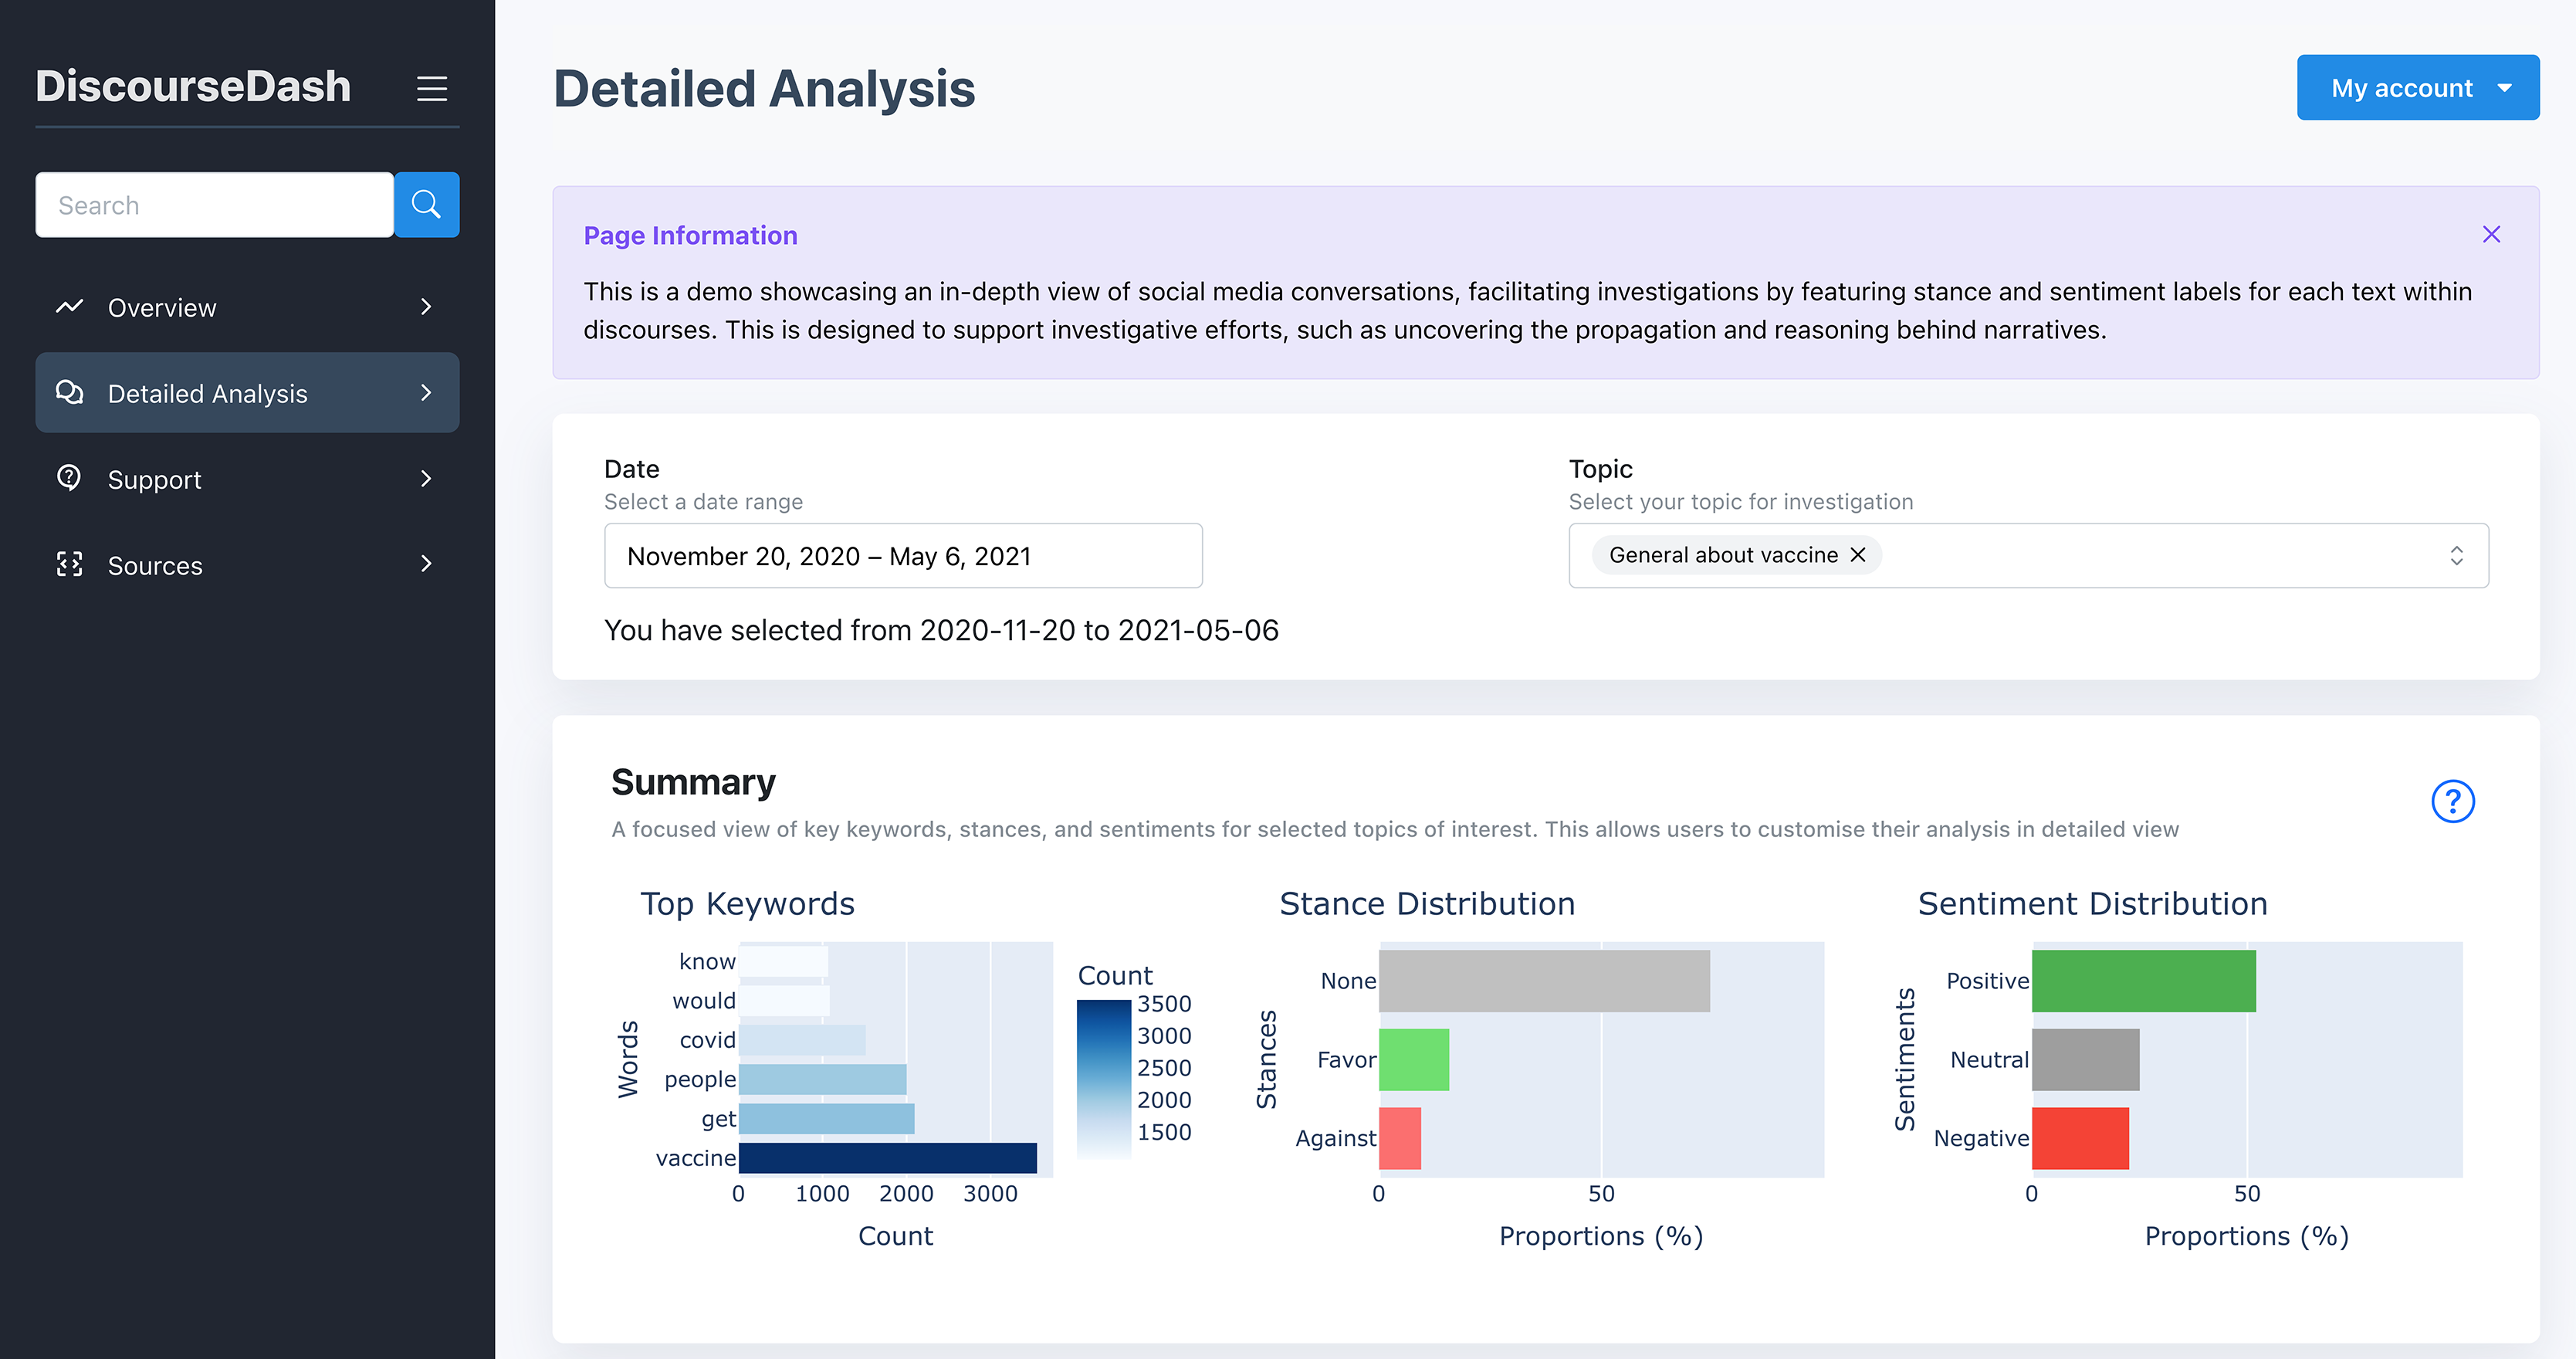
Figure 7: Detailed Analysis page with the user inputs and summary.
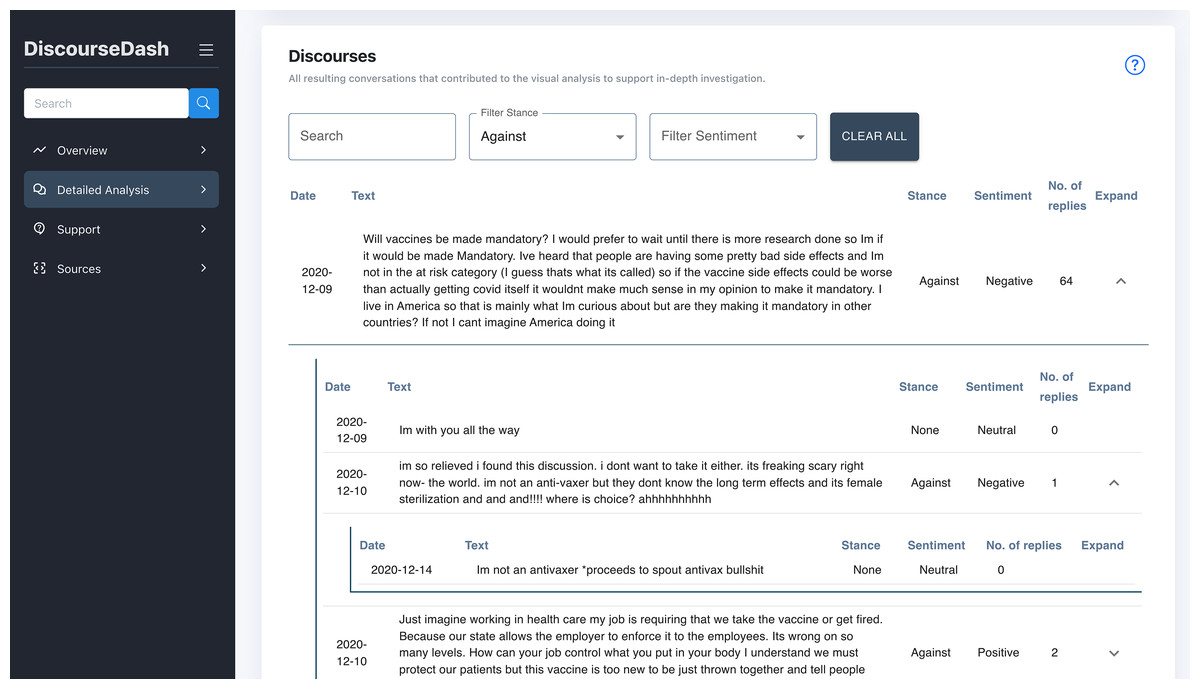
Figure 8: Detailed Analysis page with the discourses, with an example of a full discourse with activated collapsible function.
This table is located further down the page from the previous figure.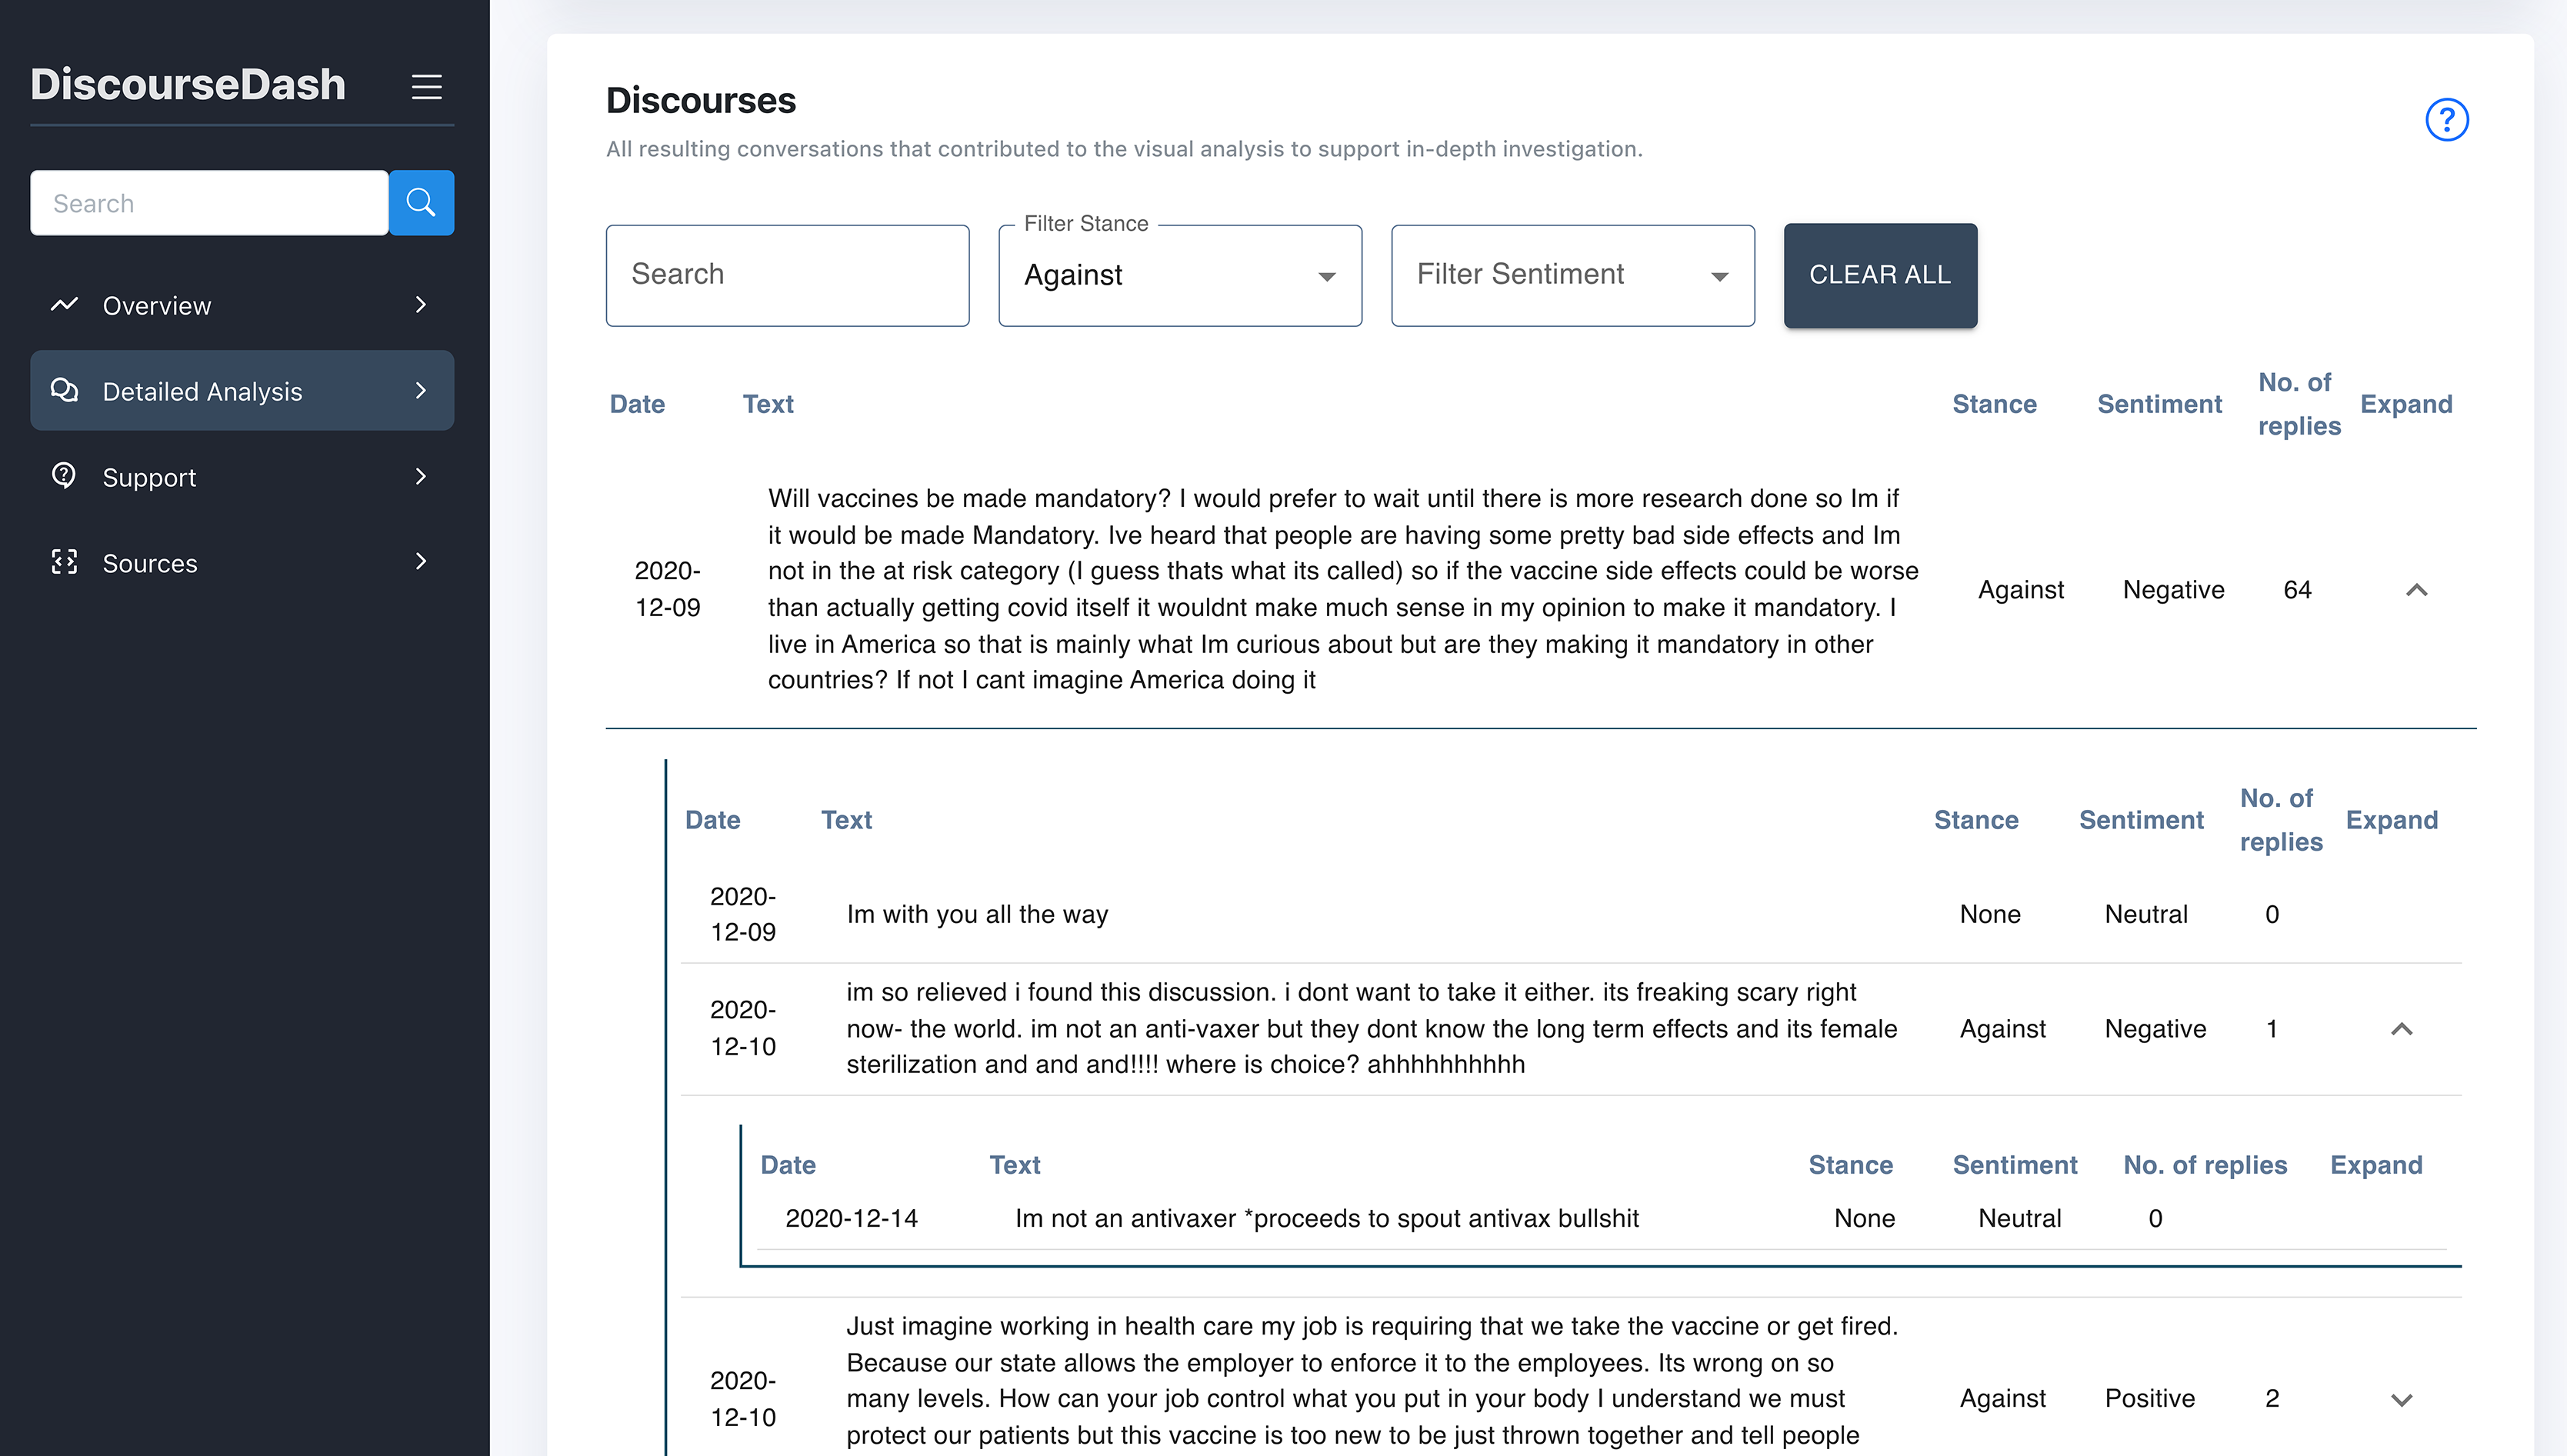
Overview page
The Overview Page provides users with a high-level summary of trending discourse topics and their key analytical insights. The page consists of the following interactive components:
A. User Inputs: Users specify a date range and optionally the number of topics to display. The dashboard then updates components B through E accordingly.
B. Trending Topics: Displayed in a table summarising the results of the analysed discourses. Each topic includes a unique identifier (Topic_ID), the topic label (Topics), counts of root-level comments (Total volume), the number of associated child-level comments (Total engagement), and a harmfulness label (Harmfulness), categorised as low, medium, or high.
C. Stance Distribution by Topic: Displayed as a bar chart, this component shows the distribution of stances (favour, none, against) across all discourses within each topic from B. The y-axis lists topics by Topic_ID, while the x-axis shows the aggregated count of stance labels from both root-level and child-level comments.
D. Sentiment Distribution by Topic: This bar chart presents the distribution of sentiments (positive, neutral, negative) associated with each topic from B. The y-axis lists topics by Topic_ID, while the x-axis shows the aggregated counts of sentiment labels from both root-level and child-level comments.
E. Popularity Over Time: The line graph displays user engagement trends for each topic from B, with dates on the x-axis and popularity (number of engagements) on the y-axis.
Detailed analysis page
This page presents the detailed discourses corresponding to the topics of the previous Overview Page. It allows users to dive deeper into specific topics they wish to investigate specific issues based on actual discourses.
A. User Inputs: Users specify a date range and select a targeted topic(s) for detailed investigation. The dashboard then updates components B and C accordingly.
B. Summary: This component provides a summary of a discourse selected by the user to investigate. By topic, a bar chart on the left illustrates the distribution of stances (favour, none, against) across the discourse. Similarly, another bar chart on the right presents the sentiment distribution (positive, neutral, negative) across the discourse.
C. Discourses: Displayed in a collapsible table format, allowing users to expand each discourse to view its associated child-level comments. Each row, representing root/child level comments, is accompanied by labels of the corresponding stance (favour, none, against) and sentiment (positive, neutral, negative). This is designed to facilitate detailed analysis within the broader context of the selected topics. Additional functionalities include filters that allow users to refine results based on specific stances, sentiments, and keyword searches.
Methods
This study comprised two sequential phases, each refined through pilot testing and guided by relevant literature. Ethical approval for both studies was granted by the Research Ethics Committee of the School of Computer Science at the University of Nottingham (Ethics Application Ref: CS-2023-R61). All participants provided informed consent before participating in the study. Written consent was obtained using an electronic consent form distributed through a secure online platform. Participants were required to read the information sheet and sign the consent form electronically to confirm their voluntary participation. All data were anonymised before analysis. Details of all anonymised participant codes and data related to this research are publicly available in the Nottingham Research Data Management Repository under accession number: 10.17639/nott.7564.
Phase 1: mixed-method study with general users
We conducted a mixed-method study with 26 participants to compare perceptions when interpreting unstructured social media content (Reddit) vs using our dashboard in decision-making tasks. This phase explored DiscourseDash’s conceptual and functional usefulness through complex interactions. The study was conducted in English via Microsoft Teams between June and July 2024.
Recruitment and participants
Participants were recruited from the university research groups, including professors, researchers, and students. No further screening was applied. Participants were assigned to interact with the conditions in a counterbalanced order. To respect participant privacy and because demographic details were not relevant to the study’s aims, detailed demographic data were not collected. This aligns with prior evidence suggesting that participants may be uncomfortable sharing such information (Frederick, 2021). Participant codes (e.g., G1) serve as anonymised identifiers, where “G” denotes a general user. A complete list of participant codes, their assigned counterbalanced condition orders, interview dates, and anonymised excerpts from the transcripts is available in the dataset.
Study design
We employed a within-subjects design where participants completed three predefined tasks using two experimental conditions in counterbalanced order: (1) Reddit as a baseline, and (2) DiscourseDash. After each task, semi-structured interviews were employed to gather qualitative feedback, followed by questionnaires to quantify user experience. Following the completion of both conditions, participants engaged in a final interview to compare their experiences and provide feedback for improvements. This approach enabled an evaluation of DiscourseDash’s effectiveness in supporting decision-making, the usefulness of its features, and opportunities for user-centred enhancements.
Baseline justification: Baseline selection should reflect realistic, representative user practices (Purchase, 2012). Manual exploration of unstructured social media is common among experts such as journalists (Humayun & Ferrucci, 2022; Hellmueller et al., 2024). Thus, an unstructured social media platform serves as a realistic analogue. Reddit was chosen for its recognised open discourse structure: threaded comments, subReddits, upvotes, and downvotes (Hollender et al., 2010). Compared to Twitter/X or Facebook, Reddit’s longer discussions, clear hierarchical threads, and topic-focused communities make it suitable as a baseline for this study. We acknowledge Reddit may not capture all interaction types of other platforms. Yet, its open, community-driven nature represents unstructured social media well. For clarity, we define a root-level comment as equivalent to a Reddit post, and a child-level comment as equivalent to a Reddit reply (see Page 7).
Procedure
Participants were provided with an initial briefing on the research topic and the study’s objectives, which focused on evaluating the effectiveness of DiscourseDash in analysing online discourse. To minimise bias, the comparison between conditions was not disclosed. Each participant experienced two counterbalanced conditions: (1) baseline Reddit and (2) DiscourseDash. Participants began by familiarising themselves with the assigned condition. Drawing from virtual experience methodologies, a realistic narrative was provided to enhance ecological validity (Gorini et al., 2011). Participants assumed the role of a fact checker tasked with identifying newsworthy topics and crafting impactful articles, inspired by journalistic practices (Humayun & Ferrucci, 2022; Hellmueller et al., 2024). This scenario helped link DiscourseDash’s metrics with its intended impact (Lam et al., 2011). Then, participants completed three separate, predefined tasks specifically designed to reflect these realistic workflows. These tasks are detailed in File S1, Set A. During these tasks, participants used the think-aloud protocol to verbalise their thought processes (Jaspers et al., 2004). After each task, a semi-structured interview and questionnaire assessed their experience. This procedure was repeated for the second condition. The study concluded with a final semi-structured interview comparing both conditions to identify preferences and gather feedback. Participants received a £10 Amazon voucher for approximately 60 min of participation. Figure 9 illustrates the study conditions and procedure.
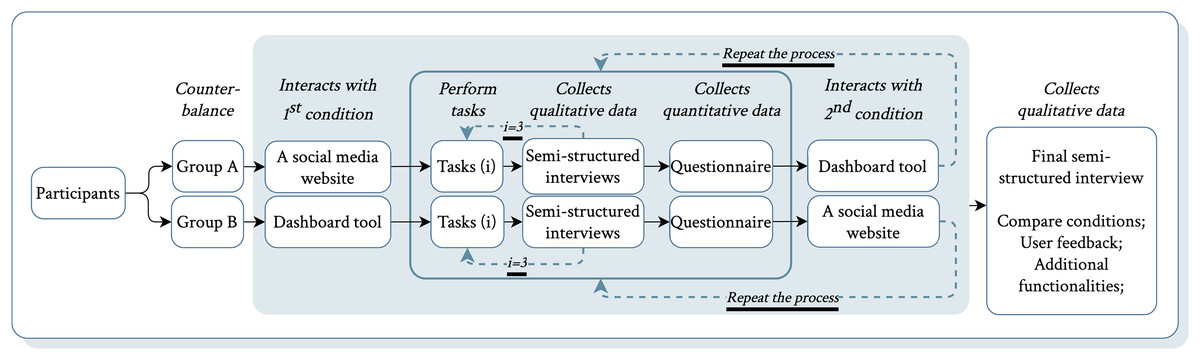
Figure 9: Overview of the study procedure in Phase 1.
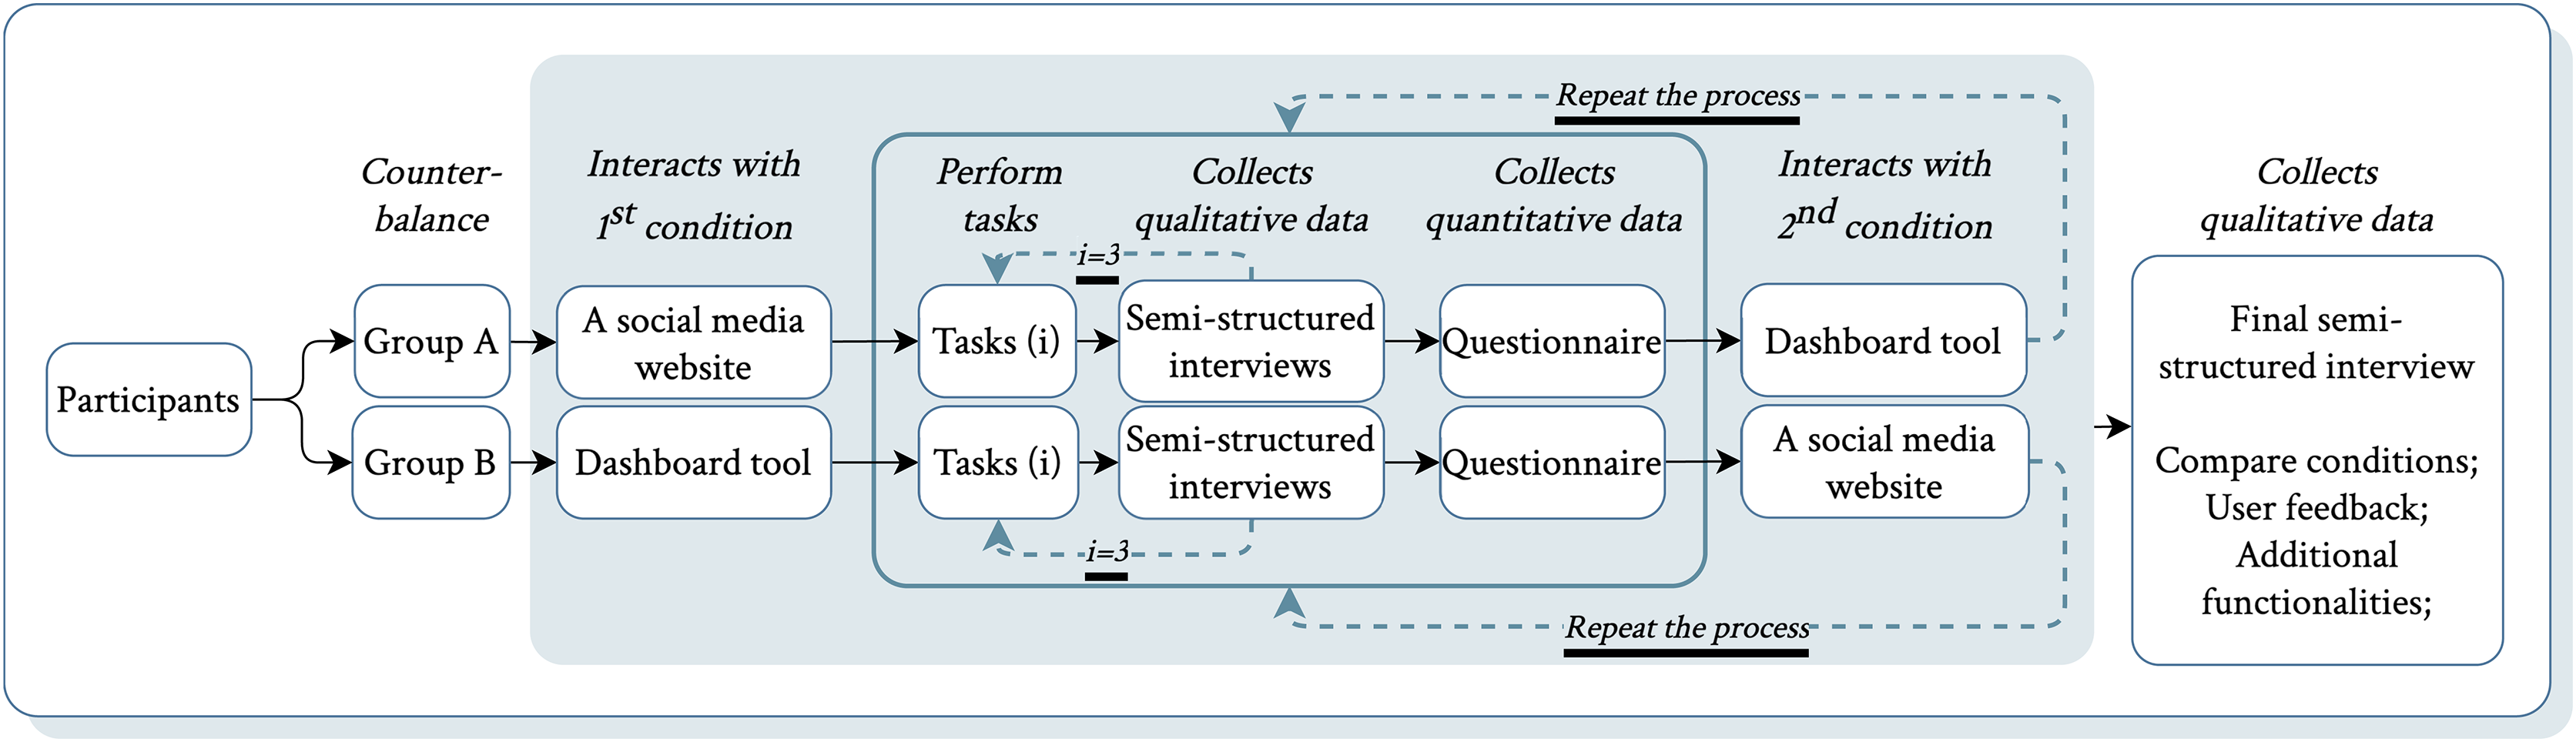
Data collection and analysis
We used a mixed-method approach (Creswell, 2021) to gather both quantitative and qualitative data. Quantitative data provided measurable insights into participants’ interactions and perceptions, while qualitative data helped explore underlying reasons. All audio recordings were transcribed via Microsoft Teams, then manually reviewed to ensure accuracy. The transcriptions were then extracted and organised by questions, as shown in the provided dataset, allowing for a structured mapping of participant responses to facilitate the analysis process.
Data collection
Interview: We conducted semi-structured interviews to collect qualitative data. After each task in both conditions, participants reflected on their experience through a predefined set of sub-questions (see File S1, SET B), targeting insights into their interactions and decision-making. After completing both conditions, a final semi-structured interview was conducted to compare the conditions and identify improvements for DiscourseDash (see File S1, SET C).
Questionnaire: Participants completed Likert-scale questions evaluating task experience and usability for each condition. Shared questions assessed aspects like ease of topic prioritisation, while condition-specific questions addressed stance detection, sentiment analysis, harmfulness detection, popularity analysis, and discourse-level features. The System Usability Scale (SUS) (Brooke, 1996) was also employed for quantitative usability assessment. Complete questionnaires for DiscourseDash and Reddit conditions are provided in Files S2 and S3, respectively.
Data analysis
Qualitative analysis: We conducted thematic analysis (Braun & Clarke, 2012) to systematically identify, organise, and interpret patterns within the qualitative data. This method was selected for its ability to capture both explicit and implicit themes from participant narratives during interactions with DiscourseDash. The process began with familiarisation, where transcripts were reviewed and responses were summarised. Open coding was then conducted using an inductive, interpretive approach. Codes were iteratively refined through regular discussions to ensure consistency, accuracy, and alignment with the study’s research questions. Illustrative participant quotes are included to substantiate the findings.
Quantitative analysis: Quantitative questionnaire data collected after each interaction were analysed using appropriate non-parametric statistical tests for ordinal and paired data. To compare participant ratings between the two conditions, we applied the Wilcoxon Signed-Rank Test, which is suitable for related samples and non-normally distributed data. Additionally, the Friedman Test was used to evaluate differences across multiple related features within conditions. These analyses allowed us to assess the relative performance of both conditions. SUS are calculated by converting participant responses on a 5-point Likert scale into a total score ranging from 0 to 100, where scores above 68 are generally considered to indicate above-average usability. The average score across participants reflects overall user acceptance and satisfaction (Bangor, Kortum & Miller, 2009).
Phase 2: interview study with industry experts
Building on insights from Phase 1, we conducted semi-structured interviews with 11 industry experts experienced in analysing social media discourses for decision-making. The study aimed to explore their current workflows, practices for social media discourse analysis, experts’ perceptions of DiscourseDash, and suggestions for its practical integration in real-world contexts. Interviews were conducted in English via Microsoft Teams between March and April 2025.
Recruitment and participants
Participants were recruited through existing networks, direct outreach on LinkedIn, and targeted recruitment via Prolific (See File S5). The final sample includes 11 participants with diverse roles, responsibilities, and sector experiences. While most were UK-based, some had experience in Japan, Nigeria, and Europe. Initial expert selection was based on predefined criteria (see File S4, SET A), excluding years of experience as a sole indicator of expertise, since prior research shows it does not reliably reflect skill or judgment (Ericsson et al., 2018). Instead, we prioritised domain knowledge, contextual understanding, and reflective insights. Participants lacking these qualities during the interview were excluded from the final sample. Participant codes (e.g., E1) serve as anonymised identifiers, where ‘E’ denotes an expert. A complete list of participant codes, their profession, interview dates, and anonymised excerpts from the transcripts is available in the dataset.
Study deign
Our interview study employed an inductive approach to explore how experts interpret social media discourses and their needs for supportive tools. This allowed us to gather insights through pre-defined questions while allowing flexibility for emergent themes. The interview questions were divided into three parts. The first explored participants’ professional roles and workflows, including decision types, methods for analysing social media discourses, and workflow challenges. The second focused on their perceptions of the conceptual dashboard prototype, asking which features stood out and what was missing. The third focuses on practicality within experts’ workflows, inviting use case scenarios, potential barriers, and suggestions. Full question sets are provided in (see File S4, set B). All questions were open-ended, supplemented with prompts for clarity and coverage of key themes.
Procedure
The interview began with a brief introduction outlining the study goals and assuring participant confidentiality. Given the small sample size and focus on high-quality insights, a short demographic questionnaire was included to ensure diversity and contextualise perspectives. The interview comprised three stages. First, to establish a baseline, participants answered questions about their engagement with social media discourses in decision-making, current tools and methods, and their limitations (see File S4, set B: B1). Next, participants interacted with a working prototype of the DiscourseDash tool via a shared screen. Participants first explored the Overview page, followed by perception-focused questions regarding the design’s relevance and any missing elements relative to their workflow (see File S4, set B: B2). This process was repeated for the Detailed Analysis page to gather perception and relevance on DiscourseDash’s feature in providing in-depth discourse insights. Finally, participants reflected on their overall experience with DiscourseDash through examples of real-world use cases, adoption barriers, and integration considerations (see File S4, set B: B3). Participants received £20 Amazon vouchers for approximately 45 min of participation. Figure 10 illustrates the study design and procedure.
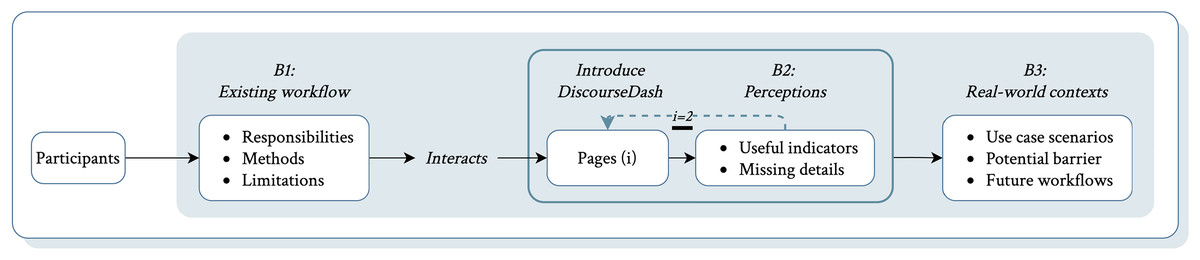
Figure 10: Overview of the study procedure in Phase 2.
The two key interactive pages are denoted as (i): when , this refers to the Overview Page; when , this refers to the Detailed Analysis Page.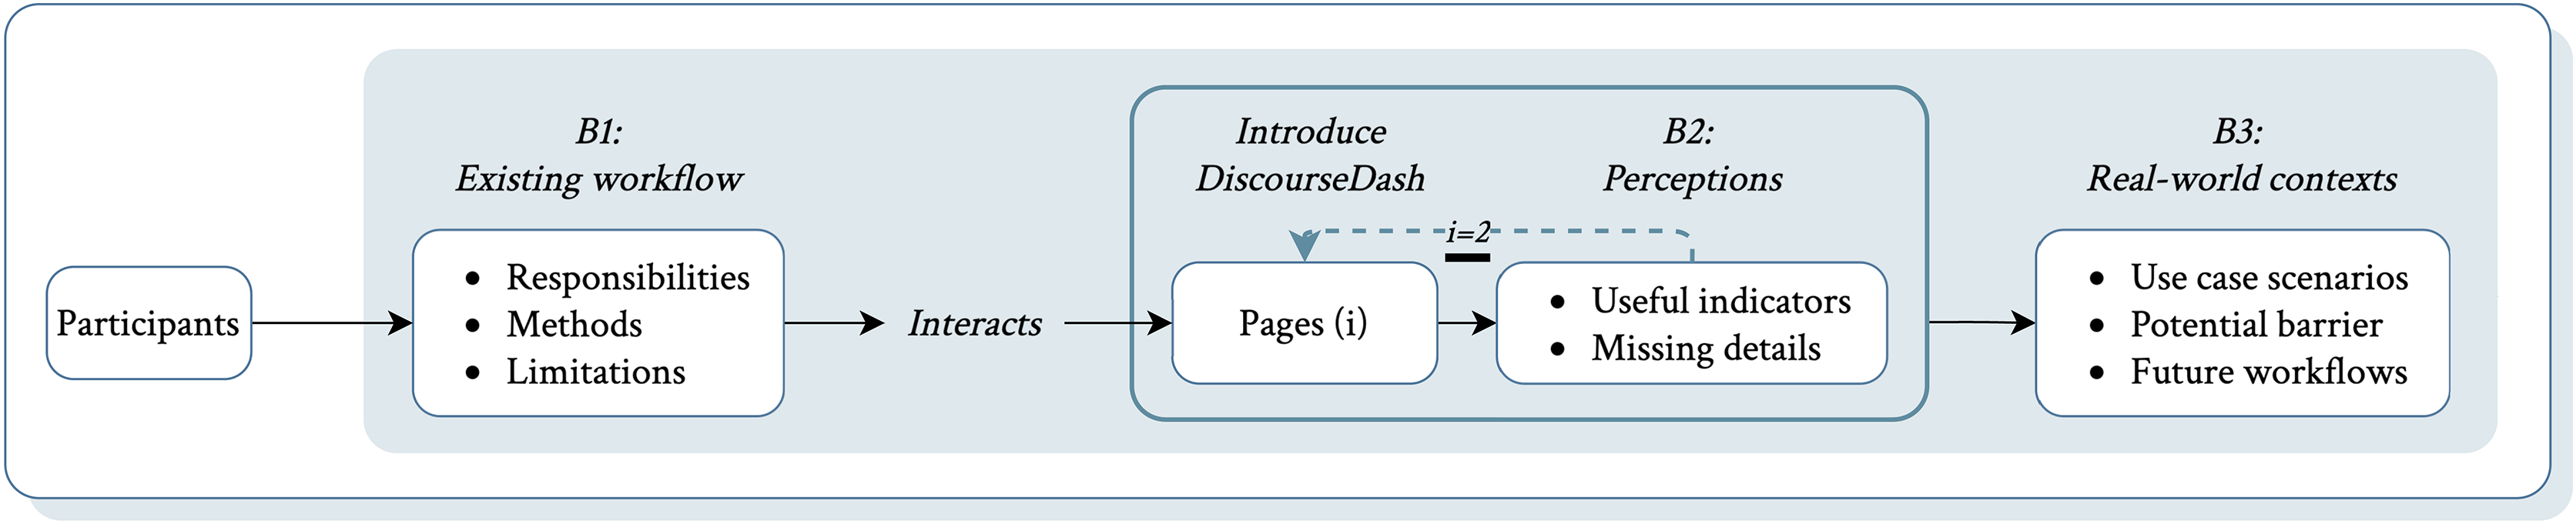
Data collection and analysis
All interviews were transcribed using Microsoft’s automated transcription service immediately after each session and manually reviewed for accuracy against the original audio. Relevant responses were extracted and organised according to interview questions, as reflected in the provided dataset. We applied the same thematic analysis approach as described above (See 14, Qualitative analysis), using inductive coding to structure the data by interview sections. Then, broader themes were developed through iterative team discussions to illustrate patterns aligned with our research objectives.
Results for phase 1: mixed-method study with general users
This section reports quantitative results from questionnaire ratings across conditions, followed by themes from the qualitative analysis. Together, they reveal user perceptions, feature usefulness, and areas for improvement.
Quantitative results
The following results are based on all responses collected from the Likert scale questionnaire after each interaction with a condition. The Wilcoxon Signed-Rank Test was chosen to compare ratings between two paired conditions by each participant, as it is suitable for non-parametric, non-normally distributed data. Additionally, we chose the Friedman Test to compare perceptions across multiple features, as it handles more than two related samples and is appropriate for ordinal data. All detailed questionnaire responses are provided in the dataset.
Comparative analysis of the ease of prioritisation
We conducted a Wilcoxon Signed-Rank test to compare the ease of identifying a topic between the Reddit baseline and DiscourseDash. The analysis revealed a Z statistic of and a p-value of . These results were statistically significant, suggesting that users perceive DiscourseDash as making it easier to prioritise topics for creating impact compared to the Reddit baseline.
Evaluating the perceptions of the usefulness of dashboard features
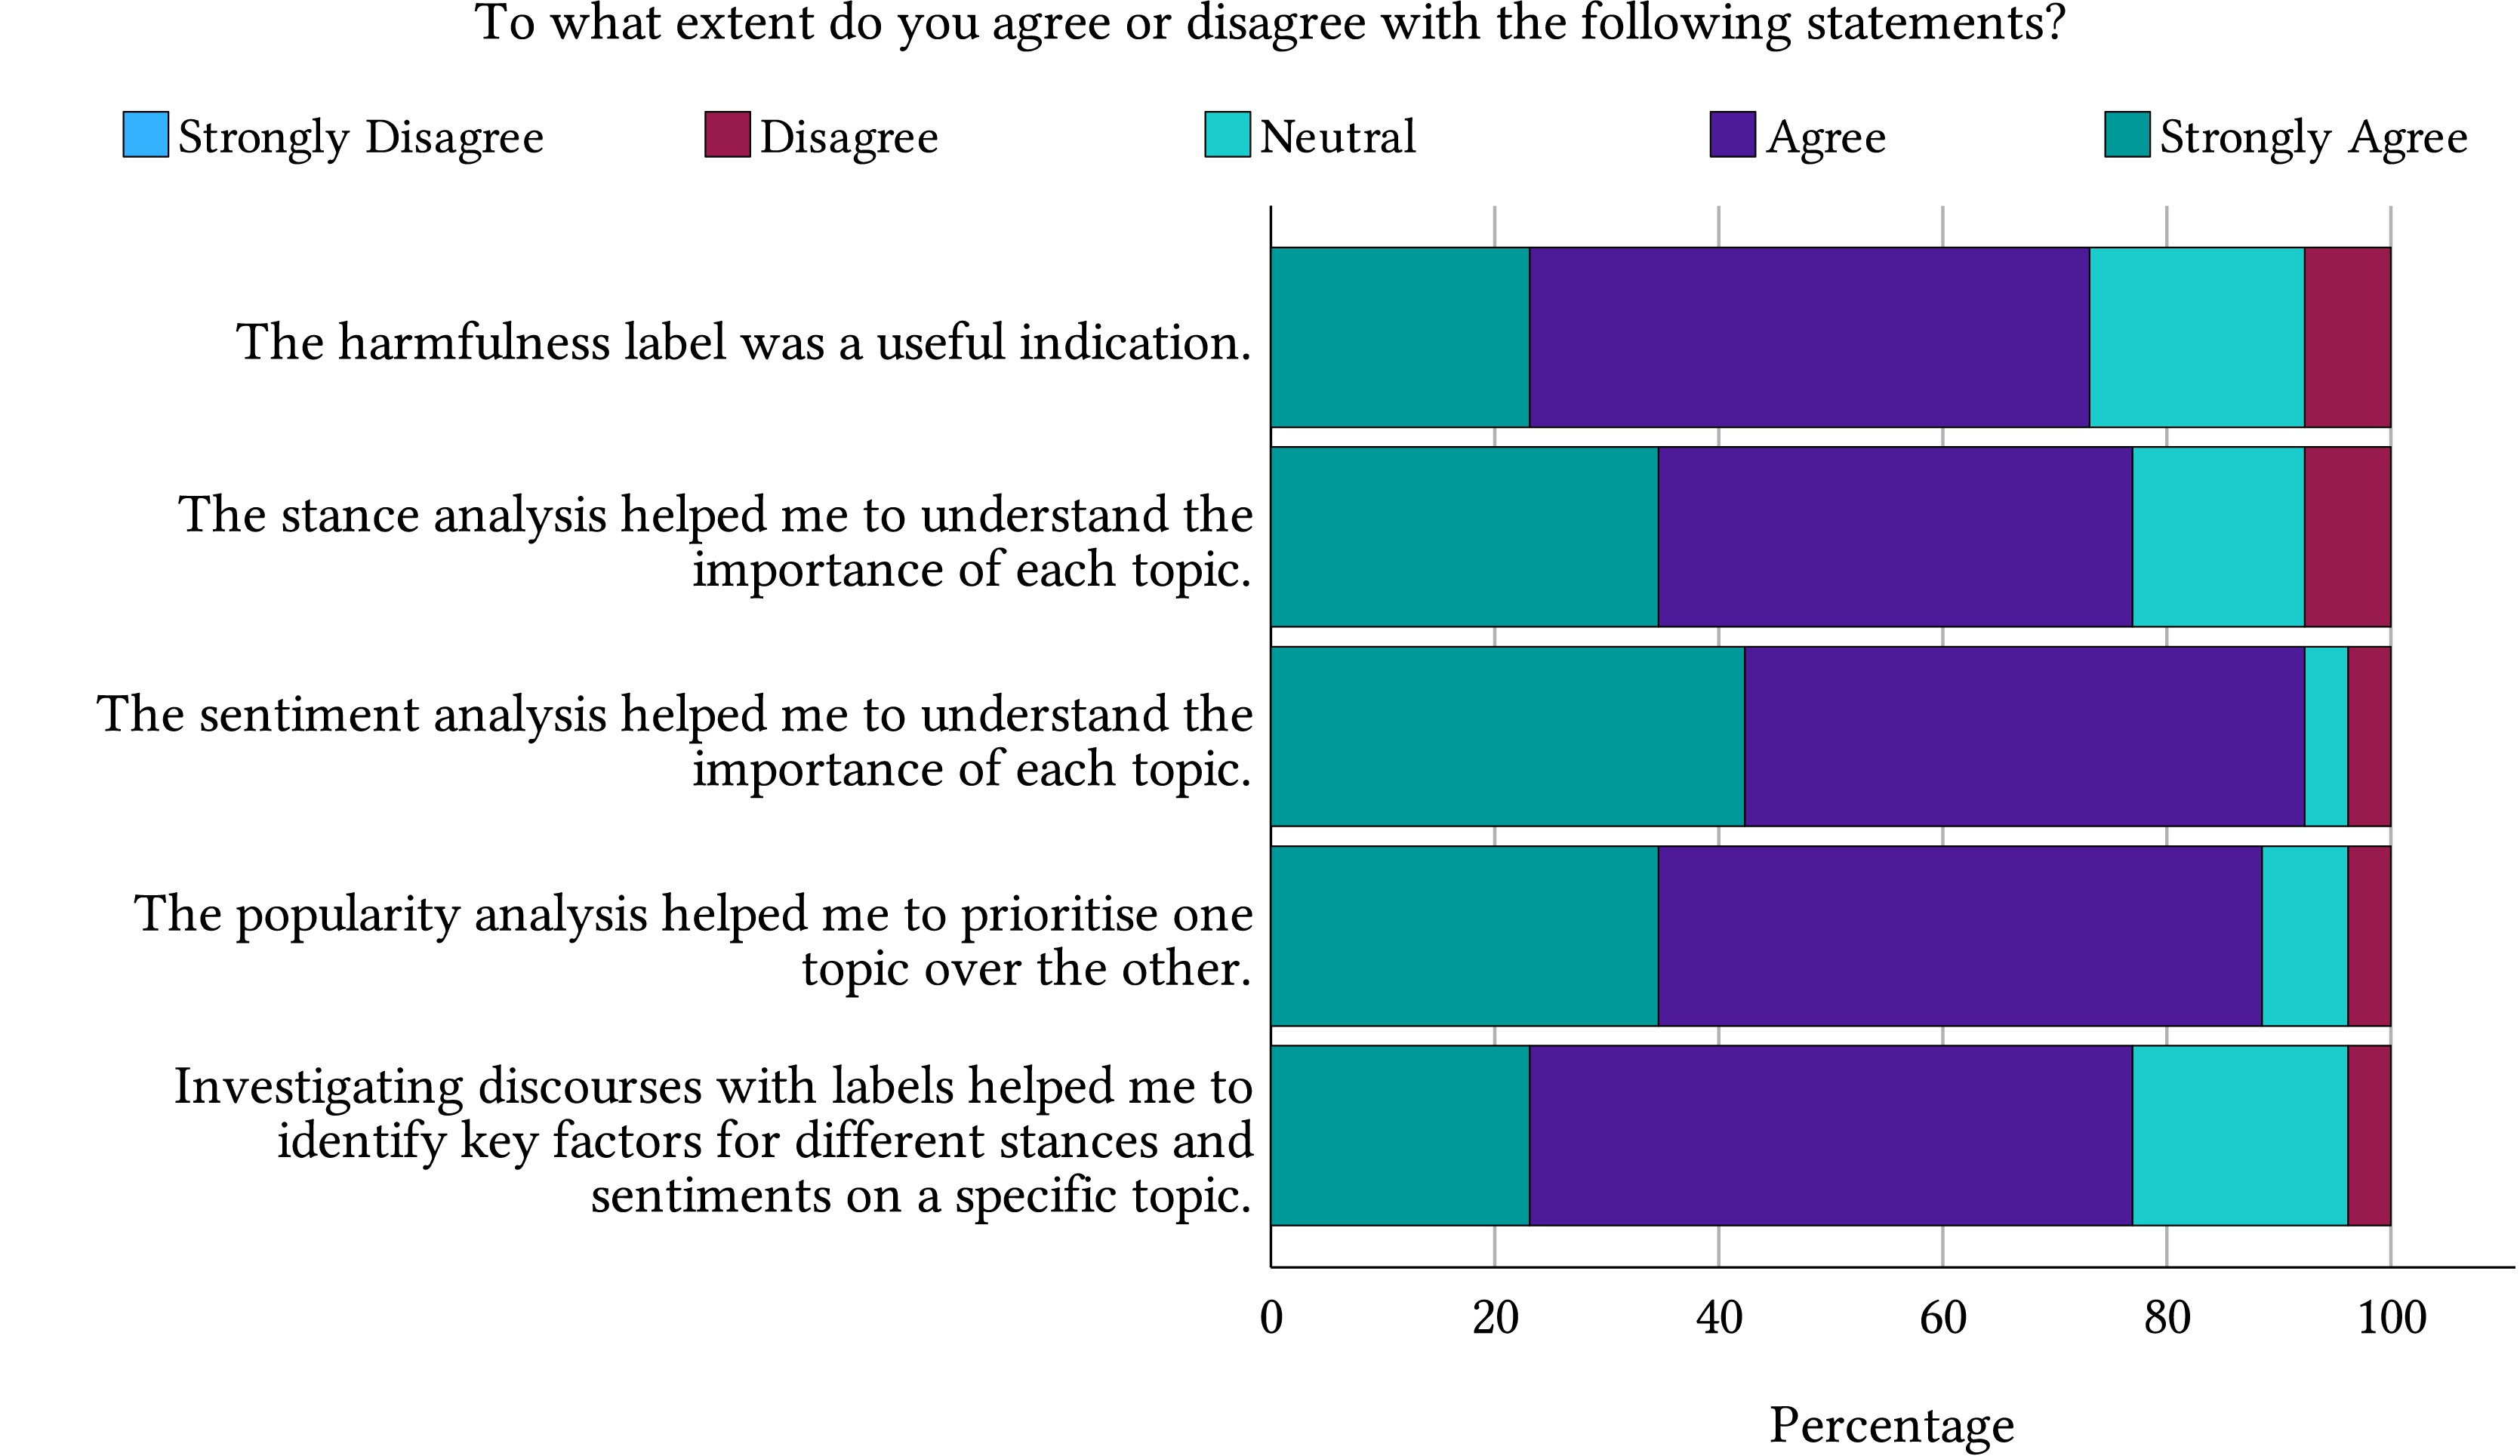
To illustrate the Likert scale agreement by participants, we present our results in a stacked bar chart (see Fig. 11). Observing the proportions of “Agree” and “Strongly Agree”, we can see that these categories occupy the majority, indicating the relevance of our proposed features in achieving decision-making tasks.
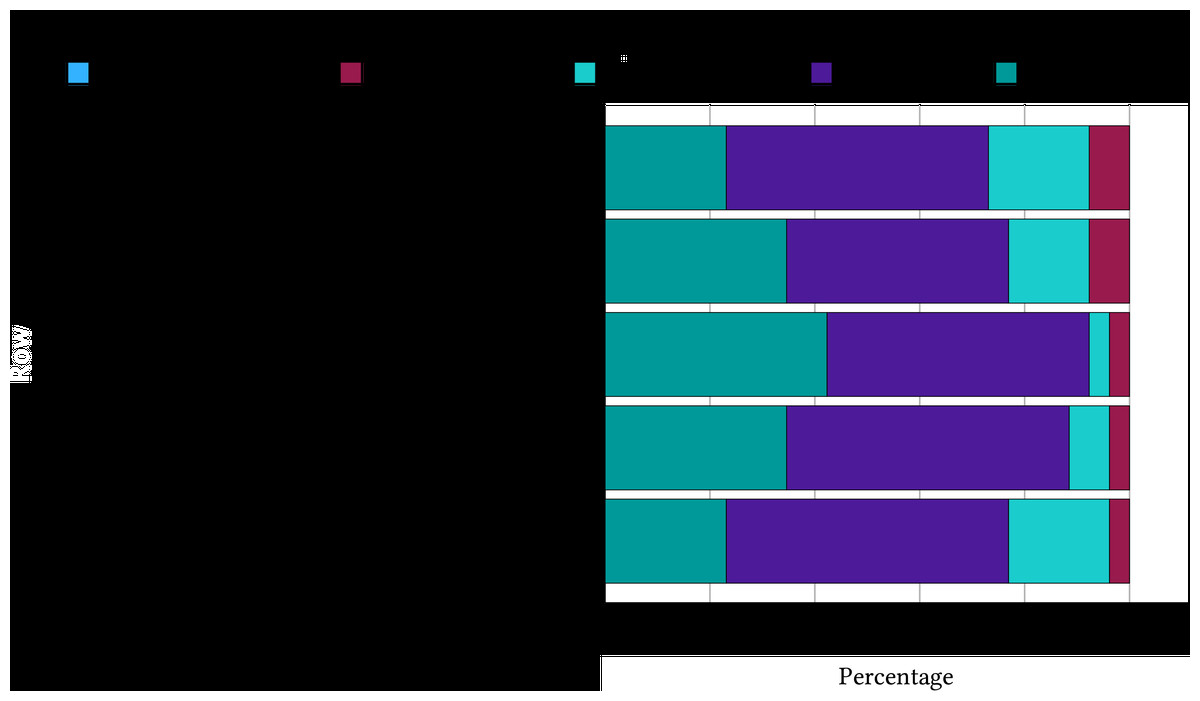
Figure 11: A stacked bar chart shows the proportion of responses from participants evaluating each feature.
Comparative analysis of the perceptions of the usefulness of dashboard features amongst participants
Additionally, a Friedman test was conducted to compare the participants’ perceptions of the usefulness of features. The features evaluated are the harmfulness label (M = 2.56), stance detection (M = 2.90), sentiment analysis (M = 3.40), popularity analysis (M = 3.25), and discourse investigation (M = 2.88). Although sentiment analysis received the highest mean rank, the test did not reveal a statistically significant difference in perceived usefulness among the features, , . This suggests that participants rated the usefulness of these features similarly, with no feature standing out as significantly more or less useful than the others.
Preliminary usability testing outcomes
DiscourseDash achieved a SUS score of 78.9, which is well above the commonly accepted usability benchmark. This suggests that participants found DiscourseDash to be usable and accessible. This result reflects positive user perceptions of the system’s ease of use and overall design suitability for achieving the tasks provided. These initial usability scores indicate that the design flow was sufficiently intuitive, demonstrating its appropriateness for evaluation in the next phase of the study.
Thematic analysis
We conducted a thematic analysis of the qualitative data, organising it into three subsections. Each subsection highlights key themes from participant perceptions, providing an understanding by contrasting their experiences across both conditions.
General user perceptions of DiscourseDash
Participants consistently preferred DiscourseDash over the baseline social media platform Reddit for the given tasks, citing its efficiency in consolidating extensive data into actionable insights. G26 highlighted that “This would make it easy to justify your thoughts… then you can tell him [your superior] how many thousands of people are interested in this [topic] right off the bat.” Similarly, G15 noted, “I’d say that was much more informative and easier to navigate through.” Another frequently mentioned reason for preferring DiscourseDash was its visual clarity and ease of use. G19 commented, “DiscourseDash gave us a clear overview of where you should focus on.”
The ability of DiscourseDash to quickly access and interpret large volumes of data allowed participants to make more informed decisions, which is especially valuable in contexts where decisions need justification. G25 explained, “The graphical representation and all of these graphs were telling me exactly the information required to [achieve tasks] and finding out what’s going on [in the discourse].” Another participant, G15, added, “[Reddit] gave me comments that I can read through, but I would see the statistics and graphs [from DiscourseDash] to make sure I make an informed decision. By doing that passively, I not only get information from all the comment sections, but I also get to read through the comments if needed.” These suggest that DiscourseDash is perceived as an effective means of providing objective analysis for informed decision-making.
Theme 1: Effectiveness in guiding a decision-making process. Participants found that DiscourseDash facilitated a more structured approach to decision-making by providing a “good overview” (G16) that “helps to boil down the overall topics that are being discussed” (G6). For example, G1 compared their experiences and mentioned that “it gave a better overview… whereas [Reddit] is not conducive for me to find out the most important viewpoints and topics that I [as fact checker] should be addressing.” Participants perceived this structured approach as beneficial in professional settings when decisions require concrete reasoning. Another advantage mentioned is time efficiency. As G10 mentioned “It’s much faster and easier to identify the for and against positions that are already categorised for me.” Correspondingly, G13 found the stance and sentiment summary provided in DiscourseDash “very useful”, allowing participants to promptly grasp public opinion.
Contrary to Reddit, participants highlighted the challenges they faced with the same tasks. G3 explained, “[In Reddit] it takes ages to find what I want to do, and if I want to determine sentiments, I need to check these replies manually.” G19 shared a similar thought “ It’s like I need to read, for example, thousands of comments […] to get an idea [from Reddit] while the analysis here [dashboard] saves a lot of time […].” G23 added, “In Reddit, I have to like maybe read the comment twice to understand the sentiments and stances.” G6 pointed out that “if you want to do this work properly, you need a tool to help you […]. Maybe a ready dashboard […] there’s too much information [on Reddit] that is too hard to see the big picture.” Overall, DiscourseDash was perceived as more efficient and effective than manually navigating through large volumes of unstructured data.
Theme 2: Guidance towards articulation of ideas. Participants highlighted how DiscourseDash facilitates understanding of discourse by revealing ideas, correlations, and trends. For example, G15 articulated their view that “The discussion is high on the first topic, which states that there is some confusion or statements made without proper facts being spread […]. Here [stance and sentiment analysis] clearly states that they are contradictory opinions, and that’s not being resolved.” Similarly, popularity was useful in revealing correlations between different topics of discourse. For example, G16 articulated their understanding of the interconnected trends across various topics, noting that “whenever there’s a spike in topic one, there’s a spike in topic three as well. This [particular topic] is also interesting because it follows a correlation with these [two other topics].”
Another example illustrates the interpretation of some ideas around the discourse by G2, “[…] at the same time they are talking about the second dose, they are also talking about side effects, with [negative sentiments towards it] […] they don’t like vaccines and very few of them are thankful for all the work done [for vaccines] so far.” Another key observation, G7 illustrated how the data trends in DiscourseDash stimulated curiosity “I tend to [want to find out] what happened around that time [a decrease in popularity]. What kind of event might have occurred at that point?” These analyses demonstrated how DiscourseDash supports and guides a user’s thought process.
An example of how stance and sentiment analysis shape participants’ ideas, G18 concluded their thoughts that “What I can make out is that people are happier in taking a vaccine rather than not taking it […] because from both the graphs [stance and sentiment], […] the number of positive is more and here the favour is more than against.” While the harmfulness label was interpreted as “high rating of harmfulness is probably more important” (G10). Adding to that, G17 “feel harmfulness also determines newsworthiness […] So I’m leaning [my decision] towards the first two [topics labelled as high harmfulness].” Instead of the term harmfulness, G18 “would rather it be a saying impact, but I guess it denotes the negative sense of these topics.” These observations highlight how the harmfulness label was used and interpreted throughout the decision-making process.
Finally, the Detailed Analysis facilitated participants in formulating ideas about the factors influencing different stances. For example, G15 articulated their understanding that “there are some people who want to take the vaccine, they show negative sentiment […] because of limited supply and they feel insecure as they are the essential workers, […] people who have a neutral stance and sentiment, they are not exactly sure how the vaccination works and how it helps.” Another informed idea articulated by G25 is “a lot of people are asking how the government is going to [take action towards the vaccine], […] there’s a lot of confusion.” Consequently, most participants expressed similar ideas when concluding their investigation.
Theme 3: Supporting trust through detailed discourse-level analysis. Several participants expressed initial scepticism toward the overview page due to limited transparency. For instance, G6 remarked, “I have to blindly trust this classification […] I have no idea what data this has been generated on.” Similarly, G26 asked, “Where are the sources from?” However, after exploring the Detailed analysis page, G6 noted, “I do have access to the data […] this addresses what I criticised [previously]”. This shift illustrates how access to underlying discourse-level data can improve perceived explainability and trust.
Another key observation highlighting how Detailed analysis facilitated the investigative tasks is evident in G26’s experience. They initially described having difficulty distinguishing between stance and sentiment. However, they noted that examining examples in the discourses helped them better understand these concepts, highlighting the value of this feature in clarifying their meaning. They expressed that their understanding of stance and sentiment, and their correlation, was “not very clear until I toggled around.” After reviewing several “different combinations and permutations [of stance and sentiment pairs]” in the discourse, G26 understood the correlation better. This suggests that while the overview page provides a high-level summary, examining the detailed data in the discourses is necessary to understand the complexities behind these summaries.
Theme 4: Concerns about analysis measures. A common concern raised during the study was the disagreement participants experienced between their manual inspection of the data and the labels provided on DiscourseDash. For example, G16 pointed out that DiscourseDash “incorrectly marked some sentiments” indicating perceived inaccuracies in the sentiment classification. Similarly, G6 stated that “when I dig into the data, which I think is important that I have the option to, I very quickly identify several [labels] for me don’t match up [with own judgement], […] which reduces the reliability of what I saw in overview.” These observations suggest that improving transparency in the labelling process is necessary to enhance trust and confidence in the system’s outputs.
Usefulness of features in influencing decisions
Here, we grouped the features mentioned by participants during their interactions to show how they evaluated each feature’s usefulness when performing tasks on DiscourseDash.
Theme 1: Effectiveness of harmfulness labels. Harmfulness labels were indicated as helpful in guiding the prioritisation of topics that were both widely discussed and deemed significant due to their potential impact. For example, G16 noted that “the harmfulness is quite high. So I’m leaning towards like the first two.” Similarly, G17 articulated that “harmfulness also determines newsworthiness, so it might be important to [prioritise] more harmful news.” They recognised that higher harmfulness signifies more pressing issues that deserve greater attention in decision-making. However, some participants expressed confusion about the interpretation of harmfulness levels. For example, G22 pointed out that “I don’t understand what the high harmfulness means […]” though they still interpreted that “if the harmfulness is high, then it is important.”
Theme 2: Roles of stance and sentiment analysis. The analysis of varying stances and sentiments reveals how these factors can influence the perceived importance of a topic. For example, G19 mentioned that “although people talked about it [the topic] a lot [from the stance detection], not a lot of people have a clear opinion on that [topic]. So, that might [warrant] a discussion in the article [as a fact checker to address it].” This example shows that the presence of diverse opinions signals to users to explore the discourse more thoroughly. Additionally, G26 observed that stance detection helps to correlate public sentiment, stating “we can tell that not many people are just singing to the choir; the public seems to agree on this [topic] but may have more questions about it.” This indicates areas of both agreement and contention, suggesting topics that may benefit from further investigation. G22 mentioned, “I think for me the stances and sentiments help shape which [topic of discourse] is important […] because if you have [a contrasting opinion like against a topic] it enriches the discussion and it’s more exciting [to investigate].”
Theme 3: Use of popularity over time. Participants leveraged popularity over time to connect shifts in interest with specific events. For example, G19 observed, “Especially here [spike in the graph] you can see some different changes, which might correspond to specific events like news that happened at that moment.” The potential application of popularity for future content planning by fact-checkers was also noted. G26 noted “comparing these [topics], although there is a decreasing amount of interest in the general vaccine, […] maybe a follow-up article like what might inform my work [as a fact checker] next would be about the second dose, which is the next trending topic [observed from the trends].” This shows how tracking popularity trends prepares decisions for interventions as a fact-checker. Besides, G07 mentioned the longitudinal aspect of popularity data commenting, “[during] the investigation, focusing on specific points like maybe this part [decrease in engagement trend] would be interesting to see what kind of events happened.” Overall, “although [a topic] is less popular than [another] topic” the popularity graph helped participants determine that “it’s rising in importance” based on the emerging relevance.
Results for phase 2: interview study with industry experts
This section presents qualitative findings from Phase 2 interviews with industry experts. A thematic analysis of expert response summaries identified recurring themes, highlighting shared insights and perspectives. These themes reveal how experts perceive DiscourseDash, its alignment with workflows, and considerations for future design.
Thematic analysis
Findings are organised around the structure of the interview: interactions with DiscourseDash before, during, and after use. This structure supports a systematic presentation of themes to our research questions, with each section reflecting insights relevant to that stage. Themes are presented in a mixed format based on their proportion of contribution: tables are used for brevity; long-form paragraphs offer more evidence that directly addresses the research questions (consistent with Phase 1); and bullet points provide concise yet elaborated information to enhance readability. This approach balances clarity with space efficiency. Additional details are available in the dataset.
Understanding existing workflows before we introduce DiscourseDash
This section demonstrates how experts engage with social media discourses—their roles, workflows, tools, and challenges to set the scene for the next results section.
Theme 1: Usage of social media discourses in decision-making contexts. This theme contextualises how experts engage with social media discourses in their day-to-day decision-making. Practices from their domains show how understanding discourses is interconnected within their organisational workflows and priorities. This means that they influence both high-level strategies and immediate responses (see Table 3).
| Sub-themes | Description |
|---|---|
| Integrating insights into strategic coordination | Supports both long-term strategy and immediate response by turning discourse data into reports that align team efforts and inform decisions. |
| Understanding audiences for public communication | Awareness of audience perspectives and platform dynamics helps tailor messaging, build trust, and sustain engagement. |
| Responding to crisis and misinformation | Experts monitor discourses to act quickly during crises, applying cultural sensitivity, detecting issues early, and preventing harm. |
| Using public signals for reporting and policy | Social media signals support evidence-based reporting for government, emergency response, and internal policy planning. |
Theme 2: Guiding factors in decision-making. Experts described workflows from data aggregation and analysis to planning and management, highlighting factors from social media discourses that guide decisions. We identified three consistent patterns: (1) data-driven indicators, including measurable metrics and observable patterns; (2) interpretive insights, involving subjective assessments and qualitative readings; and (3) situational/contextual dependence, where decisions are shaped by organisational goals, stakeholder expectations, or broader events (see Table 4).
| Sub-themes | Description |
|---|---|
| Data-driven indicators in practice | Experts use metrics such as engagement rates, follower growth, reach, and content performance to plan and assess strategies. They also consider demographics (age, gender, profession) to tailor messages for specific audiences. |
| Interpreting insights from social media discourses | Experts analyse sentiment, tone, and keywords to gauge public opinion and track emerging topics. For example, E10 monitors sentiment changes to update responses, while E11 uses these signals to combat misinformation with culturally sensitive approaches. |
| Situational and contextual dependence | Experts view social media as one part of a larger process, combining it with surveys, interviews, or fieldwork for a richer understanding. Some prefer controlled studies for reliability, while others value anonymised interviews in sensitive contexts. |
Theme 3: Navigating social media discourses. Experts tasked with interpreting social media discourses face challenges not only in data collection but also in making sense of this rapid, extensive, and often ambiguous information. We summarise how they navigate this space, extracting transferable insights relevant to their decision-making workflows. Our findings identify two approaches: (1) manual exploration and (2) automated analysis. These approaches are used independently or in combination, depending on the needs (see Table 5).
| Sub-themes | Description |
|---|---|
| Manual exploration | Experts typically begin with social media features such as trending topics, hashtags, and keywords to filter relevant discourses, followed by manual review to extract insights that guide interpretation. |
| Adopting automated or software tools | Used for handling large-scale or time-sensitive data. These include: AI tools for categorisation, summarisation, and sentiment analysis; social media monitoring/listening tools for managing accounts, tracking engagement, mentions, and sentiment; and data analytics software for detailed data structuring, management, and visualisation tailored to domain-specific needs. |
Theme 4: Limitations of current approaches in workflows. This section summarises key limitations experts identified in their current methods for navigating and analysing social media discourse, informing how the design of DisocurseDash addresses these challenges and highlighting the need for improved tools across workflows (see Table 6).
| Sub-themes | Description |
|---|---|
| Data-related issues | Data overload (E4), feeling overwhelmed (E1), and time-consuming qualitative analysis (E9). Metrics can be misleading, as trending posts may gain attention for negative reasons, complicating the identification of genuinely positive engagement. This often requires extensive human correction due to discrepancies and inconsistent results across different tools (E6). |
| Capabilities concerns | Lack of predictive capabilities for proactive insights (E7) and limited platform integration. Real-time data collection is often absent, delaying early issue detection and response. |
| Lack of in-depth qualitative analysis | Current tools mainly focus on numerical or statistical metrics, lacking contextual understanding of issue origins. Experts need to investigate comments to track causes of negative virality beyond sentiment statistics (E5). Such qualitative analysis provides richer insights, especially for less frequent but contextually significant topics (E9). |
| Accessibility | Challenges related to cost and learning barriers. Increasing restrictions and paid access, such as the discontinuation of free APIs, hinder usage (E10). Inclusivity concerns include accommodating multiple languages and cultural contexts (E9). |
| Trust and ethics in AI | Concerns about transparency, bias, privacy, and ethical implications of AI tools in sensitive domains. Experts hesitate to fully trust AI systems due to unclear training processes and potential data privacy risks. |
Perceptions during experts’ interactions with DiscourseDash
Building on the analysis of experts’ workflows, this section explores their perceptions of DiscourseDash. We examine how DiscourseDash aligns with their practices, supports their analysis and decision-making, and identifies opportunities to enhance social media discourse interpretation.
Theme 1: Supports the balancing of time and effort to allocate priorities. The overview page was described as helping experts make split-second decisions about which issues required immediate attention (E6). Experts emphasised prioritising social media topics based on their potential harm, especially regarding brand damage or public response. The ability to identify and act on harmful content was important for timely and effective decision-making. E5 illustrated how a harmfulness indicator can support resource allocation across issues of varying severity:
“The more harmful ones might bring down your brand very fast […] so when making decisions, we prioritise those with high impact first, and the ones with low to medium effect come after. We can’t prioritise [topics] that are less likely to have a harmful effect on the brand.”
This illustrates how the harmfulness indicator actively supports operational decision-making for risk management, prioritisation, and balancing resources. Even when harmful topics lack immediate solutions, experts noted they can still be prioritised due to their potential to escalate quickly. This allows organisations to balance resources between urgent threats and less harmful, manageable topics. They also mentioned the importance of an overview of a topic’s popularity and temporal dynamics to help determine relevancy and response strategies. These features could support experts in distinguishing short-term attention spikes from longer discourses that may signal more serious or lasting public concerns. E4 described how understanding a topic’s virality can guide prioritisation by revealing its current and potential reach:
“It’s important to know what is in virality at the moment […] to know the range OK, is it just a temporary thing? Is it something that has been going on, getting more audience over time, or is it just […] a momentary buzz? After knowing that, whatever is trending becomes very important.”
This showed how tracking the momentum of virality helps experts decide if a topic needs immediate action or further monitoring. Similarly, E3 highlighted topic longevity as an indicator of importance and engagement:
“If the topic is well spoken about, definitely we’ll have to check the time at which people have been talking about it. Some topics just come, and in 10 min they’re out […] but topics that last for days, those are the ones we check out.”
Experts saw this feature as useful for filtering noise and focusing on persistent topics that may signal long-term risks. These features were perceived as valuable for helping experts strategically allocate attention and resources to high-priority issues.
Theme 2: Monitoring public discourses supports targeted interventions. Experts noted that DiscourseDash helps monitor social media discourses for timely decisions and adjusting interventions. E1 highlighted the importance of public stance over personal opinion: “It’s people’s opinion that matters, not mine.” Similarly, E4 described how sentiment analysis supports decision-making by revealing public preference: “[It] helps to know how people are leaning towards whatever is going on. What decisions are they making?” Building on this, E7 explained how employee discussions, such as debates on remote work, can shape internal strategies and workplace policies: “If there’s a heated argument about work hours in the corporate setting, we’ll align workplace strategies and policies accordingly, redesign workflows, and adjust benefits.”
DiscourseDash was also valued for tracking sentiment changes and evolving narratives for timely interventions. E2, a public health expert, explained how DiscourseDash helps anticipate responses to vaccination campaigns by analysing discourse across key demographic groups before and after announcements: “Before the second dose information was public, I would search the media for narratives and sentiment, then trace the same keywords to see how they change over time.” They further explained how this process would unfold through different stages of the campaign:
“From the time before the second dose information was released, I had already monitored public discussions. Once the information became public, I observed how anti-vaccine groups introduced their narratives and how various age groups or community segments reacted. I continued tracking this over time, during the rollout and afterwards, to understand how narratives and sentiments evolved within specific demographic groups.”
This demonstrates how the expert’s workflow aligns with our design concept of monitoring narratives and sentiment, and informs effective public health messaging strategies that address emerging concerns or misconceptions. They noted that this type of analysis supports both immediate responses and long-term planning:
“Based on [monitoring trends], it is possible to create interventions for current goals. But it’s also important for the next time, for future doses or other vaccines. How do we prepare communities, especially vulnerable ones, to accept the doses? Or maintain a positive response? If one community responds well, there’s an opportunity to study what makes them different. Is the sentiment in their media bubble more supportive?”
By tracing the success of initial interventions, experts can better prepare for future events and tailor responses to specific demographic groups. Beyond public health, some noted how harm assessment could support strategic communication. For instance, E6, a marketing expert, explained: “I’ll be able to determine how to mitigate the harmfulness of the content and make sure I’m marketing to the right people. Because if you’re marketing to the wrong people, it can increase the harmfulness of the post.”
Theme 3: Re-emphasis on the need for tools to provide quantitative aspects beyond statistical visuals. A key finding was the experts’ consistent need to go beyond summary metrics and access the actual discourses driving public responses. This occurred even before participants interacted with the Detailed analysis page in DiscourseDash, which supports deeper exploration of filtered discourses. This emphasis on qualitative analysis validates our design decision in DiscourseDash that underscores a broader gap in existing analytic tools. As E7 put it, while visual data distributions were expected, the real challenge lies in bridging qualitative insights with quantitative measures: “there’s a need for us to translate qualitative data into measurable terms.”
We observed a similar pattern when experts described the limitations of their current workflows. They often noted that high-level statistical indicators are only useful to a point. To truly understand public sentiment, they need to trace these metrics back to the underlying conversations. As E1 explained: “You have to understand if you’re actually doing better this week or you’re not doing so well. You have to know the cause. This would help you strategise your next move.” Similarly, E5 stressed that identifying general trends is not enough: “We need something specific […] we need to put ourselves in their shoes, so we need to get exactly what the problem is.” E8 further explained how qualitative analysis fits into their workflow: “After the employer has […] looked through the charts, looked through the engagement and all that, the person wants to read why people don’t like this particular service.”
These insights reveal the complexity of how experts interpret social media discourses, not only through metrics but by understanding narrative shifts and contextual factors. Current tools prioritise computational scale over human interpretation, which leaves a gap in addressing the need to encourage human collaboration in questioning and refining automated outputs rather than relying on them. DiscourseDash was designed to investigate whether it helps bridge this gap by supporting qualitative insights. In the next theme, we examine how experts perceived and aligned the detailed analysis of discourses with their existing workflows. We investigate whether features like topic selection, discourse filtering, and labelled stances and sentiments helped them contextualise proposed metrics and better understand public responses.
Theme 4: The conceptual idea to provide a detailed analysis of discourses aligns with expert practices. The ability to investigate not just what is happening in public discourse but also why remains a key limitation in many current analytical tools. Before introducing DiscourseDash’s discourse-layered features, experts consistently highlighted the need for deeper qualitative insights to help contextualise the patterns shown in visual analytics. This need directly informed our design and reinforces its relevance. After being introduced to the Detailed analysis page, experts noted that it aligned with their existing practices and addressed previous limitations. For example, E1 described how access to actual social media conversations, combined with structured sentiment and stance labels, supported their interpretation efforts:
“Having to know words, months, people talk more about the product and the reason why it’s trending and also why people talk negatively about it […] kind of gives you a heads up to know what’s coming […] and I can choose to know why people go against the product and how many percent of the people going against the product.”
Here, unfolding analysis on a discourse level becomes a means of rationalising decisions, allowing experts to stay ahead of emerging risks. E2 expanded on this by explaining how the combination of stance and sentiment helps them better understand public responses:
“[It] would really work well because […] it gives you a first-hand degree of information about these topics. You know, involving the intensity of these emotions and understanding our public opinion and sentiments.”
These granular details, reflecting the fast-moving and emotional nature of discourses, were perceived as highly relevant for staying aware of the depth of feeling in different situations. Additionally, E5 directly highlighted how this kind of discourse analysis is missing from their current workflow:
“I was talking about the discourse earlier because I haven’t even seen it before […] we need to get to the root of the problem. We need to read what people are saying, their experiences, their concerns.”
For these experts, it’s important to unfold public voices to make sense of trends, controversies, or misinformation. Similarly, E6 discussed how replies alongside stance and sentiment indicators enabled a more elaborate examination:
“If something is very harmful, I want to understand what people meant by that, I want to see the replies, I want to see their stance […] analysing those replies helps us understand if more [on why] people are ‘for’ or ‘against’ the product. That knowledge helps us get better at delivering to customers.”
These signals were valued for providing evidence of real-world impact and public investment on a topic. Beyond reactive monitoring, experts picture using it for strategic applications. E4 reflected on how these discourse-level analyses could inform long-term planning:
“We can [use this feature to] shape a general view of how people are thinking […] and we can redefine our products and services to better align with their readiness.”
Here, DiscourseDash was perceived as supporting experts in forecasting what might come next and preparing for it. They gave examples from trade policy and climate initiatives to show how DiscourseDash could help anticipate future developments and inform strategic planning. In healthcare, experts noted that understanding public beliefs, hesitations, and motivations is key to designing effective interventions. As E8 reflected on the importance of presenting these justifications through detailed analysis:
“These are people’s opinions. These are people’s thoughts. It’s important for those providing services to know what people think about what they want to present […] What are the fears, the sentiments, reasons why they do or don’t engage.”
Rather than relying only on abstract metrics, experts valued tools that help reveal public concerns and experiences. They also noted that this deeper understanding supports shaping responsive actions. As E11 explained that sentiment analysis within discourses can directly support timely decision-making:
“Having seen this, this is how we will strategise […] If the sentiment distribution is highly negative, we restart the system […] we can bring in some interventions to get people to accept [vaccines].”
In these demonstrations, qualitative insights functioned as inputs to human efforts in investigation and planning. Across domains, experts valued the distinct concept of DiscourseDash for supporting their reasoning and investigative judgment.
Theme 5: Misalignments with existing analytical practices. Experts consistently highlighted missing key features essential to their daily workflows, revealing gaps in our initial design that are crucial for aligning with established practices. Addressing these misalignments will guide iterative refinement to better fit real-world organisational needs and sociotechnical contexts.
A frequently raised gap was the ability to filter demographics of analysed discourses. Targeted demographic details—such as age, location, language, and behaviour are central for tailoring strategies and contextualising sentiment. For example, healthcare experts emphasised segmentation to design interventions for specific audiences. E10 explained: “It would be nice to filter by, say, 30–45-year-old mothers in [country] […] so I could create specific reports and track changes over time for preparedness and response.” Experts also noted the absence of hashtag analysis, which is important for monitoring trends since hashtags often serve as entry points to discourses.
Experts described current sentiment analysis as too simplistic for decision-making. Instead of just positive, negative, or neutral categories, they needed richer insights into emotional intensity. E2 used an analogy: “Imagine giving a child a biscuit. If the child doesn’t want the biscuit and is forced to take it, that’s not the same as the child eagerly accepting the biscuit.” This analogy illustrates the importance of understanding whether someone’s emotion or reaction is genuine. To measure this, the expert suggests using a graph to visualise the intensity of emotions. For example, a graph could show that 70 percent of people strongly support an idea, while 20 percent only somewhat support it, allowing for a more accurate understanding of how deeply people feel about the topic.
Similarly, E7 noted that they: “need to understand the degree of how much people are engaged, how strong the negativity is. That helps us dig into the intensity of how people feel about certain things.” For example, adding a “confused” category to capture people who are undecided or unsure, which is crucial in public health contexts like vaccine uptake (E8). Tracking sentiment over time was also emphasised as crucial for responsive interventions. E10 noted: “Without that information, you can’t build any future response or interventions because you don’t know the changes [of sentiments] over time.”
Experts also called for better contextual and cultural relevance. Large data volumes are less useful without alignment to specific decision contexts. Filters and indicators need to be context-aware, especially for regions with diverse dialects or sensitive cultural environments. Some research experts preferred manual, qualitative interpretation over automated tools, arguing that qualitative categories must emerge through human evaluation. E9 explained: “ Every research is different and depends on the cultural context that is very specific […] We have had to make the categories [analysis aspects] ourselves […] these kinds of tools cannot give you that flexibility.” This reflects a broader gap in the current analytical tools’ ability to support experts conducting targeted or high-stakes social media analysis.
Reflecting on the real-world applicability of DiscourseDash
We summarise experts’ overall reflections after using DiscourseDash, offering insights to guide its integration into real-world workflows.
Theme 1: Practical applications identified by experts. Experts noted how DiscourseDash could support their or their organisation’s decision-making by fitting into existing workflows for monitoring discourses, informing strategies, and responding to emerging issues.
Sub-theme 1: Monitoring real-time discussions. Experts emphasised DiscourseDash’s value in unfolding emerging discourses and reducing manual effort across platforms. This supports early detection of sentiment shifts and discourse attention for preventative actions before narratives spread. For brand or campaign monitoring, DiscourseDash was viewed as a diagnostic tool providing signals for timely, effective responses. As E6 described:
“[I] need to know why people are talking [negatively] about [my brand], so if we realise it’s the price, that way we can try to [fix it quickly]. If you don’t know exactly the problem, it’s gonna take a longer time before it comes to a solution. So the [dashboard] is gonna help us get to the root of the problem, help us find the starting point to solve these problems.”
These reflections showed experts viewed DiscourseDash as supporting strategic analysis, moving beyond statistical monitoring to understanding drivers behind public discourses. Assessing whether trends are relevant or spreading across platforms was fundamental to gauging response scale and urgency. In journalism and media planning, experts envisioned using DiscourseDash to align content strategies with real-time public attention. E4 described:
“So I put up the date [to compare] pre-Grammy to after Grammy […] it gives me the summary and brings out the keywords […] the sentiment if it’s +1 the charts will show this particular reading […] I get to know the number of people engaging with that particular topic at a particular set time, it just makes life easy for me.”
Rather than relying on assumptions about audience interest, experts perceived DiscourseDash as guidance for navigating discourses with clearer context and understanding. Across domains, they noted how it identifies when discourses start, gain momentum, and why public attention shifts—insights valuable for staying informed and making rapid decisions in fast-paced settings.
Sub-theme 2: Informed decision-making for planning and evaluation. Experts highlighted that DiscourseDash supports ongoing planning and evaluation throughout an intervention, not just initial decisions. It enables a flexible process to refine actions as public narratives shift, especially important when sentiment impacts outcomes. For example, E10 described using DiscourseDash across different health intervention phases:
“It’s helpful for monitoring and evaluation of [health] interventions, which allows scaling up or scaling down depending on the needs as you go. After the intervention, it helps to reflect and create preparedness plans for future interventions in the same context, for vaccines or flooding.”
Discourse insights were valued not only for real-time response but also for learning and preparing for future scenarios. Rather than relying on traditional reports or surveys, DiscourseDash offers immediate indicators of public reactions. Similarly, E6 emphasised how analysing public discourse can help refine product development:
“When a new product was launched […] we wanted to know, read their feedback […] [with this] we’re able to determine how to improve the product.”
These reflections suggest experts view DiscourseDash as a method to monitor real-time impacts, guide adjustments, and inform future strategies. Rather than waiting for formal feedback like surveys, sales data, or delayed reports, DiscourseDash provides timely insights into public signals. This supports evidence-based decisions grounded in ongoing discourse, enhancing workflows for both immediate action and post-implementation reflection.
Sub-theme 3: Managing crises and reputation risks. Experts highlighted DiscourseDash’s value during crises such as public opinion shifts, misinformation, or reputational damage. Quickly identifying the core issue was crucial for timely responses. DiscourseDash provides a structured and efficient alternative to current workflows. As E4 explained: “in crisis management […] when you know what the issue is specifically, it should be easy to turn things around.” They further explained how the visualisation and sentiment indicators enable faster problem diagnosis to support response coordination:
“[Knowing that there is damaging] information about my brand that’s going on, I’ll use it [DiscourseDash] to understand the sentiment of the audience […] it would help in making decisions [according to] response protocol and there’s like a graph to back it up showing the range, so it’s very explicit and it makes things easy to comprehend.”
DiscourseDash helped navigate overwhelming discussions by providing a structured overview of concerns for quicker identification of root causes and targeted actions. For example, E5 explained how it could pinpoint a specific problem during a product backlash:
“[I] need to know why people are talking [negatively] about [my brand], so [for example] if we realise it’s the price, that way we can try to [fix it quickly]. If you don’t know exactly the problem, it’s going to take longer to find a solution. So the [dashboard] is gonna help us get to the root of the problem, help us find the starting point to solve these problems.”
These reflections indicate the potential for a timely understanding of the ‘why’ behind negative public reactions or emerging narratives, which experts valued more than merely detecting issues like sentiment shifts. In crises, fast decision-making impacts outcomes, so DiscourseDash’s support in navigating social media to identify root causes is crucial for effective response and strategy alignment.
Sub-theme 4: Shaping decisions dependent on understanding public views. Experts perceived DiscourseDash guiding reflective decisions around brand positioning, internal policy, and strategic communication. Rather than immediate responses, these uses focus on understanding how public perceptions evolve. By analysing social media discourses in detail, experts track shifts in tone, values, and alignment with intended identity. Thus, DiscourseDash serves as more than a monitoring tool; it’s a resource for staying informed through broader narratives. For example, E7 explained how discourse insights inform workplace policy design:
“In terms of designing the perks and benefits for all our employees, that is something we can incorporate to understand the trends […] there are a lot of culture changes […] So we can redesign [things] with a set of trendy [ideas] that could improve health, productivity, and the happiness index.”
This example shows how DiscourseDash helps align decisions with a broader understanding of employee sentiments and social media discourses, supporting a healthier workplace identity. Instead of relying only on assumptions or surveys, experts use DiscourseDash to gain accurate insights by analysing employees’ discussions about their work environment to inform strategic reflections.
Sub-theme 5: Following public voices to shape societal values. Experts valued DiscourseDash’s potential to track evolving narratives in policy debates, public health, and social movements. Beyond reactive monitoring, it uncovers deeper public discourse values, concerns, and perspectives for strategic alignment with emerging policies. For example, E11 described using DiscourseDash to inform government decision-making:
“If the government asked me to survey what is currently going on, on ways to improve people’s perception about them, I would use everything you shared with me [DiscourseDash] to include people’s opinions, what people are trying to pass on to the government. Like, if John Doe says, ‘This is a way the government can help the people […]’, it’s my job to write that down and explain [to the government] what led to that suggestion.”
This highlights DiscourseDash as a tool for mediated listening, translating public voices from social media into actionable suggestions for institutions. It illustrates DiscourseDash’s potential to help governments identify emerging concerns, trace the roots of suggestions, and communicate these strategically, bridging public expression and formal decision-making.
Theme 2: Adoption barriers in real-world settings. Experts recognised DiscourseDash’s value but noted barriers to adoption, including organisational constraints and concerns about data, ethics, and contextual fit.
Resource constraints: Many experts, especially from smaller organisations, noted limited budgets and technical capacity as barriers to adopting new tools. It needs to be easily integrated with existing systems, with minimal training, and no major infrastructure changes. Drawing on experience with similar tools, they emphasised long-term maintainability and reliability to avoid disruptions or rising costs from lack of upkeep or organisational changes. This highlights the need for sustainable, dependable tools that support ongoing workflows.
Accountability: Concerns were raised around data privacy, ethical use, and transparency in algorithmic processing, reflecting wider sensitivities about monitoring public discourse at scale. They stressed that design must prioritise ethical safeguards, especially for sensitive topics, including protecting identities, ensuring privacy, and promoting fairness. These concerns align with sociotechnical accountability for ethical governance throughout DiscourseDash’s lifecycle.
Organisational structure: Workflows with hierarchical or collaborative settings require role-specific permissions and access controls, similar to how platforms like Meta manage page roles according to the organisation’s position of individuals. DiscourseDash must support team workflows with varying responsibilities and sensitivities, raising design challenges around shared workspace analysis that respects organisational protocols.
Real-time performance and integration: In time-sensitive situations, experts emphasised low latency, real-time data processing, and seamless compatibility with existing workflows and platforms. Performance and interoperability are core to adoption, especially where discourse insights inform decisions. This requires back-end optimisation and flexible system design adaptable to real-world workflows.
Language and cultural adaptability: Experts noted limitations in supporting diverse languages, regional dialects, and culturally specific slang. Inclusivity in multilingual, culturally aware analysis pipelines is important for future tool development to reflect public discourses.
Trust and reliability: Some experts, especially those with qualitative backgrounds, expressed scepticism about automated classifications oversimplifying complex discourses. While useful for initial exploration, there is still space for improvement within DiscourseDash regarding reliability in managing politically or culturally sensitive contexts. Hence, they emphasised the need for better interpretation in design for users to understand how outputs are generated, how data sources are used, how assumptions are made, and confidence levels of indicators, which are all key factors for real-world adoption.
Theme 3: Designing for evolving analytical workflows. Experts reflected on how their workflows might adapt to the rapidly changing social media landscape. These forward-looking insights provide valuable guidance for future dashboard development. Hence, incorporating these perspectives helps ensure the design remains relevant and adaptable, supporting decision-making workflows that evolve along with the dynamic nature of social media.
Integration for more customised AI-based features: Experts envisioned future workflows enhanced by collaborative AI to support proactive, informed decisions. Beyond text retrieval, they envision a potential for AI-assisted processes to outline strategies based on past events and guide responses. Suggestions included incorporating instruction-based prompts and adjustable recommendations within DiscourseDash. Some mentioned incorporating features, such as X’s (formerly Twitter’s) Community Notes to identify misleading content and track virality with clear explanations.
Adapting temporal analysis beyond real-time: Experts emphasised extending temporal analysis to support strategic understanding over time, not just immediate reactions. Tools should capture how discourses evolve before, during, and after key events. They suggested using discourse patterns to predict emerging trends or risks and anticipate misinformation before escalation. They noted: “You want to know where people stand at the beginning, how that shifts after an announcement or crisis.” This highlights the value of integrating real-time data with historical patterns to reveal shifts for more adaptive or forward-looking decisions.
Summary of the findings
Our two-phase evaluation provides insights into how the design of DiscourseDash supports social media analysis in practice. Findings from Phase 1 on general user participants’ engagement indicated the value of including multiple computational measures (stance, sentiment, harmfulness, popularity) within a single interactive system. Phase 1 confirmed the effectiveness of combining such analyses to support decision-making in complex social media contexts. In Phase 2, expert participants indicated that DiscourseDash complements their existing workflows. This alignment ensured that the design offered a practical approach to inform interventions in areas where experts can make timely decisions. More broadly, our design validates the value of providing contextual information that aids human interpretation. This appreciation was demonstrated through users’ perceptions around the design that encouraged users to connect visual summaries with contextual details. This suggests that providing users with the analysis label within discourse dynamics can encourage interpretation to bridge between computational analysis and human reasoning. All in all, these implications confirm that DiscourseDash offers transferable insights for developing future interactive systems that balance automation with human interpretation.
Discussion
Our findings highlight how both general users and experts interacted and perceived our designed social media analytical tool in support of decision-making. In Phase 1, a strong consensus emerged among 26 participants on the need for a unified dashboard that integrates multiple analytical perspectives. This integrated approach helped participants navigate complex discourses efficiently and make informed decisions during targeted investigations. To ground this conceptual design in real-world practice, we engaged 11 experts with diverse experience in analysing social media discourses. Their feedback reflected DiscourseDash’s relevance to decision-making workflows in various domains. In the following sections, we synthesise our key findings and reflect on how our design contributes to the advancement of social media analysis and the broader field of HCI. We then outline the implications of the design and suggest directions for future research.
Designing for social media analysis
To address RQ1, how do both general users and industry experts perceive and interact with a dashboard tool that offers a detailed analysis with discourse-level context to make informed decisions? Our findings show that both groups valued tools that go beyond high-level statistics to support deeper interpretative engagement with online discourse. This builds on prior studies that emphasise the qualities of combining qualitative insights with quantifiable metrics to improve social media analysis (Yousefi Nooraie et al., 2020).
Throughout both phases of the study, we found a consistent need for analytical depth. This was evident when experts described the limitations of their existing tools, which often provide high-level statistics without a deeper contextual interpretation (see Page 22). This need for richer analysis became even more apparent during their interaction with DiscourseDash (see Page 24). Initially, as they explored DiscourseDash’s overview page, they acknowledged its similarity to current tools. However, after interacting with detailed discourse-level analysis, experts noted that it effectively addressed the interpretive gaps they had consistently mentioned (see Page 24). This illustration in our findings reinforces the importance of discourse-level insights to support better navigation, interpretation, and making more informed decisions. Similarly, general users rated the discourse-level analysis features as highly useful during decision-making tasks (see Page 17). Furthermore, they articulated how these features supported their reasoning during decision-making tasks (see Page 19). Both thematic findings confirmed that these perceptions were closely tied to DiscourseDash’s ability to guide their understanding of complex online discussions, suggesting the value of detailed analysis in improving how users investigate the underlying discourses.
Situated within the broader context of social media analysis (Kapoor et al., 2018; Batrinca & Treleaven, 2015; Rathore, Kar & Ilavarasan, 2017), our findings highlight key directions for designing future analytical tools that facilitate the interpretation of online discourse in decision-making processes. In both studies, we showed that moving beyond basic metrics to detailed discourse-level insights can offer more effective support for decision-making. In addition, to make our findings more future-orientated, we incorporated suggestions from experts on how DiscourseDash could evolve (see Page 29). These included more advanced features that align with how they expect their workflows to change, especially in response to the rapid advancements of AI and the dynamic nature of social media environments.
The design process of DiscourseDash in this article followed a user-centred approach that prioritised real-world applicability. This is consistent with the established HCI literature that advocates for context-sensitive and participatory design practices (Maguire, 2001; Spinuzzi, 2005). Our work documents the design process for the participation of both general and expert users. This approach ensures that future social media analysis tools remain grounded in user needs and remain relevant across domains. Most importantly, our study offers empirical evidence and practical design guidance to address the growing need for interpretive tools in social media contexts. Our evaluation of user experience and alignment with real-world decision-making practices contributes to a broader HCI agenda that prioritises designing analytical tools for understanding social media discourse rather than simply quantifying metrics.
The values within the design
To answer RQ2, to what extent do the proposed features in DiscourseDash, such as stance detection, sentiment analysis, harmfulness labels, popularity insights, influence or support decision-making workflows? Our findings from both general users and expert interviews indicate that these features offer value within analytical support. However, effective integration still requires refining the interaction between human judgment and insights from analytical tools. This study builds on previous HCI research that emphasised the importance of designing systems that balance algorithmic output with design that allows human interpretation to improve decision quality and trustworthiness (Amershi et al., 2019; Lim, Dey & Avrahami, 2009; Ambasht, 2023).
In the first phase, our qualitative analysis highlighted the importance of each feature based on the participants’ rankings (see Page 17). In addition, the participants provided detailed justifications for why they found these features useful during decision-making tasks (see Page 20). Collectively, the idea of bringing these analyses together has indicated their usefulness to general users. In the second phase, we explore how these features align with real-world workflows. Before interacting with DiscourseDash, experts described how they routinely integrated various forms of analysis to guide their decision-making processes, aligning closely with the features proposed in our tool (see Page 21). Furthermore, thematic findings from their interactions with DiscourseDash illustrated how perceptions of the usefulness of each analytical feature informed their evaluation of DiscourseDash’s relevance to their workflows (see Page 22).
However, in sensitive or high-stakes contexts such as healthcare, where decisions can directly impact people’s well-being, experts emphasised the ongoing importance of human interpretation alongside automated insights. Although they acknowledged the value of these analytical tools, they emphasised the reliance on human judgment. Factors such as trust, cultural norms, and established decision-making protocols shape the extent to which machine analyses are adopted (Kocielnik, Amershi & Bennett, 2019; Green & Chen, 2019). Automation also raises additional concerns about data privacy, bias, and ethical accountability, which vary between domains. Previous HCI studies have shown that perceived fairness and interpretation directly affect users’ willingness to adopt algorithmic systems (Binns et al., 2018). Depending on the context, we found that some users prefer extensive AI support, while others prefer to rely predominantly on human judgment (see Page 26).
Our findings suggest that the proposed analytical measures, such as stance detection, sentiment analysis, harmfulness detection and popularity analysis, are useful in guiding users through the complexities of social media discourse and in supporting informed decision-making. Although they also align with real-world practices, the extent to which these tools can be impactful depends on their ability to present trust, transparency, and remain flexible to human feedback and contextual interpretation.
Shaping values with experts
To answer RQ2, how do industry experts currently analyse social media discourses and how well does DiscourseDash align with these real-world practices? We found that experts comprehend social media discourses for a range of purposes, from monitoring to reviewing past events to planning future scenarios. To understand them for these purposes, their analyses involve identifying emergent narratives or trends, tracking public sentiment, and understanding how discourses develop. These findings extend prior research by demonstrating that combining quantitative and qualitative analyses can more effectively support decision-making in response to the complexity of online discourses (Andreotta et al., 2019; Behrendt, Richter & Trier, 2014).
Most importantly, experts emphasised the need for tools that do not simply visualise what is happening from a high-level perspective but also support reasoning about why discourses unfold the way they do. Our findings reinforce prior work highlighting the limited availability of tools designed in ways that are usable and actionable in professional contexts (Andreotta et al., 2019). Before interacting with DiscourseDash, experts described their workflows as relying on combining analytical tools with manual navigation, reporting, and qualitative interpretation (see Page 21). This enabled us to situate DiscourseDash within the context of real-world practices, validating the practical relevance of our design.
Upon introduction to DiscourseDash, experts quickly recognised how features such as analysing discourse-level insights, stance distribution, and narrative unfolding aligned with their existing analytical approaches and needs. DiscourseDash’s capacity to synthesise complex discourses into structured, interpretable outputs was perceived as valuable for understanding social media discourse during impactful contexts. These thematic findings illustrated how experts appreciated the ability to investigate the context and reasons behind the visual indicators presented (see Page 22).
Furthermore, experts’ post-interaction reflections reinforced the alignment between DiscourseDash’s design and their existing workflows. After engaging with the full dashboard experience, they articulated specific use cases where DiscourseDash could enhance and integrate into their decision-making processes. These reflections not only validate the practical relevance of our design approach but also demonstrate how DiscourseDash supports broader analytical goals (see Page 26). At the same time, they pointed out areas that need to be addressed in future work before DiscourseDash can be fully adopted in practice (see Page 28). These insights are also transferable to the design of tools to support professionals working in domains where actionable interpretation of discourse is critical (Cuevas Shaw, 2021; Jin et al., 2019; Seidel et al., 2018).
An implication for DiscourseDash could combine automated analysis (e.g., stance, sentiment, harmfulness) with expert judgment to generate actionable insights. For example, the relative importance of different computational discourse indicators (online) could guide automated recommendations, while group consensus (offline) could reflect inputs or validations from multiple analysts. This approach mirrors principles from adaptive decision support systems, where automated analysis outputs and human evaluation work together to support informed decision-making.
In general, our research demonstrated that DiscourseDash aligns well with the way experts currently analyse social media discourses and aligns with broader efforts in HCI to design analytical tools that bridge qualitative insight and real-world decision-making. Grounding our design in expert workflows and iteratively collecting feedback, we extend prior HCI research that calls for tools to support users’ situated analytical practices and enhance interpretation and sensemaking (Amershi et al., 2019; Shneiderman, 2020a). Our findings contribute an early step toward designing a system that enables deeper and more actionable analysis of complex online discourse environments.
Design implications
To address RQ4, what key design implications can we gather to guide future iterations of DiscourseDash to enhance support for diverse real-world decision-making scenarios? We outline several design implications drawn from our study. These insights are grounded in the feedback and interactions of experts and general users with the DiscourseDash prototype. They highlight key considerations for aligning better relevancy in real-world settings and inform the future development of similar tools (see Page 29).
Improving interpretation of analysis outputs
There is a clear need for more detailed and accurate interpretations of the analysis output. General users struggled to understand the meaning behind specific labels such as harmfulness, stance, or sentiment. This highlights the importance of providing concise and accessible explanations, such as through tooltips (Dai et al., 2015) or in-context guides, to help users quickly grasp the meaning of each metric. This aligns with broader insights from explainable AI (XAI) research, which emphasises that the interpretation of analysis outputs is context-dependent and should reflect users’ cognitive models (Miller, 2019; Doshi-Velez & Kim, 2017). Experts, on the other hand, expressed interest in more refined categorisations that could better reflect the complexity of online discourse. For example, rather than using broad categories, future versions of DiscourseDash could explore hierarchical or layered classification systems that first identify the presence of an issue and then allow for deeper investigation into its nature (e.g., types of harm, intensity of emotions). Hence, these insights suggest two main directions for future work: (1) to improve interpretation for non-expert users and (2) to offer more granular analytical options for advanced users. Future work should address these gaps to ensure that these analysis not only integrates seamlessly into interaction experiences, but also increase in value in various professional contexts.
Handling variability in data sources
Future iterations should offer flexibility in data sources, supporting real-time and offline inputs to better align with diverse and dynamic workflows. This aligns with prior work in crisis management studies, which highlights the importance of accommodating diverse data contexts and situational demands (Saroj & Pal, 2020; Jin, Liu & Austin, 2014). The current prototype presented an analysis of vaccine-related topics from the COVID-19 pandemic, which, while suitable for initial testing, does not fully represent the evolving nature of social media discourses. Some participants found it difficult to relate the prototype to current or personally relevant topics. Additionally, expert feedback emphasised the importance of flexible data input methods. Some experts work with curated or sensitive datasets, such as anonymised surveys, interview transcripts, or internal organisational data, which are not presented on public social media platforms. In these contexts, where public discourse is culturally or politically restricted, reliance on online data might not reflect accurate insights for high-stakes decisions. They emphasised that allowing user-uploaded data would better align with practical adoption. This flexibility is critical in workflows where decisions rely on understanding complex perspectives that are not always visible in public discourse. For example, E08, an expert, shared that public expression is sometimes limited due to cultural norms, but accurate community insights are necessary for informed policy-making decisions. Hence, supporting real-time integration and secure offline data upload ensures that DiscourseDash can be adapted to diverse use cases (Adepoju et al., 2022), improving DiscourseDash’s utility and ethical responsiveness across different sociocultural contexts. Although the current prototype was evaluated using COVID-19 discourse from Reddit, the underlying framework is designed to be scalable and adaptable to other social media platforms such as Twitter/X and Facebook towards developing solutions for domains such as brand monitoring and crisis communication. Future iterations could adapt these evaluated analyses to real-time data on social media for real-world deployment.
Incorporating demographics considerations
Our study revealed a strong emphasis on the importance of demographic context, consistent with prior work on demonstrating its influence in social media analysis (Sadah et al., 2016). These findings reinforce the value of demographic data in improving the contextualisation of social media discourses. This inclusion of demographics will allow for a deeper understanding of how different groups perceive and engage with specific topics for a more accurate analysis during decisions on interventions. For example, categorising responses by demographic factors such as community affiliation, cultural background, or belief systems could offer valuable insight into varied behavioural patterns, allowing DiscourseDash to address diverse perspectives. This is evident from experts suggesting that the lack of demographic insights limits DiscourseDash’s practical relevance (see Page 26). For many experts, demographic segmentation forms a core component of their decision-making workflows when accurate and culturally sensitive strategies are required.
In addition, we suggest that future designs could benefit from integrating social network analysis to move beyond static demographic categorisation. This design direction responds to expert feedback and points to the value of supporting relational analysis (Peng et al., 2018). By visualising patterns of interaction, influence, and community formation, this can capture how narratives spread across different groups for a more interconnected understanding of online discourses. However, representing user relationships raises important privacy considerations of sensitive or polarised topics. Therefore, we recommend that future work explore how to balance the analytical benefits of social network visualisation with ethical and responsible design practices.
Predictive and actionable features
Although our approach takes a step in this direction by offering generalised support, our findings suggest that more flexibility is needed to accommodate a greater need for preferences. There is a clear indication from both user groups that DiscourseDash features extend beyond descriptive analytics to incorporate predictive capabilities and actionable guidance (Phillips et al., 2017). With the advantages of LLMs, several suggestions were made within this scope. Firstly, participants consistently emphasised the value of temporal prediction, specifically the ability to anticipate emerging trends based on ongoing discourses or past events, such as the COVID-19 pandemic. To enhance DiscourseDash’s strategic value, incorporating predictive functionality would further support a shift from reactive to proactive decision-making.
In both studies, we observed the importance of allowing users to engage with discourse at varying levels of granularity through optional summarisation features. Among general users, some valued access to detailed analyses of discourses, while others would prefer concise summaries for quicker insights. Building on this, experts can leverage such flexibility to adjust their engagement according to the specific demands of their investigations. This can better support decision-making across a spectrum of time sensitivities, urgencies, and depths of analysis. This highlights the need for a summarisation feature that accommodates diverse user needs by offering a choice of detail levels, balancing rapid insights with opportunities for deeper exploration. This finding aligns with HCI literature on designing for user preferences and flexible data presentation to meet the needs of diverse user groups (Goodman, Langdon & Clarkson, 2007; Perer & Shneiderman, 2008).
Expanding the features of DiscourseDash could further support users in identifying effective courses of action. Based on the analytical outputs, these features can generate suggestions informed by analytical output, such as referencing a repository of predefined knowledge or guidelines that reflect established practices, or recommending interventions based on historical events. Experts highlighted that analytical insights are most valuable when paired with practical recommendations to support decision-making. With advances in LLMs and Retrieval-Augmented Generation (RAG), future iterations of DiscourseDash could evolve with features that allow users to perform queries with LLMs with more grounded recommendations. This can be achieved by linking social media discourses to hierarchical knowledge graphs or allowing a RAG system to retrieve and refine relevant output information from real-time discourses.
Our findings suggest that while generic solutions can provide baseline support for expert decision-making workflows, there is significant scope for future work to address more complex and varied analytical needs. This highlights a key design implication where analytical tools should be adaptive and configurable to support diverse goals and contexts of different users (Feigh, Dorneich & Hayes, 2012). Our study concluded that allowing users to customise prompts based on their specific objectives can increase both the applicability and effectiveness of the system. This is because we found that while some users prefer automation to streamline tasks, others remain sceptical of AI’s reliability and prefer to retain more control. Therefore, future work should develop AI-enhanced systems that are not only flexible but also subject to ongoing evaluation and refinement to remain relevant, accurate, and usable across varied domains.
Inclusivity and representation
Future design of analytical systems must consider accessibility for a wide range of users, regardless of their linguistic, cultural, or resource constraints (Abascal & Nicolle, 2005). An important point raised by our experts was the accessibility of these tools. There is a strong preference for open-sourced solutions, which were seen as a more practical way to promote broader use, encourage collaboration, and reduce cost-related barriers. These tools should be affordable, considering user groups that are also making an impact in smaller teams or researchers with limited budgets.
In addition, our findings extend the ongoing discussions in NLP about language diversity and multilingualism (Joshi et al., 2020; Hershcovich et al., 2022). Participants stressed the importance of designing tools that extend beyond the English language. For example, the global pandemic was a shared crisis that affected people worldwide. However, if analytical tools do not support multilingual analysis, they risk excluding researchers and communities who work in languages other than English. To enhance fairness and encourage wider adoption, future tools should address linguistic diversity by accommodating local dialects and underrepresented languages in regions with frequent dialectal variation.
Furthermore, the discourse on social media reflects only a partial view of societal realities, shaped by cultural and contextual factors. An expert (E9) highlighted that the usefulness of DiscourseDash can vary depending on cultural settings. For example, without such considerations, these tools can risk misinterpretation or overlook important contextual meanings, which can lead to reduced trust or limited applicability in certain settings. To ensure broader relevance and effective use across diverse user groups, future design efforts should be grounded in local practices and informed by cultural contexts.
Building trust in analytical tool
Establishing trust is a fundamental requirement for the adoption of AI-driven analytical tools. Both user groups in our study emphasised the importance of system transparency around how such a tool generates output, processes data, and ensures the fairness of algorithms. This reflects existing HCI research that calls for explainability and accountability in AI system design to support user trust (Binns et al., 2018; Abdul et al., 2018). Future designs of such analytical tools should be adapted from our approach and strengthened by making each underlying process understandable when involving real-world decision-making.
In Phase 1, two participants (G6 and G16) highlighted noticeable mismatches between their interpretations and the sentiment or stance labels generated by DiscourseDash. Similarly, in Phase 2, E9 expressed strong scepticism toward current AI-based solutions for qualitative analysis in sensitive domains. These observation highlights the importance of transparency in the system. On one hand, it demonstrates that DiscourseDash’s design makes discourse data and model outputs visible for users to detect inconsistencies rather than rely on automated labels. This aligns with DiscourseDash’s goal of supporting human–machine collaboration in decision-making rather than replacing expert judgement. On the other hand, these disagreements highlight the need for more targeted studies to understand how annotation mismatches influence users’ trust in AI-assisted analysis. This reflects broader concerns in HCI about the early application of machine learning in socially complex environments, as our approach is not yet sufficiently validated or trustworthy (Suresh & Guttag, 2019; Ehsan & Riedl, 2020). More systems should incorporate methodological transparency and allow users to provide feedback on the system output when needed (Amershi et al., 2019).
To address these concerns, future design efforts should integrate mechanisms for explaining system logic (e.g., how classifications are made), communicate how data are sourced and protected, and allow users to engage with AI outputs at varying levels of interpretive depth. Hence, trust-based designs must be continuously strengthened and evolve together with the system’s use and user feedback (Miller, 2019). Future work should consider how to address limitations in AI-generated insights, for example, by presenting the confidence level of the output (Rechkemmer & Yin, 2022), or explainable methods (Danilevsky et al., 2020; Liu, Yin & Wang, 2018). This way, trust can be encouraged where users can regulate their reliance accordingly in domains where judgment of qualitative insights is subjective.
In addition, there should be transparent documentation that outlines how analytical tools are intended to evolve, be maintained, and be supported over time. When users place trust and reliance on such systems, there is a reasonable expectation that these tools will remain accessible and functional. Lack of clarity or sudden withdrawal can undermine trust and create significant disruptions in research and decision-making workflows. For example, E10 noted that the discontinuation of Meta’s CrowdTangle and the removal of research access by X (formerly Twitter) caused considerable setbacks for many analysts and researchers who had come to depend on these platforms. These cases highlight the need for sustained transparency and clear communication about long-term support and platform commitments when tools are used in critical analytical workflows.
Contribution to HCI
Our study contributes to HCI by demonstrating how human-in-the-loop tools can support the interpretation of complex social media discourses. Through the design and evaluation of DiscourseDash, we show how the concept of automated analytical insights can be made interpretable and actionable for expert users. This builds on the emphasis in HCI on transparent, user-centred analytic systems that integrate human judgment into data-driven workflows (Shneiderman, 2020b; Amershi et al., 2019). The iterative development of DiscourseDash highlighted the value of participatory design when dealing with interdisciplinary goals and fast-evolving technologies (Dourish, 2006). Our findings align with the work of HCI in visual analysis and communication analysis (De Choudhury et al., 2009; Zubiaga et al., 2016; Majeed et al., 2020), supporting the importance of visual clarity and cognitive accessibility in complex analysis tasks (Heer & Agrawala, 2007).
By shifting from static representations to exploratory, decision-oriented insights, our approach contributes to HCI efforts in designing tools that support more proactive sense-making and intervention. While the current system focuses on analysing discourse-level indicators, participants suggested more refined features, highlighting opportunities to enhance DiscourseDash’s capabilities. These suggestions emphasise the importance of designing collaborative and context-aware systems that adapt to evolving user needs (Arias et al., 2000). Overall, DiscourseDash serves as a case study for designing socio-technical systems that bridge automated analysis with human interpretation. Furthermore, it contributes to a broader HCI emphasis on responsible AI, interpretability, and practical integration of computational tools into decision-making workflows.
Limitations
While our study provided valuable insights for developing DiscourseDash, several limitations must be acknowledged. First, the general user study was conducted primarily with university staff and students. Although this group provided valuable feedback on the overall design concept and flow, it may not reflect the complete perspective of the intended end users. Although the study collected some data related to usability, this was not its primary focus in this article’s contribution and is therefore presented briefly. A more targeted investigation of usability would benefit from purposively sampling end users using stricter criteria. Similarly, the expert interview study provides only a small sample when considering the broader landscape of efforts in social media analysis. Future research should investigate other professions and demographics to gather a wider range of qualitative insights. Future research should expand expert recruitment to include a wider range of roles, sectors, and geographic contexts to improve generalisability and design validation.
Second, participants’ familiarity with Reddit was not explicitly controlled or measured in the general user study. This familiarity may have influenced their ability to assess DiscourseDash objectively. However, Reddit was selected as a baseline platform due to its widespread use and recognisable structure, which users commonly encountered in both personal and professional contexts. This does not impact the study that primarily focused on comparative perceptions and experiences. Rather, any observed differences are likely to reflect the natural variability in how users engage with unstructured social media content in real-world settings. Nonetheless, future studies could benefit from explicitly measuring prior platform familiarity to better account for its influence on user experience. As with the randomly generated harmfulness labels used in this prototype, this approach could influence how users interpret feedback and constrain the generalisability of findings concerning this feature.
Third, our research focused only on text-based interactions, which guided the selection of Reddit as the baseline platform due to its primarily threaded discourse structure. Although this focus aligns with the analysis of unstructured textual discussions, it does not fully represent the broader social media landscape, where important content modalities such as images, videos, and other multimedia play a significant role. In addition, using Reddit as a proxy for unstructured social media discourse has underlying limitations, as its community norms and interaction styles may not reflect the diversity of behaviours found across other social media platforms. Future work should examine multiple social media platforms and incorporate multimodal content to capture the complexities of online discourse in relevance and adaptability.
Finally, our studies did not explore longitudinal use or real-world deployment of DiscourseDash. Understanding how users engage with such tools over time is important for assessing their sustained relevance. Future research should adopt an iterative design process, including long-term stakeholder collaboration, to refine DiscourseDash’s capabilities and better support decision-making practices in dynamic environments.
Conclusions
This article introduces DiscourseDash, a dashboard tool designed to support the understanding of social media discourses. The development of the conceptual design idea was informed by literature and achieved through a collaborative process. DiscourseDash integrates the analyses of stance, harmfulness, sentiment, popularity insights, and detailed insights from the discourse level to support decision-making in complex social media environments. We conducted a two-phase evaluation through a mixed-method general user exploratory study and a follow-up expert interview study to align with real-world practicality. The general user study validated the conceptual design and interaction flow, allowing us to identify strengths in the initial concept and opportunities for refinement. The proposed analyses demonstrated their effectiveness in supporting decision-making based on social media discourses. Building on this, we presented the validated design concept to industry experts to align it more closely with real-world workflows. This study revealed that most experts were optimistic by demonstrating how its core concept aligned with their workflows. This is due to the value of contextualising analyses and the demand for actionable outputs. However, we also identified several design considerations that need to be addressed before DiscourseDash can achieve practical, real-world applicability. These findings not only reinforce DiscourseDash’s relevance but also help synthesise practical expectations for its future development.
Most importantly, our findings will demonstrate how analysing social media is not just dependent on the human process; analytical tools are a necessary part of the hybrid and evolving workflows of experts who make decisions based on social media discourses. Likewise, these analytical tools are dependent on human experts in the loop to shape the practicality of these decision-making practices. Future work will focus on evolving the prototype into a fully functional system informed by the insights gained from this study. In addition, future work will explore enhanced integration of user-defined metrics, developing adaptive interfaces to improve user needs, and conducting longitudinal studies to assess DiscourseDash’s real-world impact over time.
Supplemental Information
Complete details of tasks and questions used in the Phase 1 study.
Set A presents the three tasks participants were instructed to complete. Set B contains the corresponding sub-questions asked after each task. Set C includes the sub-questions administered following participant interaction with both experimental conditions.
Survey questionnaire used in Phase 1 (DiscourseDash condition).
This questionnaire was used in Phase 1 during the DiscourseDash condition to gather participant responses after interacting with it to perform decision-making tasks. The responses measure the quantitative aspects of the overall user experience for the condition.
Survey questionnaire used in Phase 1 (Reddit condition).
This questionnaire was used in Phase 1 during the Reddit condition to gather participant responses after interacting with it to perform decision-making tasks. The responses measure the quantitative aspects of the overall user experience for the condition.