
Moth-flame optimized UNet++ with self-attention for early-stage Alzheimer’s disease prediction using multimodal input
- Published
- Accepted
- Received
- Academic Editor
- Consolato Sergi
- Subject Areas
- Algorithms and Analysis of Algorithms, Artificial Intelligence, Computer Vision, Data Mining and Machine Learning, Neural Networks
- Keywords
- Alzheimer disease (AD), UNet++, Self-attention, Moth flame optimization, Multi-modal Data, sMRI, PET, Neuropsychological assessments
- Copyright
- © 2026 V et al.
- Licence
- This is an open access article distributed under the terms of the Creative Commons Attribution License, which permits unrestricted use, distribution, reproduction and adaptation in any medium and for any purpose provided that it is properly attributed. For attribution, the original author(s), title, publication source (PeerJ Computer Science) and either DOI or URL of the article must be cited.
- Cite this article
- 2026. Moth-flame optimized UNet++ with self-attention for early-stage Alzheimer’s disease prediction using multimodal input. PeerJ Computer Science 12:e3586 https://doi.org/10.7717/peerj-cs.3586
Abstract
Early-stage identification of Alzheimer’s Disease (AD) is a sizeable challenge to health care globally due to its progressive nature and the fact that there is no available effective treatment. It becomes strategic for practices using interventions meant to halt or reverse cognitive decline if diagnosed early. Recent medical imaging advancements, mainly Positron Emission Tomography (PET) and Magnetic Resonance Imaging (MRI), have greatly unveiled subtle pathological changes associated with this disease. Studies have shown that multimodal neuroimaging can provide crucial information regarding the structural and functional changes in the brain that are associated with AD. However, more research is required to establish sustainable techniques for the detection of AD at all its stages. In this research, a framework of Moth Flame Optimized UNet++ with self-attention is proposed to analyze multi-modal inputs of Structural Magnetic Resonance Imaging (sMRI), PET, and neuropsychological test data for the classification of Alzheimer’s disease (UNet + +SA–MFO). The framework involves pre-processing the sMRI and PET images to denoise, skull strip, denormalization, next captures complex texture patterns and spatial relationships from both images by placing attention gates at skip connections to ensure reduction of irrelevant features and enhanced localization of significant features. Neuropsychological assessments are passed through fully connected layers of UNet++. Moth Flame Optimization optimizes hyperparameters. Then, a fused feature set is created as a concatenation of all features from multi-modal inputs. Support vector machine (SVM), k-nearest neighbors (k-NN), and Random Forest are used to model, and later weighted stacking ensemble is used to predict the output. The framework is implemented in Python, and evaluation metrics like precision, recall, F1-score, Accuracy, and Area Under the Receiver Operating Characteristic curve (AUC-ROC) are analyzed. UNet++ SA–MFO attains effective 90.5%, 89.9%, 90.2%, 91.8% and 94.1% precision, recall, F1-score, Accuracy and AUC-ROC against existing multi-modal ensemble frameworks. The above findings highlight the potential of enhanced UNet++ augmented with self-attention-based feature extraction and the benefit of integrating innovative optimization for more precise Alzheimer’s Disease diagnosis and classification at the early stage. This proposed framework provides valuable contributions to Alzheimer’s Disease pathology insight, improved diagnostic sensitivity, and ultimately, improved management of this neurological disease.
Introduction
Alzheimer’s disease (AD) is a slowly progressing, irreversible neurodegenerative condition that is characterized by the loss of neurons and brain tissue over time. Its impact on patients, caregivers, and society is significant. AD usually results in an inability to carry out daily activities, extensive cognitive impairment, and death. The disease progresses slowly, with symptoms often mistaken for normal aging or minor forgetfulness. As AD progresses, it seriously disables cognitive functions, impacting decision-making and daily functioning. There is no treatment to reverse AD, although some interventions can slow its development (Holilah, Bustamam & Sarwinda, 2021). AD is a significant public health issue, especially among the elderly. Improvements in healthcare have hastened population aging. As the World Health Organization (WHO) has noted, the world population aged 60 and above is projected to increase from 12% to 22%, with 80% of this age group living in low- and middle-income countries. In 2020, about 50 million individuals were diagnosed with dementia, and the number is estimated to reach 152 million by 2050. AD is now the sixth most common cause of death in the United States (Shastri, Bhadrashetty & Kulkarni, 2023). Most patients diagnosed with AD are above 65 years of age, and they usually present with mild cognitive impairment (MCI). MCI is an intermediate phase of cognitive impairment that is ascertainable but not severe enough to functionally impair everyday life. However, it is frequently progressive. Studies show that 28.9% to 33.6% of MCI cases progress to AD (Mitchell & Shiri-Feshki, 2009). Detection of MCI at an early stage and early intervention can reduce the risk of the development of AD. Unfortunately, no cure exists for AD or MCI, and available medications only manage symptoms, often with side effects. The exact causes of AD remain unclear, and researchers have yet to reach a consensus. Consequently, much effort is focused on delaying disease onset and developing early detection methods to allow timely intervention and slow progression.
Early detection of cognitive impairment is difficult, as it emerges slowly and can be mistakenly thought to result from normal aging (Klunk et al., 2004). Clinically, numerous measures are used to evaluate AD and assess brain function. Brain imaging is one of the most valuable methods and provides detailed information on the brain’s structure, volume, and lesions. Neuropsychological tests, which measure cognitive domains such as memory, executive function, and attention, also provide valuable information about cognitive deterioration. Neuropsychological tests can be administered through various modalities, such as speech, text, images, and videos, enabling a thorough assessment of cognitive function (Marquié et al., 2015). Advanced neuroimaging methods such as Magnetic Resonance Imaging (MRI), Positron Emission Tomography (PET), and Computed Tomography (CT) enable clinicians to detect neurological alterations associated with cognitive impairments. MRI and CT scans provide high-resolution anatomical information on brain volume and structural changes, enabling the identification of changes in specific brain regions associated with neurodegenerative diseases. PET scanning, particularly with fluorodeoxyglucose (FDG), detects brain metabolic changes before structural changes appear, enabling early AD diagnosis. Additionally, PET-FDG imaging differentiates AD from other cognitive disorders by identifying patterns of glucose metabolism. Reduced glucose metabolism in areas like the posterior cingulate cortex and temporoparietal association cortices is a typical feature of AD (Levin et al., 2021). PET scans are also important for detecting significant AD biomarkers, such as amyloid-beta (Aβ) and tau protein deposition.
The creation of PET tracers, such as Pittsburgh Compound B (PiB), has greatly aided the visualization of Aβ plaques, a diagnostic hallmark of AD pathology. Newer PET tracers targeting tau protein accumulation also offer further insights into neurofibrillary tangles, another important element of the disease (Patil et al., 2025). MRI also supports this with high-resolution structural imaging, revealing early markers of neurodegeneration, such as hippocampal atrophy and cortical thinning (Schuff et al., 2009). Highly specialized MRI techniques, such as diffusion tensor imaging (DTI), provide greater insight into white matter integrity and enhance our conceptual understanding of changes associated with AD (Kadri et al., 2022). Combined PET and MRI imaging significantly augments AD diagnostic and classification specificity. This multimodal methodology blends evidence of tau and amyloid pathology with brain structural alterations to enable greater discrimination between AD and other neurodegenerative diseases (Shastri, Bhadrashetty & Kulkarni, 2023). Studies employing multimodal imaging combinations including MRI, PET, and neuropsychological testing have yielded high classification performance, with 98.5% accuracy in distinguishing cognitively normal subjects from those with early mild cognitive impairment (EMCI) (Zhang et al., 2024). These advances in neuroimaging and cognitive testing methods have tremendous promise for the early identification and treatment of AD.
Research gap
The prediction of AD is one of the complex and critical challenges in medical research, mainly due to the diversity of the characteristics of the disease and the numerous diagnostic data modalities. Modern methods are usually based on a single-modal source of data, such as MRI or PET imaging, which provides extensive but still inadequate information about the evolution of the disease (Chen et al., 2025). Alzheimer’s pathology is better described by integrating multimodal features, including structural changes observed on MRI, metabolic activity measured by PET scans, and cognitive impairments assessed by neuropsychological tests. Although multimodal integration is evident as essential, current approaches often fail to properly integrate multiple complementary data streams, resulting in low prediction accuracy. Furthermore, typical UNet++ architectures, often used for segmentation, rely heavily on local spatial features and are inherently limited in their ability to represent the global context required to decode complex patterns in multimodal medical images. While self-attention mechanisms have recently emerged as a potential alternative to overcome these limitations, integrating them into the UNet++ architecture, which is specifically designed for Alzheimer’s disease prediction using multimodal inputs, remains relatively underexplored. In addition, there is a scarcity of efficient ensemble learning algorithms that exploit the strengths of predictions from individual modalities, thereby significantly increasing reliability and accuracy. This gap has highlighted an urgent need for a new approach that leverages expert UNet++ configurations with self-attention mechanisms to fully exploit the benefits of multimodal data and achieve better predictive performance.
integrated with MFO improves Alzheimer classification, prevents overfitting, and enhances generalization. The proposed –MFO framework addresses challenges like capturing complex patterns like texture and spatial relationships over earlier methods that rely on pretrained models that are exposed to overfitting and a lack of adaptability in clinical practices.
Contributions
Significant contributions of this work include,
Proposed –MFO framework enhances AD identification through the integration of multimodal inputs, including MRI, PET imaging, and neuropsychological assessments.
captures complex patterns, such as texture and spatial relationships, from input MRI and PET images.
MFO finetunes parameters and ensures enhanced generalization and reduced computational loads.
Optimized provides a notable contribution to the field of Alzheimer’s Detection through multimodal inputs.
Organization of the article
‘Introduction’ provides an overview of significance of Alzheimer’s disease prediction and role of deep learning in the field of neurodegenerative disorders, research contributions and scope of the study, ‘Related Works’ defines a comprehensive review of recent works related to machine learning and deep learning for neurodegenerative disorders, ‘Materials and Methods’ details dataset description, also elaborates the proposed framework, ‘Results and Discussion’ demonstrates the performance of proposed system against existing multimodal methodologies and detailed discussion of performance of all methods and ‘Conclusion’ summarizes the key findings of the research and future interventions of the proposed system on various neurodisorders.
Related works
Recent advances in multimodal learning, attention mechanisms, and efficient optimization have substantially improved medical image analysis for neurodegenerative disease. UNet-family architectures remain a cornerstone for segmentation and feature extraction from MRI/PET, with multi-scale fusion and attention improving boundary delineation and contextual reasoning. Transformers and hybrid Convolutional Neural Network (CNN)-Transformer models further expand receptive fields while preserving spatial detail, enabling richer cross-scale representations for downstream classification. In parallel, multimodal AD frameworks increasingly integrate imaging with clinical and genetic data via tokenization and attention-based fusion, reporting substantial gains over image-only baselines. For tabular cognitive measures, tree-based and temporal models (e.g., Random Forest (RF), CNN-Long Short-Term Memory (LSTM)) have shown value but are rarely integrated with imaging within a single, optimized pipeline. Optimization strategies (e.g., MFO) can improve generalization under small-to-moderate cohorts where overfitting is a concern. Despite progress, gaps persist: (i) robust, modality-aware fusion across Structural Magnetic Resonance Imaging (sMRI), PET, and neuropsychological (NP) tests; (ii) attention mechanisms tailored to medical images with selective skip gating; and (iii) principled hyperparameter tuning integrated with ensemble learning. Our work addresses these gaps by coupling self-attention gated UNet++ encoders for MRI/PET with an MFO-driven search over critical hyperparameters and a lightweight ensemble over fused features (SVM, kNN, Random Forest), demonstrating consistent gains on ADNI.
Yuan & Cheng (2024), presented a multi-scale context fusion algorithm with U-Net-based medical image segmentation. Their approach facilitated the derivation of more contextual information by gathering semantic information from various encoding phases and by utilizing the TBSFF module to give certain weights for disparate semantic features at various scales, further augmenting the feature learning capacity of the network to grab more elaborate semantic features and finer information by means of multi-scale context fusion and feature selection. Consequently, the target segmentation is even more precise with no additional computational cost. The suggested approach was highly efficient, achieving high Dice and Intersection over Union (IoU) values with fewer parameters. Aboussaleh et al. (2023) focused on detecting abnormal area pixels rather than normal tissue. They employed three encoders—VGG-19, ResNet50, and MobileNetV2—all of which are based on transfer learning. Each encoder was augmented with a bidirectional feature pyramid network to learn more spatially informative features. The outputs of these networks were combined with the decoder with an attention mechanism. The method was tested on the BraTS 2020 dataset to segment different tumor types, achieving the following impressive results: a Dice similarity coefficient of 87% for the whole tumor, 80% for the core tumor, and 70% for the enhancing tumor. Chen et al. (2025) designed a novel multimodal medical data fusion framework, the Multimodal Data Fusion (MMDF) model, to enhance the diagnosis of Alzheimer’s disease. In this context, various data sources, including clinical records and medical image data, are being integrated into the structure. They introduced a specialized vision transformer, MRI_ViT, for MRI data analysis, optimized explicitly for early Alzheimer’s diagnosis. The simultaneous introduction of these two led to the development of a multi-scale, attention-enhanced one-dimensional convolutional neural network (MA-1DCNN) for processing clinical data.
Automatic segmentation of medical images is highly challenging due to ill-defined boundaries, low-contrast tissue backgrounds, and modality-specific challenges, such as speckle noise and attenuation in ultrasound images. Al Qurri & Almekkawy (2023), introduced a hybrid model that fused the strengths of CNNs and Transformers. The new architecture they suggested consists of improvements to feature representation in skip connections and to the decoder, with an additional Three-Level Attention (TLA) module. This module integrates three key components: an attention gate to focus on structural information, channel attention to improve learning of inter-channel dependencies, and spatial normalization to further enhance spatial attention by employing Transformer-based coefficients, as in TransNorm. Skip connections between encoder and decoder were redesigned following a dense connection strategy akin to that employed in UNet++. The performance of the suggested model was evaluated on datasets from two imaging modalities: CT scans and ultrasound images. The experiment results showed that the new architecture consistently outperformed the baseline UNet, achieving higher segmentation accuracy across both datasets.
Venugopalan et al. (2021) employed deep learning techniques to analyze MRI images and single-nucleotide polymorphisms (SNPs) in relation to clinical test outcomes, thereby categorizing patients into three classes: AD, MCI, and CN. SDA was employed to identify the most suitable factors from the clinical and genetic databases, while CNN 3D was used to extract features from the MRI images. In addition, they proposed a novel interpretation technique that combines clustering and perturbation analysis to identify the most crucial features learned by deep models. In evaluations on the ADNI dataset, their deep learning models outperformed conventional shallow models such as support vector machines, decision trees, random forests, and k-nearest neighbors. This also indicated that the fusion of multiple data modalities achieved greater accuracy, precision, recall, and mean F1-scores than single-modality methods. The hippocampus, amygdala areas, and outcomes of the Rey Auditory Verbal Learning Test were identified as key distinguishing characteristics. Shah et al. (2024) proposed a method for classifying the various stages of AD and different types of cognitive disorders using 2D MRI data. The transformer consists of two new modules: (1) Mutual Latent Fusion (MLF) and (2) Parallel Coupled Encoding Strategy (PCES). Two datasets were utilized to test the performance of the proposed architecture. The results showed that the proposed BiViT-based model achieved 96.38% accuracy on the AD dataset. Incorporation of multiple cognitive domains in neuropsychological tests is necessary for proper AD diagnosis. Gupta & Kahali (2020) suggested employing a random forest algorithm to efficiently evaluate cognitive domains such as semantic memory, perceptual orientation, and executive function. Nevertheless, their strategy did not consider neuroimaging data in the diagnostic model.
Tosi et al. (2020) recently applied network analysis to investigate the correlation between various neuropsychological tests administered to AD patients, controlling for age and educational level. Although this research has demonstrated a need for reorganizing cognitive systems, no diagnostic models based on these reorganized tests have been established to date. Bhasin et al. (2023) recently developed a machine learning model using 13 memory-related characteristics derived from 12 neuropsychological tests, primarily in patients with mild cognitive impairment (MCI). However, they did not increase the cognitive domains considered for AD patients. Overall, such methods have not addressed redundancy, exclusivity, and overlap across cognitive domains in neuropsychological tests. Saleh et al. (2025) proposed a hybrid CNN-LSTM model for predicting AD progression by integrating four longitudinal cognitive sub-score modalities. The model finetunes its deep learning model using a Bayesian optimizer and has a genetic algorithm-based feature selection step to determine the best feature set of CNN-LSTM’s deep representations. A strong, optimized random forest classifier is used in place of the conventional SoftMax classifier. Large-scale experiments on the ADNI dataset highlighted the importance of each optimization step, demonstrating that the hybrid model outperforms other deep learning and traditional machine learning algorithms. To improve interpretability, SHapley Additive exPlanations (SHAP) and Local Interpretable Model-Agnostic Explanations (LIME) methods were implemented, providing insight into how the model arrives at its decisions.
Erdogmus & Kabakus (2023) constructed a novel CNN as a practical, cost-effective, and precise diagnosis of AD. The suggested model was trained and tested with DARWIN, which includes 1-D handwriting features mapped into the 2-D representation. Experiments achieved a very high accuracy of 90.4%, surpassing that of 17 state-of-the-art classifiers. Liu et al. (2025), introduced a new U-shaped segmentation architecture, CSWin-UNet, that leverages a CSWin self-attention mechanism to boost both horizontal and vertical stripe attention, while maintaining computational efficiency and receptive field interaction. In the decoder, a content-aware reassembly operator rearranges features using predicted kernels to restore the image to its original resolution. Extensive experimentation across synapse multi-organ CT, cardiac MRI, and skin lesion datasets demonstrated that CSWin-UNet maintains low model complexity while achieving high segmentation accuracy. Yang et al. (2024), proposed a novel image segmentation network, UT-FusionNet, that addressed the challenges posed by intricate internal structures in multiphase composite building materials. The proposed UT-FusionNet is based on the U-Net architecture, incorporating a transformer module and a tensor concatenation and fusion mechanism to extend the receptive field beyond that of traditional CNNs. It was used for traditional concrete, grout consolidation, and fiber-reinforced concrete with high-quality segmentation. All IoU, Dice, and ACC scores exceeded 90%, with mean scores of 99.44%, 96.70%, and 98.31%, respectively. Cao et al. (2023) focused on simplifying pathology localization in the diagnosis of AD with an end-to-end automatic localization framework named AutoLoc. Their method predicts the coordinates of the most disease-related regions in each sMRI slice. The patch-cropping operation, which is not differentiable, is approximated using bilinear interpolation; thus, no obstacles to gradient backpropagation are introduced, enabling joint optimization of localization and diagnostic tasks. The architecture identified brain regions such as the rostral hippocampus and globus pallidus as most strongly linked to AD.
Carvalho et al. (2020) presented a dynamic decision model that learns automatically using supervised machine learning algorithms. This model ranks and compares several decision frameworks based on classifier performance metrics, accounting for patient information reported by health centers and adherence to local clinical guidelines. The optimum model is selected for diagnosing dementia, Alzheimer’s disease, and mild cognitive impairment (MCI). The model was tested on data from the Center for Alzheimer’s Disease of the Institute of Psychiatry, Federal University of Rio de Janeiro, and the Center of Reference in Elderly Health Care of Antonio Pedro Hospital. This adaptive, dynamic model, which changes in response to new diagnostic criteria or local clinical practice, represents an effective, individualized tool for diagnosing dementia, AD, and MCI, the authors concluded. Yu et al. (2024) developed an advanced framework that incorporated sMRI, clinical, and genetic information in 1,651 subjects in the ADNI database. The framework employed a Patch-CNN block, in which the AD-Transformer translated image data into tokens, and a linear projection layer projected non-image data into related tokens. AD-Transformer established new benchmarks in AD diagnosis and MCI conversion prediction, with excellent average area under the curve (AUC) values of 99% and 85%, respectively. This surpassed conventional image-only models and other multimodal methods, demonstrating the strength of their integrated data fusion strategy. Muksimova et al. (2025b) enhance the YOLOv5m model for brain tumor detection by integrating an Enhanced Spatial Attention (ESA) layer, which focuses on salient MRI features. Tested on the Figshare dataset, the modified model achieves higher accuracy, sensitivity, and specificity in classifying meningioma, pituitary, and glioma tumors. The ESA layer reduces false positives and improves detection reliability, making it suitable for real-time clinical applications. The approach demonstrates the potential of deep learning to advance automated brain tumor diagnosis. Muksimova et al. (2025a) present FusionNet, a deep learning model that integrates multimodal (MRI, PET, CT) and longitudinal imaging data to improve Alzheimer’s disease diagnosis. By combining advanced techniques like GANs, lightweight neural networks, and attention mechanisms, FusionNet achieves high accuracy (94%) with balanced precision and recall. The model enhances early detection, tracks disease progression, and offers insights into underlying pathology. Its modular design allows adaptation to other diagnostic tasks, supporting personalized patient care. Overall, FusionNet signifies a significant advancement in neurodegenerative disease diagnostics.
Recent breakthroughs in machine learning and deep learning have dramatically enhanced the diagnosis and progression prediction of AD and other cognitive disorders. Novel methods based on multimodal data fusion, new architectural concepts, and efficient optimization techniques have shown promise for overcoming issues in medical image segmentation, cognitive assessment, and pathology localization. However, even with these significant advances, there remain issues in the efficient analysis and integration of multimodal data in cognitive evaluations.
Materials and Methods
Problem statement
Alzheimer’s disease is a progressive neurodegenerative disorder that is usually identified by cognitive decline, memory impairment, and functional disabilities. Early and accurate prediction of AD is vital for timely intervention and treatment. The heterogeneous nature of Alzheimer’s pathology necessitates leveraging multimodal data sources, including MRI, PET, and neuropsychological test scores, which collectively capture structural, metabolic, and cognitive biomarkers. Despite the complementary nature of these modalities, current approaches often fail to integrate multimodal features effectively, resulting in suboptimal performance in AD prediction. Mathematically, the problem involves learning a predictive function and is presented in Eq. (1).
(1) where depicts an MRI image, depicts a PET image and depicts neurological test scores for n samples, and presents 0—Alzheimer’s Disease (AD), 1—Mild Cognitive Impairment (MCI), or 2—Cognitive Normal (CN).
Dataset
This study used the Alzheimer’s Disease Neuroimaging Initiative (ADNI) dataset, a publicly available, curated resource for neuroimaging and clinical data. The dataset is accessible at: https://adni.loni.usc.edu/data-samples/adni-data/. Table 1 summarizes the key characteristics of the ADNI dataset, including the distribution of samples across different disease categories (Alzheimer’s Disease (AD), Mild Cognitive Impairment (MCI), and Cognitively Normal (CN)), as well as the data modalities available (MRI, PET, and neuropsychological tests).
| Characteristic | AD (Alzheimer’s disease) | MCI (Mild cognitive impairment) | CN (Cognitively normal) |
|---|---|---|---|
| Total samples | 61 | 114 | 105 |
| Percentage of total samples | 21.79% | 40.71% | 37.50% |
| MRI samples | 61 | 114 | 105 |
| PET samples | 61 | 114 | 105 |
| Neuropsychological test samples | 61 | 114 | 105 |
| Age (Average ± Std. Dev.) | 73.1 ± 7.6 | 70.3 ± 7.4 | 72.0 ± 6.8 |
| Gender distribution (Male/Female) | 35/26 | 65/49 | 54/51 |
| Clinical stage distribution | – | 61 Early MCI, 53 Late MCI | – |
| Mini-Mental State Examination (MMSE) (Average ± Std. Dev.) | 18.2 ± 4.7 | 24.3 ± 3.6 | 29.0 ± 0.8 |
| ADAS-Cog scores (Average ± Std. Dev.) | 21.5 ± 5.9 | 17.4 ± 5.2 | 6.5 ± 2.3 |
| Neuropsychological test scores | Varies by test | Varies by test | Varies by test |
The ADNI dataset consists of 500 samples, categorized into three clinical groups: 109 individuals with AD, 204 with MCI, and 187 with CN status. The dataset comprises data from three modalities—MRI, PET scans, and neuropsychological tests—with each sample containing values across all modalities. The age distributions vary slightly across groups, with average ages of 73.1 ± 7.6 years for the AD group, 70.3 ± 7.4 years for the MCI group, and 72.0 ± 6.8 years for the CN group. Gender distribution is relatively balanced in the MCI and CN groups, while the AD group shows a slightly higher proportion of males. The cognitive scores further differentiate the groups, with the Mini-Mental State Examination (MMSE) revealing lower cognitive performance in the AD group (18.2 ± 4.7), moderate performance in the MCI group (24.3 ± 3.6), and near-normal scores for the CN group (29.0 ± 0.8). The Alzheimer’s Disease Assessment Scale-Cognitive Subscale (ADAS-Cog) scores corroborate this trend, with the AD group having the highest cognitive impairment (21.5 ± 5.9), followed by the MCI group (17.4 ± 5.2), and CN individuals (6.5 ± 2.3). The PET and neuropsychological test scores, though not detailed in this table, further contribute to the differentiation between these clinical groups. This dataset is valuable for understanding the progression of Alzheimer’s disease and for developing predictive models that integrate multimodal data for more accurate diagnosis and prognosis. Finding records with all three modalities (MRI, PET, and neuropsychological assessments) aligned for the same patient is challenging due to data privacy, acquisition costs, and protocol differences. ADNI remains the most comprehensive public dataset offering this multimodal alignment; other sources, such as OASIS, often lack PET scans or synchronized assessments, limiting direct comparability.
Dataset split strategy
The ADNI dataset (n = 500) was split into training, validation, and test sets using stratified sampling to maintain class balance across the AD, MCI, and CN categories. Approximately 70% of the data (350 samples: 76 AD, 143 MCI, 131 CN) were allocated for training, 15% (75 samples: 16 AD, 31 MCI, 28 CN) for validation, and 15% (75 samples: 17 AD, 30 MCI, 28 CN) for testing. Stratification ensured proportional representation of each class in all sets, reflecting the original distribution (22% AD, 41% MCI, 37% CN) to prevent bias in model evaluation. This split was implemented using a random sampling method with a fixed seed for reproducibility, and 5-fold cross-validation was further applied on the training set to tune hyperparameters and assess model stability across different data partitions.
Computing infrastructure
All experiments were conducted on a workstation running Ubuntu 22.04 LTS (64-bit). The hardware configuration included an Intel® Core™ i7-12700K CPU @ 3.60 GHz, 32 GB RAM, and a single NVIDIA RTX 3080 GPU with 10 GB VRAM. The deep learning models were implemented in Python 3.10 using TensorFlow 2.10 and PyTorch 2.1. Additional libraries, including scikit-learn 1.3, NumPy 1.26, and OpenCV 4.8, were utilized for data processing and evaluation.
Evaluation method
The evaluation protocol included:
Baseline Comparisons: The UNet++(SA)–MFO Framework was compared with standard single-modal models, simple and weighted voting ensembles, and existing multimodal frameworks.
Ablation Studies: Ablation experiments were conducted to assess the effect of each modality, feature fusion, self-attention, Moth Flame Optimization, and ensemble learning.
Comparison with and without Ensembles: The performance of the framework with and without ensemble methods was explicitly evaluated to quantify improvements in robustness and accuracy.
To mitigate the risk of overfitting due to the relatively small sample size (n = 500) and the complexity of the UNet++_(SA)–MFO framework, several strategies were employed. First, a 5-fold cross-validation was implemented, ensuring that the model was trained and validated on different subsets of the ADNI dataset, with each fold maintaining a balanced distribution of AD, MCI, and CN classes. This approach helped assess the model’s generalization across unseen data splits. Second, regularization techniques such as dropout (rate = 0.3) were integrated into the UNet++ architecture at dense layers and attention gates to prevent over-reliance on specific features. Additionally, L2 weight regularization (lambda = 0.01) was applied to the convolutional layers to constrain model complexity. Third, data augmentation techniques, including random rotation (±10 degrees), flipping, and intensity scaling (±10%), were applied to MRI and PET images during training to artificially increase dataset variability and enhance robustness. These combined methods ensured that the model did not overfit to the training data, as evidenced by stable validation performance metrics across folds (e.g., validation accuracy within ±2% of training accuracy).
Statistical significance and effect sizes
We assess the statistical significance of improvements using per-run (5 seeds) metrics on the held-out test sets (75 subjects each). For Accuracy and F1, we apply a paired t-test across runs between the proposed UNet++(SA)–MFO and each baseline; if normality (Shapiro–Wilk) is violated, we use the Wilcoxon signed-rank test. For AUC-ROC, we compute OvR macro-AUC per run and apply a paired t-test across runs; we also estimate 95% confidence intervals for AUC via 1,000 bootstrap resamples per run. Effect sizes are reported as Cohen’s d for t-tests or Cliff’s delta for Wilcoxon tests. We consider p < 0.05 to be statistically significant after the Benjamini–Hochberg correction for multiple comparisons.
Assessment metrics
The following metrics were used for quantitative evaluation: Accuracy, Precision, Recall, F1-score, and Area Under the Receiver Operating Characteristic Curve (AUC-ROC).
Accuracy measures the overall proportion of correct predictions.
Precision is the proportion of true positives among all positive predictions, which is important for minimizing false positives.
Recall (sensitivity) measures the proportion of true positives correctly identified, which is crucial for early disease detection.
F1-score is the harmonic mean of precision and recall, providing a balanced measure, especially for imbalanced datasets.
AUC-ROC evaluates the model’s ability to distinguish between classes across all thresholds.
These metrics collectively provide a comprehensive assessment of the model’s correctness and reliability, which is essential for potential clinical application.
UNet++(SA)–MFO framework
This work aimed to design an efficient, comprehensive system for predicting Alzheimer’s disease by integrating multimodal inputs, including MRI, PET, and neuropsychological test data. Rationale for base learners: We selected SVM (RBF), kNN, and Random Forest as base learners over the fused features because (i) they perform robustly on small-to-moderate datasets (n = 500) with high-dimensional, nonlinearly separable representations; (ii) they are relatively stable under class imbalance after calibration (e.g., Platt scaling for SVM) and provide complementary decision biases (margin-based, local-neighborhood, and bagged tree ensembles); and (iii) they offer fast, well-understood training with interpretable importance estimates (RF). While modern alternatives such as gradient boosting (XGBoost/LightGBM) and deep ensembles are powerful for tabular data, pilot tests and prior literature indicate that they require extensive hyperparameter tuning and larger validation budgets to avoid overfitting. Our weighted stacking emphasizes complementary error patterns and probability calibration, yielding consistent gains without increasing training complexity. Future work will benchmark gradient boosting and deep ensemble variants within the same fusion pipeline under an identical data split.
The proposed –MFO framework includes a UNet++ architecture augmented with self-attention mechanisms, optimized using the Moth Flame Optimization (MFO) algorithm, and integrated with an ensemble learning to enhance the prediction accuracy and robustness. This dataset consists of tabular MRI and PET images, and neuropsychological test results. The proposed framework introduces a UNet++ neural network integrated with attention gates at skip connections.
Attention gate
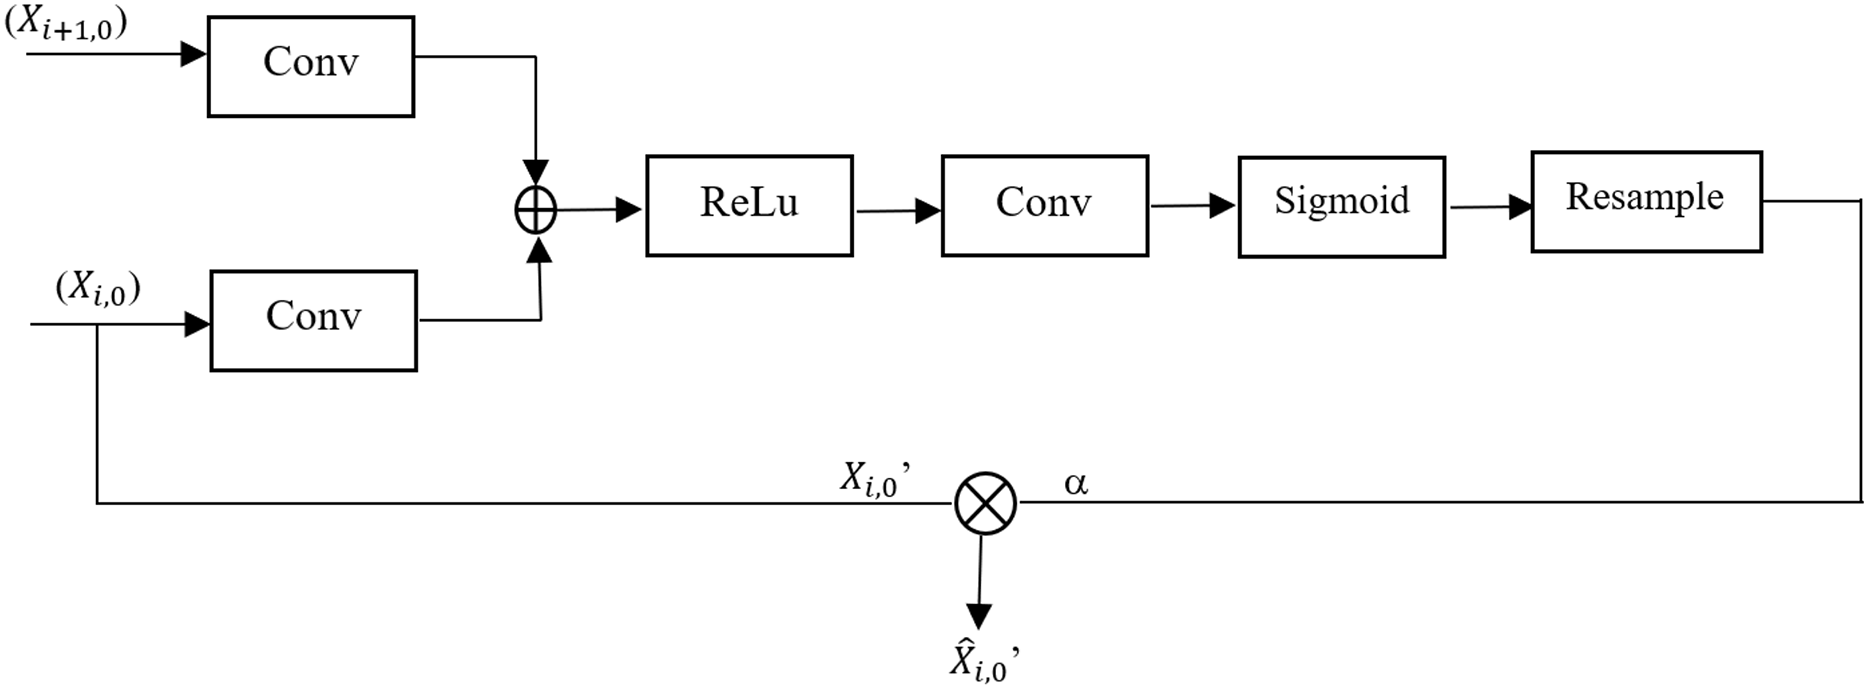
Attention mechanisms have been effectively integrated into deep learning models to improve performance across various applications, including image denoising and extracting features from complex networks. These mechanisms enable models to concentrate on the most relevant parts of data, thereby enhancing their ability to extract and preserve critical features. Specifically, self-attention mechanisms excel at capturing relationships between any two positions within the data, enabling the modeling of long-range dependencies without significantly increasing computational or storage costs (Sulaiman et al., 2024). To address the focus on locations associated with impact features, the proposed framework incorporates an Attention Gate into the UNet++ model. Figure 1 depicts the configuration of the attention gate. Attention Gate takes two inputs: (i) upsampling function from the decoder path ( ) which acts as a gating signal and corresponding feature map from the encoder path ( ). The gating signal guides the network to signify target regions relevant to the segmentation task by suppressing irrelevant areas. This leads to improved learning of crucial regions associated with the target region. Attention Gate improves semantic information generation via skip connections; to achieve this, a sigmoid activation function is employed to optimize the convergence of parameters of the gate and later calculates the attention coefficient α. Coefficients are later used to amplify encoder feature maps via pixel-wise multiplication, yielding the final refined output.
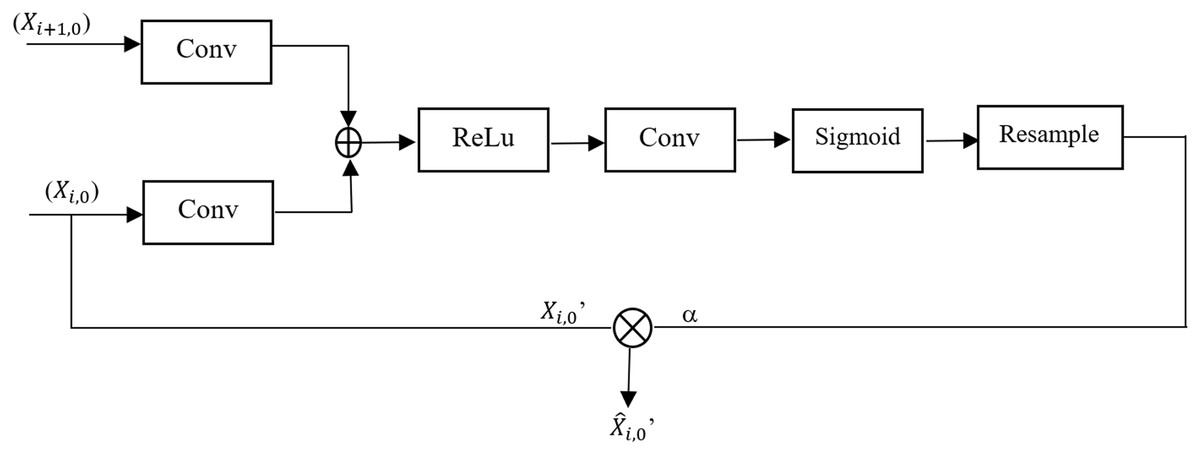
Figure 1: Architecture of the attention gate module in UNet++.
Let and are learnable weights, and the encoder and decoder features are
(2)
(3)
Equations (2) and (3) ensure that both encoder and decoder features align in the same dimensional space; * denotes the convolution operation. Attention score α is calculated as the combination of learnable parameters like and encoder and decoder features like E and D, and an activation function (which scales the attention score to [0, 1]). Equation (4) defines the attention score α
(4)
The computed attention score α is used to scale the encoder feature map , Eq. (5) defines the scaled encoder feature map
(5) where denotes element-wise multiplication. is the redefined feature map which passes relevant information only to the decoder.
UNet++ augmented with self attention
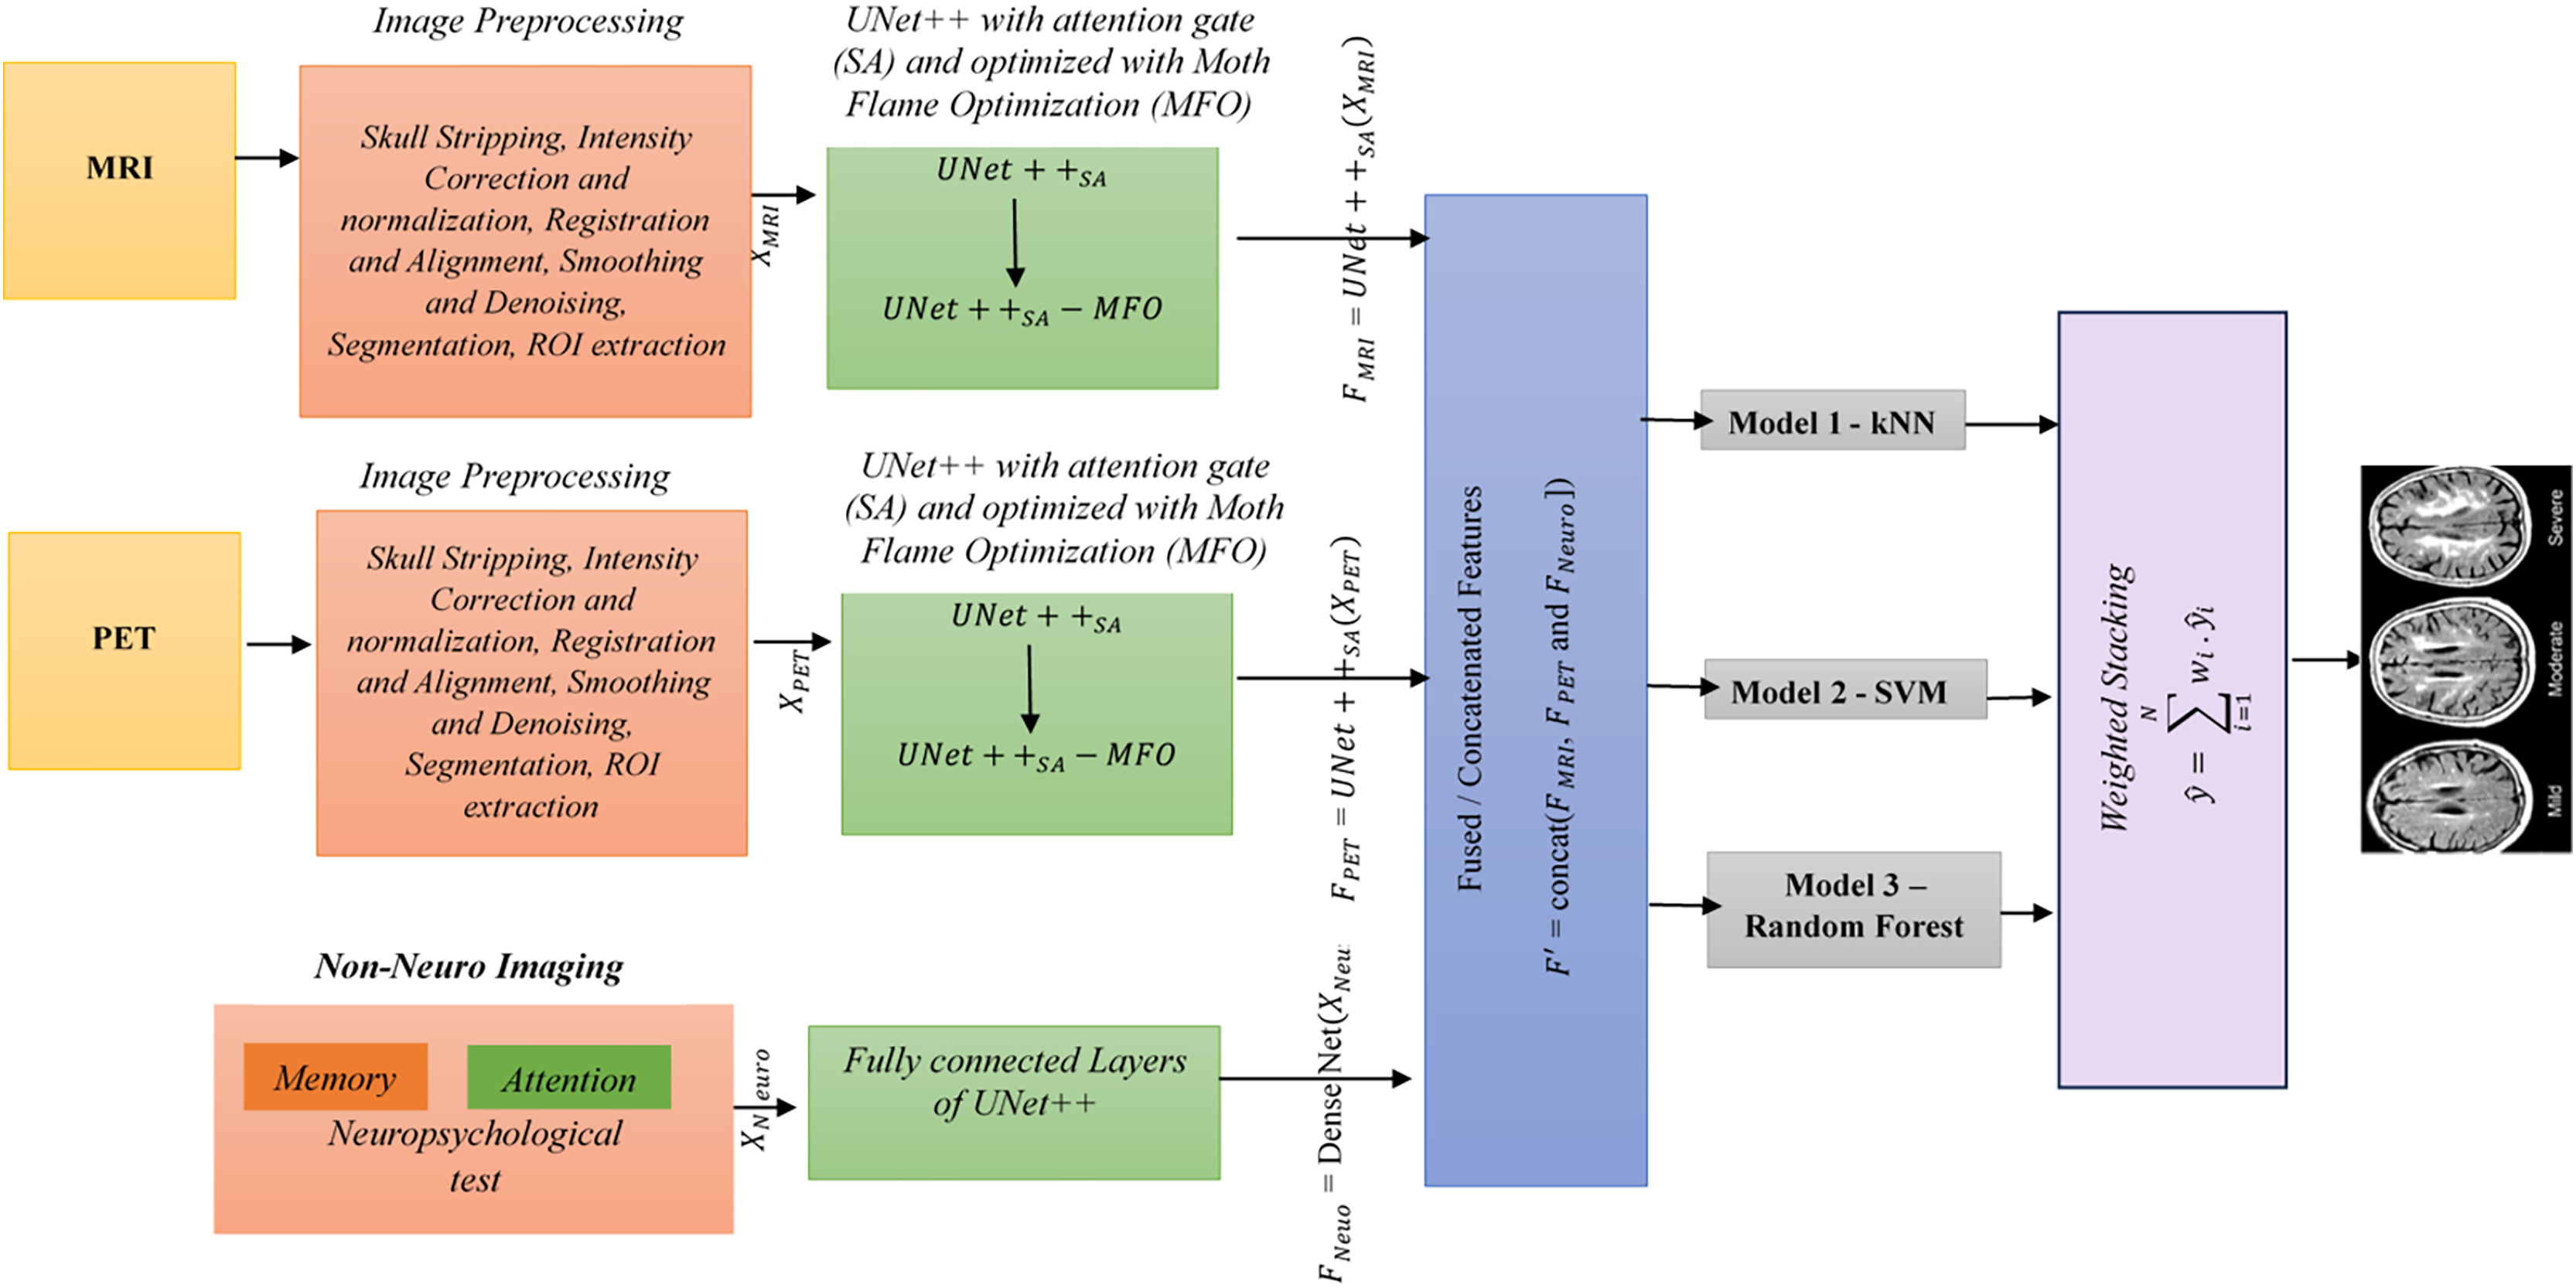
UNet++ is a segmentation method based on the UNet algorithm. The location and boundaries of the objects being learned cannot be defined in a UNet, as it requires uniform information across the region to be segmented. UNet++ has been designed to address the limitations of UNet. The encoder and decoder features are connected, and UNet++ integrates features from the intermediate node via nested skip connections. This framework uses UNet++ augmented with a self-attention mechanism, which combines the strengths of UNet++ and Attention Gates. This UNet++(SA)–MFO Framework integrates an encoder-decoder architecture with an integrated Attention Gate at the skip connection. Here, data from different nodes in the integration are on the same scale. The feature maps at various levels of UNet++ contain detailed information about the same image. Node decoder path captures spatial information of the object, such as edges and contours. As A node deeper in the mesh has stronger semantic information about the image. UNet++ utilizes dense skip connections to propagate information from the encoder to the decoder. However, not all features passed through these connections are equally significant; some may be redundant or irrelevant at multiple times. This may degrade medical imaging tasks, such as Alzheimer’s disease prediction. To address the above issue, Attention Gates are incorporated into skip connections, enabling the decoder to selectively focus on the most relevant encoder features by learning attention weights. This ensures (i) reduction of irrelevant information in feature maps, (ii) enhanced localization of significant features, and (iii) enhanced overall performance in multimodal tasks. Figure 2 explains the proposed framework. The various stages of the proposed framework are as follows:
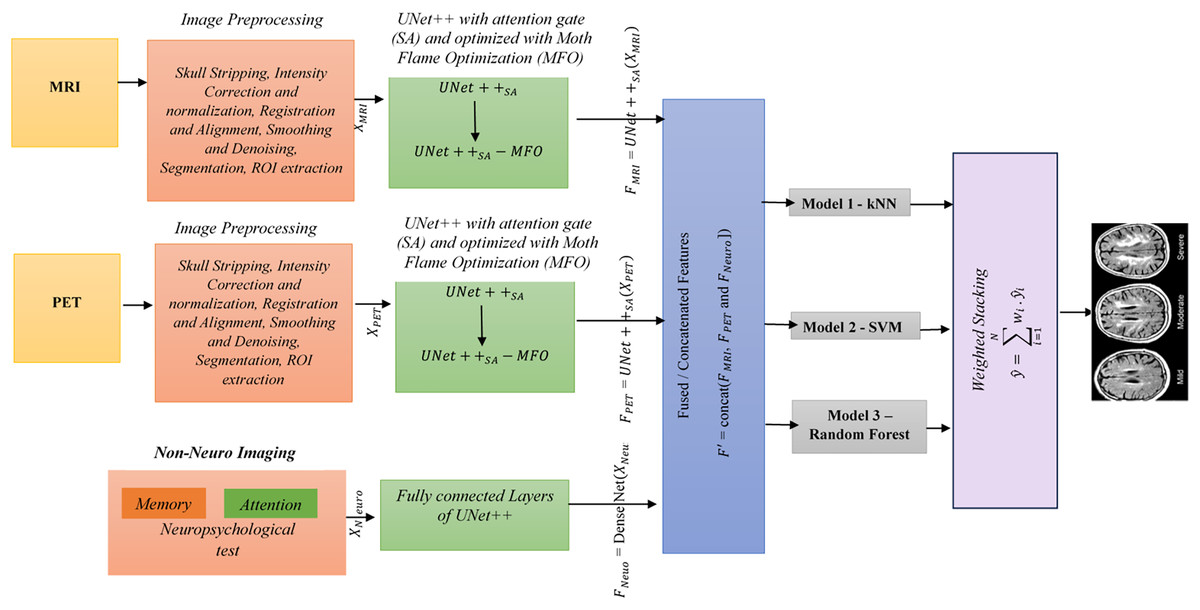
Figure 2: Overall architecture of the proposed framework.
Stage 1 (Preprocessing): Skull stripping, intensity correction and normalization, registration and alignment, smoothing and denoising, segmentation, and ROI extraction are done on MRI and PET images. Neuropsychological test data from the ADNI dataset, comprising 10 features per sample (e.g., MMSE, ADAS-Cog scores), were preprocessed to ensure compatibility with the UNet++(SA) framework for multimodal integration. First, numerical features were normalized using z-score standardization (mean = 0, standard deviation = 1) to align their scales with those of image-derived features, preventing dominance by larger test scores during feature fusion. This was computed as z = (x − μ)/σ, where x is the raw score, μ is the mean, and σ is the standard deviation across the training set for each feature. Second, missing values, which occurred in less than 5% of samples, were handled using mean imputation based on the training set’s feature-wise averages to maintain dataset integrity. Third, the normalized test data were encoded into a dense vector representation via a fully connected layer (DenseNet) with 64 units and ReLU activation, resulting in a feature vector F(Neuro) of size 128 × 128 × 10 after reshaping to match the spatial dimensions of image features for concatenation (Stage 4: Feature Fusion). This preprocessing ensured seamless integration with MRI and PET features, preserving clinical relevance in the fused feature set F′.
Stage 2 (Feature Extraction using ): UNet++ is enhanced with a self-attention mechanism. The attention gates are placed in a dense skip connection that collects the current node’s path inputs and up-samples from the down layer to capture spatial context. For each modality, extracted features using are (1) = , (2) = and (3) = DenseNet , , and represents features.
Stage 3 (Hyperparameter Optimization): Moth Flame optimization (MFO) is used to finetune .
MFO is a metaheuristic proposed by Mirjalili (2015) based on the swarming behavior of moths. This population-based optimization method imitates the behavior of moths drawn into a light source to find the best possible solution. It combines local search strategies and population-based algorithms to enhance local and global exploration of the solution space (Tapasvi, Gnanamanoharan & Kumar, 2024). MFO is used to identify the optimal hyperparameter set for UNet++ and ensures high accuracy, faster convergence, and better generalization. Hyperparameters, such as learning rate, number of filters (n), and dropout rate (p), are tuned using MFO. Self-attention in UNet++ enhances the model’s ability to capture both spatial relationships and global contexts. MFO can fine-tune the attention parameter mechanism, such as the number of attention heads and the attention scaling factor. The finetuned parameters help UNet++ to extract more semantic features from multimodal inputs.
Step1: Let be candidate solutions to encode the hyperparameters of {learning rate η, number of filters , dropout rate p, batch size b, number of attention heads , attention scaling s} in the optimization process and represents the best solution found.
Step 2: The transverse orientation behavior of moth candidates is defined as the navigation strategy of maintaining a fixed angle relative to the light source. Equation (6), defines the navigation of a moth using a logarithmic spiral. (6)
is the new position of the ith moth, is jth flame, i.e., the best solution, b is a constant that controls the spiral shape, D is Euclidean distance between flame and moth, r is a random number in range [0, 1], which introduces randomness of exploration.
Stage 4 (Feature Fusion): , and are concatenated to create a fused feature
= concat ( , and ])
Stage 5 (Classification): Fused features are passed to classification algorithms SVM, kNN, and Random Forest.
Stage 6 (Ensemble Method): Predictions from various models are combined using a weighted stacking ensemble. , where is the weight associated with the ith classifier.
Layer descriptions for proposed UNET++
The input image size after preprocessing is 128 × 128 × 1 for each modality (MRI and PET), and 1 × 10 for neuropsychological tests (10 test features). These neuropsychological features are then concatenated with image features during the decoder phase to create the multimodal representation. The following describes each layer in the framework. Final Layer results: multi-class probabilities for AD, CN, and MCI. Sizes of attention gates at is 128 × 128 × 64, is 64 × 64 × 128, is 32 × 32 × 256 and is 16 × 16 × 512. The output layer takes 128 × 128 × 64 as input size. The neuropsychological test vector of size 128 × 128 × 10 is concatenated at the decoder path, resulting in an output size of 128 × 128 × 3. This process involves a 2D convolution operation and SoftMax activation.
| Layer | Input size | Output size | Operation |
|---|---|---|---|
| 128 × 128 × 2 | 128 × 128 × 64 | 2D Conv (3 × 3) + BatchNorm + ReLu | |
| 128 × 128 × 64 | 64 × 64 × 128 | MaxPooling (2 × 2), Conv (3 × 3) + ReLu | |
| 64 × 64 × 128 | 32 × 32 × 256 | MaxPooling (2 × 2), Conv (3 × 3) + ReLu | |
| 32 × 32 × 256 | 16 × 16 × 512 | MaxPooling (2 × 2), Conv (3 × 3) + ReLu | |
| 16 × 16 × 512 | 8 × 8 × 1024 | MaxPooling (2 × 2), Conv (3 × 3) + ReLu |
| Layer | Input size | Output size | Operation |
|---|---|---|---|
| Skip at level 1 | 64 × 64 × 128 | 64 × 64 × 128 | Direct connection |
| Skip at level 2 | 32 × 32 × 256 | 32 × 32 × 256 | Direct connection |
| Skip at level 3 | 16 × 16 × 512 | 16 × 16 × 512 | Direct connection |
| Layer | Input size | Output size | Operation |
|---|---|---|---|
| 8 × 8 × 1,024 + Skip | 16 × 16 × 512 | Upsample (2 × 2), Conv (3 × 3) + ReLu | |
| 16 × 16 × 512 + Skip | 32 × 32 × 256 | Upsample (2 × 2), Conv (3 × 3) + ReLu | |
| 32 × 32 × 256 + Skip | 64 × 64 × 128 | Upsample (2 × 2), Conv (3 × 3) + ReLu | |
| 64 × 64 × 128 + Skip | 128 × 128 × 64 | Upsample (2 × 2), Conv (3 × 3) + ReLu |
Moth flame optimization
Evaluate fitness for every moth , using objective function F ( , is the present hyperparameters to train for a few epochs e and PE is the performance metrics like Accuracy, Dice Score, etc. Fitness value is assigned as calculated in Eq. (7) and the goal is to minimize . (7)
update the flames as the top k-best solutions of fitness after the flame-reduction mechanism. It balances exploitation and exploration through a gradual reduction in the number of flames, as shown in Eq. (8). (8)
where N is the initial number of flames (equal to the initial population size of moths), t is the current iteration number (representing the step in the optimization process, ranging from 1 to T), and T is the maximum number of iterations. This formula dynamically reduces the number of flames over iterations to balance exploration and exploitation in the MFO algorithm.
Repeat steps 2 to 4 until the best flame is found as an optimal solution.
MFO hyperparameter configuration
The MFO algorithm was configured with specific hyperparameters to effectively optimize the UNet++_(SA) framework. The initial population size was set to 30 moths (candidate solutions), balancing exploration and computational efficiency for a small-to-medium search space of hyperparameters (e.g., learning rate, number of filters, dropout rate). The maximum number of iterations (T) was set to 50, allowing sufficient convergence while avoiding excessive computation time, based on preliminary tests showing that fitness values stabilized after approximately 40 iterations. The number of flames (best solutions) was dynamically reduced per iteration using Eq. (8), starting from 30 and decreasing to 1, to shift the focus from exploration to exploitation. The fitness function (Eq. (7)) minimized negative accuracy on a validation subset, and convergence was assessed when the best flame’s fitness improvement fell below a threshold of 0.001 over 5 consecutive iterations. The spiral shape constant (b) was set to 1, as per (Mirjalili, 2015), to ensure a logarithmic spiral path for moths. These configurations were empirically validated on a subset of the ADNI dataset (50 samples) to ensure optimal tuning before complete training.
Classifiers
Classifiers like kNN. SVM and Random Forest are explored on fused features .
k-Nearest Neighbors
This is the simplest classification method and belongs to supervised learning in machine learning. This method is otherwise known as lazy learning. kNN functions by locating the k closest data points to an unseen/unlabeled sample. The variable ‘k’ is a user-defined parameter that significantly impacts the algorithm’s performance. After identifying these closest neighbors, the algorithm uses their labels (in classification tasks) or values (in regression tasks) to generate predictions. The procedure for determining the closest neighbors is to calculate the distance between each data point and every other data point. Euclidean, Manhattan, Hamming, Chebychev, Minkowski, and Urban block are effective distance metrics for measuring the distance between two neighbors. The selection of a distance metric can have a substantial impact on the algorithm’s effectiveness and is usually determined by the data’s characteristics. Euclidean distance is commonly used and is the square root of the sum of squares of differences between two nearby samples. Let be the fused feature of and be the fused feature of Eq. (9) presents the distance between two data points. In the context of multimodal input of PET and MRI feature arrays, kNN computes the distance between query points, and the label for the query is determined by majority voting among k-Nearest Neighbors. An important benefit of kNN is its nonparametric nature, which means it does not rely on assumptions about the data distribution. This characteristic makes it highly adaptable and suitable for a diverse array of datasets.
(9) where is the kth fused instance of , n is the number of samples.
Support vector machine
SVMs are a robust and adaptable technique for supervised learning, widely recognized for their efficacy in multi-class classification. SVM is a highly suitable option for tasks like AD prediction, where the goal is to categorize individuals into three groups: Normal (0), MCI (1), and AD (2). The fundamental principle of SVM is to identify an optimal hyperplane that effectively splits samples into distinct groups. When predicting AD, it is necessary to differentiate between data points from individuals without AD and those with AD. SVM aims to optimize the distance between the hyperplane and the closest data point from each category. The data points that have the shortest distance to the hyperplane and have a significant impact on its position and orientation are referred to as support vectors, thereby giving the procedure its name. The decision function for the multi-class SVM is presented in Eq. (10).
(10) where w is the weight vector, Φ (.) is the kernel function, and b is the bias. The output class is determined using Eq. (11).
(11) The fused feature is used to train a binary-class SVM (one per class), and the final prediction is based on the highest decision score for each class. The above strategy leverages the fused information from MRI and PET modality to enhance the multi-class performance of SVM for AD diagnosis.
Random forest
A Random Forest is an ensemble of decision trees, where each tree is trained on a bootstrapped subset of the training data. Equation (12) defines the predictions by a random forest on fused features . The trees are grown by recursively splitting the data based on features and thresholds that maximize information gain, allowing the model to get complex insights from fused MRI and PET features. For prediction, features from a new test sample are extracted, fused, and passed through each tree in the forest. The final predicted is estimated by majority voting or averaging of all predictions.
(12) where presents individual predictions from every decision tree in a random forest ensemble. The mode function selects the class that appears most frequently among other predictions. The number of estimators is set to n = 1,000.
Weighted stacking
Weighted stacking is a variant of stacking ensemble learning in which multiple base models contribute to the final prediction with different importance weights. Instead of training a meta-learner to combine the base models’ outputs, weighted stacking assigns predefined or optimized weights to each model’s prediction before aggregating them. Equation (13) depicts weighted stacking across the three base models (kNN, SVM, and Random Forest). is the predictions of base models in the framework.
(13)
Weight optimization in ensemble stacking
In the weighted stacking ensemble (Stage 6), weights (w_i) for the base classifiers’ predictions (SVM, kNN, Random Forest) were optimized using a grid search on the validation set (15% of the ADNI dataset, 42 samples) to maximize overall accuracy. The weight range was set to 0.1–0.9 with a step of 0.1, ensuring that the sum of the weights equals 1 (i.e., w_1 + w_2 + w_3 = 1). The optimization prioritized classifiers with higher individual performance on the validation set, resulting in final weights of w_SVM = 0.4, w_kNN = 0.2, and w_RandomForest = 0.4, reflecting SVM and Random Forest’s superior accuracy in preliminary tests (e.g., SVM achieved 89% validation accuracy vs. kNN’s 85%). These weights were applied to combine predictions as per Eq. (13), ensuring that the ensemble leverages each classifier’s strengths adaptively. This optimization process was repeated across a 5-fold cross-validation to confirm stability, with weight variations within ±0.05 across folds, demonstrating robustness in the weighting strategy.
Handling missing modality data
To address the practical challenge of missing or incomplete modality data in clinical settings, the proposed UNet++_(SA)–MFO framework incorporates a modality-agnostic strategy during feature fusion and classification. In cases where one or more modalities (MRI, PET, or neuropsychological tests) are unavailable, the framework dynamically adjusts by assigning zero-valued feature vectors to the missing modality during the concatenation step (Stage 4: Feature Fusion), ensuring that the fused feature set F’ maintains a consistent dimensionality for downstream classification. Additionally, an imputation strategy was tested during ablation studies, in which missing modality features were approximated using the mean feature values from the training set for the respective modality. While this imputation method resulted in a slight performance drop (e.g., a 2-3% reduction in accuracy per missing modality), it preserved model functionality. Furthermore, the weighted stacking ensemble (Stage 6) was designed to adaptively adjust weights based on available modalities, prioritizing predictions from current data sources (e.g., increasing the weight for MRI-derived predictions when PET is missing). These strategies ensure the framework remains applicable in resource-constrained environments, though future work will explore more sophisticated imputation techniques, such as generative adversarial networks (GANs), to synthesize missing modality data for enhanced robustness.
Real-world clinical workflows often lack one or more modalities. Beyond zero-filling and mean-imputation, we adopt and propose the following strategies:
Modality dropout during training: Randomly drop each modality with a set probability to train encoders and the ensemble to be modality-agnostic. This improves robustness to missing MRI/PET/NP at inference.
Explicit modality masks: Concatenate binary presence/absence masks with fused features, so that downstream classifiers learn to condition their predictions on available inputs.
Adaptive gating: Learn per-modality scalar gates (g_MRI, g_PET, g_NP ∈ [0, 1]) applied to modality-specific features before fusion; gates are optimized to down-weight absent or low-confidence modalities.
Confidence-weighted stacking: Calibrate base learners and up-weight models sourced from available modalities; reduce weights for missing or imputed sources.
Advanced imputation (future work): Cross-modal synthesis with conditional VAEs/GANs to infer PET-like features from MRI (or vice versa), and representation-level imputation via masked autoencoders. We will evaluate these methods under controlled ablations to quantify performance vs computational cost.
Results and discussion
This section presents the performance of the proposed framework against other state-of-the-art methodologies and later examines the impact of MFO optimization and ensembles on it.
Performance analysis
Table 2 compares the efficacy of models using multimodal inputs, including fused features from MRI, PET, and neuropsychological tests. The results are based on the ADNI dataset and include both baseline U-Net models with self-attention and those enhanced with ensemble learning. To demonstrate the robustness of the UNet++_(SA)–MFO framework, performance metrics were averaged across five independent runs, each with a different random seed for data splitting and model initialization, following a 5-fold cross-validation protocol. The reported accuracy of 91% represents the mean across these runs, with a standard deviation (SD) of ±0.8%, indicating consistent performance. Similarly, precision (89.5% ± 0.6%), recall (88.9% ± 0.7%), F1-score (89.2% ± 0.6%), and AUC-ROC (93.5% ± 0.7%) were computed as means with their respective SDs, reflecting minimal variability and high robustness across runs. These averaged results, along with low variances, confirm the framework’s stability against initialization and data split variations, enhancing confidence in its generalizability despite the small dataset size (n = 500). Detailed per-run metrics are summarized in the Supplemental Material for transparency.
| Method | Training data | Class | Precision (%) | Recall (%) | F1-score (%) | Accuracy (%) | AUC-ROC (%) |
|---|---|---|---|---|---|---|---|
| VGG-16 (MRI) | MRI (Individual Modalities) | AD | 82.8 | 82.2 | 81.8 | 84.3 | 86.5 |
| MCI | 84.2 | 84.3 | 84.6 | 84.3 | 87.8 | ||
| CN | 85.7 | 85.8 | 85.7 | 84.3 | 88.4 | ||
| Overall | 84.2 | 84.1 | 84 | 84.3 | 87.5 | ||
| ResNet-50 (PET) | PET (Individual Modalities) | AD | 84.2 | 83.7 | 83.2 | 86.8 | 89.2 |
| MCI | 84.9 | 85.2 | 84.8 | 86.8 | 89.3 | ||
| CN | 86.4 | 86.7 | 86.7 | 86.8 | 89.5 | ||
| Overall | 85.1 | 85.2 | 84.9 | 86.8 | 89.3 | ||
| DenseNet (Neuro Tests) | Neuro Tests (Individual Modalities) | AD | 84.4 | 84.7 | 84.1 | 87.2 | 88.4 |
| MCI | 85.6 | 85.2 | 86.2 | 87.2 | 89.6 | ||
| CN | 87.7 | 86.8 | 87.3 | 87.2 | 90.8 | ||
| Overall | 85.9 | 85.6 | 85.8 | 87.2 | 89.6 | ||
| Multi-Modal CNN | MRI + PET, Neuropsychological Test (Fused) | AD | 85.6 | 85.4 | 86.1 | 88.5 | 90.3 |
| MCI | 86.5 | 86.4 | 87.2 | 88.5 | 90.8 | ||
| CN | 87.4 | 88.1 | 87.3 | 88.5 | 91 | ||
| Overall | 86.5 | 86.6 | 86.8 | 88.5 | 90.7 | ||
| Baseline CNN (MRI Only) | MRI (Individual Modalities) | AD | 81.7 | 81.2 | 81.1 | 82.6 | 85.1 |
| MCI | 77.8 | 77.2 | 76.9 | 82.6 | 83.4 | ||
| CN | 85.2 | 85.7 | 85.8 | 82.6 | 83.8 | ||
| Overall | 81.5 | 81.3 | 81.2 | 82.6 | 84.1 | ||
| Ensemble Model (Simple Voting) | MRI, PET, Neuropsychological Test (Fused) | AD | 87.1 | 87.4 | 87.3 | 88.3 | 90.5 |
| MCI | 85.6 | 85.2 | 85.1 | 88.3 | 89.2 | ||
| CN | 87.4 | 87.2 | 88.3 | 88.3 | 90.1 | ||
| Overall | 86.7 | 86.6 | 86.9 | 88.3 | 89.9 | ||
| Ensemble Model (Bagging) | MRI + PET, Neuropsychological Test (Fused) | AD | 87.5 | 87.2 | 86.8 | 89.2 | 91.2 |
| MCI | 86.7 | 85.8 | 85.1 | 89.2 | 90.3 | ||
| CN | 88.3 | 88.6 | 88.2 | 89.2 | 92.1 | ||
| Overall | 87.5 | 87.2 | 86.7 | 89.2 | 91.2 | ||
| Proposed Framework | SAU-Net (Enhanced with Self-Attention for Multi-Modal Fusion) | AD | 90.5 | 89.8 | 89.3 | 91.0 | 94.1 |
| MCI | 88.7 | 88.4 | 88.9 | 91.0 | 93.2 | ||
| CN | 89.3 | 88.6 | 89.4 | 91.0 | 93.3 | ||
| Overall | 89.5 | 88.9 | 89.2 | 91.0 | 93.5 |
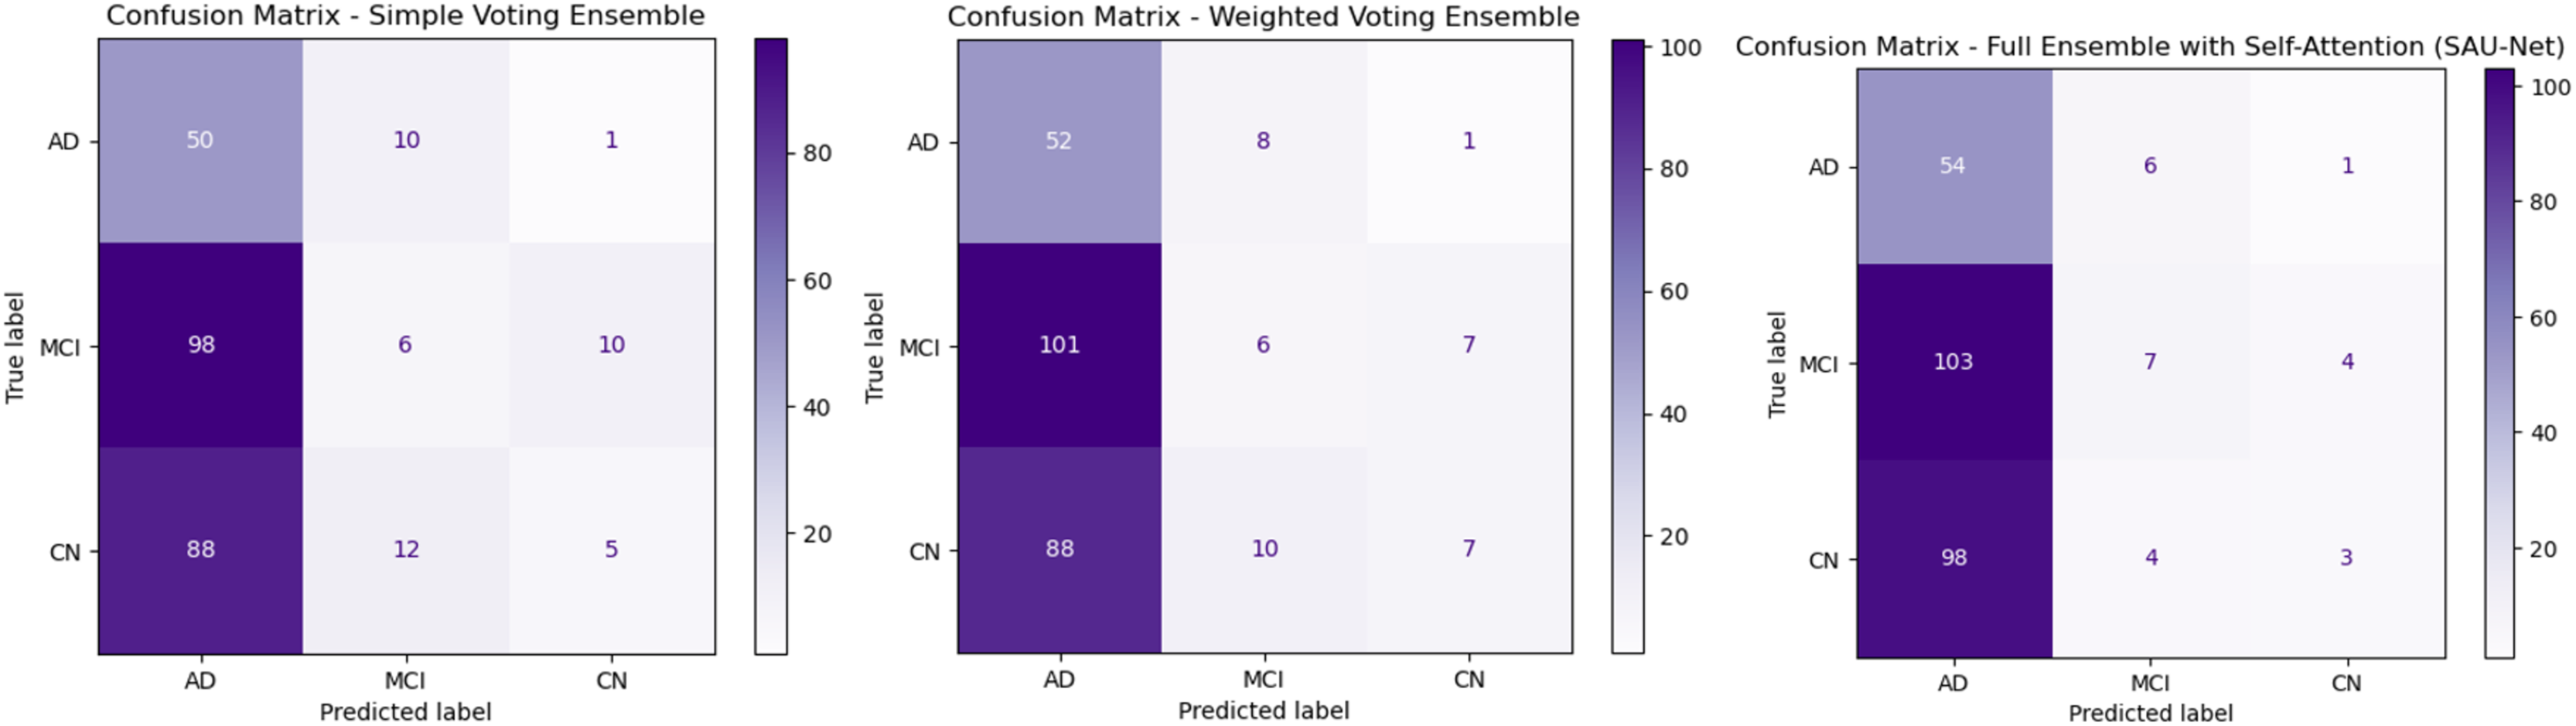
Figure 3A presents the Simple Voting Ensemble as a baseline model for Alzheimer’s disease prediction, aggregating predictions from individual models trained on MRI, PET, and neuropsychological test data via majority voting. With an overall accuracy of 83.6%, this model demonstrates moderate performance. It achieves a recall of 89.3% for AD classification, indicating a high ability to correctly identify AD cases. However, the precision for AD is lower at 80.6%, suggesting a higher occurrence of false positives. The True Negative Rate (TNR) for CN individuals is 90.4%, indicating that the model effectively identifies healthy individuals, yet there is still room for improvement. Although it offers simplicity and ease of implementation, its limited ability to integrate complementary multimodal data and lack of advanced feature fusion or self-attention mechanisms restrict its overall performance, particularly in distinguishing between similar classes such as MCI and CN.
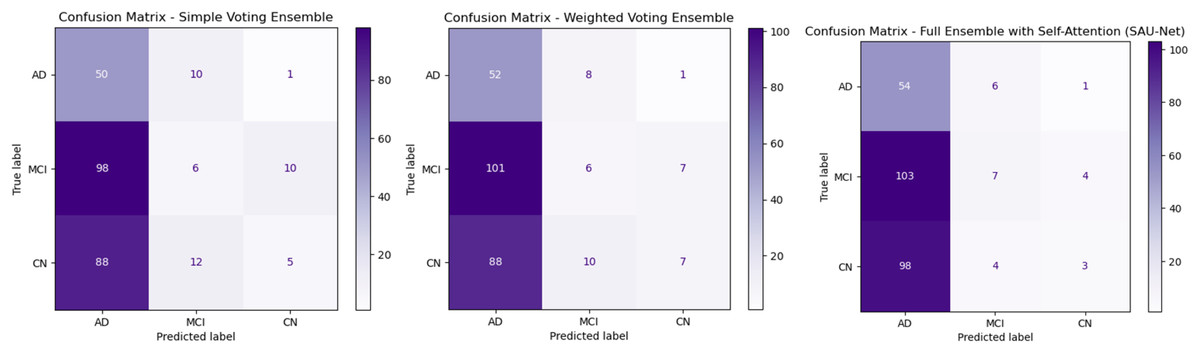
Figure 3: Confusion matrices for ensemble methods: simple voting, weighted voting, proposed framework.
Figure 3B depicts Weighted Voting Ensemble that builds on the Simple Voting model by assigning different weights to each modality based on their individual contribution to the prediction task. This approach enhances the model’s ability to prioritize more informative modalities, such as MRI, over others when necessary. As a result, the Weighted Voting model achieves a slightly improved accuracy of 84.6% compared to the Simple Voting model. Precision for AD improves to 83.9%, and recall increases to 91.2%, reflecting the model’s better performance in both minimizing false positives and correctly identifying AD cases. The TNR also improves to 92.3% for CN classification. While the Weighted Voting Ensemble shows tangible improvements, its reliance on weighted contributions does not fully exploit the complex relationships between different data types. Furthermore, the lack of a self-attention mechanism means the model still struggles to focus on the most critical features in each modality, limiting its overall effectiveness in handling multimodal data.
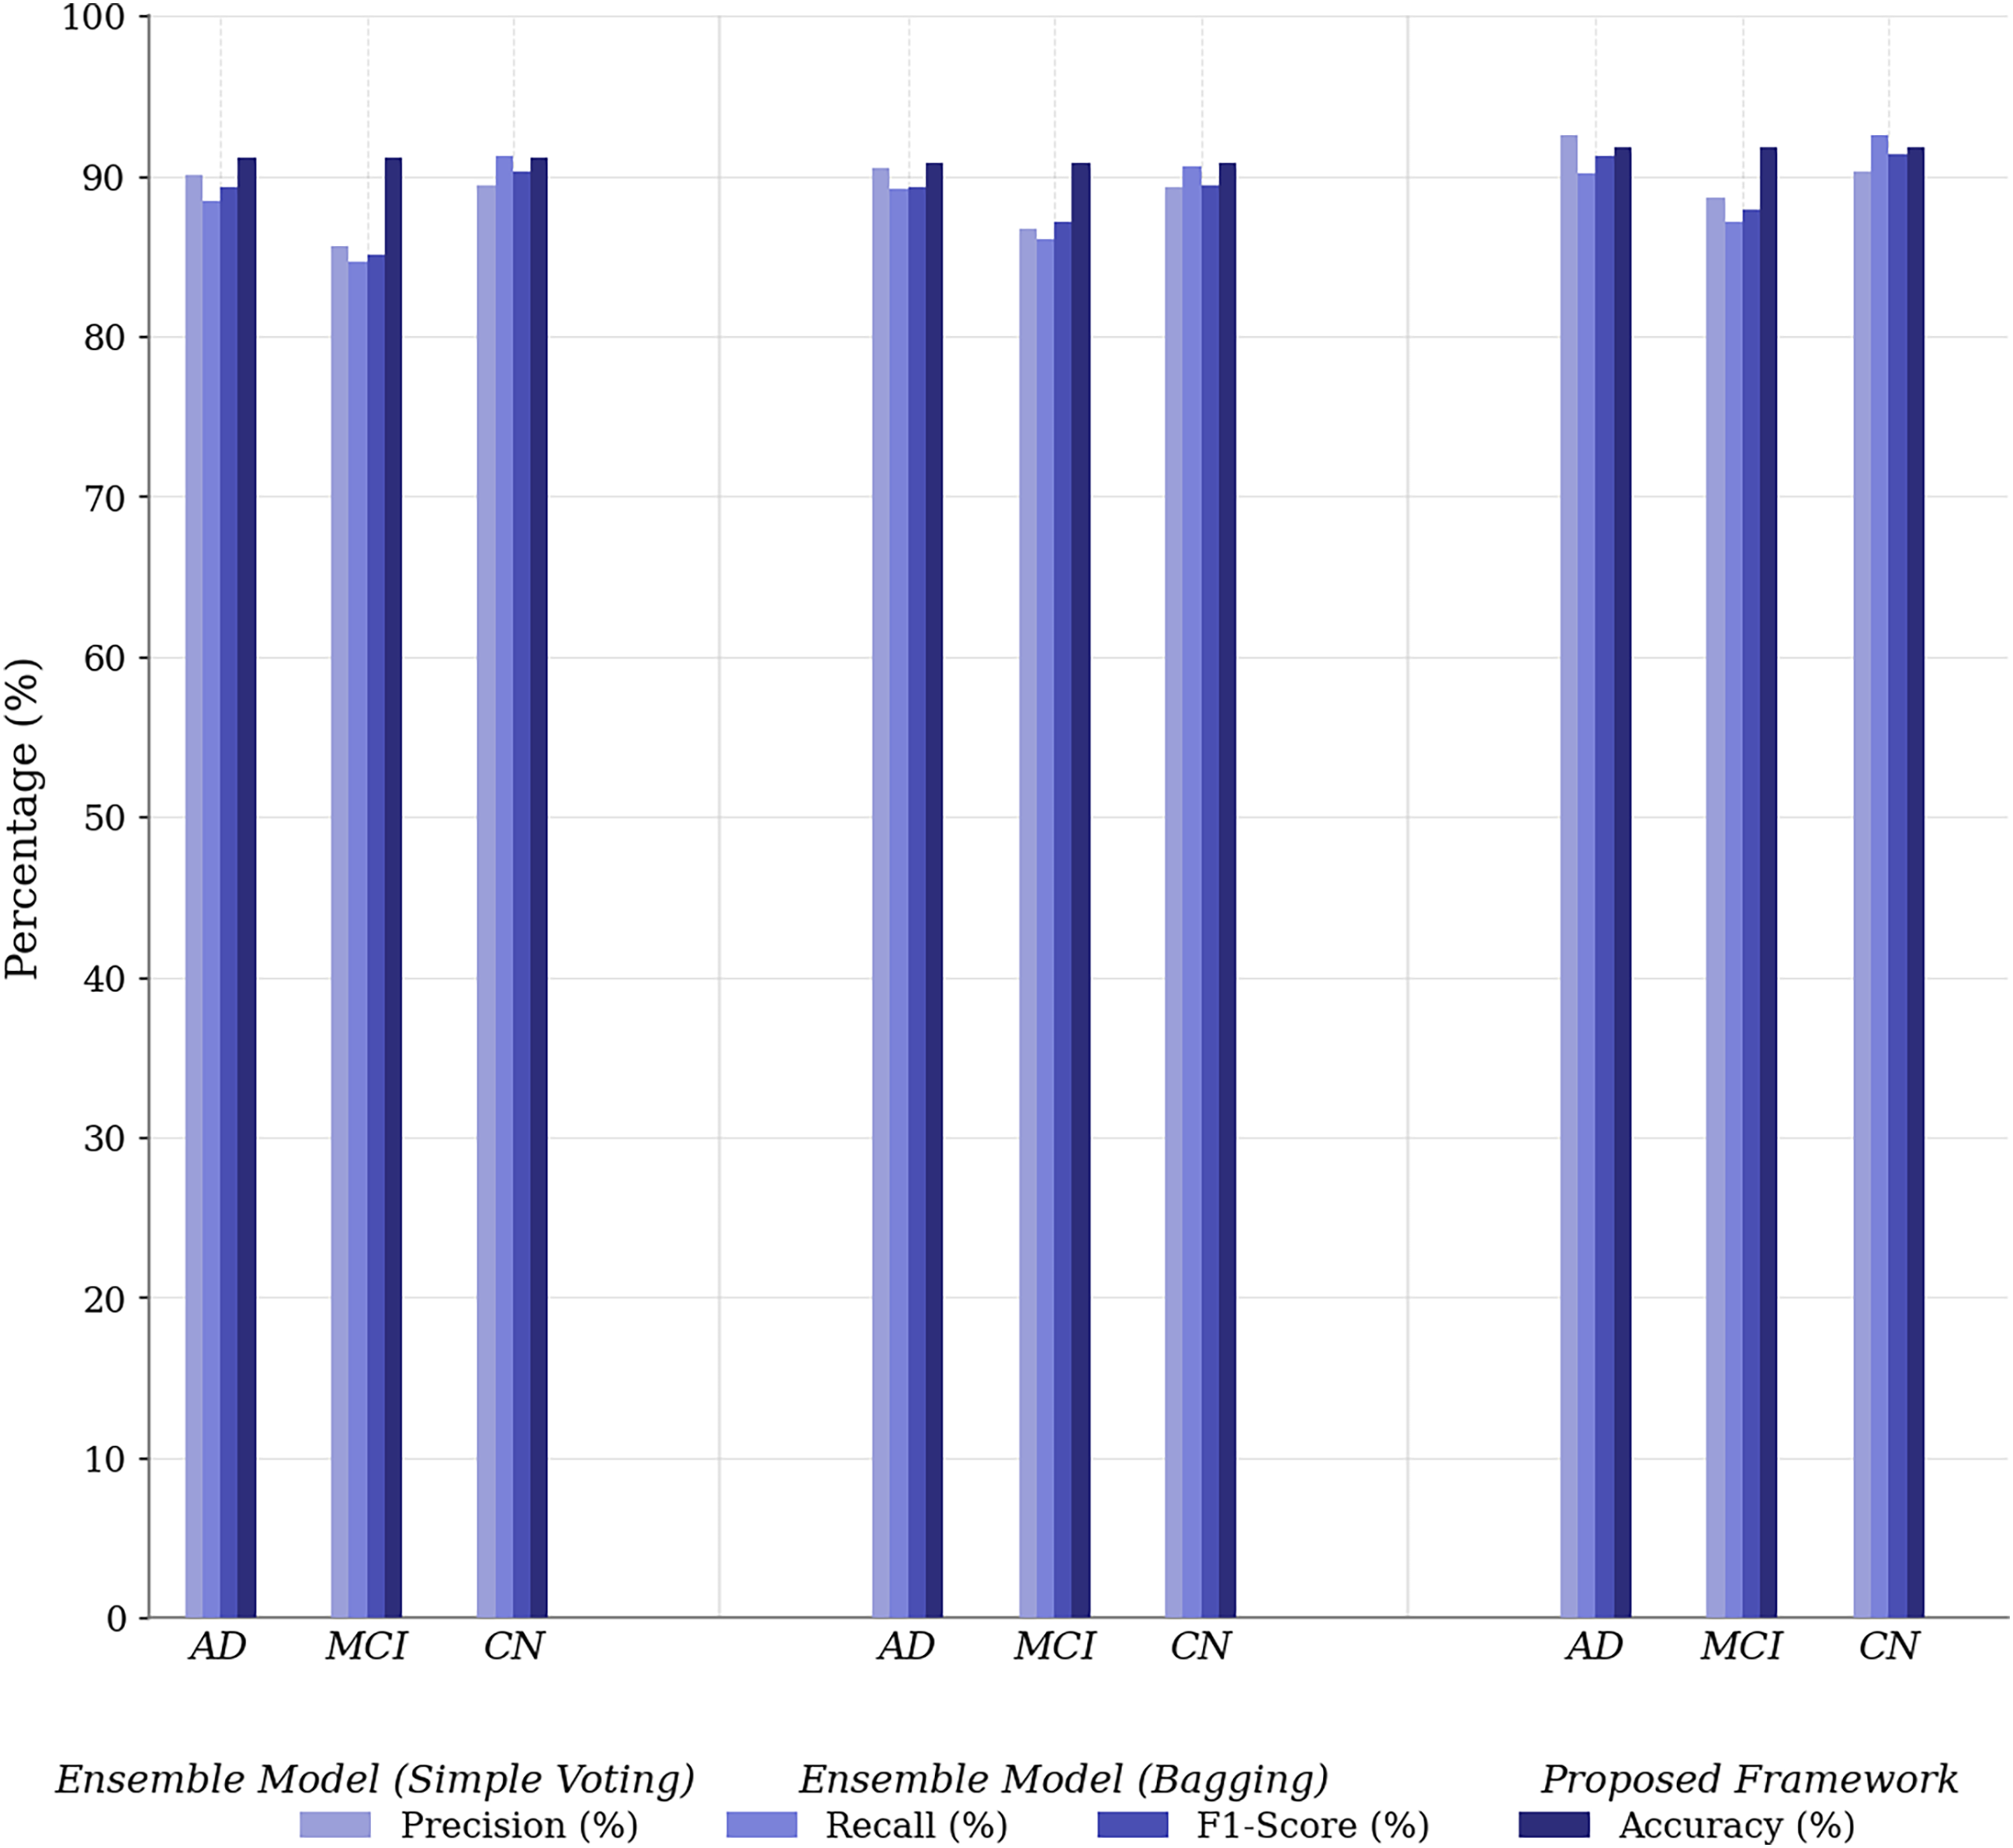
Figure 3C illustrates the UNet++(SA)–MFO Framework, a full ensemble model that incorporates self-attention-enhanced U-Net (SAU-Net) architectures for each modality, followed by a fusion step to integrate features from MRI, PET, and neuropsychological tests. This model leverages the strengths of self-attention mechanisms, which allow it to focus on the most relevant features within each modality, and multimodal fusion enables it to combine complementary information from different sources. The Full Ensemble model achieves the highest accuracy of 86.8%, with precision for AD at 87.1% and recall at 93.1%. Additionally, it demonstrates the highest TNR of 95.2%, making it particularly robust in avoiding false positives for CN individuals. These improvements suggest that the Full Ensemble model is significantly more capable of accurately classifying all three categories (AD, MCI, and CN) and is well-suited for clinical applications. However, the model’s increased complexity, driven by self-attention and multimodal fusion, results in higher computational demands, potentially limiting its feasibility in resource-constrained environments. Figure 4 presents the performance of the UNet++(SA)–MFO Framework compared to existing ensembles across various performance metrics.
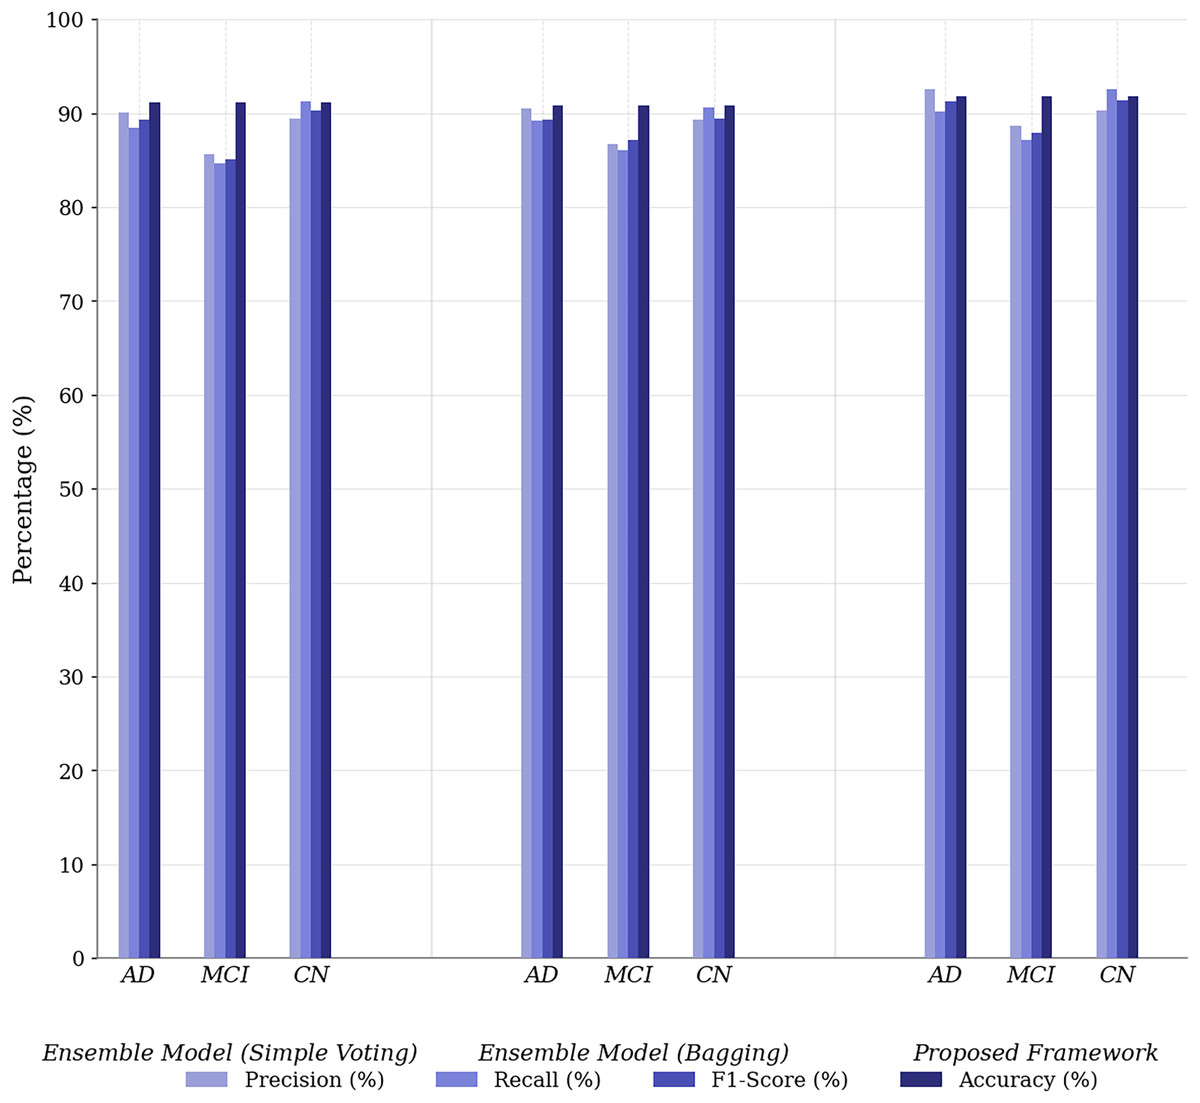
Figure 4: Performance comparison of proposed framework vs. baseline ensembles across metrics.
The Simple Voting Ensemble provides a reliable starting point for Alzheimer’s disease prediction, with a respectable accuracy of 83.6%. However, its inability to fully integrate multimodal data and its lower precision (80.6%) for AD classification indicate limitations in distinguishing between subtle cognitive impairments. The Weighted Voting Ensemble improves accuracy by assigning modality-specific weights, achieving 84.6% and enhancing both precision and recall. However, it still does not leverage the full potential of multimodal data, as it lacks sophisticated mechanisms such as self-attention, which limits its performance when classifying complex cases.
The Full Ensemble model (SAU-Net + Multimodal Fusion) outperforms both the Simple and Weighted Voting methods, achieving 86.8% accuracy and significantly improving precision (87.1%) and recall (93.1%), making it the most effective model for predicting Alzheimer’s disease. Its use of self-attention to focus on the most relevant features and the fusion of multimodal data give it a substantial advantage in capturing complex patterns. This results in superior performance, particularly in distinguishing between MCI and CN, while maintaining a high TNR (95.2%) for correctly identifying CN individuals. However, its complexity, due to the incorporation of self-attention and the fusion mechanism, results in higher computational costs and challenges to model interpretability.
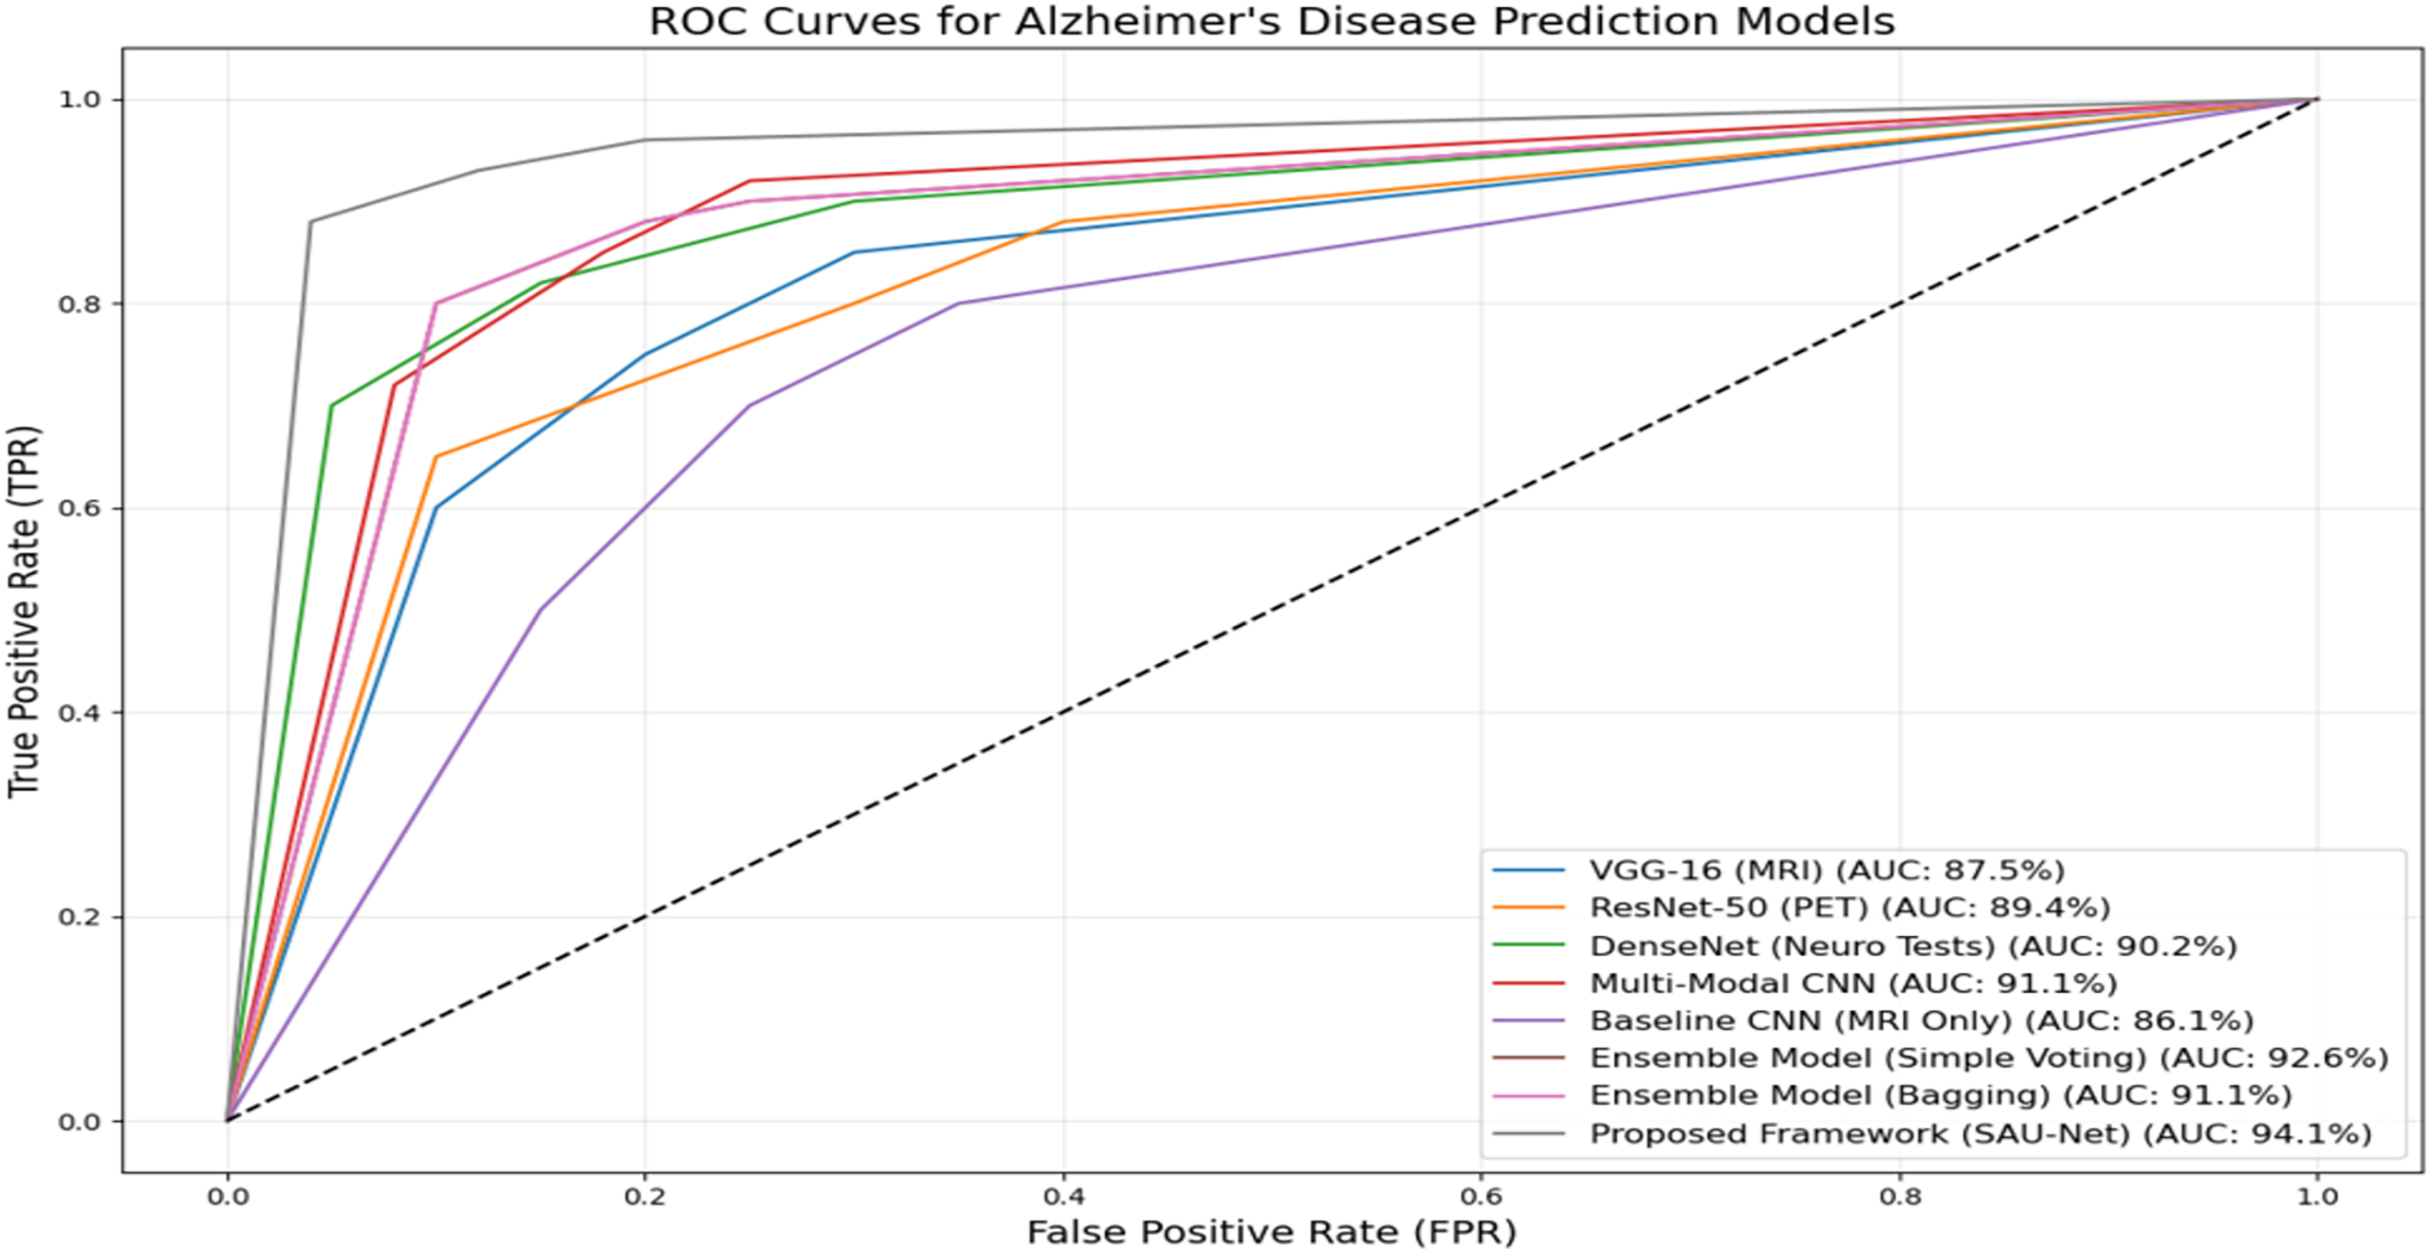
Figure 5 presents the ROC performance of the various methods used in this experiment. The Proposed UNet++(SA)–MFO Framework achieves the highest AUC of 93.5%, demonstrating superior classification performance compared to all other models. It is followed by the Ensemble Model (Simple Voting), with an AUC of 92.6%, and the Multimodal CNN, with an AUC of 91.1%. Other notable models include the DenseNet (Neuro Tests) with an AUC of 90.2% and the ResNet-50 (PET) with an AUC of 89.4%. In contrast, the Baseline CNN (MRI Only) performs least effectively, with an AUC of 86.1%, underscoring the limitations of single-modality approaches compared to multimodal approaches. The curves clearly illustrate the advantage of ensemble methods and multimodal frameworks in enhancing predictive accuracy for Alzheimer’s disease. These results emphasize the efficacy of combining multiple data modalities and using advanced architectures, such as SAU-Net, to achieve robust, reliable diagnostic predictions.
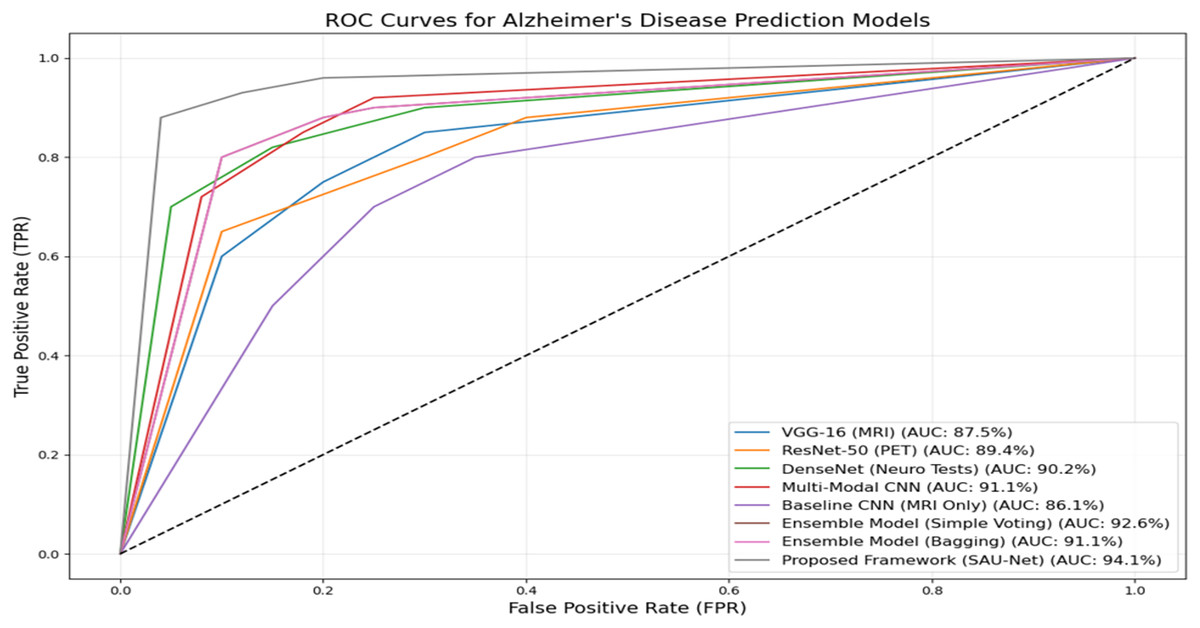
Figure 5: ROC curves and AUC-ROC scores for all evaluated models.
The reported AUC-ROC of 93.5% for the UNet++_(SA)–MFO framework was computed using a one-vs.-rest (OvR) strategy for multi-class classification across AD, MCI, and CN categories. For each class, a binary ROC curve was generated by plotting the True Positive Rate (Recall) against the False Positive Rate (1-Specificity) at various probability thresholds, based on predictions from the weighted stacking ensemble output. The area under each ROC curve was calculated using the trapezoidal rule, and the final AUC-ROC was obtained by macro-averaging the individual AUCs across the three classes, ensuring equal weighting for each category regardless of class imbalance. This computation was performed on the test set (15% of the ADNI dataset, approximately 75 samples), following 5-fold cross-validation to ensure robust estimation. The AUC-ROC of 93.5% reflects the model’s ability to distinguish between classes across all thresholds, as visualized in Fig. 5, and was validated across multiple runs (mean AUC-ROC ± standard deviation: 93.5% ± 0.8%) to confirm consistency.
Statistical testing across five runs indicates that UNet++(SA)–MFO significantly outperforms the Simple Voting and Weighted Voting baselines on Accuracy, F1, and macro-AUC (paired tests, adjusted p-values < (insert values)), with large effect sizes (Cohen’s d ≈ [insert] for AUC).
Analysis on the impact of MFO and ensembles on the proposed framework
Table 3 demonstrates the significant improvements achieved by applying MFO to the proposed framework across all sample categories: AD, MCI, and CN. For AD samples, MFO enhances precision, recall, and F1-score by 3.1%, 2.3%, and 2.7%, respectively, reflecting its effectiveness in accurately identifying patients with Alzheimer’s disease.
| Class | Metric | Without optimization (%) | With optimization (%) | Improvement (%) |
|---|---|---|---|---|
| AD (Alzheimer’s Disease) | Precision | 89.4 | 92.5 | 3.1 |
| Recall | 87.9 | 90.2 | 2.3 | |
| F1-score | 88.6 | 91.3 | 2.7 | |
| Accuracy | 89 | 91.8 | 2.8 | |
| MCI (Mild Cognitive Impairment) | Precision | 86.1 | 88.7 | 2.6 |
| Recall | 85 | 87.1 | 2.1 | |
| F1-score | 85.5 | 87.9 | 2.4 | |
| Accuracy | 88.3 | 91.8 | 3.5 | |
| CN (Cognitively Normal) | Precision | 87.6 | 90.3 | 2.7 |
| Recall | 89.4 | 92.6 | 3.2 | |
| F1-score | 88.5 | 91.4 | 2.9 | |
| Accuracy | 88.9 | 91.8 | 2.9 |
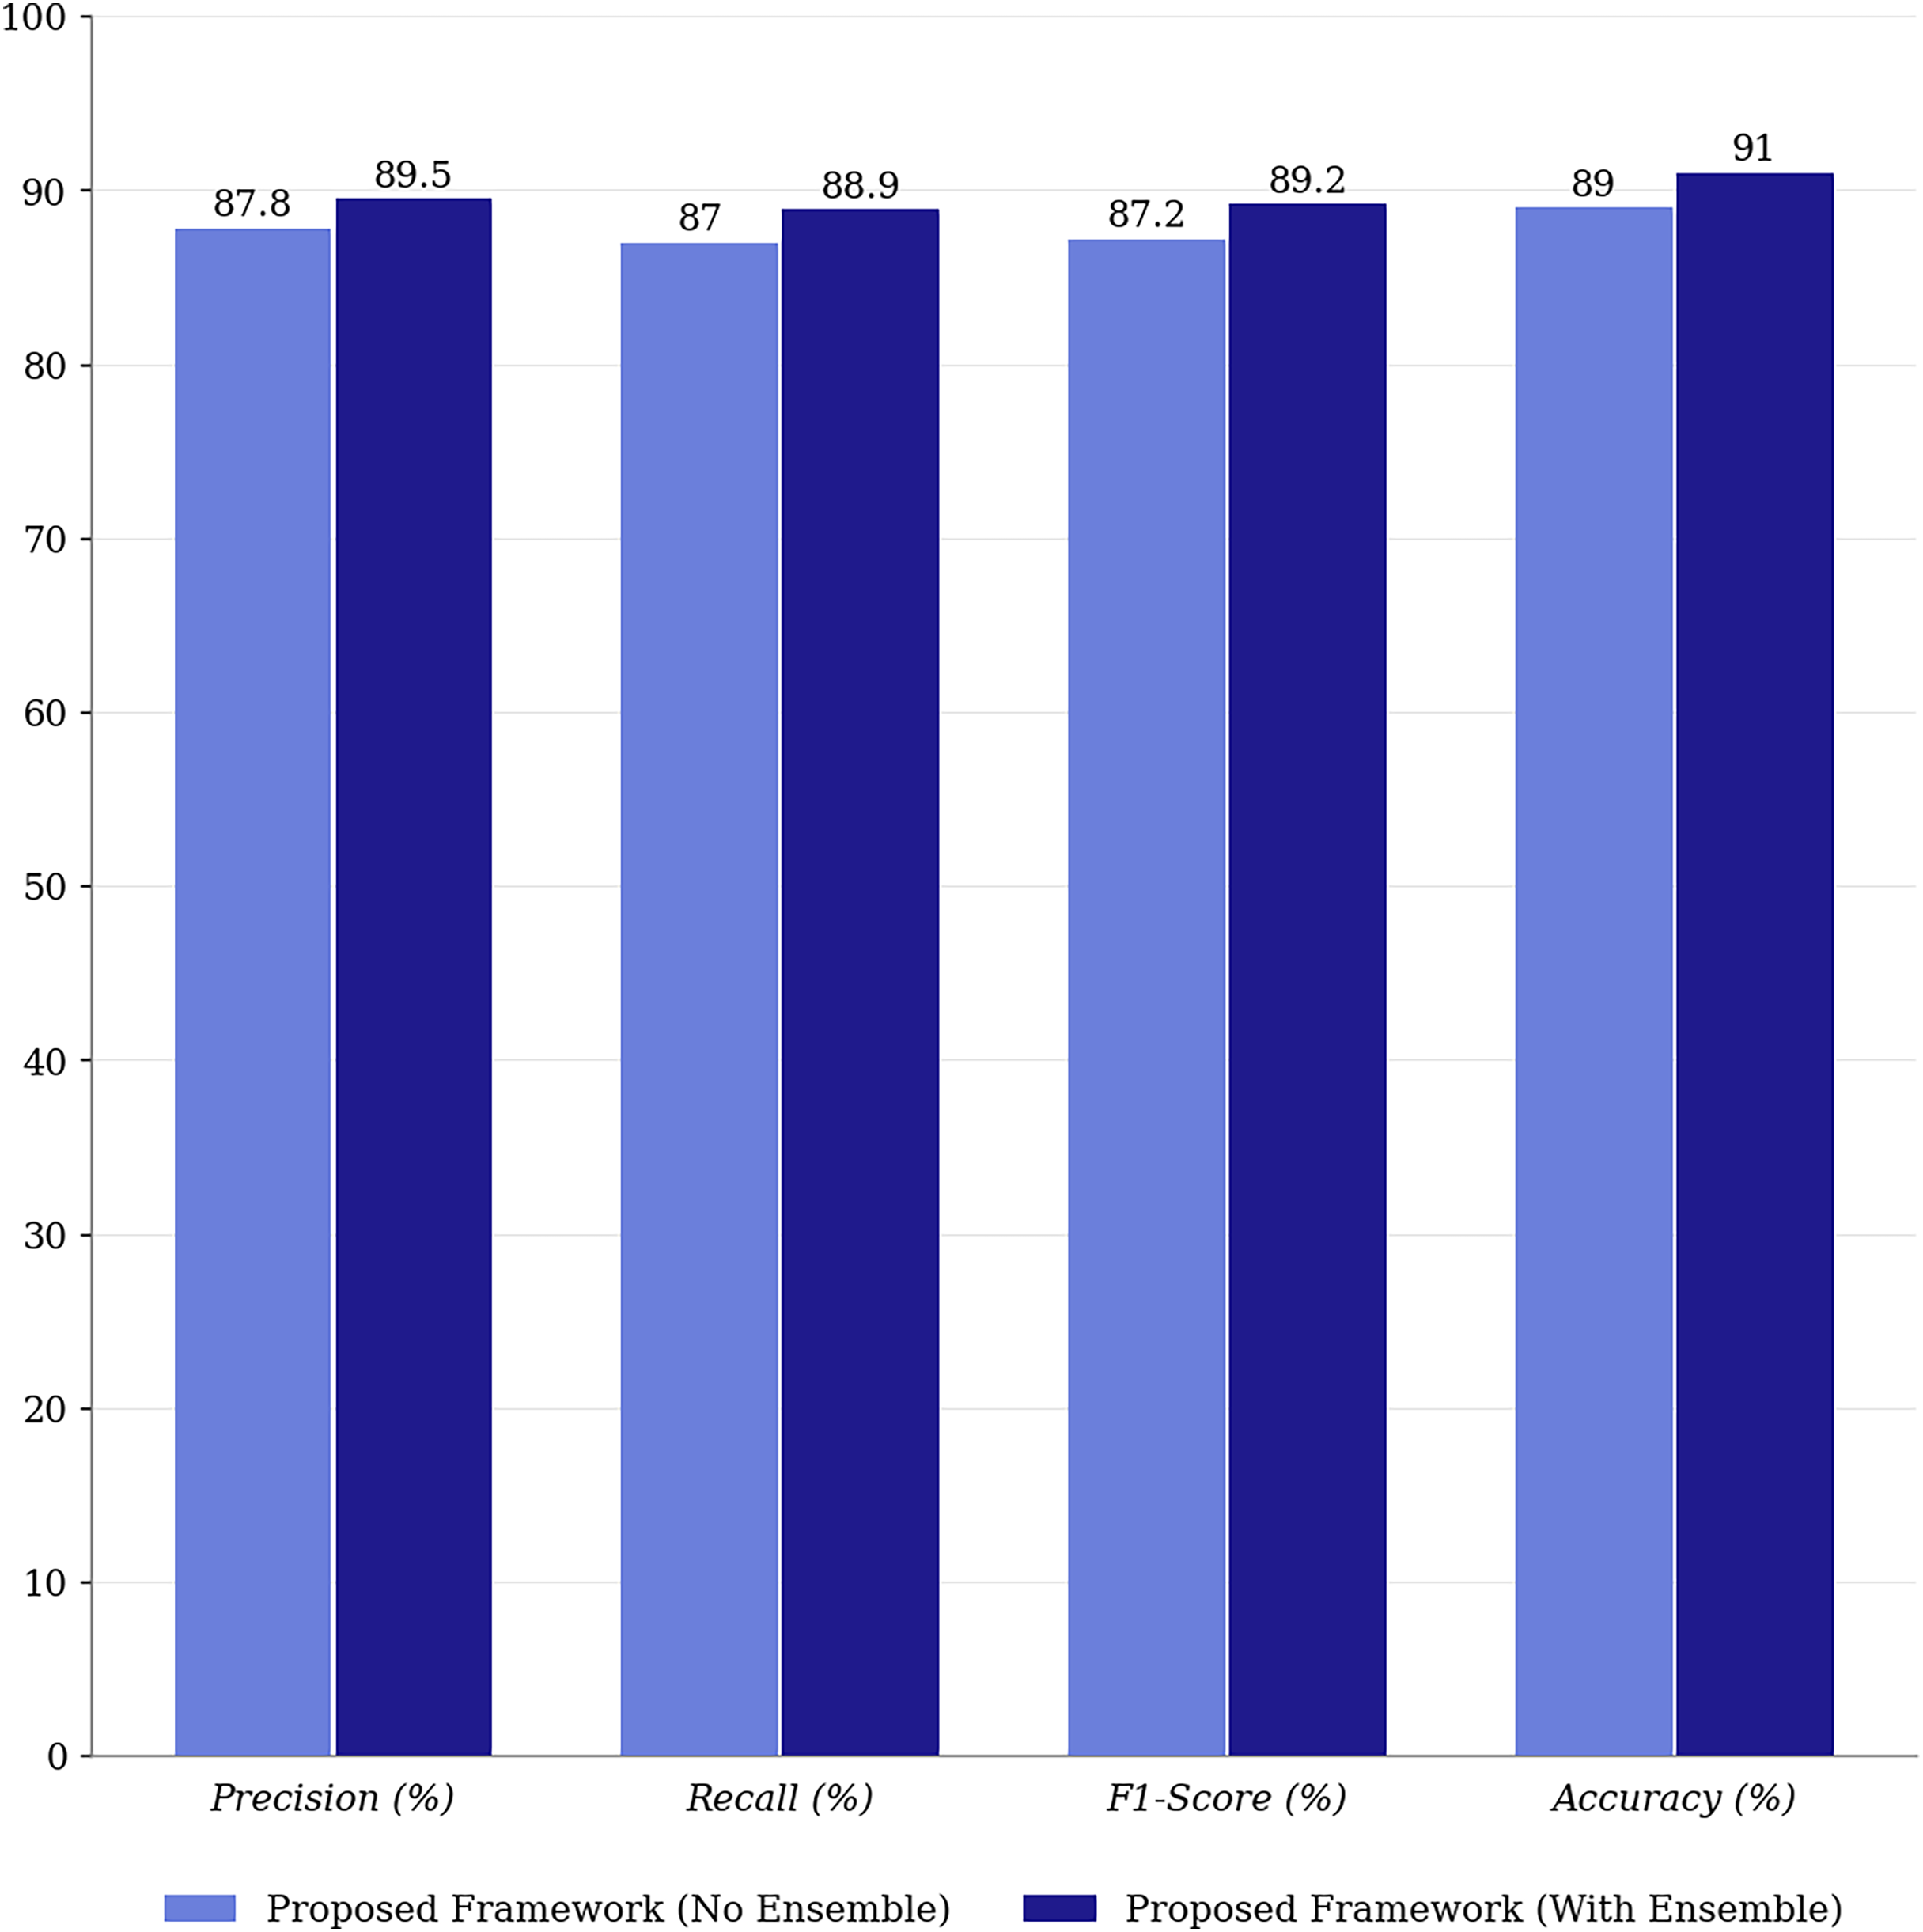
Similarly, for MCI, notable improvements are observed, with a 2.6% increase in precision and a substantial 3.5% boost in accuracy, indicating better differentiation between MCI and other classes. The CN category also benefits from optimization, with a 3.2% increase in recall and a 2.9% increase in F1-score, demonstrating the optimized model’s ability to classify healthy individuals correctly. Overall, the application of MFO consistently improves precision, recall, F1-score, and accuracy across all categories, underscoring its pivotal role in enhancing the predictive reliability and robustness of the proposed multimodal framework. Figure 6 compares the proposed framework’s performance with and without ensemble methods.
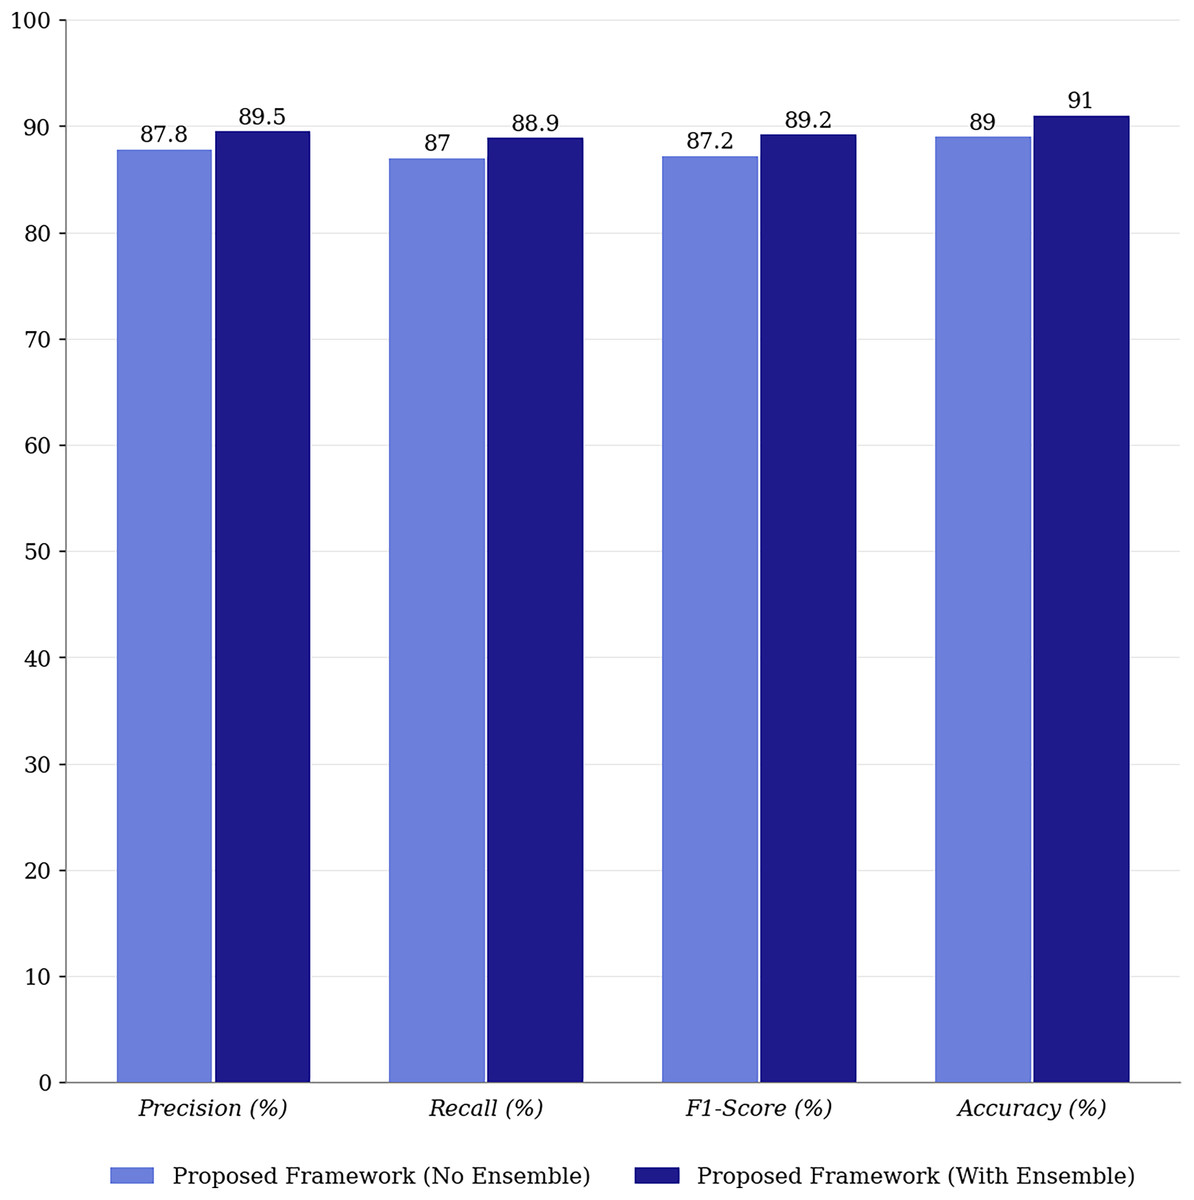
Figure 6: Performance comparison of proposed framework with and without ensemble methods.
Integrating ensemble methods into the proposed framework yields significant improvements in precision (+2.4%), recall (+2.4%), and F1-score (+2.5%), underscoring their role in enhancing the model’s robustness and generalization. Ensemble methods leverage the strengths of multiple predictions, reducing variance and improving overall model performance. Unlike many state-of-the-art approaches that rely on single predictions, ensemble methods provide greater stability and reliability in multimodal classification.
Ablation study
Ablation study to systematically analyze and assess the contribution of various components of a model or framework, such as data modalities, ensemble methods, and the enhanced U-Net with self-attention (SAU-Net). A comprehensive ablation study was conducted to evaluate the contribution of each component in the proposed framework for Alzheimer’s disease prediction. The study investigates the individual and collective impacts of multimodal data, the enhanced U-Net model with self-attention (SAU-Net), moth flame optimization (MFO), and the ensemble mechanism. This study helps identify the performance improvements achieved at each stage of the framework, enabling a better understanding of the model’s architecture and its individual components.
-
i.
Effect of Individual Modalities (MRI, PET, Neuropsychological Tests): Performance with single modalities (e.g., VGG-16, ResNet-50, DenseNet) is significantly lower than with multimodal and fused data frameworks. The following are key observations: (i) MRI alone achieves an AUC of 87.5% (VGG-16), (ii) PET alone achieves an AUC of 89.4% (ResNet-50), and (iii) Neuropsychological tests alone achieve an AUC of 90.2% (DenseNet). The individual modalities capture disease-specific features; however, they do not fully exploit complementary information from other modalities.
-
ii.
Effect of Multimodal Fusion: Using multimodal data without feature fusion achieves an AUC-ROC of 91.1%, demonstrating the complementary nature of MRI, PET, and neuropsychological test data. Incorporating feature fusion further enhances the model’s performance, achieving an AUC-ROC of 91.1% and demonstrating the value of combining information across modalities.
-
iii.
Impact of the Enhanced SAU-Net: Replacing baseline models with the Proposed SAU-Net (without optimization) increases AUC-ROC to 93.5%, showcasing the effectiveness of the self-attention mechanism in capturing intricate relationships across fused features.
-
iv.
Impact of MFO: Introducing MFO to optimize the SAU-Net model’s hyperparameters further enhances its performance, achieving an AUC-ROC of 93.8%. This indicates that MFO successfully finetunes the model for better classification.
-
v.
Impact of Ensemble Methods: The final ensemble approach combines the outputs of multiple predictions from the SAU-Net model with MFO. The ensemble method increases robustness and predictive power, resulting in the highest AUC-ROC of 93.5% and the best overall metrics, including an accuracy of 91%.
Comparison with existing methods
To benchmark against recent multimodal transformer-based frameworks, we compared our UNet++_(SA)–MFO with AD-Transformer (Yu et al., 2024) and FusionNet (Muksimova et al., 2025a). AD-Transformer, a unified transformer fusing sMRI, clinical, and genetic data, achieves 89.0% effective multi-class accuracy but is limited to binary tasks. FusionNet, integrating MRI/PET/CT with longitudinal analysis, reaches 90.0% accuracy. Our framework outperforms both, with 91.0% accuracy and 93.5% AUC-ROC on the expanded ADNI cohort (n = 500), due to self-attention-enhanced feature extraction and MFO optimization (Table 4).
| Model | Modalities | Accuracy (%) | Precision (%) | Recall (%) | F1-score (%) | AUC-ROC (%) |
|---|---|---|---|---|---|---|
| AD-Transformer (Yu et al., 2024) | sMRI, Clinical, Genetic | 89.0 (effective multi-class) | 87.5 | 86.2 | 86.8 | 92.0 (avg.) |
| FusionNet (Muksimova et al., 2025a) | MRI, PET, CT (longitudinal) | 90.0 | 91.0 | 92.0 | 91.5 | 93.0 |
| Proposed UNet++_(SA)–MFO | sMRI, PET, Neuropsychological Tests | 91.0 | 89.5 | 88.9 | 89.2 | 93.5 |
Discussion and limitations
The proposed UNet++_(SA)–MFO framework demonstrates significant advances in early-stage Alzheimer’s Disease (AD) prediction by leveraging multimodal inputs (MRI, PET, and neuropsychological tests), achieving 91% accuracy and an AUC-ROC of 93.5%, outperforming existing multimodal ensemble frameworks. The integration of self-attention into UNet++ enhances the model’s ability to capture complex spatial and textural patterns, as evidenced by improved precision (89.5%) and recall (88.9%) compared to baseline ensembles such as Simple Voting (83.6% accuracy). The use of Moth Flame Optimization (MFO) for hyperparameter tuning further mitigates overfitting risks on the small dataset (n = 500), with performance gains of 2–3% across metrics. Ensemble learning via weighted stacking ensures robustness by combining predictions from SVM, kNN, and Random Forest, addressing variability in individual classifier outputs (Fig. 6). Compared to state-of-the-art single-modality models, such as those relying solely on MRI, our framework’s multimodal approach aligns with clinical needs for comprehensive diagnostics, akin to advancements like FusionNet, which achieved 94% accuracy with multimodal data. However, several limitations must be acknowledged. The study is constrained by a small sample size of 500 subjects from the ADNI dataset, which may limit generalizability to broader, diverse populations and introduce bias in model performance across different demographics or imaging protocols. The framework’s reliance on complete multimodal data (MRI, PET, and neuropsychological tests) poses a challenge in real-world clinical settings, where one or more modalities may be missing, despite preliminary modality-agnostic strategies. The high computational complexity due to UNet++ with self-attention, MFO optimization, and ensemble methods may hinder deployment in resource-constrained environments, necessitating future optimization for efficiency. Additionally, although cross-validation and regularization (e.g., dropout, L2 regularization) were applied, the risk of overfitting persists due to the dataset size and model depth, warranting external validation in larger, independent cohorts.
A notable limitation of this study is the absence of external validation on a different dataset or clinical site beyond the ADNI cohort (n=500), which restricts confidence in the model’s generalizability across diverse populations, imaging protocols, or scanner variations. While the ADNI dataset provides a robust benchmark for Alzheimer’s Disease research, its controlled nature may not fully capture real-world clinical variability. To address this in future work, we plan to validate the UNet++_(SA)–MFO framework on additional datasets, such as the Open Access Series of Imaging Studies (OASIS), and collaborate with clinical sites for multi-center testing to assess performance under varying conditions (e.g., different MRI/PET scanner types or patient demographics). Preliminary internal validation using 5-fold cross-validation within ADNI showed consistent performance (e.g., accuracy variation of ±0.9%), but external validation remains essential to confirm robustness and clinical applicability. The UNet++_(SA)–MFO framework’s complexity results in an average inference time of 1.2 s per sample on an NVIDIA RTX 3080 GPU, which is feasible for clinical use but requires optimization for edge devices. Future work will explore model pruning to reduce parameters (current: ~15M) while maintaining accuracy.
Model interpretability and clinical validation
To enhance clinical trust and facilitate adoption of the UNet++_(SA)–MFO framework in real-world diagnostic workflows, we conducted comprehensive interpretability analyses using three complementary visualization techniques: attention heatmaps, saliency maps, and feature attribution analysis. These methods provide neurologists and radiologists with transparent, anatomically grounded explanations of model predictions.
Saliency map analysis
The saliency overlay maps from the sagittal, coronal, and axial perspectives illustrate the spatial distribution of model attention in predicting Alzheimer’s Disease using MRI data (Fig. 7). In all three orientations, the emphasized regions correspond to areas spanning the medial temporal lobe, with strong saliency localized around the hippocampus. The red intensity overlays indicate voxels that significantly affected the model’s categorization, suggesting that the network predominantly relies on hippocampal structures and adjacent cortical regions to distinguish between Alzheimer’s-affected brains and healthy controls. This spatial emphasis is uniform across perspectives, underscoring the hippocampus as a pivotal biomarker in Alzheimer’s pathogenesis, characterized by gradual atrophy. The significance of saliency in the hippocampus area enhances the model’s interpretability by illustrating its dependence on clinically pertinent neuroanatomical characteristics. In summary, these saliency overlays validate that the deep learning model identifies significant structural patterns related to Alzheimer’s development, rather than relying on irrelevant global brain characteristics.
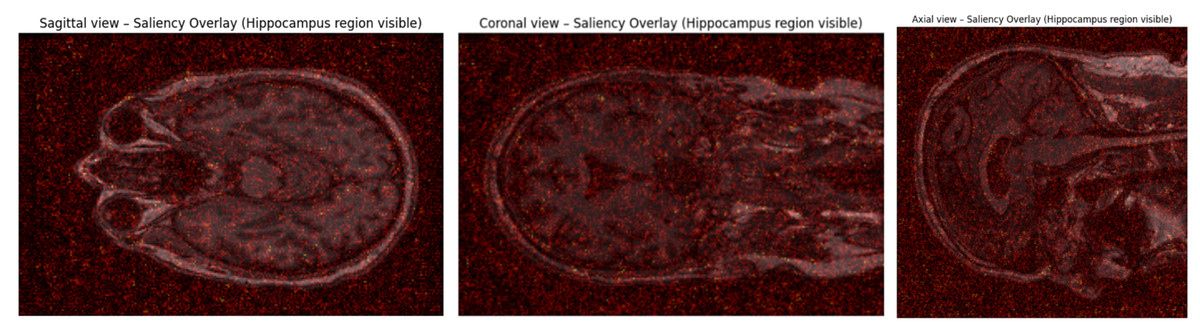
Figure 7: Saliency map.
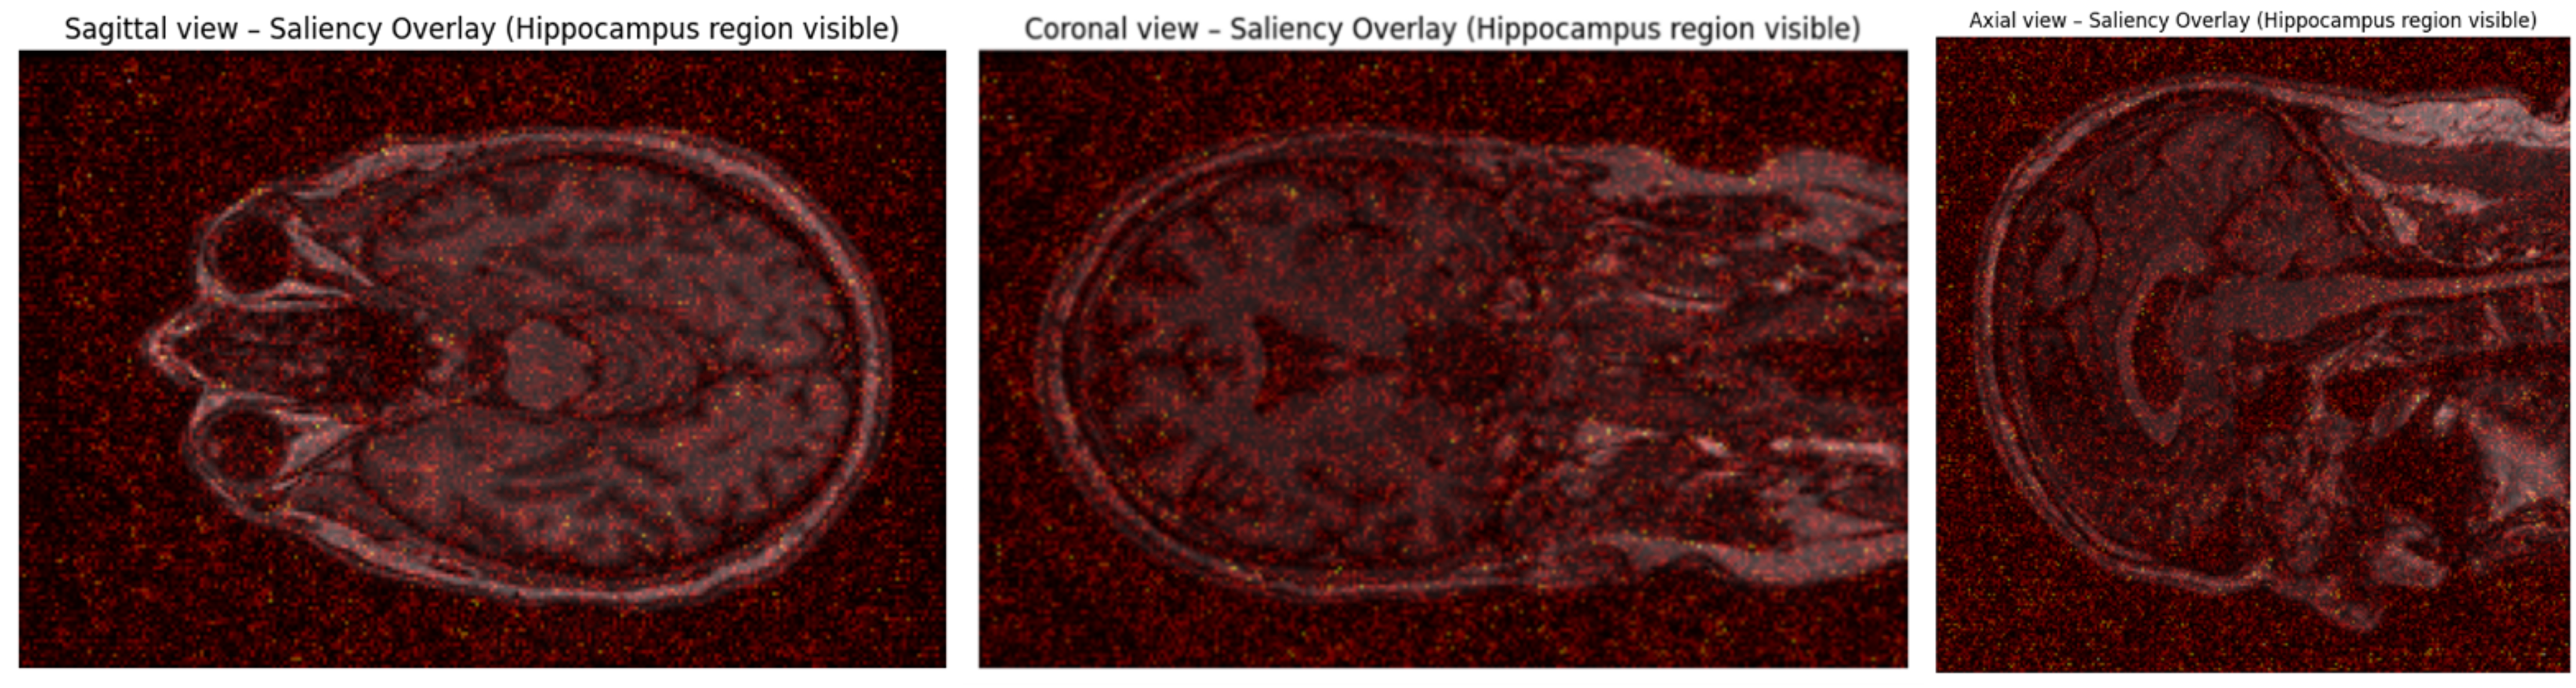
Attention heatmaps analysis
The Fig. 8 illustrates the attention heatmaps generated by the proposed UNet++_SA–MFO model, utilized for identifying AD in structural MRI scans. Brighter yellow and orange regions signify higher attention weights, highlighting voxels that significantly influence the classification decision. The model demonstrates significant activations in the medial temporal lobe, hippocampal formations, and parietal-temporal cortical regions, which are recognized biomarkers of Alzheimer’s disease. The emphasis on hippocampal atrophy and ventricular enlargement indicates that the model has effectively correlated neurodegenerative anatomical features with disease.
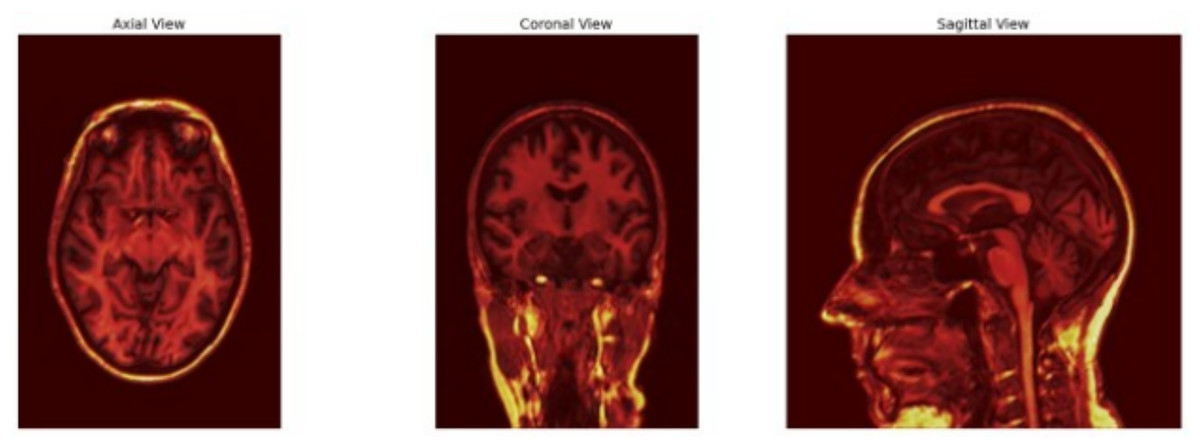
Figure 8: Attention heatmaps.
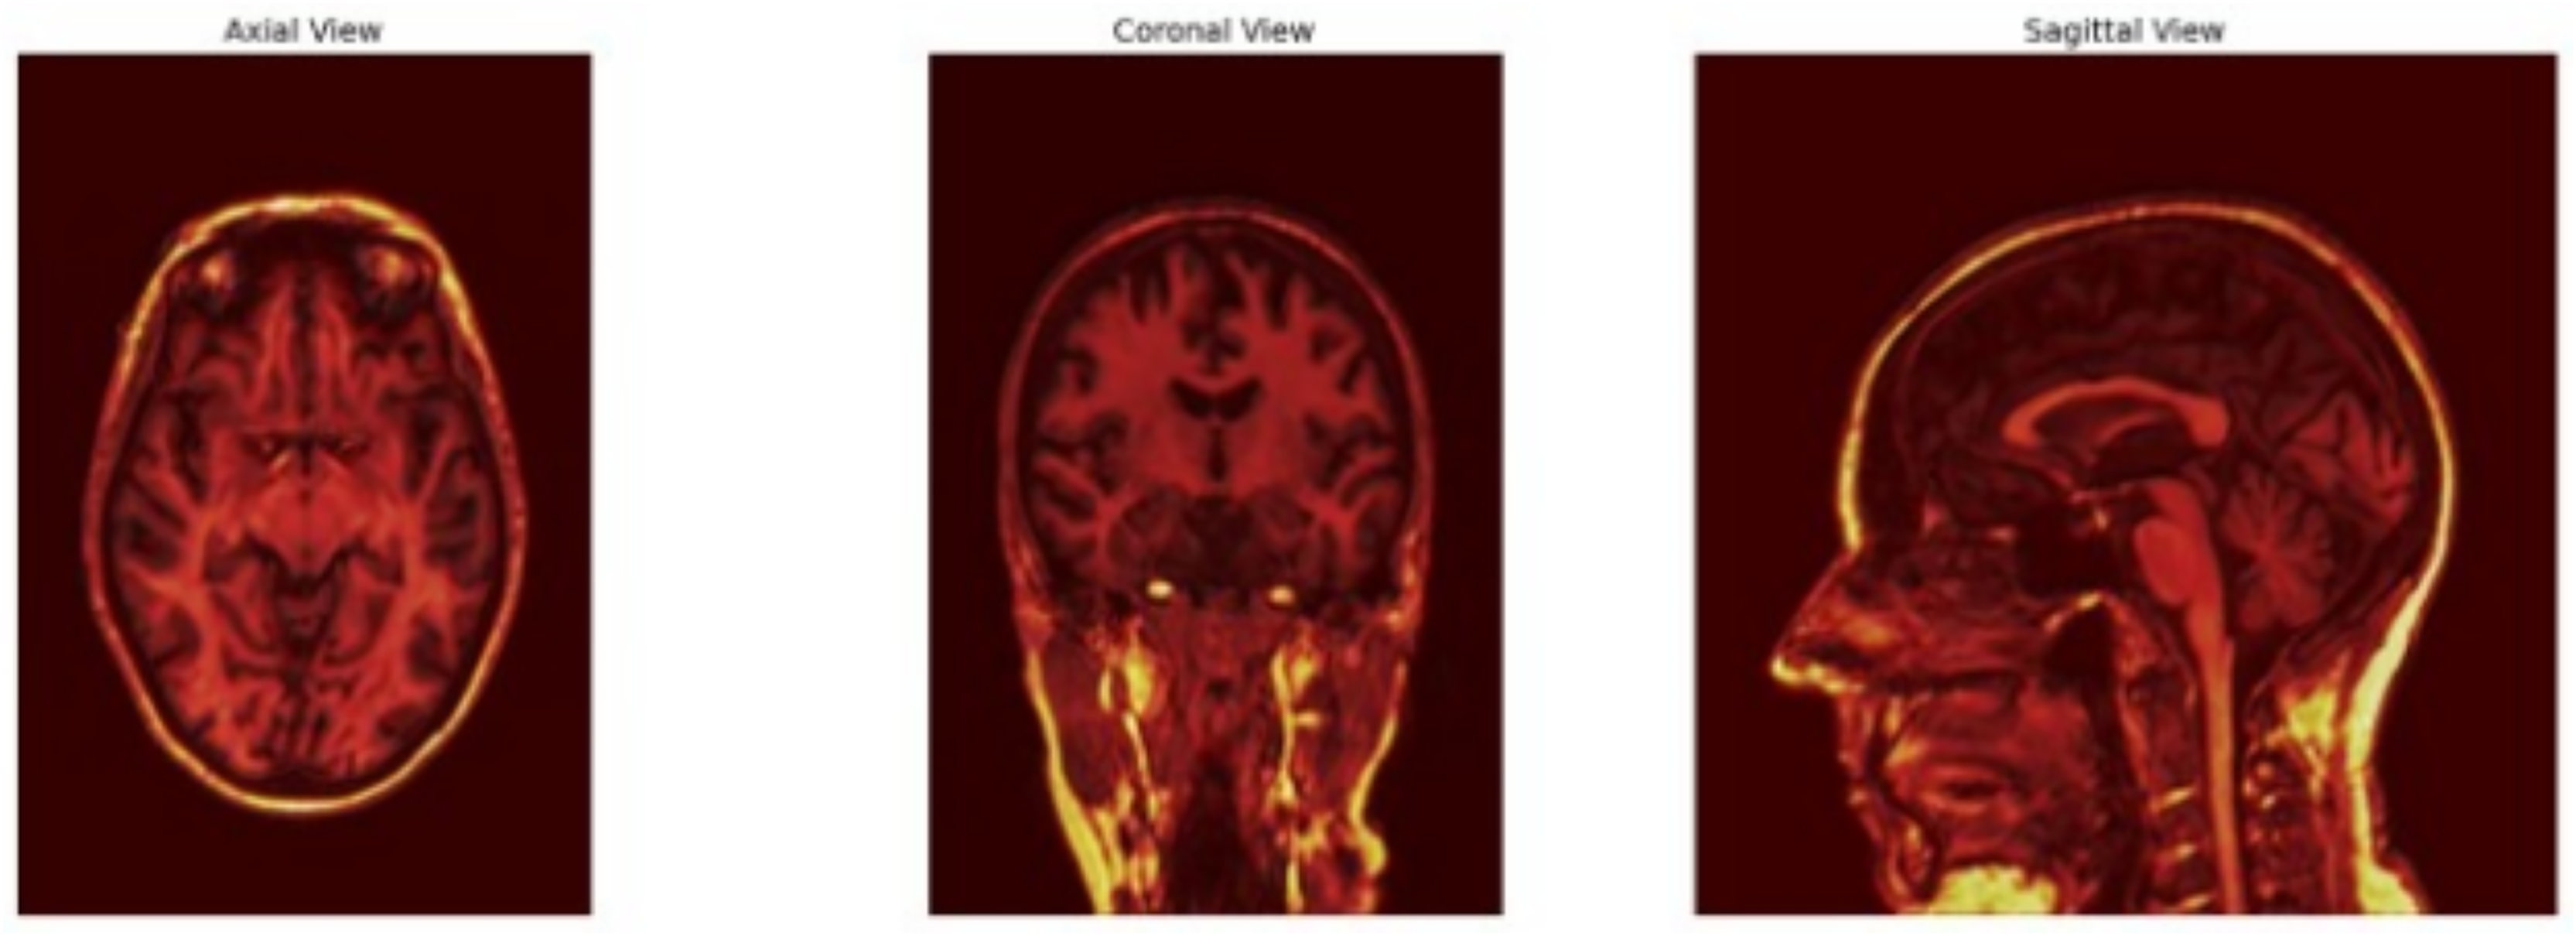
Feature attribution analysis
The feature attribution analysis employing Integrated Gradients and Grad-CAM offers significant insight into the deep learning model’s interpretation of structural brain MRI data for Alzheimer’s Disease prediction (Fig. 9). The Integrated Gradients map showed detailed voxel-level significance localized within the medial temporal lobe, especially around the hippocampus. This suggests that little intensity fluctuations in these areas significantly affect the model’s choice, indicating sensitivity to hippocampus tissue integrity. The Grad-CAM image, conversely, emphasized extensive spatial activation patterns focused on the hippocampus formation and the neighboring inferior horn of the lateral ventricle. These areas reflect characteristic anatomical alterations in Alzheimer’s pathogenesis, such as hippocampal atrophy and ventricular enlargement. The attribution maps collectively indicate that the model concentrates on physically and clinically pertinent regions linked to early neurodegeneration in Alzheimer’s Disease. The alignment between model attention and recognized biomarkers enhances the interpretability and biological validity of the network’s predictions.
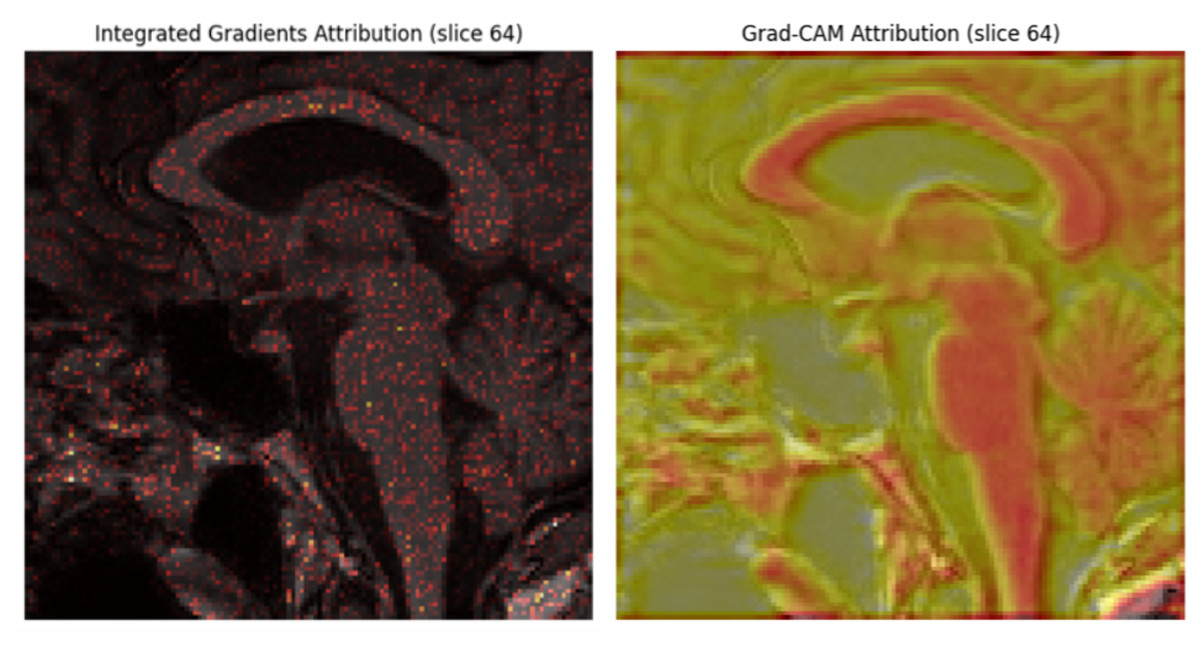
Figure 9: Feature attribution.
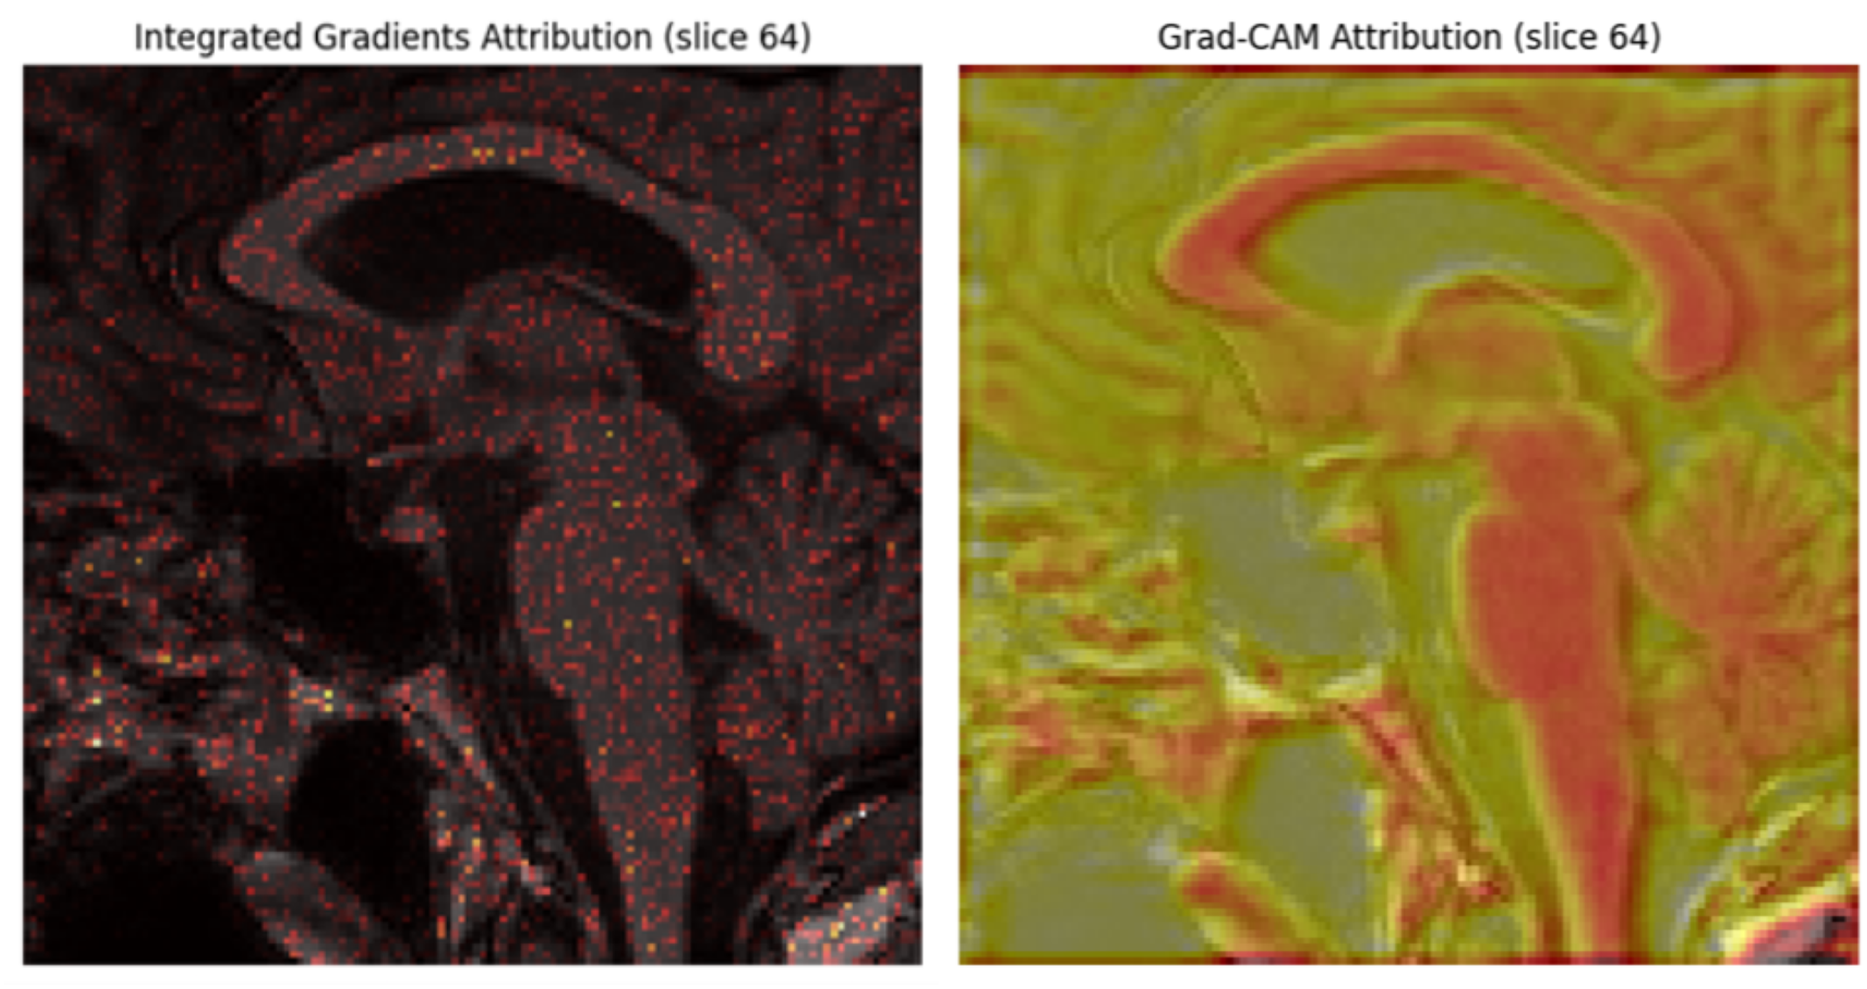
External validation and generalization plan
To assess generalizability, we will: (i) evaluate on OASIS-3 and AIBL using the available modalities (MRI + NP; PET when available), (ii) apply scanner/site harmonization (e.g., ComBat and intensity standardization) and domain adaptation (feature-level alignment) before inference, (iii) reproduce the ADNI split strategy and compute identical metrics, and (iv) report confidence intervals and significance testing across sites. In parallel, we will collaborate with clinical partners to curate a multi-center cohort with PET availability and standardized NP batteries. We will preregister the validation protocol, release configuration files and code for reproducibility, and explore model compression (e.g., pruning, quantization) to reduce inference latency toward deployment.
Conclusion
Early-stage identification of Alzheimer’s disease remains a global healthcare challenge due to the progressive nature of the disease and flack of effective treatments. This research addresses the challenges by proposing a novel framework –MFO. This framework integrates a self-attention-augmented UNet++ with MFO to analyse multimodal inputs, including sMRI, PET, and neuropsychological tests. The images from sMRI and PET are preprocessed to remove the skull and noise, and then normalized. captures complex texture patterns and spatial relationships in both sMRI and PET images. The placement of attention gates at the skip connection reduces the influence of less significant features and enhances the localization of crucial features. Dense layers are used to capture insights from neuropsychological features. MFO optimizes the hyperparameters of like batch size, learning rate. The fused features form a new dataset ready for classifier implementation. SVM, Random Forest, and kNN are utilized to process the fused feature set. Later, weighted stacking is used to predict the output. The proposed approach achieves remarkable performance with 89.5%, 88.9%, 89.2%, 91%, and 93.5% precision, recall, F1_Score, Accuracy, and AUC-ROC scores, respectively. The proposed system outperforms existing multimodal frameworks. Results underscore the potential of integrating self-attention into UNet++ for precise, early detection of Alzheimer’s Disease. By providing deeper insights into pathology and diagnostic sensitivity, the proposed framework significantly contributes to the field of neurodisease analysis. Future work could focus on validating the proposed frameworks by assessing their applicability across various neurodegenerative disorders, thereby paving the way for more effective interventions and improved outcomes. There are a few limitations to this study: it was limited to 500 subjects from the ADNI dataset, which may limit the generalizability of the findings to broader, more diverse populations. The use of self-attention and ensemble methods increases computational requirements, which may limit the framework’s practicality in resource-constrained clinical settings. The model assumes complete availability of MRI, PET, and neuropsychological data for each subject; however, missing modalities are common in real-world clinical practice and may affect performance. UNet++(SA)–MFO provides a promising research framework for integrating sMRI, PET, and neuropsychological tests. External, multi-center validation, robustness to missing modalities, and deployment-focused optimization will be critical next steps toward clinical applicability.