
Predicting adaptability of students in online entrepreneurship education using deep learning
- Published
- Accepted
- Received
- Academic Editor
- Trang Do
- Subject Areas
- Artificial Intelligence, Computer Education, Data Mining and Machine Learning, Data Science, Neural Networks
- Keywords
- Learning analytics, Attention mechanisms, Hybrid neural networks, Adaptive learning systems, Employability prediction
- Copyright
- © 2026 Yin and Sun
- Licence
- This is an open access article distributed under the terms of the Creative Commons Attribution License, which permits unrestricted use, distribution, reproduction and adaptation in any medium and for any purpose provided that it is properly attributed. For attribution, the original author(s), title, publication source (PeerJ Computer Science) and either DOI or URL of the article must be cited.
- Cite this article
- 2026. Predicting adaptability of students in online entrepreneurship education using deep learning. PeerJ Computer Science 12:e3581 https://doi.org/10.7717/peerj-cs.3581
Abstract
The rapid expansion of online entrepreneurship education has underscored the importance of accurately assessing students’ adaptability, a key factor influencing learning effectiveness and entrepreneurial competency. Yet, predicting adaptability remains a challenge due to the heterogeneous and complex nature of educational data. To address this issue, we introduce TabNSA, a hybrid deep learning framework for tabular data that integrates Native Sparse Attention (NSA) to capture long-range feature dependencies and a TabMixer module to model non-linear interactions among diverse attributes. Experimental evaluations demonstrate that TabNSA consistently outperforms both classical machine learning baselines and recent state-of-the-art tabular models, achieving an overall accuracy of 93.58%. These results highlight the potential of TabNSA as a robust predictive tool to inform adaptive instructional design and learner support in online entrepreneurship education, ultimately enhancing employability and reducing unemployment through more effective entrepreneurial training.
Introduction
The demand for entrepreneurship training is increasing, particularly in the context where governments can no longer generate enough jobs for the entire workforce. Entrepreneurship education has proven to be highly significant in reducing unemployment and poverty. Studies show that entrepreneurship education positively influences students’ entrepreneurial mindset, thereby enhancing their ability to identify and exploit business opportunities (Saadat et al., 2021; Jiatong et al., 2021). However, the integration of problem-solving thinking into curricula at schools and training institutions has not been systematically emphasized, leading to the urgent need for reform in entrepreneurship teaching (Liguori et al., 2021; Sarooghi et al., 2019).
In practice, modern technologies such as smartphones and e-learning have greatly supported students’ access to advisory resources and training materials in entrepreneurship education. Online learning tools enable students to interact with mentors and global experts, equipping them with the knowledge and skills necessary for entrepreneurial activities (Li, Cao & Jenatabadi, 2023; Chang, Chang & Chen, 2022). Nevertheless, this transition is not without challenges. The digital divide, uneven network infrastructure, and students’ adaptability to online learning present barriers to effective entrepreneurship education (Liguori et al., 2021; Supriyanto, Pardiman & Abs, 2020). A current key research objective is to predict students’ adaptability in online entrepreneurship education in order to suggest improvement strategies. Recent studies indicate that entrepreneurial mindset can be developed through education and plays a crucial mediating role in shaping students’ entrepreneurial intentions (Juwairia, Wardana & Maharani, 2024; Sun, Shi & Zhang, 2023). This highlights the necessity of designing appropriate entrepreneurship education programs that not only address the needs of younger generations but also optimize the development of entrepreneurial thinking in digital learning environments (Purwanti, Handayani & Kusdiyanti, 2024; Zupan, Cankar & Setnikar Cankar, 2018).
If this issue is not addressed, the challenges surrounding entrepreneurship education will only intensify, directly affecting students’ livelihood and their capacity to develop as responsible citizens in the future (Christina & Widjojo, 2023; Hoang et al., 2020). Therefore, improving the localization of entrepreneurship education programs, in combination with modern technology and problem-solving thinking, is essential to ensure the effectiveness of entrepreneurship training and contribute to reducing unemployment in society. In the current context, integrating entrepreneurship education into formal education curricula is more important than ever. With the evolution of socio-economic conditions, it is necessary to adjust teaching philosophies and methods to align with the new requirements of entrepreneurship learning. Entrepreneurship courses should be designed with diverse content, including marketing, financial management, innovation, and operations, in order to provide students with the essential knowledge and skills (Morris & König, 2020; Wang, Shi & Jiang, 2024).
Adaptability in entrepreneurship education is defined as the adjustment of students’ behavior, cognition, and emotions in new contexts, which is particularly important for their learning motivation and performance (Lee & Jung, 2021). Research has shown that entrepreneurial mindset serves as an important mediator between uncertainty and adaptability at work, especially in the context of the COVID-19 pandemic, which accelerated the transition to online learning (Rodriguez & Lieber, 2020). Therefore, studying students’ adaptability to e-learning in entrepreneurship has become a necessary topic in modern education. Globally, entrepreneurship education has been strongly developed in countries such as the United States and Japan, where many universities have launched entrepreneurship programs and courses (Cai et al., 2022; Adeoye, Abimbowo & Mahmud, 2024). To evaluate the effectiveness of technology in entrepreneurship teaching, three main aspects including pedagogical, usability, and technological must be considered (Tiberius & Weyland, 2023; Mahmood et al., 2021). Although there are many challenges in adopting modern teaching methods, advances in technology provide tremendous opportunities for creativity and innovation in entrepreneurship training (Centobelli et al., 2019). Recent advances in educational and computational social science have shown that key student outcomes, such as perceived employability and subjective well-being, emerge from complex configurations of cognitive, affective, and contextual factors that are not well captured by simple linear models (Ma & Bennett, 2024; Wu et al., 2025). At the same time, explainable deep learning approaches to knowledge tracing have begun to integrate cognitive learning theories with neural architectures, illustrating how richer representations of learning processes can be constructed from large-scale interaction data (Huang et al., 2024).
The key contribution of this study lies in addressing issues in online entrepreneurship education by analyzing students’ adaptability. One of the proposed methods is to employ ensemble machine learning (ML) models to predict adaptability, thereby improving accuracy through the integration of multiple data sources such as demographic characteristics, learning habits, and students’ levels of engagement. This approach not only supports policy-making but also contributes to the development of personalized teaching methods and support systems, enabling students to gradually cope more effectively with challenges in the entrepreneurial environment.
Related work
In studies on adaptability in online entrepreneurship learning, several notable works have applied AI and ML technologies to predict these components. Adnan et al. (2021) employed the Random Forest (RF) algorithm with high accuracy in predicting students’ adaptability to online learning. This demonstrates the potential of ML models in evaluating learning performance in the e-learning context. Seo et al. (2021) developed an intelligent online learning system designed to monitor learners’ situations, thereby improving the effectiveness of the learning process. This underscores the importance of learner management and support in online learning environments, an aspect that current learning platforms need to ensure. Another study revealed that the use of artificial intelligence (AI) and ML can significantly influence interactions between learners and instructors in online learning, particularly during the COVID-19 pandemic (Seo et al., 2021). Other research also highlighted the correlation between adaptability, online learning confidence, and academic performance under certain conditions (Lee & Trim, 2022). Adnan et al. (2022) introduced an intelligent evaluation model for online education, which assists instructors in adjusting content and teaching methods more effectively to meet students’ needs. Findings from these studies consistently suggest that integrating AI and ML into education can enhance interaction and improve student learning outcomes in online settings. In addition, one study applied an evolutionary game model to the entrepreneurship domain, enabling students to learn and create entrepreneurial products through simulated scenarios. The study also conducted analyses related to technology investment and students’ familiarity with technological entrepreneurship, emphasizing the importance of technology in entrepreneurship education (Martín et al., 2022). Finally, another study proposed a predictive framework for e-learning effectiveness based on learning behavior, highlighting the necessity of deep psychological insights into learners in order to foster their development and engagement in online programs (Wang et al., 2025b). Overall, these studies not only emphasize the critical role of technology in education but also indicate the need for concrete strategies to apply AI/ML in order to enhance the effectiveness of online entrepreneurship education.
Although previous studies have successfully applied AI and ML techniques to predict students’ adaptability in online learning and improve the effectiveness of entrepreneurship education (Adnan et al., 2021; Seo et al., 2021; Wang et al., 2025b), most of them primarily focus on traditional ML models or specific learning behaviors. These approaches often lack the capacity to simultaneously capture complex non-linear interactions among diverse features, long-range dependencies, and the multi-dimensional nature of students’ learning adaptability. Moreover, few studies provide a comprehensive framework that integrates advanced feature interaction modeling and attention mechanisms to address the diversity of demographic, socio-economic, and academic factors influencing adaptability. In this study, we introduce a novel hybrid deep learning framework. This approach not only enhances predictive accuracy but also provides detailed insights into the relative importance of different feature dimensions, thereby guiding personalized interventions and curriculum design. The contribution of this research lies in bridging the gap between traditional ML methods and modern deep learning approaches for comprehensive, data-driven prediction of students’ adaptability in online entrepreneurship education.
Material and method
Data collection and preprocessing
Data collection
In this study, we employed the dataset introduced in the work of Hasan Suzan et al. (2021). The data were gathered through a combination of online and offline surveys to ensure diversity among participants. The survey covered learners across different educational levels, including high school students, college students, and university students. The collection process was carried out between December 10, 2020 and February 5, 2021, resulting in a total of 1,205 valid records after removing incomplete or duplicate responses. This dataset is particularly valuable because it captures the factors influencing students’ adaptability in the context of online learning, which plays a critical role in shaping their engagement and performance in online entrepreneurship education. The dataset consists of 14 input features along with1 target variable (adaptability level in online learning). These attributes reflect demographic, socio-economic, infrastructural, and academic aspects of the learners. Specifically, they include:
Age and Gender: basic demographic information.
Education Level: distinguishes between school, college, and university students.
Type of Institution: differentiates public and non-public institutions.
Geographic Location: captures regional variations in access to online education.
IT-related background: whether the participant is an IT student or not.
Prior Educational Background: academic preparedness of the learner.
Load Shedding Level and Internet Quality: infrastructural conditions affecting access.
Class Time: reflects flexibility or constraints in scheduling online classes.
Family Economic Condition: socio-economic factor influencing access to resources.
Device Type: such as computer, smartphone, or tablet used for attending classes.
Institutional learning management system (LMS) Availability: indicates whether the institution provides its own learning management system.
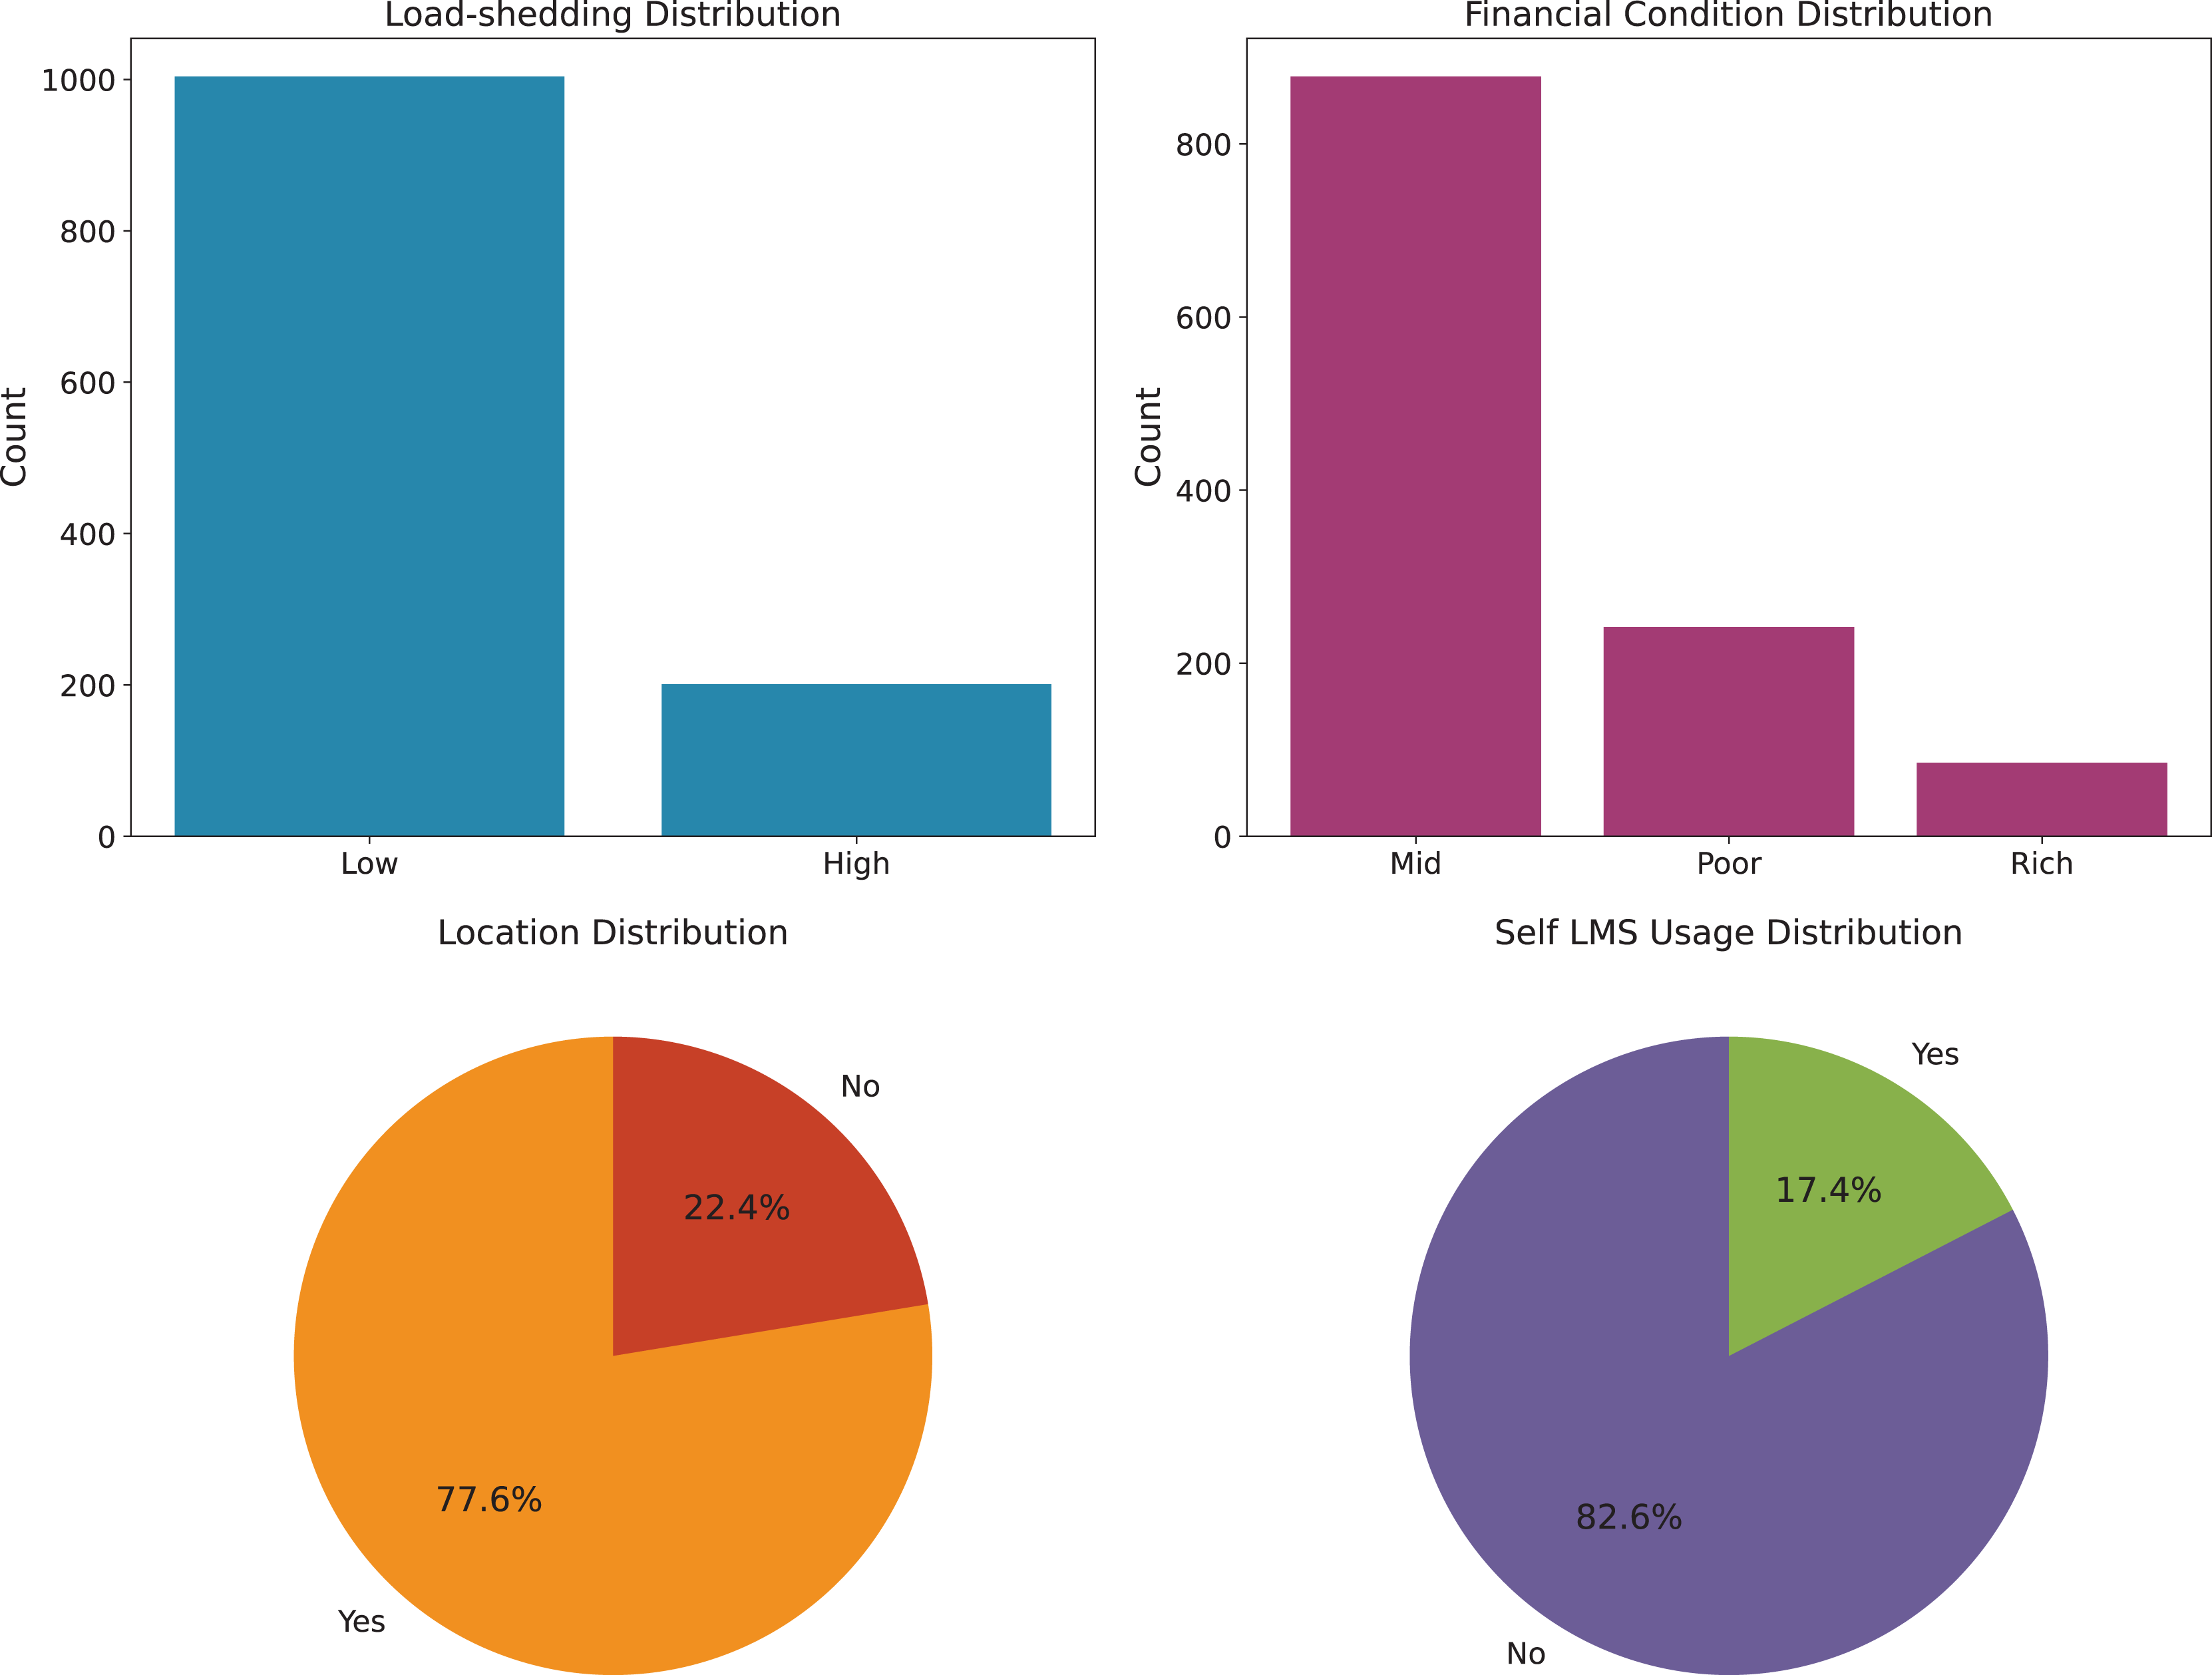
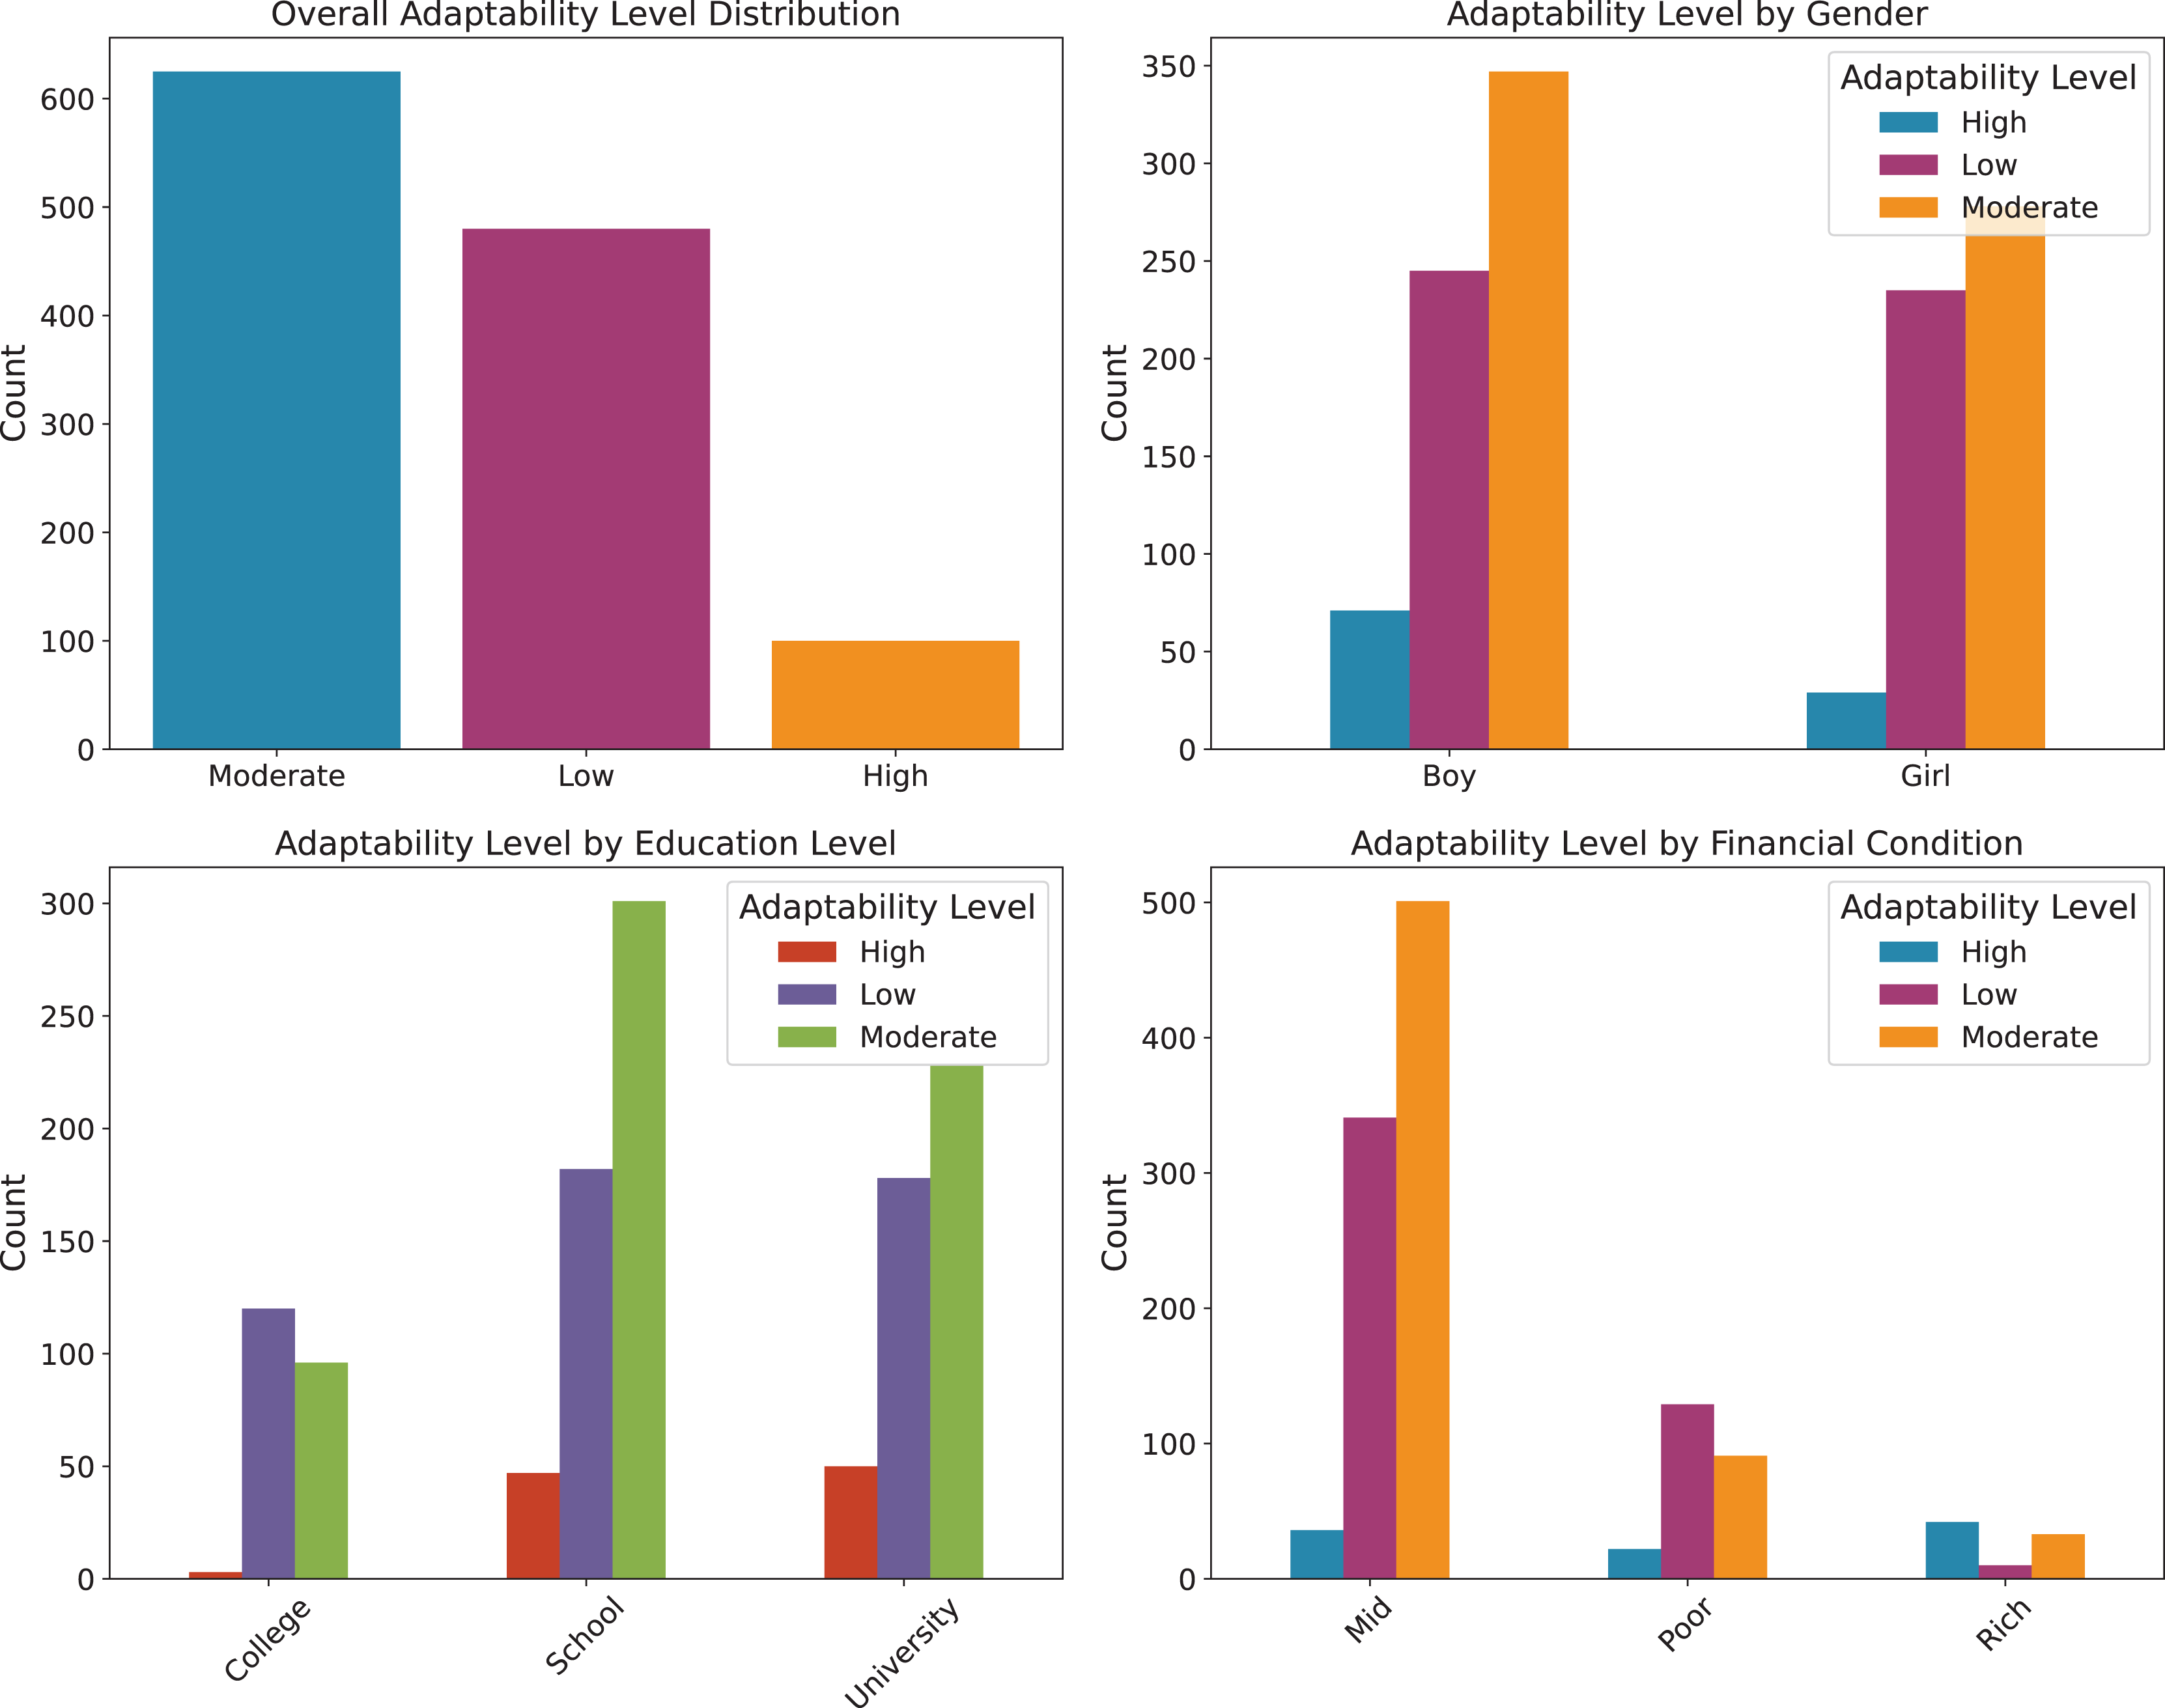
To provide a clearer understanding of the dataset, we illustrate the distribution of key influencing factors. Specifically, Fig. 1 presents the analysis of environmental factors, such as geographic location, economic condition, and load shedding level, which directly affect students’ access to online learning platforms. Figure 2 highlights the technological infrastructure aspects, including device type, internet type, and network type, showcasing how technological readiness influences online learning adaptability. Finally, Fig. 3 (Adaptability Level Analysis) provides a comprehensive view of learners’ adaptability scores, derived from gender, education level, and financial condition, serving as the target variable in our study. These attributes are especially relevant when analyzing adaptability in online entrepreneurship education, where factors such as reliable digital infrastructure, economic background, and prior academic preparedness strongly influence students’ ability to engage with entrepreneurial content, participate in collaborative tasks, and apply innovative ideas in a virtual learning environment.
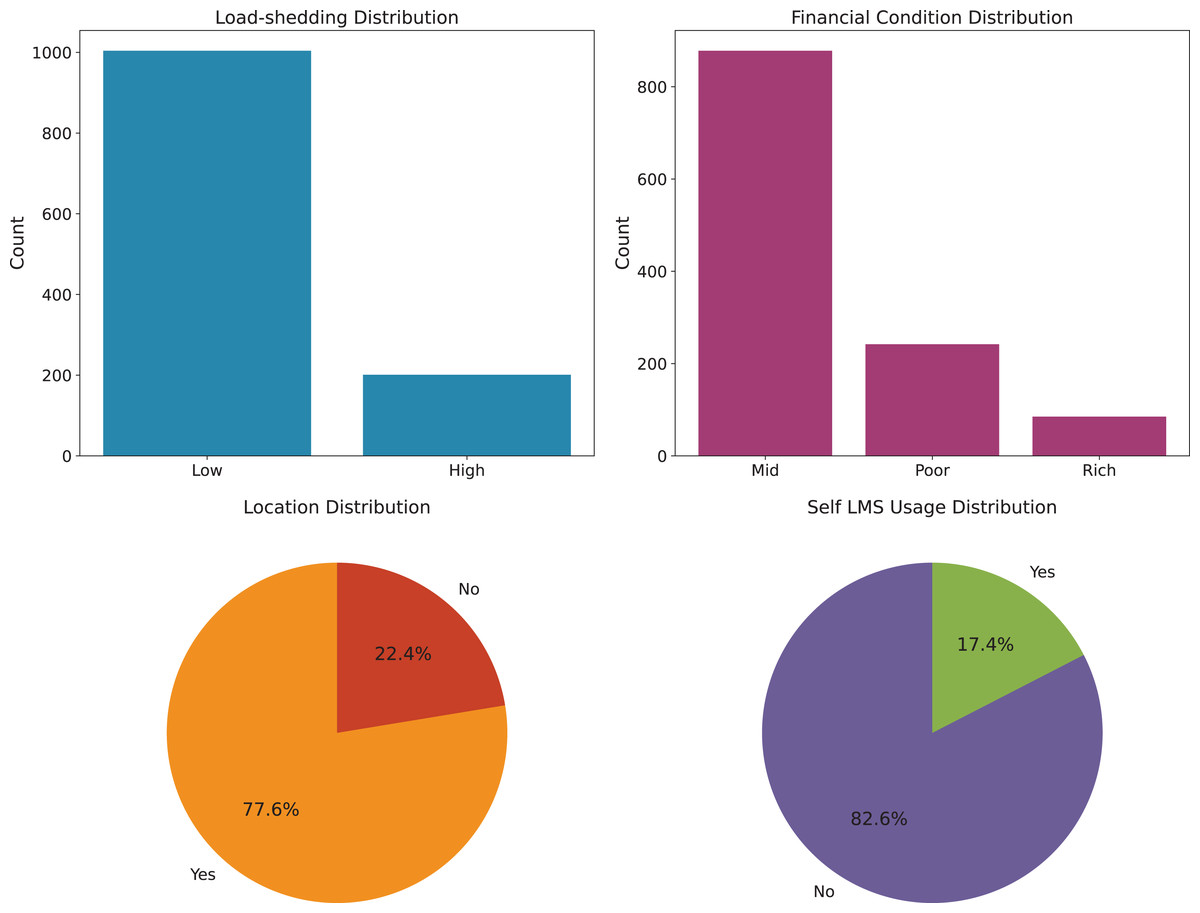
Figure 1: Environmental factors analysis.
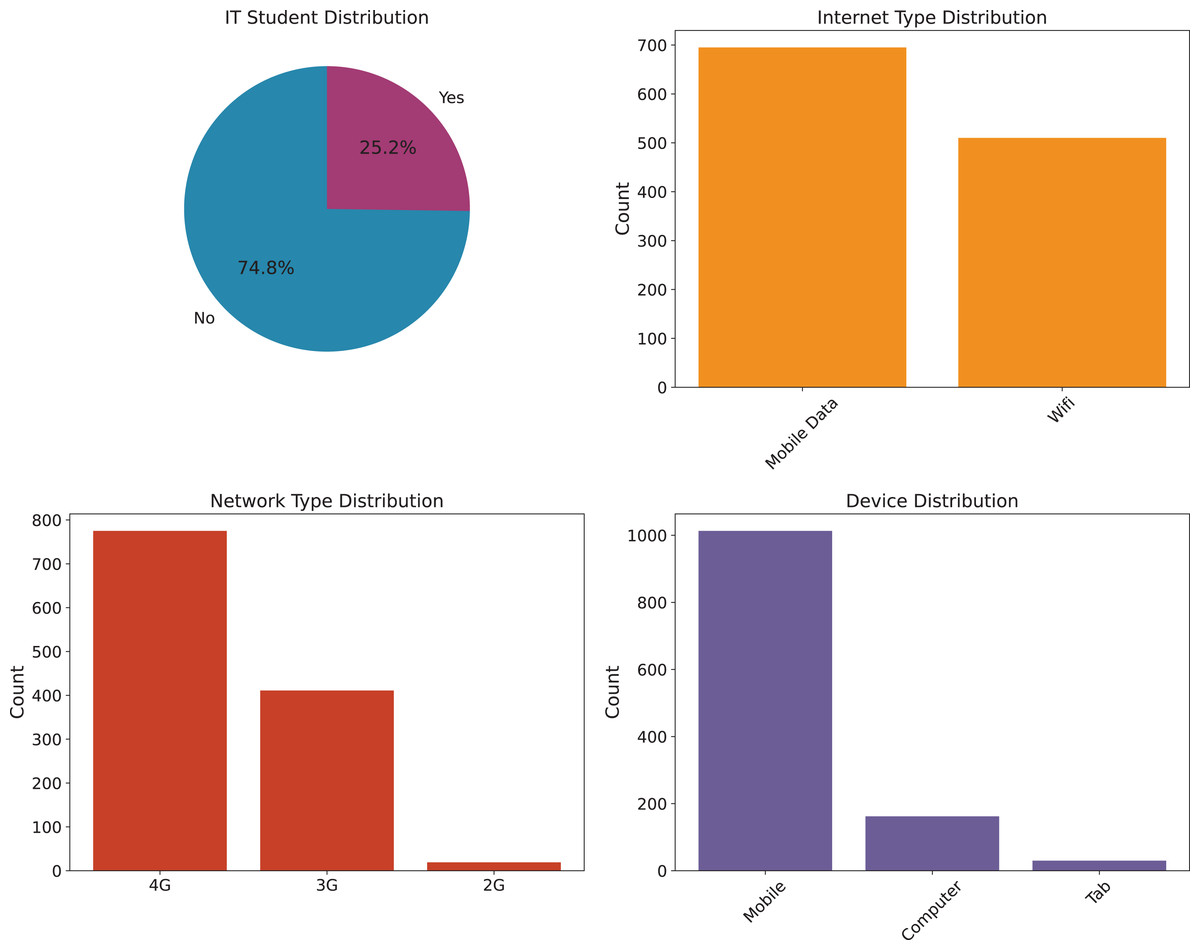
Figure 2: Technology infrastructure analysis.
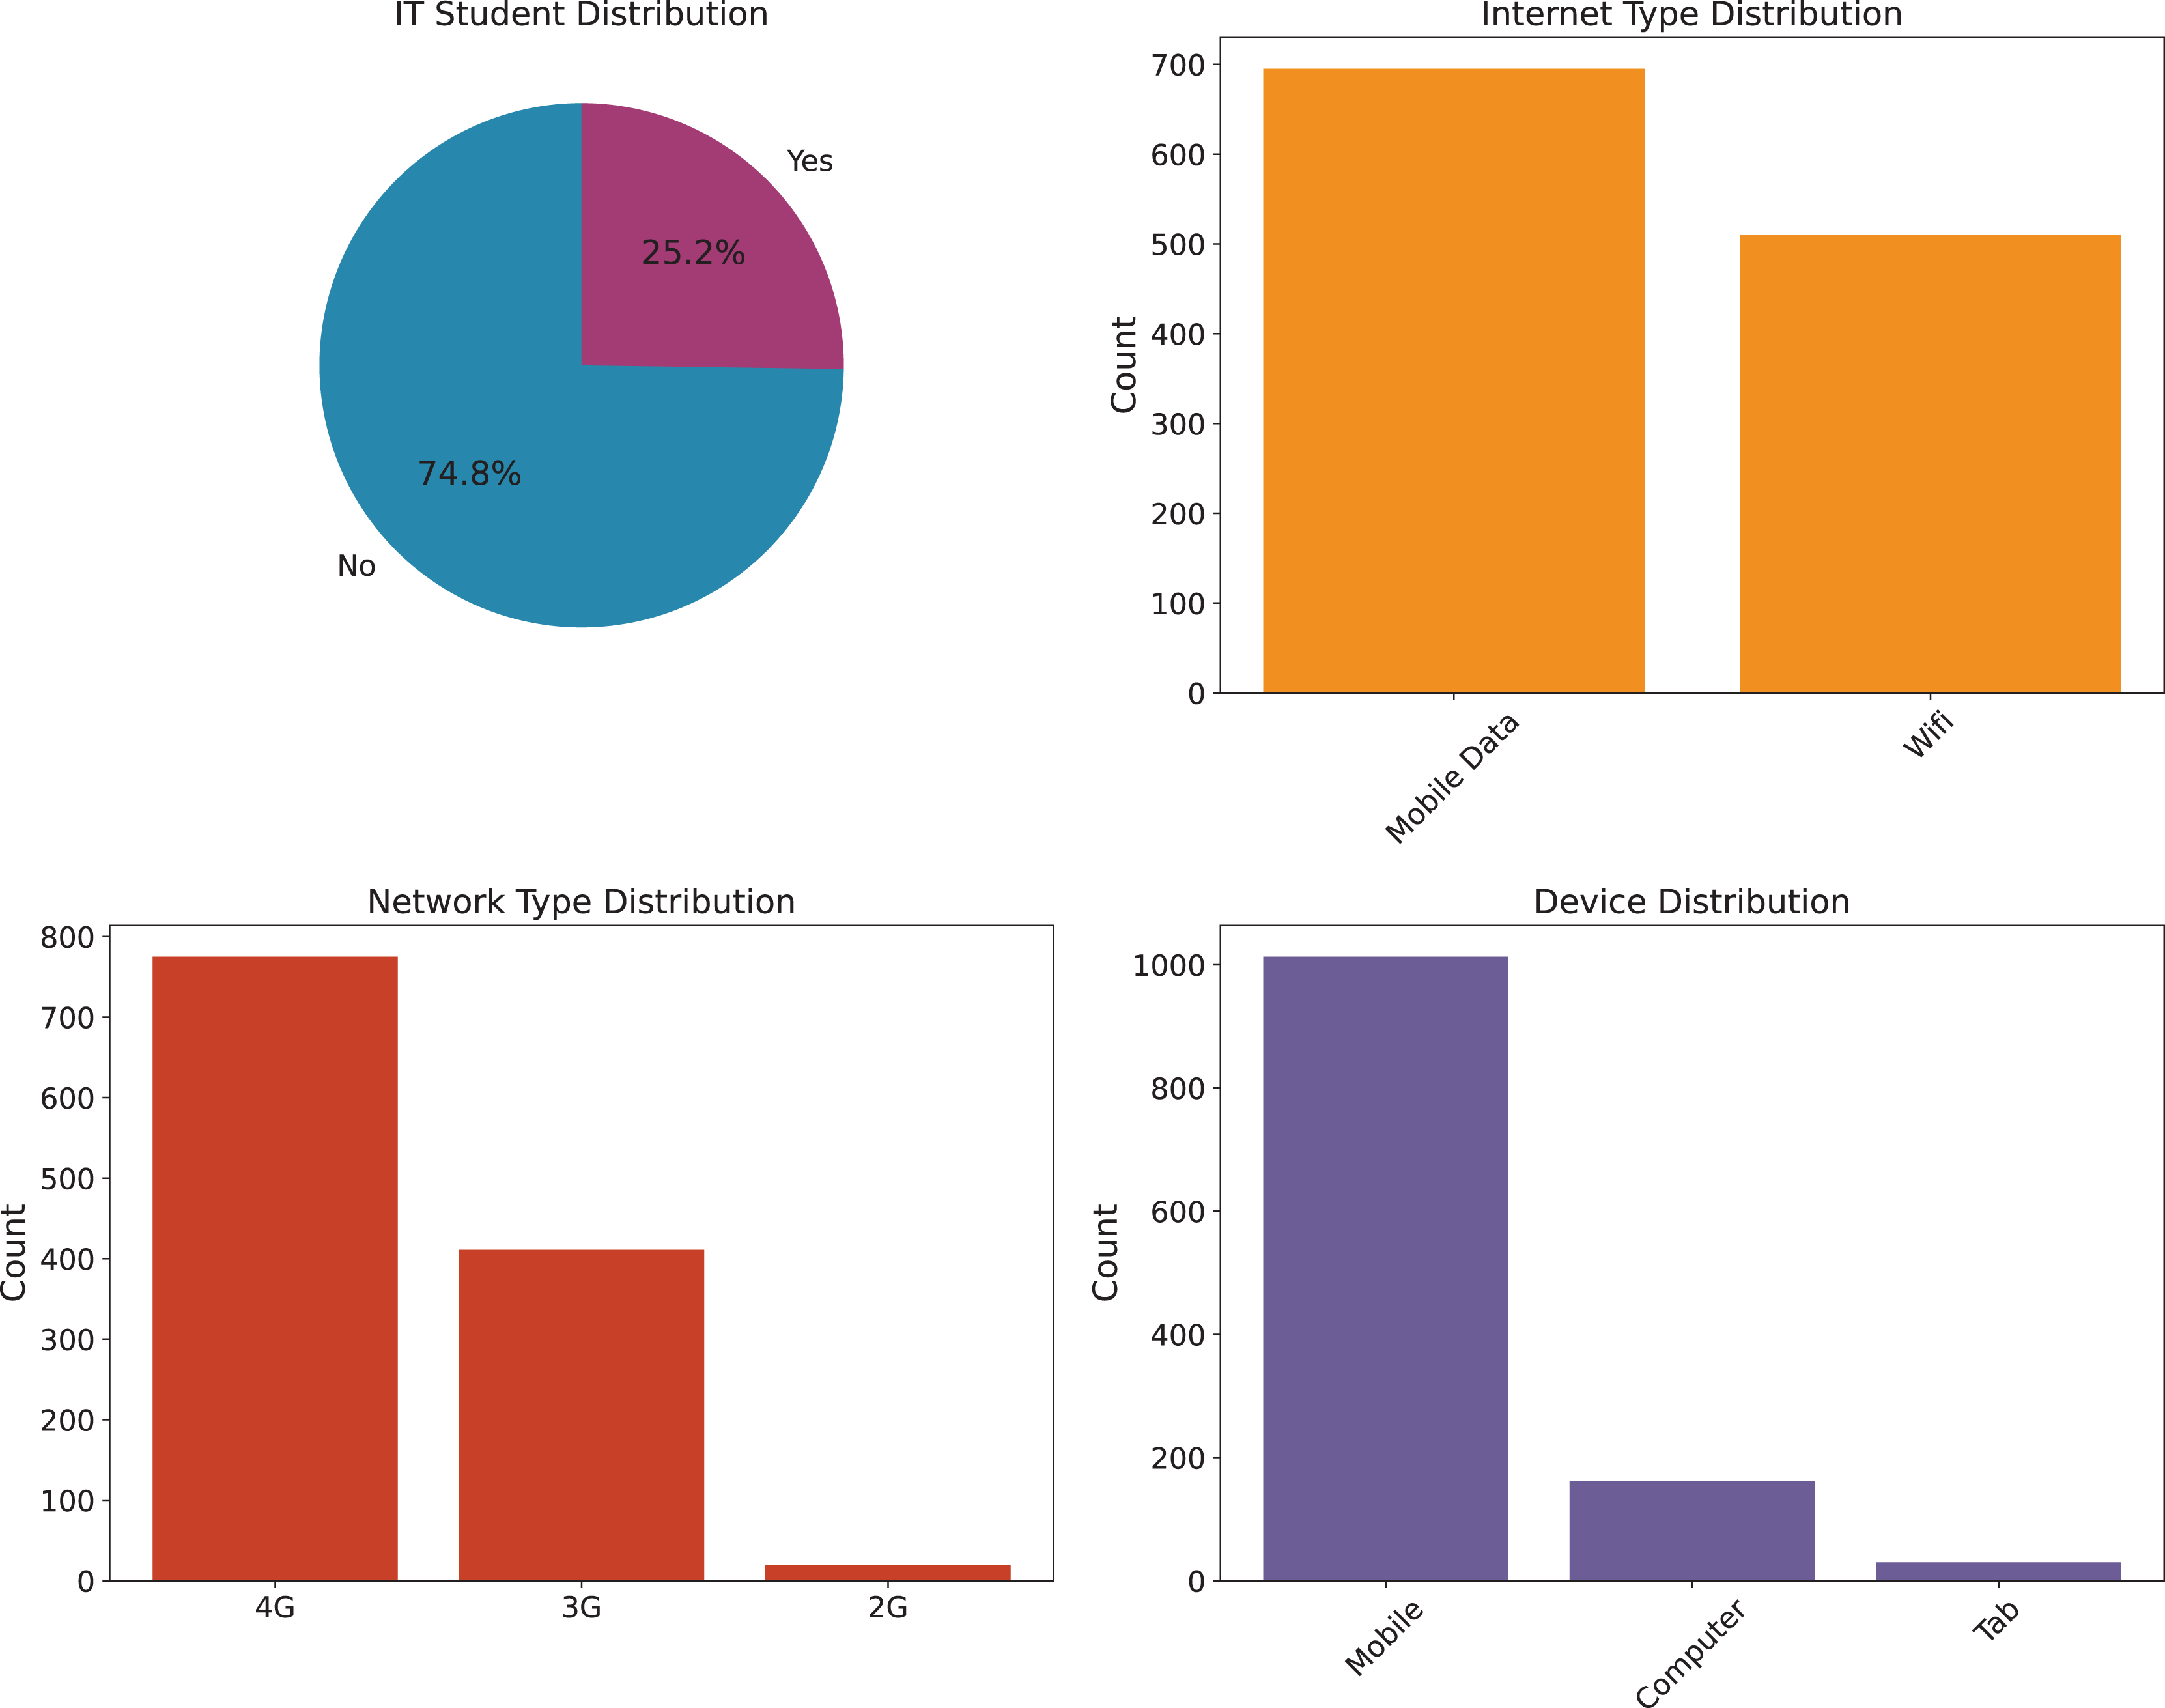
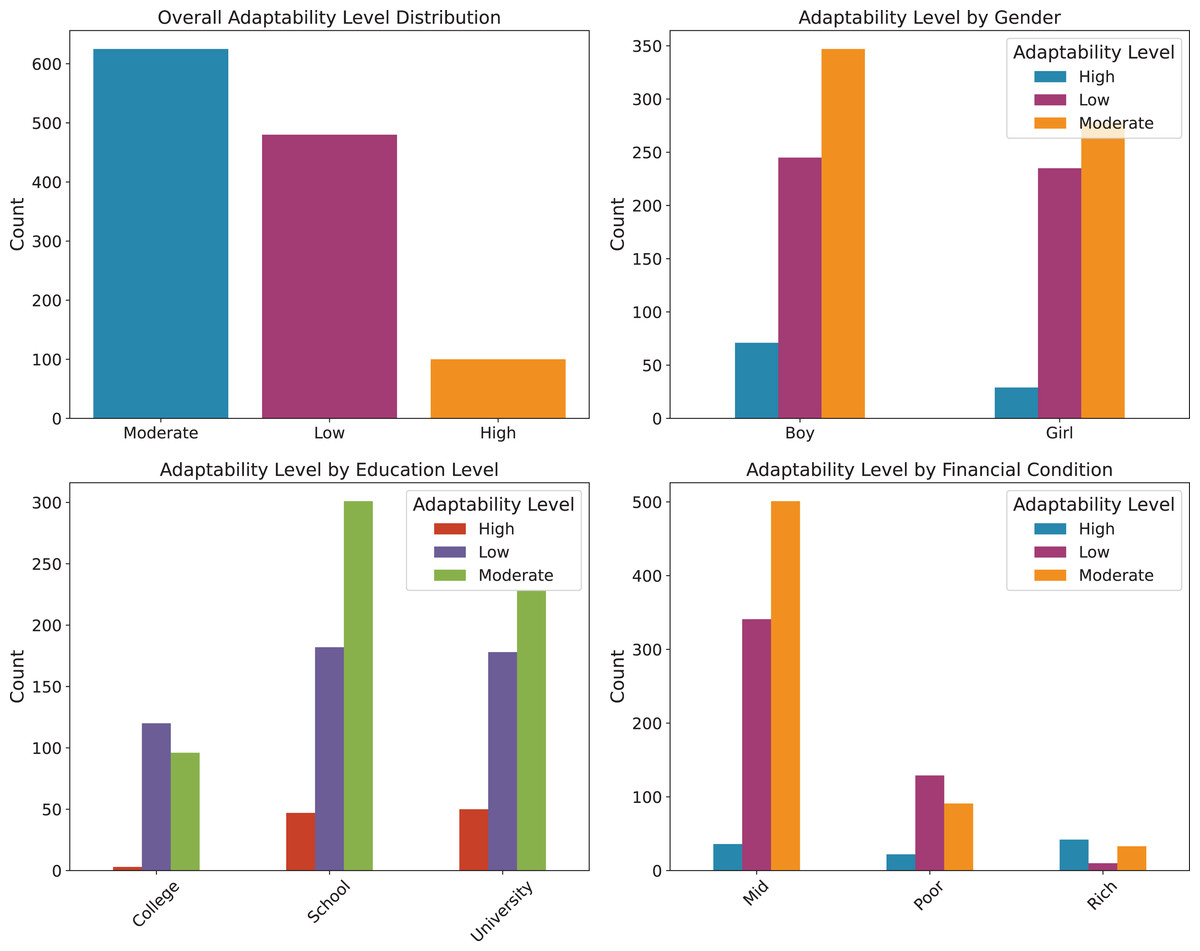
Figure 3: Adaptability level analysis.
Data preprocessing
As the survey was originally conducted in the Bengali language, all responses were manually translated into English to facilitate subsequent processing. String-type attributes were standardized and then converted into numerical values for model training. The target variable (adaptability level) was encoded with values 0, 1, and 2, corresponding to low, moderate, and high adaptability, respectively. Additional preprocessing steps such as data cleaning, removal of invalid responses, and handling of missing values were performed to ensure dataset quality. In summary, the final dataset consists of 1,205 samples, each represented by 14 features and one target label. By encompassing demographic, socio-economic, infrastructural, and academic factors, the dataset provides a strong foundation for examining and predicting students’ adaptability in online education. The original class distribution was moderately imbalanced, with the majority of learners falling into the moderate adaptability category, followed by low, and a relatively small proportion in the high group. To ensure robust model evaluation, the dataset was split into training, validation, and test sets in proportions of approximately 80%, 10%, and 10%, respectively. Table 1 summarizes the class distribution across the original dataset and each subset. This splitting helps reduce the risk of overfitting while enabling the model to be trained, tuned, and validated in an objective manner. The training set is used to learn and capture the underlying patterns, the validation set supports hyperparameter tuning and model selection, and the test set is reserved for final performance evaluation, ensuring that the reported results accurately reflect the model’s generalization ability on unseen data.
| Dataset | Total samples | Low | Moderate | High |
|---|---|---|---|---|
| Original | 1,205 | 480 | 625 | 100 |
| Training (80.0%) | 963 | 384 | 499 | 80 |
| Validation (10.0%) | 121 | 48 | 63 | 10 |
| Test (10.0%) | 121 | 48 | 63 | 10 |
Machine learning approach
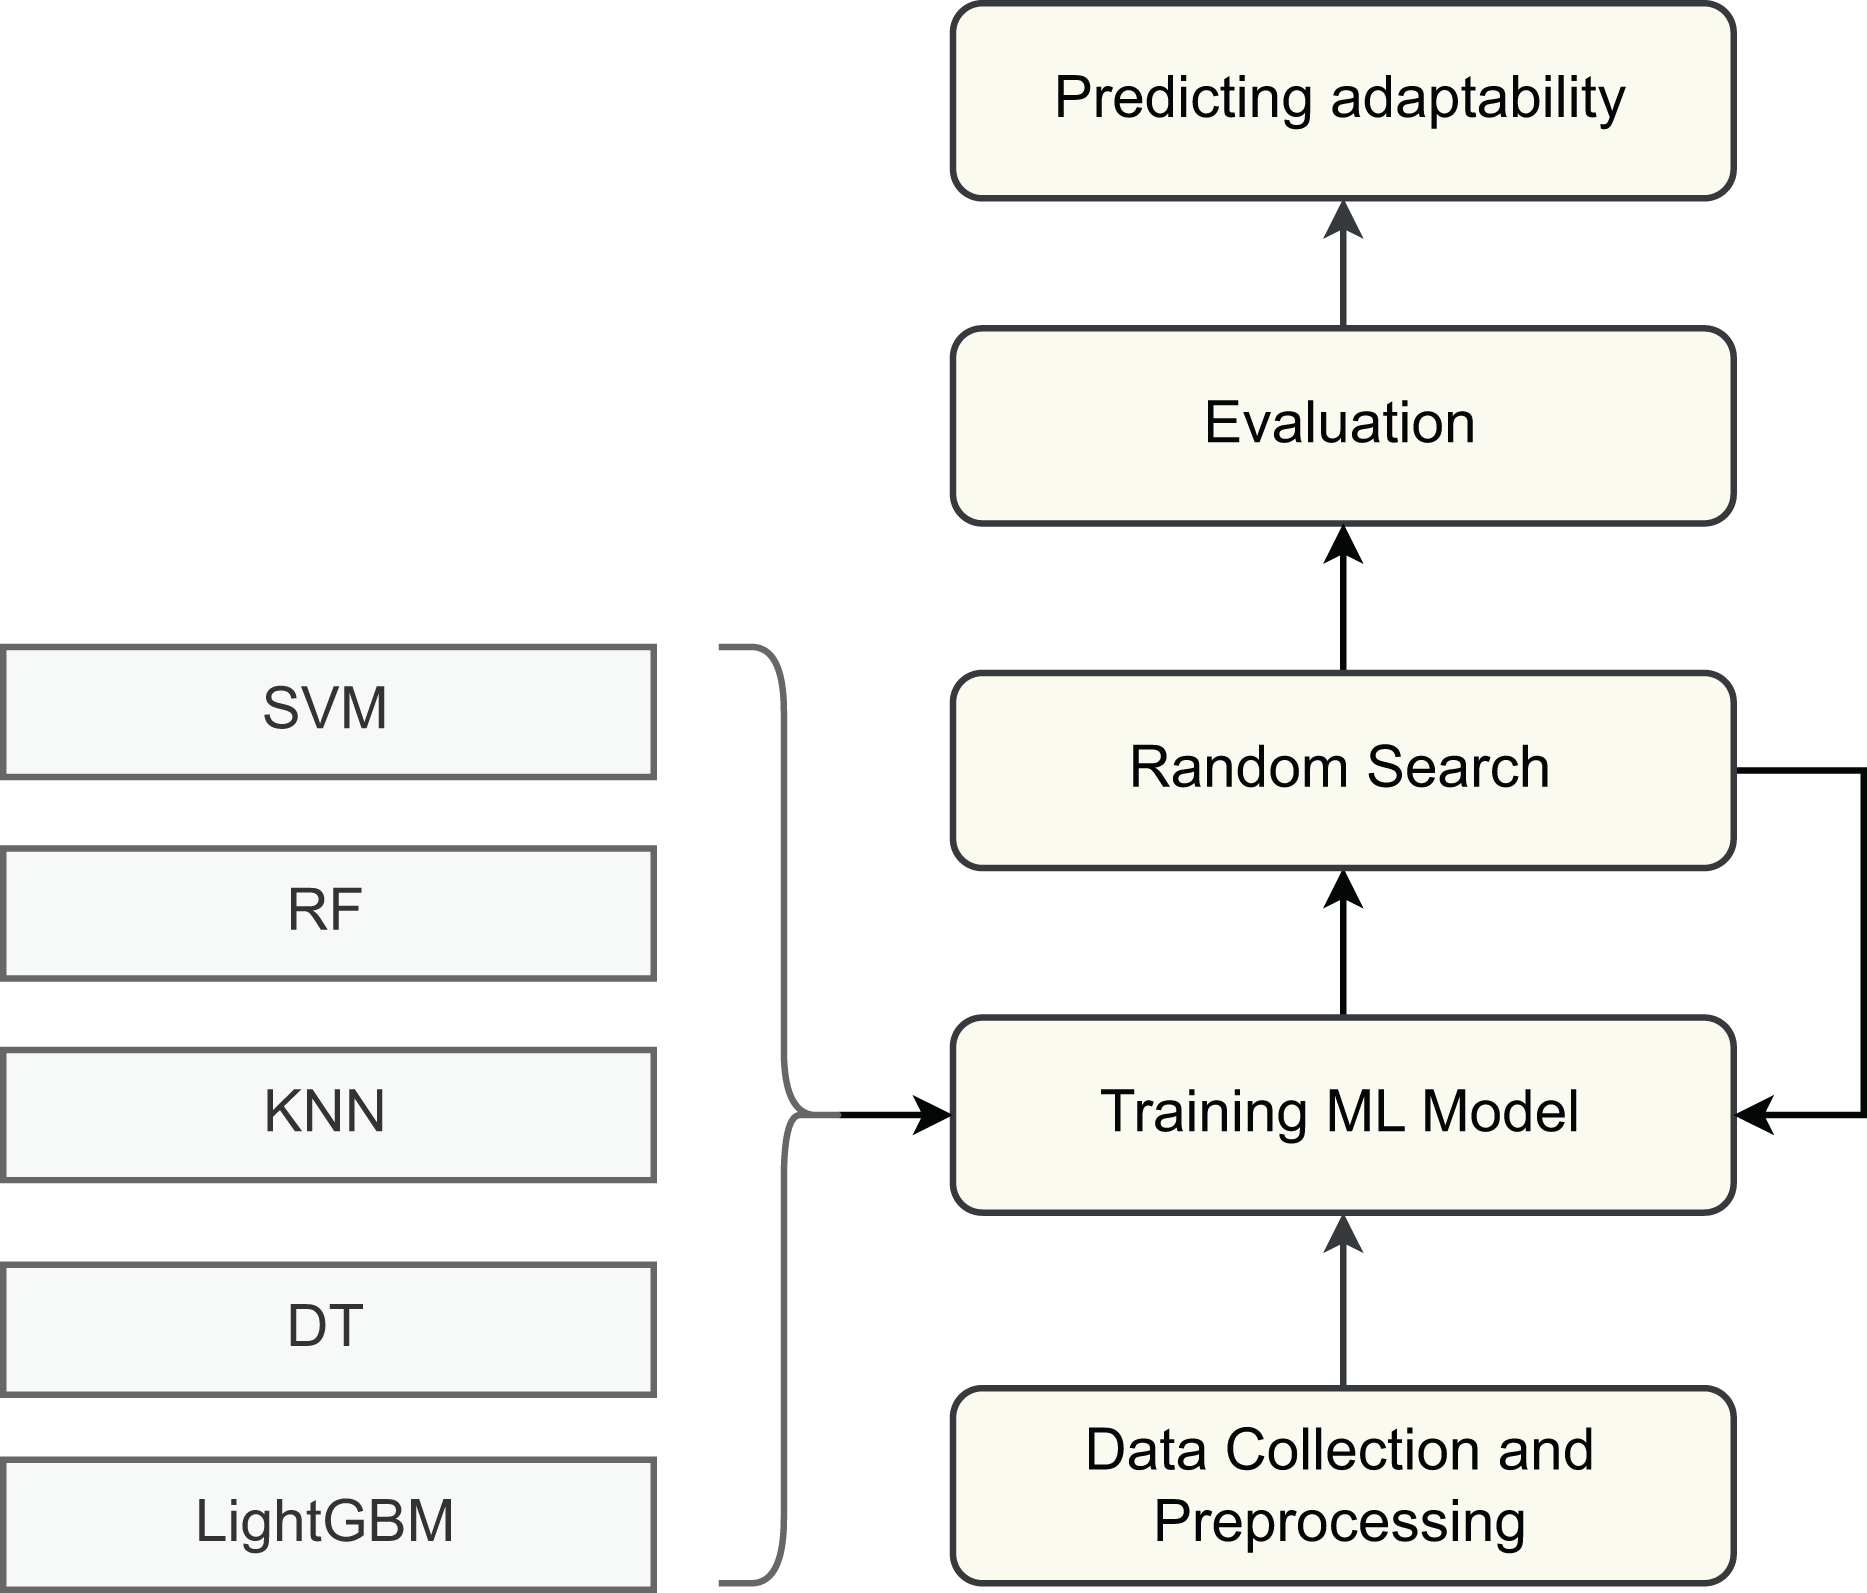
Firstly, to evaluate the adaptability of students in online entrepreneurship education, we employed several supervised machine learning algorithms. Each model was trained and tested on the processed dataset to compare performance and assess predictive capability as shown in Fig. 4. The selected algorithms include Support Vector Machine (SVM) (Hearst et al., 1998), Decision Tree (DT) (Quinlan, 1986), Random Forest (RF) (Breiman, 2001), K-Nearest Neighbor (KNN) (Mucherino, Papajorgji & Pardalos, 2009), and Light Gradient Boosting Machine (LightGBM) (Ke et al., 2017). These models provide the initial benchmark results on the dataset, allowing us to analyze their strengths and limitations. By identifying the shortcomings of these baseline approaches, we establish a foundation for motivating the development of more advanced models tailored to the task of predicting students’ adaptability in online entrepreneurship education. Their theoretical foundations and working principles are briefly described below.
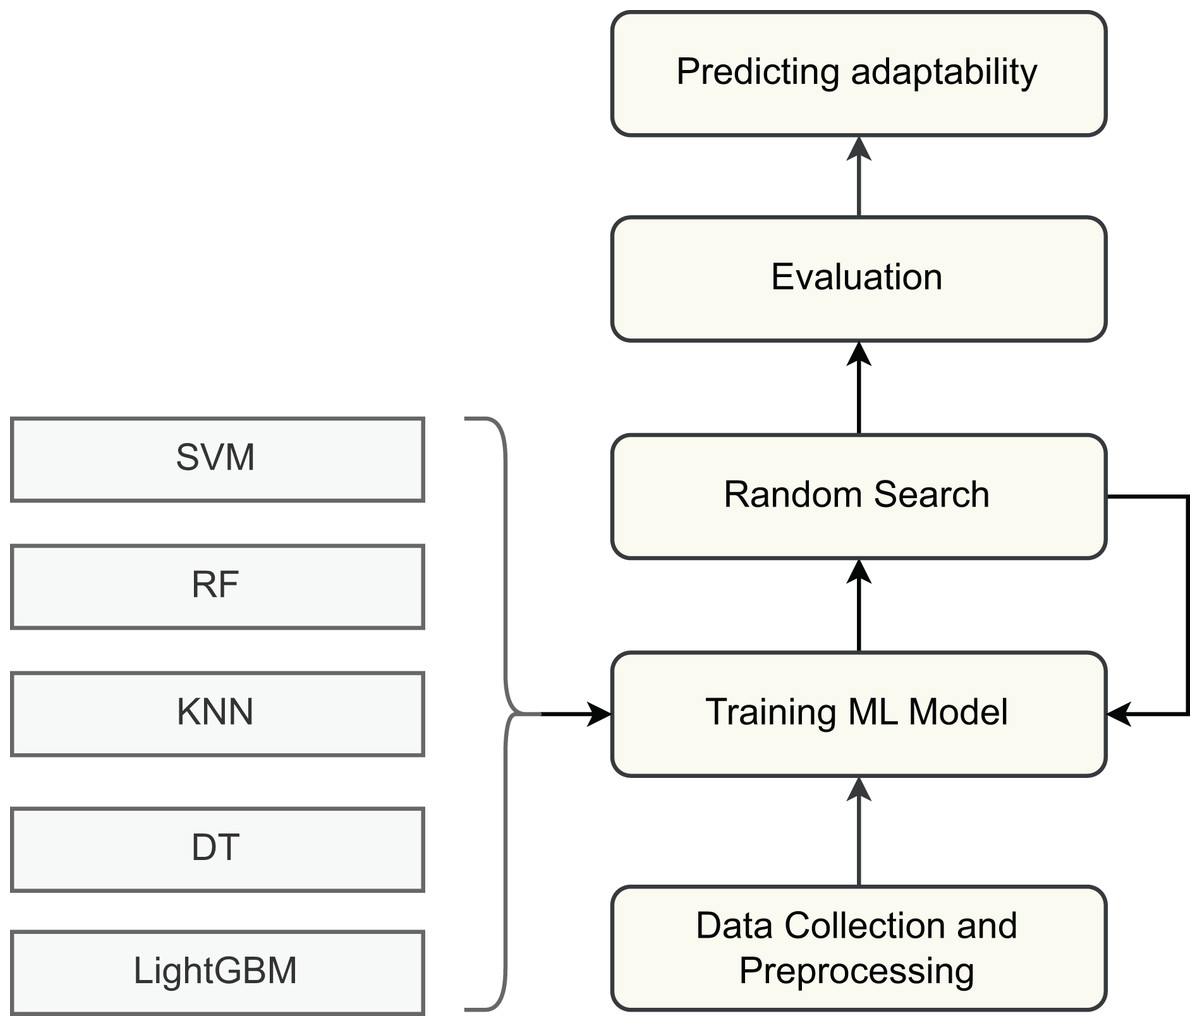
Figure 4: Machine learning approach.
Support vector machine
Support Vector Machine is a powerful classification technique that aims to identify an optimal separating hyperplane with the maximum margin between different classes. For a binary classification problem, the decision function can be formulated as:
(1) where denotes the weight vector and is the bias term. The margin is maximized by solving the following optimization problem:
(2) Since our dataset involves three adaptability classes, we adopted the one-vs.-one strategy, where multiple binary classifiers are trained and combined to handle the multi-class scenario effectively.
Decision tree
Decision Tree classifiers construct a tree-like structure in which internal nodes represent tests on features, and leaf nodes indicate class labels. The splitting criterion is generally based on entropy and information gain. Entropy of a dataset S is defined as:
(3) where is the probability of an instance belonging to class . The information gain for splitting on attribute A is:
(4) This recursive partitioning continues until a stopping condition is reached, yielding a human-interpretable tree structure that is highly suitable for categorical and tabular data.
Random forest
Random Forest is an ensemble learning method that aggregates predictions from multiple decision trees to improve accuracy and reduce overfitting. Each tree is trained on a bootstrap sample of the data, and random subsets of features are considered at each split. The final prediction is obtained by majority voting across all trees. The margin function of RF can be expressed as:
(5) where represents the randomization in tree construction and is the expectation over different trees. By averaging across diverse trees, Random Forest enhances robustness and generalization compared to individual decision trees.
K-nearest neighbor
KNN is a non-parametric and instance-based learning algorithm. Classification is performed by finding the closest data points to a query instance according to a distance metric, typically Euclidean distance. The predicted class corresponds to the majority class among the nearest neighbors. The Euclidean distance between two data points and in -dimensional space is given by:
(6) KNN is computationally simple and interpretable, making it effective for small to medium-sized datasets where local relationships among samples strongly influence classification outcomes.
Light gradient boosting machine (LightGBM)
Light gradient boosting machine (LightGBM) is a gradient boosting framework that constructs an ensemble of weak learners (decision trees) in a sequential manner. Unlike traditional boosting methods, LightGBM employs a leaf-wise growth strategy with depth constraints, enabling it to handle large-scale data efficiently. The objective function combines a differentiable loss function L and a regularization term to prevent overfitting:
(7) where and are the true and predicted labels, respectively, and denotes the -th decision tree in the ensemble. LightGBM’s efficiency in handling high-dimensional categorical features and its ability to capture complex non-linear patterns make it a strong candidate for predicting student adaptability levels.
Proposed method
Approach to model selection
Although traditional ML algorithms such as SVM, DT, RF, KNN, and LightGBM have shown effectiveness in tabular classification tasks, they exhibit limitations when applied to predicting students’ adaptability in online learning. Linear models and tree-based methods often struggle to capture complex non-linear relationships, while ensemble and boosting approaches, despite improving accuracy, remain insufficient in modeling long-range dependencies and higher-order feature interactions across diverse attributes such as demographic, socio-economic, infrastructural, and academic factors. Moreover, most existing approaches treat features independently or rely on simplistic aggregation strategies, ignoring the intricate interplay between diverse data modalities that is critical for understanding adaptability in online entrepreneurship education. This gap indicates a clear need for models capable of jointly capturing feature heterogeneity, long-range dependencies, and non-linear interactions in tabular data.
To overcome these limitations, we propose TabNSA (Eslamian & Cheng, 2025), a deep learning framework specifically designed for tabular data. TabNSA integrates Native Sparse Attention to efficiently capture long-range dependencies among features, and TabMixer to model intricate non-linear interactions between heterogeneous attributes. This hybrid design ensures both scalability and enhanced representational power, enabling more accurate and comprehensive prediction of adaptability levels in the context of online entrepreneurship education.
Model description
To accurately predict students’ adaptability in the context of online entrepreneurship education, we propose a hybrid deep learning framework named TabNSA (Eslamian & Cheng, 2025). This model is tailored for tabular data and is designed to efficiently capture both long-range dependencies among features and complex non-linear feature interactions. The architecture integrates Native Sparse Attention (NSA) (Yuan et al., 2025) and TabMixer modules, thus balancing global contextual modeling with effective feature mixing. These modules will be further explained in the following subsections.
Given an input batch of tabular data represented by matrix , where B is the batch size and N denotes the total number of features extracted from student records, the TabNSA model undergoes a series of transformations to produce the final prediction of adaptability. The overall design is illustrated in Fig. 5.
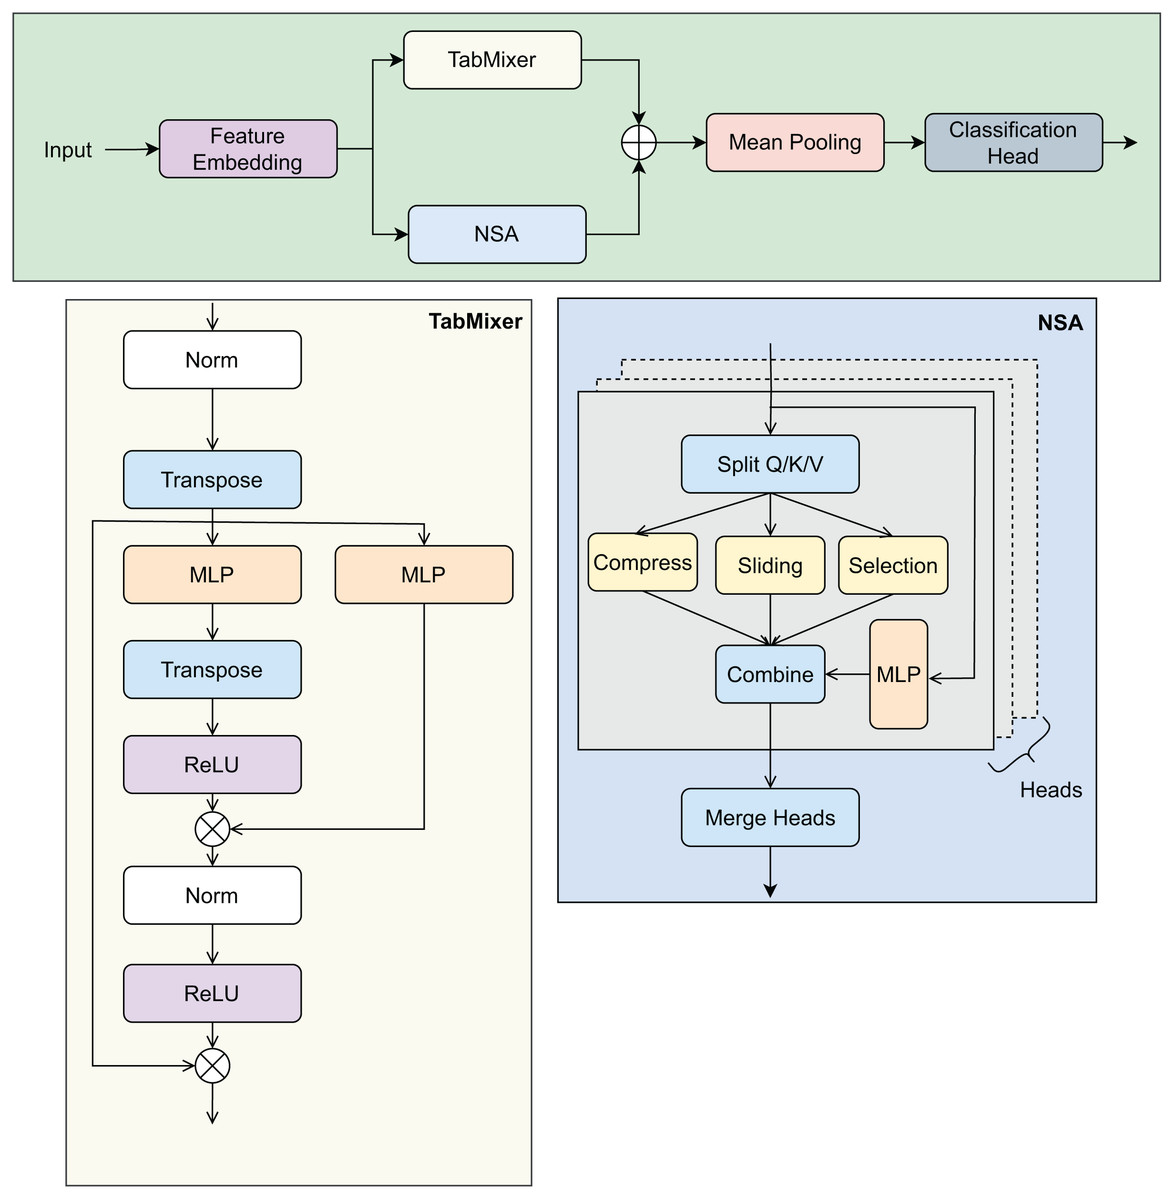
Figure 5: Overview of the TabNSA model architecture.
The figure illustrates the NSA and TabMixer modules, along with the data flow from input features to the prediction output.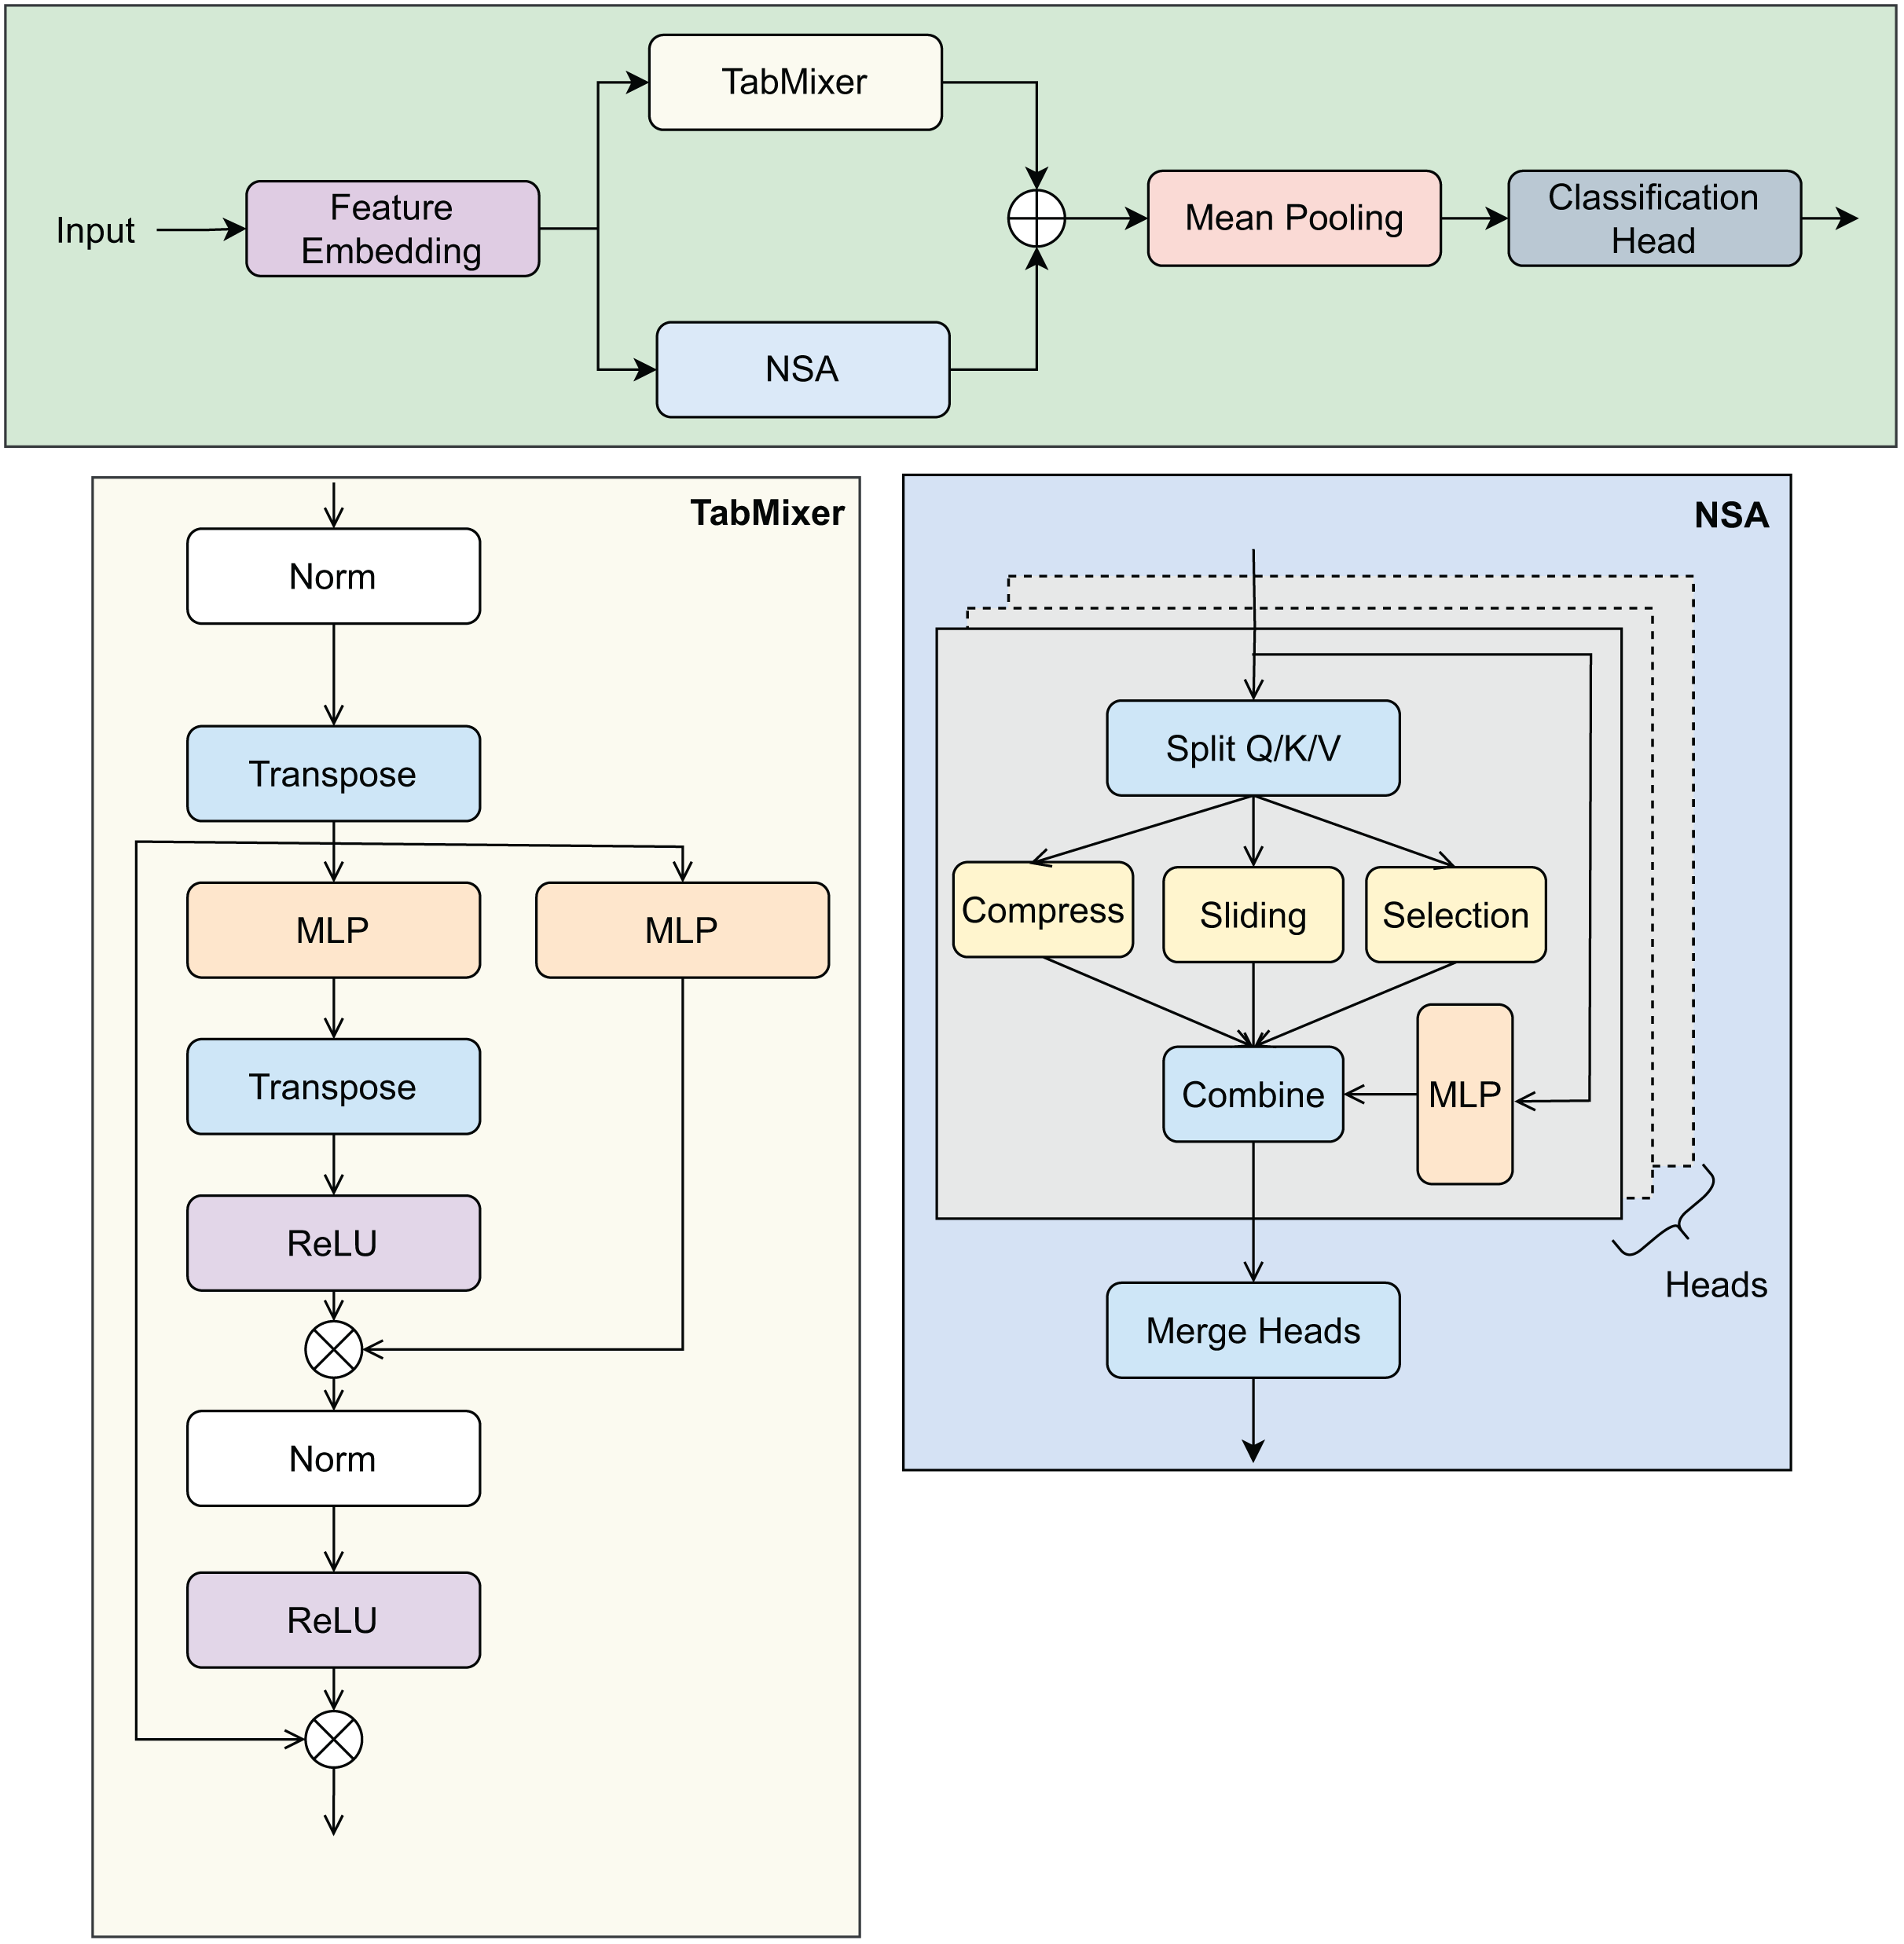
Feature embedding: The input features consist of both numerical and categorical types, each requiring tailored processing to produce a unified embedding representation. Numerical features are first normalized and then projected into a high-dimensional embedding space of dimension D using a shared linear transformation:
(8) For categorical features, one-hot encoding are applied to convert each categorical value into a fixed 1-dimensional scalar representation. Subsequently, each scalar categorical feature is linearly projected into the same D-dimensional embedding space as numerical features through a shared linear layer:
(9) This approach ensures a consistent embedding dimension D for both numerical and coded categorical features without using a dedicated embedding lookup table. The embedded numerical and categorical features are then concatenated along the feature dimension to form the complete embedding tensor:
(10)
Native Sparse Attention: The embedded features E are processed via the NSA module, which addresses the computational challenges of standard self-attention’s quadratic complexity in feature dimension. NSA employs three core mechanisms:
Sliding-window local attention: Focuses on capturing dependencies among neighboring features to model local context effectively.
Block-wise compression: Aggregates non-overlapping blocks of features to reduce dimensionality and computational expense.
Block selection: Selects only the most informative blocks for further processing, thus maintaining efficiency while preserving key information.
Through these components, NSA models long-range inter-feature relationships with linear complexity, making it scalable for high-dimensional tabular datasets.
TabMixer module: Parallel to the attention mechanism, the embedded features are fed into TabMixer, an architecture inspired by recent MLP-Mixer frameworks. TabMixer facilitates both intra-feature and inter-feature interactions via:
Channel-wise MLP: Processes each feature embedding vector independently to learn complex patterns within feature dimensions.
Token-wise MLP: Operates across the feature tokens to capture interactions between different features.
Non-linear activation functions such as ReLU are employed to enhance the representational capacity of these MLP layers, enabling the model to effectively capture heterogeneous dependencies in educational data.
Fusion and aggregation: Outputs of the NSA and TabMixer modules, denoted and respectively, are combined through element-wise summation:
(11)
To obtain a fixed-length vector representation summarizing all feature information, mean pooling is applied across the feature tokens:
(12)
Classification head: The aggregated embedding X is fed into a two-layer multilayer perceptron (MLP) with GeLU activations to compute the final adaptability prediction score or classification logits:
(13) where C denotes the number of target classes or regression outputs. This classification head reduces the embedding dimension and produces the model’s final output corresponding to students’ adaptability levels.
Model configuration
Table 2 summarizes the key configuration details of the proposed TabNSA model, including embedding dimensions, NSA and TabMixer settings, and classification head parameters. These default values are chosen to balance model capacity and computational efficiency for tabular data prediction tasks.
| Component | Parameter | Default value |
|---|---|---|
| Feature embedding | Embedding dimension (D) | 128 |
| NSA | Window size | 8 |
| Number of blocks selected | 4 | |
| TabMixer module | Channel-wise MLP hidden dimension | 128 |
| Token-wise MLP hidden dimension | 128 | |
| Activation function | ReLU | |
| Fusion and aggregation | Fusion method | Element-wise summation |
| Pooling | Mean pooling across features | |
| Output dimension after pooling | 128 | |
| Classification head | Hidden layers | [128, 64] |
| Output classes (C) | 3 (Low/Moderate/High adaptability) |
Evaluation metrics
To comprehensively evaluate the predictive performance of the proposed TabNSA model and benchmark algorithms, we employed a set of widely used classification metrics, including Accuracy, Precision, Recall, and F1-score.
(14)
(15)
(16)
(17) These metrics collectively provide a reliable assessment framework, enabling us to capture both global and class-specific performance trends. For each experiment, results were computed per class (low, moderate, high adaptability) and averaged to reflect overall system capability.
Evaluation method
To validate the effectiveness and robustness of the proposed TabNSA framework, a series of carefully designed experiments were conducted on the student adaptability dataset. The evaluation process was structured to progressively examine the contribution of individual model components, the comparative advantage over traditional machine learning approaches, and the competitiveness against recent deep learning architectures for tabular data. All experiments were performed under consistent data preprocessing and training conditions to ensure fair comparison and reproducibility.
Ablation study
To assess the impact of each architectural component in the proposed TabNSA model, we performed an ablation study focusing on the contributions of the NSA and TabMixer modules. Four model configurations were evaluated:
-
Baseline MLP: a simple two-layer feedforward neural network without attention or mixing mechanisms.
-
TabNSA (w/o NSA): the proposed architecture excluding the attention mechanism, retaining only the TabMixer module to evaluate the role of non-linear feature mixing.
-
TabNSA (w/o TabMixer): the model incorporating only the NSA module to isolate the effect of long-range dependency modeling.
-
Full TabNSA: the complete hybrid design combining both NSA and TabMixer modules.
All variants were trained using identical hyperparameter settings and optimization strategies. The ablation study aims to clarify how each module contributes to overall performance improvements in adaptability prediction, particularly in modeling complex dependencies and heterogeneous educational attributes.
Fusion strategy comparison in the fusion and aggregation module
To further evaluate the effectiveness of the proposed fusion mechanism in TabNSA, we conducted an additional experiment comparing three commonly used feature fusion strategies: element-wise summation, concatenation, and attention-based fusion. While element-wise summation offers computational simplicity and concatenation increases representational capacity, neither explicitly models the relative importance of different feature channels. In contrast, attention-based fusion adaptively reweights features, allowing the network to highlight more informative dimensions before aggregation.
Comparative analysis of attention mechanisms
To further investigate the effectiveness of the NSA module in modeling long-range dependencies, we conducted additional experiments comparing NSA with other widely used attention mechanisms: dot-product attention (Vaswani et al., 2017) and additive attention (Wu et al., 2021). The objective is to examine how each mechanism captures global contextual information and contributes to adaptability prediction across different student groups. For a fair comparison, we replaced the NSA module in the TabNSA architecture with either:
Dot-Product Attention: standard scaled dot-product attention commonly used in transformers.
Additive Attention: a learnable attention mechanism that computes a weighted sum of input features using trainable attention scores.
NSA (baseline): the original sparse attention mechanism proposed in TabNSA.
All models retained the TabMixer module to maintain local feature interaction modeling. Hyperparameters, training schedules, and dataset splits were kept identical across all variants to ensure consistency.
Comparison with existing models
To establish a baseline reference, we compared TabNSA with a set of conventional machine learning algorithms widely applied to tabular data, including SVM, DT, RF, KNN, and LightGBM. These models were optimized using grid search to ensure competitive configurations. Table 3 summarizes the searched parameters and the final configurations selected for each algorithm. The comparison highlights the limitations of shallow or tree-based methods in capturing higher-order relationships and global contextual dependencies across diverse student features.
| Model | Tuned hyperparameters | Selected value |
|---|---|---|
| SVM | Kernel: {linear, rbf} | Kernel = rbf |
| C: {0.1, 1, 10, 100} | C = 10 | |
| : {scale, 0.01, 0.001} | = scale | |
| Decision tree | Max depth: {None, 5, 10, 20, 30} | Max depth = 20 |
| Min samples split: {2, 5, 10} | Min split = 2 | |
| Criterion: {gini, entropy} | Criterion = gini | |
| Random forest | Max depth: {None, 10, 20, 30} | Max depth = 30 |
| Min samples split: {2, 5, 10} | Min split = 2 | |
| Max features: {sqrt, log2} | Max features = sqrt | |
| KNN | n_neighbors: {3, 5, 7, 9} | n_neighbors = 5 |
| Weights: {uniform, distance} | Weights = distance | |
| Metric: {euclidean, manhattan} | Metric = euclidean | |
| LightGBM | max_depth: {5, 10, 20} | max_depth = 20 |
| learning_rate: {0.01, 0.05, 0.1} | learning_rate = 0.05 | |
| n_estimators: {100, 300, 500} | n_estimators = 300 | |
| feature_fraction: {0.6, 0.8, 1.0} | feature_fraction = 0.8 |
Beyond traditional baselines, we further benchmarked TabNSA against several state-of-the-art (SOTA) deep learning architectures for tabular data, namely TabNet (Arik & Pfister, 2019), NODE (Popov, Morozov & Babenko, 2019), FT-Transformer (Gorishniy et al., 2021), SAINT (Somepalli et al., 2021), DANets (Chen et al., 2021), DeepGBM (Ke et al., 2019), and TabTransformer (Huang et al., 2020). These models represent distinct paradigms of neural processing for tabular inputs, including attentive feature selection, differentiable decision trees, and transformer-based contextual encoding. For fairness, all models were trained on the same dataset split, using identical training epochs, learning rates, and batch sizes.
Infrastructure information
We implement all experiments in a controlled computing environment to ensure reproducibility and consistency of results. The implementation was carried out using Python 3.14 with deep learning frameworks including PyTorch 2.2 and Scikit-learn 1.4 for baseline models. The training and evaluation processes were executed on a workstation equipped with an NVIDIA RTX 3060 GPU (8GB VRAM), AMD Ryzen 9 5950X CPU (16 cores, 3.4 GHz), and 32 GB of system RAM. Model optimization leveraged with an initial learning rate of , a batch size of 64, and an early stopping criterion based on validation loss to prevent overfitting. Dataset, preprocessing scripts, and model checkpoints were managed on Ubuntu 22.04 LTS to guarantee portability and scalability. This setup ensures that the proposed TabNSA framework can be seamlessly replicated or extended in future studies.
Result and discussion
Insights from the ablation study
The ablation study result in Table 4 provides insight into the contribution of each module within TabNSA. The baseline MLP achieves reasonable performance for low and moderate adaptability (accuracy 89.374%), but struggles with the high adaptability class (recall 0.621, F1-score 0.701), highlighting its limited capacity to model complex feature dependencies. When integrating only the TabMixer module (w/o NSA), performance improves across all classes, with accuracy rising to 91.285% and recall for high adaptability improving from 0.621 to 0.673. This suggests that TabMixer is particularly effective at enhancing feature mixing and local interaction modeling, which benefits both low and moderate adaptability groups. Using only NSA (w/o TabMixer) further increases overall accuracy to 91.763%. Here, recall in the high adaptability class rises to 0.689, while precision also improves across the board. This confirms that NSA’s sparse attention mechanism outperforms at modeling long-range dependencies and global contextual relationships among features, which are especially critical for students with high adaptability. Finally, the full TabNSA model (NSA + TabMixer) achieves the best results across all metrics, with accuracy 93.582%, recall 0.972 in low adaptability, and balanced improvements in moderate and high adaptability classes. The synergistic integration of both modules ensures the simultaneous capture of local and global feature interactions, enabling the model to generalize better across different adaptability levels.
| Variant | Class name | Accuracy | Precision | Recall | F1-score |
|---|---|---|---|---|---|
| MLP baseline | Low adaptability | 89.374% | 0.881 | 0.902 | 0.891 |
| Moderate adaptability | 0.886 | 0.895 | 0.890 | ||
| High adaptability | 0.805 | 0.621 | 0.701 | ||
| w/o NSA (only TabMixer) | Low adaptability | 91.285% | 0.903 | 0.928 | 0.915 |
| Moderate adaptability | 0.912 | 0.921 | 0.916 | ||
| High adaptability | 0.828 | 0.673 | 0.743 | ||
| w/o TabMixer (only NSA) | Low adaptability | 91.763% | 0.911 | 0.934 | 0.922 |
| Moderate adaptability | 0.919 | 0.925 | 0.922 | ||
| High adaptability | 0.842 | 0.689 | 0.758 | ||
| Full TabNSA (NSA + TabMixer) | Low adaptability | 93.582% | 0.936 | 0.972 | 0.954 |
| Moderate adaptability | 0.941 | 0.949 | 0.945 | ||
| High adaptability | 0.918 | 0.736 | 0.817 |
Insights from the fusion comparison
Table 5 summarizes the performance of the three fusion variants. According to the results, element-wise summation surprisingly achieves the highest overall accuracy (93.582%), with strong performance across all adaptability classes and particularly high F1-scores for low (0.954) and moderate (0.945) adaptability. Concatenation achieves slightly lower accuracy (91.027%) and moderate improvements in F1-scores (0.772 for high adaptability), indicating that simply increasing feature dimensionality helps but is insufficient for capturing complex inter-feature relationships. The attention-based fusion shows the lowest overall accuracy (90.214%), yet it provides competitive F1-scores for low and moderate adaptability classes. Notably, it underperforms in the high adaptability class (F1 0.757), suggesting that adaptive weighting alone may not fully exploit the complementary information in heterogeneous features in this specific dataset.
| Fusion strategy | Class name | Accuracy | Precision | Recall | F1-score |
|---|---|---|---|---|---|
| Attention-based fusion | Low adaptability | 90.214% | 0.875 | 0.890 | 0.882 |
| Moderate adaptability | 0.878 | 0.882 | 0.880 | ||
| High adaptability | 0.801 | 0.718 | 0.757 | ||
| Concatenation | Low adaptability | 91.027% | 0.890 | 0.913 | 0.901 |
| Moderate adaptability | 0.895 | 0.902 | 0.898 | ||
| High adaptability | 0.815 | 0.732 | 0.772 | ||
| Element-wise summation (proposed) | Low adaptability | 93.582% | 0.936 | 0.972 | 0.954 |
| Moderate adaptability | 0.941 | 0.949 | 0.945 | ||
| High adaptability | 0.918 | 0.736 | 0.817 |
These results indicate that, for TabNSA, element-wise summation effectively preserves discriminative information across heterogeneous features, while attention-based fusion may require further tuning or complementary mechanisms to reach similar overall performance.
Insights from the attention mechanisms comparison
The results in Table 6 demonstrate the distinct advantages of the NSA module in capturing long-range feature dependencies compared to other attention mechanisms. NSA achieves the highest accuracy (93.582%) and significantly improves recall (0.736) and F1-score (0.817) for the high adaptability class. These gains can be attributed to NSA’s sparse attention mechanism, which selectively attends to the most informative feature interactions rather than computing dense attention over all pairs. This allows the model to capture critical long-range dependencies while reducing noise from irrelevant interactions, enhancing performance across all adaptability levels, resulting in more robust generalization across heterogeneous educational features.
| Variant | Class name | Accuracy | Precision | Recall | F1-score |
|---|---|---|---|---|---|
| Dot-product attention | Low adaptability | 91.478% | 0.902 | 0.935 | 0.917 |
| Moderate adaptability | 0.912 | 0.920 | 0.916 | ||
| High adaptability | 0.827 | 0.661 | 0.737 | ||
| Additive attention | Low adaptability | 91.832% | 0.905 | 0.940 | 0.922 |
| Moderate adaptability | 0.918 | 0.926 | 0.922 | ||
| High adaptability | 0.835 | 0.672 | 0.743 | ||
| NSA (Our model) | Low adaptability | 93.582% | 0.936 | 0.972 | 0.954 |
| Moderate adaptability | 0.941 | 0.949 | 0.945 | ||
| High adaptability | 0.918 | 0.736 | 0.817 |
Performance analysis
In this section, we present a comprehensive summary of the experimental results obtained from classical machine learning models and compare them with the performance of the proposed TabNSA framework on the student adaptability dataset. The comparative evaluation against classical machine learning baselines highlights the superior performance of the proposed TabNSA framework. As shown in Table 7, our model achieves an overall accuracy of 93.582% on the low adaptability class, outperforming LightGBM (91.237%), Random Forest (90.368%), and Decision Tree (88.421%). The precision, recall, and F1-score of our model on this class are 0.936, 0.972, and 0.954, respectively, which demonstrates both robustness and stability across metrics. In the moderate adaptability class, our model reaches a precision of 0.941, recall of 0.949, and F1-score of 0.945. These values are consistently higher than those of LightGBM (0.926/0.933/0.930), indicating that the hybrid architecture more effectively captures mid-level adaptability patterns where feature interactions are complex and less separable. Although the high adaptability class remains the most challenging across all models, our model still secures the best results with a precision of 0.918, recall of 0.736, and F1-score of 0.817. This outperforms LightGBM (0.902/0.697/0.786) and Random Forest (0.896/0.681/0.774), reflecting the ability of TabNSA to capture subtle and non-linear patterns in highly adaptive students. These findings confirm that TabNSA consistently surpasses traditional models across all adaptability levels. The gains are especially pronounced in recall (+2.6% compared to LightGBM in High adaptability), suggesting that the integrated NSA and TabMixer modules are particularly effective in capturing informative patterns that general tree-based and linear models overlook.
| Model | Class name | Accuracy | Precision | Recall | F1-score |
|---|---|---|---|---|---|
| DT | Low adaptability | 88.421% | 0.894 | 0.915 | 0.904 |
| Moderate adaptability | 0.903 | 0.918 | 0.910 | ||
| High adaptability | 0.852 | 0.701 | 0.769 | ||
| RF | Low adaptability | 90.368% | 0.907 | 0.954 | 0.930 |
| Moderate adaptability | 0.917 | 0.920 | 0.918 | ||
| High adaptability | 0.896 | 0.681 | 0.774 | ||
| SVM | Low adaptability | 68.754% | 0.879 | 0.583 | 0.704 |
| Moderate adaptability | 0.628 | 0.941 | 0.755 | ||
| High adaptability | 0.062 | 0.025 | 0.036 | ||
| KNN | Low adaptability | 78.126% | 0.842 | 0.774 | 0.807 |
| Moderate adaptability | 0.761 | 0.868 | 0.812 | ||
| High adaptability | 0.721 | 0.533 | 0.613 | ||
| LightGBM | Low adaptability | 91.237% | 0.918 | 0.960 | 0.939 |
| Moderate adaptability | 0.926 | 0.933 | 0.930 | ||
| High adaptability | 0.902 | 0.697 | 0.786 | ||
| Ours | Low adaptability | 93.582% | 0.936 | 0.972 | 0.954 |
| Moderate adaptability | 0.941 | 0.949 | 0.945 | ||
| High adaptability | 0.918 | 0.736 | 0.817 |
To further validate the effectiveness of the proposed TabNSA, we compared it with recent state-of-the-art (SOTA) deep learning models for tabular data. As shown in Table 8, for the low adaptability class, TabNSA achieves an accuracy of 93.582% with precision, recall, and F1-score of 0.936, 0.972, and 0.954, respectively. These values surpass SAINT (91.926%, 0.921/0.950/0.935) and FT-Transformer (91.473%, 0.917/0.942/0.929). The significant gain in recall (+2.2% compared to SAINT) highlights the ability of TabNSA to correctly identify more low-adaptability students, reducing false negatives. In the moderate adaptability class, our model achieves a balanced performance with precision 0.941, recall 0.949, and F1-score 0.945. While TabNet (0.927/0.935/0.931) and NODE (0.921/0.929/0.925) perform competitively, they still fall short of TabNSA by a margin of 1.4–2.0% in F1-score. This indicates that TabNSA’s hybrid architecture more effectively captures intermediate adaptability patterns where interactions among heterogeneous features are complex. The high adaptability class remains challenging across all SOTA models. Nevertheless, TabNSA secures the best results with precision 0.918, recall 0.736, and F1-score 0.817, outperforming SAINT (0.905/0.714/0.798) and FT-Transformer (0.893/0.701/0.785). The improvements in recall (+2.2% over SAINT and +3.5% over FT-Transformer) demonstrate that the integration of NSA and TabMixer modules enhances sensitivity in detecting highly adaptive students, a group where subtle and non-linear feature interactions dominate. In addition, recent models such as DANets, DeepGBM, and TabTransformer exhibit stable performance but still fall short of TabNSA across all adaptability groups. DANets performs relatively well in the low and moderate adaptability classes; however, its reduced F1-score in the high adaptability class (0.791) indicates limitations in capturing subtle non-linear feature dependencies. DeepGBM and TabTransformer also outperform several traditional deep tabular models, yet their improvements remain insufficient to match TabNSA, particularly in the high adaptability category where long-range dependencies and hybrid feature interactions become more dominant These results confirm that TabNSA achieves consistent superiority over both classical ML models and recent SOTA deep learning architectures.
| Model | Class name | Accuracy | Precision | Recall | F1-score |
|---|---|---|---|---|---|
| TabNet | Low adaptability | 90.835% | 0.908 | 0.933 | 0.920 |
| Moderate adaptability | 0.927 | 0.935 | 0.931 | ||
| High adaptability | 0.876 | 0.693 | 0.773 | ||
| NODE | Low adaptability | 91.052% | 0.912 | 0.938 | 0.925 |
| Moderate adaptability | 0.921 | 0.929 | 0.925 | ||
| High adaptability | 0.884 | 0.705 | 0.784 | ||
| FT-Transformer | Low adaptability | 91.473% | 0.917 | 0.942 | 0.929 |
| Moderate adaptability | 0.924 | 0.931 | 0.928 | ||
| High adaptability | 0.893 | 0.701 | 0.785 | ||
| SAINT | Low adaptability | 91.926% | 0.921 | 0.950 | 0.935 |
| Moderate adaptability | 0.929 | 0.938 | 0.933 | ||
| High adaptability | 0.905 | 0.714 | 0.798 | ||
| DANets | Low adaptability | 91.742% | 0.920 | 0.947 | 0.933 |
| Moderate adaptability | 0.928 | 0.936 | 0.932 | ||
| High adaptability | 0.898 | 0.708 | 0.791 | ||
| DeepGBM | Low adaptability | 90.964% | 0.915 | 0.939 | 0.927 |
| Moderate adaptability | 0.922 | 0.930 | 0.926 | ||
| High adaptability | 0.887 | 0.695 | 0.778 | ||
| TabTransformer | Low adaptability | 91.386% | 0.918 | 0.944 | 0.930 |
| Moderate adaptability | 0.924 | 0.933 | 0.928 | ||
| High adaptability | 0.892 | 0.703 | 0.785 | ||
| Our model | Low adaptability | 93.582% | 0.936 | 0.972 | 0.954 |
| Moderate adaptability | 0.941 | 0.949 | 0.945 | ||
| High adaptability | 0.918 | 0.736 | 0.817 |
In addition to its superior predictive performance, the TabNSA model demonstrates reasonable computational efficiency. On an NVIDIA RTX 3060 GPU (8 GB VRAM), training the full model on the student adaptability dataset took approximately 6 min for 80 epochs with a batch size of 64. The inference time per sample is only a few milliseconds, allowing for use in real-time or near real-time applications. Although TabNSA is more complex than shallow or tree-based models, the training cost remains within acceptable limits, and the model can be efficiently fine-tuned on new datasets. With this level of efficiency, TabNSA can be directly integrated into adaptive learning systems or intelligent tutoring platforms. By accurately predicting students’ adaptability levels, the model enables content personalization, appropriate interventions, and dynamic curriculum adjustments. Overall, TabNSA provides a data-driven, scalable solution that supports adaptive learning environments and enhances student outcomes.
Stability evaluation: multiple runs of the proposed model
To evaluate the stability and robustness of the proposed model, we ran the experiments five times with different random seeds. Table 9 summarizes the performance metrics across these runs for each adaptability class. The mean and standard deviation (std) are reported to provide insight into the variability of the results.
| Run | Class name | Accuracy | Precision | Recall | F1-score |
|---|---|---|---|---|---|
| 1 | Low adaptability | 93.582% | 0.936 | 0.972 | 0.954 |
| Moderate adaptability | 0.941 | 0.949 | 0.945 | ||
| High adaptability | 0.918 | 0.736 | 0.817 | ||
| 2 | Low adaptability | 92.246% | 0.928 | 0.982 | 0.955 |
| Moderate adaptability | 0.946 | 0.957 | 0.952 | ||
| High adaptability | 0.912 | 0.745 | 0.823 | ||
| 3 | Low adaptability | 94.124% | 0.945 | 0.965 | 0.955 |
| Moderate adaptability | 0.936 | 0.943 | 0.939 | ||
| High adaptability | 0.925 | 0.728 | 0.820 | ||
| 4 | Low adaptability | 93.326% | 0.930 | 0.970 | 0.950 |
| Moderate adaptability | 0.943 | 0.951 | 0.947 | ||
| High adaptability | 0.915 | 0.740 | 0.818 | ||
| 5 | Low adaptability | 93.580% | 0.938 | 0.975 | 0.956 |
| Moderate adaptability | 0.940 | 0.948 | 0.944 | ||
| High adaptability | 0.920 | 0.735 | 0.817 | ||
| Mean Std | Low adaptability | 93.371 0.693% | 0.935 0.007 | 0.972 0.007 | 0.953 0.003 |
| Moderate adaptability | 0.942 0.005 | 0.949 0.006 | 0.945 0.005 | ||
| High adaptability | 0.918 0.005 | 0.737 0.006 | 0.819 0.003 |
Limitations and research
This study has several limitations that should be considered when interpreting the findings. First, the data were collected from a single institution and specific online entrepreneurship education context, which may limit the generalisability of the TabNSA model to other universities, disciplines, or national settings. Second, the analysis is based on self-reported measures and cross-sectional data, so causal interpretations of the relationships between entrepreneurial traits, learning behaviours, and adaptability are not warranted. Third, although TabNSA achieves strong predictive performance, our feature space is restricted to tabular variables derived from the existing course design, and we do not incorporate richer multimodal signals such as clickstream sequences, text discussions, or peer interactions that may capture additional dimensions of students’ adaptive learning processes. Finally, while we provide an initial interpretation of feature importance, a more comprehensive investigation of model fairness and potential biases across demographic subgroups is still needed before large-scale deployment.
Future research should therefore extend this work along several directions. From a data perspective, collecting multi-cohort, multi-institution, and possibly longitudinal datasets would allow researchers to test the stability of the TabNSA framework over time and across diverse learning environments, as well as to link adaptability with longer-term outcomes such as employability and entrepreneurial career trajectories. Methodologically, subsequent studies could incorporate sequence-based or multimodal architectures to jointly model behavioural traces, content engagement, and assessment trajectories, thereby deepening our understanding of how adaptability evolves during a course. It would also be valuable to explore data-level strategies for handling class imbalance, building on deep learning–based oversampling techniques that synthesise realistic minority-class records while maintaining key distributional properties (Wang et al., 2025a). In addition, generative models for tabular data offer a promising avenue for augmenting scarce learner profiles and stress-testing model robustness, for example by adapting transformer-based variational autoencoders and deterministic autoencoders with Wasserstein loss to the entrepreneurship education domain (Wang & Nguyen, 2025b, 2025a). Taken together, these directions can help move from a single-institution proof of concept toward a more general, interpretable, and equitable framework for predicting and supporting students’ adaptability in online entrepreneurship education.
Conclusion
This study introduced TabNSA, a hybrid deep learning framework designed to predict student adaptability in online entrepreneurship education. By combining Native Sparse Attention and TabMixer, the model effectively balances global contextual modeling with local feature mixing. Experimental results demonstrate that TabNSA consistently outperforms classical machine learning baselines and achieves the highest overall accuracy and robust performance across all adaptability classes. The ablation study further confirmed that both NSA and TabMixer contribute complementary benefits, with their integration leading to superior performance compared to using either module alone. The proposed model also outperforms SOTA models for tabular data. These results highlight the potential of TabNSA as a reliable predictive tool for understanding and supporting student adaptability in online education contexts.
Supplemental Information
Python code with data.
The Python code used in the study with the dataset from the original source.