
Measuring the prediction performance of Alzheimer’s disease using MR images with a deep learning model supported by a cross-replication strategy
- Published
- Accepted
- Received
- Academic Editor
- Luigi Di Biasi
- Subject Areas
- Algorithms and Analysis of Algorithms, Artificial Intelligence, Computer Vision, Data Mining and Machine Learning
- Keywords
- Deep learning, Image processing, Cross-replication, Disease prediction
- Copyright
- © 2026 Cosar
- Licence
- This is an open access article distributed under the terms of the Creative Commons Attribution License, which permits unrestricted use, distribution, reproduction and adaptation in any medium and for any purpose provided that it is properly attributed. For attribution, the original author(s), title, publication source (PeerJ Computer Science) and either DOI or URL of the article must be cited.
- Cite this article
- 2026. Measuring the prediction performance of Alzheimer’s disease using MR images with a deep learning model supported by a cross-replication strategy. PeerJ Computer Science 12:e3580 https://doi.org/10.7717/peerj-cs.3580
Abstract
This study evaluates the performance of a deep learning framework supported by a cross-replication strategy for predicting Alzheimer’s disease (AD) from structural magnetic resonance imaging (MRI). EfficientNetV2-B0 was selected due to its favorable accuracy-efficiency trade-off. The workflow consisted of two stages: (i) clustering-based relabeling of the full dataset into five clinically meaningful categories, and (ii) training a classifier on the relabeled data. To assess the stability of the proposed approach, the model was trained across multiple random initializations on a fixed train/validation/test split. Class-wise Average Precision, macro- and micro-averaged Precision-Recall Area Under the Curve (PR–AUC) and Receiver Operating Characteristic Area Under the Curve (ROC–AUC), and their 95% confidence intervals were reported using bootstrap resampling. The cross-replication strategy yielded improved stability across initializations, with a mean test accuracy of 0.95 compared with 0.94 for the single-run baseline, along with consistently higher PR–AUC and ROC–AUC values. These findings suggest that cross-replication enhances the reliability of AD stage prediction by reducing performance variability due to stochastic initialization, although further evaluation with alternative data partitions or external validation cohorts is warranted.
Introduction
Constructing standardized brain templates and analyzing their anatomical organization are fundamental tasks in neuroscience and cognitive science. Magnetic resonance imaging (MRI) plays a central role in this process by providing high-resolution structural information that enables population-level analyses across diverse clinical groups (Gu et al., 2023). Alzheimer’s disease (AD), a progressive neurodegenerative disorder characterized by cognitive decline and eventual dementia, remains one of the most pressing global health challenges (Fabrizio et al., 2021). Early diagnosis is critical because therapeutic interventions are most effective during the mild cognitive impairment (MCI) or pre-clinical stages, where delaying symptom progression can substantially improve quality of life (Qiu & Cheng, 2024; Rana et al., 2023). The economic burden associated with AD is enormous—estimated at US$1.3 trillion annually and expected to rise to US$2.8 trillion by 2030—further highlighting the need for accurate, scalable, and automated diagnostic tools (Newby et al., 2023).
Multimodal neuroimaging—including structural MRI, Fluorodeoxyglucose Positron Emission Tomography (FDG-PET), amyloid-PET, and tau-PET—provides complementary biological information for early diagnosis, prognosis, and disease staging (Liu et al., 2023). Among these modalities, MRI is especially valuable due to its non-invasive nature and its ability to distinguish gray matter, white matter, and characteristic atrophic patterns associated with dementia (Yao et al., 2023; Eickhoff, Yeo & Genon, 2018; Hao et al., 2020). MRI also facilitates precise measurements of regions implicated in early AD pathology, particularly the hippocampus and amygdala.
With the increasing digitalization of healthcare systems, machine learning (ML) and deep learning (DL) have emerged as powerful tools for processing large-scale imaging data. In many AD-related applications, DL methods analyze curated datasets that include demographic information, clinical assessments, and neuroimaging features to support early prediction and diagnostic decision-making. Convolutional neural networks (CNNs) and more recent architectures such as EfficientNet and EfficientNetV2 have demonstrated strong performance in medical image classification due to their efficient scaling and favorable accuracy–efficiency trade-offs (Devi, Kumar & Sivakumar, 2023).
While ML and DL have emerged as powerful tools for processing large-scale imaging data, many AD-related DL studies often rely on manually curated labels, which may lead to potential label noise or misclassification issues. To potentially mitigate this limitation, the present work introduces a two-stage approach. In the first stage, 6,400 MRI scans were grouped into five clinically meaningful categories using an EfficientNetV2-B0–based feature extraction and clustering pipeline. A primary goal of this stage was to refine potentially mis-labeled cases in the raw dataset through an auto-mated relabeling procedure. The number of clusters (k = 5) was supported by silhouette-based and cluster-stability analyses, consistent with established methods for cluster validation (Rousseeuw, 1987). To avoid information leakage, clustering was fitted exclusively on the training set, after which the learned centroids were used to assign cluster labels to the validation and test samples. Cluster-to-label mapping followed predefined metadata-based rules to minimize the risk of circular confirmation.
In the second stage, the relabeled data were used to train an EfficientNetV2-B0 classifier for AD stage prediction. To assess the stability of the model, a cross-replication strategy was employed, defined here as repeating the full training process across multiple random initializations on a single fixed train/validation/test split—a form of variability that has been highlighted in recent work examining the sensitivity of deep learning models to initialization and data perturbations (Recht et al., 2019). Accordingly, the variability captured by the mean ± standard deviation reflects stochastic initialization effects rather than data re-partitioning, distinguishing this approach from conventional k-fold cross-validation.
A comparative evaluation was then conducted between a single-run baseline and the cross-replicated model. Performance was assessed using class-wise Average Precision (AP), macro- and micro-averaged PR–AUC and ROC–AUC, and their 95% bootstrap confidence intervals. Calibration was examined using multiclass Brier scores, Expected Calibration Error (ECE), and reliability diagrams, following established principles in probabilistic model evaluation (Niculescu-Mizil & Caruana, 2005). This comprehensive experimental design provides a trans-parent and reproducible assessment of the stability and predictive performance of Effi-cientNetV2-B0 in MRI-based AD stage classification.
The primary aim of the study is to examine whether the cross-replication strategy enhances initialization stability and contributes to more reliable prediction of AD stages. Although DL-based AD studies are common, systematic evaluations of variability across random initializations remain limited in the literature. By integrating relabeling, advanced evaluation metrics, and a fully reproducible experimental setup, the present study aims to contribute methodological rigor to MRI-based AD prediction research.
Literature review
Artificial intelligence (AI) and data-driven analytical methods have become increasingly central to the development of diagnostic and prognostic systems in healthcare. AI-based disease prediction models typically operate on large-scale datasets and employ mathematical, statistical, and algorithmic frameworks to derive clinically meaningful in-sights. In essence, AI encompasses computational systems capable of adapting to evolving conditions, generating informed predictions, solving complex problems, and executing tasks that traditionally require human-level cognitive abilities (Coppin, 2004). Within diagnostic workflows, AI-driven decision-support systems provide continuous, data-informed feed-back that enhances the accuracy, reliability, and interpretability of clinical assessments. These systems utilize a broad array of computational paradigms, including ML, DL, artificial neural networks (ANN), decision trees, and expert systems.
Figure 1 illustrates the general function of AI within the AD diagnostic pipeline, in which multimodal or single-modality data are processed through various analytical strategies to support early detection, disease progression modeling, patient stratification, and the identification of novel therapeutic targets (Fabrizio et al., 2021).
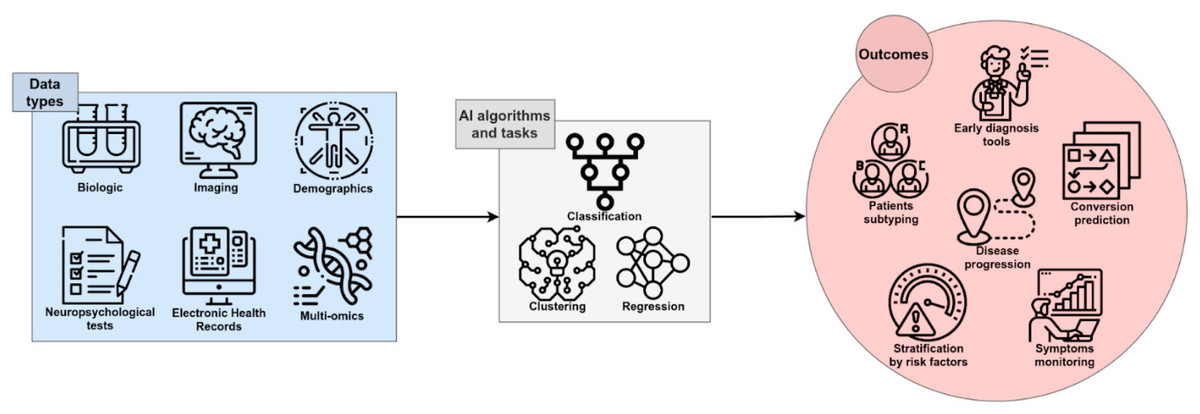
Figure 1: The role of AI in Diagnosing AD (Fabrizio et al., 2021).
Image credit: Fabrizio et al. (2021).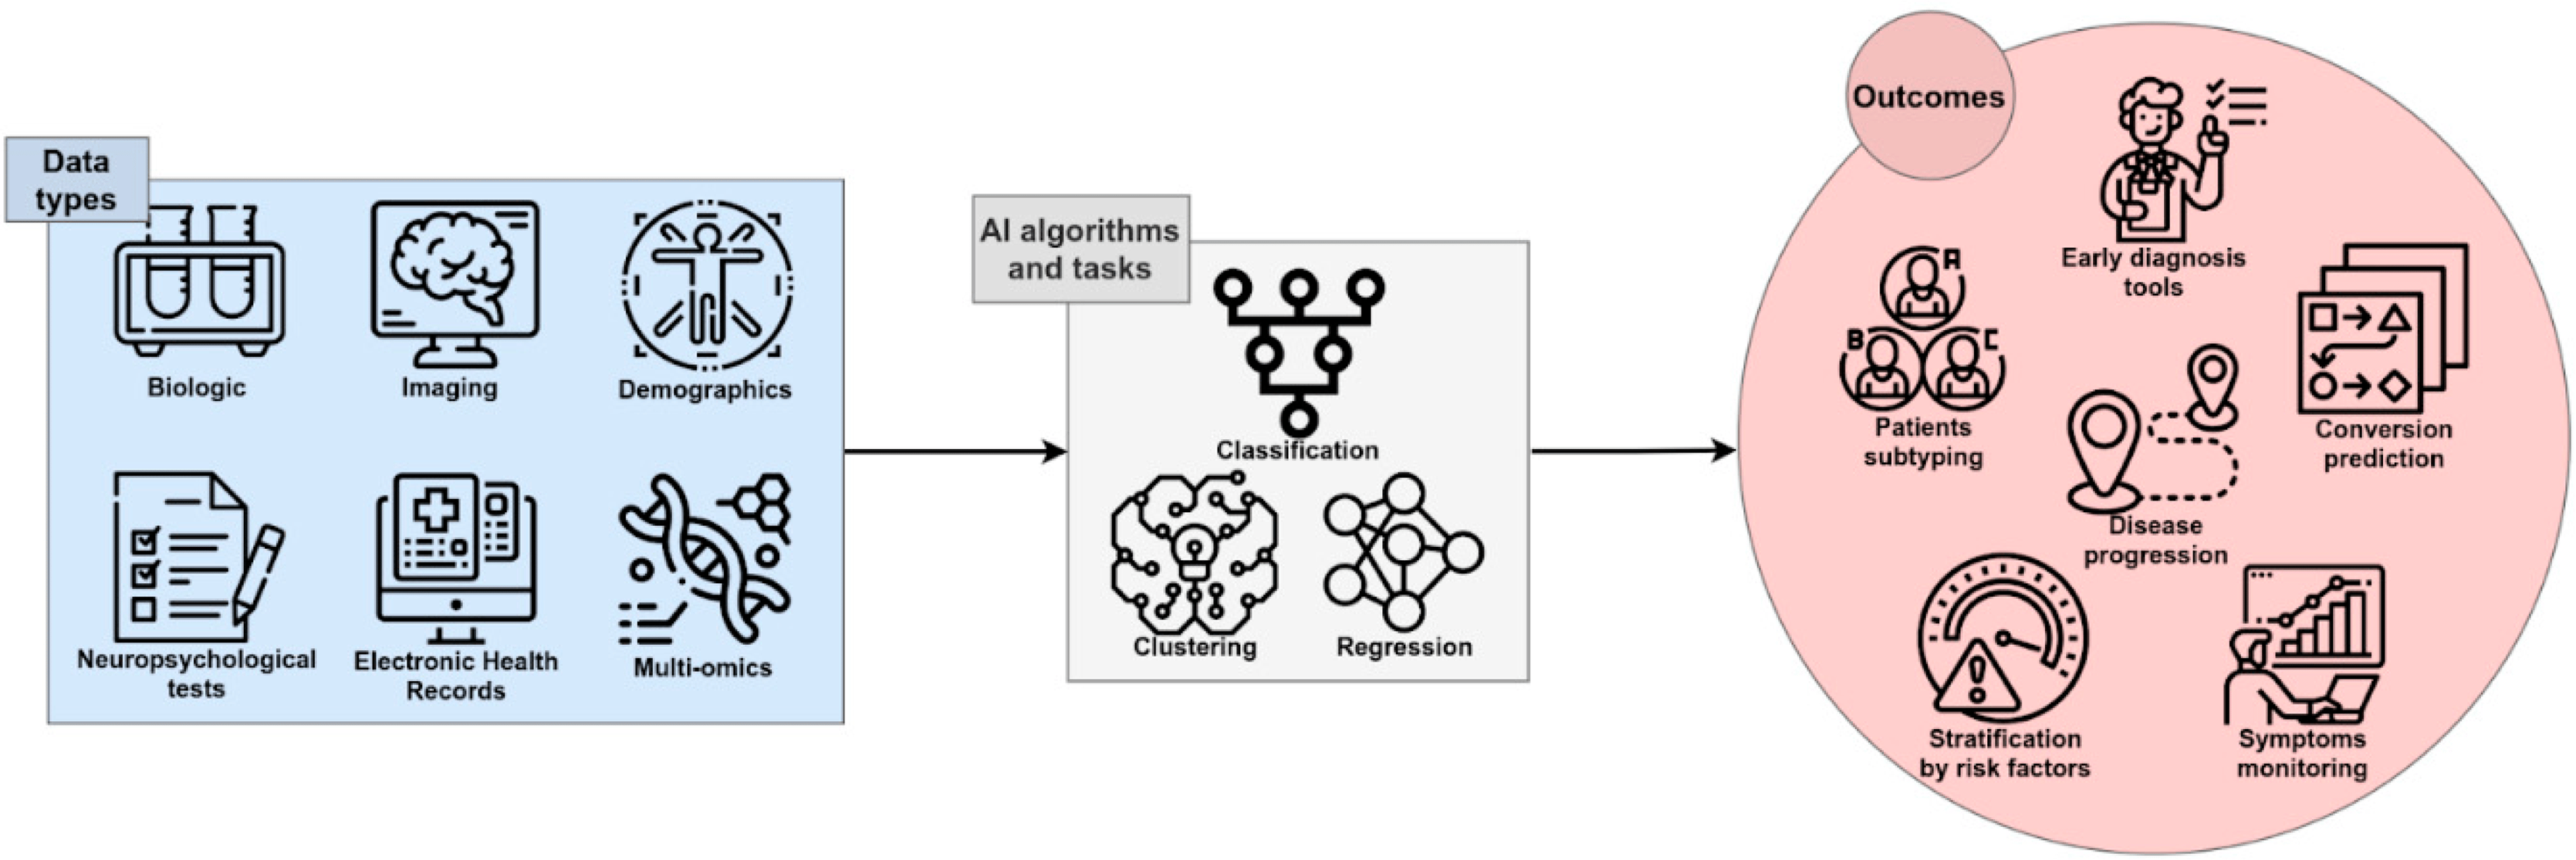
CNNs have become the dominant architecture for medical image analysis due to their strong representational capacity (Qiu & Cheng, 2024). Numerous studies have demonstrated the effectiveness of CNN variants and pre-trained models such as ResNet, ImageNet-based architectures, GoogLeNet, AlexNet, and MobileNet for AD classification tasks. Table 1 provides an overview of representative studies investigating AI-based AD prediction, summarizing their methodological approaches and reported performance.
| Author(s) | Topic/tittle | AI models | Performance |
|---|---|---|---|
| Young et al. (2013) | An AD and NC classifier using Gaussian process. Using GM volume from MRI and regional FDG of 27 preselected ROIs, as well as CSF measurements and APOE | Gaussian Process | 74% |
| Shamrat et al. (2023) | AlzheimerNet: An Effective Deep Learning Based Proposition for AD Stages Classification From Functional Brain Changes in MRI | VGG16, MobileNetV2, AlexNet, ResNet50 and InceptionV3 | 78.84%, 86.85%, 78.87%, 80.98% and 96.31% |
| Deepa & Chokkalingam (2022) | Optimization of VGG16 utilizing the arithmetic optimization algorithm for early detection of AD | VGG-16 | 97. 89% |
| Hinrichs et al. (2011) | Performance of multi-kernel learning method to construct AD and NC classifier on 112 MRI images. | Multi-Kernel Learning | 81.40% |
| Zhang & Shen (2012) | Used MRI, PET, MMSE, and ADAS-Cog at multiple time points to predict MCI conversion. (93 MRI data) | Regression model | 78.4% |
| Fuadah et al. (2020) | Automated classification of AD based on MRI image processing using CNN with AlexNet architecture | CNN with AlexNet | 95% |
| Shanmugam et al. (2022) | AD classification using pre-trained deep networks. | ResNet-18, GoogLeNet, AlexNet | 97.51%, 96.39% and 94.08% |
| Sudar et al. (2022) | AD Analysis using Explainable AI. | VGG-16 | 78.12% |
| Colloby et al. (2016) | Differentiating between AD and Dementia with Lewy Bodies (DLB) on 72 MRI and EEG images | SVM+LogisticRegression | R2 = 0.62, Classification = 90% |
| Wang et al. (2018) | Disease prediction with multimodal MRI | CNN | 92.06% |
| Ferri et al. (2021) | rsEEG, sMRI and AD disease prediction using composite features | ANN with stacked hidden layers | 80% (EEG), 85% (MRI), and 89% (both) |
| Cobbinah et al. (2022) | Reducing variations in multi-center AD classification with convolutional adversarial autoencoder. | Convolutional adversarial autocoder CAAE | 91.8% |
| Jia et al. (2024) | Multi-modal global- and local-feature interaction with attention-based mechanism for diagnosis of AD | Multi-Modal Global–Local Fusion method | 86.34% |
| Liu et al. (2023) | 842 subjects from the ADNI dataset on Patch-based deep multi-modal learning framework for AD diagnosis using multi-view neuroimaging | Patch-based deep multi-modal learning (PDMML) | 79.4% |
| Rallabandi & Seetharaman (2023) | Deep learning-based classification of healthy aging controls, mild cognitive impairment and AD using fusion of MRI-PET imaging | CNN | 95.3% |
| Divya & Kumari (2023) | SUVR quantification using attention-based 3D CNN with longitudinal Florbetapir PET images in AD | 3D CNN | RMSD1 = 0.036 and MAE = 0.026 |
| Xiao et al. (2021) | Early diagnosis model of AD based on sparse logistic regression with the generalized elastic net | Sparse logistic regression with the generalized elastic net | 96.10% |
| Bi et al. (2021) | AI-based MRI Images for Brain in Prediction of AD | Deep metric learning (DML) | 82% |
| Odusami et al. (2024) | AD stage recognition from MRI and PET imaging data using Pareto-optimal quantum dynamic optimization | Pareto-optimal quantum dynamic optimization | 94.73% |
| Jain et al. (2019) | CNN based AD classification from MR brain images. | CNN | 90% |
| Xu et al. (2018) | An efficient classifier for AD genes identification. Molecules | SVM | 94% |
| Kang et al. (2021) | Multi-model and multi-slice ensemble learning architecture based on 2d CNN for AD diagnosis, MRI | 2D-CNN, VGG-16 | 90,36% |
| Zhang et al. (2022) | A single model deep learning approach for AD diagnosis. | EfficientNet-B1 | 93.20% |
| Sharma et al. (2022) | Transfer learning-based modified inception model for the diagnosis of AD | Hybrid models (DenseNet201-Gaussian NB, DenseNet201-XG Boost, DenseNet201-SVM) | 91.75% |
| Nagarathna & Kusuma (2022) | Automatic diagnosis of AD using hybrid model and CNN | CNN and VGG-19 | 95.52% |
| Ebrahimi, Luo & Chiong (2021) | Deep sequence modelling for AD detection using MRI | CNN + RNN | 91% |
| Salehi et al. (2023) | Binary Classification of Alzheimer’s Disease Using LSTM | LSTM | 98.62% |
The literature reflects substantial variation in modeling strategies, ranging from classical Gaussian processes (Young et al., 2013), multi-kernel learning frameworks (Hinrichs et al., 2011), and regression-based prediction models (Zhang & Shen, 2012), to a wide range of modern CNN architectures (Shamrat et al., 2023; Fuadah et al., 2020; Shanmugam et al., 2022; Sudar et al., 2022; Wang et al., 2018; Cobbinah et al., 2022; Rallabandi & Seetharaman, 2023; Xiao et al., 2021; Bi et al., 2021; Odusami et al., 2024; Jain et al., 2019; Zhang et al., 2022; Sharma et al., 2022; Nagarathna & Kusuma, 2022). Many of these studies report notable classification accuracies, with several exceeding 95% under specific modeling configurations (Deepa & Chokkalingam, 2022; Fuadah et al., 2020; Shanmugam et al., 2022; Rallabandi & Seetharaman, 2023; Odusami et al., 2024; Salehi et al., 2023). Hybrid and multimodal systems also constitute an expanding area of research. For example, Rallabandi & Seetharaman (2023) integrated MRI–PET fusion features into a CNN structure to achieve high diagnostic precision, while Cobbinah et al. (2022) employed convolutional adversarial autoencoders to mitigate site- and scanner-related variations in multi-center datasets. Similarly, multimodal learning frameworks combining MRI, PET, electroencephalography (EEG), or clinical scores have demonstrated synergistic improvements in classification accuracy and robustness (Colloby et al., 2016; Wang et al., 2018; Ferri et al., 2021; Jia et al., 2024; Divya & Kumari, 2023).
Recent research has also focused on architectures that combine spatial and temporal feature extraction. Wu et al. (2025) proposed a hybrid CNN–LSTM model that processes sagittal, coronal, and axial MRI planes simultaneously, yielding a classification accuracy of 96%. Rajeswari & Swathi (2025) introduced an attention-enhanced CNN–LSTM network incorporating CS-Attention blocks and aggregate weighted pooling to capture fine-grained spatial dependencies, achieving 91.51% accuracy in early AD detection. Other studies, such as Zhao et al. (2023), have highlighted the benefits of 3D convolutional architectures in volumetric MRI analysis, reporting improved sensitivity in distinguishing mild cognitive impairment (MCI), a prodromal stage of AD.
Systematic examinations of DL performance in AD diagnosis further reinforce the superiority of DL over traditional ML techniques. Warren & Moustafa (2022) reviewed 22 studies integrating DL with functional MRI (fMRI) and found that DL approaches generally outperformed classical ML methods, with many achieving accuracies around 85%. Complementary findings by Kaur et al. (2024) emphasized the diagnostic potential of CNNs and recurrent neural networks (RNNs) due to their capacity to model complex spatial and temporal patterns associated with cognitive decline.
Collectively, existing studies demonstrate that sophisticated neural network architectures, multimodal learning strategies, and hybrid models substantially enhance AD diagnostic performance. At the same time, methodological rigor—particularly the use of replication strategies, balanced datasets, and controlled experimental protocols—remains essential for achieving generalizable and interpretable models. The present study aligns with this direction by integrating an EfficientNetV2-B0 architecture with a cross-replication strategy (Wong, Paritosh & Aroya, 2021), complemented by tailored data balancing and augmentation procedures. Through this design, the study aims to improve model stability, enhance generalization, and contribute to the development of reliable and reproducible AD prediction frameworks.
Materials and methods
The dataset uses the terms Dementia/No Dementia. These are the equivalent of dementia and no dementia throughout this article. This section provides a comprehensive overview of the dataset, preprocessing steps, model architecture, training procedures, evaluation metrics, and replication strategy implemented in the study. All methodological components were structured to ensure transparency, reproducibility, and consistency with established machine learning and neuroimaging practices.
The model was run on a computer equipped with an Intel(R) Core(TM) i7-7700 CPU @ 3.60 GHz processor, 32 GB of RAM, and an NVidia GeForce GT-730 graphics card. The operating system used was Windows 11. The code was developed and executed in the Spyder 6.0.3 environment, utilizing Python version 3.12.8.
Dataset
The dataset used in this study was obtained from Sachin & Sourabh (2022) (Kaggle link: https://www.kaggle.com/datasets/lukechugh/best-alzheimer-mri-dataset-99-accuracy). The raw dataset comprised 6,400 MRI images grouped into four classes with an imbalanced and partially inconsistent labeling structure. Table 2 summarizes the class distribution and labeling format. In this initial state, several learning algorithms exhibited reduced performance, increased variance, and indications of overfitting, motivating the need for systematic re-labeling.
| Directory | Files | New label |
|---|---|---|
| No_Dementia | 3,200 | 26(19), 28(17)… |
| Very_Mild_Dementia | 2,240 | 26(5), 32(51)… |
| Mild_Dementia | 896 | 26(20), 31(28)… |
| Moderate_Dementia | 64 | 16(2), 27(2), |
| Total | 6,400 |
To improve label reliability and clinical coherence, a two-stage unsupervised re-labeling procedure was applied. First, deep feature representations were extracted from each MRI using a frozen EfficientNetV2-B0 backbone pretrained on ImageNet. These high-dimensional embeddings were subsequently clustered using the K-Means algorithm with k = 5, selected on the basis of silhouette coefficient analysis and cluster stability assessments, consistent with established cluster validation methodology (Rousseeuw, 1987).
To prevent information leakage, the K-Means model was fitted exclusively on the training subset, and the resulting centroids were used to assign cluster labels to the validation and test sets without refitting. Cluster-to-label mapping was performed using predefined rules based on metadata patterns and intensity-based imaging characteristics; this mapping was conducted independently from the classification model to minimize any risk of circular validation.
The new class structure obtained after re-labeling is presented in Table 3. Notably, the process identified a subset of images that did not correspond well to their original labels (e.g., samples labeled as Mild or Moderate but exhibiting distinct structural patterns). These were reassigned to a newly defined class labelled Dementia. This data-driven approach resulted in a more balanced and clinically interpretable label distribution. Following re-labeling, the dataset was partitioned into training (4,608 images), testing (1,280 images), and validation (512 images) sets. All samples were numerically re-indexed to ensure traceability.
| Directory | Files | New label |
|---|---|---|
| No_Dementia | 1,426 | No_Dementia0001… |
| Very_Mild_Dementia | 1,321 | Very_Mild_Dementia0001… |
| Mild_Dementia | 1,358 | Mild_Dementia0001… |
| Moderate_Dementia | 949 | Moderate_Dementia0001 |
| Dementia | 1,346 | Dementia0001… |
| Total | 6,400 |
Following the re-labeling process—illustrated in the initial stage of Fig. 2—the dataset was automatically partitioned into three subsets for model training: train, test, and validation. All re-labeled samples were sequentially indexed starting from 0001, corresponding to the total number of files. The final distribution of MRI images was as follows: 4,608 files were assigned to the train directory, 1,280 to the test directory, and 512 to the validation directory, thereby completing the data preparation phase.
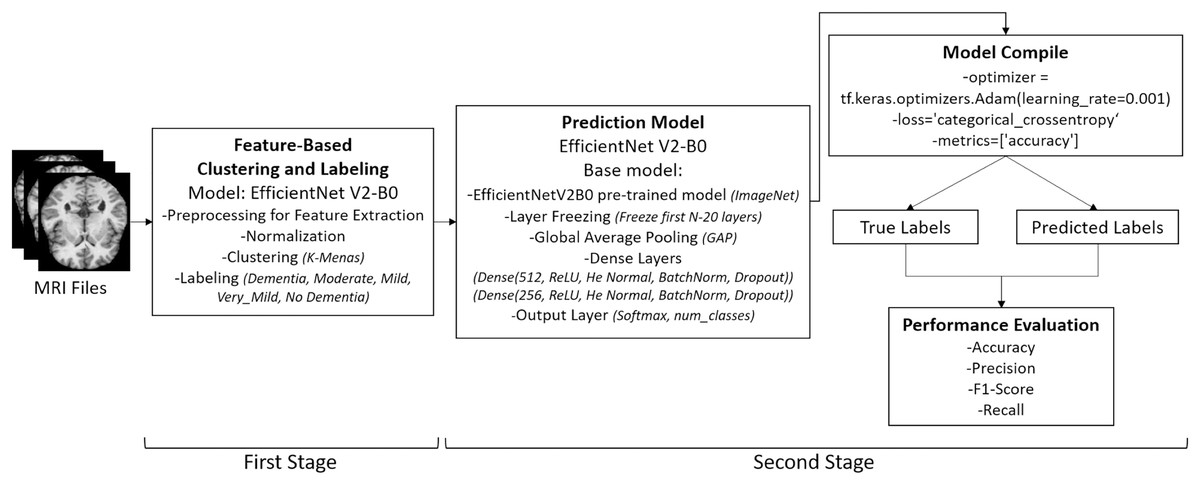
Figure 2: Overview of the two-stage pipeline used in the study.
Stage 1: Unsupervised re-labeling and formation of five clinically meaningful classes. Stage 2: Classification of the re-labeled dataset using the EfficientNetV2-B0 model. Images: Kaggle: https://www.kaggle.com/datasets/lukechugh/best-alzheimer-mri-dataset-99-accuracy.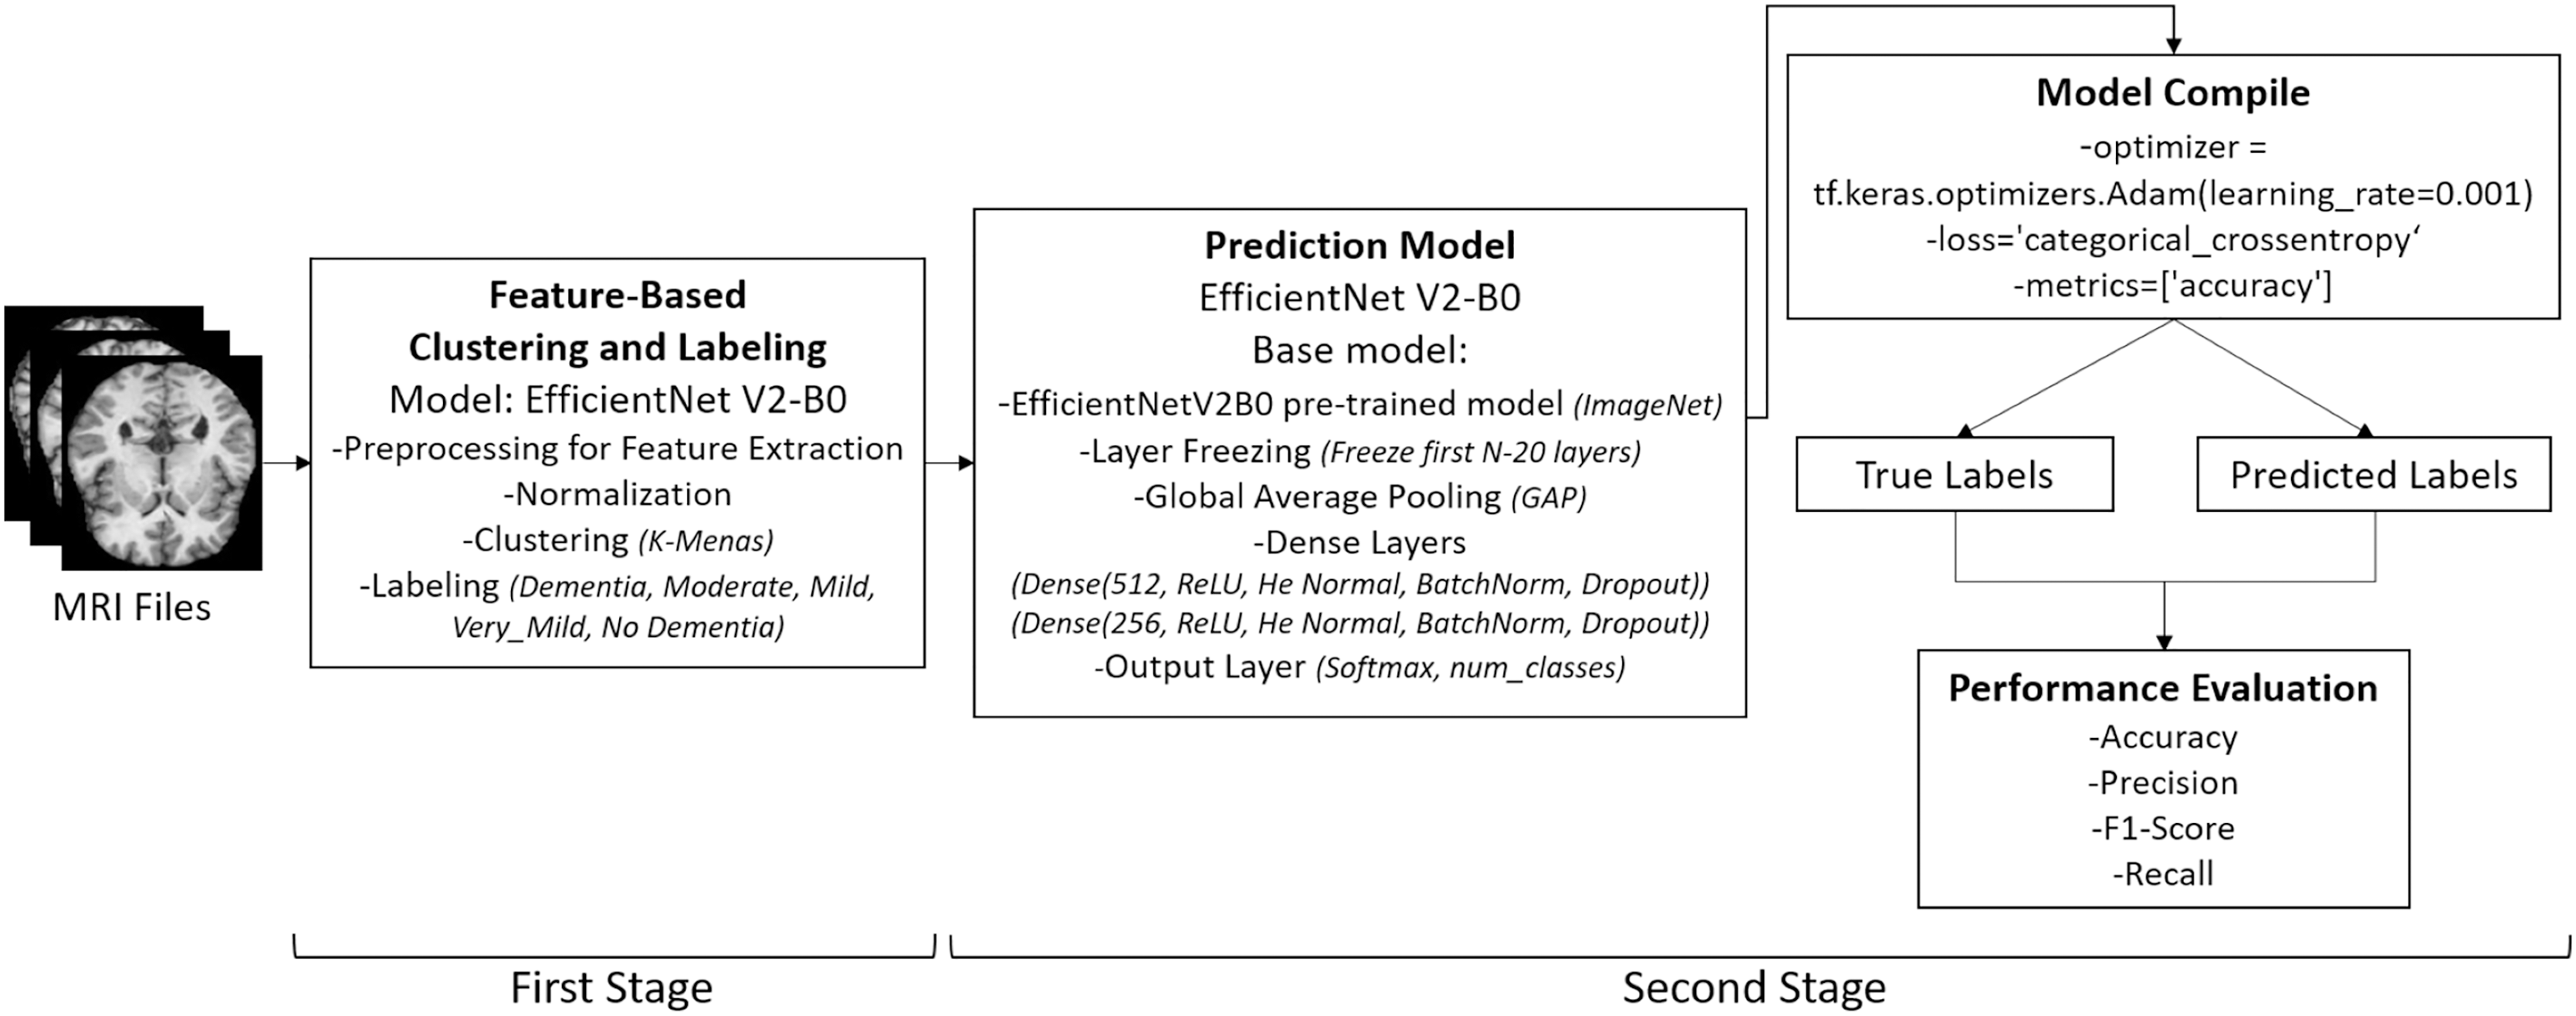
Data pre-processing
Data pre-processing was conducted to standardize the MRI images, reduce noise, and enhance the robustness of the model. The overall pre-processing pipeline is illustrated in Fig. 2, which shows the two-stage structure of the application: (i) unsupervised re-labeling and class formation, and (ii) classification using the EfficientNetV2-B0 model.
The raw axial MRI slices were originally in grayscale JPEG format with a resolution of 176 × 208 pixels. All images were converted to RGB and resized to 224 × 224 × 3 pixels to comply with the input requirements of the classification model. Normalization to the [0,1] intensity range was then applied.
To preserve important neuroanatomical structures while mitigating noise, anisotropic diffusion filtering was employed. This technique selectively smooths homogeneous regions while maintaining sharp edge boundaries, making it particularly beneficial for high-detail medical images. Additionally, Gaussian smoothing was used to remove high-frequency noise components. The major filtering steps and their sequential application are illustrated in Fig. 3.
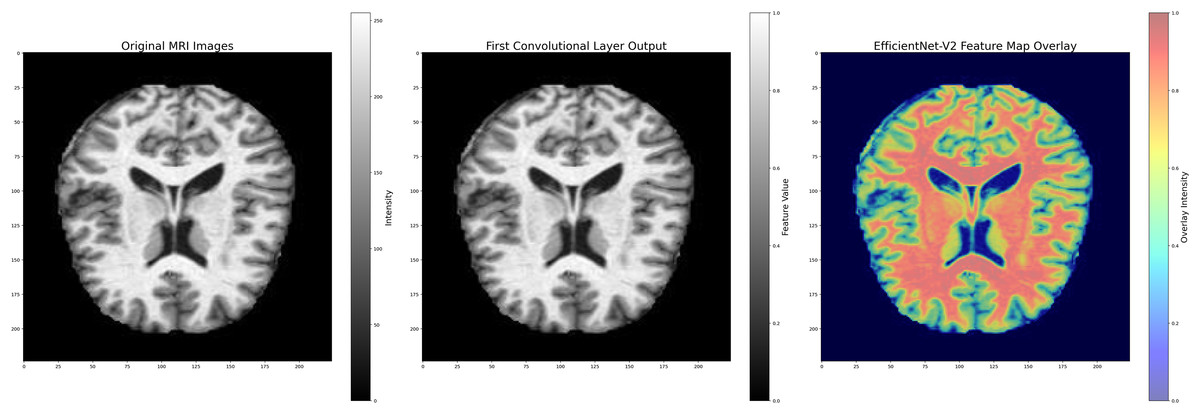
Figure 3: Image pre-processing steps applied in model layers.
Images: Kaggle: https://www.kaggle.com/datasets/lukechugh/best-alzheimer-mri-dataset-99-accuracy.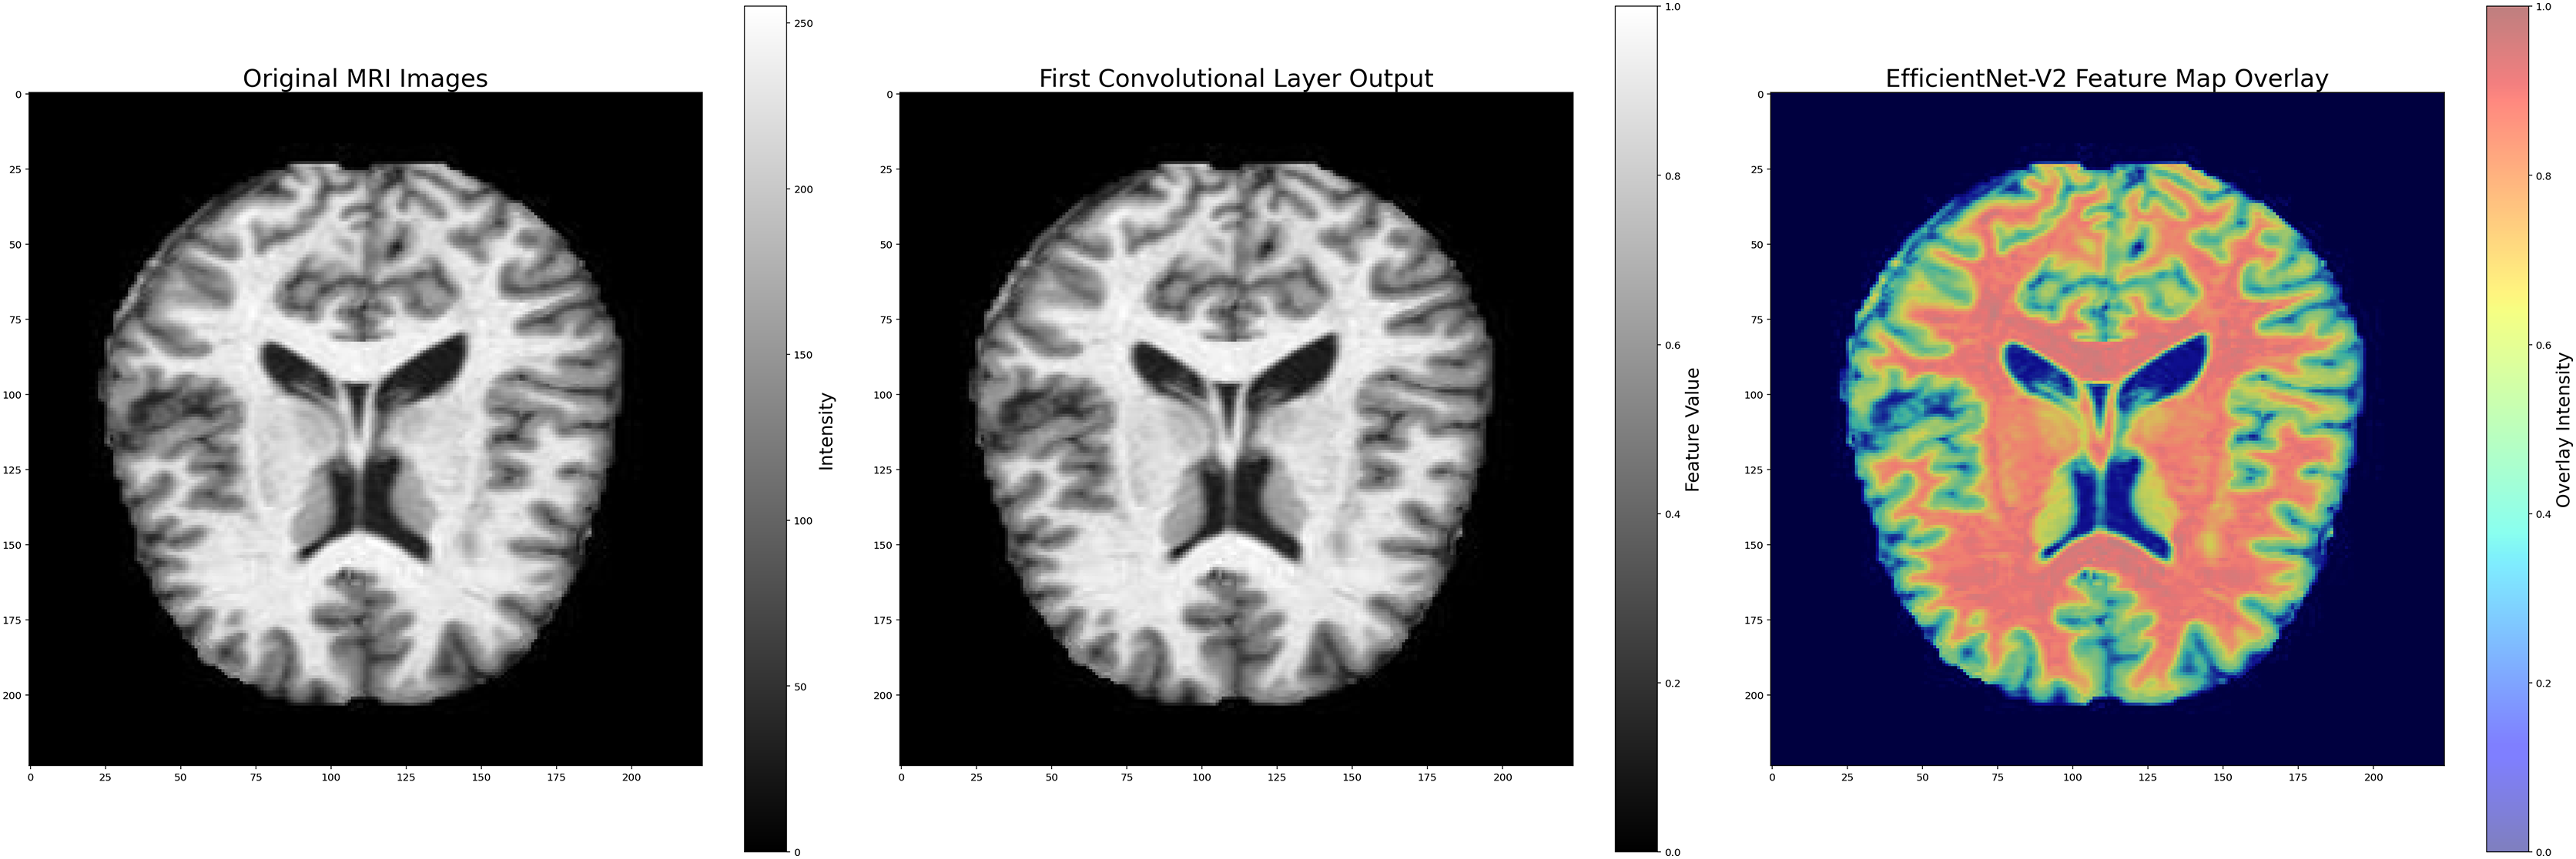
Following noise reduction, the dataset underwent an extensive data augmentation process to improve generalization and reduce overfitting. Augmentation was performed exclusively on the training set using the ImageDataGenerator class and included random rotations, width and height shifting, zooming, horizontal flipping, brightness modifications, and pixel filling. The implementation code and augmentation parameters used in this procedure are shown in Fig. 4.
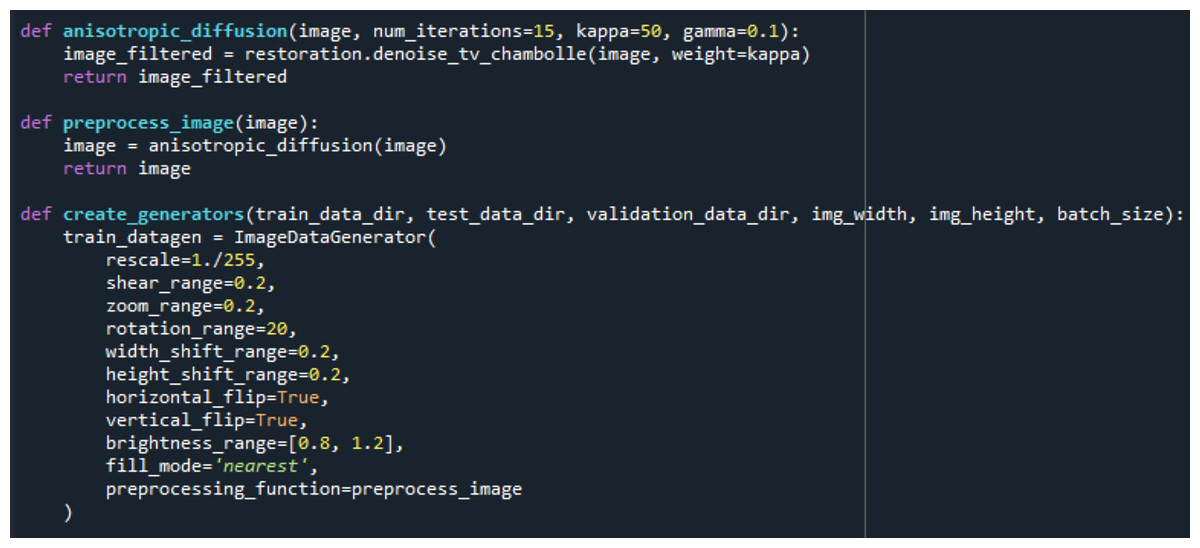
Figure 4: Data filtering and augmentation process code.
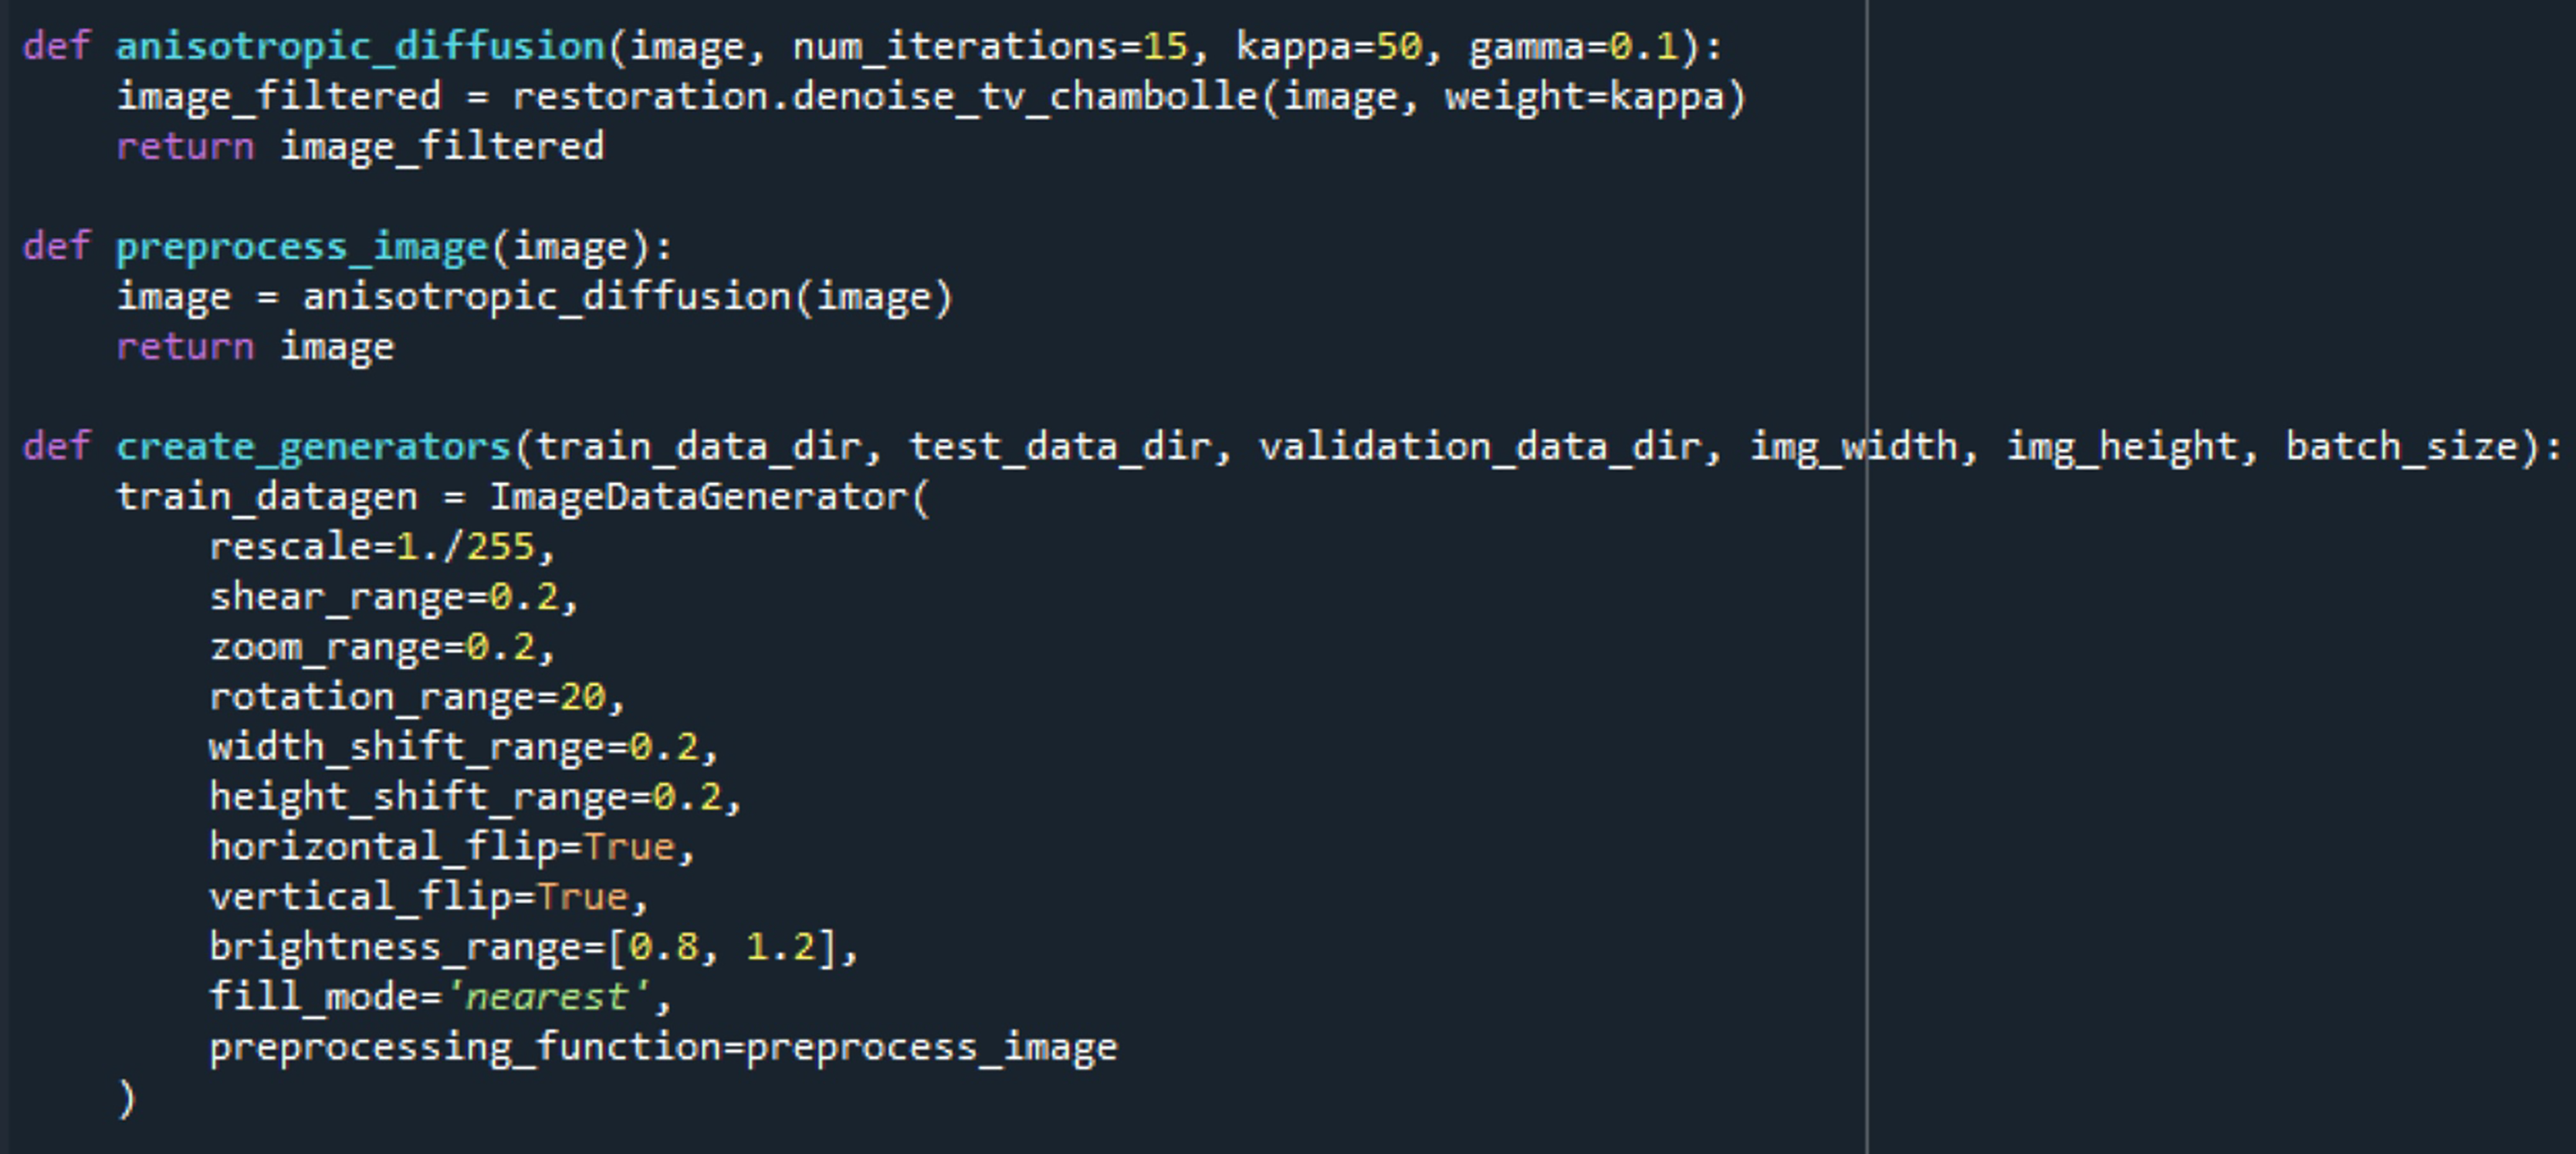
The combined filtering and augmentation procedures ensured that anatomically relevant features were preserved while generating meaningful variations of the input data. An example of an MRI image before and after the pre-processing operations is presented in Fig. 5, where significant improvements in structural clarity and standardization can be observed.
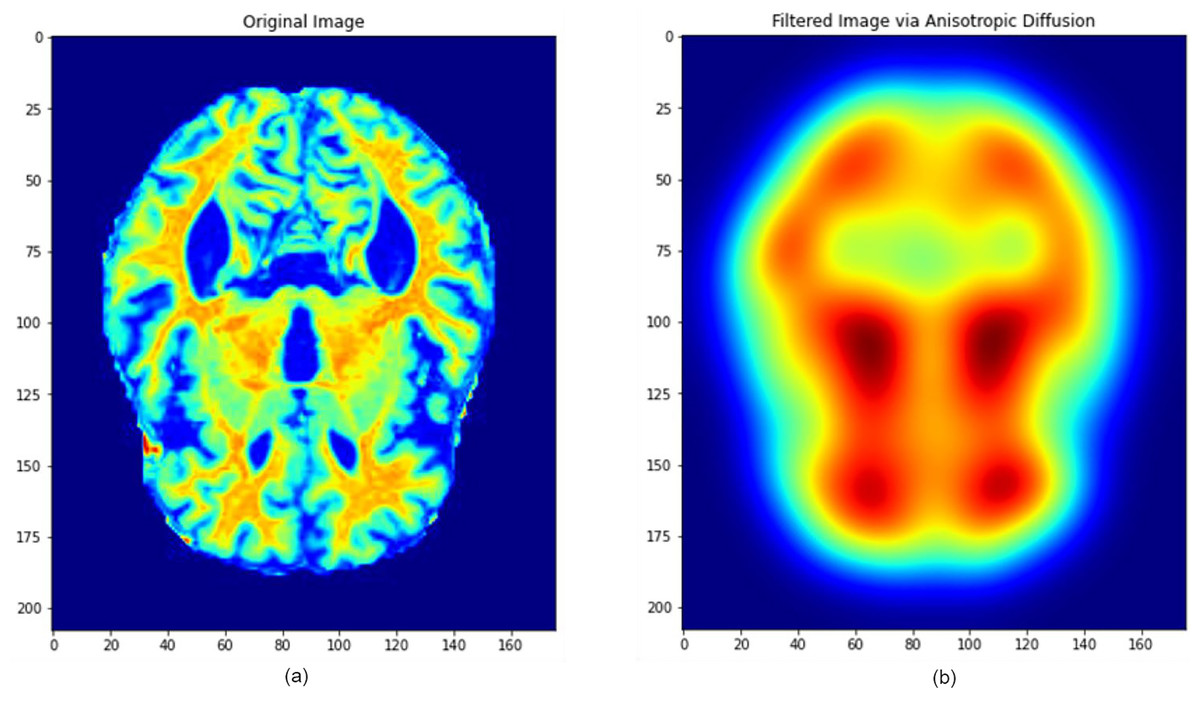
Figure 5: Image processing during data filtering and augmentation.
(A) The original MRI image, (B) the image after pre-processing. This process ensures that all images are uni-formly processed by the model, maintaining consistent properties across the dataset. Images: Kaggle: https://www.kaggle.com/datasets/lukechugh/best-alzheimer-mri-dataset-99-accuracy.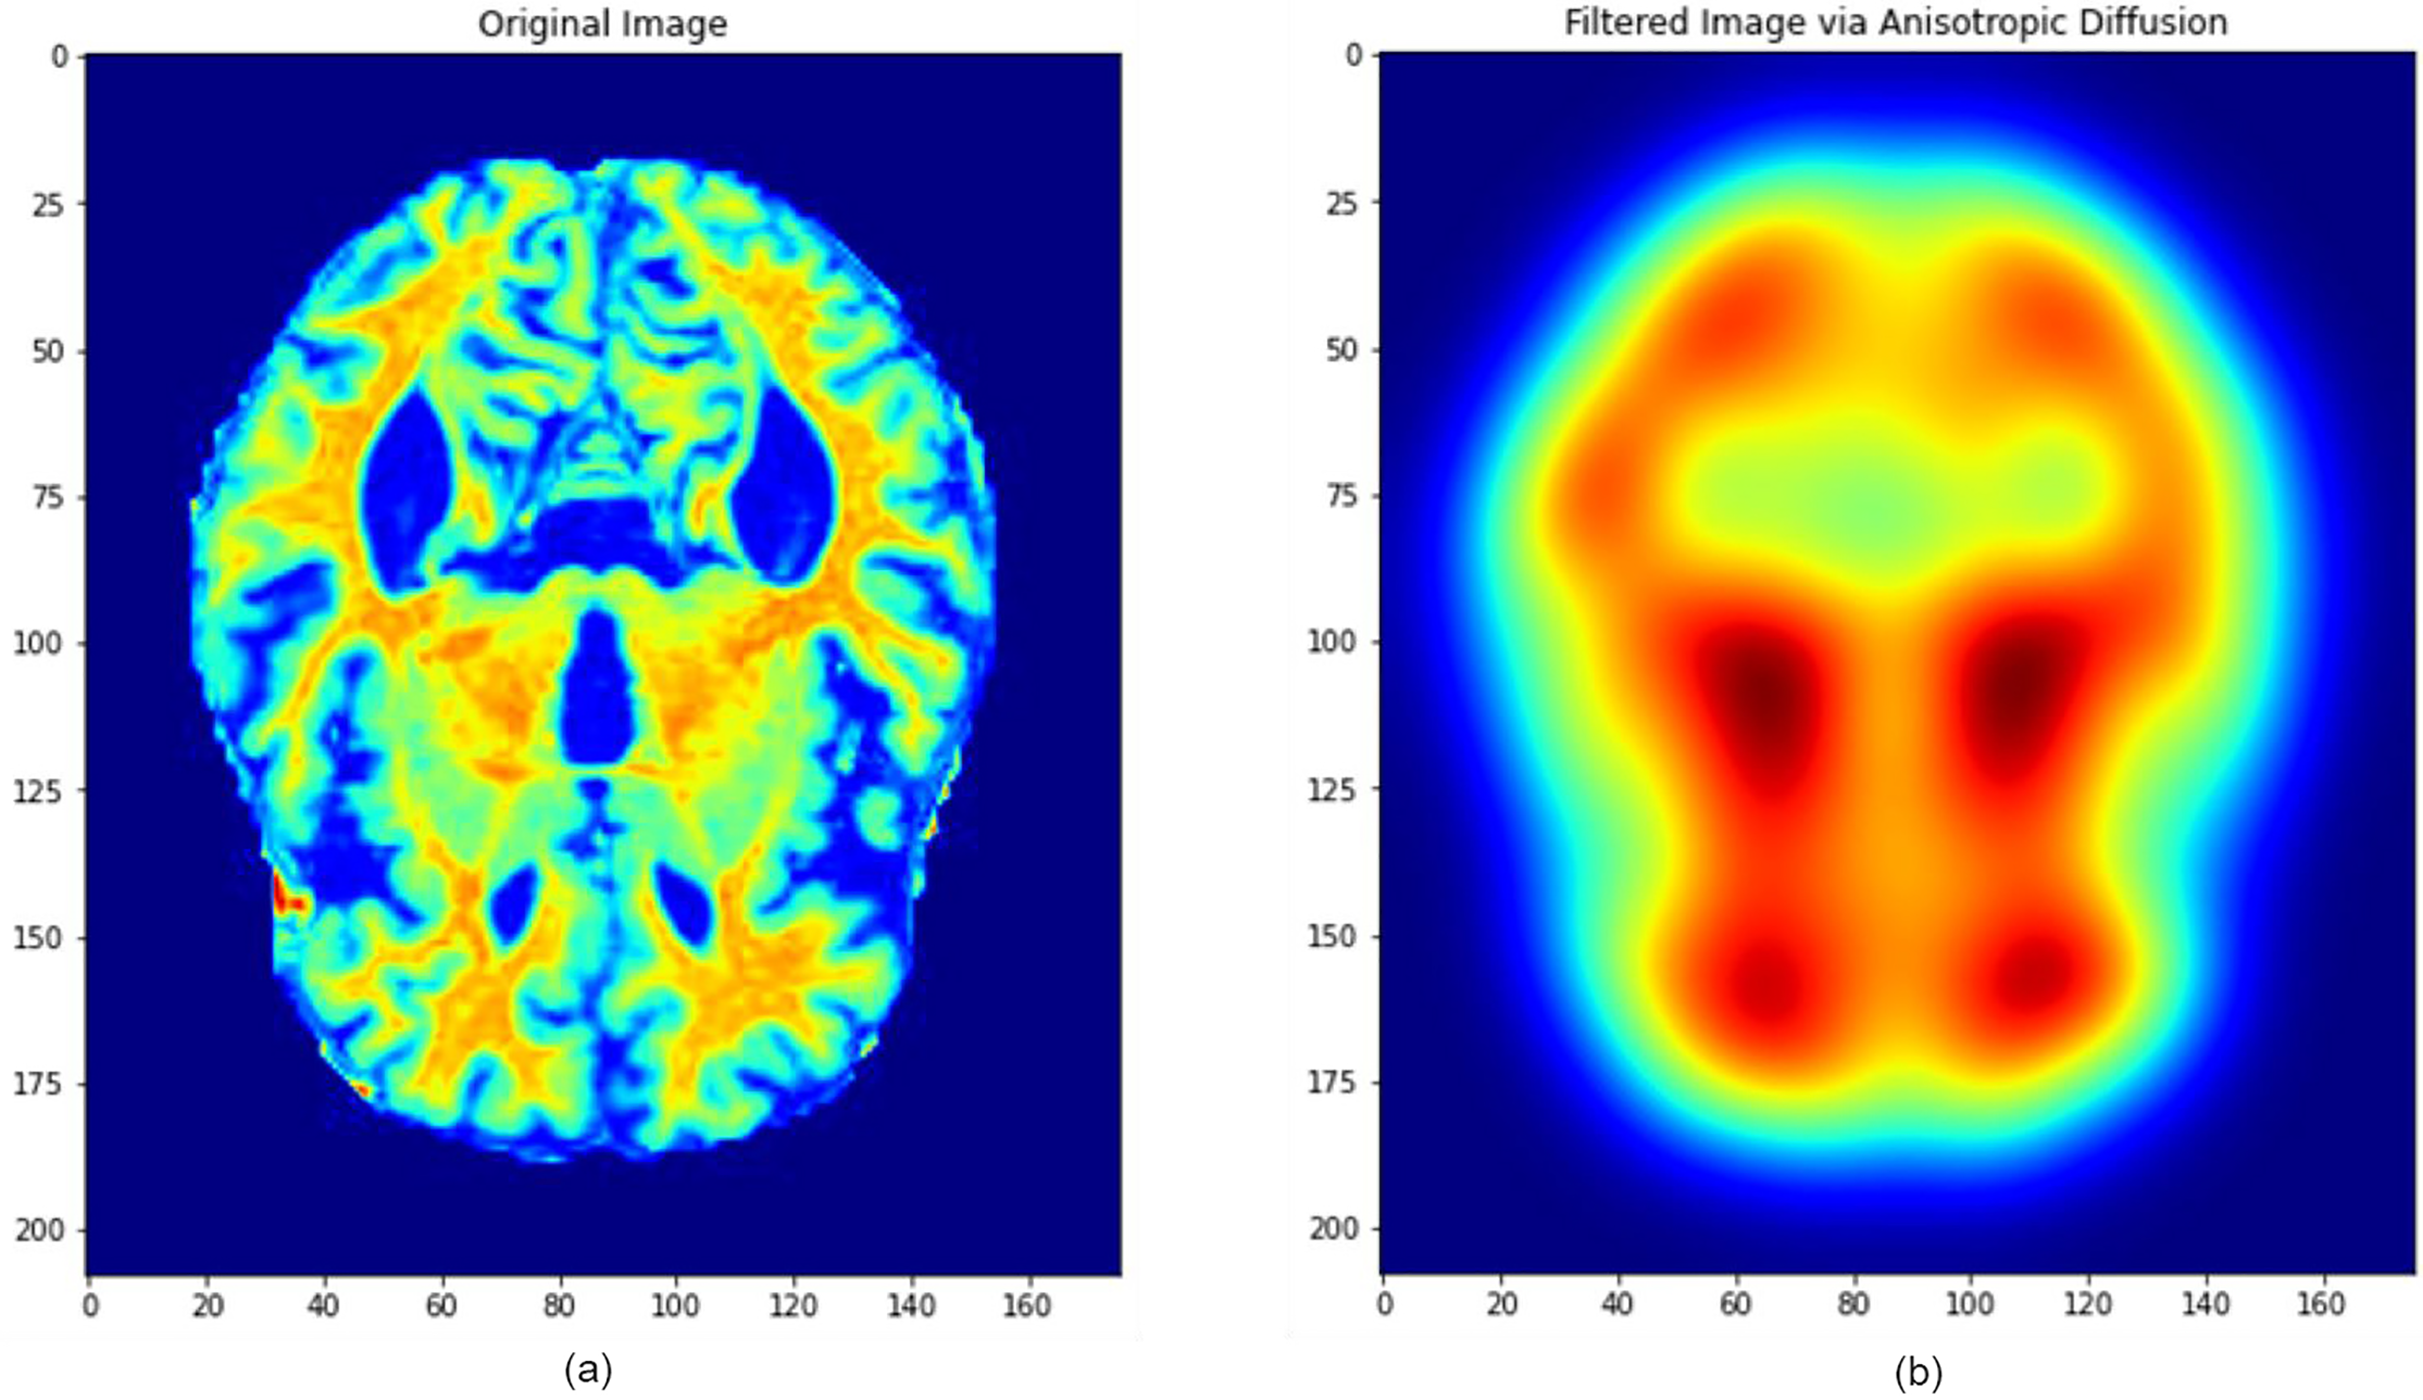
To address class imbalance and further strengthen robustness, each class in the training set was expanded approximately fivefold through the augmentation procedures. In total, nearly 5,000 augmented images per class were created, while validation and test images were only rescaled to maintain unbiased evaluation.
Model selection and architecture
EfficientNetV2-B0 was selected as the primary architecture in this study due to its proven efficiency and strong performance in image classification tasks. Although no manual region-of-interest (ROI) segmentation was applied, the model’s convolutional hierarchy is inherently capable of extracting discriminative features from brain regions commonly associated with AD, including the hippocampus, entorhinal cortex, and medial temporal lobes. This enables the network to capture subtle structural alterations and atrophy patterns characteristic of disease progression.
EfficientNet represents a family of deep learning architectures developed to achieve optimal accuracy–efficiency trade-offs. The design is based on compound scaling, a principled approach that jointly scales the network’s width, depth, and input resolution in a balanced manner. These dimensions are governed by the scaling factors described in Eq. (1):
(1) where, d, w, and r denote the depth, width, and resolution multipliers, respectively. The coefficients α, β, and γ are determined via grid search, and φ controls the resource budget allocated for scaling. The operator ☉ represents the composition of convolutional transformations. This formulation allows EfficientNet to achieve higher performance while remaining computationally lightweight.
EfficientNetV2 further improves this design by introducing:
-
(1)
Progressive Resizing, where training begins with lower-resolution inputs and gradually increases to higher resolutions to accelerate early training while preserving final accuracy, and
-
(2)
Improved regularization and training strategies, reducing computational cost while enhancing generalization (Tan & Le, 2019, 2021).
A defining component of the architecture is the Mobile Inverted Bottleneck Convolution (MBConv) block, which combines depthwise separable convolutions with an inverted bottleneck mechanism to reduce parameter count. Squeeze-and-Excitation (SE) modules are integrated within these blocks to adaptively recalibrate channel-wise activations by emphasizing informative feature channels.
Standard convolutional layers perform spatial feature extraction, max-pooling reduces spatial dimensionality, and fully connected layers implement the final classification. A GlobalAveragePooling2D layer is employed to aggregate spatial feature maps prior to classification, and Dropout regularization is used to mitigate overfitting.
During forward propagation, the transformation of an input vector X into an output vector Y across neural network layers follows Eq. (2):
(2) where W and b denote the learnable weights and biases, respectively, and f denotes the activation function. Non-linearity is introduced via the ReLU activation in hidden layers, defined as Eq. (3).
(3)
The Sigmoid activation, occasionally used for gate mechanisms, is described in Eq. (4):
(4)
For the multi-class classification task, the output layer uses the Softmax to compute class probabilities. The mathematical representation of the overall classification function can be expressed as Eq. (5):
(5) where x denotes the input image tensor, g(x) represents the learned feature maps generated by convolutional operations. W is the weight matrix, and b is the bias vector. The output f(x) yields class probabilities for Alzheimer’s stages.
Model training minimizes the Categorical Cross-Entropy loss between the predicted output Ŷ and the true label Y. Parameter optimization is carried out using the Adaptive Moment Estimation (Adam) algorithm, which computes adaptive learning rates for each parameter using first- and second-order moment estimates. The update rule is given in Eq. (6):
(6)
This loss is minimized during training using the Adam optimizer, which adaptively adjusts learning rates for each parameter based on the first and second moment estimates of the gradients. The parameter update rule is given by Eq. (7):
(7) where and denote the bias-corrected first and second moment estimates, α is the learning rate, and ensures numerical stability. The moment estimates evolve according to Eq. (8):
(8) where g denotes the gradient, β1 and β2 are decay rates, α is the learning rate, and ensures numerical stability. In Eq. (7), Memory(N) is the memory cost of the model architecture, and target_memory is the predefined maximum memory capacity.
Model training
Model training was conducted under a standardized experimental protocol to ensure methodological rigor, reproducibility, and fair comparison across architectures. During each training cycle, performance was evaluated through a combination of discrete classification metrics and probabilistic evaluation measures. To quantify classification accuracy, the standard metrics of accuracy, precision, recall, and F1-score were computed. Their mathematical definitions are provided in Eq. (9).
(9) where TP, FP, TN, and FN represent true positives, false positives, true negatives, and false negatives, respectively. These metrics collectively provide a detailed characterization of the model’s classification behavior across all decision thresholds.
In addition to discrete metrics, probabilistic performance was assessed using the Receiver Operating Characteristic (ROC) and Precision–Recall (PR) curves. The Area Under the ROC Curve (ROC–AUC) and Area Under the PR Curve (PR–AUC) were computed for each class, along with their micro- and macro-averaged variants. To examine calibration quality, the multiclass Brier score was calculated, and reliability diagrams were constructed to evaluate the alignment between predicted probabilities and empirical outcome frequencies. This multidimensional evaluation framework enabled a comprehensive assessment of both discriminatory power and probabilistic reliability.
To quantify statistical uncertainty, 95% confidence intervals for ROC–AUC and PR–AUC were obtained through bootstrap resampling (1,000 iterations) on the test set. These confidence intervals provide an estimate of the variability inherent in performance metrics and ensure transparent reporting of statistical precision.
To enhance robustness and evaluate sensitivity to stochastic initialization, the study employed a Cross-Replication Strategy, distinct from conventional k-fold cross-validation. Unlike k-fold methods that vary data partitions, cross-replication preserves a fixed train–validation–test split while varying the random initialization seed across independent training runs. This design isolates the contribution of initialization variability to performance fluctuations and has been demonstrated to be critical for evaluating the stability of deep learning models.
A total of five independent replications (n = 5) were performed. For each replication, the model was trained from scratch using identical data partitions, hyperparameters, and augmentation settings. The best-performing checkpoint—determined by validation ROC–AUC—was saved via the ModelCheckpoint callback. The final reported performance measures were computed as the average across all replications according to Eq. (10):
(10) where Mk denotes the metric obtained in the kth replication. This averaging procedure reduces sensitivity to outlier runs and yields a stable, statistically reliable estimate of generalization performance. To ensure fairness in comparative evaluation, EfficientNetV2-B0 and VGG16 were trained and tested under the same replication protocol, utilizing identical:
train/validation/test splits,
optimization settings (Adam),
learning rate schedules (ReduceLROnPlateau),
batch size,
early stopping criteria, and
evaluation metrics.
This harmonized framework ensures that differences in performance reflect architectural capability rather than discrepancies in experimental conditions. The resulting mean values of accuracy, precision, recall, F1-score, ROC–AUC, and PR–AUC across the five replications provide an unbiased and methodologically sound comparison between the two architectures.
Results
All coding, model training, and evaluation procedures were implemented in Python using standardized deep learning libraries. Table 4 summarizes the primary performance metrics obtained during the training phase for both the single-run (self-training) strategy and the Cross-Replication Strategy. The table reports training and validation accuracies alongside their corresponding loss values.
| Metrics/strategy | Self | Cross-replication |
|---|---|---|
| Train accuracy | 0.942117781981202 | 0.948482850740087 |
| Validation accuracy | 0.918660446408159 | 0.938526438611691 |
| Train_Loss | 0.340453706061420 | 0.338244580762242 |
| Validation_Loss | 0.379438283676354 | 0.372981761591189 |
The results in Table 4 indicate that the cross-replicated model achieved higher mean training and validation accuracy than the single-run baseline. Specifically, the training accuracy increased from 0.9421 to 0.9485, while validation accuracy improved from 0.9187 to 0.9385 across the five replications. Similarly, both training and validation loss values decreased slightly under the cross-replicated setup.
These findings suggest that performing multiple replications with distinct random initializations leads to greater stability and improved generalization performance. The improvements, although modest, demonstrate that the Cross-Replication Strategy mitigates the sensitivity of deep learning models to stochastic initialization and provides a more reliable estimate of expected performance compared to a single-run evaluation.
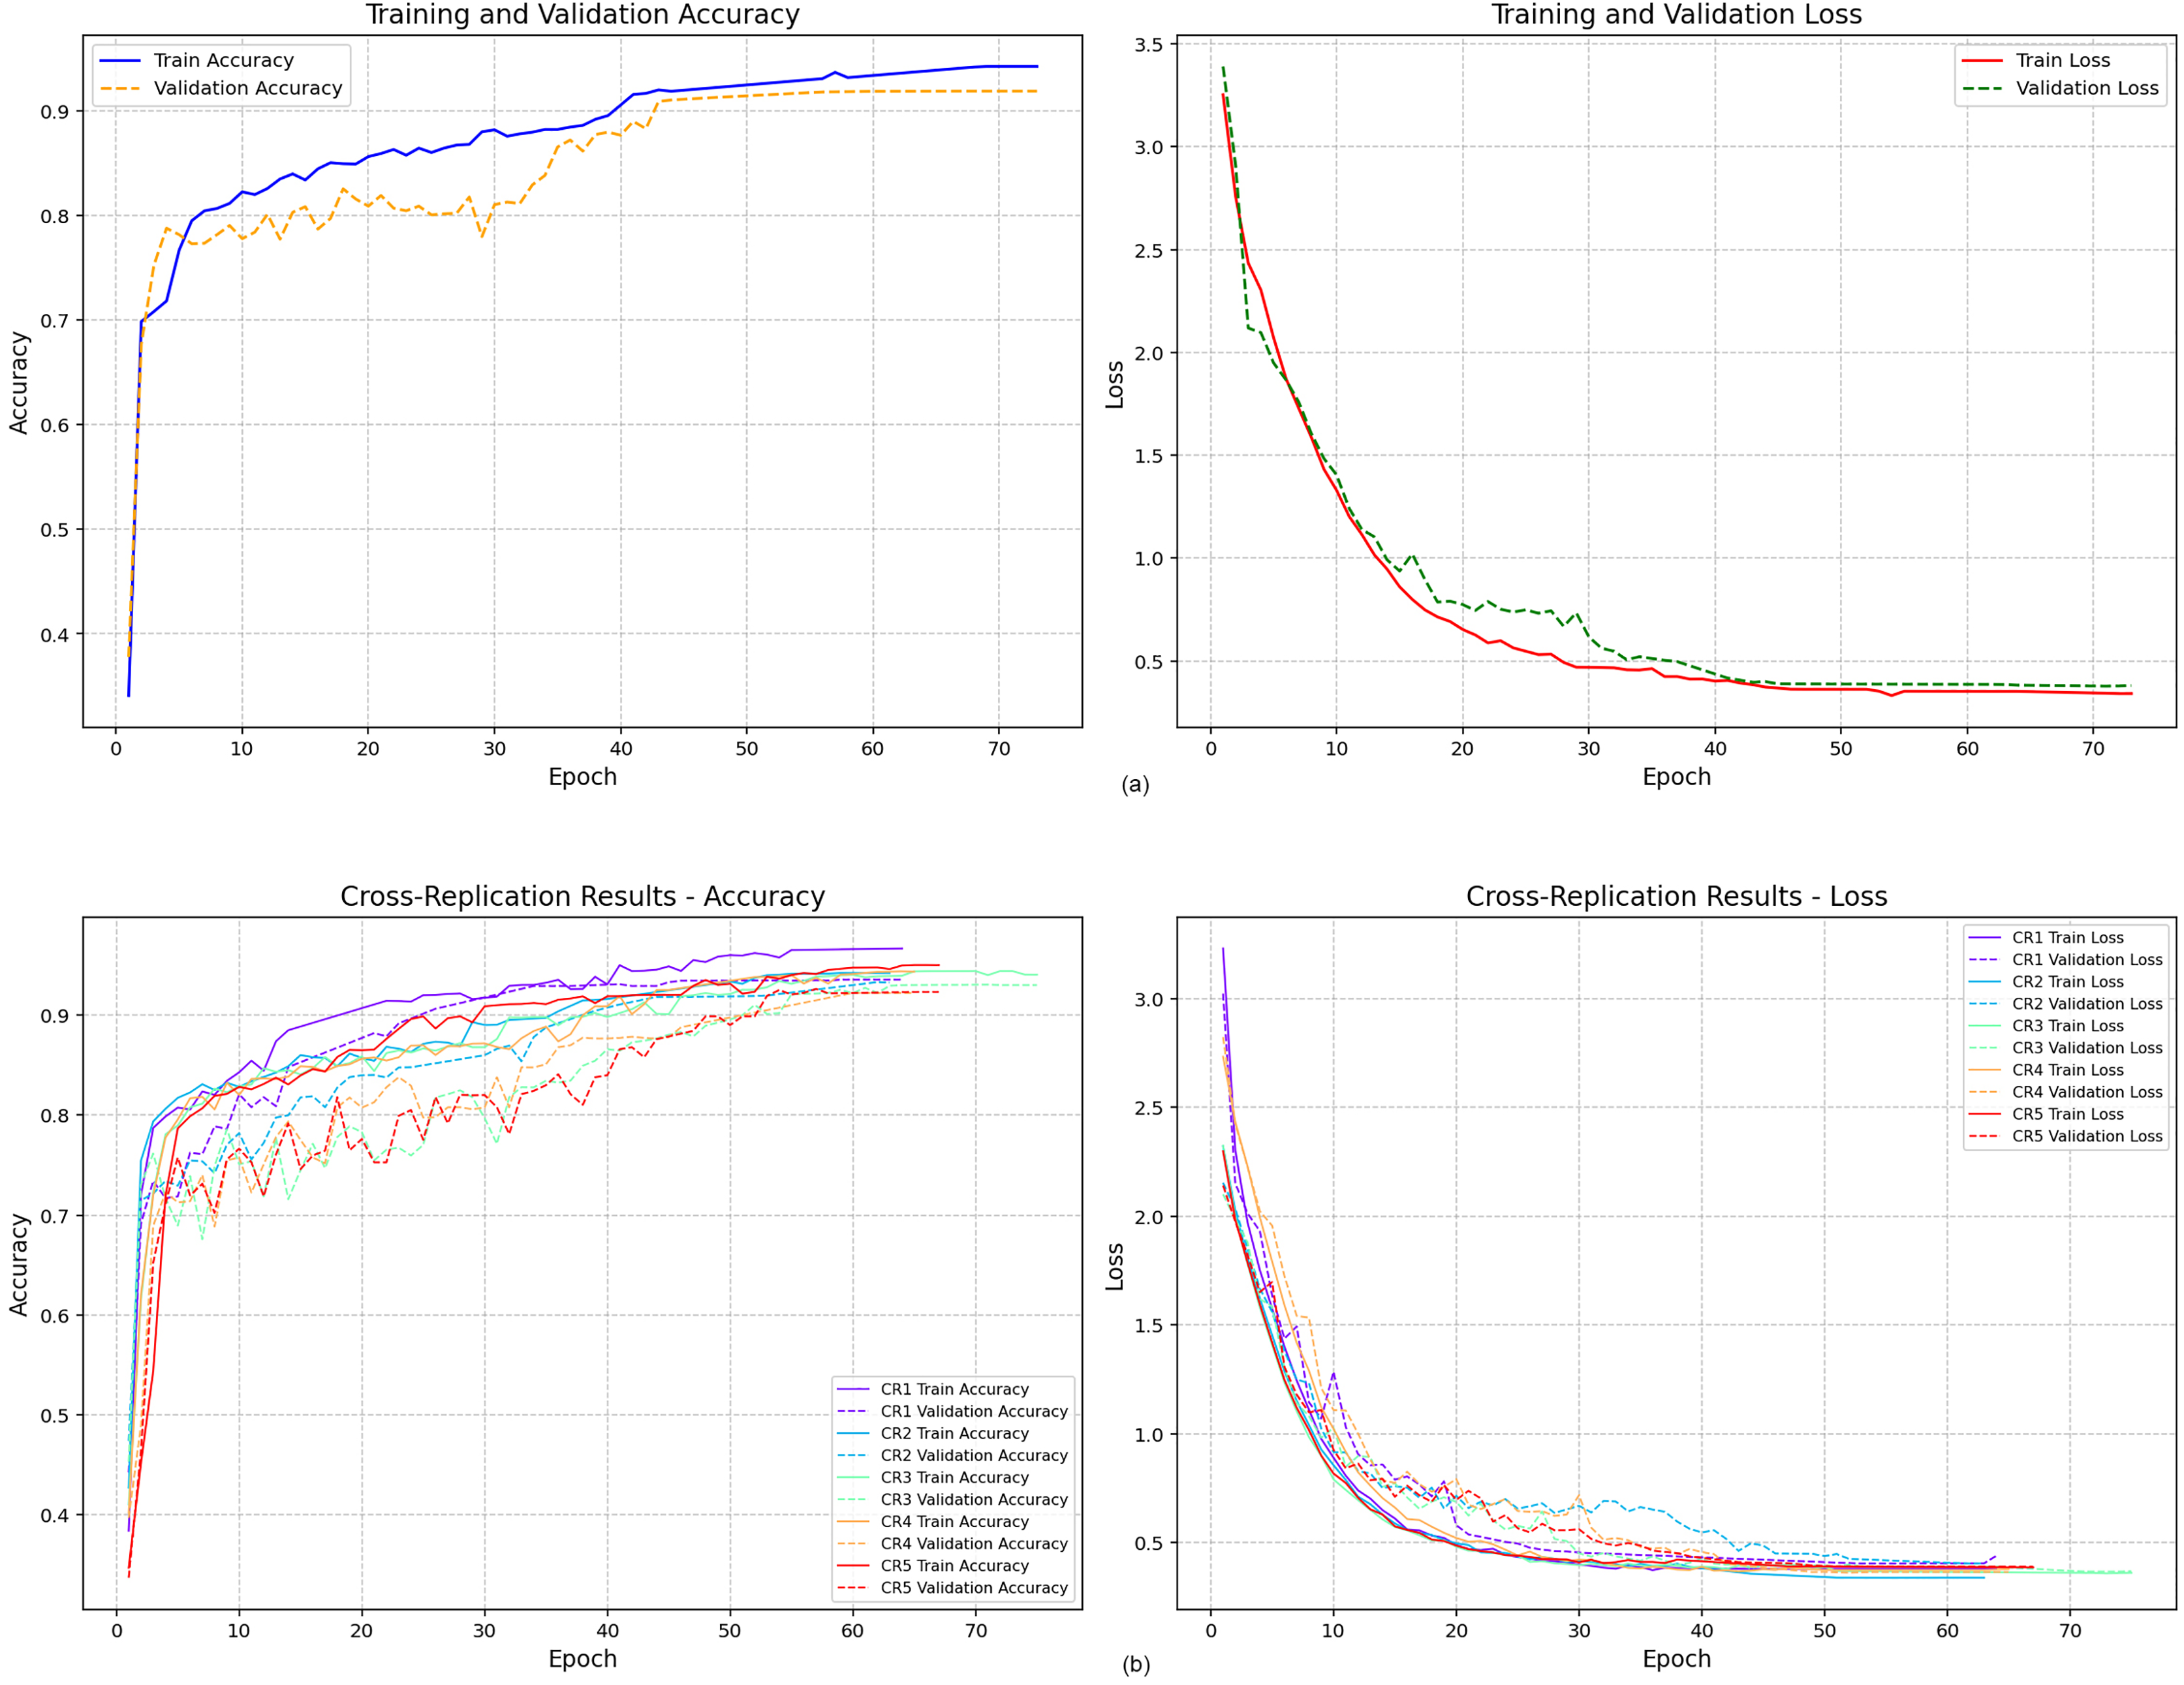
Figure 6 presents the training and validation accuracy curves obtained from the two modeling strategies. Figure 6A displays the accuracy trajectory of the single-run model. Although the maximum number of epochs was set to 100, the model converged after the 73rd epoch due to early stopping, indicating stabilization of both training and validation performance.
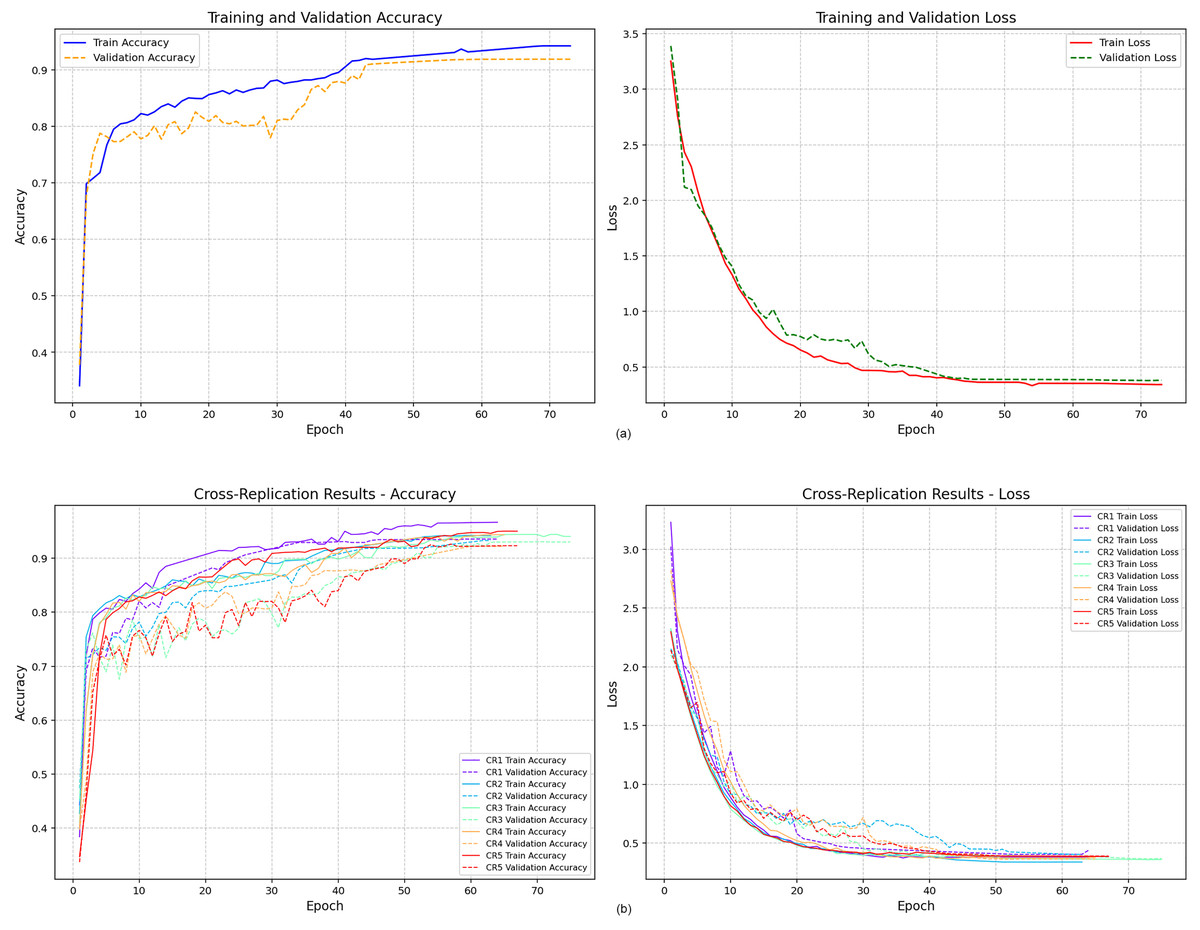
Figure 6: Training and validation accuracy values.
In contrast, Fig. 6B illustrates the accuracy curves obtained from the five independent replications conducted under the Cross-Replication Strategy. Each replication is shown in a distinct color. Across all five runs, the model demonstrated consistent convergence, stabilizing earlier—approximately after the 60th epoch. The tighter clustering of the curves suggests lower variability and improved training stability compared to the single-run scenario.
To evaluate generalization to unseen samples, classification metrics were computed on the test dataset. Table 5 reports the precision, recall, and F1-score for each class under both strategies. For the Cross-Replication Strategy, all values represent the mean of five independent runs, ensuring a reliable and variance-reduced assessment.
| Metrics/strategy | Self | Cross-replication (average) | ||||||||
|---|---|---|---|---|---|---|---|---|---|---|
| Dementia | Moderate | Mild | VeryMild | NonDem | Dementia | Moderate | Mild | VeryMild | NonDem | |
| Precision | 0.94606 | 0.82741 | 0.88462 | 0.88603 | 0.94755 | 0.93216 | 0.85800 | 0.90399 | 0.89722 | 0.94044 |
| Recall | 0.85714 | 0.91477 | 0.92336 | 0.90262 | 0.91246 | 0.88918 | 0.92049 | 0.92363 | 0.90337 | 0.91380 |
| F1-score | 0.90837 | 0.88740 | 0.90357 | 0.89425 | 0.92967 | 0.91012 | 0.88805 | 0.91368 | 0.90022 | 0.92690 |
The results in Table 5 reveal that the Cross-Replication Strategy provides consistently higher performance across almost all classes. Precision and recall values improved in several key categories, most notably in the Moderate and Mild dementia classes—two groups where classification is typically more challenging due to greater intra-class variability and overlapping pathological features.
The increase in F1-scores across these categories indicates that repeated training with distinct initialization seeds enhances the model’s ability to balance precision and recall. This suggests that cross-replication reduces sensitivity to random fluctuations, yielding more stable class-level predictions. The overall improvements in the Dementia, Moderate, and Mild classes imply that cross-replication is particularly effective in mitigating variance and improving discrimination between clinically adjacent categories.
Taken together, Fig. 6 and Table 5 demonstrate that the Cross-Replication Strategy leads to earlier convergence, reduced run-to-run variability, and improved generalization performance, thereby offering a more reliable and statistically robust estimate of expected model behavior compared to a single-run evaluation.
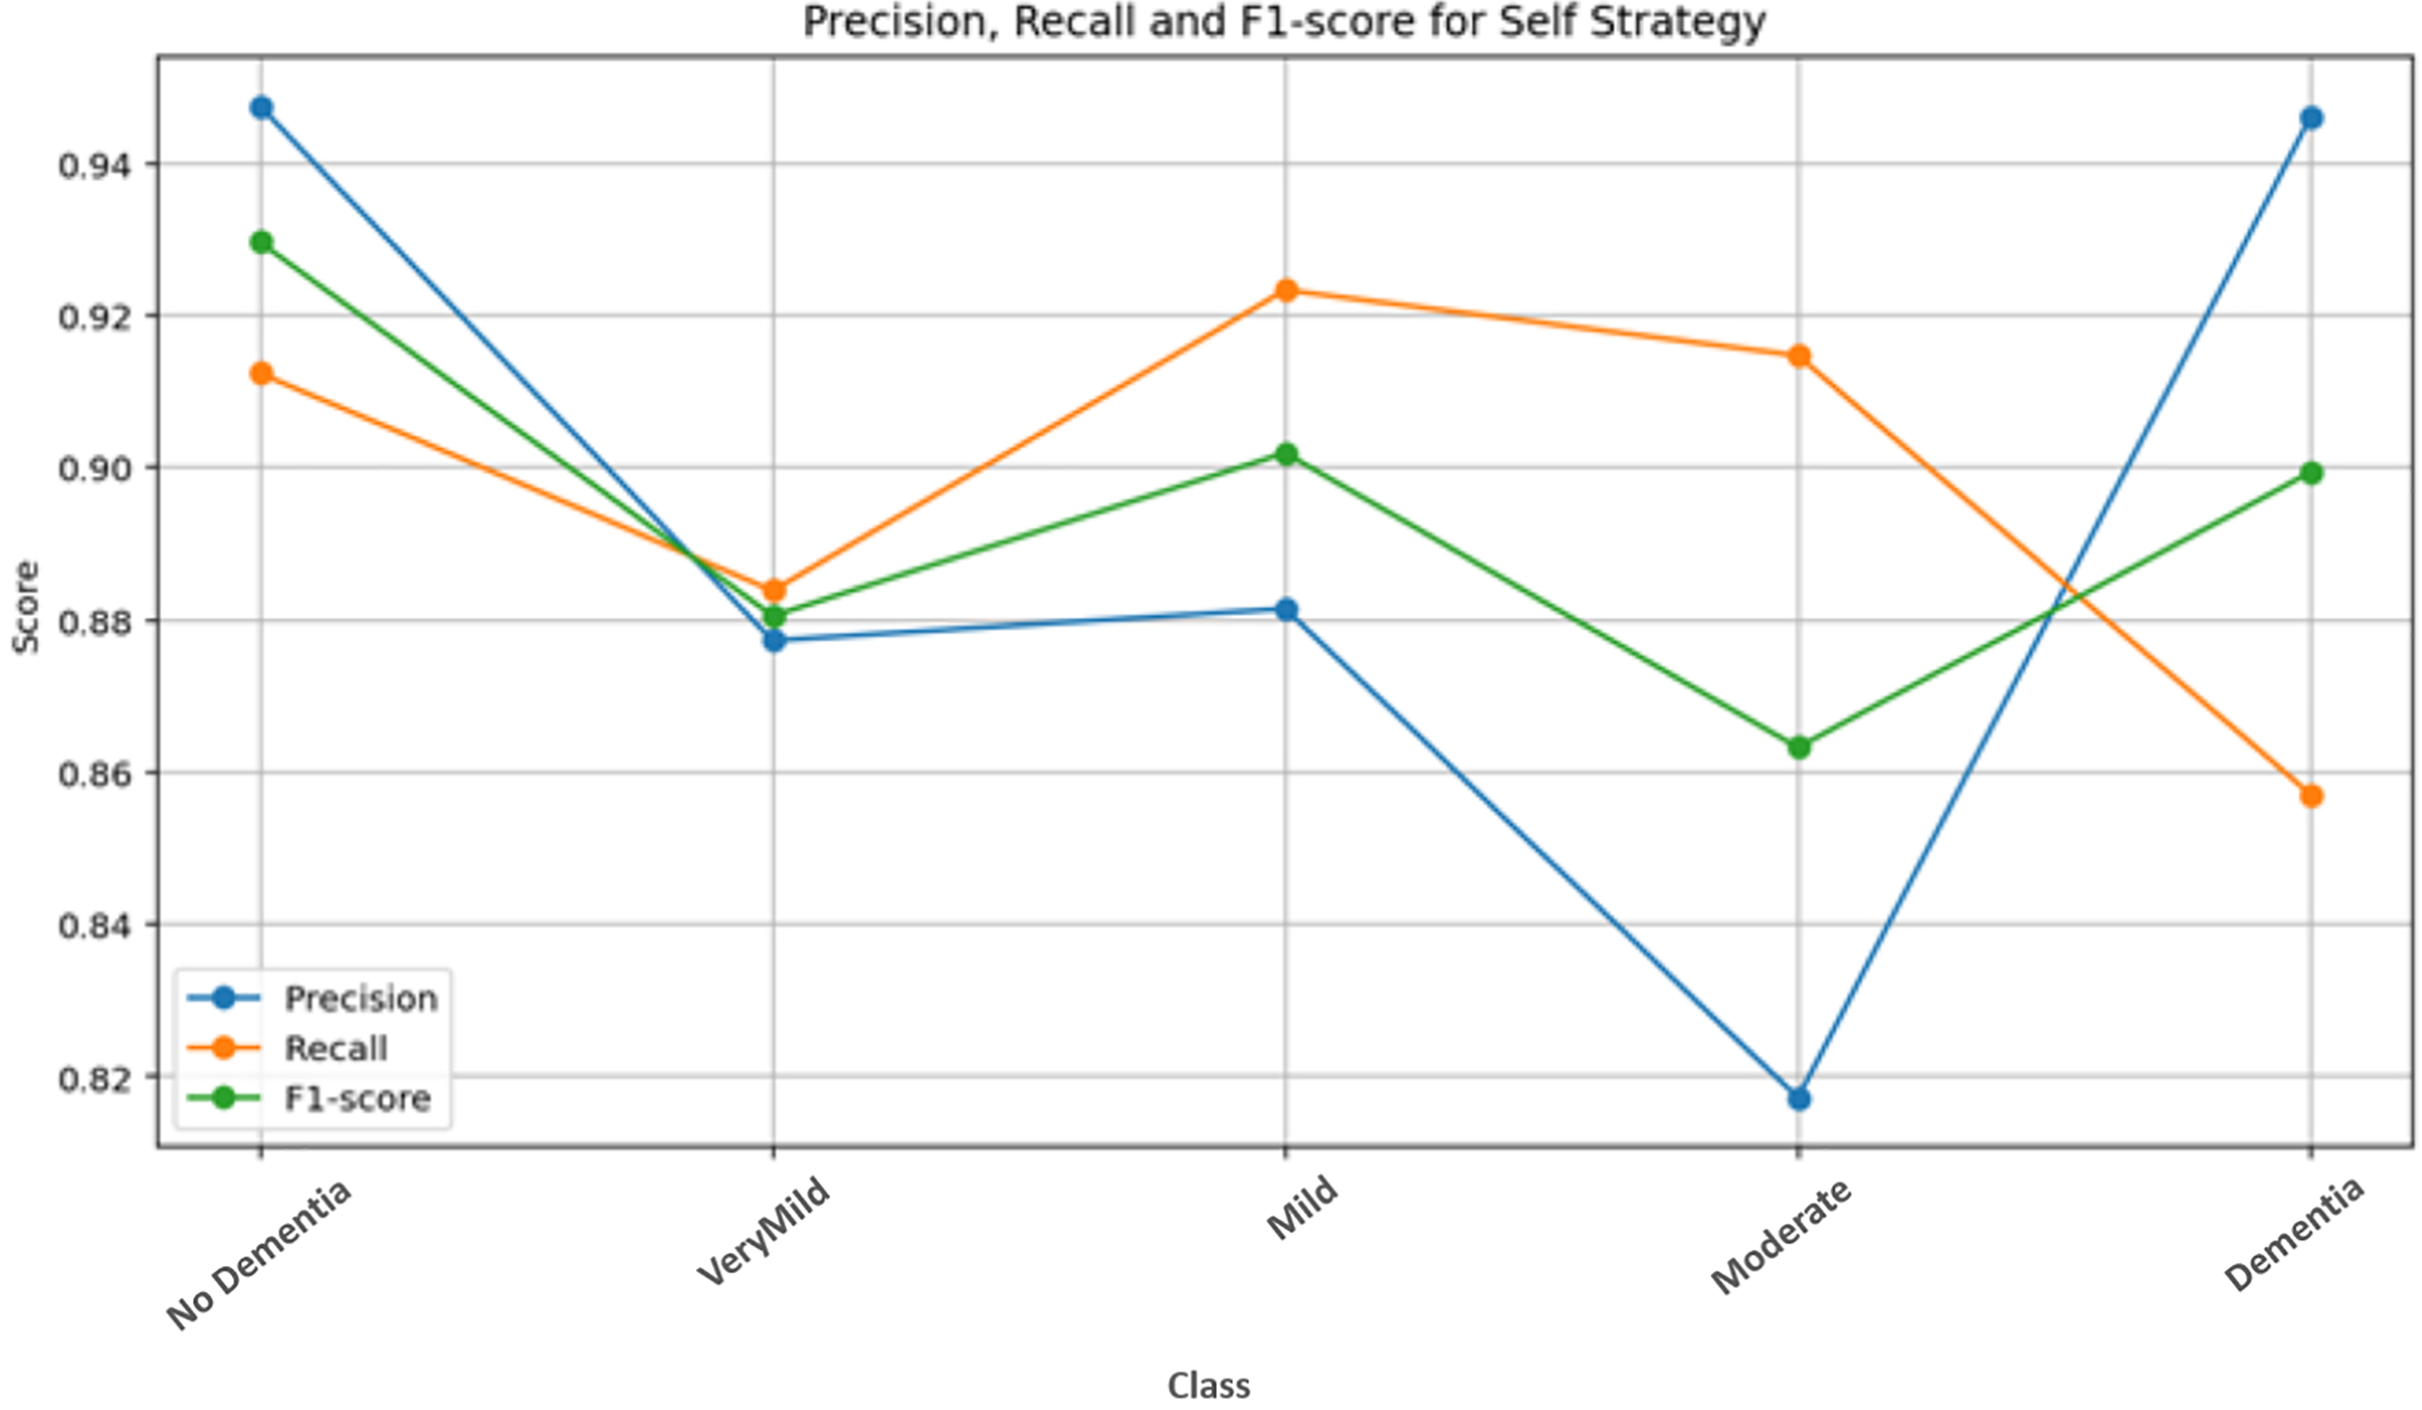
Figure 7 presents the class-wise performance metrics obtained from the self-training strategy on the test dataset. Examination of the metric distributions across classes shows that the No Dementia class achieves the highest and most consistent scores. This indicates that the model is highly reliable in distinguishing healthy subjects from dementia classes under the single-run setting, with minimal misclassification.
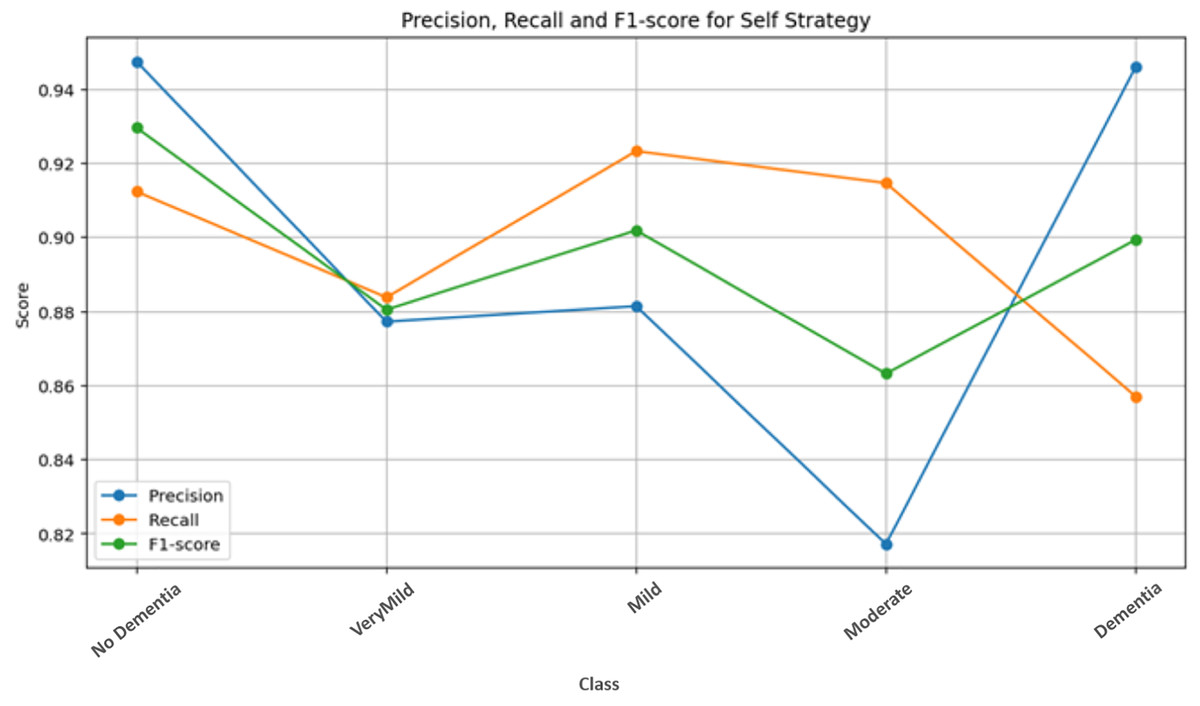
Figure 7: Self-strategy test performance metrics.
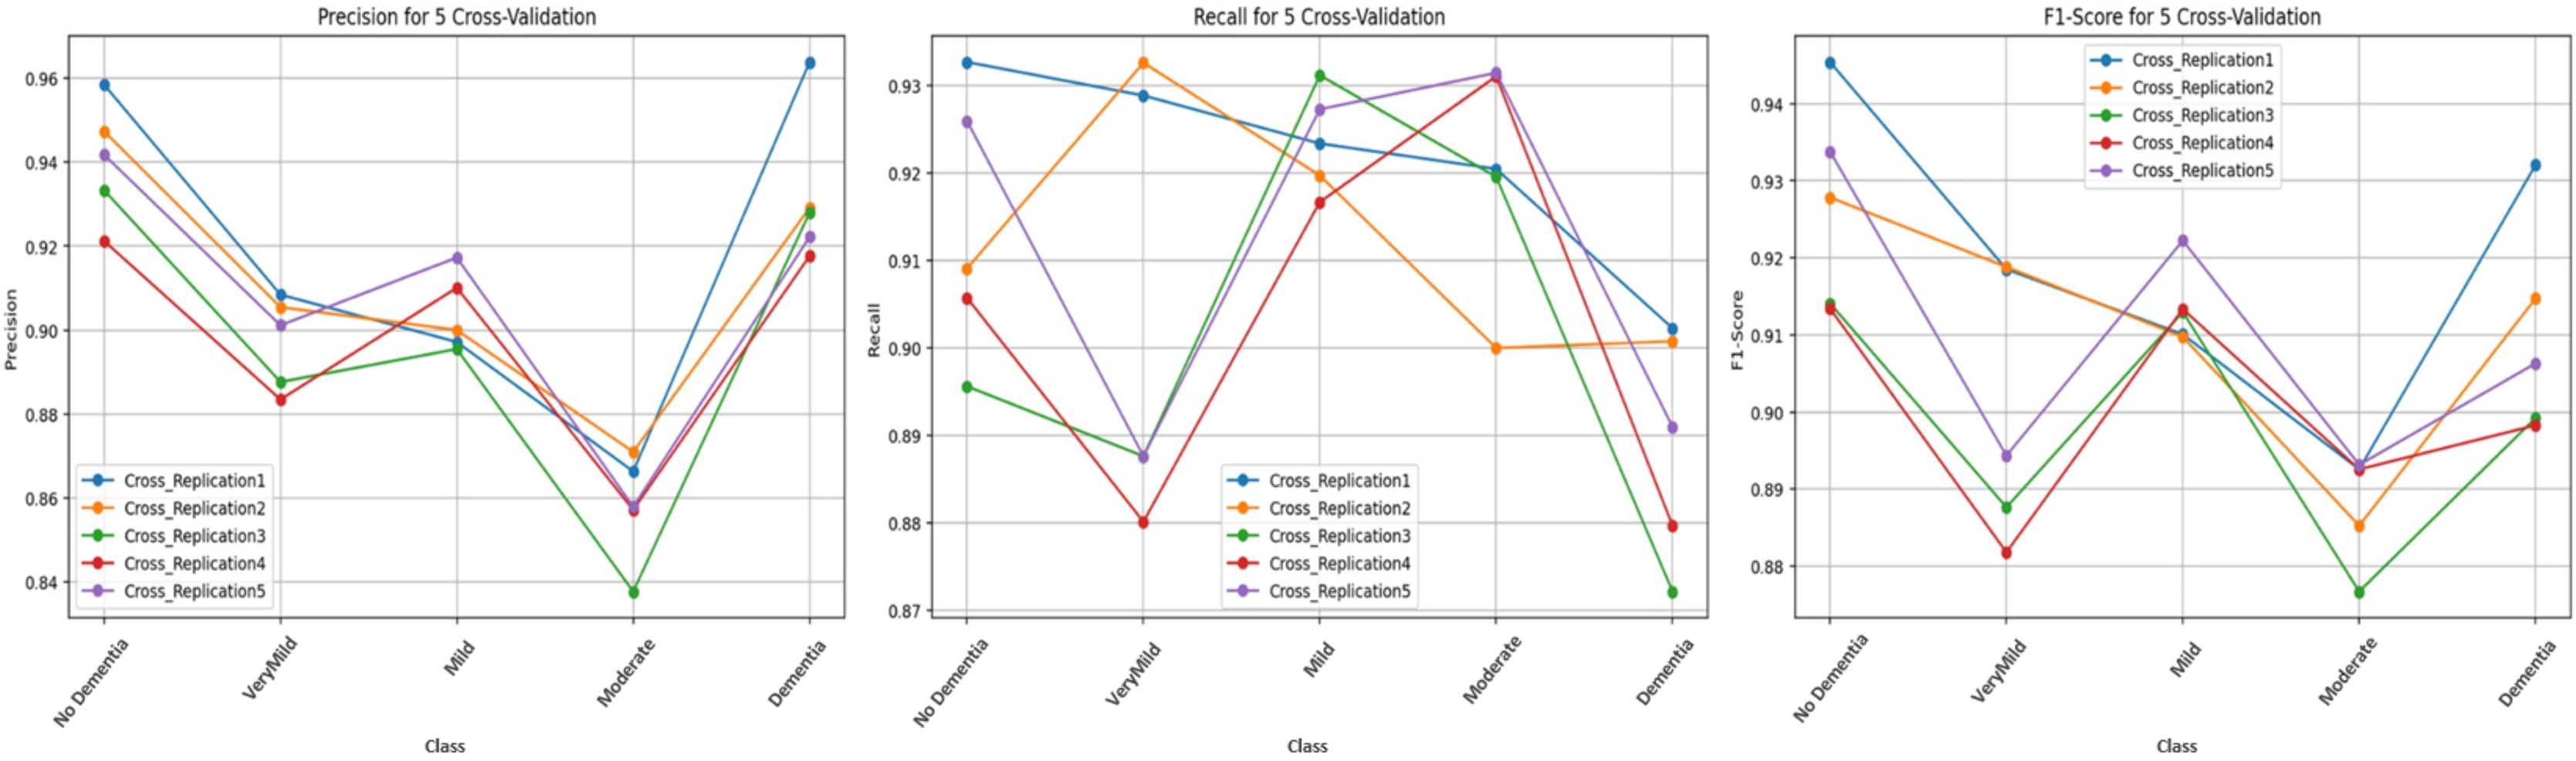
Figure 8 illustrates the class-level performance across the five independent replications. Although all replications display similar performance trends, Replication 1 and Replication 5 show slightly higher scores across multiple classes. Overall, the tight clustering of the bars across replications demonstrates the low variance achieved by the cross-replication protocol.
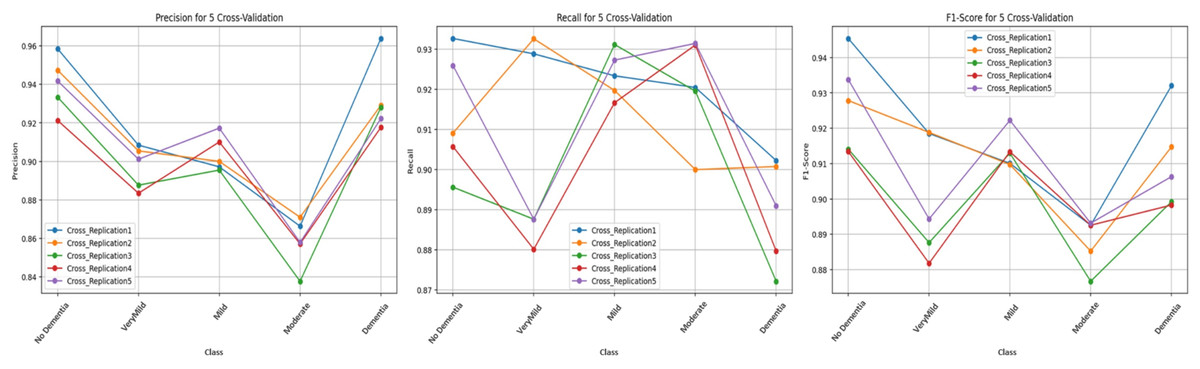
Figure 8: Test performance metrics obtained with the cross-replication strategy.
To further evaluate classification behavior, confusion matrices were generated for both strategies. Figure 9 displays the confusion matrices for the self-training model (A and B) and all five replications under the cross-replication framework (C–F).
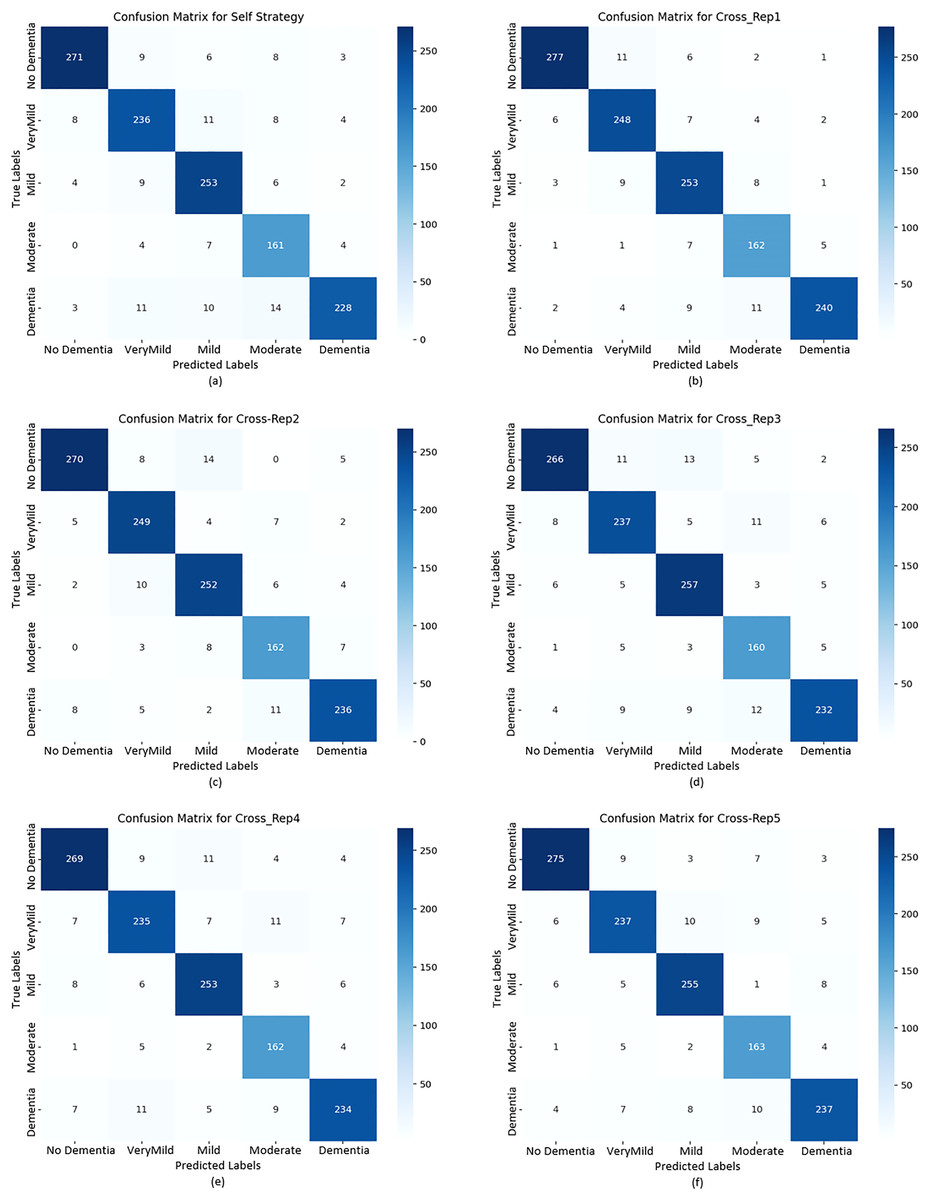
Figure 9: Confusion matrix plots calculated for the test data based on both strategies.
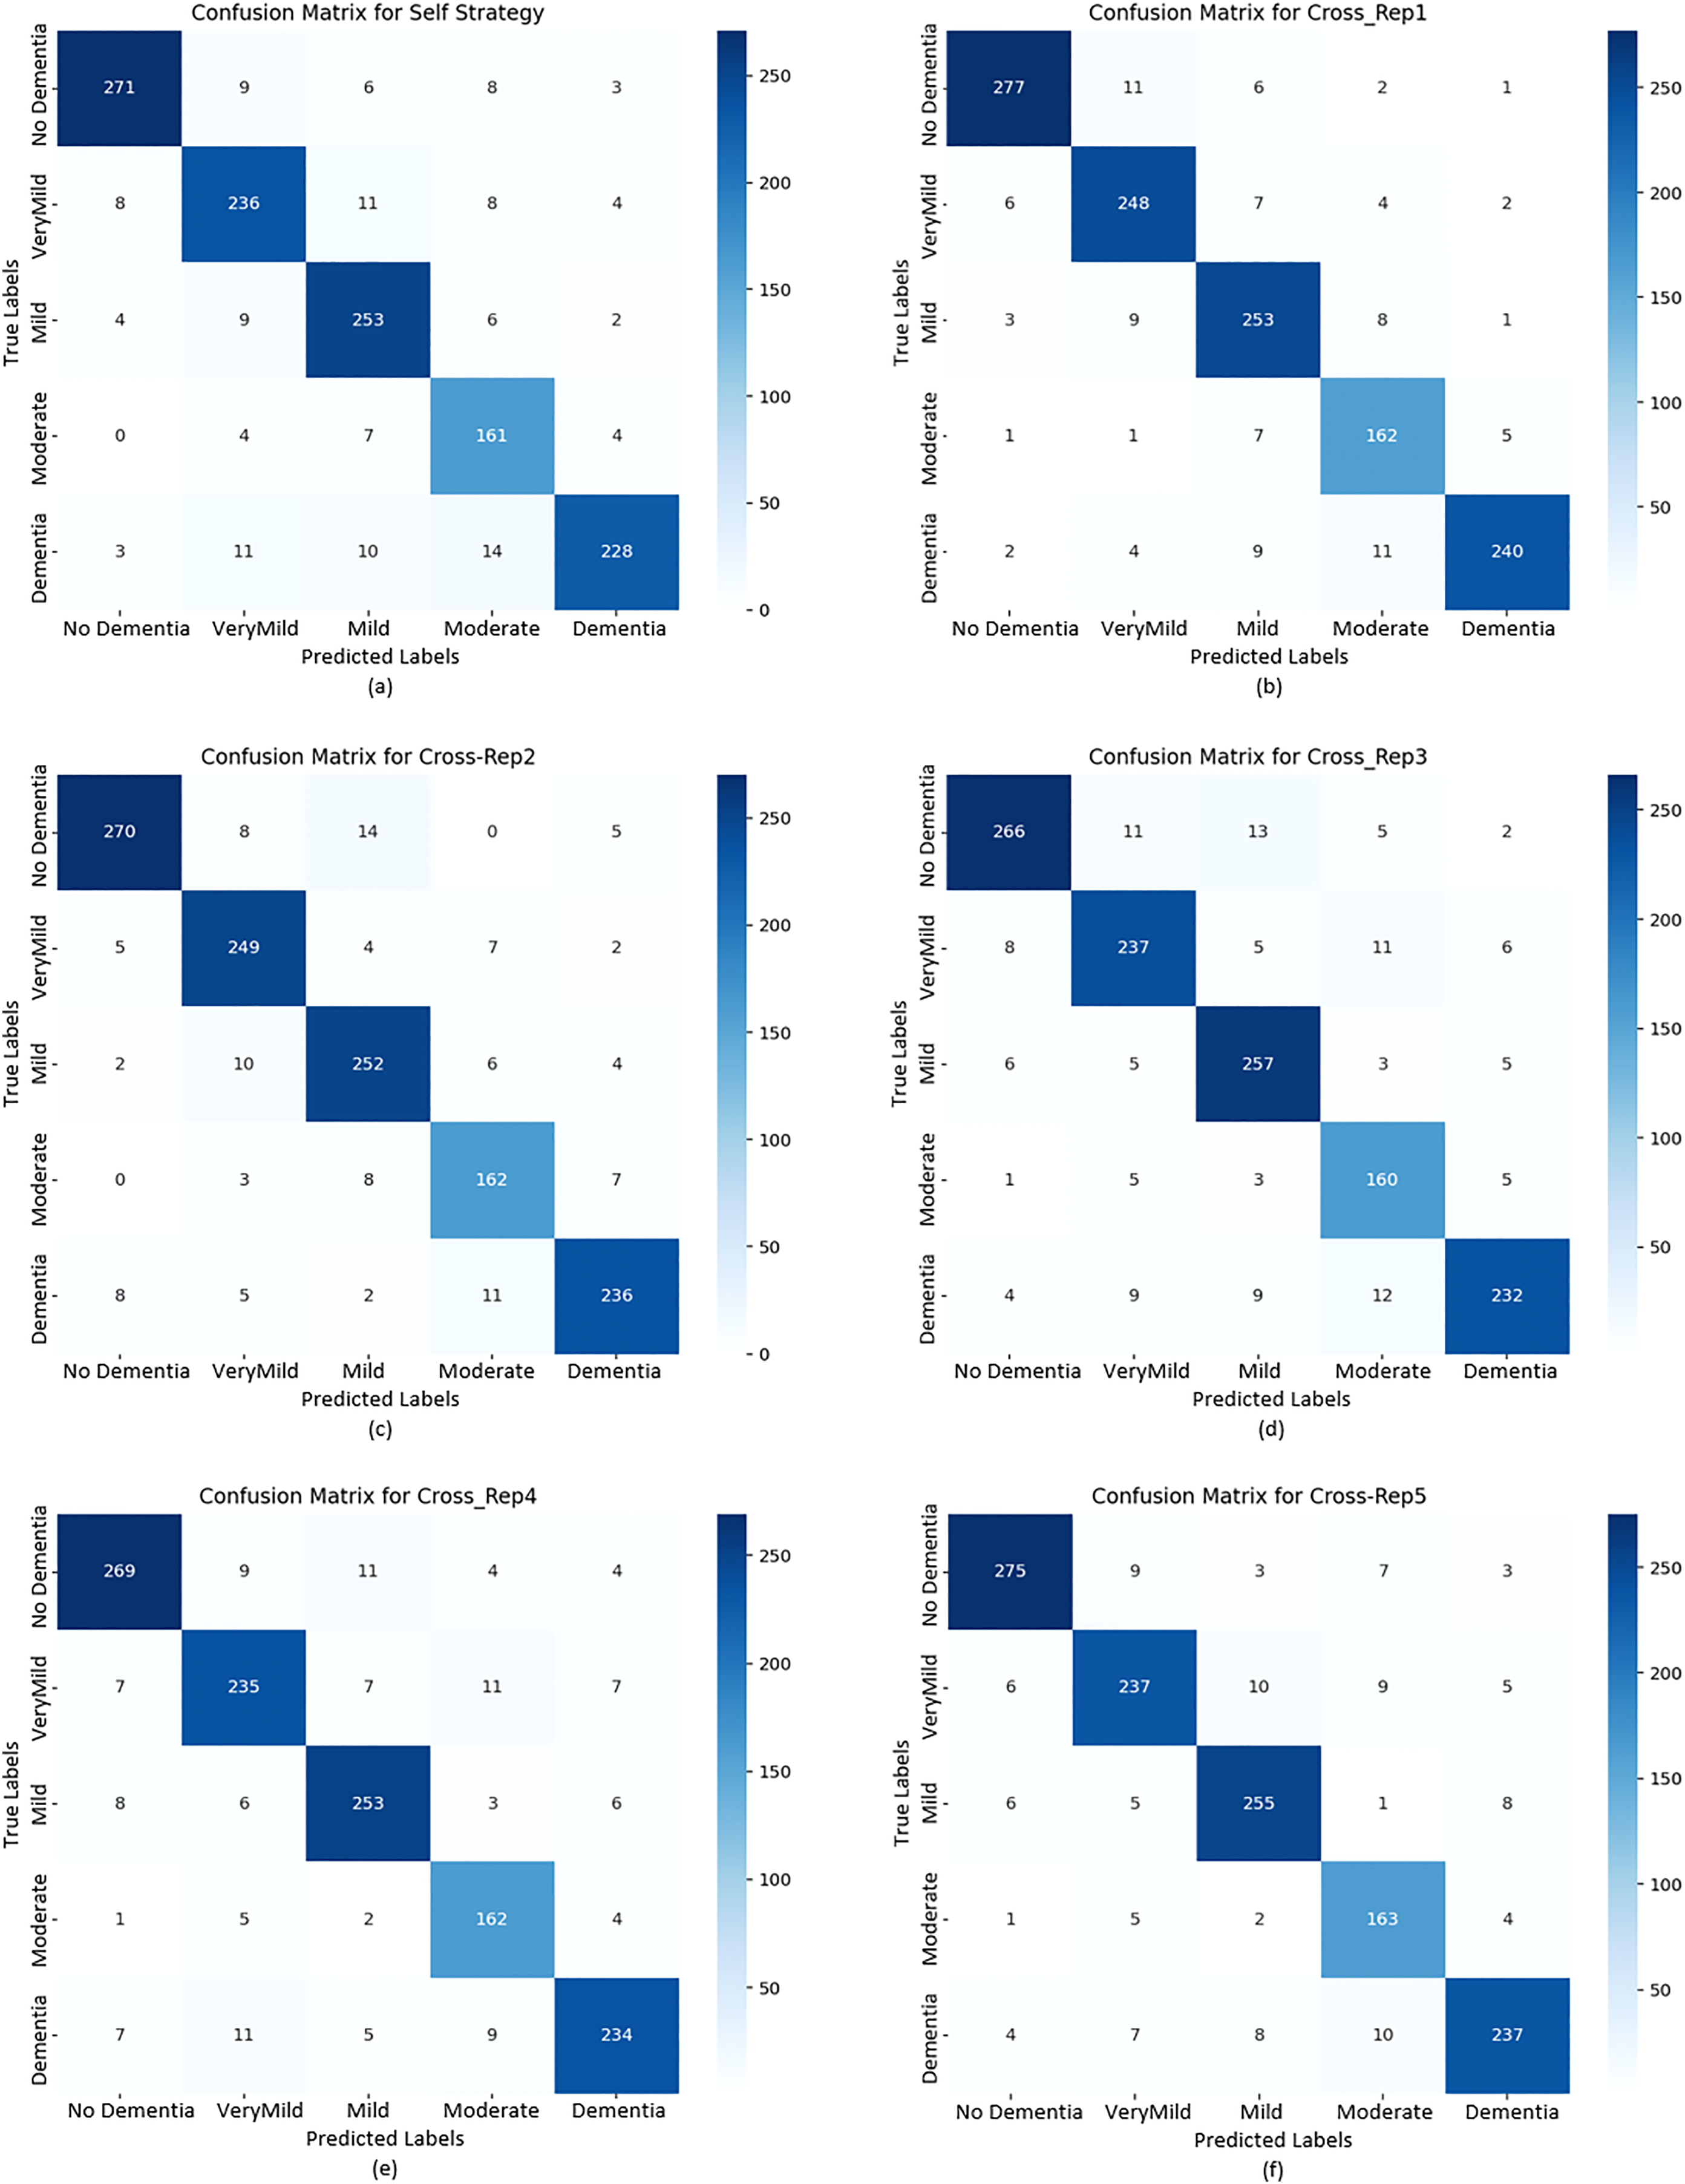
The confusion matrices in Fig. 9 provide detailed insights into per-class behavior and show that the model maintains a consistent classification pattern across replications, with only minor fluctuations. This confirms the robustness of the cross-replication approach against initialization variability.
No Dementia: This class consistently achieved the highest precision, recall, and F1-scores across all replications (0.9338–0.9454). The low number of false positives and false negatives indicates stable and reliable detection of healthy subjects.
Very Mild Dementia: This class displayed high recall (up to 0.9288) with slightly lower precision (≈0.91), suggesting that the model identifies early-stage dementia cases effectively, though with a small number of false alarms.
Mild & Moderate Dementia: These intermediate classes exhibited slightly higher variability between replications. Such fluctuations are expected due to overlapping visual features between adjacent dementia stages. Even so, F1-scores remained consistently high, confirming reliable classification.
Dementia: Precision values ranged between 0.922 and 0.963, while recall values ranged from 0.872 to 0.902. Although this class exhibited a slightly increased rate of false negatives, overall F1-scores (0.90+) indicate stable detection performance, with Replication 1 achieving the best results.
While both strategies show strong performance, the Cross-Replication Strategy yields:
slightly higher average precision and F1-scores in Mild, Moderate, and Very Mild classes,
reduced performance variance across replications,
more balanced predictions across adjacent dementia categories.
The single-run model performs marginally better in the Dementia and No Dementia classes, but these differences are small. Overall, cross-replication offers superior stability without sacrificing accuracy.
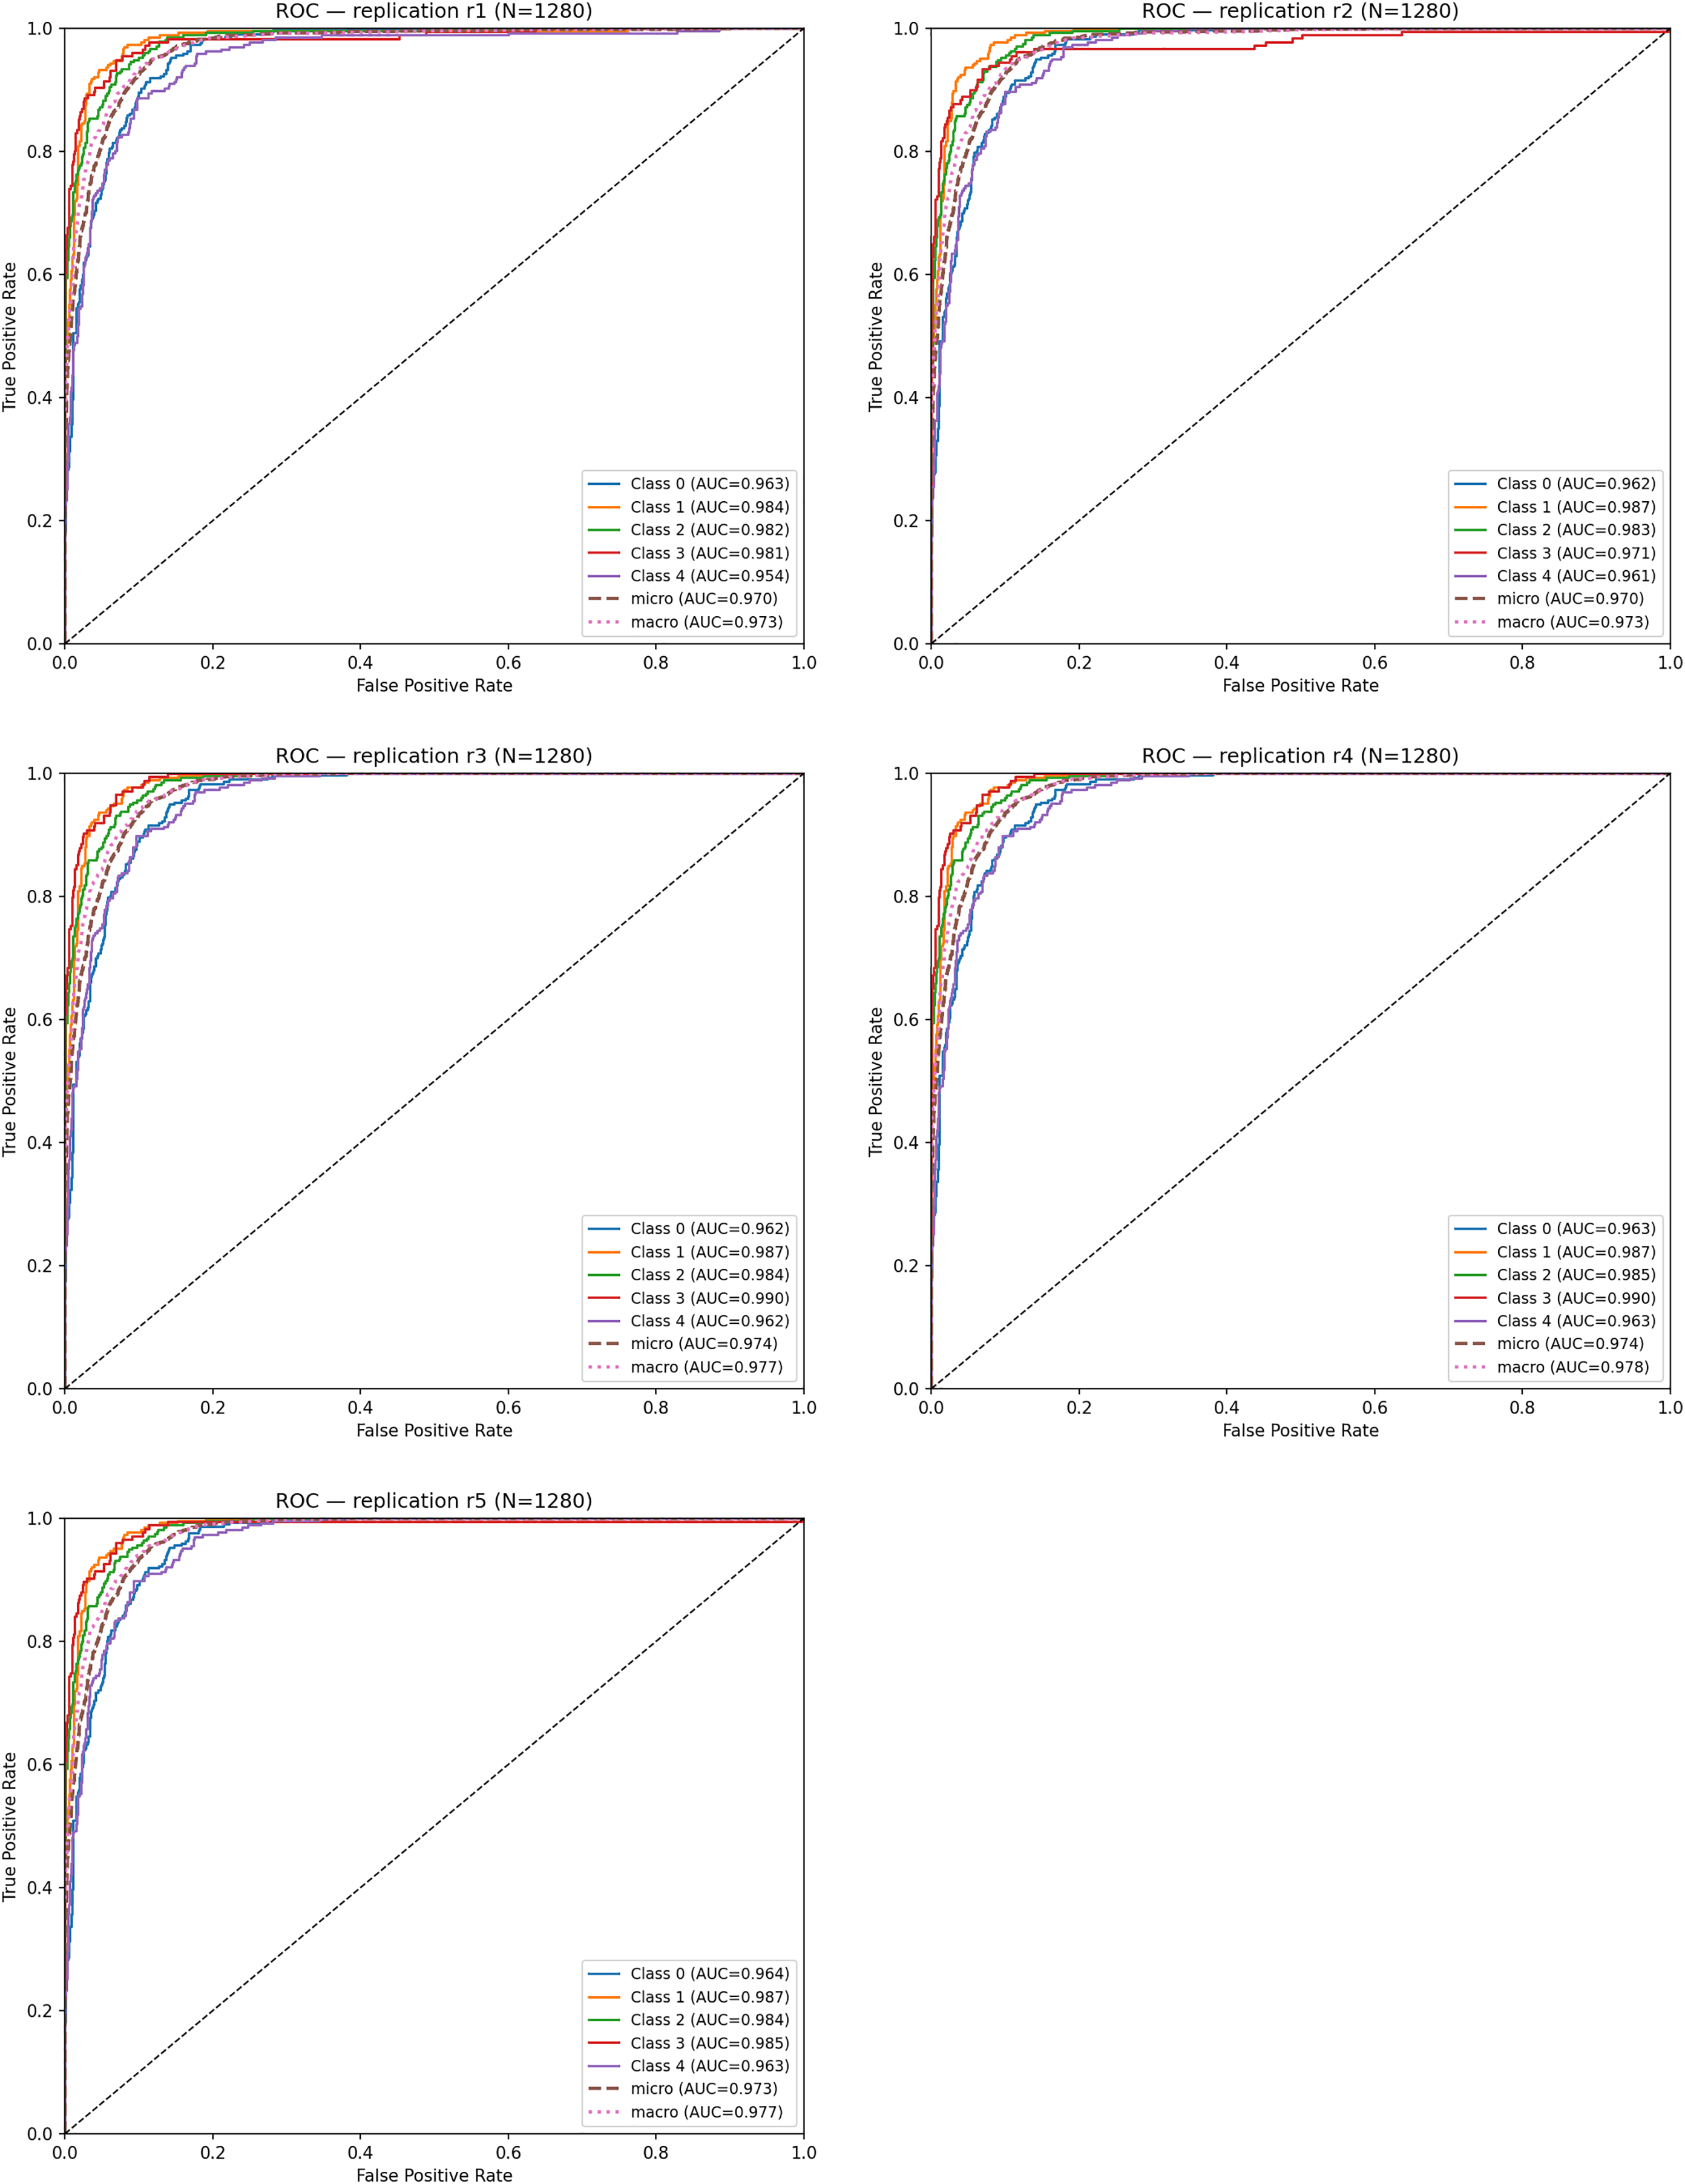
To evaluate discriminative ability, ROC curves were computed for each replication. The mean ROC–AUC across the five runs was: Mean ROC–AUC = 0.963 ± 0.001. Table 6 summarizes the ROC–AUC values for each class and replication.
| Replication | Class 0 | Class 1 | Class 2 | Class 3 | Class 4 | Micro AUC | Macro AUC |
|---|---|---|---|---|---|---|---|
| r1 | 0.963 | 0.984 | 0.982 | 0.981 | 0.954 | 0.970 | 0.973 |
| r2 | 0.962 | 0.987 | 0.983 | 0.971 | 0.961 | 0.970 | 0.973 |
| r3 | 0.962 | 0.986 | 0.982 | 0.990 | 0.962 | 0.974 | 0.977 |
| r4 | 0.963 | 0.986 | 0.985 | 0.990 | 0.963 | 0.974 | 0.977 |
| r5 | 0.964 | 0.987 | 0.983 | 0.965 | 0.963 | 0.973 | 0.977 |
Across all replications, ROC–AUC scores remain consistently high (0.96–0.98). Notably; Class 1 (Very Mild Dementia) and Class 2 (Mild Dementia) achieved the highest AUC values, demonstrating that the model is particularly effective at distinguishing early-stage dementia, where subtle structural alterations are harder to detect.
Figure 10 shows the ROC curves obtained from each replication. The curves exhibit high overlap, indicating that the true-positive rate remains stable despite different random initializations. This close alignment reflects the low stochastic variance of the model under the replication framework.
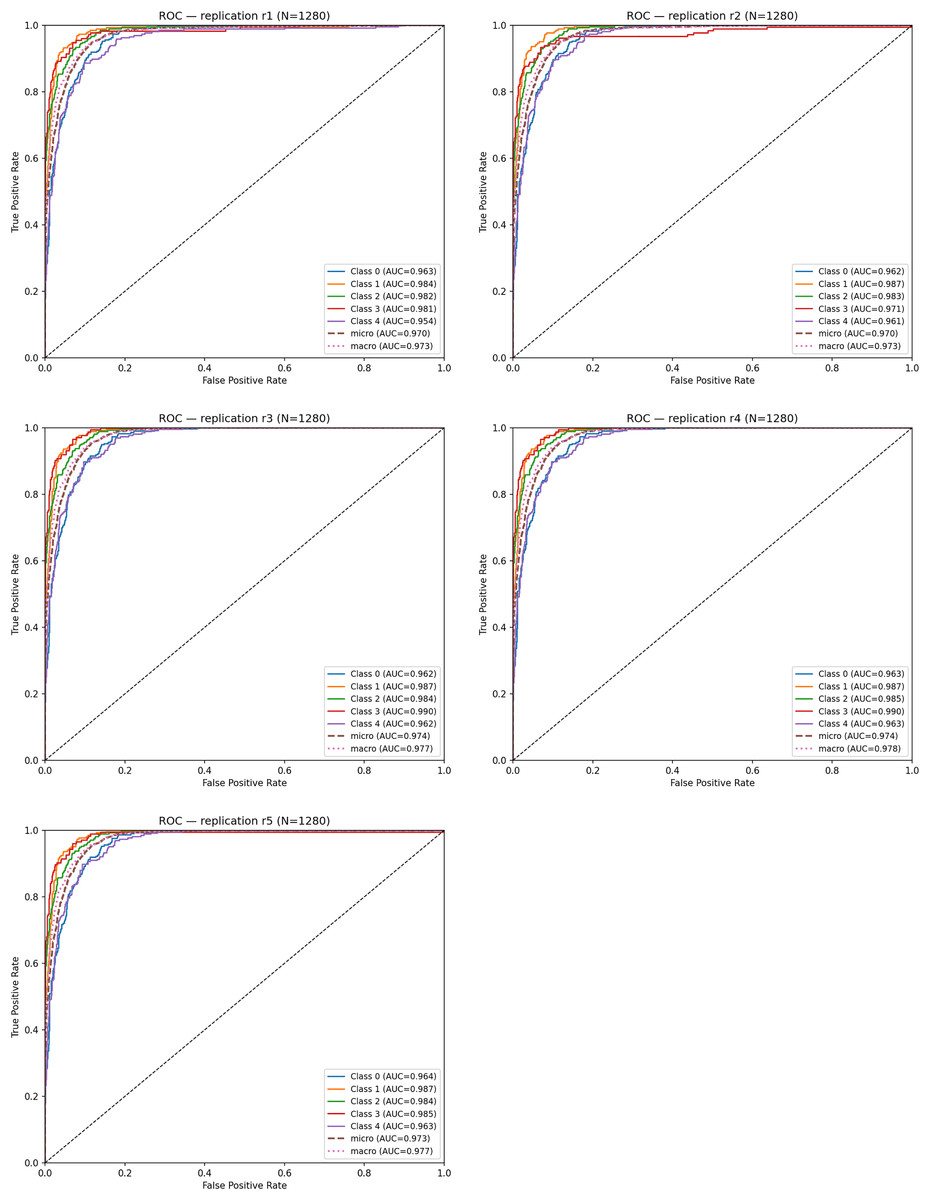
Figure 10: ROC curves for five cross-replications.
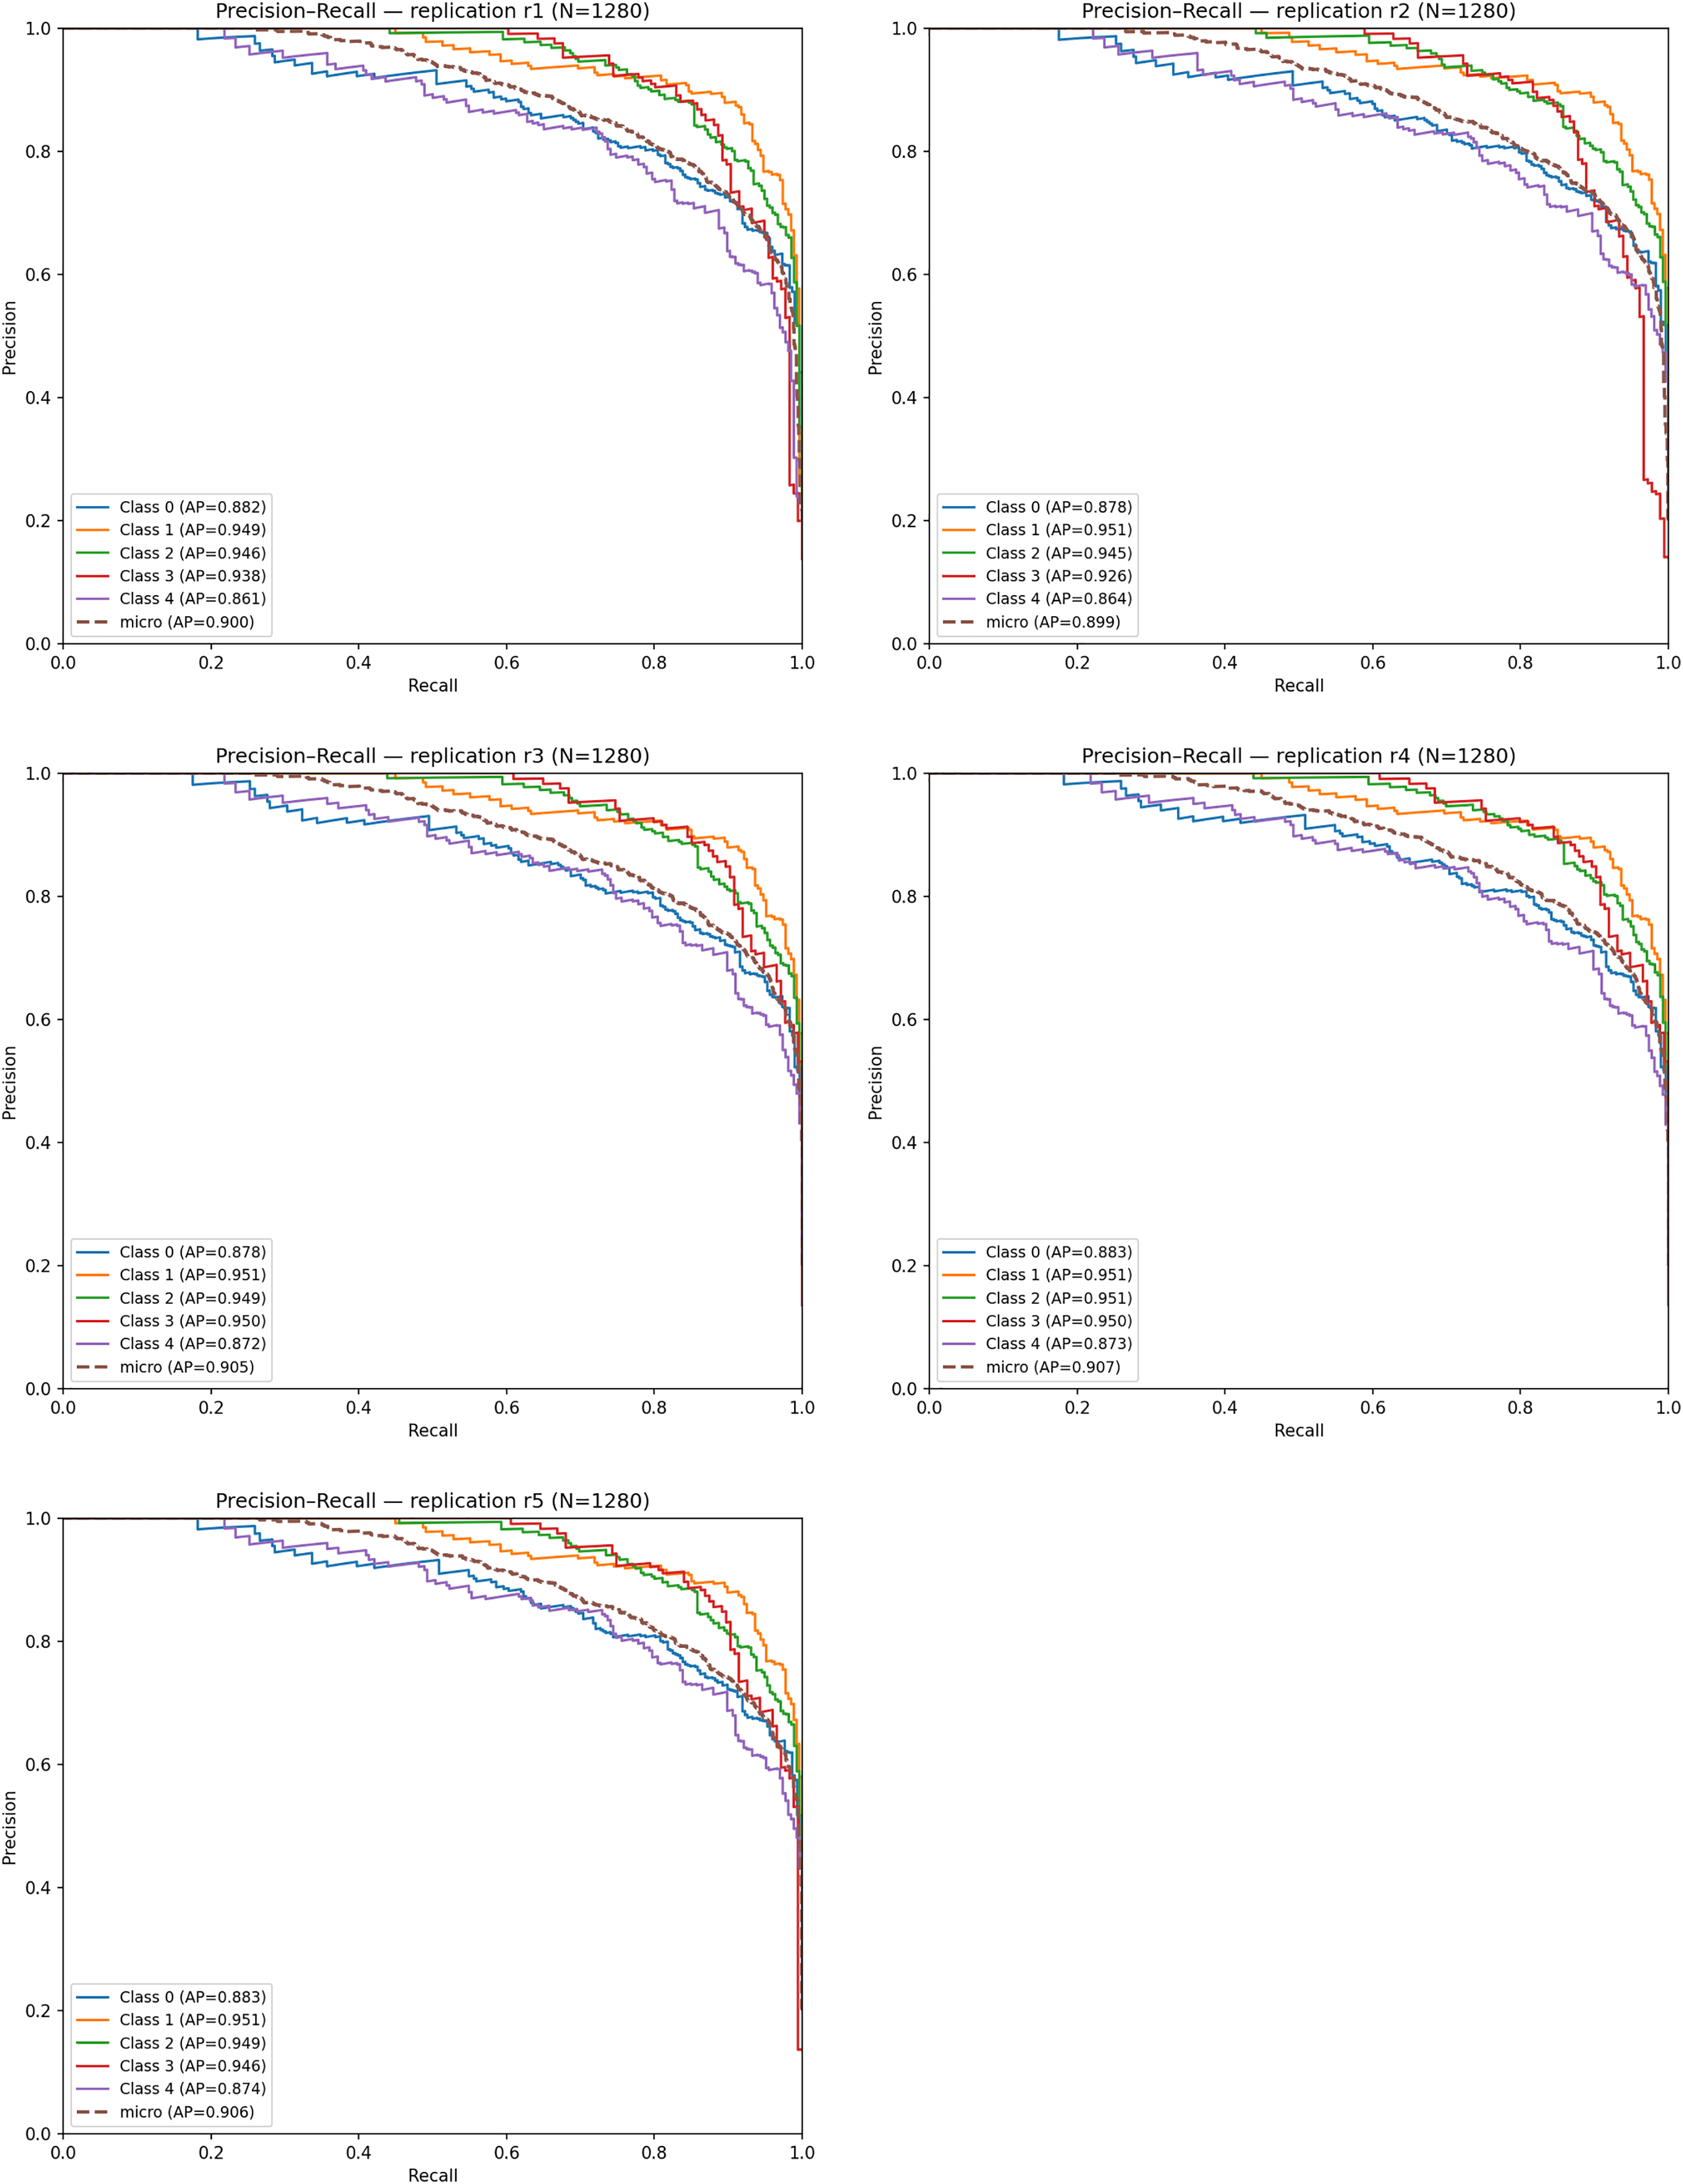
Figure 11 displays the PR curves for the five replications. The micro-averaged AP values range between 0.89 and 0.91, and the average PR–AUC across replications is: Mean PR–AUC = 0.959 ± 0.002. Among the classes, Very Mild Dementia and Mild Dementia achieve the highest AP scores (0.94–0.95), confirming the model’s capability to detect subtle neuropathological signals. Slightly lower but still strong AP values for the No Dementia and Moderate classes (≈0.87–0.88) indicate moderate difficulty due to class overlap.
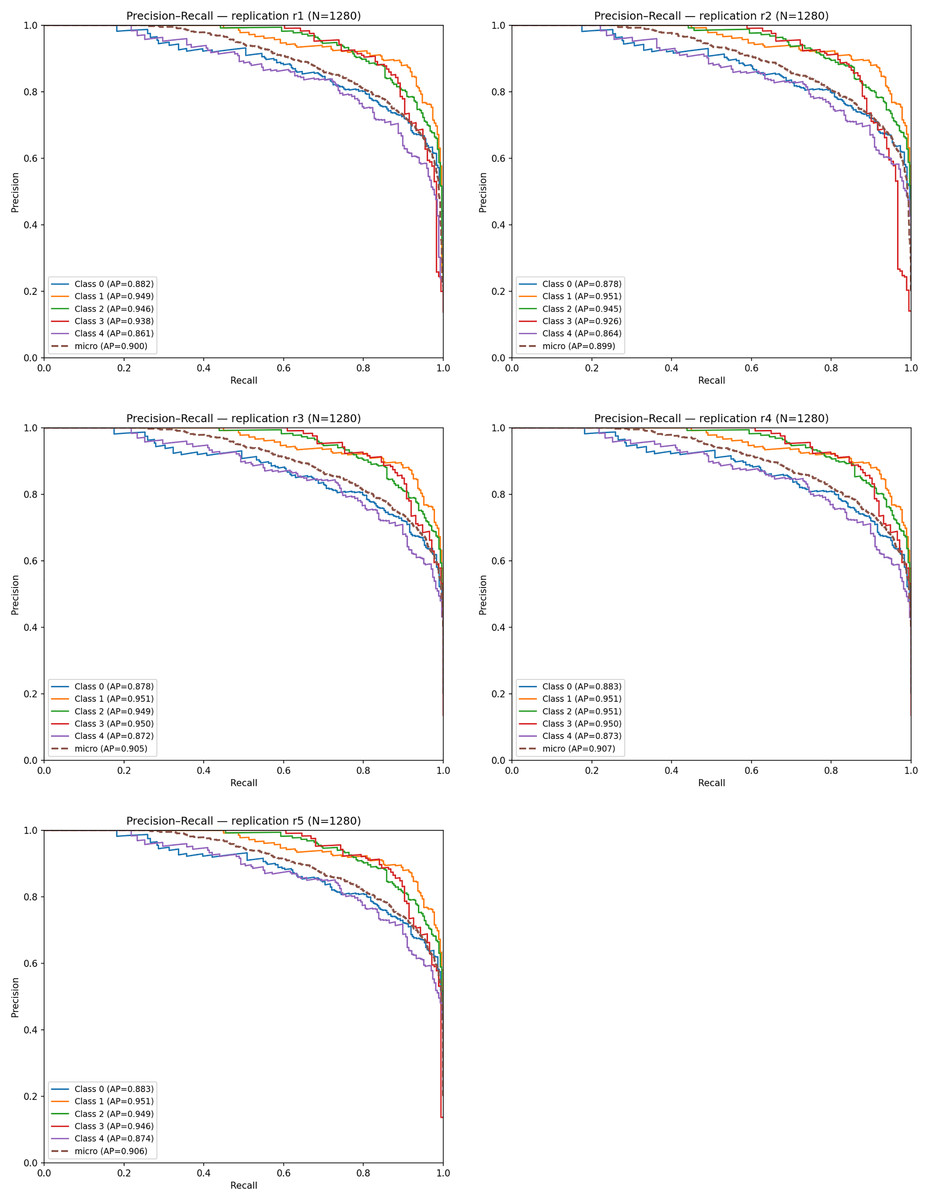
Figure 11: Precision–Recall (PR) curves obtained from five independent replications.
The high alignment among PR curves demonstrates consistent precision–recall behavior across replications, confirming the reproducibility and robustness of the proposed model.
Model calibration was assessed using Brier scores. The average multiclass Brier score across the five replications was: Mean Brier Score = 0.134 ± 0.002. This relatively low Brier score indicates that predicted probability estimates are well-aligned with actual class frequencies. Calibration curves (not shown for brevity) further confirmed that the model’s Softmax outputs demonstrate strong probabilistic reliability, with only minor deviations from perfect calibration.
Discussion
This study presents a systematic evaluation of a deep learning framework for AD detection from MRI images, emphasizing methodological rigor through the integration of a Cross-Replication strategy. The findings demonstrate that incorporating replication-based validation substantially enhances model stability, reliability, and generalizability by mitigating the impact of random initialization. The robust performance observed in distinguishing both No Dementia and Dementia categories underscores the discriminative capacity of the EfficientNetV2-B0 architecture within a clinically relevant diagnostic context.
To situate the proposed approach within the broader landscape of AD classification research, Table 7 summarizes recent MRI-based studies and their corresponding classification accuracies.
| Author(s) | Model | Accuracy (%) |
|---|---|---|
| Salehi et al. (2023) | LSTM | 98.62 |
| Bi et al. (2021) | Deep Metric Learning (DML) | 82.00 |
| Rallabandi & Seetharaman (2023) | CNN + PET-MRI Fusion | 95.30 |
| Zhang et al. (2022) | EfficientNet-B1 | 93.20 |
| This study | EfficientNetV2-B0 + Cross-Replication | 95.00 |
As shown in Table 7, the proposed framework achieves a competitive accuracy of 95.00%, surpassing several contemporary approaches and performing comparably to the best-performing LSTM-based system reported by Salehi et al. (2023). It is important to interpret such comparisons with caution because of heterogeneity in datasets, preprocessing pipelines, and evaluation methodologies. Nevertheless, the proposed model’s performance remains compelling, particularly given its computational efficiency and statistical robustness.
A key innovation of this study lies in the systematic use of five-fold Cross-Replication, where each replication corresponds to an independent model instantiation with a unique random seed while retaining a fixed train/validation/test split. This design enables a clearer quantification of performance variance attributable solely to stochastic optimization. The resulting low variance observed across replications indicates a reliable learning process, strengthening confidence in the model’s stability.
In addition to accuracy-based evaluations, the model’s consistency was supported by high ROC–AUC (0.963 ± 0.001) and PR–AUC (0.959 ± 0.002) scores, demonstrating excellent discriminative power. Importantly, these metrics were complemented by calibration analyses; the mean Brier score of 0.134 ± 0.002 reflects a strong alignment between predicted probabilities and observed class frequencies. Together, these findings confirm that the proposed framework provides not only accurate but also well-calibrated probability estimates—an essential attribute for clinical decision-support applications.
EfficientNetV2-B0 was selected because of its well-documented trade-off between accuracy and computational cost. Its compact architecture, enhanced by compound scaling and progressive resizing, enables efficient training while preserving high representational capacity. This advantage is particularly meaningful for medical institutions with limited computational resources or for deployment scenarios requiring real-time inference.
Moreover, the automatic extraction of hierarchical features directly from MRI images eliminates the need for handcrafted or region-based feature engineering. This property enhances adaptability across datasets and supports the detection of subtle structural variations associated with early-stage AD progression. Although the results are encouraging, several limitations merit further investigation:
Single-modality limitation: The current analysis relies solely on structural MRI data. Future work should explore multimodal fusion approaches incorporating PET imaging, genetic biomarkers, or cognitive assessment data to enhance diagnostic comprehensiveness.
Model diversity: While EfficientNetV2-B0 performed well, emerging architectures such as Vision Transformers, hybrid CNN–Transformer systems, or Graph Neural Networks may capture global relationships in neuroanatomical structures more effectively.
Interpretability: Integrating explainable AI methods (e.g., Grad-CAM, SHapley Additive exPlanations (SHAP)) will be essential to identify the specific anatomical regions driving model predictions, thereby improving clinical relevance and trust.
External validation: Although the Cross-Replication strategy strengthens internal validity, further validation using multi-center datasets with heterogeneous demographics is necessary to confirm cross-site generalizability.
Overall, the proposed framework offers a statistically resilient and computationally efficient approach for AD prediction, with potential for meaningful adoption in clinical workflows following additional external validation.
Conclusions
This study systematically evaluated the performance of the EfficientNetV2-B0 architecture for AD prediction from MRI data under two distinct training strategies. The results consistently demonstrate that integrating a 5-fold Cross-Replication strategy leads to measurable improvements in predictive accuracy, stability, and generalization. Specifically, the cross-replication approach increased overall accuracy from 0.94 to 0.95, reduced performance variance, and achieved model convergence with fewer epochs, thereby enhancing computational efficiency.
The key contribution of this work lies in establishing that replication-based evaluation provides a more reliable assessment of model robustness than single-run training procedures. By minimizing the variance introduced by random initializations, the proposed framework offers improved reproducibility—an essential requirement for AI-assisted diagnostic tools in clinical practice.
The findings suggest that with further external validation, multimodal data integration, and enhanced interpretability, the proposed methodology can contribute to the development of dependable and clinically interpretable prediction systems. Ultimately, the study highlights the potential of combining EfficientNetV2-B0 with replication-based evaluation strategies to support earlier, more accurate, and more reliable AD diagnosis.