
Multiviz: a smart visualization system for real-time financial trading operations
- Published
- Accepted
- Received
- Academic Editor
- Arkaitz Zubiaga
- Subject Areas
- Human-Computer Interaction, Data Science, Visual Analytics
- Keywords
- Financial data visualization, Treemap, Human computer interaction, Multichannel data visualization, Real time data visualization, Eyetracking in finance, Financial user interface
- Copyright
- © 2026 Gokturk and Emiral
- Licence
- This is an open access article distributed under the terms of the Creative Commons Attribution License, which permits unrestricted use, distribution, reproduction and adaptation in any medium and for any purpose provided that it is properly attributed. For attribution, the original author(s), title, publication source (PeerJ Computer Science) and either DOI or URL of the article must be cited.
- Cite this article
- 2026. Multiviz: a smart visualization system for real-time financial trading operations. PeerJ Computer Science 12:e3575 https://doi.org/10.7717/peerj-cs.3575
Abstract
Real-time financial monitoring requires operators to interpret large volumes of multidimensional and continuously changing data under conditions that demand rapid, accurate, and repeatable judgment. Conventional tabular interfaces rely heavily on serial scanning and working-memory—intensive comparison, increasing cognitive load and limiting the timely detection of anomalies or the integration of multiple indicators. This study introduces Multiviz, a visualization system designed to support high-density financial analysis through a squarified treemap layout, perceptually separable multivariate encodings, and a rule-based agent layer that applies nonintrusive visual emphasis to contextually relevant changes. A controlled laboratory experiment was conducted with twelve finance-domain participants who completed six analytical tasks using both Multiviz and a baseline tabular interface. Quantitative results showed that Multiviz reduced task completion time from 241.5 ± 42.7 s to 113.1 ± 13.8 s and increased task accuracy from 7.75 ± 0.26% to 9.17 ± 0.27%. Mouse interactions decreased from 52.6 ± 5.4 to 34.9 ± 3.4, indicating reduced interaction overhead. Eye-tracking analysis further revealed shorter fixations (414 vs. 441 ms), reduced scanpath length, and more concentrated attention within semantically coherent regions, suggesting greater perceptual efficiency. Participants reported improved clarity and reduced search effort after brief familiarization with the system. These findings provide empirical evidence that integrating hierarchical layout, multivariate visual encoding, and rule-based perceptual cueing can improve performance and attentional focus in complex, data-rich financial analysis settings.
Introduction
Real-time financial markets generate large volumes of multidimensional and interrelated data, requiring operators to interpret many indicators simultaneously and under demanding time constraints. In this dynamic and high-stakes environment, traditional visualization approaches frequently prove inadequate, leading to increased cognitive load and suboptimal decision-making.
Conventional displays, such as spreadsheets or static dashboards, lack the perceptual efficiency required to handle the density and volatility of modern financial data. They typically rely on textual or tabular representations, which force users to engage in serial processing and frequent visual scanning. Such interactions are cognitively demanding and error prone, especially for tasks that require anomaly detection, comparative filtering, or multi criteria decision making.
To address these challenges, advanced visualization techniques such as hierarchical treemaps and context aware agent systems have gained attention. Treemaps are well suited for representing hierarchical financial data with space efficient encodings of multiple variables (Shneiderman, 1992). Yet, their integration into real-time trading systems remains limited, particularly in interfaces designed with human perceptual and attentional constraints in mind.
This article presents Multiviz, a smart visualization system that enhances financial operator performance through real-time enhanced treemap-based representations, machine-learning driven visual agents and perceptually optimized interface design. The development of Multiviz is evaluated through controlled eye-tracking experiments that compare the system with a baseline tabular interface using realistic financial analysis tasks.
The findings demonstrate that Multiviz reduces task completion times and visual search load while enabling more accurate and confident decision-making. This research contributes to financial information visualization and human–computer interaction by offering an evidence-based design that balances visual scalability, real-time responsiveness, and cognitive efficiency.
This study basically addresses the following research question:
How can real-time, multidimensional financial data be visualized in a way that optimizes operator performance, reduces cognitive load, and supports anomaly detection in settings that require rapid interpretation and high information density?
The key contributions of this article are as follows:
-
(1)
Multiviz, a smart visualization system that integrates treemap based financial data representations with real-time agent based anomaly highlighting and dynamic interaction capabilities, was proposed.
-
(2)
A hybrid interface architecture that incorporates visual hierarchy, perceptual cues, and task aligned user interactions was designed and implemented.
-
(3)
A controlled user study using eye-tracking was conducted to compare Multiviz with a conventional list based layout on realistic financial tasks.
-
(4)
Empirical evidence was provided to demonstrate that Multiviz improves task speed, reduces fixation time, and enhances user focus in high-density data environments.
Background and related work
Multivariate visualization in financial contexts
Today’s financial sector is one of the most data intensive domains, characterized by the real-time generation of large volumes of multidimensional, interconnected, and volatile data. Analysts and operators are routinely required to monitor variables such as credit default swap (CDS) spreads, market depth, bond yields, sector performance indicators, order book activity, volatility surfaces, macroeconomic announcements, and geopolitical risk signals. These tasks usually occur in parallel and are often performed under time pressure (Keim, 2002). Furthermore, the heavy cognitive workload remains the same throughout the workday (Sarlin & Peltonen, 2013). The big challenge is not only in accessing the data but also in turning it into actionable insights during rapidly changing scenarios such as sudden market changes and policy shifts (Sackett et al., 2006). Recent approaches also move beyond isolated indicators toward integrated multi signal architectures for anomaly detection. For example, Shu, Wang & Liang (2024) proposed a multi-signal integration framework that synthesizes market microstructure metrics, sentiment measures, and cross asset signals, achieving earlier detection of financial anomalies across diverse regimes. This line of work highlights the growing emphasis on integrated signal processing, which parallels Multiviz’s goal of combining heterogeneous indicators into a unified perceptual display.
Traditional financial information systems have relied heavily on tabular displays and chart-based dashboards, sometimes seasoned with colors and additional markers. Table based monitoring lists or Bloomberg Terminals™ are widely used in the financial sector due to their familiarity and flexibility to users. However, they still impose considerable cognitive demands on users, especially in high dimensional settings where relevant variables are not spatially grouped or perceptually pre-attentive (Guo et al., 2022). Users are required to perform manual filtering, sorting, and cross-comparison across multiple views, leading to high levels of visual search effort, memory load, and error susceptibility.
The limitations of such approaches have been well documented especially in high dimensional settings (Marghescu, 2007). Cleveland & McGill (1984) demonstrated that common graphical encodings vary significantly in their perceptual accuracy, with position and length-based encodings outperforming area and color under most circumstances. Although bar charts and line plots work well for isolated comparisons, they are less effective in conveying hierarchical relationships, attribute clusters, or anomaly patterns in large data sets. In the finance domain, where datasets usually exhibit hierarchical and multiscale properties such as “sector → sub-sector → firm”, the need for more expressive and compact visualization methods becomes apparent.
In response to these difficulties, financial analytics platforms have started to incorporate more sophisticated visualizations. Heatmaps and dashboard tiles are frequently used to encode variable magnitudes through color gradients. Some platforms offer simple tree navigation or filterable panels to support hierarchical analysis. However, these systems rarely optimize for perceptual salience or cognitive efficiency, especially when addressing multi-dimensional data such as environment, social and governance (ESG)-based investment factors (Khoo et al., 2025; Huang, Liang & Nguyen, 2009). As noted in Vliegen, van Wijk & van der Linden (2006), many real-time monitoring dashboards are not suitable to support exploratory sense-making under stress but rather for routine surveillance of static key performance indicators (KPIs). Such tools often struggle with scalability issues. As the number of variables or assets increases, traditional visualizations become cluttered and difficult to work with, and interactions such as sorting or filtering become time consuming and cognitively disruptive.
Several academic and commercial efforts have explored techniques to enhance visual performance in finance. For example, Kong, Heer & Agrawala (2010) investigated multi-criteria ranking tools for financial instruments by combining sliders and scatterplots for portfolio optimization. Medeiros et al. (2023) and Limberger et al. (2023) proposed event-driven visual interfaces that adapt their focus based on detected anomalies. Yet these systems generally stop short of integrating hierarchical layouts with real-time feedback mechanisms or perceptual guidance layers.
One underaddressed challenge is the alignment between data structure and user task. For example, when identifying underperforming firms within a sector, it is not sufficient to sort a column in a table. The user must simultaneously evaluate firm level indicators, their sector wide context, and how the anomaly deviates from temporal baselines. All of these benefit from visualization techniques that support visual grouping, comparison, and pattern detection at multiple levels of abstraction. Existing tools that rely on linear representations or disconnected panels fail to provide this integrative visual context.
A recent systematic review further highlights the broadening application of visualization in finance. Du et al. (2025) surveyed visualization approaches aimed at improving financial literacy and decision making, emphasizing how visual design principles can support not only expert analysis but also public understanding of financial risk and investment. This underscores the expanding role of visualization in both professional and educational financial contexts, complementing operational systems such as Multiviz with evidence from the domain of financial literacy.
Given this landscape, it becomes clear that an effective financial visualization solution must:
-
(1)
support real-time updates and responsiveness,
-
(2)
scale to high dimensional data while preserving interpretability,
-
(3)
allow rapid anomaly detection and comparison, and
-
(4)
align visual structure with domain specific decision tasks.
The design of Multiviz addresses these needs through employing a hierarchical enhanced treemap based structure which is coupled with visual agents guiding attention. It takes the cognitive burden away from manual data scanning toward perception driven insight. This transition is becoming increasingly necessary as financial operations move toward automation assisted human oversight.
Treemaps and hierarchical visual encodings
Treemaps are space filling visualization techniques designed to represent hierarchical structures using nested rectangles, where each rectangle encodes a data item and its size and color represent one or more quantitative attributes. First introduced by Shneiderman (1992), treemaps have proven useful in domains with dense, multilevel data requiring efficient screen utilization, such as file systems, system monitoring, and stock market summaries.
Initial treemap layouts, such as the “slice and dice” method, produced long, thin rectangles that hindered interpretability and comparison. This limitation prompted the development of squarified treemaps, which improved readability by ensuring more balanced aspect ratios (Bruls, Huizing & van Wijk, 2000). Other innovations followed, including strip, pivot, and ordered treemaps, each balancing competing design goals: maintaining item order, improving rectangle shape, or stabilizing layouts during updates (Elmqvist & Fekete, 2010; Van Wijk & Van de Wetering, 1999; Scheibel et al., 2020). Building on these foundational refinements, recent work has increasingly explored how treemap variants can address the challenges of temporal dynamics, anomaly detection, and cognitive optimization in high frequency environments.
Recent advances have also investigated hierarchical visualization of temporal data streams. For example, Meng et al. (2025) introduced ChronoDeck, a visual analytics framework designed for hierarchical time series analysis, which enables scalable exploration of multilevel temporal structures while preserving hierarchical context. This work reflects a broader trend of enhancing hierarchical visual encodings with temporal awareness, reinforcing the relevance of treemap based approaches for financial data characterized by both hierarchy and rapid change.
Despite these advances, the adoption of treemaps in operational financial systems has historically remained limited. Early implementations, such as SmartMoney’s Map of the Market, demonstrated the appeal of using treemaps to visualize sector wise stock performance with color coded returns (Wattenberg, 1999). However, these systems lacked interactivity, had delayed updates, and were largely disconnected from users’ decision workflows. Other attempts to use treemaps for portfolio composition or credit scoring faced similar issues, namely, insufficient real-time responsiveness, lack of perceptual guidance, and poor integration with user tasks.
Recent research has emphasized the value of dynamic treemap adaptations that move beyond static layouts. Animated heat treemaps were introduced to visualize evolving data access hotspots in distributed microservices architectures, demonstrating how treemaps can be extended to capture temporal dynamics and activity patterns (De Rycke et al., 2025). This illustrates the continuing relevance of treemap variants for monitoring time evolving, high frequency environments, reinforcing their suitability for financial contexts where anomalies and trends unfold rapidly.
One critical limitation of traditional treemaps is their semantic neutrality. They represent all items visually, but without embedded intelligence to indicate relevance or urgency. In high stakes domains such as financial trading, users require more than compact structure. They need interfaces that guide attention, prioritize anomalies, and help them parse and assimilate complexity. This has led to the emergence of hybrid systems that combine treemaps with task aware agent models or enhanced visual analytics mechanisms.
For example, treemap variants are proposed that adapt based on semantic constraints or dynamic reordering strategies (Vernier, Burch & Weiskopf, 2020). Another study integrated financial indicators into interactive layouts with user-adjustable filters (Carvalho, de Oliveira & Campos, 2016). However, these systems usually remain limited to static or semi dynamic contexts, lacking robust real time architecture and fine grained attentional cues (Balzer, Deussen & Lewerentz, 2005; Limberger et al., 2023). Additional recent work has compared treemaps with alternative hierarchical visualizations in terms of efficiency and usability. A recent work evaluated circle packing, treemaps, and network graphs for ontology relationship tasks, using both task accuracy and usability measures (Maukar, 2025). The results showed that treemaps offered the fastest completion times and highest usability scores, while circle packing achieved higher accuracy but suffered from lower usability. These findings reinforce the value of treemaps for contexts requiring efficiency and scalability, while also highlighting the importance of perceptual and interaction design trade-offs.
In parallel, treemap literacy was investigated through a constructivist classroom intervention, comparing a Treemap only interface with a coordinated Node-Link + Treemap design (Firat et al., 2025). Their findings indicated that students who directly engaged with treemaps developed stronger interpretive skills than those using the combined view, suggesting that treemaps themselves can provide sufficient scaffolding for comprehension when designed carefully. This reinforces the argument that treemaps, when perceptually optimized, can serve as both effective analytical tools and pedagogical instruments, aligning with Multiviz’s emphasis on self explanatory, cognitively efficient treemap designs.
Taken together, this body of research shows a trajectory from foundational treemap designs toward increasingly sophisticated adaptations that integrate temporal dynamics, semantic guidance, anomaly detection, and usability considerations. Multiviz extends this trajectory by adopting a squarified treemap layout optimized for real-time performance, embedding multi variable glyphs, and integrating a rule based agent layer that enhances perceptual salience. In doing so, it combines visual scalability, responsiveness, and cognitive optimization in ways not addressed by prior systems, particularly in the context of high frequency financial trading.
In addition to the basic treemap rendering, Multiviz incorporates a smart agent layer that enhances treemap regions based on context sensitive triggers. Developed agents monitor live data streams. When detecting relevant events such as anomalies, threshold breaches, or volatility spikes, they modify the visual appearance of the corresponding rectangles using perceptual cues (e.g., brightness modulation, edge emphasis). This changes the treemap from a passive structure into an interactive attention guiding system supporting rapid orientation and decision making.
By addressing the perceptual challenges of traditional treemaps alongside the operational demands of real time financial environments, Multiviz contributes a hybrid visualization model combining layout stability, semantic awareness, and user-centered responsiveness.
Cognitive optimization and attention-guiding interfaces
Effective visual interfaces must do more than simply present data. They must align with the user’s perceptual and cognitive capabilities. In high-stakes domains such as financial trading, where decision speed and accuracy are critical, most users are often overwhelmed by the volume and volatility of information. Traditional tabular or chart based layouts provide flexibility and the ability to drill down further, but they require high visual effort and manual synthesis. This leads to suboptimal decisions due to pressure where time is critical.
The field of cognitive optimization in visualization focuses on minimizing this mental burden by designing displays that support preattentive processing, reduce visual search time, and lower working memory load (Card, Mackinlay & Shneiderman, 1999). As early as the 1980s, Julesz (1981) demonstrated that certain visual features, such as color, orientation, and spatial proximity, are processed by the human visual system with minimal effort, enabling rapid detection of outliers and groupings. More recently, Franconeri et al. (2021) emphasized the importance of leveraging these perceptual channels in complex multivariate displays.
Other contemporary efforts have also introduced novel visualization metaphors designed specifically for anomaly signaling and early warning. Wu et al. (2025) proposed the Bubble-Wall Plot, a dynamic analytical processing visualization tool that serves as a visual warning system for anomaly detection tasks in complex data environments. This work underscores the importance of perceptually salient, easily interpretable cues in financial early warning systems, aligning closely with Multiviz’s use of rule based agents and visual emphasis to draw user attention to emergent anomalies.
Interfaces following such principles try to make important patterns “pop out” automatically to the user, eliminating the need for exhaustive scanning. Tufte (2001) indicates it is possible to transform dense numerical data into intuitive visual structures and improve decision clarity.
For example, using consistent spatial layouts, color to indicate magnitude or directionality, and size to represent importance enables users to perform visual inference. Inferences such as drawing conclusions directly from perceptual patterns instead of through manual calculation or cross referencing become possible. This approach is particularly valuable in financial contexts where users should track dozens of critical variables across instruments, sectors, and time windows simultaneously.
Conventional table or spreadsheet based tools are limited in this regard. They rely on serial data inspection, demand short term memorization, and impose frequent context switches. In contrast, cognitively optimized interfaces structure information spatially and semantically, allowing users to visually prioritize, compare, and filter without shifting mental context.
This brings the concept of attention guiding interfaces to mind described as a class of systems that use visual cues and interaction design to direct the user’s focus toward the most relevant information. These cues can be passive (e.g., color saturation, border emphasis) or active (e.g., animation, dynamic reordering). While such systems do not completely replace user control, they reduce the burden of decision critical navigation. It is anticipated that the current status of artificial intelligence tools may further enhance attention guiding capabilities, which is left as a future study.
This principle is related to the broader idea of mixed-initiative interfaces, originally proposed in the human–computer interaction literature, but also has important differences (Horvitz, 1999). In full fledged mixed initiative systems, the machine models user intent, intervenes adaptively, and engages in a collaborative workflow. Examples include intelligent assistants, dialogue systems, or predictive recommendations.
Multiviz adopts a lightweight form of this principle. Rather than learning or predicting user behavior, it employs rule based visual agents that monitor live financial data streams. These agents are configured with domain specific thresholds and conditions (e.g., a firm’s CDS spread increasing while its interest coverage ratio drops below a critical value). When such patterns are detected, the agent layer triggers non intrusive visual cues, such as brightness highlighting, border thickening, or gentle animation, within the treemap interface. This allows the system to direct user attention toward emergent anomalies without interrupting the user’s flow or removing agency.
This mechanism transforms the interface into a form of cognitive scaffold, a visualization adapting in real time to guide sense-making under complexity. The goal is not to completely replace user decision making and automate. The actual goal is to amplify perception and reduce unnecessary visual work. In this way, Multiviz integrates the cognitive optimization principles of visual structure, stability, and preattentive encoding with a task aware, agent enhanced display system.
Multiviz embeds these capabilities directly into the layout engine instead of relying on alert panels or external notifications. It ensures that the most critical data becomes visually dominant within the user’s natural field of view, reducing the need for serial scanning or manual filtering. This design choice is critical in trading environments, where reaction time and clarity are critically important and where attention is a scarce cognitive resource.
Eye-tracking for visual interface evaluation
Eye-tracking has been in use as a valuable tool in the evaluation of visual interfaces. It offers insights into how users interact with complex data displays. By recording gaze patterns, fixation points, and saccadic movements, researchers can infer how attention is distributed across the interface and which elements users engage with most. While eye-tracking is often used in cognitive psychology to estimate workload or stress, its application in interface evaluation is generally focused on assessing visual efficiency, layout effectiveness, and usability.
In the context of financial systems, eye-tracking has received limited but growing attention. Studies such as Carvalho, de Oliveira & Campos (2016) and Alsayani et al. (2025) have shown that gaze data may help reveal whether users are overloaded by visual complexity, misdirected by suboptimal layouts, or aided by perceptual grouping and focus mechanisms. These works generally emphasize that effective visual interfaces naturally direct user attention to the most critical information, minimizing the time and effort required for manual searching.
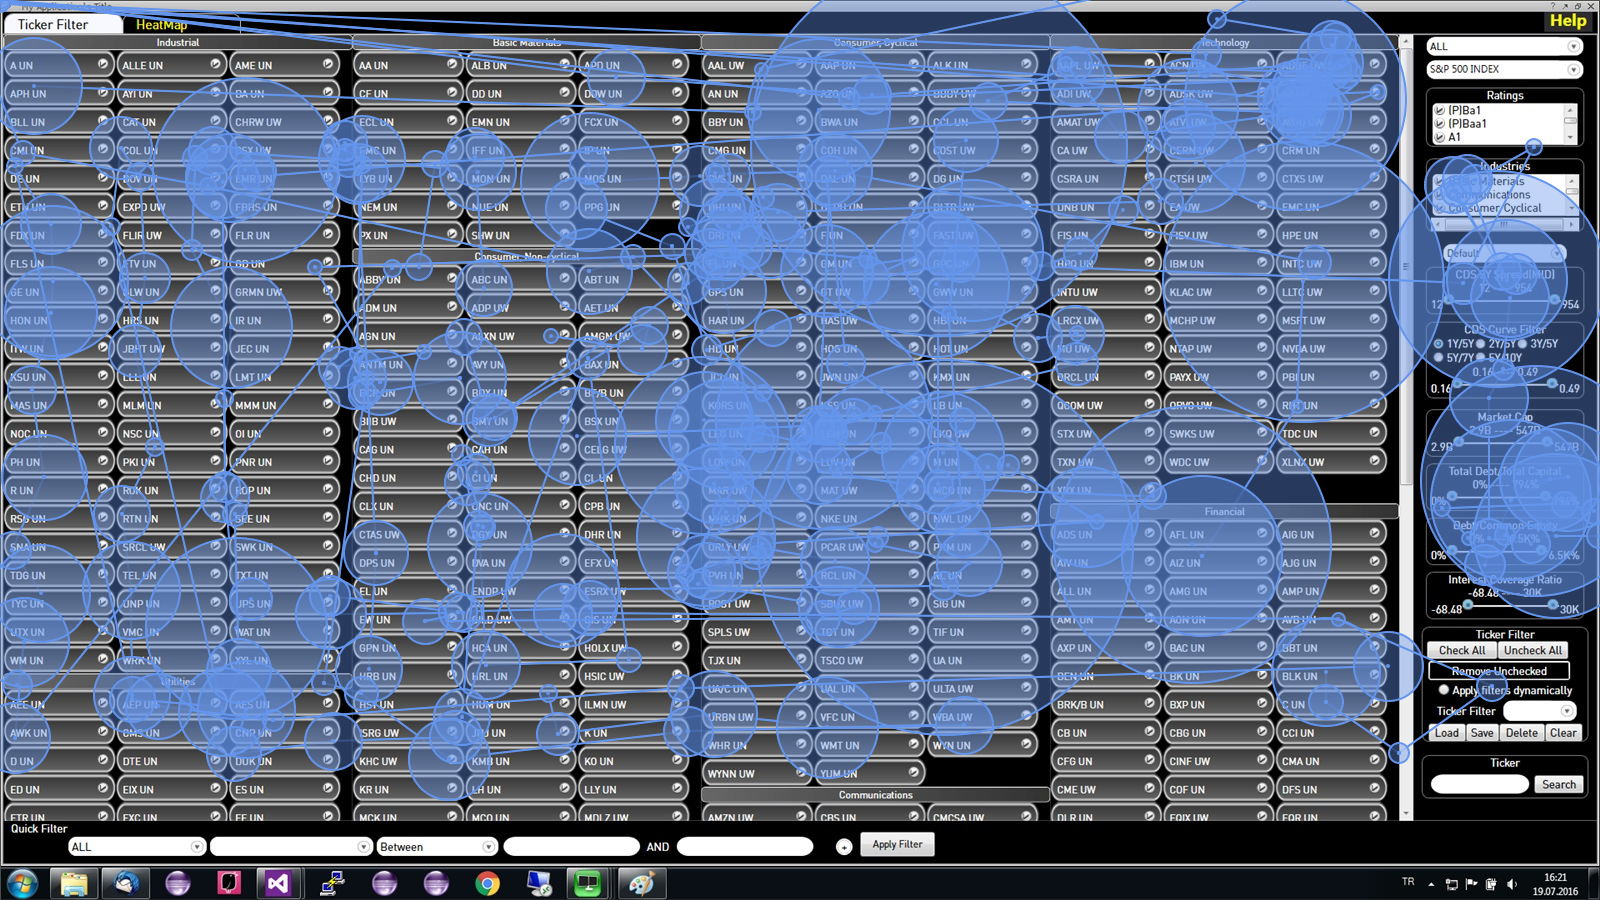
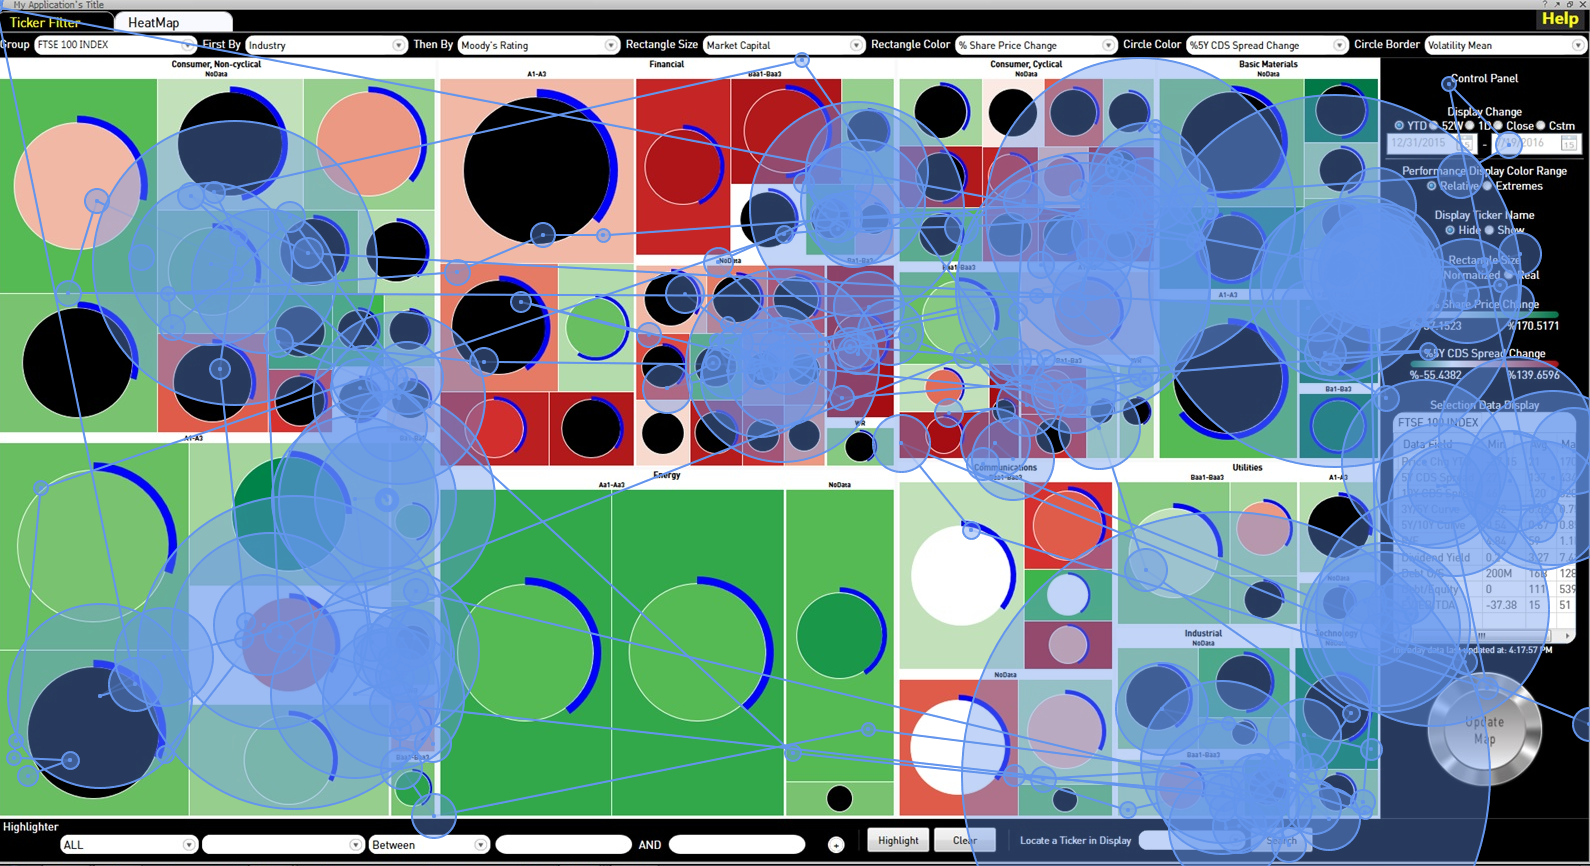
In the present study, eye-tracking was employed in both a measurement and observational capacity. The goal was to compare gaze behaviors between users interacting with the Multiviz interface and those using a conventional table based layout. Gaze heatmaps, scan paths, and fixation clusters were used to identify high level differences in visual search strategies and attention allocation. Typical layouts showing heatmaps from the experiment depicting treemap and tabular style screens used are given in Fig. 1.
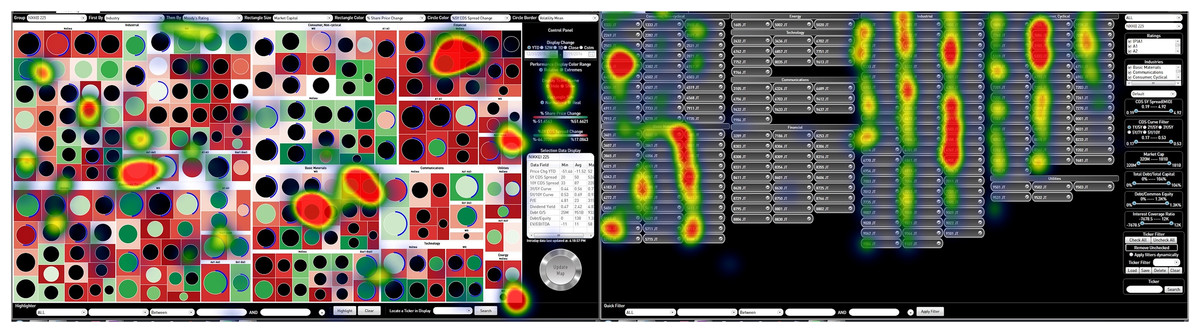
Figure 1: Gaze behavior comparison heatmap.
(A) Multiviz interface with round elements and treemap grouping. (B) Legacy tabular-like interface with rectangular button layout.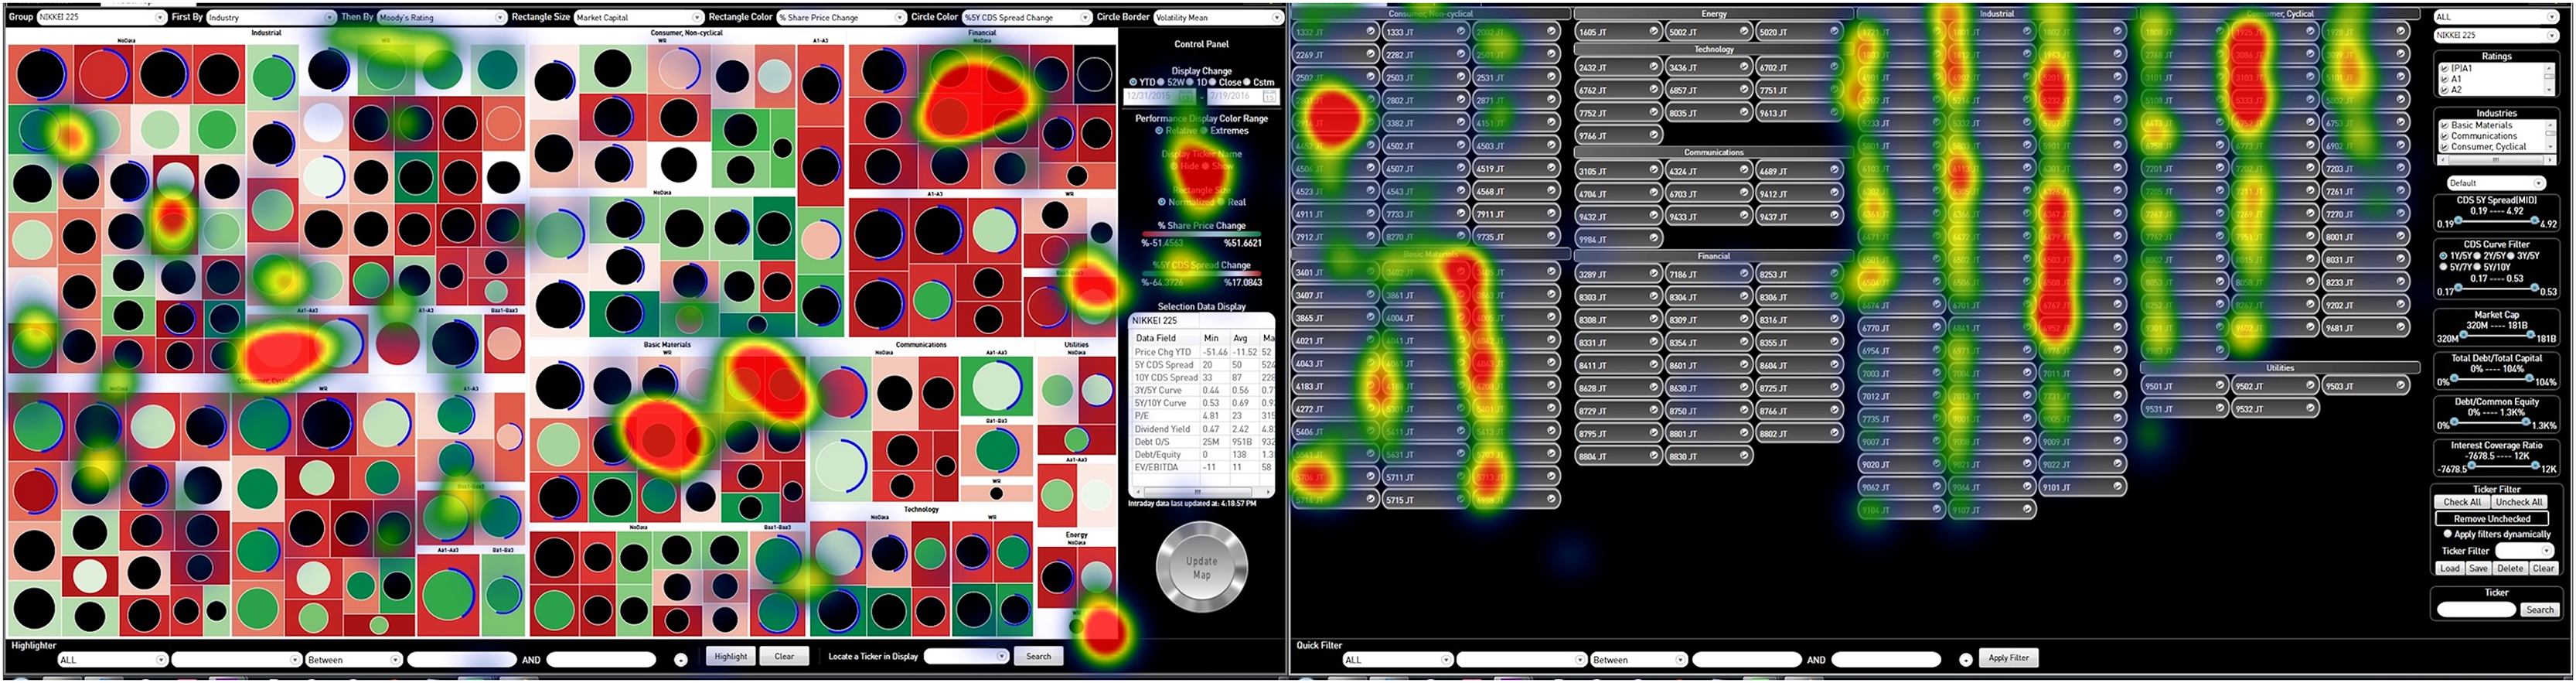
It is important to emphasize that eye-tracking always provides supplementary evidence. These results complement more traditional performance metrics such as task completion time and error rate by offering an additional layer of insight into how users experience and navigate the interface. More granular gaze analytics for each element (e.g., fixation duration distributions, transition matrices, or attention entropy) could generally further quantify the impact of interface design on cognitive effort.
The development of Multiviz was evaluated through controlled eye-tracking experiments, comparing it to a baseline Excel interface using realistic financial analysis tasks. Eye-tracking in this study served as a diagnostic tool, reinforcing that Multiviz’s structured layout and visual guidance mechanisms align with natural attentional strategies. This supports the broader system goal of making complex financial information more accessible, interpretable, and actionable.
System design: multiviz architecture
Overview
The Multiviz system was designed to meet the real-time cognitive and operational demands of financial analysts by providing a perceptually optimized, intelligent, and responsive data visualization interface. The architecture employs a layered design that integrates data acquisition, visual structuring, and cognitive support mechanisms, enabling seamless monitoring of multidimensional financial information. Multiviz is designed to operate within the Bloomberg Terminal™ framework for data acquisition and deployment.
The system comprises three primary layers:
-
(1)
Visual data layer: Responsible for data mapping, layout generation, and rendering of treemaps and visual encodings.
-
(2)
Smart agent layer: Monitors incoming data streams in real time, applies rule based logic to detect significant patterns or anomalies, and triggers visual emphasis operations.
-
(3)
Interaction and navigation layer: Manages user interface controls, filters, and navigational interactions, allowing users to manipulate focus, apply constraints, or explore data hierarchies interactively.
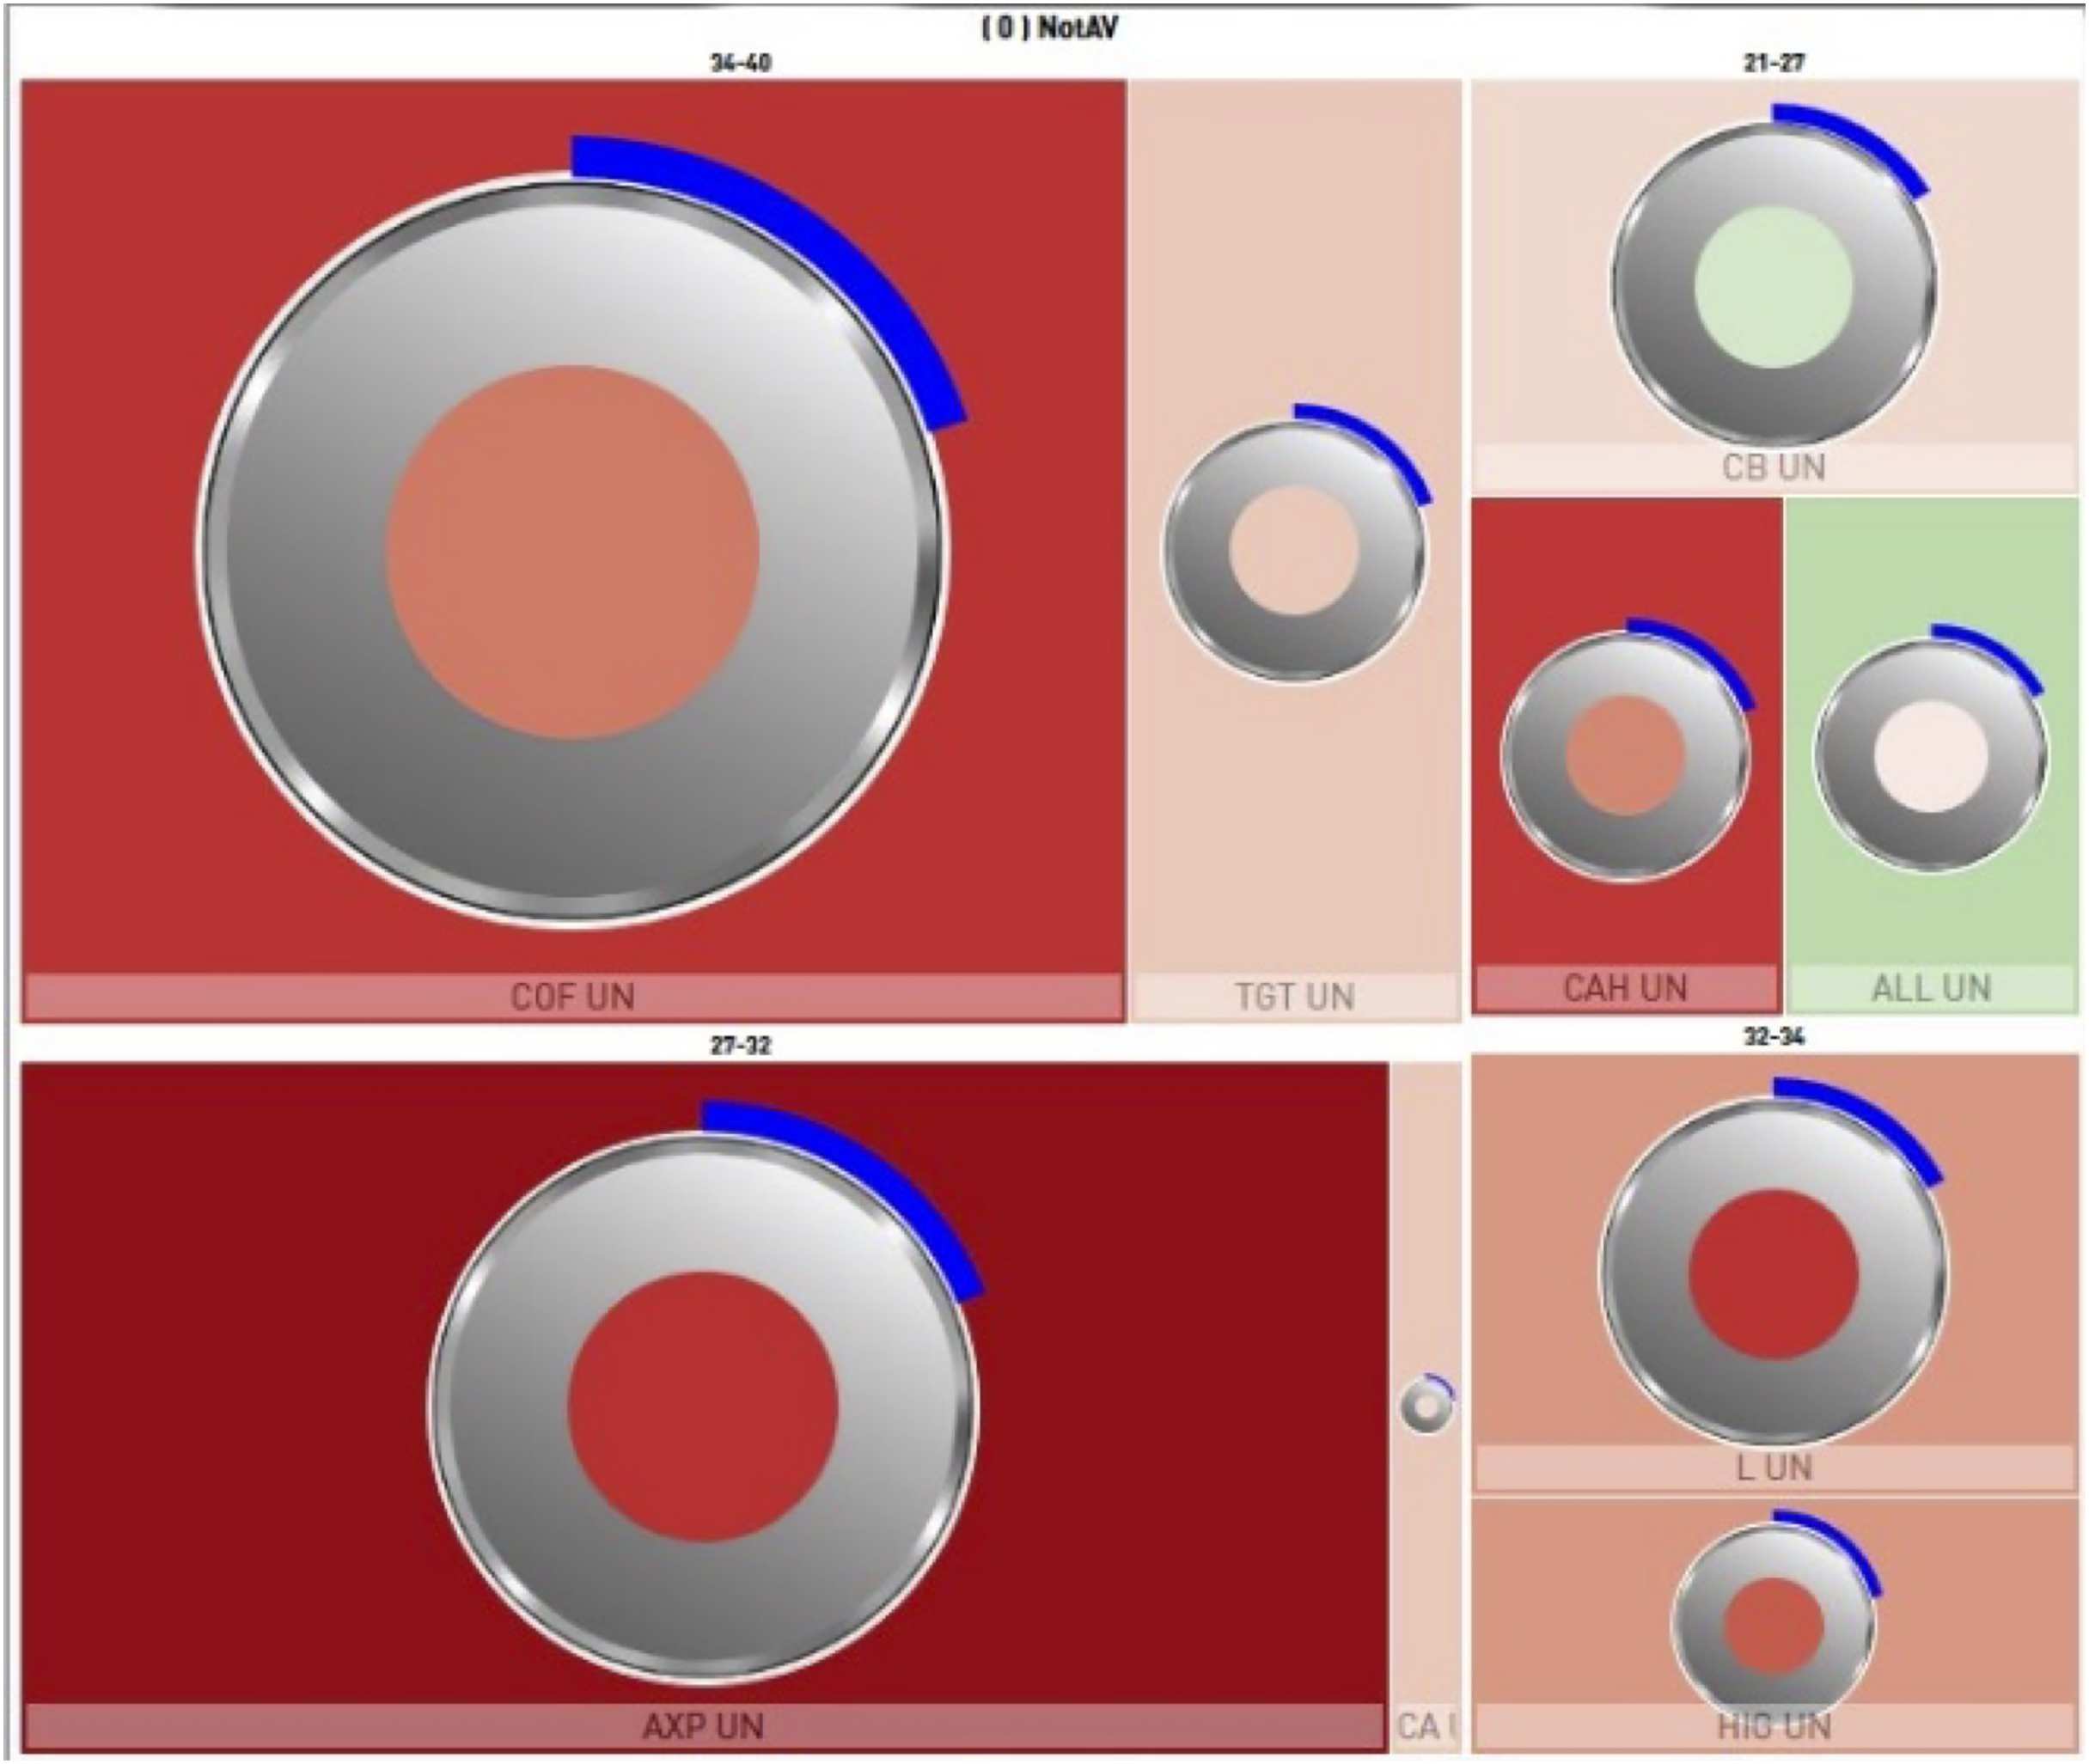
These components work together to transform raw financial data into an interactive visual workspace where structure, priority, and change are encoded both visually and semantically. The overall architecture of Multiviz is depicted in Fig. 2, illustrating the relationship between data ingestion, smart agent evaluation, and visual rendering.
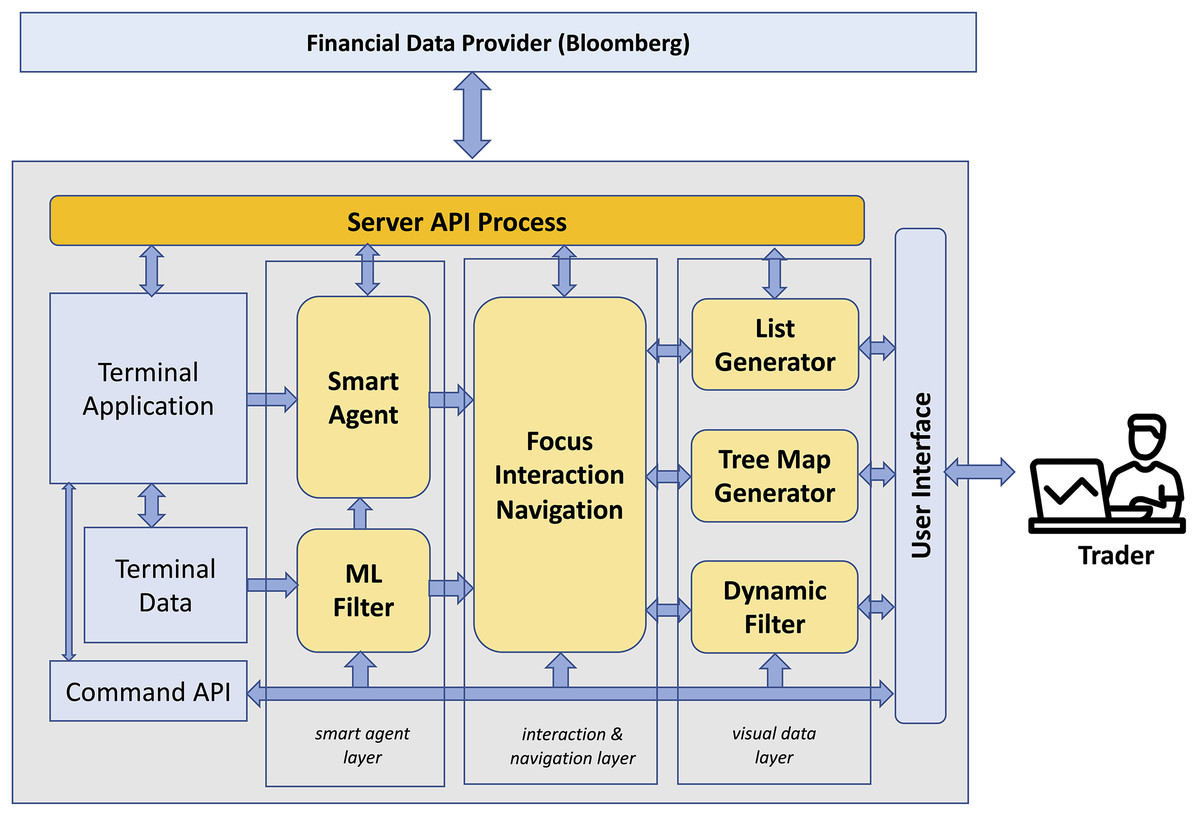
Figure 2: Multiviz architecture.
Icon credit: Free icon library at http://vecteezy.com.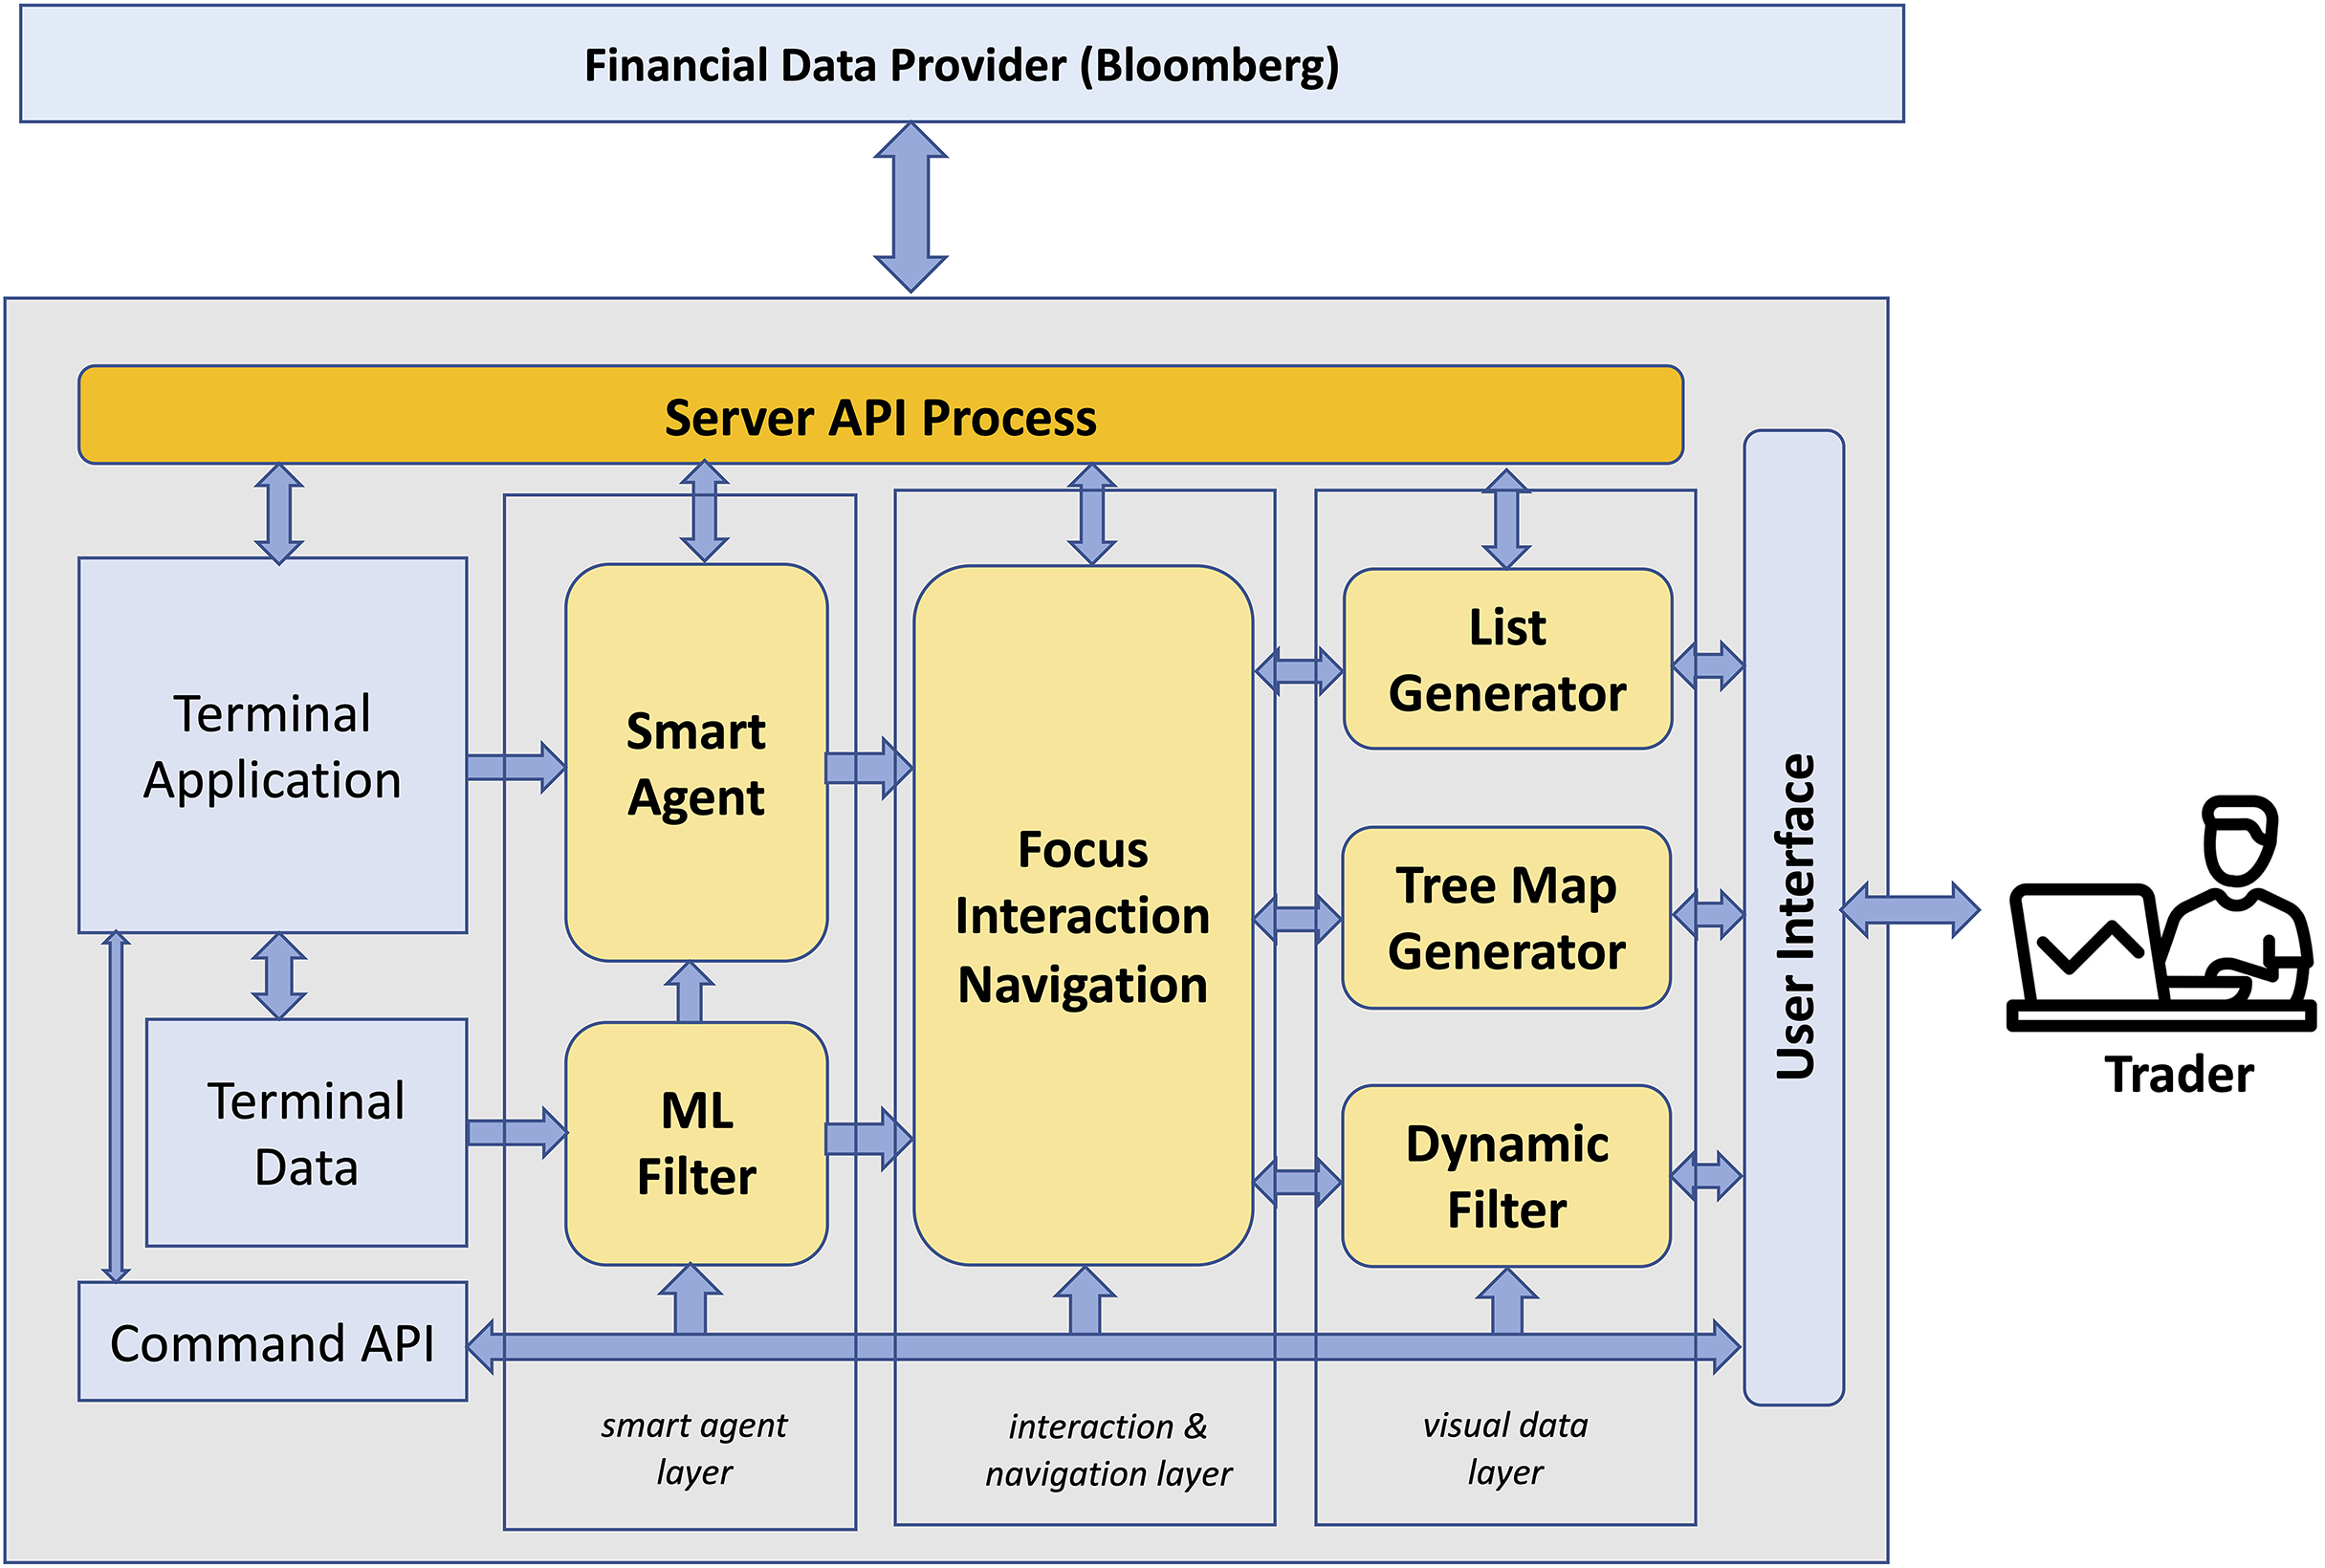
The Multiviz architecture consists of three layers that operate together in real time. Financial data is ingested through the Bloomberg application programming interface (API) and passed to the visual data layer for treemap generation and attribute encoding. The smart agent layer continuously evaluates incoming values against predefined rules and triggers visual emphasis cues when relevant conditions are met. The interaction and navigation layer provides filtering, drill-down, and control mechanisms, enabling users to explore and interpret high-density financial data efficiently.
Visual data layer
The visual data layer is responsible for converting complex, real-time financial data into perceptually coherent visual structures. Serving as the core of Multiviz, this layer handles data driven layout generation, attribute encoding, and screen rendering. It is designed to support high frequency data updates and visual scalability, accommodating dozens of financial indicators across hundreds of entities without sacrificing readability in the terminal. It includes a list view generator, treemap generator, dynamic filters, and other standard user interface rendering components.
Hierarchical representation and layout
At the core of the visual structure is a squarified treemap layout algorithm, chosen for its ability to maintain low aspect ratios and preserve visual comparability between nodes. Each treemap node represents a financial entity, such as a company, sector, or instrument, and the hierarchical structure reflects domain taxonomies (e.g., “sector → rating class → firm”). The layout maintains spatial consistency over time, enabling users to develop spatial memory and quickly return to familiar regions of interest.
To handle incoming Bloomberg financial real time data, the layer uses a layout caching mechanism. When incoming data affects only attribute values (e.g., color or size) but not the structure (e.g., sector membership), the layout engine retains rectangle positions, updating only the affected encodings. This ensures a stable visual field and reduces disorientation caused by constant reshuffling which is a limitation observed in early treemap applications.
Visual encoding of financial attributes
The visual glyphs in a typical Multiviz interface are designed to encode up to nine distinct variables simultaneously, enabling dense information display without overloading the user. Accommodated within the treemap structure, each treemap tile functions as a composite perceptual unit, layering multiple encodings such as geometric form, color, label, icon, and numeric overlay to support quick, parallel interpretation, as shown in Fig. 3.
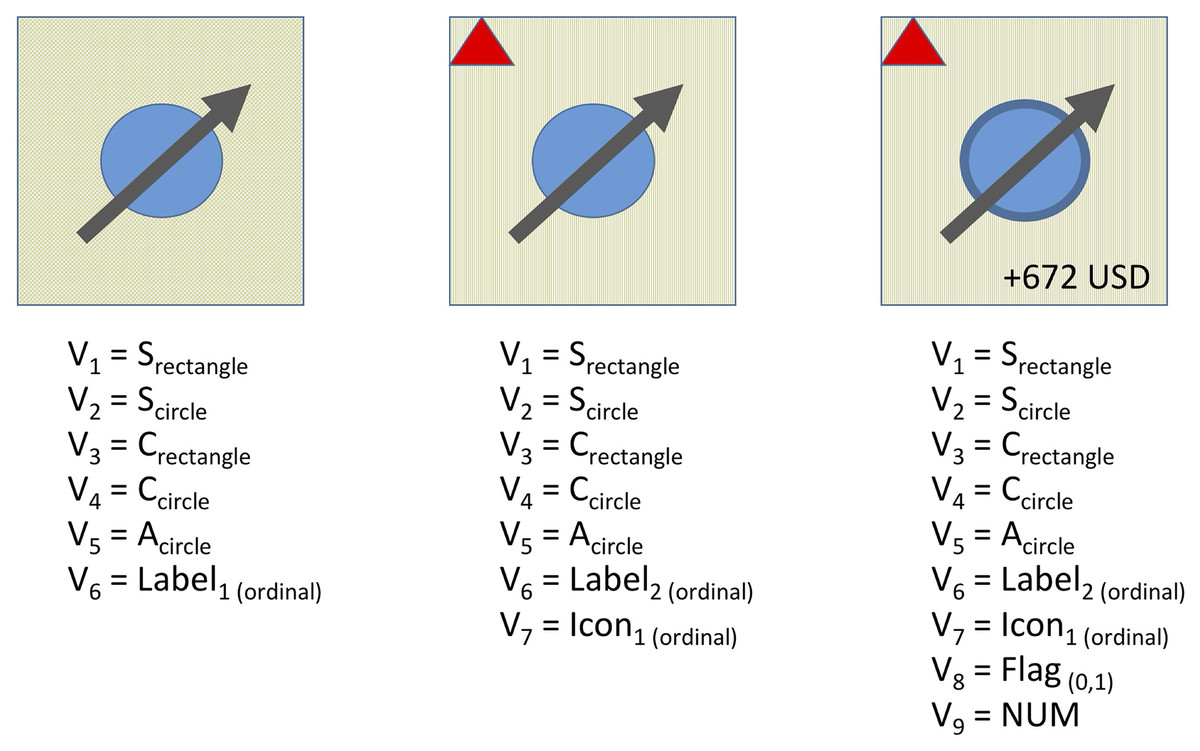
Figure 3: Multivariate glyph design showing the encoding of nine financial variables in a single visual unit.
• v1: rectangle size (e.g., market cap) • v2: circle size (e.g., risk exposure) • v3: rectangle color (e.g., share price change) • v4: circle color (e.g., volatility class) • v5: circle area texture (e.g., rating stability) • v6: text label (e.g., firm name or rating) • v7: icon (ordinal, e.g., trend arrow or alert symbol) • v8: binary flag (e.g., warning triangle indicating rule violation) • v9: overlaid numeric value (e.g., yield or return delta).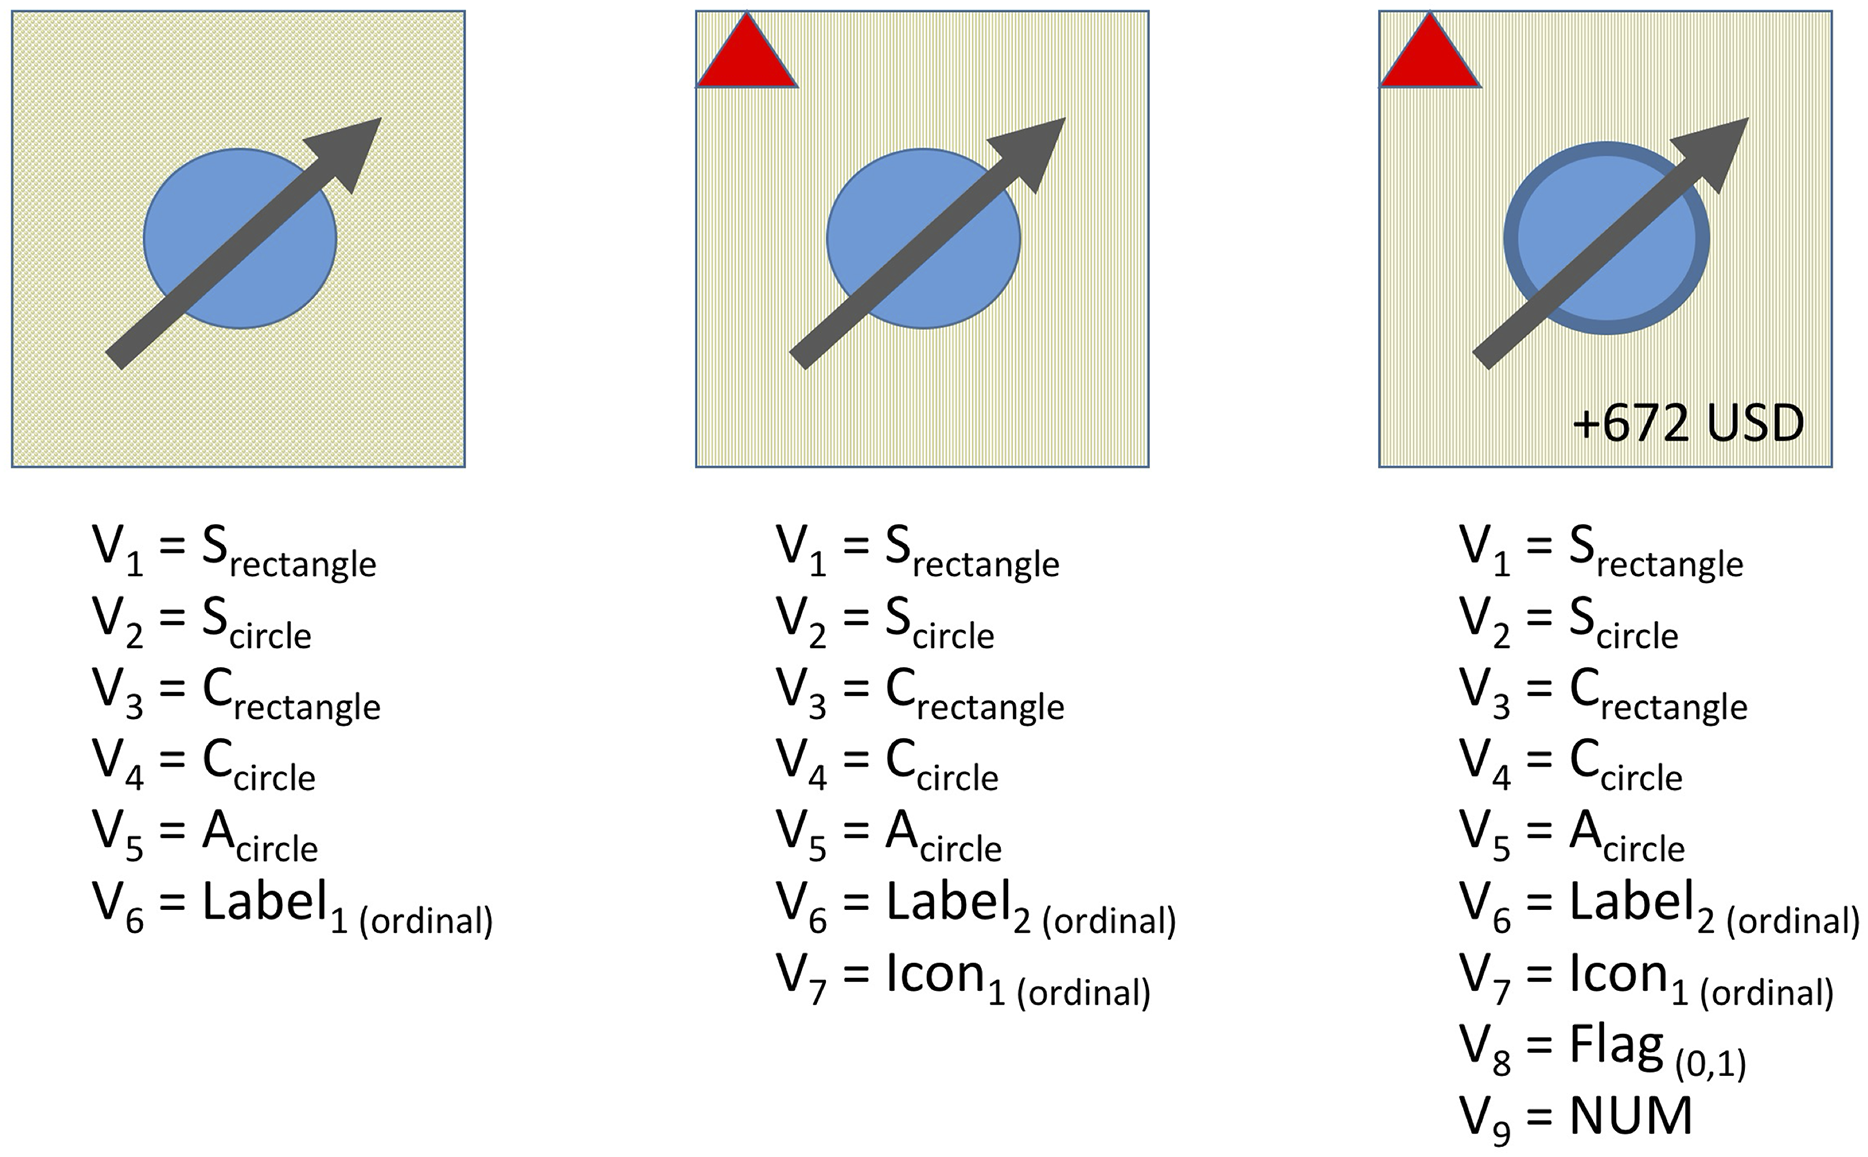
Variables include:
v1: rectangle size (e.g., market cap)
v2: circle size (e.g., risk exposure)
v3: rectangle color (e.g., share price change)
v4: circle color (e.g., volatility class)
v5: circle area texture (e.g., rating stability)
v6: text label (e.g., firm name or rating)
v7: icon (ordinal, e.g., trend arrow or alert symbol)
v8: binary flag (e.g., warning triangle indicating rule violation)
v9: overlaid numeric value (e.g., yield or return delta)
The layered encoding strategy allows users to interpret multiple dimensions without additional navigation or clicking. It performs this by embedding semantic cues directly into the visual representation, reducing the need for external legends or modal popups, and allowing for faster cognitive parsing of the interface. Such multi channel glyph design follows established visualization principles, such as those described by Bertin (1983) and Cleveland & McGill (1984), emphasizing parallel, non conflicting visual mappings (Friendly, 2006).
Each treemap node encodes multiple attributes using a combination of visual channels, such as:
Rectangle size: Market capitalization or total outstanding debt
Rectangle color: Direction and magnitude of share price or CDS change
Circle color (overlaid): Volatility or risk-class value
Circle border: Spread behavior or external score (e.g., rating outlook)
Brightness and texture (triggered by agents): Used to emphasize or de-emphasize nodes dynamically
Visual glyph: Supplementary shape, arrow, and text as options
The encodings were selected based on perceptual research emphasizing separable channels to avoid cognitive interference and ensure rapid attribute differentiation (Bertin, 1983; Cleveland & McGill, 1984).
This design aligns with established principles of visual perception and encoding separability, ensuring that users can rapidly interpret the state of each entity. By embedding both semantic value and interaction cues directly into the shape, external lookup requirements are minimized, supporting fast, context-rich comparisons across the treemap.
Furthermore, the display adapts to zoom levels and viewport size, automatically rescaling visual elements to preserve interpretability as an additional feature.
Update mechanism and rendering performance
Financial data is streamed into the system via a data ingestion module that connects to structured data sources (e.g., SQL-based financial feeds or APIs). In this study, the Bloomberg API was used to retrieve data within the Terminal framework. Each record is parsed and pushed into the rendering pipeline with a maximum update interval of 200–300 ms, depending on system load. This provides real time perception to the user. To minimize frame drops or interface lag, the system uses incremental update queues and batched rendering for grouped changes. The information architecture of this mechanism is shown in Fig. 4.
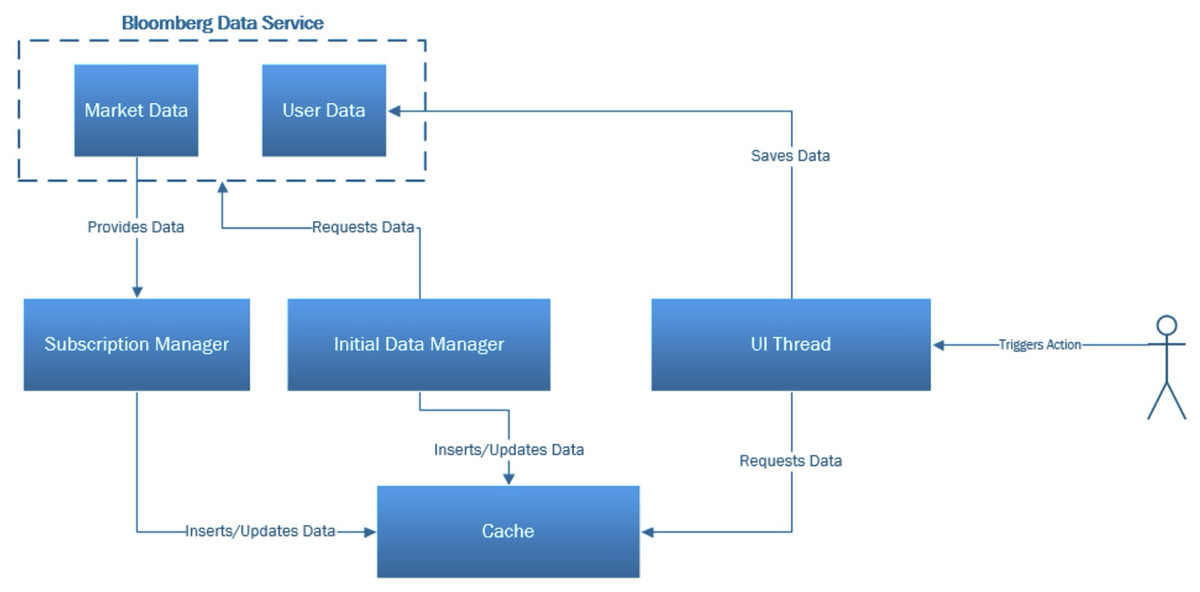
Figure 4: Data flow from market data server.
The rendering engine is built using a custom graphics library, allowing Multiviz to maintain consistent update rates even under high variable update loads which is a crucial requirement for real-time trading environments.
Smart agent layer
The smart agent layer in Multiviz acts as a domain aware, rule driven component that actively monitors the financial data stream and modifies the visual interface in real time to support attention guidance and anomaly detection. Unlike traditional alert systems that rely on external notifications or intrusive pop-ups, this layer enables the interface itself to react dynamically to context changes and financial market signals.
Agent design and rule framework
Each agent in the system is implemented as a lightweight module associated with a financial entity or group, such as a firm within a sector. Agents subscribe to specific variables like CDS spread changes, interest coverage ratios, volatility scores, or credit ratings, and continuously check these based on predefined logical conditions.
For example, a basic rule might be:
“Trigger if CDS spread increases by over 20% while the interest coverage ratio falls below 1.5.”
More complex agents support multivariable rule chaining, threshold crossing detection, and Boolean logic such as “AND”, “OR”, “NOT” (Fernandes & Garcia, 2012). The rules are derived from domain knowledge provided by analysts and regulatory experts, ensuring that triggered events align with real-world financial heuristics.
Upon detecting a rule match, the agent emits a signal to the Visual Data Layer, which responds by updating the affected element’s encoding (such as changing its border color or increasing its brightness). It can also initiate a short visual animation (e.g., pulse or glow).
A sample agent rule can be expressed in the following pseudocode:
// Agent Rule: Detect credit stress scenario
IF (CDS_5Y_CHANGE > 0.2) AND (InterestCoverageRatio < 1.5) THEN
TriggerAlert(
TargetNode,
VisualEffect = “pulse_border”,
Priority = “high”
)
This rule continuously monitors the 5-year CDS spread change and interest coverage ratio for a financial entity. If the CDS increases by more than 20% and the firm’s coverage ratio falls below 1.5, a high-priority visual alert is triggered using a border pulse effect. Rules can be extended with OR, NOT, and nested conditions for more complex monitoring strategies.
Visual emphasis without interruption
A key design principle of the smart agent layer is non intrusiveness. Rather than interrupting the user or masking the data with overlays, agents enhance existing visual properties to steer user attention naturally. This attention steering technique is based on literature in visual cognition and human–computer interaction (HCI). Subtle but perceptually salient changes, such as motion, contrast, or brightness shifts, are more effective and less cognitively disruptive than modal alerts (Franconeri et al., 2021; Julesz, 1981). Multiviz incorporates visual emphasis and additional channels on enhanced treemap design as shown in Fig. 5.
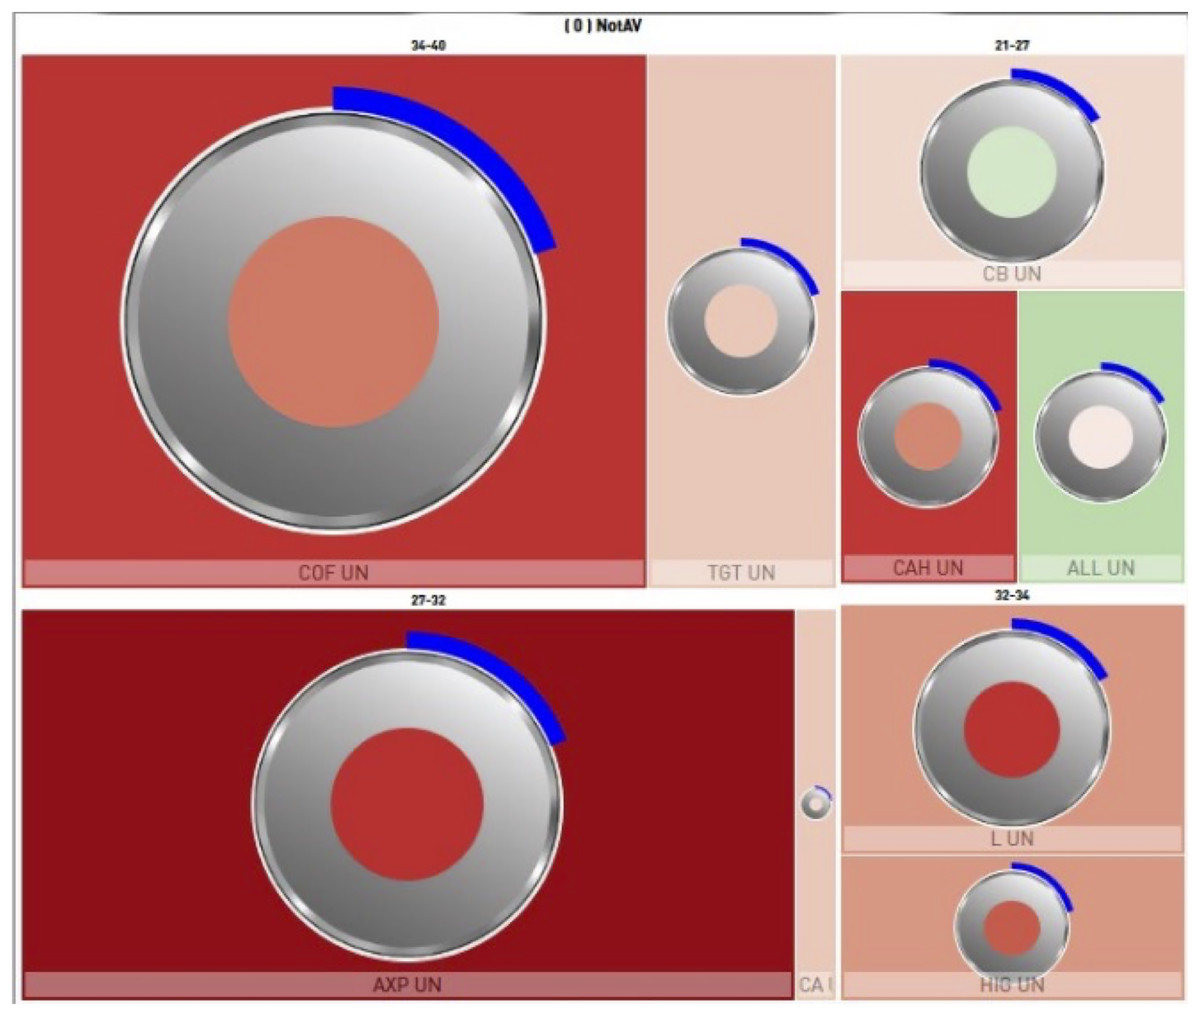
Figure 5: Visual emphasis and additional channels on tree-map.
Visual cues used by agents include:
Pulse highlighting: temporal glow around a tile’s border
Brightness emphasis: increased luminance of the target rectangle
Motion cues: oscillation or bounce effect to signal volatility
Color shift: saturation change to encode anomaly severity
These cues are layered carefully to avoid over salience, especially in dashboards where multiple agents may be triggered simultaneously. A priority queuing mechanism ensures that the most critical alerts are visually dominant, while others are subdued or stacked using layered overlays.
Agent lifecycle and feedback integration
Agents operate on a “subscription–evaluation–response” loop. At initialization, each agent registers interest in a subset of variables from the incoming data stream. When a data update is received, the agent evaluates its rule set. If a trigger condition is met, it communicates with the visual layer and records the event in a log for optional user feedback.
Users can enable or disable individual agent types, adjust thresholds, and even define custom rules using the rule maker tool. This configurability makes the system flexible for various user profiles. For example, analysts focused on credit risk can prioritize “CDS-linked” triggers, while equity traders can emphasize stock volatility and short interest movements.
The current version of Multiviz uses static rule definitions; however, future extensions may include adaptive agents that can learn from user interactions or incorporate predictive modeling through active use of artificial intelligence (AI)-based data analytics approaches.
Interaction and Navigation layer
The interaction and navigation layer provides user facing functionality for exploration, filtering, and manipulation of the data visualizations. As the visual data layer presents a perceptually optimized snapshot of the current state of financial instruments and the smart agent layer selectively guides user attention, the interaction layer ensures that users remain in control, dynamically tailoring the interface to match their informational needs and decision contexts. Dynamic features reduce visual clutter and support real-time decision making (Biedert, Schwarz & Roth-Berghofer, 2008).
Filtering and focus tools
A main feature of the interaction layer is the dynamic filter panel, allowing users to apply threshold constraints or value ranges across multiple financial variables. For example, a user may choose to display only firms with CDS spreads above a certain percentile or filter by sector, market capitalization, or risk classification.
Filters are applied in real time using progressive disclosure principles. Non-matching entities are visually faded rather than removed, preserving the spatial continuity of the layout and preventing disorientation. This approach enables users to focus on relevant subsets while still maintaining awareness of the global context.
The filtering panel supports:
Slider based numerical filters (e.g., CDS > 300 bps)
Multi select categorical filters (e.g., Sector ∈ {Energy, Finance})
Search box for firm codes or tickers
Preset filters for common scenarios (e.g., “High Volatility + Low Coverage”)
Zoom, pan, and drill-down navigation
As offered in many other visualization systems, Multiviz supports multi level hierarchical navigation, enabling users to move between sector, firm group, and individual firm views. A “click-to-zoom” mechanism allows users to drill into a cluster (e.g., a specific rating class within a sector), upon which the layout smoothly transitions to display a finer level of detail. The breadcrumb trail interface at the top of the screen reflects the current navigation path and allows users to jump back to higher level groupings.
Users can also pan across the layout, either using click drag interaction or keyboard controls, especially when viewing treemaps containing hundreds of entities. Smooth zoom transitions and layout stability provide perceptual continuity across navigation actions. This is a key requirement in decision-critical environments (Schlechtweg, Schulze-Wollgast & Schumann, 2004).
Custom rule application interface
For advanced users, the interface includes a visual rule editor, enabling the creation and testing of custom agent rules without direct coding. This tool empowers analysts to encode domain-specific logic and adapt the system to emerging market scenarios without needing developer intervention. All defined rules are stored in user profiles and can be activated, deactivated, or prioritized using toggle switches.
Interaction design principles
Throughout the interface, interaction mechanisms were designed according to the following principles:
Non-intrusiveness: Interactions should never occlude critical data or break visual flow.
Continuity and context preservation: Layout stability is maintained during all interactions.
Responsiveness: All actions, from filtering to navigation, are processed with sub-300 ms latency.
Progressive engagement: Novice users can explore the interface at a surface level, while experts can drill deeper through custom rule sets and advanced filters.
By empowering users to navigate complexity, focus on relevance, and encode their own domain knowledge, the interaction and navigation layer makes Multiviz not only a visualization, but a cognitively aligned analytical workspace.
Machine learning based parameter filtering
The number of traditional variables received from the Bloomberg data server exceeds 30. Although all are considered important and are thus offered through terminal services, traders usually focus on certain parameters frequently and monitor those closely, while other parameters are examined infrequently. To determine which parameters are most significant for continuous display, a simple machine learning algorithm was used and results were analyzed.
To reduce the number of parameters displayed in real time to about 5 or 6, a user study was conducted using the traditional system. A machine learning based selection process was performed to identify a usable data filtering technique and determine the five most critical features. Initially, data was collected over two days, yielding 1105 samples with 34 features for each stock, along with whether each feature was actually examined (“viewed/not viewed”) by professional traders. This constituted a classification problem with two classes: viewed (+) and not viewed (–). Given the class imbalance in this data (most features are not actively used), precision, recall, and ROC curves were used as evaluation metrics rather than accuracy alone. Several classification algorithms, including decision tree based methods (J48, jRip, PART), instance based (IBk), and ensemble methods (Bagging, RandomForest), were evaluated and produced adequate results. The decision tree and rule-based classifiers (J48, jRip, PART) performed well in terms of balancing accuracy and interpretability, and also provided short test times. As a result, these algorithms were identified as suitable for selecting the most relevant parameters for display, based on their reliable classification of viewed parameters and overall system responsiveness in near real-time scenarios.
User study with eye-tracking
To evaluate the effectiveness of the Multiviz interface in supporting rapid visual analysis of multidimensional financial data, a controlled laboratory user study was conducted. The study compared the performance and gaze behavior of participants using two different interface designs: the Multiviz system with hierarchical visual layout and smart agents, and a baseline tabular interface resembling traditional grid based displays. The primary goal was to assess whether Multiviz could improve task performance and reduce visual search effort in complex analytical scenarios.
Participants
A total of 12 participants took part in the study, all of whom were finance professionals or advanced finance students with experience in interpreting multivariable financial indicators. Participants were recruited from the Globit analyst ecosystem and had varying degrees of familiarity with both traditional grid based tools and interactive visualization systems.
Apparatus, environment, and tasks
The experiments were conducted in a controlled laboratory setting using a desktop workstation equipped with an SMI eye tracker. The system recorded gaze data at a minimum of 120 Hz sampling rate, capturing fixations, saccades, and scan paths during task execution. Screen recordings and user logs were collected.
Both interfaces (Multiviz and the baseline tabular interface) were deployed as interactive applications using the same screen dimensions and data set. Participants used a mouse and keyboard to interact with both systems, and no time constraints were enforced.
Participants were asked to perform six analytical tasks, each designed to simulate realistic use cases in financial market analysis. These tasks included:
Identifying firms with anomalous CDS behavior within a sector
Filtering companies based on multi-variable thresholds (e.g., high CDS, low coverage ratio)
Comparing volatility patterns across rating classes
Spotting sudden changes in financial health indicators
Sector level ranking based on aggregated risk metrics
Shortlisting candidates for investment exclusion based on rule violations
Each task was performed once in the baseline tabular interface and once in Multiviz, using a within-subjects design with four different markets. The task order and interface order were counterbalanced using Williams Latin Square method to mitigate learning effects among participants.
Measures and data collected
For each task and participant, the following data were collected:
Task completion time
Accuracy of the response (e.g., correct firm identification or ranking)
Number of mouse interactions/clicks
Gaze behavior: fixation and saccade data, scan paths, region-of-interest metrics
Qualitative feedback through post-task interviews
Eye-tracking data were used to analyze visual search efficiency, fixation concentration, and interface scanning patterns. These data were not used to directly infer cognitive load but as a measure of easiness in performing tasks.
Qualitative feedback analysis
Open-ended comments were collected from participants after each task block to capture immediate impressions of clarity, visual load, and ease of locating relevant information. Responses were transcribed and grouped using simple content categorization, separating positive observations, negative observations, and interface-specific suggestions. This procedure was not intended as a full qualitative analysis; rather, it provided supplementary insight into usability-related perceptions and helped contextualize the quantitative results reported in this study.
Interface comparison protocol
The baseline interface presented financial entities in a scrollable tabular layout with sortable columns and filter dropdowns. The Multiviz interface displayed the same data in a treemap layout enriched with smart agents that triggered visual cues when defined rules were satisfied.
Participants were given only a brief introduction and 2–3 min of practice on each interface to simulate realistic onboarding.
Results
The results of the user study revealed that the Multiviz interface significantly outperformed the baseline tabular interface across multiple dimensions of task performance. Subjects performed tasks significantly faster with Multiviz, resulting in fewer number of fixations and shorter gaze paths. This section presents findings on task completion time, accuracy, interaction behavior, and gaze data analysis.
Task completion time and accuracy
Participants completed tasks more quickly using Multiviz than with the baseline tabular interface. The average completion time with Multiviz was 113.11 ± 13.81 s compared to 241.47 ± 42.68 s for the tabular interface, t(11) = –10.63, p < 0.000001, Cohen’s d = –3.07, representing a 53% reduction. The largest time savings were observed in tasks requiring multi-variable filtering and anomaly detection, where spatial grouping and agent-based cues enabled users to rapidly locate relevant data regions.
Accuracy was also significantly higher with Multiviz (9.17 ± 0.27%) compared to the tabular interface (7.75 ± 0.26%), t(11) = 11.76, p < 0.000001, d = 3.39. Errors in the baseline condition were mostly due to missed variable combinations or misinterpreted rows, confusion, while errors in Multiviz were less frequent and typically related to over selection during early exploration. A comparison of mean fixation times, saccade durations, task completion times, and accuracy across both interfaces is provided in Table 1, which shows the overall advantage of the Multiviz treemap design.
| Type | Mean fixation (ms) | Mean Saccade (ms) | Completion time (s) | Task accuracy (%) |
|---|---|---|---|---|
| Multiviz Treemap | 414.0 | 38.1 | 113.1 | 92 |
| ListView Tabular | 441.0 | 36.2 | 241.5 | 78 |
Note:
Experimental results comparing the Multiviz treemap interface and the baseline tabular ListView interface. Each data point represents the mean value across participants. Reported measures include mean fixation duration (ms), mean saccade duration (ms), mean task completion time (s), and mean task accuracy (%). Multiviz shows shorter fixations, longer saccades, reduced completion times, and higher accuracy compared to the baseline interface.
Participants made fewer mouse interactions when using Multiviz. The number of clicks decreased from 52.6 ± 5.4 with the tabular interface to 34.9 ± 3.4 with Multiviz, t(11) = –10.63, p < 0.000001, d = –3.07. This suggests that users required less trial and error and navigation overhead, supporting the hypothesis that visual encodings and perceptual layout reduce the need for additional manipulation and search. This aligned with the post-experiment interviews.
Gaze behavior
Eye-tracking heatmaps and scan paths revealed distinct behavioral differences between conditions, as well as differences in fixation and saccade measurements.
In the tabular interface, gaze patterns were characterized by horizontal sweeps across rows, repeated fixations on column headers, and frequent re-checking of variable combinations. The mean fixation duration was higher in the tabular interface (441.0 ms vs. 414.0 ms with, t(11) = –3.45, p < 0.005, d = –1), suggesting potential difficulties in cognitive processing. In contrast, users of Multiviz exhibited more clustered fixations in relevant treemap regions. They also made rapid returns to agent highlighted nodes and demonstrated fewer long saccades or visual backtracking, ultimately reducing mean saccade times. Due to significantly longer task completion times, mean number of fixations were also higher in Tabular interface (602.2 ± 108.8 vs. 259.3 ± 43.1 fixations, p < 0.0000017).
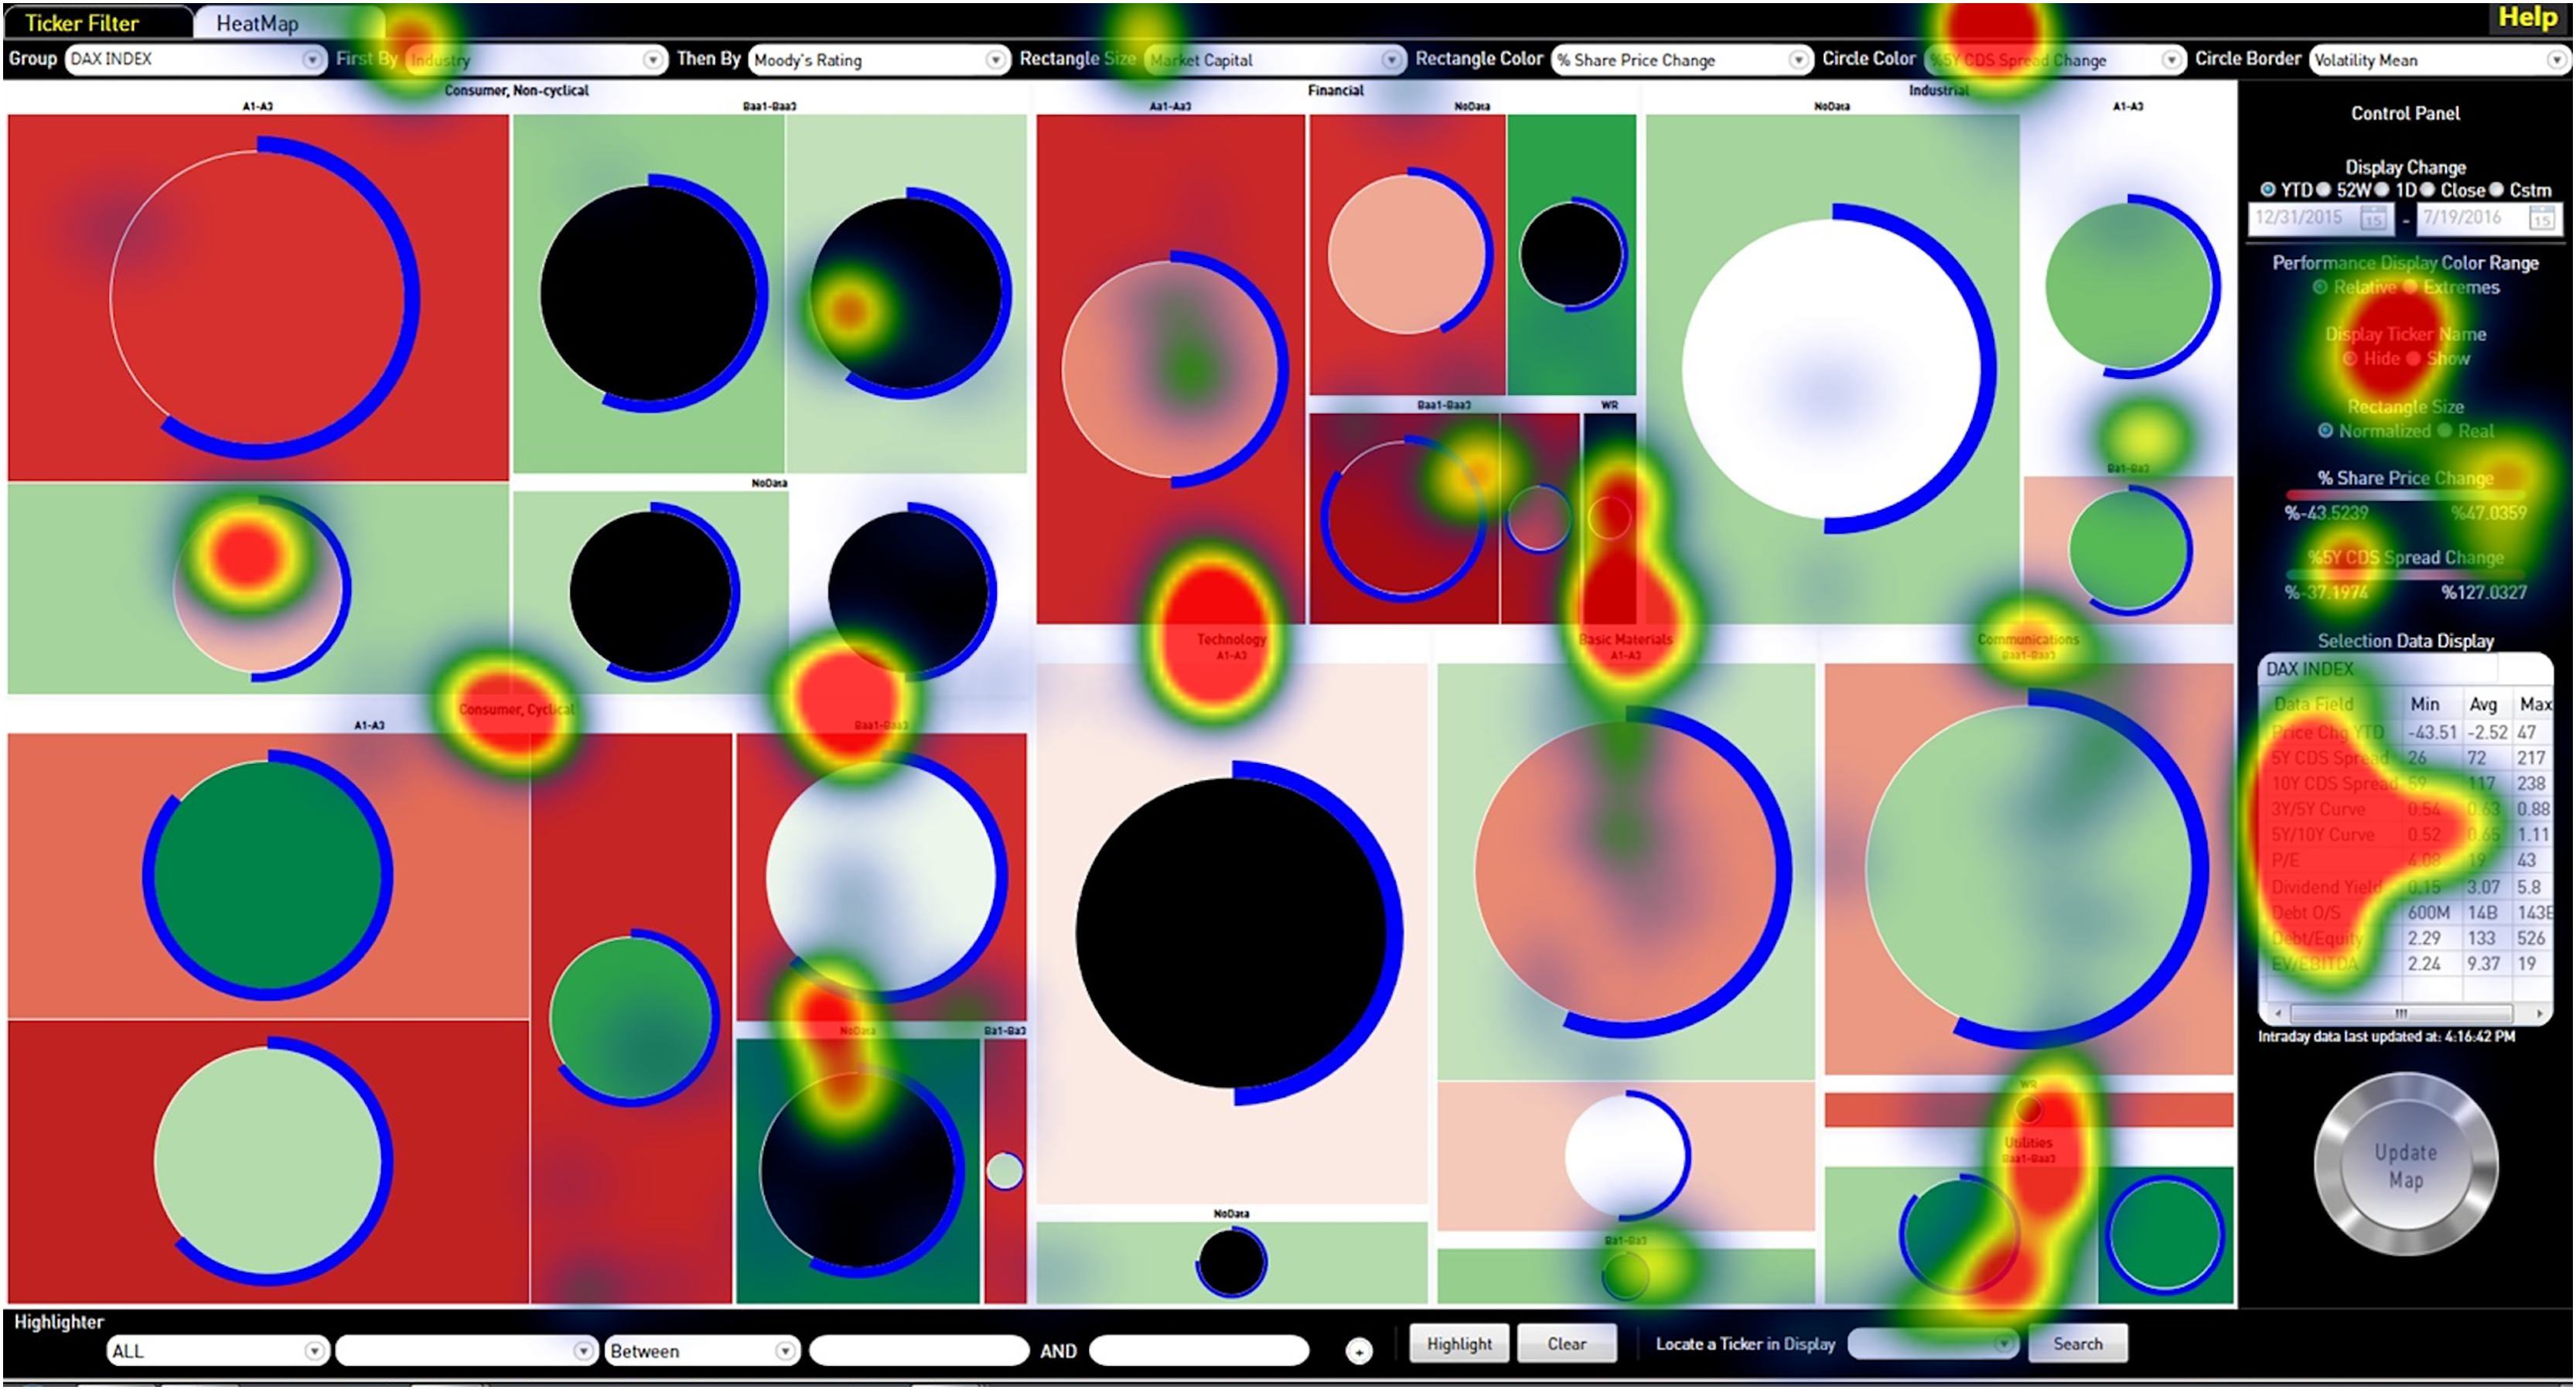
Figures 6 and 7 showed a sample heatmap comparison from a task involving multivariable filtering (DAX market data). In the baseline tabular interface, attention was widely dispersed, whereas in Multiviz, fixations were concentrated in visually prioritized zones.
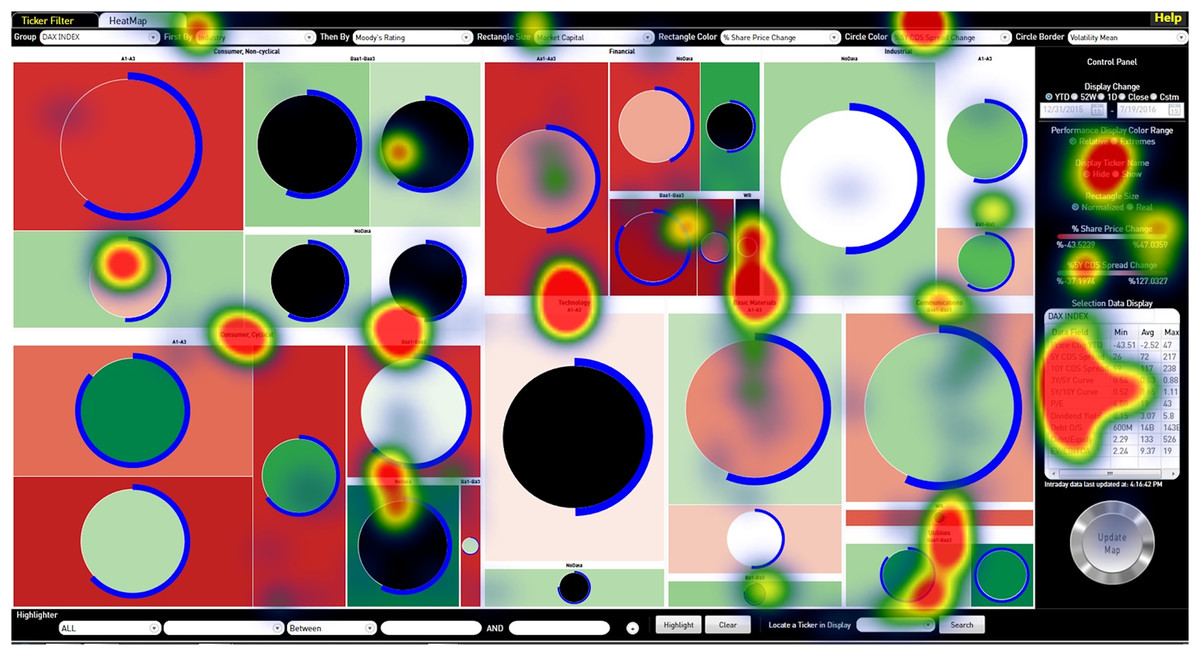
Figure 6: DAX data task screen eyegaze heatmap.

Figure 7: DAX data tabular ListView eyegaze heatmap.
These patterns suggested that Multiviz supported more focused visual attention, likely due to the combined effect of semantic grouping, perceptual encoding, and agent-based cueing.
The observed patterns indicated that users interacting with Multiviz exhibited more concentrated fixations, with shorter scan paths and fewer returns to previously visited regions. In contrast, users working with the tabular interface spent more time scanning horizontally across rows and vertically down columns, often revisiting cells to verify contextual information. These differences suggest that the spatial structuring and perceptual cues in Multiviz helped users form a coherent visual strategy more quickly. For example, in tasks requiring the identification of firms with specific financial criteria (e.g., high CDS but low interest coverage), gaze behavior in Multiviz tended to center around the visual clusters emphasized by agent driven highlighting. In the list view, the same task required participants to scan and locate relevant rows, mentally combine values across columns, and jump frequently between sections.
Participant feedback
Qualitative feedback gathered through short post-task interviews indicated a clear preference for Multiviz. Participants described the interface as “Visually clean and smart,” “Helpful in pointing me to the problem area,” and “Much faster to work with once I understood what the colors and highlights meant.” Some participants also noted brief initial confusion when interpreting the layered glyph encodings before becoming familiar with the visual mappings, indicating a short learning period associated with the multivariate design.
In addition, several participants mentioned that the agent-driven highlights increased their trust in the visualization, particularly for complex filtering and anomaly detection tasks.
Discussion
The user study results demonstrate that Multiviz improves performance, interpretability, and user experience in real-time financial analysis tasks when compared with a traditional tabular interface. These improvements validate the system’s design assumptions and highlight the importance of cognitively aligned and perceptually structured visualizations in high-density analytical settings.
Visual structuring enables faster cognition
The observed reduction in task time and interaction count suggests that preattentive visual structuring, enabled by treemaps, size and color encodings, and layout stability, allowed users to “recognize” rather than “search.” This finding is consistent with the theory of visual cognition advanced by Ware (2019) and supported by empirical work from Cleveland and McGill, emphasizing that position, color, and size are rapidly processed channels for visual comparison.
In particular, the use of consistent spatial regions for sector and firm groupings enabled subjects to build spatial memory, reducing re-orientation effort and providing fast access to familiar locations across tasks. This aligns with the principle of layout stability as a cognitive anchor, as explored in Bederson, Shneiderman & Wattenberg (2002) work on dynamic interfaces.
Agent-driven cues amplify situational awareness
The smart agent layer contributed to non-disruptive attention guidance, particularly in tasks requiring synthesis of multiple financial indicators. Unlike alarm-based systems that interrupt user flow, Multiviz agents operated inline with the visual representation, using subtle cues to direct gaze rather than distract. This model draws from the concept of ambient display, where low-cost perceptual signals can enable situational awareness without demanding conscious switching (Pousman, Stasko & Mateas, 2007).
The effectiveness of these agent cues also reflects principles from feature integration theory by Treisman & Gelade (1980), wherein attention is automatically drawn to feature conjunctions such as color plus motion or brightness plus border. By embedding rule based intelligence into the perceptual field, the system allowed users to maintain peripheral awareness of non focal anomalies without the cognitive cost of constant scanning.
Gaze-based validation adds depth
Although limited in data size, the gaze analysis provided valuable insight into the visual search efficiency enabled by Multiviz. The tighter fixation clusters and reduced scan path complexity suggested that the interface allowed for more targeted attention allocation, consistent with literature on perceptual grouping and guided visual search by Wolfe (2007). This evidence confirms that the design reduced extraneous cognitive load, even without relying on subjective workload ratings such as NASA-TLX (Hart & Staveland, 1988).
The quantitative analysis further confirmed that fixation duration was significantly shorter in Multiviz (414.0 ± 13.2 ms) than in the table (441.0 ± 22.4 ms), t(11) = –3.45, p = 0.005, d = –1.00. Scanpath length was also greatly reduced (43,477 ± 7,554 px vs 89,210 ± 19,989 px), t(11) = –8.23, p < 0.00001, d = –2.38. Saccade duration showed a nonsignificant trend (38.1 ± 2.2 ms vs 36.2 ± 3.1 ms), p = 0.067. These metrics corroborate the performance results by demonstrating that Multiviz supported more efficient and focused visual strategies.
These qualitative insights serve as grounded justifications for interface design decisions, bridging the gap between engineering choices, such as the use of border glow, and user experience.
Domain specificity and generalizability
Although Multiviz was designed and evaluated specifically for financial market monitoring, its underlying architectural principles, hierarchical treemaps, multi variable glyphs, and inline rule-based agents, may have relevance in other time-sensitive, data-intensive domains.
However, such applicability remains prospective. The present study does not provide direct empirical validation outside the financial context, and claims of cross domain transferability should be treated with caution. Future research should investigate Multiviz inspired designs in settings such as cybersecurity, healthcare, or industrial operations, with appropriate adaptation to domain-specific data structures and decision tasks. Only through such targeted evaluations can the broader utility of the architecture be established with confidence.
Limitations
This study has several constraints that qualify the interpretation of the results. First, the sample size was relatively small (N = 12) and composed of domain familiar participants (finance professionals and advanced students) recruited through existing networks, which may bias performance toward expert strategies and limit generalizability to novice users. Second, participants received only a brief familiarization period (≈2–3 min per interface). Such short onboarding may depress early performance for the composite glyph encodings. Longer training could attenuate early errors and alter relative differences. Third, the evaluation was conducted in a controlled laboratory setting with fixed and difficult hardware (desktop display and SMI eye tracker at ≥120 Hz) and scripted tasks. These conditions do not capture typical production constraints (interruptions, multi-display setups, concurrent applications) on a trading floor. The evaluation therefore does not simulate the time pressure, concurrent task demands, or environmental complexity of an operational trading floor. Instead, it examines perceptual and interaction performance under controlled laboratory conditions. Fourth, although a within-subjects counterbalanced design was used, residual learning or fatigue effects cannot be fully ruled out. Fifth, our gaze analysis relied on aggregate measures (mean fixation duration, saccade duration, scanpath length) and did not include subjective workload scores (e.g., NASA-TLX) or trial level models. We therefore treat eye-tracking results as convergent evidence rather than definitive workload estimates. Finally, the present version evaluates a rule based, non adaptive agent; results may differ with adaptive or predictive agents that personalize thresholds or learn user intent over time.
Design implications for high-density interfaces
The findings suggest several actionable design guidelines for real-time, multivariate decision support systems:
Preserve layout stability to support spatial memory and reduce re-orientation time.
Use perceptual cues such as border pulse or brightness to guide attention without intruding on the data.
Design visual elements as multi attribute glyphs, leveraging separable channels like size, color, shape, and text.
Avoid global sorting and re-layouts during updates; prefer inline visual emphasis.
Embed decision logic visually, highlighting what matters directly within the interface rather than in external alert panels.
These principles may offer a blueprint for designing cognitively efficient interfaces in domains where human operators must process complex data under constraints of time and uncertainty.
Conclusions
This article presented Multiviz, a smart visualization system designed to support real-time financial analysis through perceptually structured layouts, rule-based anomaly highlighting, and cognitively aligned interaction mechanisms. By integrating a squarified treemap layout with rule based agent cueing and user driven navigation, Multiviz addresses key challenges in high dimensional, high-frequency data interpretation.
In a controlled user study with 12 professional finance domain participants, Multiviz significantly outperformed a baseline tabular interface in both task efficiency and accuracy. Eye-tracking analysis revealed that Multiviz users exhibited more concentrated and semantically guided gaze behavior, indicating a reduction in visual search effort. These findings affirm the value of embedding visual intelligence directly into the interface rather than relying solely on external controls or alerts.
The key contributions of this work are as follows:
Providing a cognitively optimized visual framework for multidimensional financial monitoring, using squarified treemaps and perceptually separable visual encodings.
Supporting real-time, rule based detection and visual emphasis of financial anomalies within the interface through a domain-driven agent layer.
Enabling rapid pattern recognition without additional interaction via a multi variable visual glyph design supporting up to nine attributes per entity.
Providing qualitative eye-tracking evidence that the interface improves visual focus and reduces unnecessary scan behavior compared to a traditional tabular layout.
Enabling flexible interaction across user roles in time sensitive environments through a validated model combining filtering, zoom, drill- down, and rule editing.
The study highlights the benefits of combining layout stability, multi channel visual encoding, and non intrusive agent support in domains where decision makers operate under heavy cognitive pressure. Although designed for financial market surveillance, the principles underlying Multiviz are broadly applicable to other real-time, multivariate environments, including cybersecurity, logistics, and healthcare with high cognitive load monitoring and search/action tasks.
Future work
Several directions emerge from this study. The present evaluation focused on a rule based, non adaptive agent layer. Future extensions may include adaptive or user trainable agents that learn from user feedback or interaction histories, as well as generative approaches that propose new visual encodings and anomaly cues in real time. Such developments would align with recent advances in agent-assisted and AI driven visualization design, and could improve personalization, trust, and decision accuracy.
Second, although our study focused exclusively on financial data, similar architectures could be tested in other high stakes domains such as cybersecurity, healthcare monitoring, and industrial process control. Cross domain validation would help establish the scalability and transferability of the Multiviz design.
Third, the participant pool was limited to twelve domain familiar users. Future studies should include larger and more diverse samples spanning novice and expert populations, different financial roles, and potentially users from other data intensive domains. Multi user or collaborative settings could further test how attention guiding agents perform in team based decision contexts.
Finally, our study examined short term task performance in a controlled laboratory setting. Longitudinal evaluations, in which participants adopt Multiviz over extended periods of use, are needed to capture learning effects, trust calibration, fatigue, and integration into everyday work practices. These future investigations will help establish the external validity, scalability, and sustainability of the Multiviz approach.
Multiviz contributes not only a novel interface but also a replicable design pattern for cognitively optimized, task aligned visualization in expert settings. As data environments grow increasingly complex, such systems will be critical in ensuring that human operators remain informed and empowered.
Supplemental Information
Sample Scanpath Image From SMI eyetracker.
Scanpath sample data from the experiment.
Eyetracker result data including gaze duration task completion time task accuracy scanpath length and saccade durations.
Each line corresponds to one condition of one subject which was done in latin square order change to prevent learning effects
Questionnaire in Turkish.
The questionnaire was given in Turkish Language to the participants after the experiment.
Post experiment questionnaire form.
This post experiment questionnaire based on standard system usability scale was given to participants after the experiment.