
A dual oscillatory particle swarm optimization for tomato disease classification
- Published
- Accepted
- Received
- Academic Editor
- Nicole Nogoy
- Subject Areas
- Algorithms and Analysis of Algorithms, Artificial Intelligence, Computer Vision, Data Mining and Machine Learning, Optimization Theory and Computation
- Keywords
- Particle swarm optimization, Dual oscillatory, Tomato disease classification, Image analysis
- Copyright
- © 2026 Guo et al.
- Licence
- This is an open access article distributed under the terms of the Creative Commons Attribution License, which permits unrestricted use, distribution, reproduction and adaptation in any medium and for any purpose provided that it is properly attributed. For attribution, the original author(s), title, publication source (PeerJ Computer Science) and either DOI or URL of the article must be cited.
- Cite this article
- 2026. A dual oscillatory particle swarm optimization for tomato disease classification. PeerJ Computer Science 12:e3566 https://doi.org/10.7717/peerj-cs.3566
Abstract
This study presents a novel Dual Oscillatory Particle Swarm Optimization (DOPSO) algorithm for automated tomato disease classification through image analysis, advancing agricultural sensing and computer vision methodologies. DOPSO uniquely introduces anti-phase oscillatory operators that alternate between exploration and exploitation phases, coupled with a dual-subgroup architecture enabling parallel search with information exchange, addressing premature convergence in hyperparameter optimization for image classification tasks. Using a dataset comprising 10,000 images (1,000 per class across 1 healthy state and 9 disease types), we systematically extracted ten discriminative visual features spanning color, texture, and shape characteristics from tomato leaf images. DOPSO achieves superior image classification performance by optimizing light gradient boosting machine (LightGBM) algorithm hyperparameters. Experimental validation demonstrates that DOPSO-LightGBM achieves 82.25% classification accuracy, representing improvements of 6.25 percentage points over support vector machine (SVM) (76.00%), 21.20 percentage points over Logistic Regression (61.05%), 1.90 percentage points over Random Forest (80.35%). Robust performance across precision (82.21%), recall (82.25%), and F1-score (82.16%) metrics establishes reliable tomato disease image classification. This research contributes significantly to automated image analysis for crop disease detection, demonstrating effective integration of optimization algorithms with computer vision techniques for agricultural applications.
Introduction
Tomato leaf diseases pose a significant threat to the global nutritional supply (Aishwarya & Reddy, 2023; Ahmed et al., 2022). These diseases are one of the most significant factors affecting the crop’s yield and quality. Tomato plants face threats from multiple pathological agents, including various fungal, bacterial, and viral pathogens, as well as pest-induced damage, each presenting distinct diagnostic and management challenges (Ullah et al., 2023).
In modern agricultural disease management systems, early and accurate diagnosis is the prerequisite for implementing effective control measures and curbing the spread of diseases. Traditional disease diagnosis methods are time-consuming and labor-intensive (Rehman et al., 2023). More importantly, during large-scale disease outbreaks in the field, the lag in manual inspection often leads to missing the optimal window for treatment, resulting in irreversible losses. Consequently, rapid identification at the initial stage of disease onset is of decisive importance for controlling disease spread and minimizing economic losses (Thanammal Indu & Suja Priyadharsini, 2022).
The central problem addressed in agricultural disease classification involves the simultaneous optimization of feature selection and classifier hyperparameters for agricultural disease classification while maintaining computational efficiency suitable for field deployment. This optimization challenge requires addressing the complex interplay between multiple objectives: maximizing classification accuracy, minimizing computational resources, ensuring model interpretability for agricultural practitioners, and achieving robust performance under variable field conditions (Paymode & Malode, 2022). The multiobjective nature of this problem necessitates an advanced optimization framework capable of balancing these competing requirements while delivering practical solutions for precision agriculture applications (Shantkumari & Uma, 2023).
To address the challenges of traditional methods, automated disease recognition technologies based on computer vision and artificial intelligence have emerged (Gulzar & Ünal, 2025a; Duggan, 2000; Gulzar, 2025). These automated systems can provide objective, rapid, and scalable diagnostic solutions, helping agricultural producers to take timely and precise intervention measures (such as targeted pesticide application), thereby significantly reducing over-reliance on broad-spectrum chemical pesticides and effectively lowering production costs (Nawaz et al., 2022). In recent years, the rise of machine learning, especially deep learning, has brought revolutionary breakthroughs to plant pathology. Its powerful feature learning and pattern recognition capabilities have made it the core driving force for building a new generation of intelligent disease diagnosis systems, attracting widespread attention from both academia and industry (Yao et al., 2023).
The practical implementation of automated diagnostic systems encounters several critical optimization challenges that require sophisticated algorithmic solutions (Gulzar, 2023; Gulzar et al., 2024; Gulzar & Ünal, 2025b). Agricultural field conditions introduce complex parameter optimization problems, including variable environmental factors and imaging inconsistencies that complicate model tuning processes. Disease classification presents unique optimization difficulties due to overlapping symptom characteristics and morphological variations, requiring advanced hyperparameter selection strategies for robust performance. Limited training data availability and class distribution imbalances create additional optimization constraints that conventional methods inadequately address. The computational efficiency challenge further complicates optimization, as achieving high accuracy while maintaining practical resource requirements for field deployment necessitates sophisticated parameter optimization approaches (Albahli & Nawaz, 2022; Nawaz et al., 2022).
Data-level challenges further compound these issues. Scarce large-scale, class-balanced datasets exacerbate few-shot learning limitations (Liu & Zhang, 2023), and imbalanced data degrades recognition of minority-class diseases (Zhao et al., 2022). Moreover, accuracy improvements typically entail complex architectures with prohibitive computational costs. Most advanced models require high-performance computing platforms, hindering deployment on resource-constrained edge devices (e.g., mobile/embedded systems) and limiting field applicability (Ullah et al., 2023; Ahmed et al., 2022).
Despite the significant promise of deep learning, its practical deployment in real-world agricultural settings is hindered by several formidable challenges. First, models must be robust to the complex imaging conditions of the field, including variable illumination, shadows, background clutter, and image noise (Albahli & Nawaz, 2022). Second, the inherent visual ambiguity of symptoms—where different diseases exhibit similar features (low inter-class variance) and a single disease presents differently across stages (high intra-class variance)—demands exceptional generalization from the model (Nawaz et al., 2022). Finally, progress is often constrained by data-level and resource-level bottlenecks, including the scarcity of large, well-curated datasets (few-shot learning) (Liu & Zhang, 2023), the prevalence of imbalanced class distributions (Zhao et al., 2022), and the prohibitive computational cost of state-of-the-art models, which limits their applicability on resource-constrained field devices (Ullah et al., 2023; Ahmed et al., 2022).
LightGBM (Light Gradient Boosting Machine) demonstrates excellent performance in conventional classification tasks. However, hyperparameter configuration becomes a critical bottleneck that constrains its effectiveness when addressing complex, large-scale classification problems. In this research, the central challenge involves simultaneously optimizing multiple LightGBM hyperparameters for tomato disease classification while balancing classification accuracy with computational efficiency suitable for real-world agricultural deployment.
To address these multifaceted challenges, we propose the Dual Oscillatory Particle Swarm Optimization (DOPSO) algorithm, which tackles the optimization problem through three innovative mechanisms: (1) anti-phase oscillatory operators that dynamically balance exploration and exploitation phases, preventing premature convergence in high-dimensional hyperparameter spaces; (2) dual-subgroup architecture that enables parallel optimization with adaptive information exchange, accelerating convergence while maintaining solution diversity; and (3) seamless integration with gradient boosting frameworks (specifically LightGBM) to achieve optimal feature-hyperparameter co-optimization. Our approach directly addresses the computational efficiency requirements of agricultural applications. The main contributions of this work are summarized as follows:
Algorithmic innovation: We introduce the novel DOPSO algorithm featuring anti-phase oscillatory operators and dual-subgroup architecture, providing mathematically-proven convergence properties superior to standard Particle Swarm Optimization (PSO) variants in high-dimensional optimization spaces.
Methodological framework: We develop an integrated DOPSO-LightGBM optimization pipeline that simultaneously optimizes feature selection and hyperparameter tuning, addressing the unique challenges of agricultural image classification.
Empirical validation: We conduct comprehensive experimental evaluation on a 10,000-image tomato disease dataset (1 healthy + 9 disease classes), demonstrating the effectiveness of our approach through rigorous comparative analysis.
Related work
The difficulties of tomato disease recognition
Although automated disease recognition technology shows great potential, its deployment in real-world, complex agricultural environments still faces numerous severe technical challenges:
Complex imaging conditions are the primary external factor affecting recognition accuracy. In natural settings such as fields or greenhouses, the image acquisition process is highly susceptible to issues like variations in lighting intensity, shadow interference, occlusion by healthy leaves, stems, or soil in the background, as well as image blur and noise caused by wind or camera shake. These factors significantly increase the difficulty of accurately extracting disease features from raw images (Albahli & Nawaz, 2022).
The inherent ambiguity and variability of disease symptoms constitute an intrinsic recognition challenge. On the one hand, different diseases may exhibit highly similar visual features (i.e., low inter-class variance), such as various fungal diseases initially appearing as small brown or yellow spots. On the other hand, the same disease may show significant variations in the size, color, and morphology of its lesions at different stages of infection, on different tomato varieties, or under different environmental conditions (i.e., high intra-class variance). This poses a high demand on the model’s generalization ability and robustness (Nawaz et al., 2022).
Limitations in data and computational resources are practical bottlenecks constraining model performance. In many real-world application scenarios, researchers find it difficult to obtain large-scale, accurately labeled, and class-balanced image datasets that cover all disease categories and developmental stages. This leads to problems such as small-sample learning (Liu & Zhang, 2023) and data imbalance (Zhao et al., 2022), which severely restrict the training effectiveness of deep learning models. Furthermore, many high-performance deep learning models have complex architectures and a massive number of parameters, requiring substantial computational resources. This hinders their deployment on resource-constrained mobile platforms like smartphones and drones, limiting the practical application value of the technology in the field (Ullah et al., 2023; Ahmed et al., 2022).
Traditional methods for tomato leaf disease detection
In the field of automatic plant disease recognition, the technological paradigm has shifted from traditional machine learning, which relies on manual feature engineering, to deep learning, which is dominated by end-to-end learning. This section provides an in-depth analysis of these two categories of methods, which constitute the current research baselines, and elucidates their respective advantages and remaining limitations (Thanammal Indu & Suja Priyadharsini, 2022).
Early research efforts were primarily focused on traditional machine learning methods. For instance, Kurmi & Gangwar (2022) proposed a context-based image classification algorithm that first localizes the leaf region using an Lab* color space transformation, then extracts handcrafted features including Bag of Visual Words and Fisher vectors, and finally uses classifiers like logistic regression or multilayer perceptrons for determination. Similarly, to achieve accurate detection of grape leaf diseases, Shantkumari & Uma (2023) concentrated on extracting high-quality histogram and extended histogram features to capture the fine-grained structure and boundary information of lesions, feeding them into their proposed Convolutional Neural Networks (CNN) and an improvised K-Nearest Neighbor (IKNN) model. The common thread in these methods is their core pipeline of “manual feature design + classic classifier.” However, this paradigm suffers from a fundamental flaw: it heavily relies on the researcher’s domain expertise, the development process is tedious, and the designed features exhibit poor generalization, being extremely sensitive to environmental variations like lighting and background, which can easily lead to a drop in classification accuracy due to irrelevant or redundant information (Rehman et al., 2023).
To overcome the limitations of traditional methods, deep learning approaches, particularly CNNs, have rapidly become the new, more powerful baseline, as they can automatically learn hierarchical and discriminative features directly from raw pixels (Yao et al., 2023). In this direction, Paymode and Malode (Paymode & Malode, 2022) applied the classic Visual Geometry Group (VGG) network architecture, using transfer learning to classify tomato and grape leaf diseases, thereby validating the effectiveness of pre-trained models in the agricultural domain. To further enhance model performance and adaptability to complex scenarios, researchers have made numerous improvements. For example, to address the problem of precise lesion localization, Nawaz et al. (2022) proposed a Faster-Region-based Convolutional Neural Network (RCNN) model based on ResNet-34 and innovatively integrated a Convolutional Block Attention Module (CBAM) into the feature extractor to enhance the model’s focus on key lesion features. Also aiming to improve feature discrimination, Stephen, Punitha & Chandrasekar (2023) introduced a self-attention mechanism into the ResNet architecture for the classification of rice leaf diseases.
Meanwhile, to tackle the high computational cost of deep models and their difficult deployment on mobile devices, Ahmed et al. (2022) proposed a solution based on the lightweight network MobileNetV2, significantly reducing model size and computational complexity while maintaining high accuracy. Ullah et al. (2023) went a step further by designing a custom lightweight network, DTomatoDNet, with only 19 learnable layers specifically for tomato disease recognition, intended for easy integration into mobile applications.
Metaheuristic (Guo et al., 2024a, 2022) algorithms are considered an important method for image classification using texture features (Guo et al., 2024b; Shi et al., 2022). The stochastic nature of metaheuristics enables effective exploration of non-convex optimization landscapes, avoiding local optima that frequently trap gradient-based methods when optimizing texture feature combinations (Guo et al., 2023a, 2023b). Furthermore, metaheuristic approaches demonstrate superior capability in simultaneously addressing multiple objectives inherent in texture classification tasks, including feature subset selection, classifier hyperparameter tuning, and computational efficiency optimization (Guo et al., 2025; Tian et al., 2022).
Furthermore, to address the prevalent issues of data scarcity and class imbalance in agriculture, Zhao et al. (2022) proposed a two-stage generative adversarial network called DoubleGAN to generate high-quality synthetic images of diseased leaves for augmenting and balancing the training set. In their hybrid deep learning method, Islam et al. (2022) also employed a Conditional GAN (CGAN) to generate synthetic images to cope with data imbalance and noisy labels.
Materials and Methods
Dual oscillatory particle swarm optimization (DOPSO)
The DOPSO algorithm is proposed in this part. DOPSO addresses the fundamental limitations of conventional PSO, particularly premature convergence and insufficient population diversity, by implementing a sophisticated multi-layered search strategy.
The term “Dual Oscillatory” reflects the two core mechanisms of this algorithm. “Dual” refers to the dual subgroup architecture, in which the entire particle swarm is evenly divided into two independent subgroups. Each subgroup maintains its own global best solution and conducts parallel search operations. This separation ensures that the two subgroups can explore different regions of the search space simultaneously, thereby reducing the risk of the entire population converging to a single local optimum. “Oscillatory” describes the anti-phase oscillatory search strategy applied to the two subgroups. Specifically, oscillatory coefficients based on trigonometric functions are introduced into the velocity update process, and these coefficients are designed to operate in opposite phases for the two subgroups. This complementary oscillation pattern maintains continuous population diversity throughout the optimization process.
The algorithm operates through three primary mechanisms: (1) dual subgroup parallel exploration, where the particle swarm is divided into two independent subgroups that maintain separate global best solutions; (2) anti-phase oscillatory operators that introduce controlled perturbations to particle position updates using trigonometric functions; and (3) periodic information exchange between subgroups to facilitate global knowledge sharing while preserving local search independence. The mathematical foundation of DOPSO extends the classical PSO velocity-position update equations by incorporating an oscillatory coefficient that varies dynamically with iteration count. This oscillatory behavior creates a natural balance between exploration and exploitation phases, enabling the algorithm to maintain population diversity in early iterations while converging to high-quality solutions in later stages. DOPSO demonstrates particular effectiveness in high-dimensional optimization problems and machine learning hyperparameter tuning, where traditional PSO often suffers from stagnation in local optima. The algorithm’s dual-layer architecture provides robustness against premature convergence while maintaining computational efficiency comparable to standard PSO implementations. The theoretical contributions of DOPSO include: enhanced global search capability through dual subgroup diversity maintenance, improved convergence characteristics via oscillatory perturbation mechanisms, and a novel information sharing paradigm that balances exploration and exploitation throughout the optimization process.
DOPSO mathematical formulation
Dual subgroup architecture
The DOPSO algorithm partitions the swarm S of size into two equal subgroups:
(1) where S is the particle swarm, is the total number of particles, and are the first and second subgroups each containing N particles, respectively, and represents the th particle.
Each subgroup maintains an independent global best solution:
(2) where and are the global best positions of subgroups 1 and 2, respectively, is the objective function, and is the personal best position of particle .
Oscillatory position update
The core innovation of DOPSO lies in the modified position update equation incorporating an oscillatory coefficient:
For Subgroup 1:
(3)
For Subgroup 2:
(4) where and are the position of particle at iterations and , respectively, is the velocity of particle at iteration , and and are the oscillatory coefficients for subgroups 1 and 2 at iteration , respectively.
The oscillatory coefficients are defined as:
(5)
(6) where is the current iteration number, provides phase alternation, and controls the amplitude decay over iterations.
Velocity update with dual global guidance
The velocity update equations for each subgroup are:
For Subgroup 1:
(7)
For Subgroup 2:
(8) where is the inertia weight, and are the cognitive and social acceleration coefficients, respectively, and are random numbers uniformly distributed in , is the personal best position of particle , and and are the respective global best positions of each subgroup.
Information exchange mechanism
At predetermined intervals, the global best solutions are exchanged between subgroups:
(9) where , T is the maximum iteration count, and denotes the floor function.
Oscillatory coefficient properties
The oscillatory coefficients exhibit the following mathematical characteristics:
Phase alternation:
(10)
Amplitude evolution:
(11)
Convergence behavior:
(12) where the amplitude decreases monotonically as increases, ensuring strong exploration in early iterations and refined exploitation in later stages.
DOPSO-LightGBM
LightGBM is a highly efficient gradient boosting framework that utilizes tree-based learning algorithms, developed by Microsoft Research. It employs novel techniques such as Gradient-based One-Side Sampling (GOSS) and Exclusive Feature Bundling (EFB) to significantly reduce computation time and memory usage while maintaining high accuracy. LightGBM constructs trees leaf-wise rather than level-wise, enabling faster training speed and lower memory consumption compared to traditional gradient boosting methods. The framework supports parallel and GPU learning, handles categorical features natively, and provides excellent performance in various machine learning competitions and real-world applications, particularly excelling in scenarios with large datasets and high-dimensional feature spaces. DOPSO-LightGBM represents an innovative hybrid approach that combines the advanced hyperparameter optimization capabilities of DOPSO with the efficient gradient boosting framework of LightGBM. This integration addresses the critical challenge of optimal hyperparameter configuration in LightGBM by employing DOPSO’s dual subgroup architecture to simultaneously optimize seven key parameters: learning rate, maximum depth, number of estimators, subsample ratio, feature sampling ratio, minimum split gain, and minimum child samples. The anti-phase oscillatory mechanism of DOPSO ensures comprehensive exploration of the hyperparameter space while preventing premature convergence to suboptimal configurations. Through periodic information exchange between subgroups and controlled perturbation dynamics, DOPSO-LightGBM achieves superior parameter tuning performance compared to conventional optimization methods, resulting in enhanced model accuracy and robustness for complex classification tasks such as plant disease recognition. To better illustrate the workflow of DOPSO, the pseudocode is presented in Algorithm 1.
| Require: Objective function f, parameter bounds, swarm size N, maximum iterations Tmax |
| Ensure: Optimal solution and its fitness value |
| 1: Initialization: |
| 2: Divide swarm into two equal subgroups S1 and S2 |
| 3: Initialize positions and velocities for both subgroups randomly |
| 4: Initialize personal best and global best for each subgroup |
| 5: for to Tmax do |
| 6: if then |
| 7: Exchange global best information between subgroups |
| 8: end if |
| 9: Update Subgroup 1: |
| 10: for each particle in S1 do |
| 11: Evaluate fitness and update personal best |
| 12: Update velocity using PSO formula |
| 13: Apply anti-phase oscillatory operator |
| 14: Update position with oscillation-modified velocity |
| 15: Apply boundary constraints |
| 16: end for |
| 17: Update global best for S1 |
| 18: Update Subgroup 2: |
| 19: for each particle in S2 do |
| 20: Evaluate fitness and update personal best |
| 21: Update velocity using PSO formula |
| 22: Apply anti-phase oscillatory operator |
| 23: Update position with oscillation-modified velocity |
| 24: Apply boundary constraints |
| 25: end for |
| 26: Update global best for S2 |
| 27: end for |
| 28: return Best solution from all subgroups |
Tomato disease classification with DOPSO-LightGBM
Tomato Disease Classification with DOPSO-LightGBM represents a comprehensive application of advanced machine learning optimization techniques to address the critical agricultural challenge of automated plant disease diagnosis. This approach leverages a dataset of tomato leaf images encompassing ten distinct categories, including healthy specimens and nine disease conditions such as bacterial spot, early blight, late blight, leaf mold, septoria leaf spot, spider mites, target spot, tomato mosaic virus, and yellow leaf curl virus. The methodology extracts ten carefully selected image features spanning color, texture, shape, and statistical characteristics, including red and green channel means, red-green ratio, Gray-level co-occurrence matrix (GCLM) contrast and energy, Hue, Saturation and Value (HSV) means, intensity standard deviation, edge density, and color variance. These features are specifically designed to capture the visual manifestations of disease symptoms in tomato leaves, providing discriminative information for accurate classification. The DOPSO-LightGBM framework for tomato disease classification integrates the robust gradient boosting capabilities of LightGBM with the enhanced optimization power of DOPSO to achieve superior diagnostic performance. The system employs DOPSO’s dual subgroup oscillatory mechanism to optimize seven critical LightGBM hyperparameters simultaneously, ensuring optimal model configuration for the multi-class classification task. Through the anti-phase perturbation strategy and periodic information exchange between subgroups, the optimization process effectively explores the hyperparameter space while maintaining population diversity, leading to improved convergence to high-quality parameter combinations. This optimized DOPSO-LightGBM model demonstrates enhanced accuracy, precision, recall, and F1-score metrics compared to conventional optimization approaches, providing farmers and agricultural specialists with a reliable, automated tool for early disease detection and management, ultimately contributing to improved crop yield and food security.
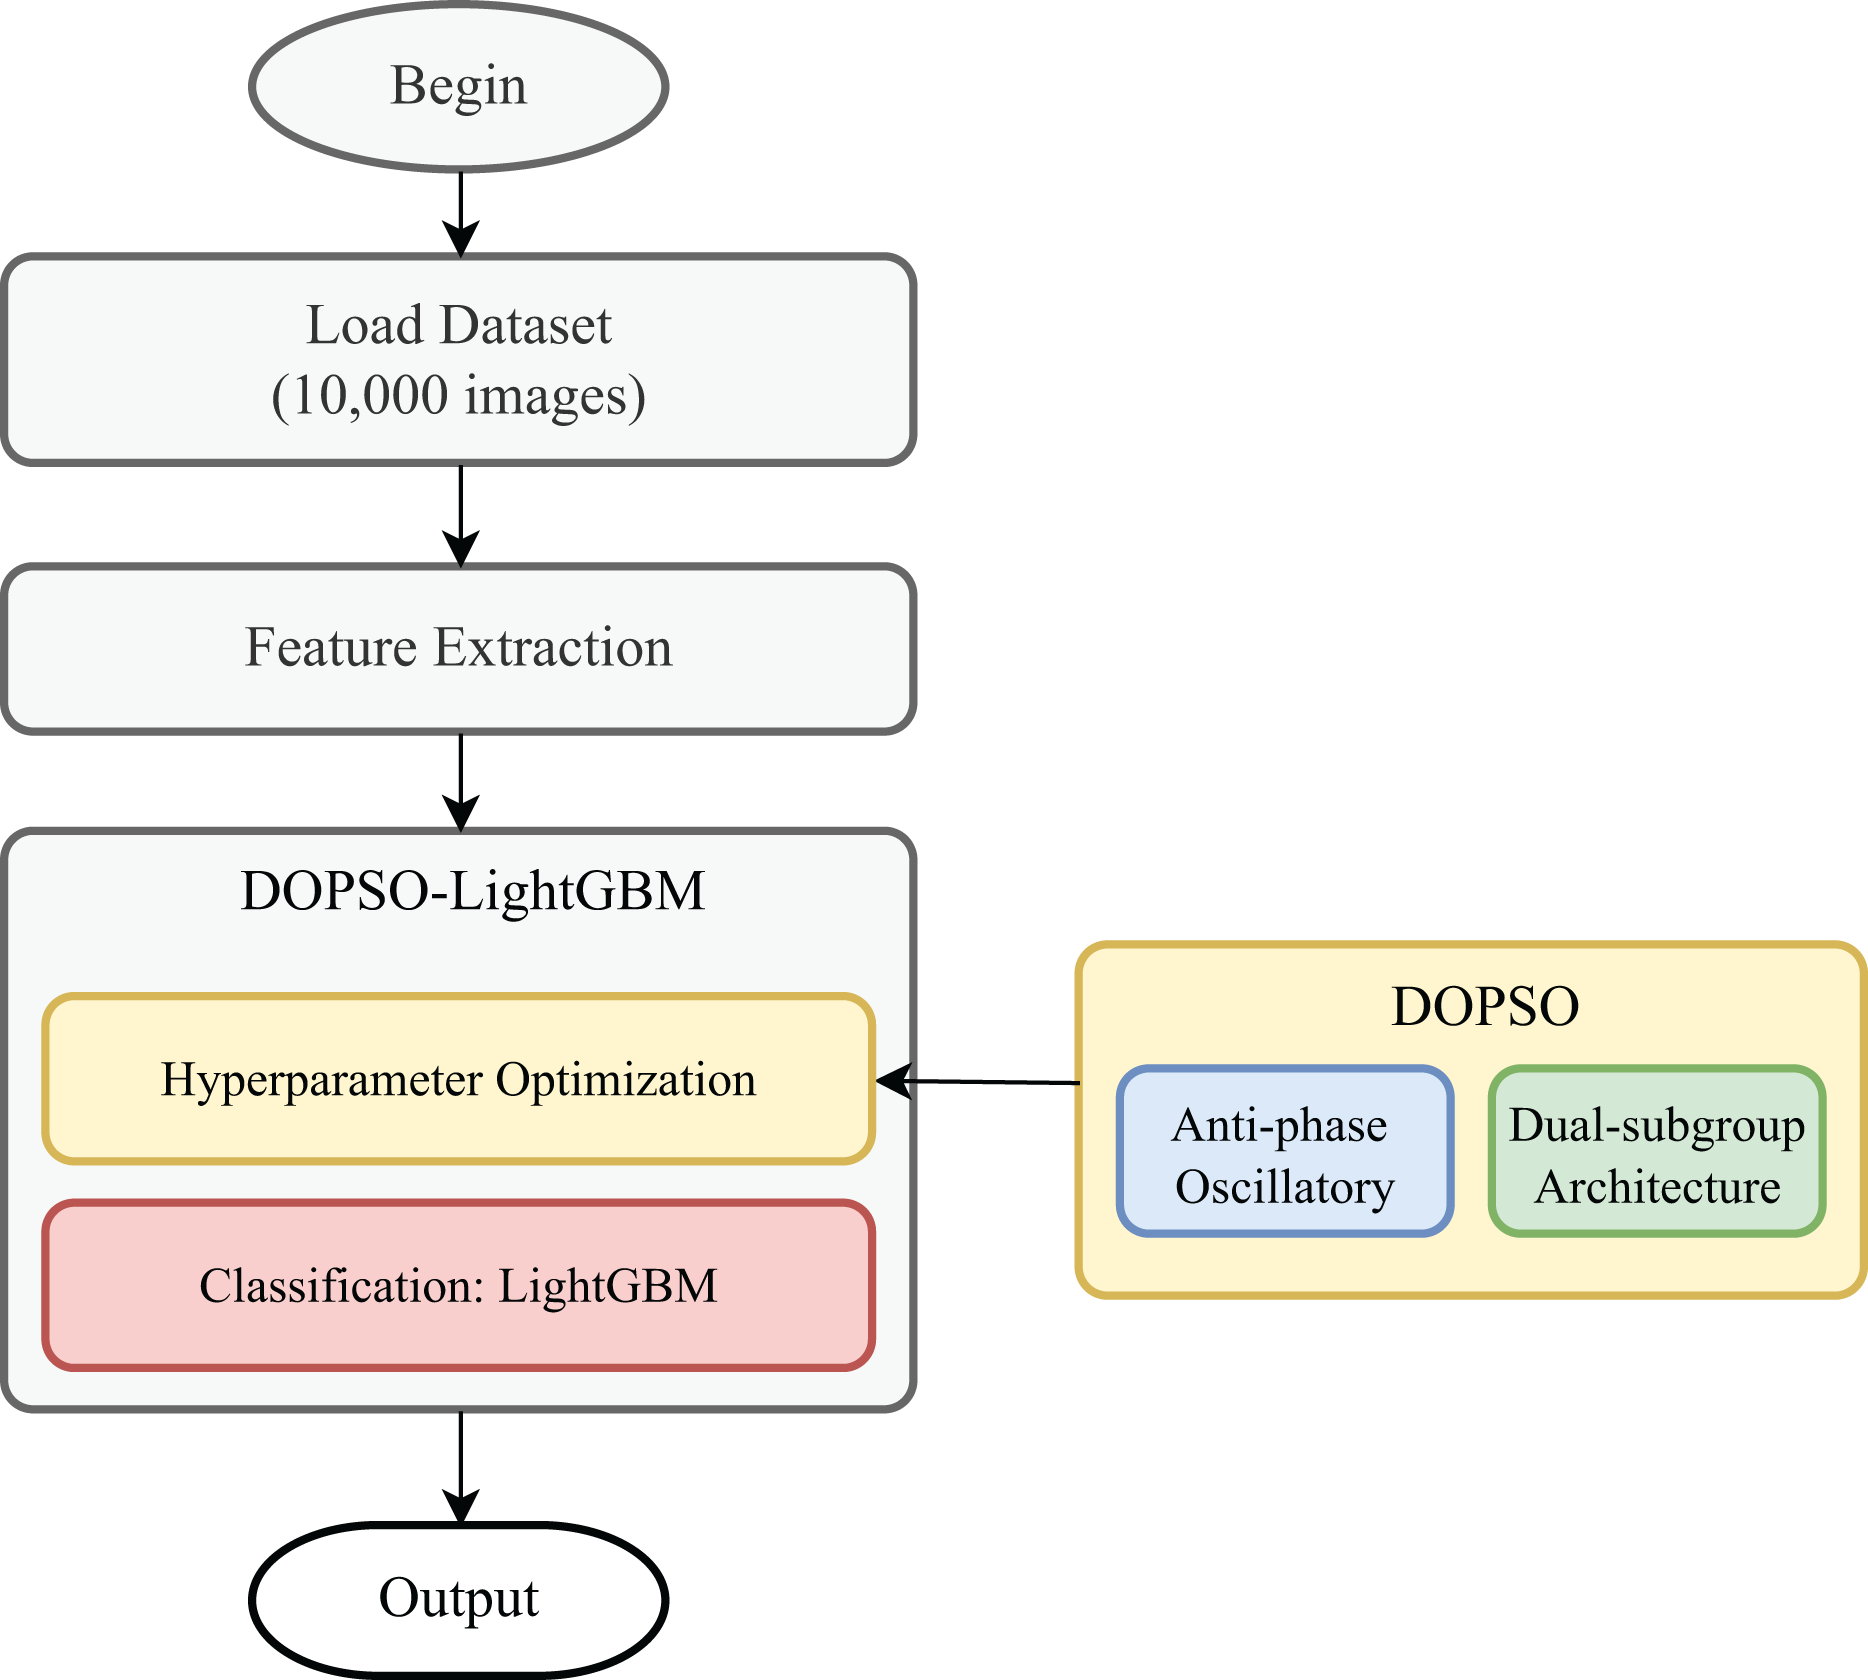
The tomato disease classification pipeline begins with the acquisition of tomato leaf images representing ten distinct categories: one healthy class and nine disease conditions including bacterial spot, early blight, late blight, leaf mold, septoria leaf spot, spider mites, target spot, tomato mosaic virus, and yellow leaf curl virus. Each category contains 1,000 preprocessed images that have been standardized in terms of size and quality to ensure consistency across the dataset. The images are systematically organized in separate directories corresponding to their respective disease labels, facilitating automated processing and maintaining clear categorical boundaries for supervised learning. The feature extraction phase constitutes a critical component of the pipeline, where ten discriminative features are computed from each image to capture the essential visual characteristics of disease manifestations. The extraction process encompasses multiple feature domains: color features including red and green channel means, red-green ratio, and HSV hue and saturation means to capture disease-induced color variations; texture features such as GLCM contrast and energy that quantify surface irregularities and uniformity patterns; statistical features including intensity standard deviation and color variance that measure pixel distribution characteristics; and shape features represented by edge density that captures boundary information of diseased regions. This comprehensive feature set is specifically designed to encode the visual signatures of various tomato diseases while maintaining computational efficiency. The flowchart of the classification process is shown in Fig. 1.
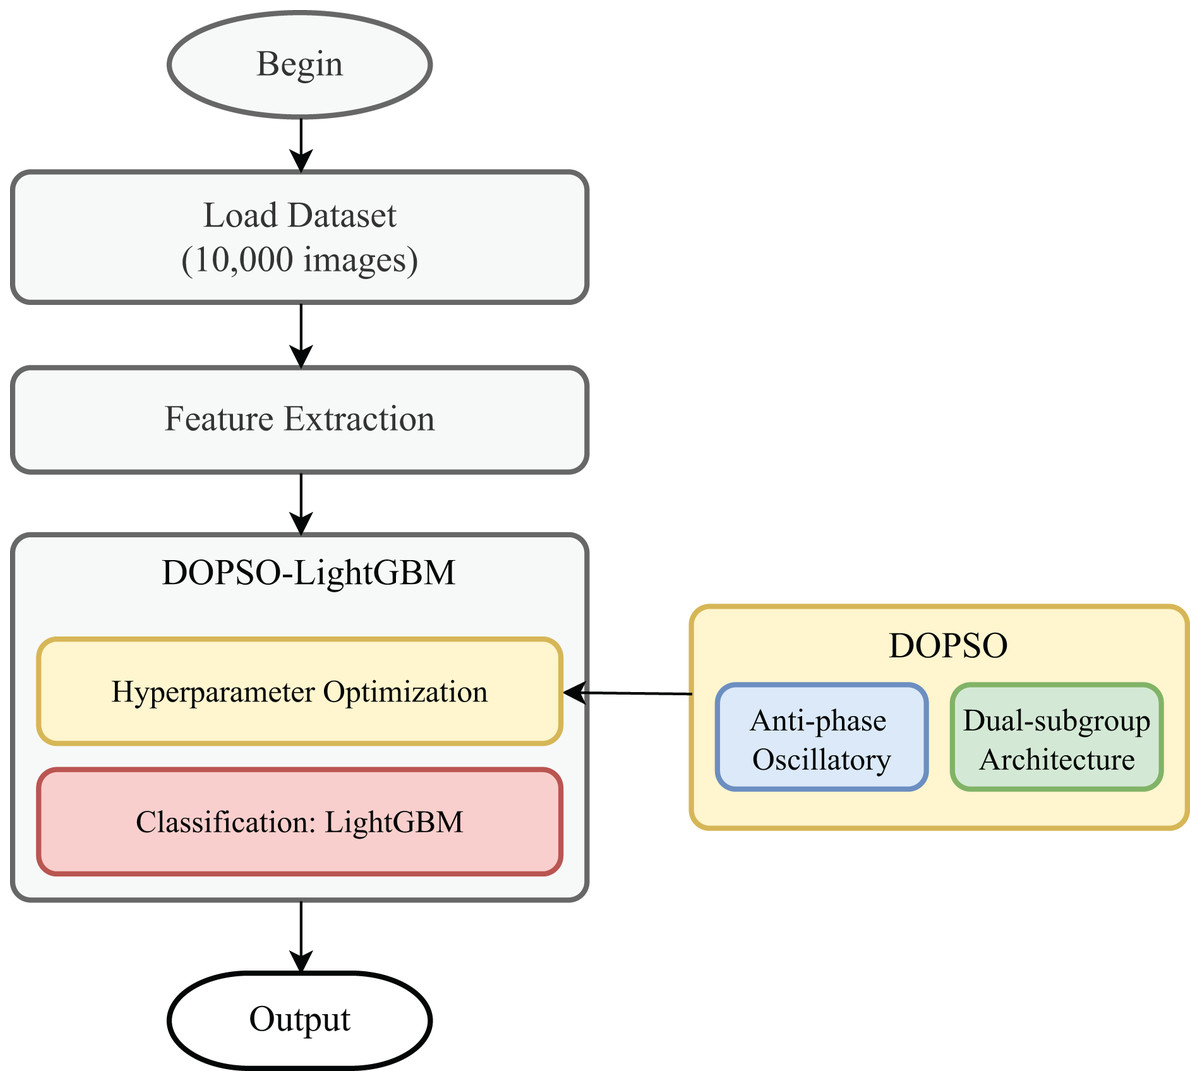
Figure 1: Flowchart of the classification process.
Results
Experimental data
The experimental framework utilizes a balanced tomato leaf pathology datasets containing 10,000 standardized images organized into ten classification categories, each represented by 1,000 samples to maintain statistical equilibrium. The datasets incorporates healthy control specimens and nine disease manifestations spanning bacterial, fungal, viral, and pest-induced pathologies. All image samples underwent preprocessing normalization protocols to achieve uniform dimensional and quality standards, enabling consistent feature extraction and robust performance assessment across pathological classifications.
The experimental comparison encompasses a comprehensive set of baseline methods representing different paradigms in machine learning for agricultural image classification. Traditional machine learning group includes Support Vector Machine (SVM), Logistic Regression K-Nearest Neighbors (KNN), and Random Forest. To evaluate the effectiveness of DOPSO, traditional PSO, Differential Evolution (DE), and Genetic Algorithm (GA) are also used to optimize the hyperparameters of LightGBM. LightGBM based group includes traditional LightGBM, PSO-LightGBM, DE-LightGBM and GA-LightGBM. To ensure fairness in the experiments, all population-based algorithms used the same parameter settings: a population size of 20 and a maximum of 30 iterations. For DOPSO, parameters are set: population size 20, subgroup size 10, inertia weight 0.7, = = 2.0.
All experiments were conducted on a workstation equipped with an Intel Core i7-10700 CPU (8 cores, 16 logical processors) running at 2.90 GHz, 32 GB of DDR4 RAM, and an NVIDIA GeForce RTX 3080 GPU with 4 GB of dedicated memory, Microsoft Windows 11 operation system.
The classification stage employs the DOPSO-LightGBM framework, where the extracted features serve as input to the optimized gradient boosting model. The DOPSO algorithm systematically explores the eight-dimensional hyperparameter space of LightGBM through its dual subgroup architecture and oscillatory perturbation mechanism. Details of hyperparameters are shown in Table 1.
| No. | Hyperparameter | Lower bound | Upper bound | Description |
|---|---|---|---|---|
| 1 | learning_rate | 0.01 | 0.1 | Learning rate for gradient boosting |
| 2 | num_leaves | 20 | 150 | Maximum number of leaves in one tree |
| 3 | max_depth | 4 | 10 | Maximum tree depth |
| 4 | min_child_samples | 10 | 50 | Minimum number of samples in a leaf |
| 5 | subsample | 6 | 1.0 | Subsample ratio of training instances |
| 6 | colsample_bytree | 0.6 | 1.0 | Subsample ratio of features |
| 7 | reg_alpha | 0 | 5 | L1 regularization term |
| 8 | reg_lambda | 0 | 5 | L2 regularization term |
The optimized model undergoes training on 80% of the dataset while utilizing 20% for testing, with additional validation splits employed during the optimization process. The final pipeline outputs classification predictions with associated confidence scores, enabling accurate disease identification and providing agricultural practitioners with reliable diagnostic capabilities for early intervention and crop management strategies. Details of datasets are shown in Table 2.
| Type | Class name | Samples | Disease category |
|---|---|---|---|
| Type 1 | Healthy | 1,000 | Healthy |
| Type 2 | Tomato_mosaic_virus | 1,000 | Bacterial disease |
| Type 3 | Tomato_Yellow_Leaf_Curl_Virus | 1,000 | Fungal disease |
| Type 4 | Target_Spot | 1,000 | Fungal disease |
| Type 5 | Spider_mites Two-spotted_spider_mite | 1,000 | Fungal disease |
| Type 6 | Septoria_leaf_spot | 1,000 | Fungal disease |
| Type 7 | Leaf_Mold | 1,000 | Fungal disease |
| Type 8 | Late_blight | 1,000 | Viral disease |
| Type 9 | Early_blight | 1,000 | Viral disease |
| Type 10 | Bacterial_spot | 1,000 | Pest damage |
Prior to feature extraction, each input image undergoes a standardized preprocessing procedure. All images are resized to a uniform dimension of 256 * 256 pixels to ensure consistent feature computation across the datasets.
The feature extraction process constitutes a critical component of the tomato disease classification pipeline, where ten carefully selected features are computed from each image to capture the essential visual characteristics of disease manifestations. These features span multiple domains including color information, texture properties, statistical characteristics, and shape descriptors, providing comprehensive representation of disease-induced visual changes in tomato leaves.
The following ten features were systematically extracted from each tomato leaf image:
Red channel mean (red_mean): Computes the average intensity of the red color channel across all pixels in the image. This feature is particularly valuable for detecting diseases that cause reddish-brown discoloration, such as bacterial spot and early blight, where pathological changes manifest as distinct red pigmentation patterns.
Green channel mean (green_mean): Calculates the mean intensity of the green color channel, representing the overall greenness of the leaf tissue. Healthy leaves typically exhibit high green channel values, while diseased areas often show reduced green intensity due to chlorophyll degradation and tissue necrosis.
Red-green ratio (rg_ratio): Derived as the ratio between red and green channel means, this feature effectively captures the color balance shift that occurs during disease progression. Diseased regions typically exhibit higher red-green ratios compared to healthy tissue, making this feature particularly discriminative for pathological condition identification.
HSV hue mean (hsv_hue_mean): Represents the average hue value in the HSV color space, providing perceptually uniform color information that aligns with human visual perception. This feature captures subtle color variations that may not be apparent in RGB space, particularly useful for distinguishing between similar disease symptoms.
HSV saturation mean (hsv_saturation_mean): Measures the average color saturation, indicating the purity and vividness of colors in the leaf image. Disease-affected areas often exhibit altered saturation levels due to tissue degradation and pigment changes.
GLCM contrast (glcm_contrast): Computed using Gray-Level Co-occurrence Matrix analysis, this feature quantifies the local intensity variations and texture roughness. Diseased regions typically exhibit higher contrast values due to irregular surface patterns, lesion boundaries, and tissue deterioration.
GLCM energy (glcm_energy): Measures texture uniformity and homogeneity through GLCM analysis. Healthy leaf surfaces demonstrate higher energy values indicating uniform texture, while diseased areas show reduced energy due to irregular patterns and surface disruptions.
Intensity standard deviation (intensity_std): Calculates the standard deviation of grayscale pixel intensities, capturing the variability in brightness across the image. Diseased leaves typically exhibit higher intensity variation due to the presence of spots, lesions, and irregular pigmentation patterns.
Color variance (color_variance): Computes the average variance across all three RGB color channels, providing a comprehensive measure of color distribution complexity. Disease-affected regions generally demonstrate increased color variance due to mixed healthy and pathological tissue areas.
Edge density (edge_density): Determined using Canny edge detection followed by edge pixel ratio calculation, this feature captures the boundary information and structural complexity. Diseased leaves typically exhibit higher edge density due to lesion boundaries, spot perimeters, and irregular tissue structures characteristic of pathological conditions.
The heat map of experimental data is shown in Fig. 2.
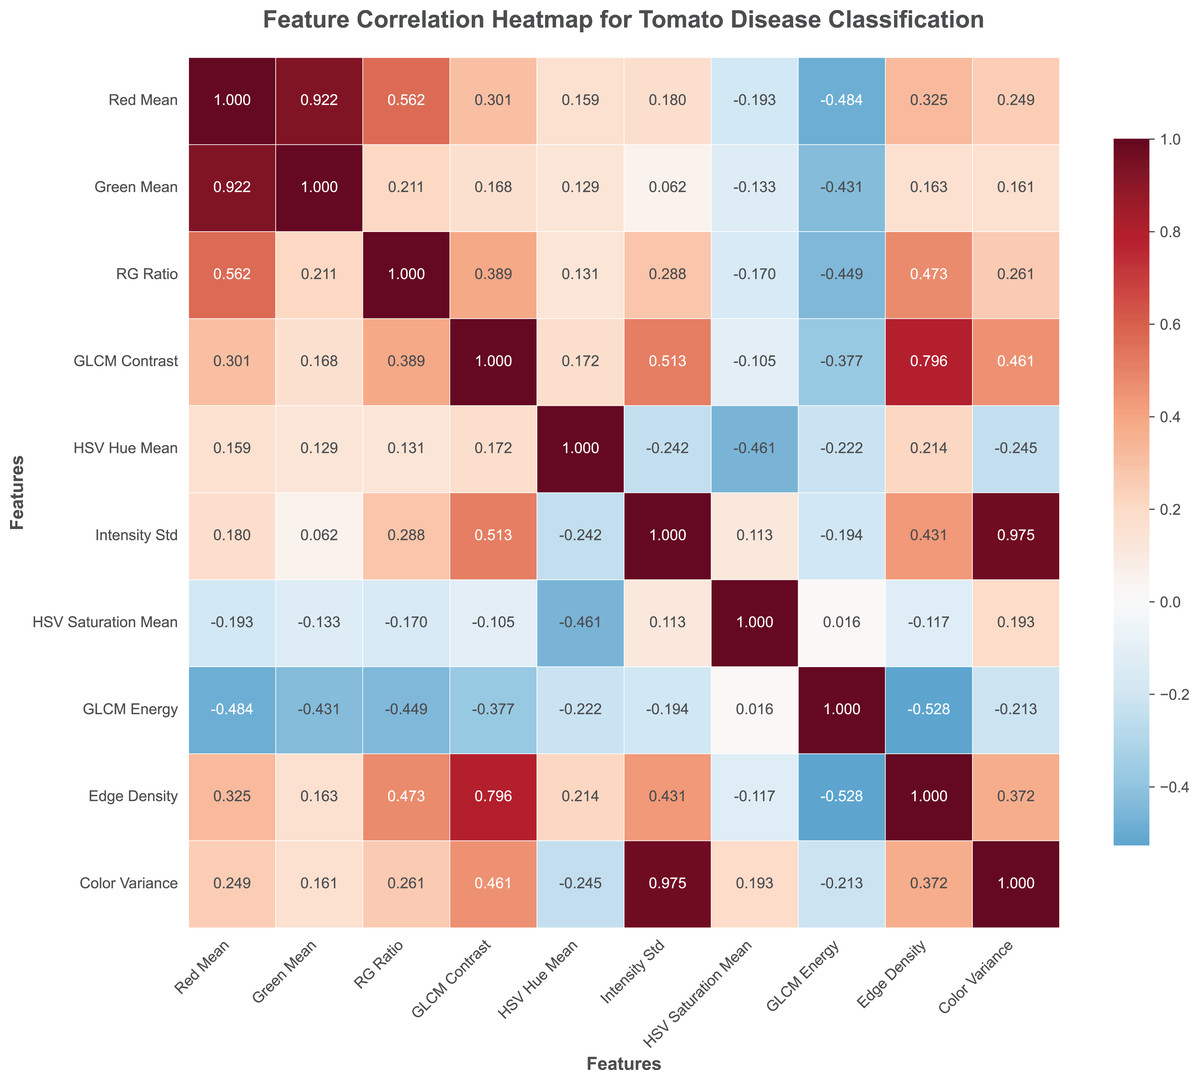
Figure 2: Feature correlation with tomato disease figures.
Experimental results
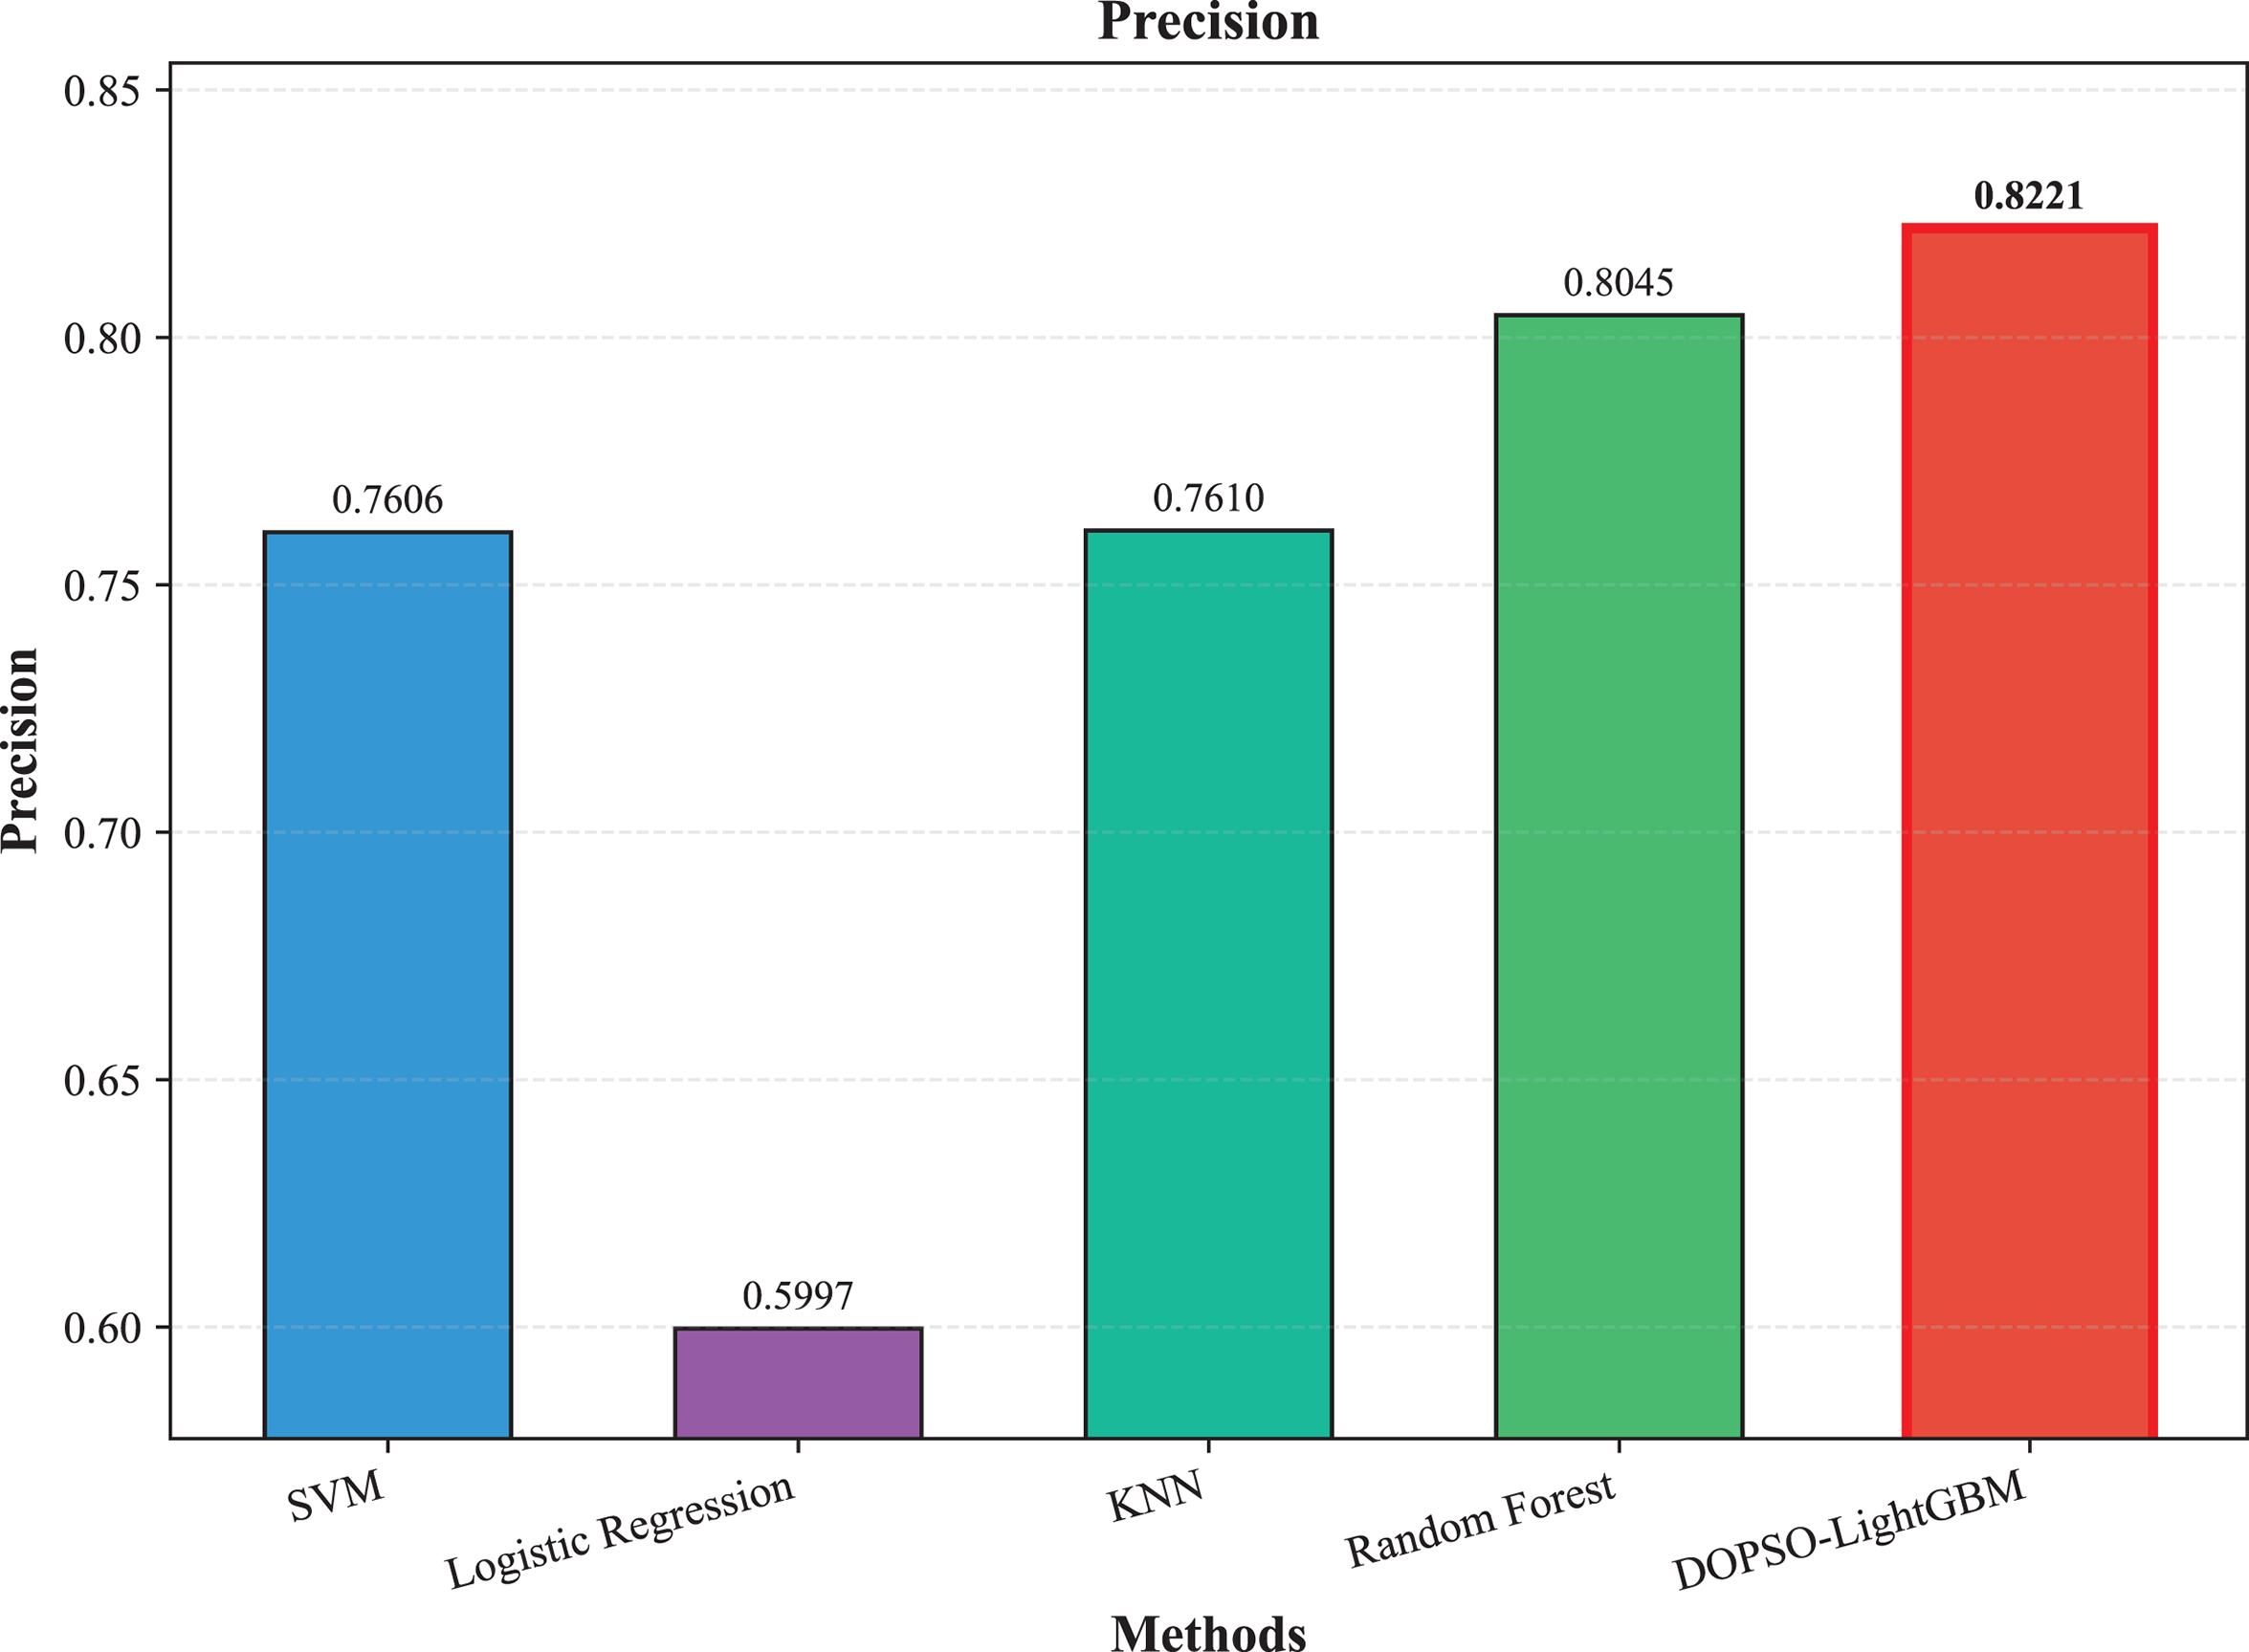
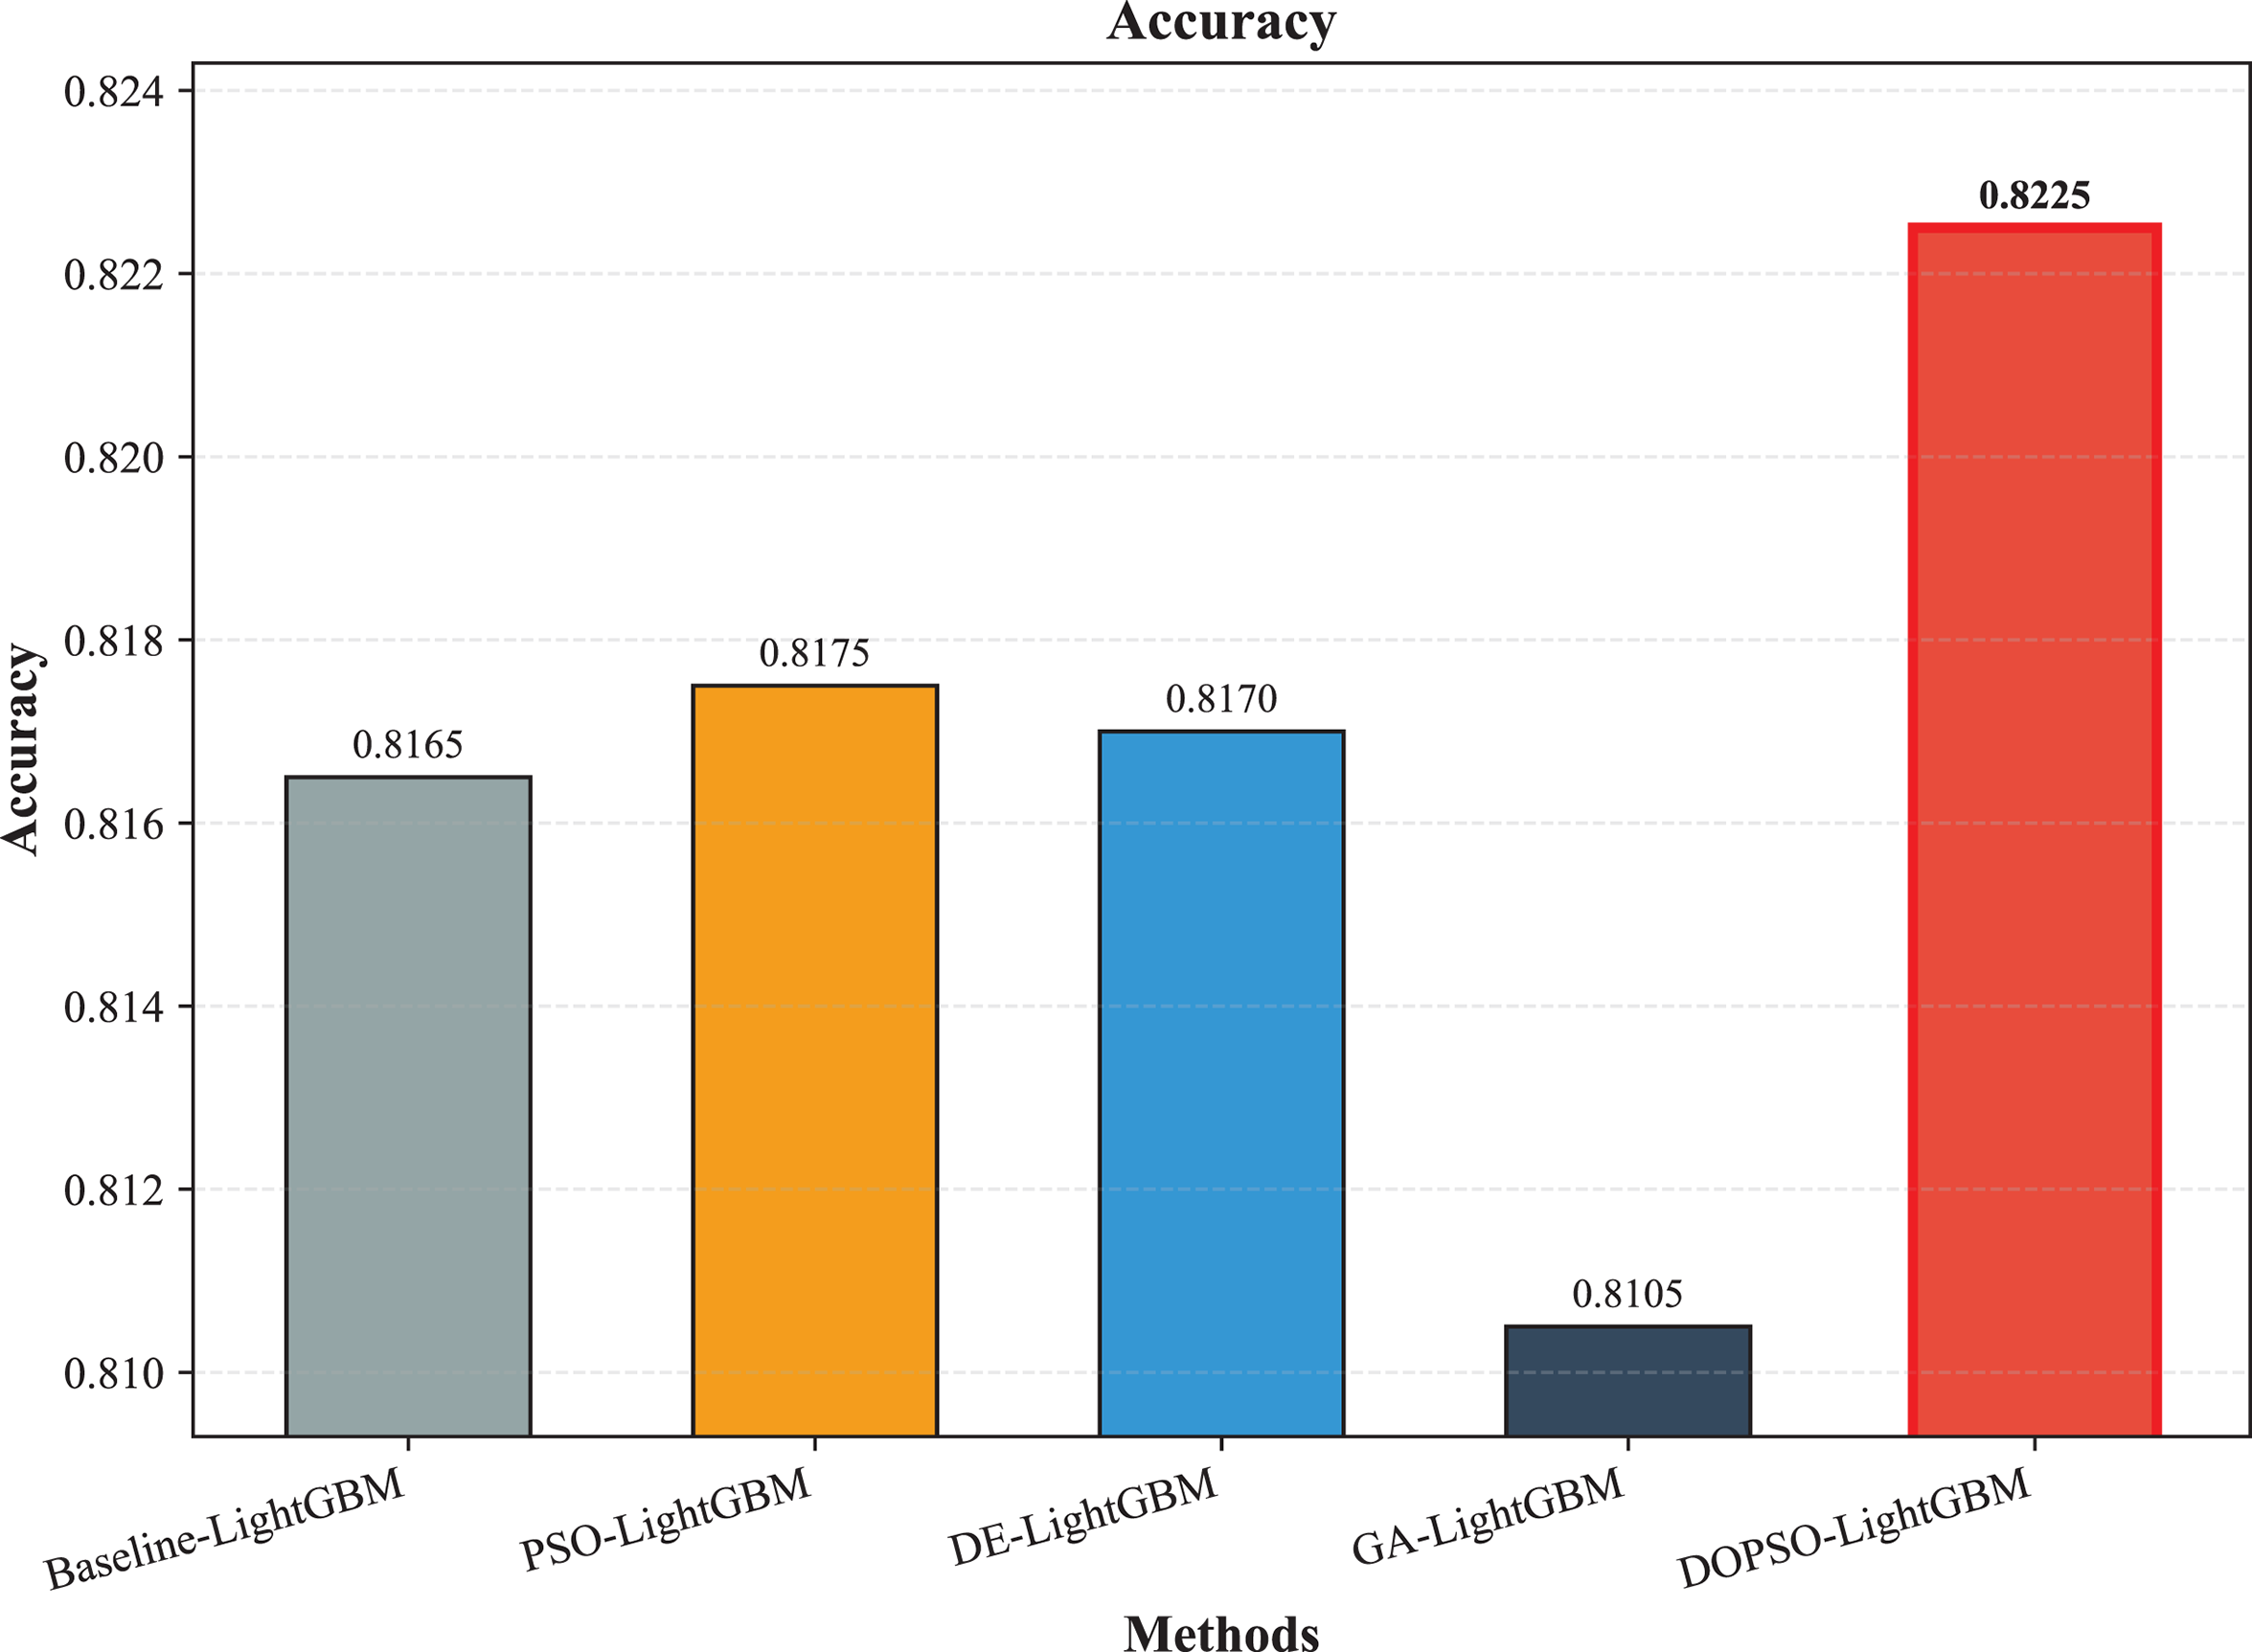
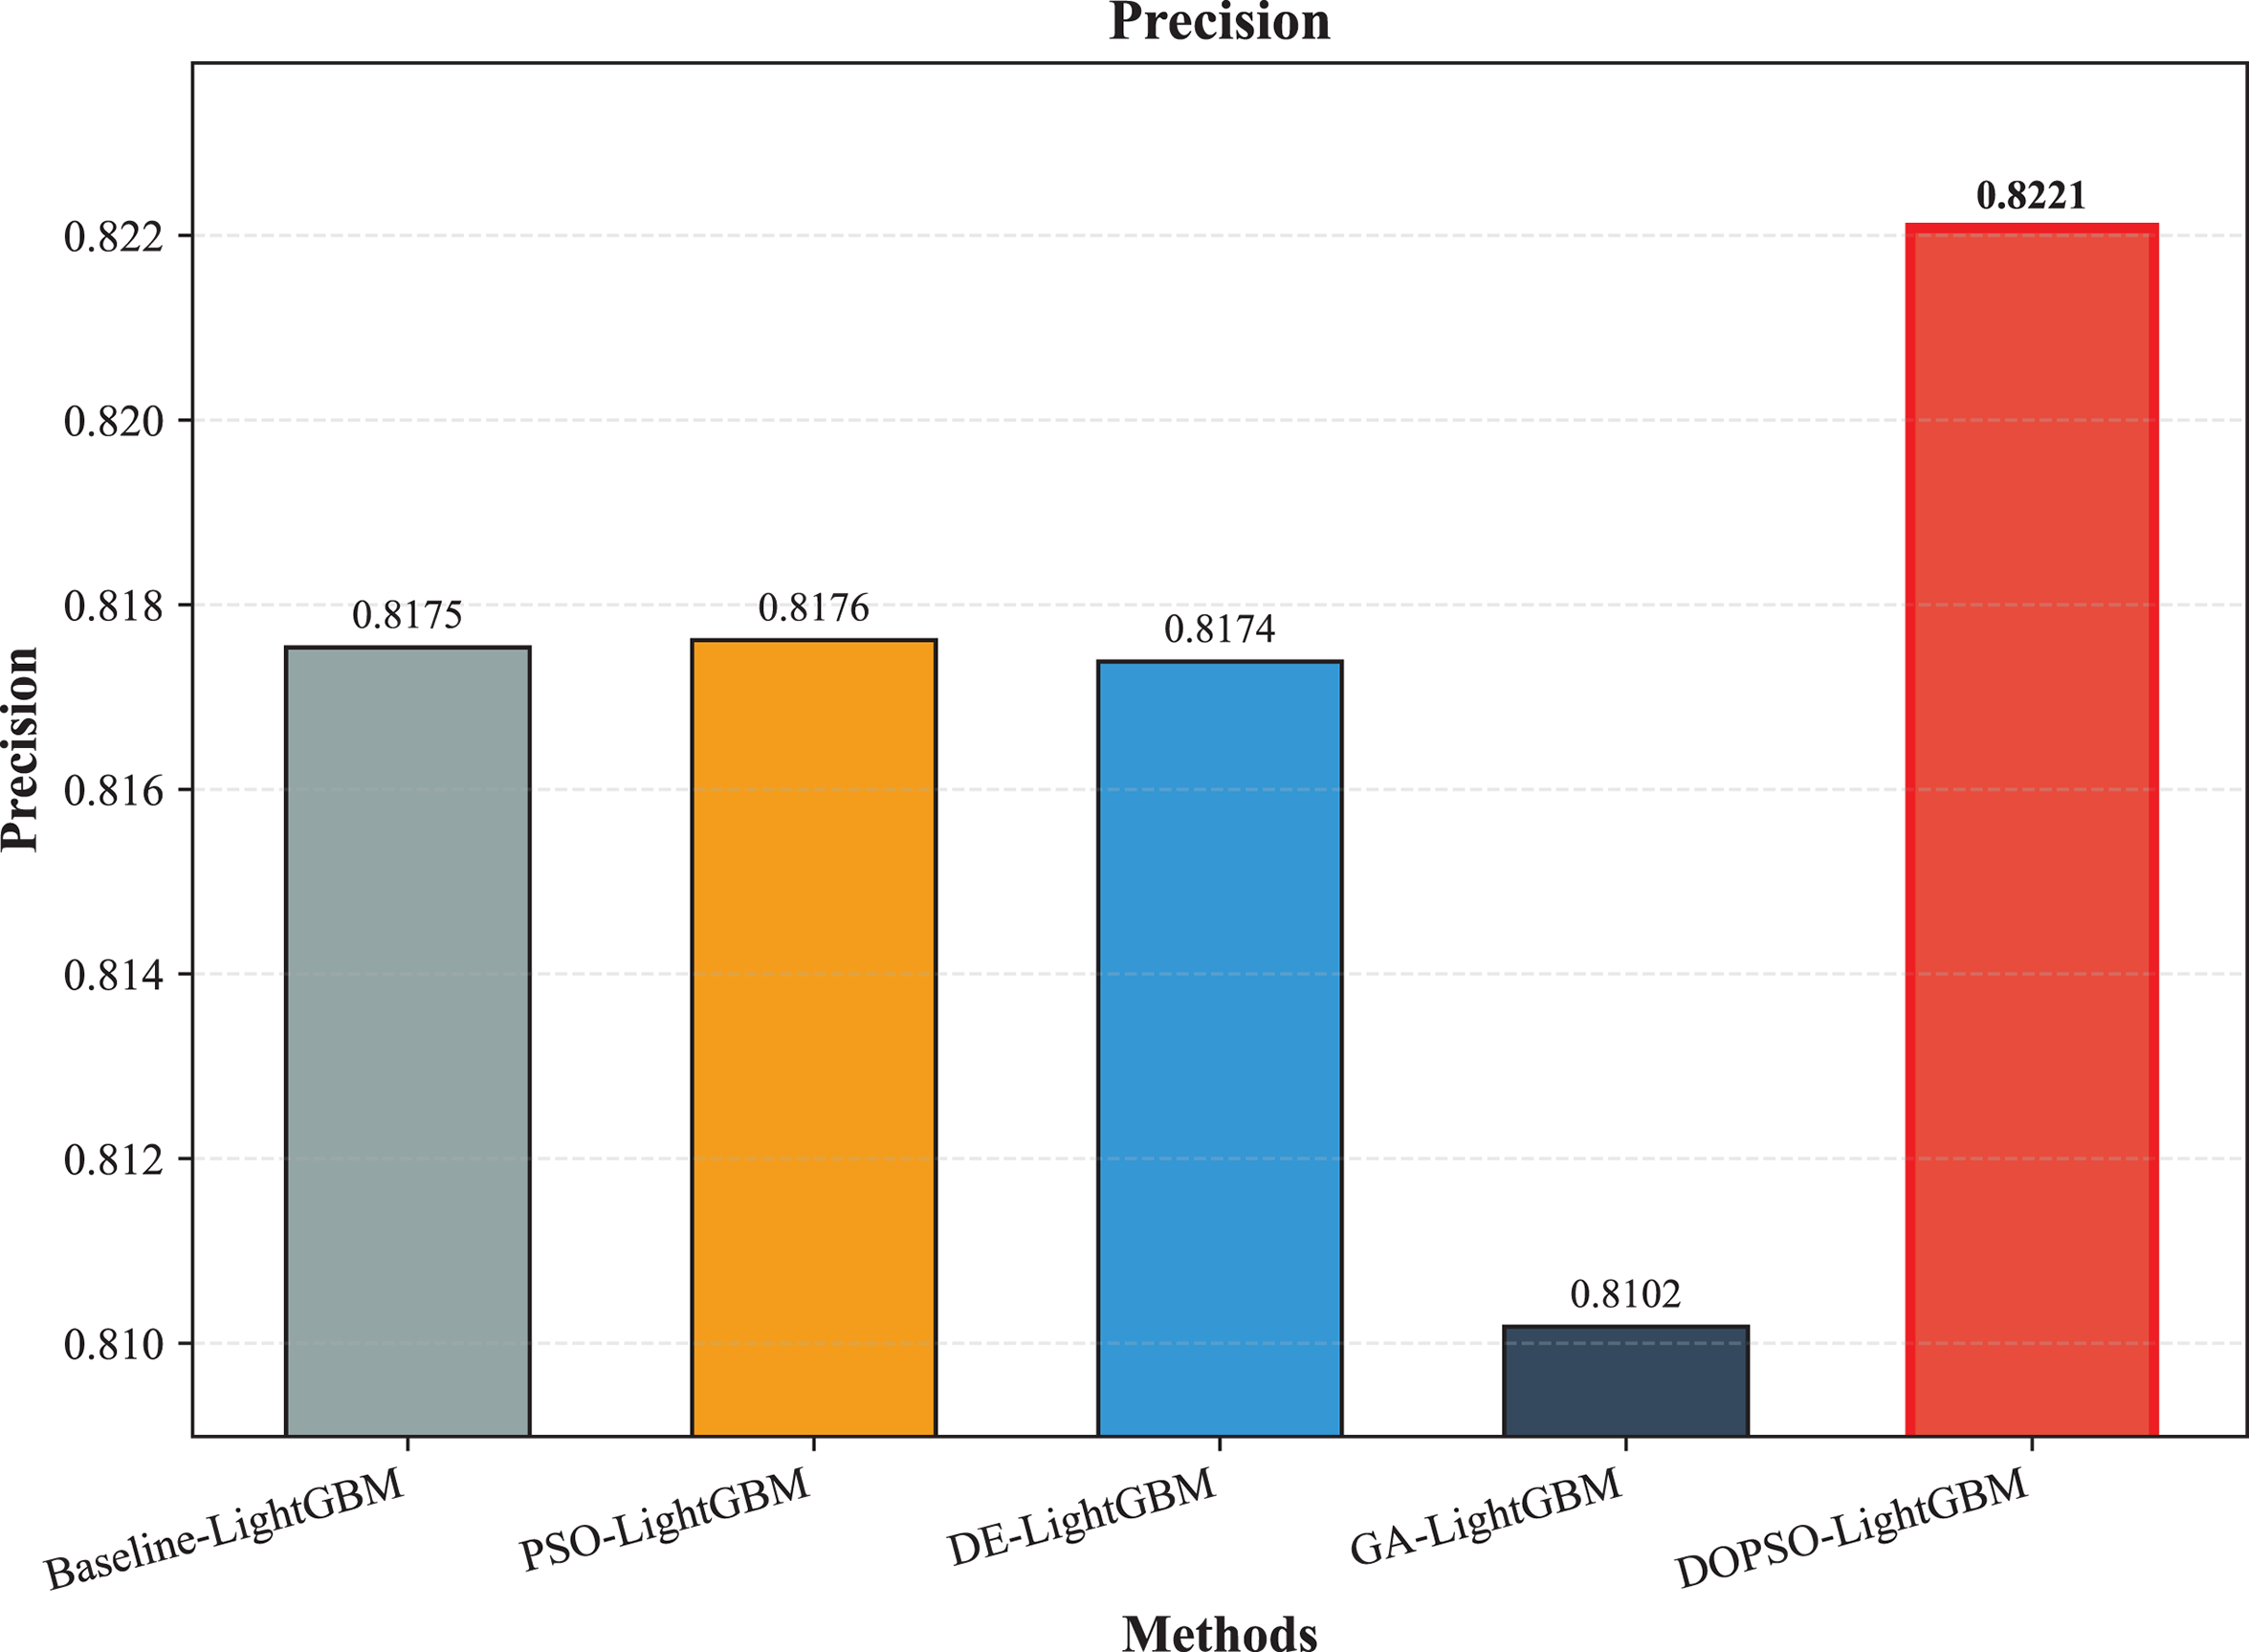
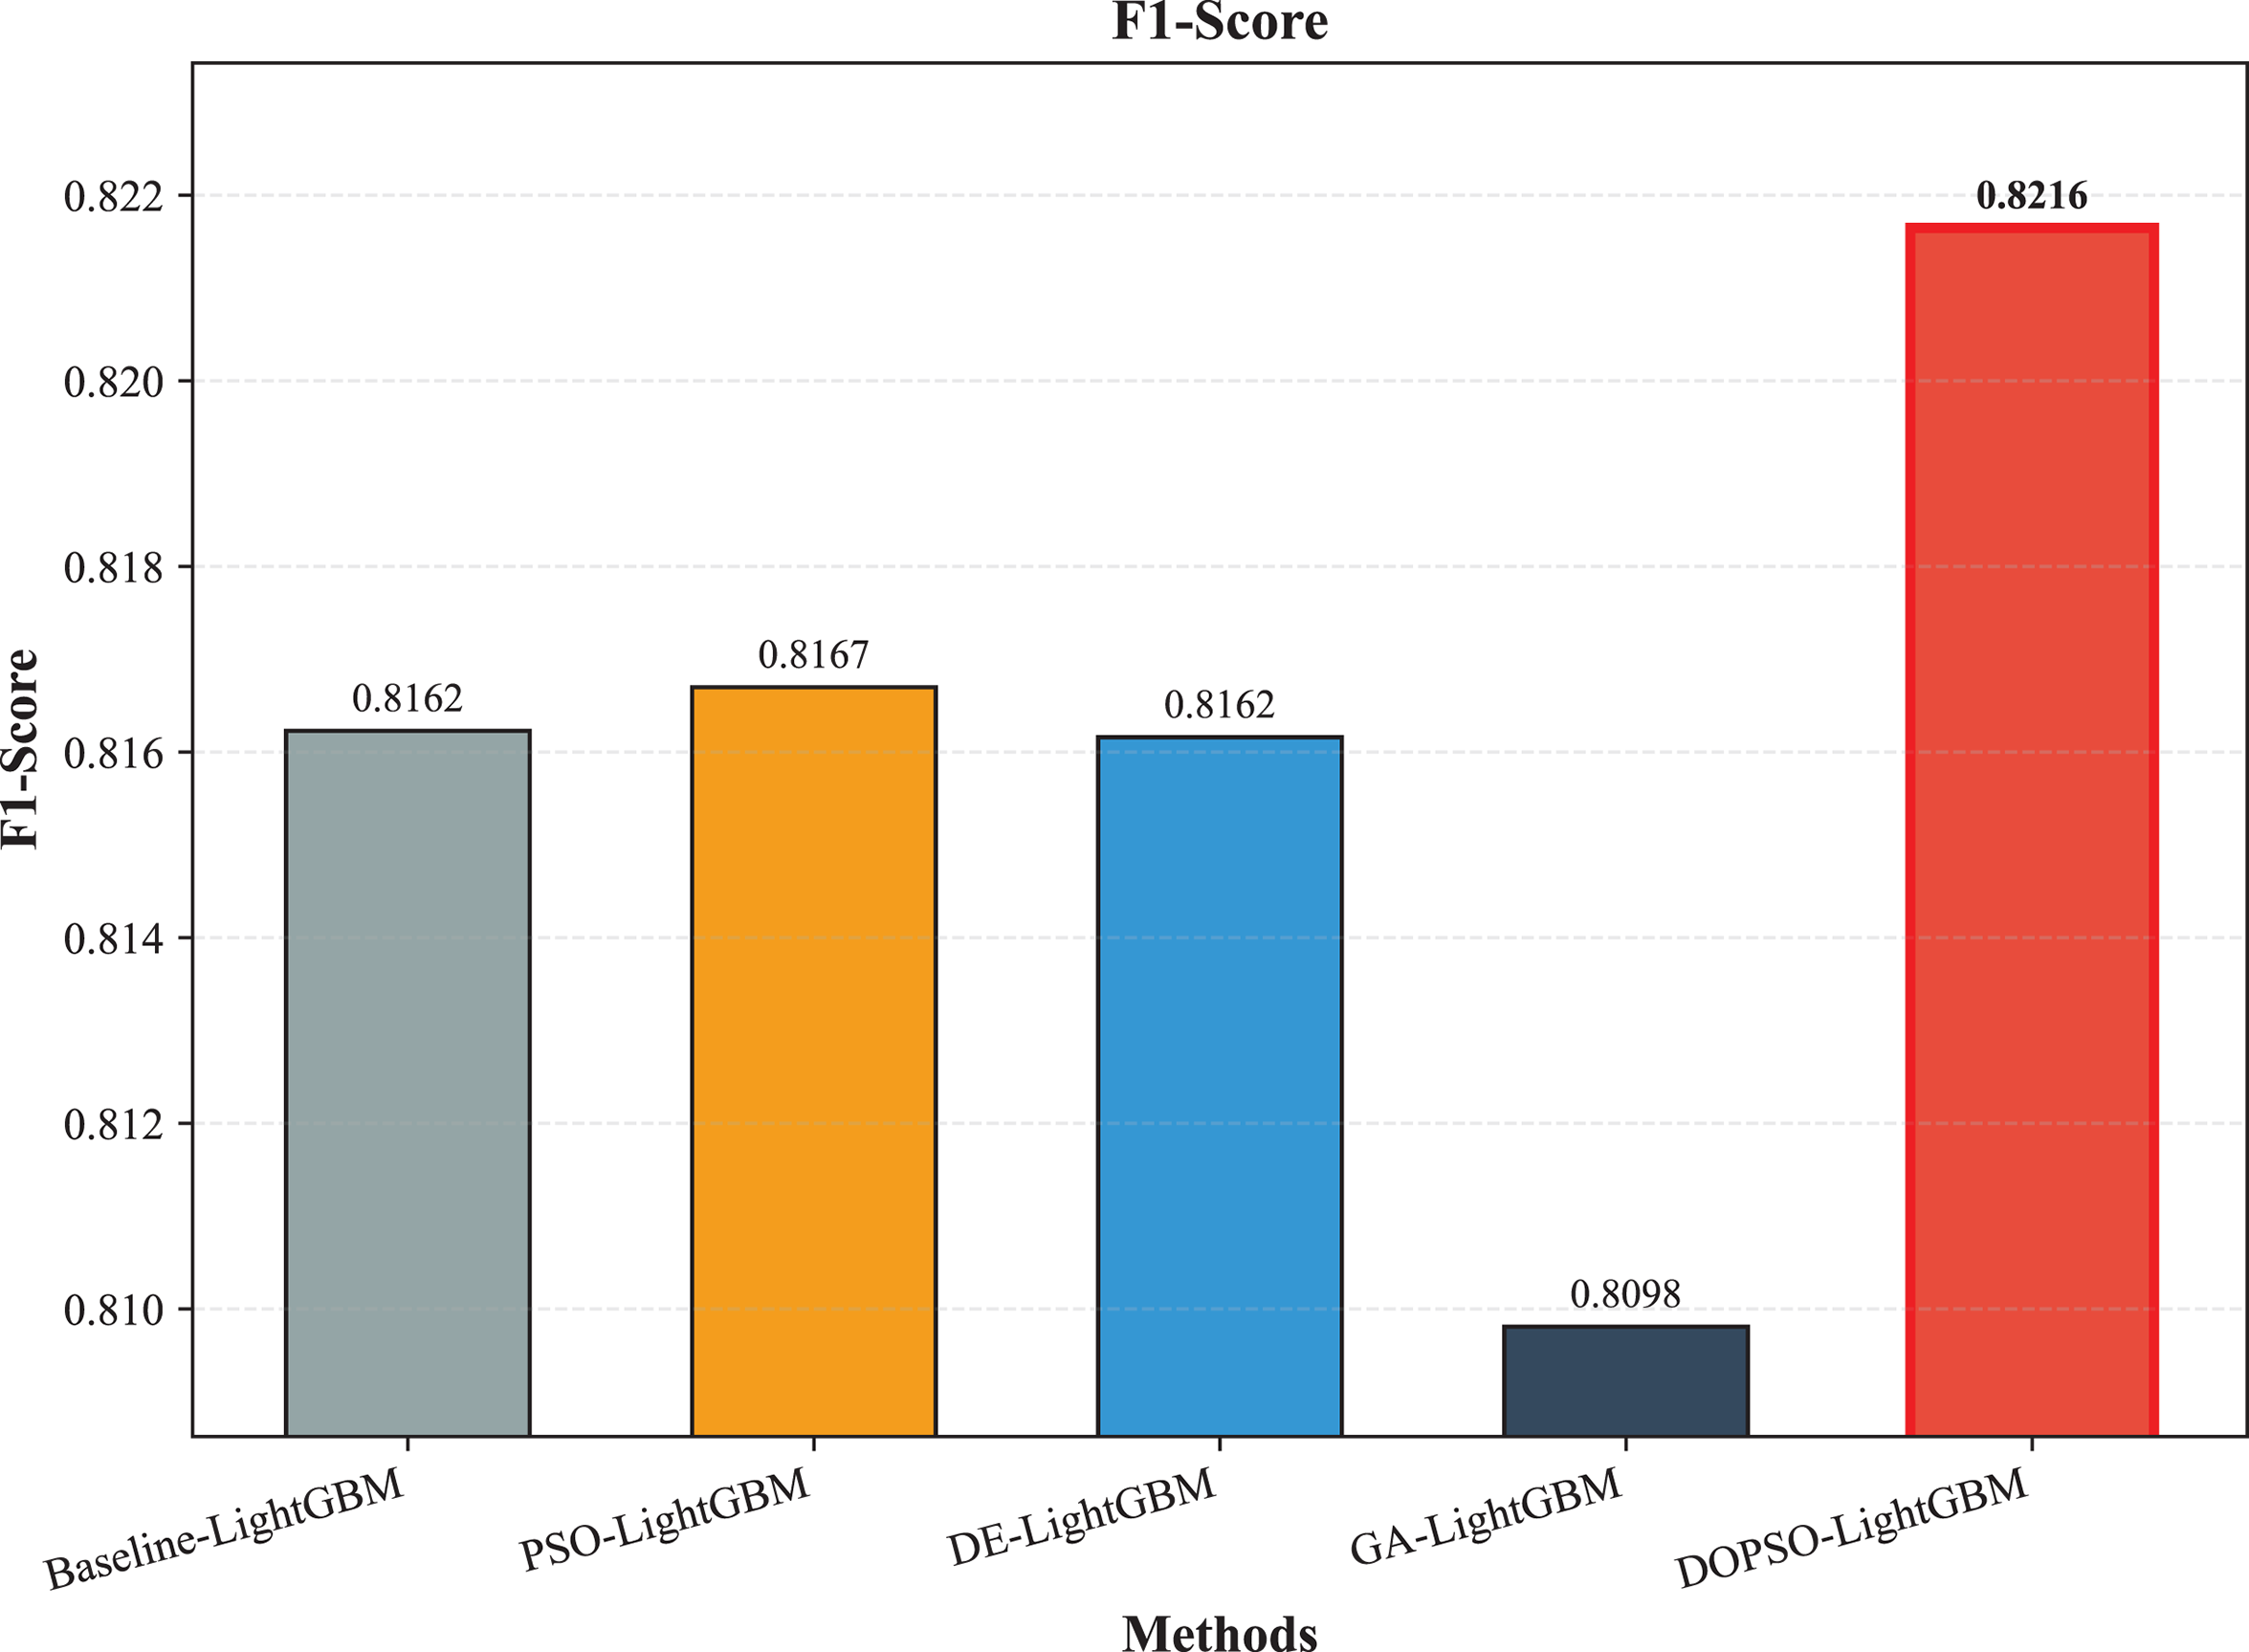
The experimental results presented in Table 3 demonstrate the superior performance of the proposed DOPSO-enhanced algorithms compared to traditional machine learning approaches and standard PSO optimization methods. DOPSO-LightGBM achieved the highest classification accuracy of 82.25%, representing a significant improvement over conventional approaches. This outstanding performance can be attributed to the synergistic combination of LightGBM’s efficient gradient boosting framework and DOPSO’s enhanced hyperparameter optimization capabilities.
| Method | Accuracy | Error Rate | Precision | Recall | F1-score |
|---|---|---|---|---|---|
| SVM | 0.7600 | 0.2400 | 0.7606 | 0.7600 | 0.7577 |
| Logistic Regression | 0.6105 | 0.3895 | 0.5997 | 0.6105 | 0.6005 |
| KNN | 0.7595 | 0.2405 | 0.7610 | 0.7595 | 0.7575 |
| Random Forest | 0.8035 | 0.1965 | 0.8045 | 0.8035 | 0.8023 |
| LightGBM | 0.8165 | 0.1835 | 0.8175 | 0.8165 | 0.8162 |
| PSO-LightGBM | 0.8175 | 0.1825 | 0.8176 | 0.8175 | 0.8167 |
| DE-LightGBM | 0.8170 | 0.1830 | 0.8174 | 0.8170 | 0.8162 |
| GA-LightGBM | 0.8105 | 0.1895 | 0.8102 | 0.8105 | 0.8098 |
| DOPSO-LightGBM | 0.8225 | 0.1775 | 0.8221 | 0.8225 | 0.8216 |
The experimental results presented in Table 3 demonstrate the superior performance of the proposed DOPSO-LightGBM method across all evaluation metrics for tomato disease classification. DOPSO-LightGBM achieved the highest accuracy of 82.25%, with corresponding precision of 82.21%, recall of 82.25%, and F1-score of 82.16%, while maintaining the lowest error rate of 17.75%. Among traditional machine learning approaches, Logistic Regression exhibited the poorest performance with 61.05% accuracy, while SVM and KNN achieved comparable results around 76%. Random Forest, as an ensemble method, demonstrated improved performance at 80.35%, highlighting the advantage of ensemble learning over single classifiers. The baseline LightGBM algorithm further enhanced classification accuracy to 81.65%, confirming the effectiveness of gradient boosting methods for this image classification task.
Details are shown in Figs. 3, 4, 5, 6, 7, 8, 9, and 10.
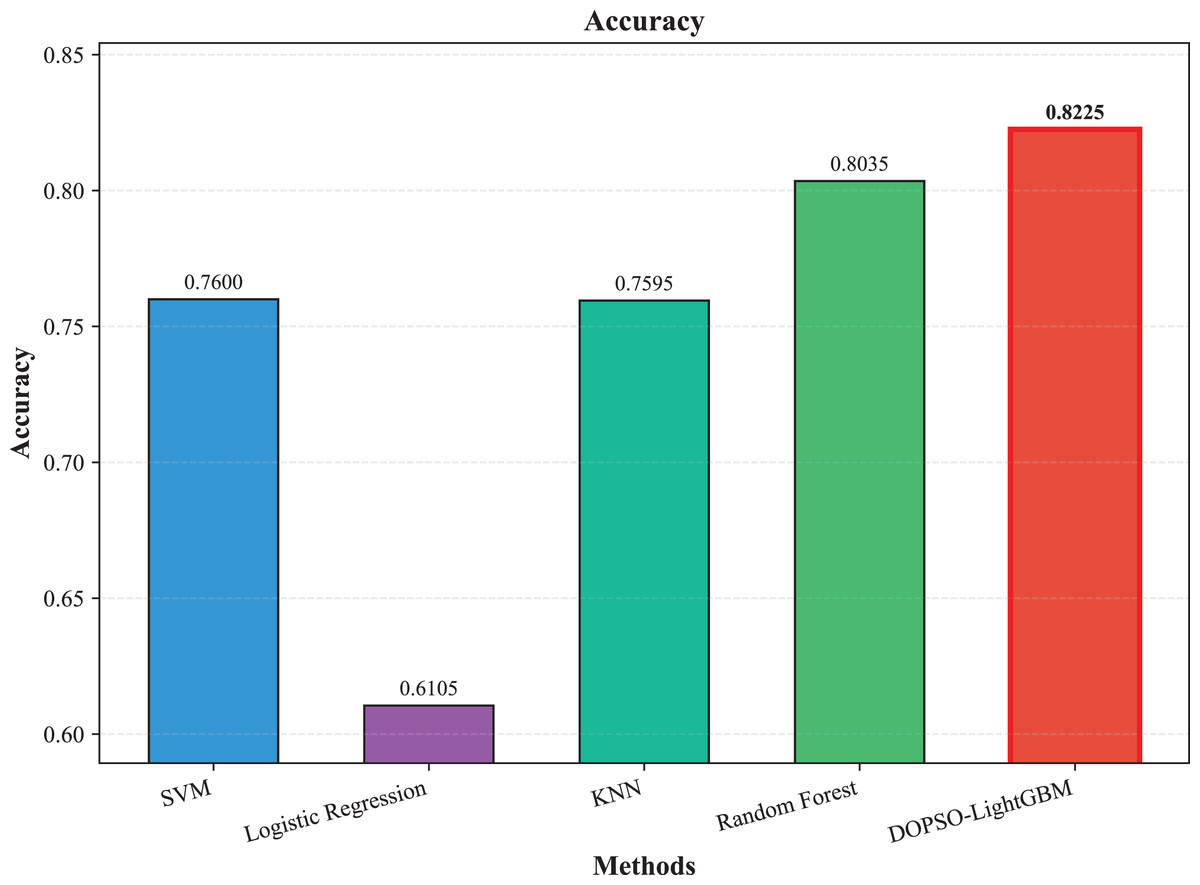
Figure 3: SVM, logistic regression KNN, random forest and DOPSO-LightGBM results: accuracy.

Figure 4: SVM, logistic regression KNN, random forest and DOPSO-LightGBM results: precision.

Figure 5: SVM, logistic regression KNN, random forest and DOPSO-LightGBM results: recall.

Figure 6: SVM, logistic regression KNN, random forest and DOPSO-LightGBM results: F1-score.

Figure 7: LightGBM, PSO-LightGBM DE-LightGBM, GA-LightGBM and DOPSO-LightGBM results: accuracy.
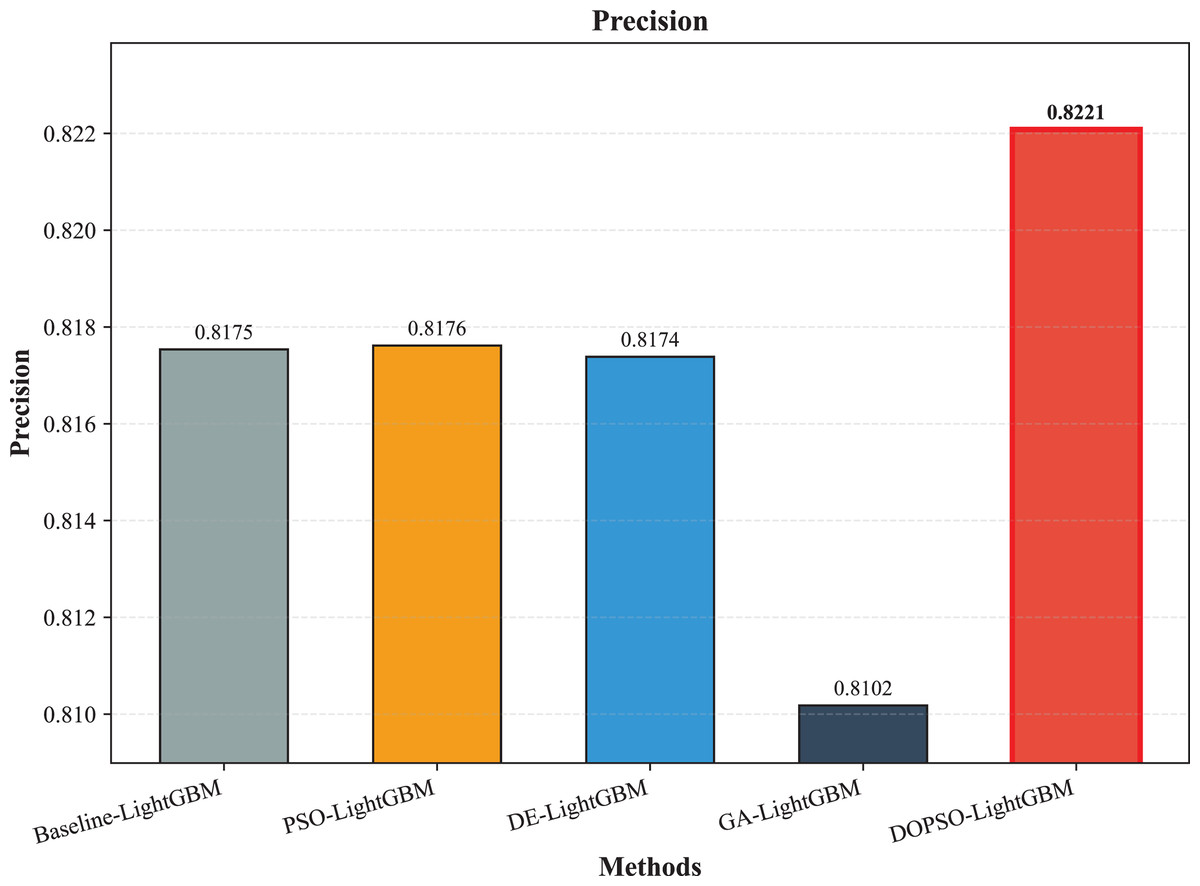
Figure 8: LightGBM, PSO-LightGBM DE-LightGBM, GA-LightGBM and DOPSO-LightGBM results: precision.
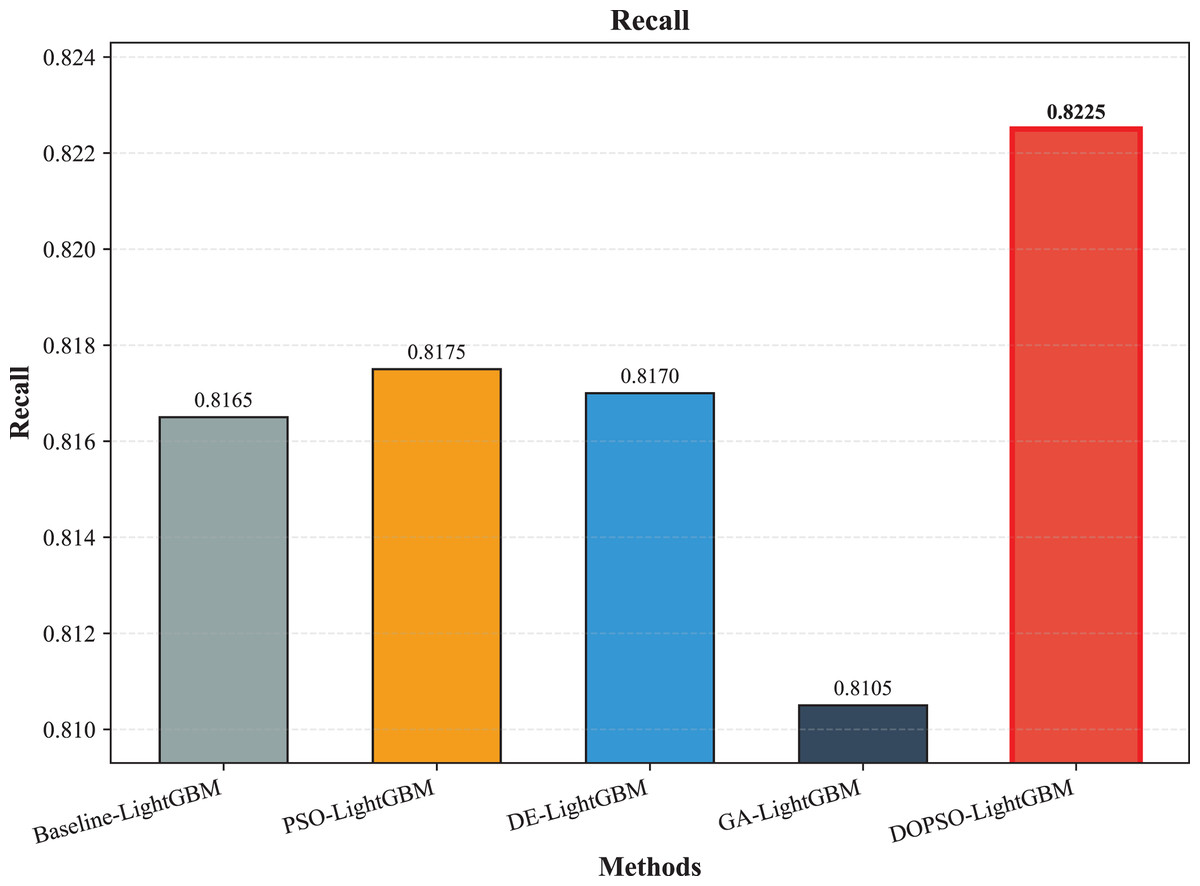
Figure 9: LightGBM, PSO-LightGBM DE-LightGBM, GA-LightGBM and DOPSO-LightGBM results: recall.
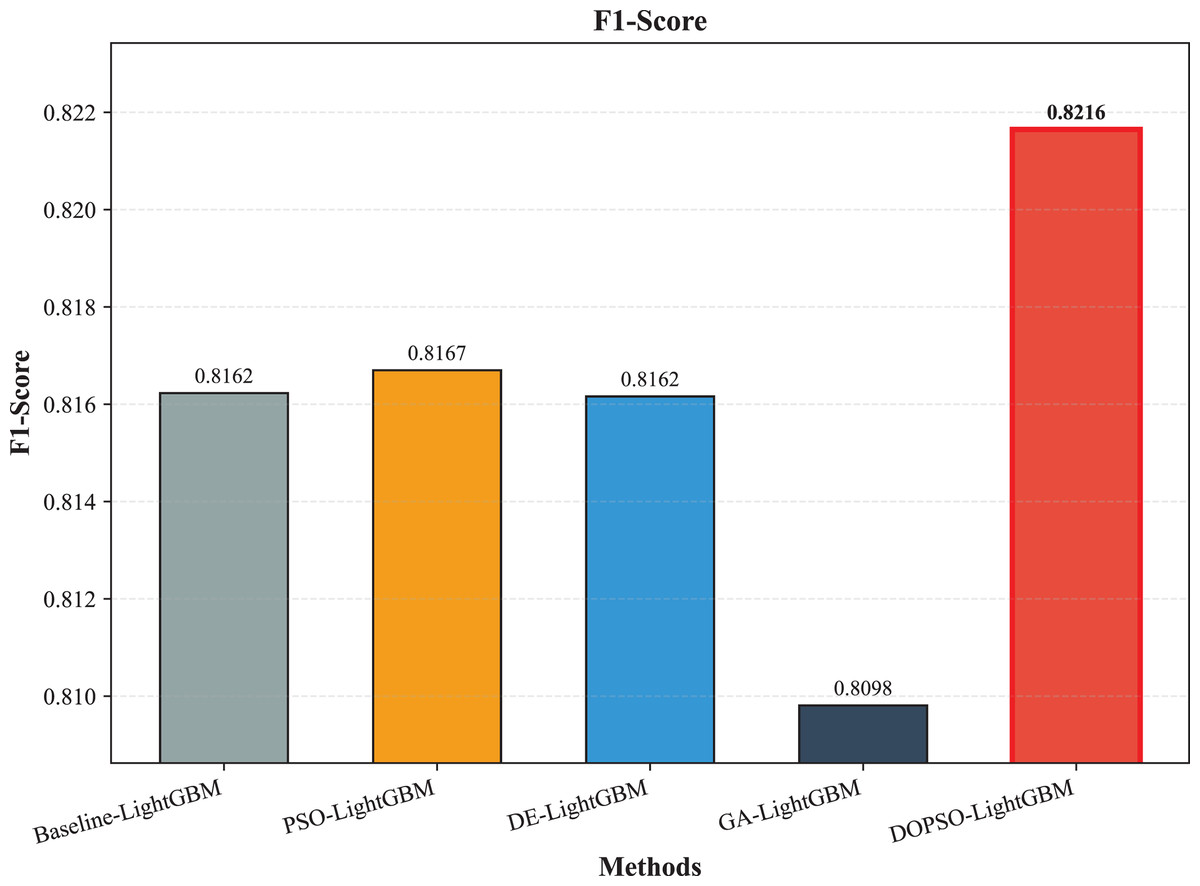
Figure 10: LightGBM, PSO-LightGBM DE-LightGBM, GA-LightGBM and DOPSO-LightGBM results: F1-score.
Analysis and discussion
The integration of metaheuristic optimization algorithms with LightGBM yielded varying degrees of improvement, with DOPSO demonstrating the most significant enhancement. Specifically, DOPSO-LightGBM outperformed PSO-LightGBM (81.75%), DE-LightGBM (81.70%), and GA-LightGBM (81.05%) by 0.50, 0.55, and 1.20 percentage points, respectively. This performance hierarchy validates the efficacy of the proposed dual oscillatory mechanism in hyperparameter optimization, achieving a 0.60 percentage point improvement over the baseline LightGBM. The consistent values across precision, recall, and F1-score metrics for all methods indicate balanced classification performance across different tomato disease categories, suggesting no significant bias toward specific classes. These results empirically confirm that the DOPSO algorithm’s anti-phase oscillatory operators and dual-subgroup architecture effectively address premature convergence issues, leading to superior hyperparameter configurations for agricultural image classification tasks.
The oscillatory coefficients create a dynamic balance between exploration and exploitation. In early iterations, the large amplitude oscillations promote extensive search space exploration, while the gradual amplitude decay in later iterations facilitates precise convergence to optimal hyperparameter configurations. The periodic information exchange between subgroups prevents algorithmic stagnation and ensures comprehensive coverage of the hyperparameter landscape.
Limitations and future research directions
Several limitations of the current study warrant consideration. First, although DOPSO demonstrates effectiveness in optimizing hyperparameters for gradient boosting frameworks, its current application scope remains confined to parameter tuning rather than structural optimization. Second, the computational cost per fitness evaluation is relatively high due to the requirement of training and validating machine learning models, which represents a primary direction for future optimization.
Future research will address these limitations through three strategic directions. First, we plan to extend the functionality of DOPSO from hyperparameter optimization to neural architecture search (NAS), thereby enabling automatic discovery of optimal network structures for disease classification tasks. This extension would allow the algorithm to simultaneously optimize both architectural configurations and training parameters, potentially yielding more effective classification models. Second, we aim to develop a lightweight, real-time detection framework suitable for unmanned aerial vehicle (UAV) deployment. This framework will integrate model compression techniques, such as knowledge distillation and network pruning, with efficient inference strategies to achieve real-time responsiveness on resource-constrained mobile devices. Third, we intend to generalize the DOPSO-based recognition methodology to diverse plant species, enabling comprehensive crop disease identification across a broader range of agricultural applications. This generalization will involve the construction of multi-species disease datasets and the development of transfer learning approaches to facilitate cross-domain knowledge sharing.
Conclusions
This research presents the development and application of DOPSO for tomato disease classification, addressing the critical challenge of hyperparameter optimization in agricultural machine learning systems. The proposed DOPSO algorithm introduces two synergistic innovations: anti-phase oscillatory operators that dynamically balance exploration and exploitation phases to prevent premature convergence in high-dimensional optimization spaces, and dual-subgroup architecture that facilitates parallel search with periodic information exchange to preserve population diversity while accelerating convergence. These mechanisms work collaboratively to optimize seven critical LightGBM hyperparameters, establishing an effective optimization framework for complex agricultural image classification tasks.
Experimental validation on a comprehensive dataset of 10,000 tomato leaf images across ten categories demonstrates DOPSO-LightGBM’s superior performance, achieving 82.25% classification accuracy with balanced precision (82.21%), recall (82.25%), and F1-score (82.16%) metrics. The proposed method outperforms traditional machine learning approaches by substantial margins (21.20 percentage points over Logistic Regression, 6.25 over SVM) and shows consistent improvements over other metaheuristic-optimized variants, including PSO-LightGBM (0.50 percentage points), DE-LightGBM (0.55 percentage points), and GA-LightGBM (1.20 percentage points). These results empirically validate that DOPSO’s oscillatory mechanism and dual-subgroup strategy effectively address the limitations of conventional optimization algorithms in agricultural computer vision applications.
Future research will focus on addressing current limitations and expanding the framework’s practical applicability. Priority directions include developing unsupervised classification methods to mitigate the labor-intensive data annotation requirements, extending DOPSO to NAS for automatic network structure discovery, and optimizing the framework for real-time deployment for drone-based monitoring. Additionally, validating DOPSO’s generalizability across other economically important crops will establish its broader utility in precision agriculture, ultimately contributing to enhanced food security through automated disease detection systems.