
Design of an intelligent optimization framework for corporate financial management based on GA-FL-transformer
- Published
- Accepted
- Received
- Academic Editor
- Muhammad Asif
- Subject Areas
- Human-Computer Interaction, Algorithms and Analysis of Algorithms, Artificial Intelligence, Data Mining and Machine Learning, Neural Networks
- Keywords
- Genetic algorithm, Fuzzy logic, Transformer, Enterprise financial management, Multi-objective optimization, Risk control
- Copyright
- © 2026 Zhu et al.
- Licence
- This is an open access article distributed under the terms of the Creative Commons Attribution License, which permits unrestricted use, distribution, reproduction and adaptation in any medium and for any purpose provided that it is properly attributed. For attribution, the original author(s), title, publication source (PeerJ Computer Science) and either DOI or URL of the article must be cited.
- Cite this article
- 2026. Design of an intelligent optimization framework for corporate financial management based on GA-FL-transformer. PeerJ Computer Science 12:e3549 https://doi.org/10.7717/peerj-cs.3549
Abstract
This article addresses lenges in enterprise financial management, including difficulties in processing multi-source data, limited adaptability to dynamic environments, and a lack of systematic integration in the decision-making process. To tackle these issues, a new intelligent optimization framework, named genetic algorithm-fuzzy logic-Transformer (GA-FL-Transformer), is proposed. First, the framework employs the Transformer architecture to achieve unified encoding and feature fusion across multiple sources of financial data, high-dimensional features with strong discriminative power. Subsequently, an attention-weight-guided co-evolutionary mechanism integrating genetic algorithm (GA) and fuzzy logic (FL) is designed. This mechanism incorporates the features and attention weights into chromosome encoding, fitness function formulation, and genetic operations, thereby enabling dynamic optimization of fuzzy rules and membership functions. Finally, an intelligent optimization framework that integrates perception, optimization, and decision-making is constructed, achieving closed-loop optimization from data to decision-making via a bidirectional flow mechanism and supporting continuous learning and system-wide self-adjustment. Results on financial datasets from Compustat and CRSP show that the proposed method outperforms competing models in financial optimization. Ablation experiments further validate the contributions of the Transformer-based feature extraction, genetic algorithm optimization, and fuzzy reasoning mechanism to the system’s performance. This study provides a crucial theoretical foundation for enterprises to construct intelligent financial decision-making systems.
Introduction
Enterprise financial management, as a core component of modern enterprise strategy and operational systems, plays a pivotal role in resource allocation, risk control, and other critical areas. With the acceleration of globalization and the highly dynamic nature of market environments, financial decision-making problems have become increasingly complex, marked by multi-objectivity, nonlinearity, and uncertainty. Although traditional financial management methods, which rely on static models and single indicators, have made some advances in data processing and fundamental analysis, they exhibit significant shortcomings in adaptability and robustness when faced with uncertainties such as market fluctuations, policy changes, and unforeseen events. This limitation directly undermines enterprises’ comprehensive optimization capabilities in terms of capital allocation efficiency, risk control precision, and economic indicator forecasting, necessitating the introduction of more intelligent and adaptive modeling frameworks (Liu et al., 2024; Jiang & Yuan, 2025).
In recent years, the development of intelligent algorithms has provided new technological pathways for addressing the challenges. Genetic algorithm (GA) (Lambora, Gupta & Chopra, 2019), with its robust global search capability, has achieved remarkable results in scenarios such as portfolio optimization and cost control. Fuzzy logic (FL) (Saatchi, 2024), through its handling of semantic uncertainty and fuzzy reasoning, demonstrates unique advantages in risk assessment and decision support. However, existing methods still exhibit significant limitations. GA has limited adaptive capacity in dynamic environments, while FL heavily relies on expert knowledge and struggles to learn automatically from data (Mitrakas, Xanthopoulos & Koulouriotis, 2025). On the other hand, traditional machine learning methods often suffer from insufficient generalization ability when processing multi-source heterogeneous financial data and lack systematic modeling capabilities for uncertainty and temporal dependencies (Lu & Wu, 2025). Furthermore, traditional approaches struggle to achieve effective unified representation and deep integration, leading to inadequate use of critical information (Yubo, 2021; Wu et al., 2024b).
To overcome the challenges, a new genetic algorithm-fuzzy logic-Transformer (GA-FL-Transformer) fusion framework was proposed to achieve global optimization in corporate financial management. The core innovation lies in the attention mechanism that synergistically integrates deep feature learning with multi-objective optimization. The Transformer’s multi-head attention mechanism not only captures complex cross-modal associations but also provides dynamic feature importance weights that directly guide the GA-FL co-evolution process, enabling data-driven automatic generation of optimization rules and adaptive adjustment of fuzzy membership functions. Specifically, the contributions of this study include:
The Transformer model is utilized as a perception and encoding framework for multi-source heterogeneous financial data. Through its multi-head attention mechanism, it effectively captures complex associations in structured indicators, textual information, and temporal data, constructing a multi-dimensional representation that integrates semantic and temporal features.
A co-evolutionary model integrating GA and FL, guided by attention weights, is designed. The extracted features are incorporated into chromosome encoding, fitness functions, and genetic operations, enabling automatic generation of multi-objective rules and dynamic optimization of membership functions. This enhances decision-making effectiveness while improving adaptability and interpretability in complex financial environments.
An intelligent optimization framework for corporate financial management based on GA-FL-Transformer is established, integrating cross-modal perception, evolutionary optimization, and fuzzy reasoning. A bidirectional flow mechanism is introduced to realize optimization from data to decision-making. The framework supports forward reasoning and feedback learning, enabling enterprises to perceive and continuously adjust in dynamic markets.
The framework is validated on two financial datasets, Compustat and CRSP, using multiple evaluation metrics. This comprehensive assessment demonstrates the model’s advantages in economic forecasting, risk control, and other aspects.
Related work
The genetic algorithm has attracted significant attention for optimizing corporate financial management due to its exceptional global search capabilities and robustness. Existing research demonstrates that GA offers substantial advantages across core areas such as capital allocation, risk control, and portfolio optimization. For instance, Alhijawi & Awajan (2024), Zhu et al. (2023) enhanced the algorithm’s global search performance and convergence efficiency in complex financial scenarios by improving the selection operator. Abdelkhalek et al. (2024) introduced an adaptive parameter adjustment mechanism that uses dynamic crossover and mutation probabilities to improve convergence stability and ensure the algorithm’s superiority in multi-objective financial optimization. Wang et al. (2024) and Hao et al. (2025) further improved the accuracy and robustness of asset allocation by integrating periodic encoding, priority decoding, and multi-swarm cooperative optimization. Moreover, GA demonstrates strong adaptability in cross-domain optimization tasks. For example, Usvakangas, Tuovinen & Neittaanmäki (2024) effectively addressed financial management optimization problems by introducing partially mapped crossover and inversion operators. Mazouzi et al. (2024) optimized system integration solutions using an adaptive multi-swarm genetic algorithm, validating GA’s efficiency in engineering scenarios. Despite the notable achievements of GA research in financial management, most of these methods rely heavily on manually specified objectives and constraints, failing to leverage data-driven deep features and environmental context fully. Consequently, they exhibit significant limitations in generalization within dynamic financial environments.
Fuzzy logic has been widely applied in finance and financial management. Its strength lies in transforming imprecise information in complex environments into actionable decision-making bases through membership functions and fuzzy rule bases. Maroua et al. (2024) pointed out that after introducing non-economic variables into economic forecasting, fuzzy logic significantly enhanced the robustness and accuracy of predictions. Precup, Nguyen & Blažič (2024) emphasized the core value of FL in managing uncertain systems, enabling adaptive regulation in dynamic environments. Gorgin et al. (2024) further proposed a fuzzy reasoning-based financial control mechanism that maps risk inputs into decision outputs via IF–THEN rules, thereby enabling intelligent assessment of complex risk factors. However, most existing fuzzy logic methods rely on expert experience to construct rules and membership functions, lacking the ability to learn from multi-source data automatically. This makes it difficult for them to adapt to the continuously changing semantic and contextual uncertainties in complex financial environments.
Data-driven deep learning methods are widely applied to optimize corporate financial management models. Sun et al. (2025) proposed a hybrid model integrating Convolutional Neural Networks (CNNs) and Long Short-Term Memory (LSTM) networks to enhance the efficiency of financial data prediction and decision-making. Zhou (2025) introduced a TCN-GRU model that combines Temporal Convolutional Networks (TCN) with Gated Recurrent Units (GRU) to optimize corporate management accounting systems and enable effective financial risk prediction. Zhang (2022) proposed an improved Temporal Convolutional Network-Long Short-Term Memory (TCN-LSTM) architecture for modeling financial management systems, incorporating an optimization algorithm to refine the deep learning model’s parameters. Hao (2022) developed a Bayesian regularization algorithm based on neural network models to evaluate asset management in financial processes by integrating neural network principles with Bayesian regularization. Additionally, researchers in Rao et al. (2024), Yang et al. (2025) combined deep learning models with GAs to support financial management decision-making, demonstrating applicability in multi-parameter scenarios such as resource allocation and risk assessment.
Existing financial management methods based on GA, FL, and deep learning still exhibit significant limitations when addressing complex and multi-source financial data in enterprises. Firstly, traditional approaches struggle to effectively process multi-source heterogeneous financial data, lacking a unified representation of structured financial statements, unstructured text, and temporal market information, resulting in insufficient utilization of critical information. Secondly, these methods fail to achieve effective integration between GA and FL, preventing multi-objective co-evolution. Finally, existing approaches lack a closed-loop optimization framework, leading to fragmented decision-making processes. To overcome the shortcomings, this article proposed a GA-FL-Transformer fusion framework that enables unified encoding and perception of multi-source data via the Transformer, facilitates deep co-evolution of GA and FL guided by attention mechanisms, and constructs an intelligent, closed-loop decision system to enhance perception capabilities and optimization efficiency in financial management comprehensively.
Materials and Methods
Multi-source financial data perception and feature extraction based on transformer
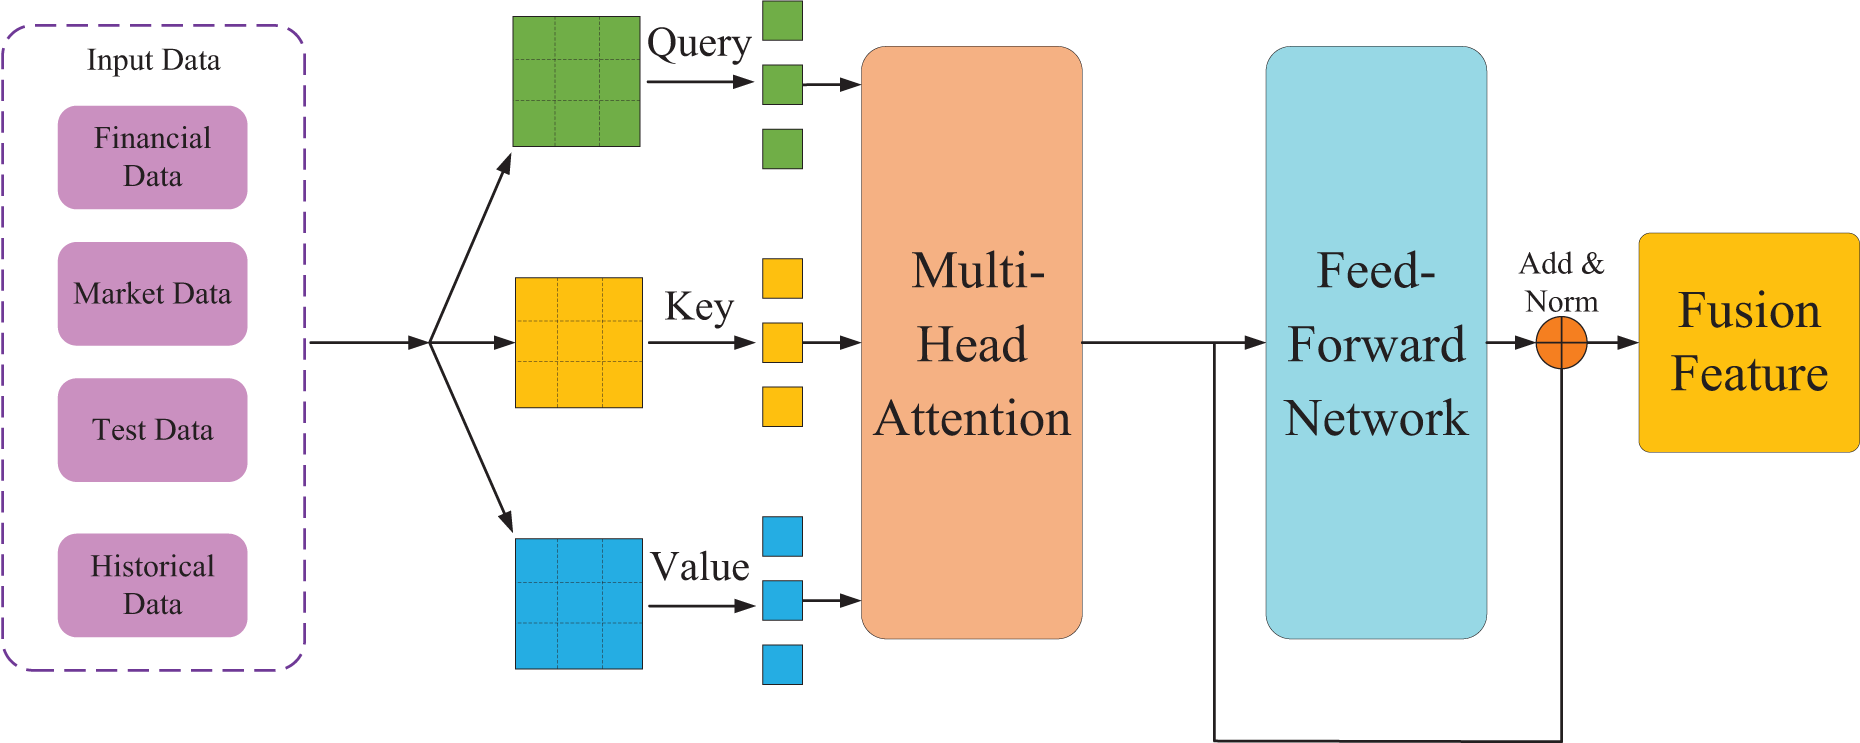
In the context of corporate financial management, data sources are extremely diverse and varied in format, encompassing structured financial statements, semi-structured management reports, unstructured market news, policy texts, and social media information. Effectively processing and comprehending massive volumes of heterogeneous financial data is crucial. To address this challenge, this study first introduces the Transformer model as the perception module for economic data, as illustrated in Fig. 1. This module leverages its attention mechanism to achieve deep understanding and key feature extraction from multi-source financial data. The following formula can express it:
(1)
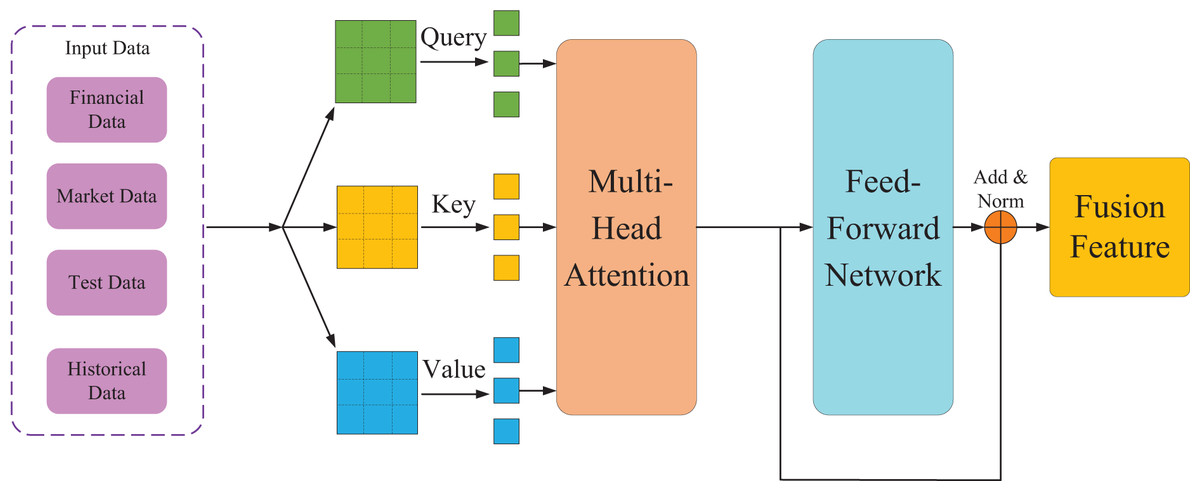
Figure 1: Data perception and feature extraction based on transformer.
Here, Q, K, and V represent the query, key, and value matrices respectively, is the dimension of the key vectors, and is the probability distribution function that ensures the sum of all weights equals 1. This enables automatic capture of associations across different data sources and identification of information patterns that significantly impact a company’s financial condition. In this study, a unified encoding strategy for multimodal financial data is designed. The specific encoding process is as follows:
(2)
Here, denotes the embedding of financial indicators, represents the embedding of market information, stands for the text embedding, is the time-series embedding, which indicates the feature concatenation operation. Subsequently, through the multi-head attention mechanism, the model comprehends financial data from multiple perspectives. The formula for the multi-head attention mechanism is expressed as:
(3)
Here, each attention head Focuses on different financial dimensions. For instance, pays attention to cash—liquidity indicators, focuses on stock earnings, and centers on the market environment, and so on. This design enables the model to assess an enterprise’s financial health comprehensively. The theoretical justification for the unified encoding strategy lies in its superior capacity for cross-modal alignment and feature disentanglement. Unlike simple concatenation that often creates entangled representations, the cross-modal attention mechanism explicitly models interactions between all pairs of tokens across different data types. This allows the model to dynamically contextualize information, for instance, by refining a financial ratio based on relevant news sentiment. Consequently, it suppresses irrelevant features and enhances discriminative power, fostering a more coherent and disentangled feature space optimized for financial inference tasks compared to isolated modality processing.
The multi-source financial data perception and feature extraction based on the Transformer can process multi-source heterogeneous financial data in parallel, effectively capturing long-range dependencies and cross-modal associations. The unified encoding strategy not only preserves the temporal characteristics and semantic information of various data types but also enables in-depth fusion of different modal data in the feature space.
Attention-guided genetic-fuzzy financial decision optimization mechanism
This study constructs a novel financial decision optimization mechanism that deeply integrates GA with the interpretability of FL and leverages Transformer attention weights as guidance to form an adaptive decision optimization mechanism. The core of this mechanism lies in leveraging the Transformer’s in-depth perception of financial environmental features to dynamically guide the entire evolutionary process of the algorithm, ensuring that the generated fuzzy decision rules exhibit high accuracy. The fuzzy logic system employs Gaussian membership functions to fuzzify inputs such as Liquidity and leverage into three linguistic sets: Low, Medium, and High. The output, Decision_Output, is defined by five Gaussian sets ranging from Conservative to Aggressive. An initial rule base is constructed from all possible combinations of input sets. Subsequently, the Genetic Algorithm dynamically optimizes the parameters of these membership functions and the fuzzy rule weights, guided by the Transformer’s attention mechanism. Based on the features extracted by the Transformer model in the previous section, the chromosome encoding structure for environmental perception is formulated as follows:
(4)
Here, represents the financial decision rules generated based on the features. The membership function parameters are dynamically refined using the attention weights from the Transformer. This process adjusts the shape and position of the fuzzy membership functions to prioritize features that the model deems most critical. Consequently, the chromosome-encoding process evolves to reflect the current financial context better, ensuring that the genetic search is guided by semantically salient information. denotes the context-dependent risk weights. This encoding approach establishes an intrinsic connection between the genetic algorithm’s evolutionary space and the environment perceived by the Transformer, providing a structural foundation for subsequent multi-objective optimization.
The design of the fitness function fully integrates traditional financial metrics with environmental context information, leveraging Transformer outputs to achieve multi-objective financial optimization. The mathematical expression for the fitness function is as follows:
(5)
Here, ROI(C), Risk(C), Liquidity(C) represent the investment return, risk level, and liquidity status after applying the decision rules. The term in the fitness function quantitatively measures the alignment between a chromosome’s decision rules and the feature importance profile. Chromosomes whose rules resonate with highly weighted features receive a fitness boost, steering the population toward contextually relevant solutions. This integration ensures that optimization objectives are dynamically adapted to the perceived financial environment. This fitness function design ensures that the evolutionary process simultaneously optimizes both traditional financial metrics and contextual relevance, resulting in a rule set highly pertinent to the financial environment.
To provide a more rigorous mathematical foundation, we now derive the complete formulation of the fitness function with all hyperparameters explicitly defined. The attention alignment term in Eq. (5) is mathematically defined as:
(6)
In Eq. (6), denotes the total number of rules in chromosome , and represents the average attention weight associated with the rule , which reflects the importance of features involved in that rule. This formulation quantifies how well the chromosome’s rule set aligns with the features deemed important by the Transformer’s attention mechanism.
The attention-guided genetic operation mechanism guarantees the algorithm’s exploratory capability, avoiding local optima. When exchanging rule segments between two chromosomes, features with high attention weights are more likely to be exchanged. The following formula gives the attention-guided crossover probability:
(7)
Here, denotes the final crossover probability, representing the actual probability that rule segment is selected for crossover operation. is the base crossover probability, a preset benchmark probability value. is an adjustment coefficient used to control the extent to which attention weights influence the final crossover probability. represents the average attention weight, the mean of the attention weights for all features related to the rule segment, reflecting the segment’s importance.
The attention-guided crossover mechanism requires a precise mathematical derivation to demonstrate how attention weights modulate genetic operations. The average attention weight for rule segment is computed as the mean of attention weights of all features involved in that rule segment. Specifically, if rule involves features, then:
(8)
In Eq. (8), represents the attention weight for the -th feature in the rule segment By averaging the attention weights across all features involved in a rule segment, the Transformer model produced a comprehensive measure of that segment’s contextual importance.
To clarify the specific mechanism of attention-guided updates, the Transformer attention weights primarily influence the membership function boundaries rather than rule antecedents or final decision parameters. During the genetic algorithm’s evolutionary process, the attention weights act as adaptive scaling factors that modulate the magnitude of parameter adjustments for each fuzzy membership function. Features with higher attention weights undergo more substantial changes in their Gaussian membership function centers and widths, making the fuzzy system more sensitive to critical financial indicators identified by the Transformer. Conversely, membership functions corresponding to features with lower attention weights receive minimal adjustments, maintaining stability in less relevant dimensions. This mechanism ensures that the evolutionary search dynamically prioritizes optimizing decision boundaries for the most contextually essential features.
In the attention-guided mutation operation mechanism, the magnitude and direction of mutation are guided by attention weights. Important features receive stronger or more specific mutations rather than completely random perturbations. Equation (9) describes this process:
(9)
Here, represents the mutation result, denoting the new value of the rule segment obtained after the mutation operation. is the basic mutation step size, which determines the baseline magnitude of the mutation. is a random variable, governing the mutation’s random direction and magnitude. is the attention weight output by the Transformer model and associated with the i-th relevant feature. is a scaling function that maps the attention weight into a regulatory factor for the mutation intensity.
This optimization mechanism explores the complex financial decision space through the genetic algorithm, automatically optimizing the fuzzy rule base and membership functions. For instance, given inputs where Liquidity is High and Leverage is Medium, multiple rules are activated. The final decision is not a simple average but a weighted aggregation based on each rule’s firing strength and its dynamically evolving weight, which the GA adjusts according to the attention-guided importance. This process ensures that the system’s decision-making continuously adapts to the perceived financial context. Fuzzy Logic ensures the algorithm’s decision-making process is well interpretable, while introducing Transformer attention weights effectively integrates the optimization direction with key features of the financial environment, significantly enhancing the accuracy of the decision-making model.
An intelligent optimization framework for corporate financial management based on GA-FL-transformer
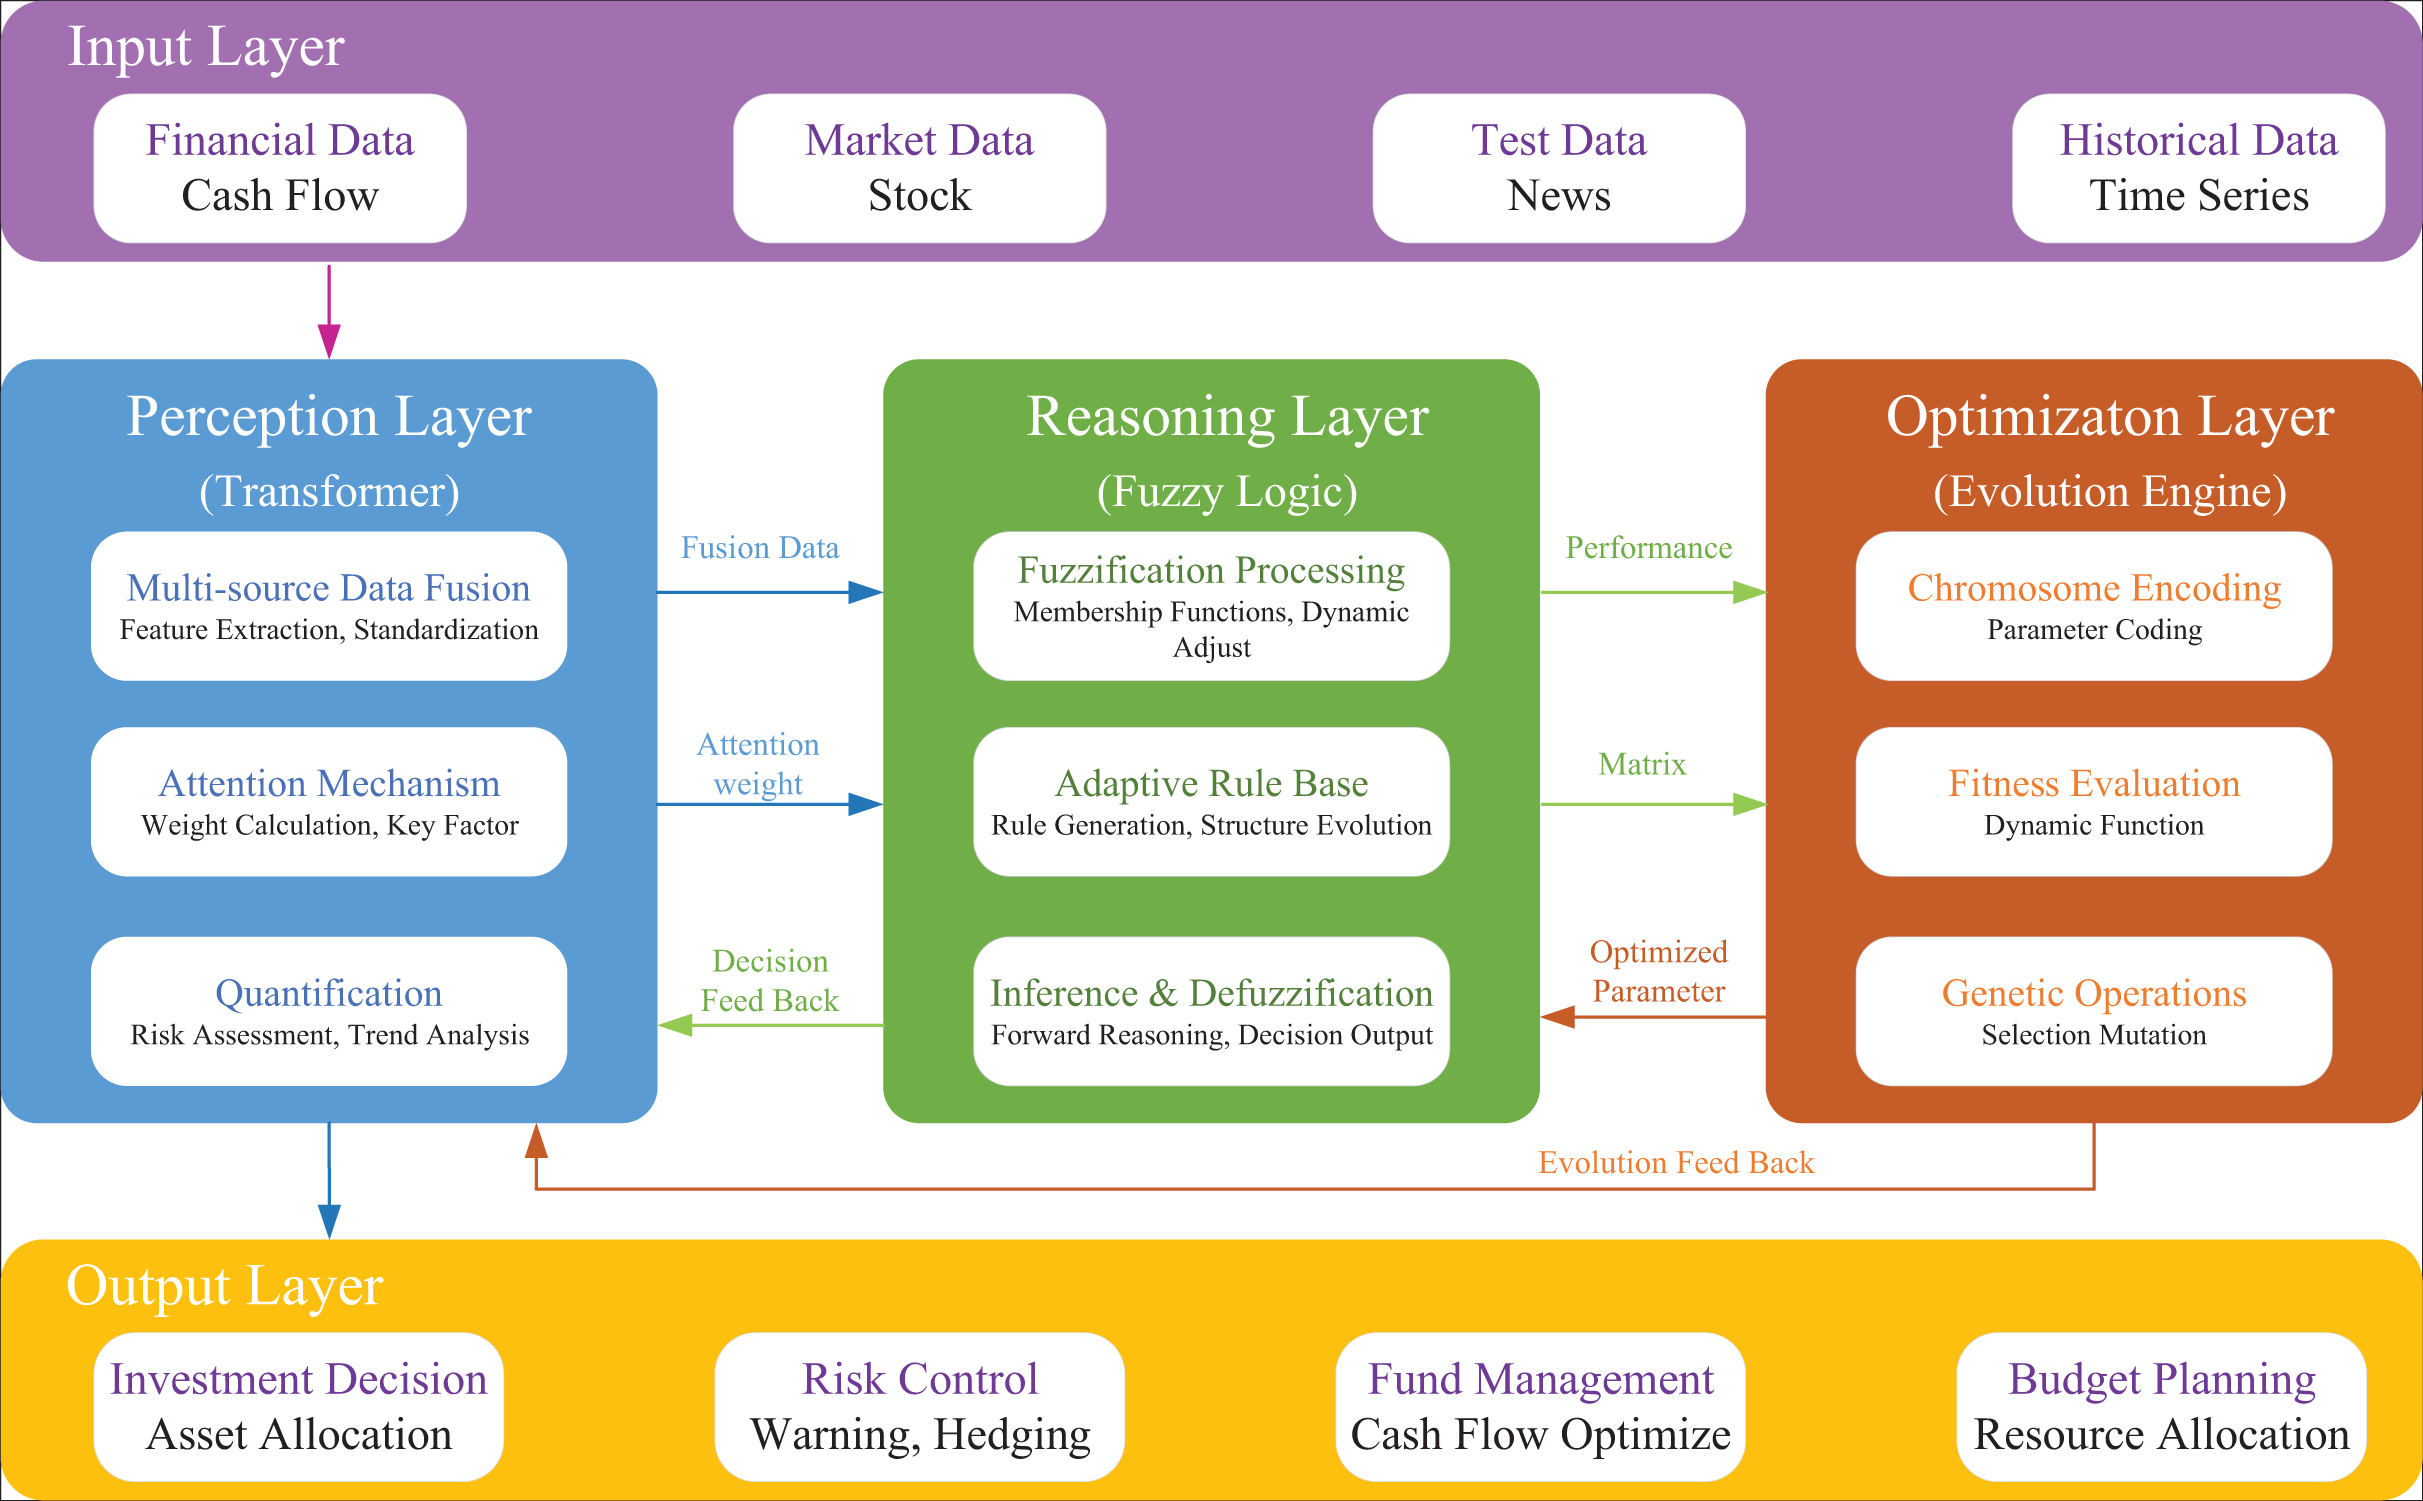
Building on Transformer-based feature extraction and the genetic-fuzzy financial decision-making mechanism, this study constructs an intelligent optimization framework for financial management that integrates perception, optimization, and decision-making. As illustrated in Fig. 2, the framework adopts a three-layer model, concluding a Transformer-based multi-source data perception and feature extraction layer, a genetic algorithm-based reasoning layer, and a fuzzy logic-based optimization layer.
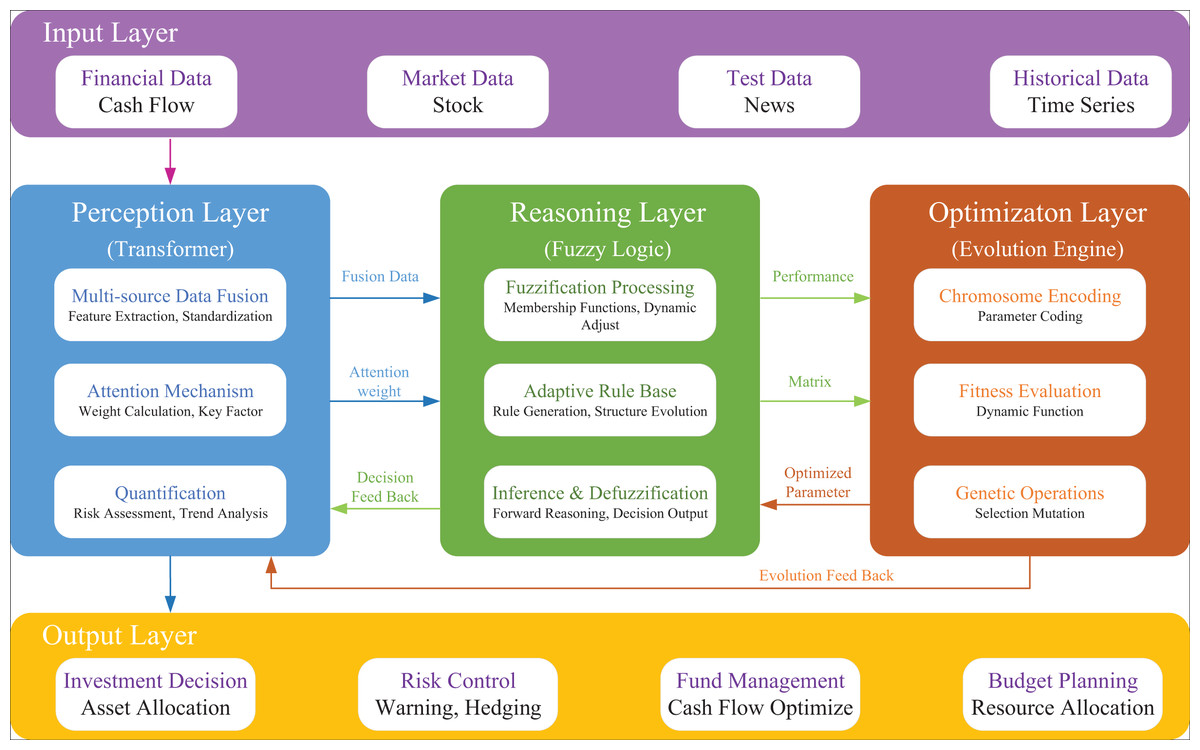
Figure 2: The proposed GA-FL-transformer optimization model architecture.
The perception layer, centered around the Transformer model, is responsible for multi-source data fusion and feature extraction. This layer integrates corporate financial data, real-time market data, public sentiment information, and historical time-series data. By employing self-attention mechanisms, it dynamically calculates feature importance weights and outputs high-dimensional feature vectors, attention weight matrices, and structured environmental information to support subsequent optimization processes.
The optimization layer utilizes the evolutionary mechanism of the genetic algorithm to drive rule generation. In this layer, fuzzy system parameters are mapped into evolvable individual variables through chromosome encoding. A dynamic fitness function is employed to evaluate the comprehensive performance of potential solutions. Continuous improvement is achieved through attention-weighted genetic operations, ultimately outputting an optimal set of fuzzy rules and membership function parameters.
The decision-making layer executes interpretable fuzzy reasoning based on optimization results. It employs the optimally evolved rule base and membership functions for fuzzy inference, generating multi-dimensional decision-making schemes, including investment decisions, risk control measures, fund management strategies, and budget planning, in the context of the given environment. The entire decision-making process maintains a high degree of interpretability.
Effective integration across the three layers is achieved through forward information flow and feedback learning mechanisms, ensuring robust environmental perception and adaptive capabilities. This framework can provide systematic solutions for complex corporate financial decision-making problems.
Computing infrastructure
The experiments were conducted on a Windows 11 64-bit operating system using Python 3.10 and the PyTorch 2.2 framework for model implementation. Training and evaluation were performed on a workstation equipped with an Intel Core i9-13900K CPU, 64 GB RAM, and an NVIDIA RTX 4090 GPU (24 GB VRAM). The software environment also included CUDA 12.1 and cuDNN 8.9 for GPU acceleration, and all models were trained with the same hyperparameter settings to ensure fairness and reproducibility.
Data preprocessing
A comprehensive data preprocessing pipeline was designed to improve the quality and compatibility of heterogeneous financial data. First, structured financial indicators such as balance sheets and income statements were normalized using z-score standardization to eliminate scale bias and stabilize gradient convergence during model training. Second, unstructured textual information from market news, policy documents, and analyst reports was preprocessed through tokenization, stop-word removal, and lemmatization, followed by TF-IDF weighting and conversion into 300-dimensional embeddings using a pretrained Word2Vec model. Third, time-series data, such as stock returns and transaction volumes, were smoothed using a sliding-window normalization approach and temporally aligned via timestamp synchronization to ensure consistent sampling frequency. Missing values were imputed using a Gaussian expectation-maximization algorithm, while categorical variables were encoded using one-hot encoding. Finally, all processed modalities were concatenated using the unified multimodal embedding mechanism defined in Eq. (2), enabling the Transformer encoder to jointly learn attention-based features across heterogeneous data sources.
The experimental dataset comprises financial records from 2,847 publicly traded companies spanning 2010–2023, partitioned chronologically into a training set covering 2010–2019 (70%), a validation set covering 2020–2021 (15%), and a test set covering 2022–2023 (15%). Financial statement data are sampled quarterly, while market data are aggregated from daily to quarterly frequency for temporal consistency. Ground-truth labels for risk classification are constructed using a composite framework in which companies are labeled “High Risk” if they satisfy at least two criteria, including an Altman Z-score below 1.8, an interest coverage ratio below 1.5, negative operating cash flow for two consecutive quarters, or a stock price decline exceeding 40%. The training set exhibits a 23.6% High Risk vs. 76.4% Low Risk distribution, with key financial indicators showing a mean return on assets of 4.82% with a standard deviation of 8.91%, an average debt-to-equity ratio of 1.34 with a variance of 2.17, and a mean current ratio of 2.08 with a standard deviation of 1.53.
Evaluation method
The evaluation methodology in this study was designed to verify both the structural validity and functional performance of the GA-FL-Transformer framework. Two complementary evaluation strategies were employed. First, method comparison was performed by benchmarking the proposed framework against three representative deep learning baselines: Long Short-Term Memory (LSTM) (Liu & Fan, 2025), Convolutional Neural Network–Long Short-Term Memory (CNN-LSTM) (Sun et al., 2025), and Temporal Convolutional Network–Gated Recurrent Unit (TCN-GRU) (Zhou, 2025). Additionally, to provide a broader methodological context, three domain-specific models were included as comparative benchmarks: the genetic algorithm and fuzzy neural network model (GA-Fuzzy) (Huang et al., 2025) for international trade settlement modeling, the two-stage fuzzy neural approach (Fuzzy-NN) (Fonseca, Wanke & Correa, 2020) for credit risk assessment, and the self attention deep learning method (Wu et al., 2024a) for financial distress prediction using current reports. These models were selected to represent classical sequence learning, hybrid convolutional–recurrent learning, and dilated temporal convolutional paradigms, respectively. Each baseline was trained and tested under identical data partitions and hyperparameters to ensure fairness. Second, ablation experiments were conducted to isolate and quantify the contributions of each major component within the GA-FL-Transformer architecture. Specifically, three ablation variants were tested: (1) removal of the Genetic Algorithm (GA) module, (2) removal of the Fuzzy Logic (FL) reasoning component, and (3) removal of the Transformer encoder. The performance degradation observed after excluding each component quantitatively demonstrated its contribution to global optimization, uncertainty reasoning, and multi-source feature perception. Together, the comparative and ablation analyses provide strong methodological evidence for the interpretability, adaptability, and efficiency of the proposed framework before full-scale performance evaluation.
Assessment metrics
Precision, Recall, F1-score, and Error Rate (ER) were used to evaluate our work. Precision shows the proportion of the things we predicted as positive that are actually positive. Here’s the formula for calculating Precision:
(10)
Recall quantifies the proportion of true positive cases correctly classified as positive by the model. Its formal expression is given below:
(11)
The F1-score is the harmonic average of Precision and Recall, which is expressed as:
(12)
Error rate (ER) represents the error rate of the model. The expression for ER is as follows:
(13)
Here, denotes the number of samples that were originally correctly classified but were incorrectly predicted, repres denotes the number of samples that were originally incorrectly classified but were correctly predicted, and Num denotes the total sample size.
Experimental results and analysis
Experimental setup
This study utilizes authoritative data from Compustat and the CRISPR Therapeutics AG Stock Performance (CRSP) as the experimental foundation. The Compustat database covers most listed companies in North America, providing financial statement data at both annual and quarterly frequencies spanning several decades. Its primary data includes structured financial details such as income statements, balance sheets, and cash flow statements, as well as metadata about company basics and equity setups. The CRSP database provides high-precision securities market data, including individual stock prices, returns, trading volumes, and historical records of market indices and various investment instruments. It is widely used for market behavior analysis, investment performance evaluation, and financial risk modeling. In this study, data from both CRSP and Compustat are employed to gain a more comprehensive market perspective and further evaluate the performance of the GA-FL-Transformer in financial risk identification and multi-period forecasting tasks.
Method comparison and result analysis
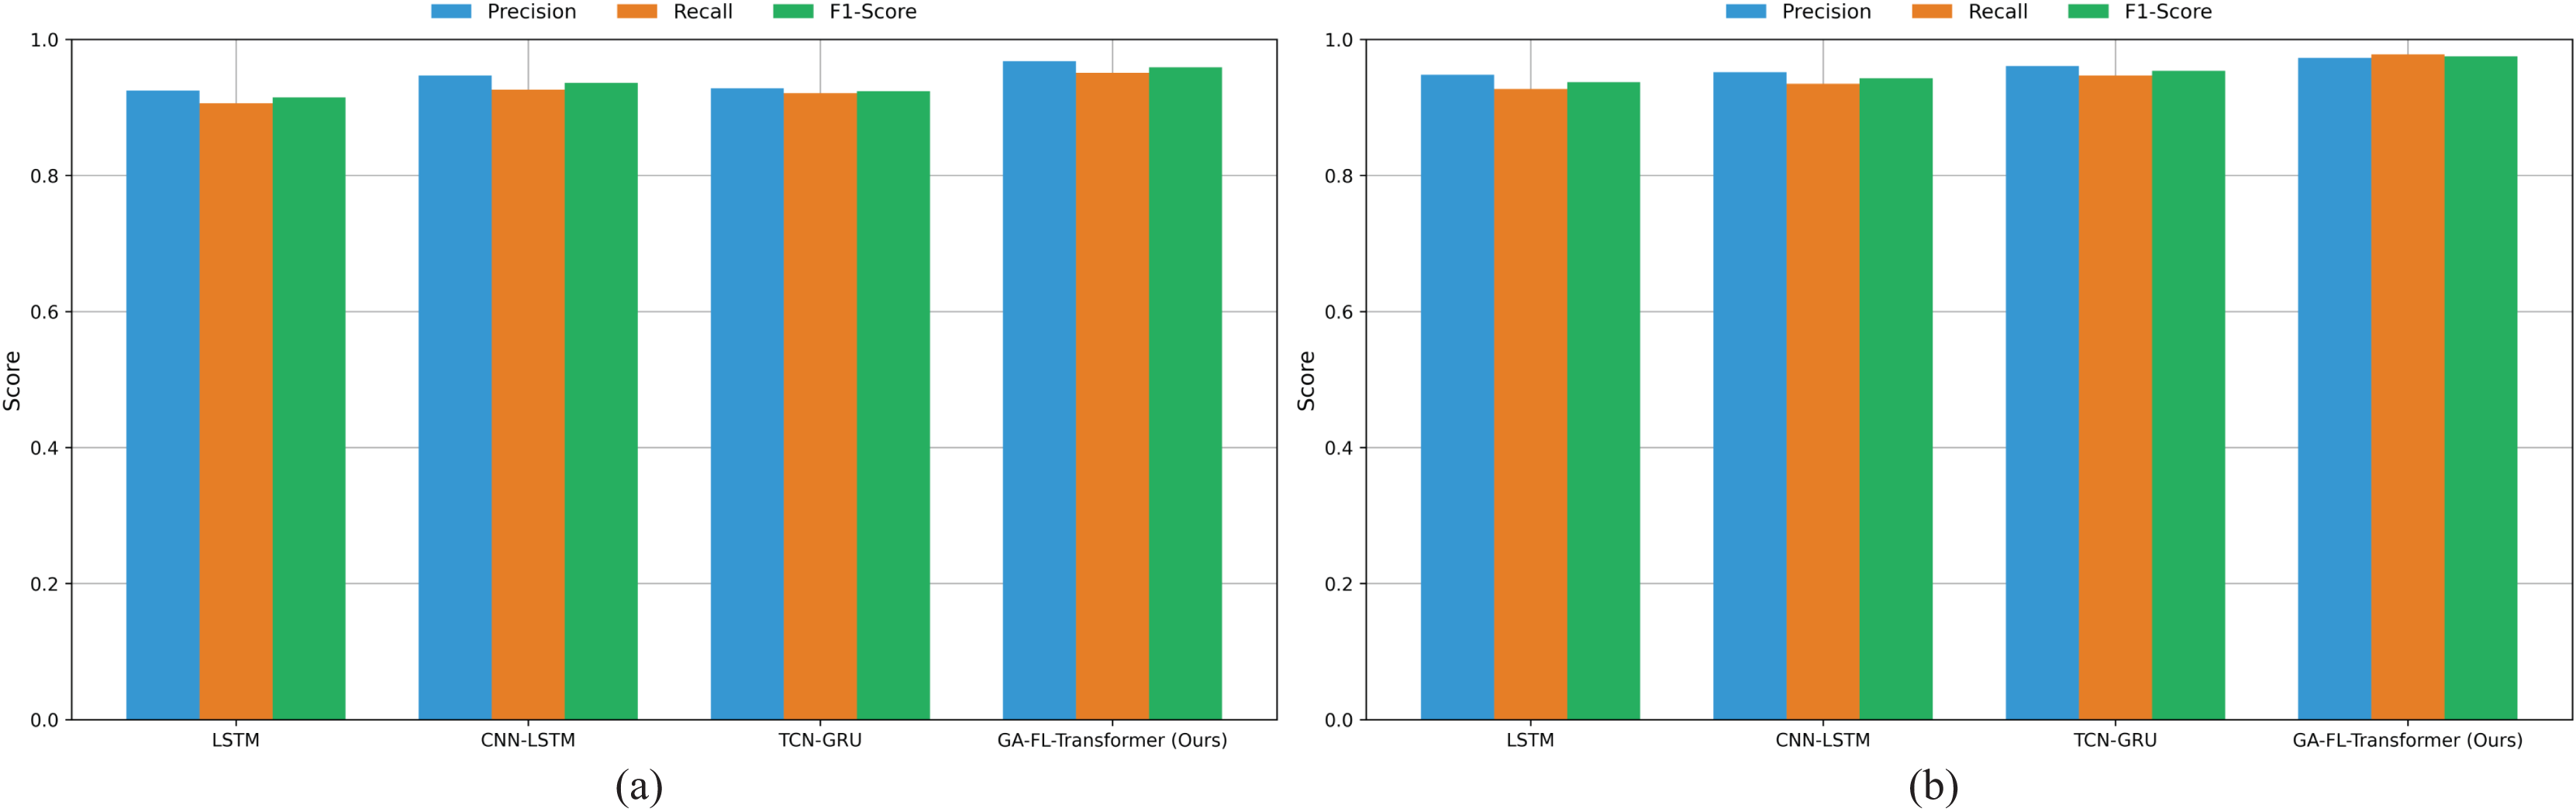
As illustrated in Fig. 3A, in the comparison results on the Compustat dataset, the GA-FL-Transformer model outperforms all competing models. From the grouped bar chart, it is evident that, across all compared models, the Recall metric is generally lower than the Precision metric, reflecting the prevalence of class imbalance and the risk of false negatives in financial risk prediction tasks. However, the GA-FL-Transformer model achieves an outstanding Recall of 0.952, significantly narrowing the gap with Precision. This indicates that the model can more comprehensively identify potential risk samples, benefiting from its ability to perceive and integrate multi-source features.
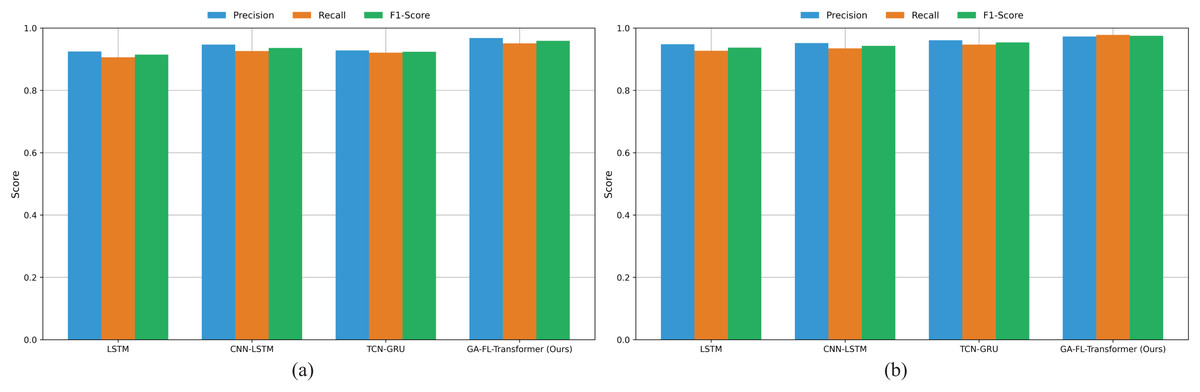
Figure 3: Comparison results on compustat and CRSP datasets.
Among the competing models, the traditional LSTM performs worst across all three metrics, highlighting its limitations in effectively capturing complex dependencies in financial data. Although the CNN-LSTM and TCN-GRU models have achieved some performance improvements by incorporating convolutional structures and gating mechanisms, the extent of these improvements is limited. This suggests that single or simply hybrid deep learning architectures still have significant shortcomings. The GA-FL-Transformer significantly enhances its capability of financial patterns through a multi-module collaborative and optimization mechanism.
From the results on the CRSP dataset shown in Fig. 3B. The GA-FL-Transformer model demonstrates exceptional Recall performance of 98.2%, outperforming all competing models. This indicates that the model has a significant advantage in identifying genuine risk signals, which is of great importance for reducing the false-negative rate and enhancing the reliability of risk warnings. Secondly, although the TCN-GRU model exhibits relatively balanced performance, with Precision, Recall, and F1-score values of 96.1%, 94.8%, and 95.4%. In addition, the F1-score of the GA-FL-Transformer reaches 97.7%, reflecting its excellent comprehensive classification performance.
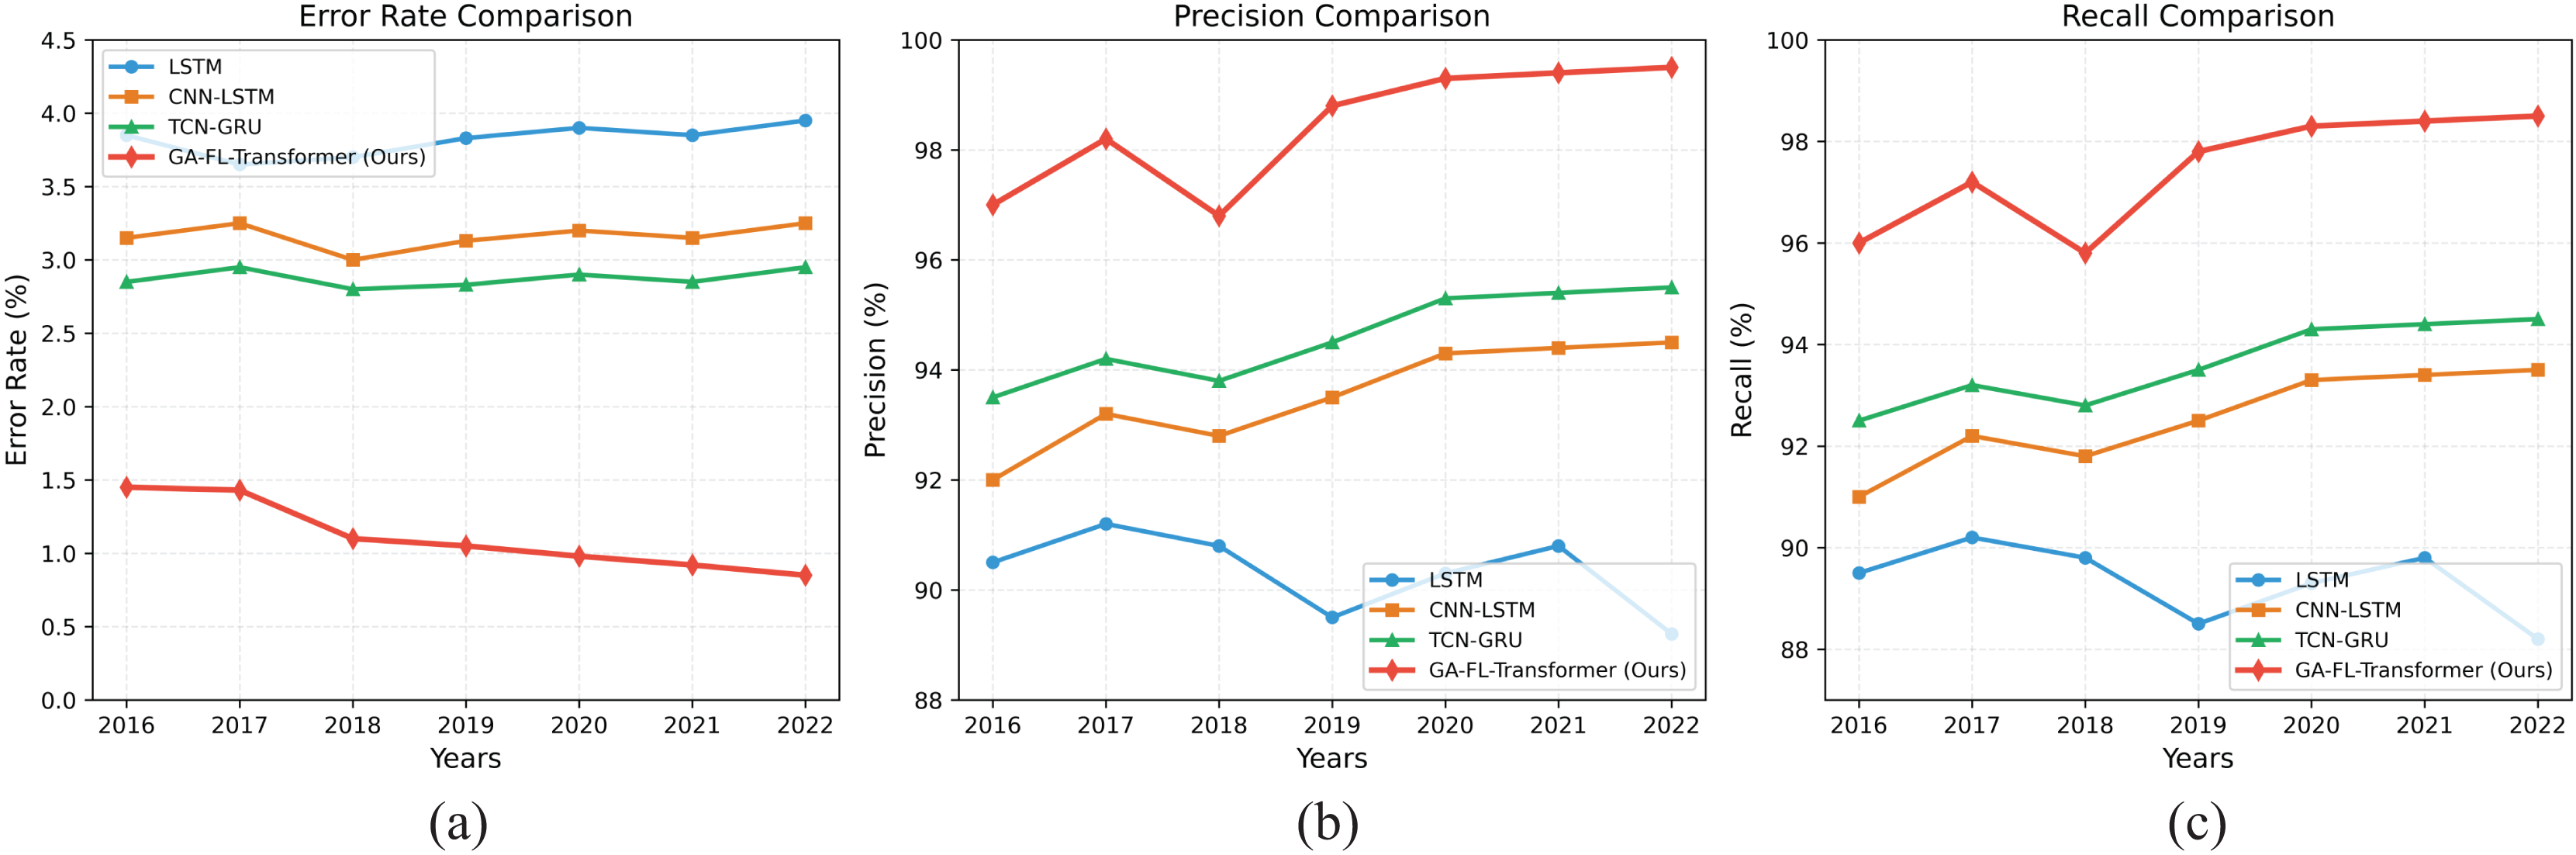
Figures 4A–4C present the results of corporate financial risk prediction tasks on the Compustat dataset from 2016 to 2022 under different evaluation metrics. The experiments show that our model outperforms existing methods.
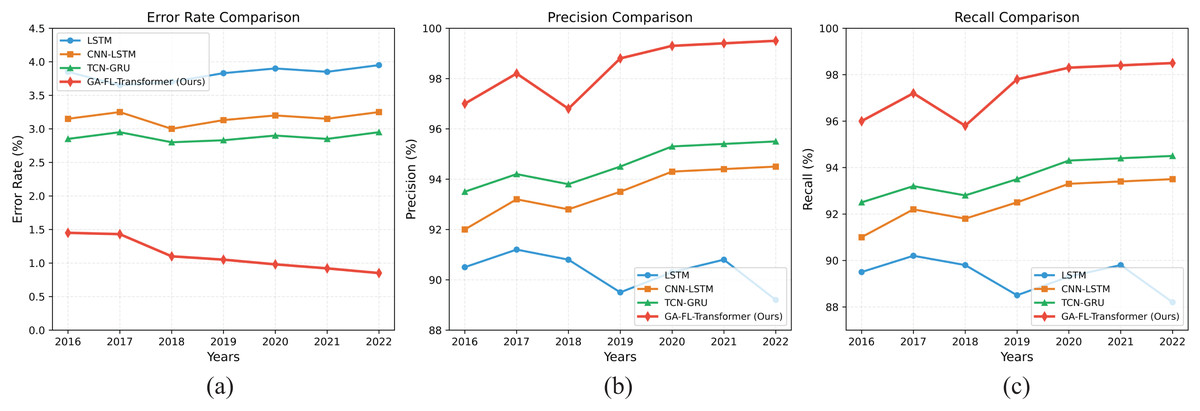
Figure 4: Comparison results of risk prediction on the Compustat dataset.
In terms of the ER, the GA-FL-Transformer model has achieved a continuous decline from 1.45% in 2016 to 0.85% in 2022, representing a significant reduction of approximately 70% compared to the competing TCN-GRU model. This improvement is primarily attributed to the Transformer-based multi-source fusion module in the model, which effectively integrates multimodal financial data through a multi-head attention mechanism, enabling more precise feature representation and thereby significantly reducing the risk of misjudgment.
Regarding prediction Precision, our model consistently maintains a level above 97% throughout the entire testing period and reaches a peak of 99.5% in 2022, which is 9.2%, 5.8%, and 4.3% higher than LSTM, CNN-LSTM, and TCN-GRU, respectively. This advantage can be attributed to the designed attention-guided genetic-fuzzy collaborative optimization mechanism. This mechanism dynamically adjusts the rule generation and parameter evolution processes based on feature importance, enabling the model to make more accurate decisions in high-dimensional financial objective spaces.
In terms of Recall, the GA-FL-Transformer model achieves an excellent average performance of 97.4%. This result benefits from the feedback-learning mechanism introduced into the GA-FL-Transformer’s optimization architecture. The system can dynamically optimize the perception and decision-making modules based on historical performance, thereby continuously improving prediction accuracy.
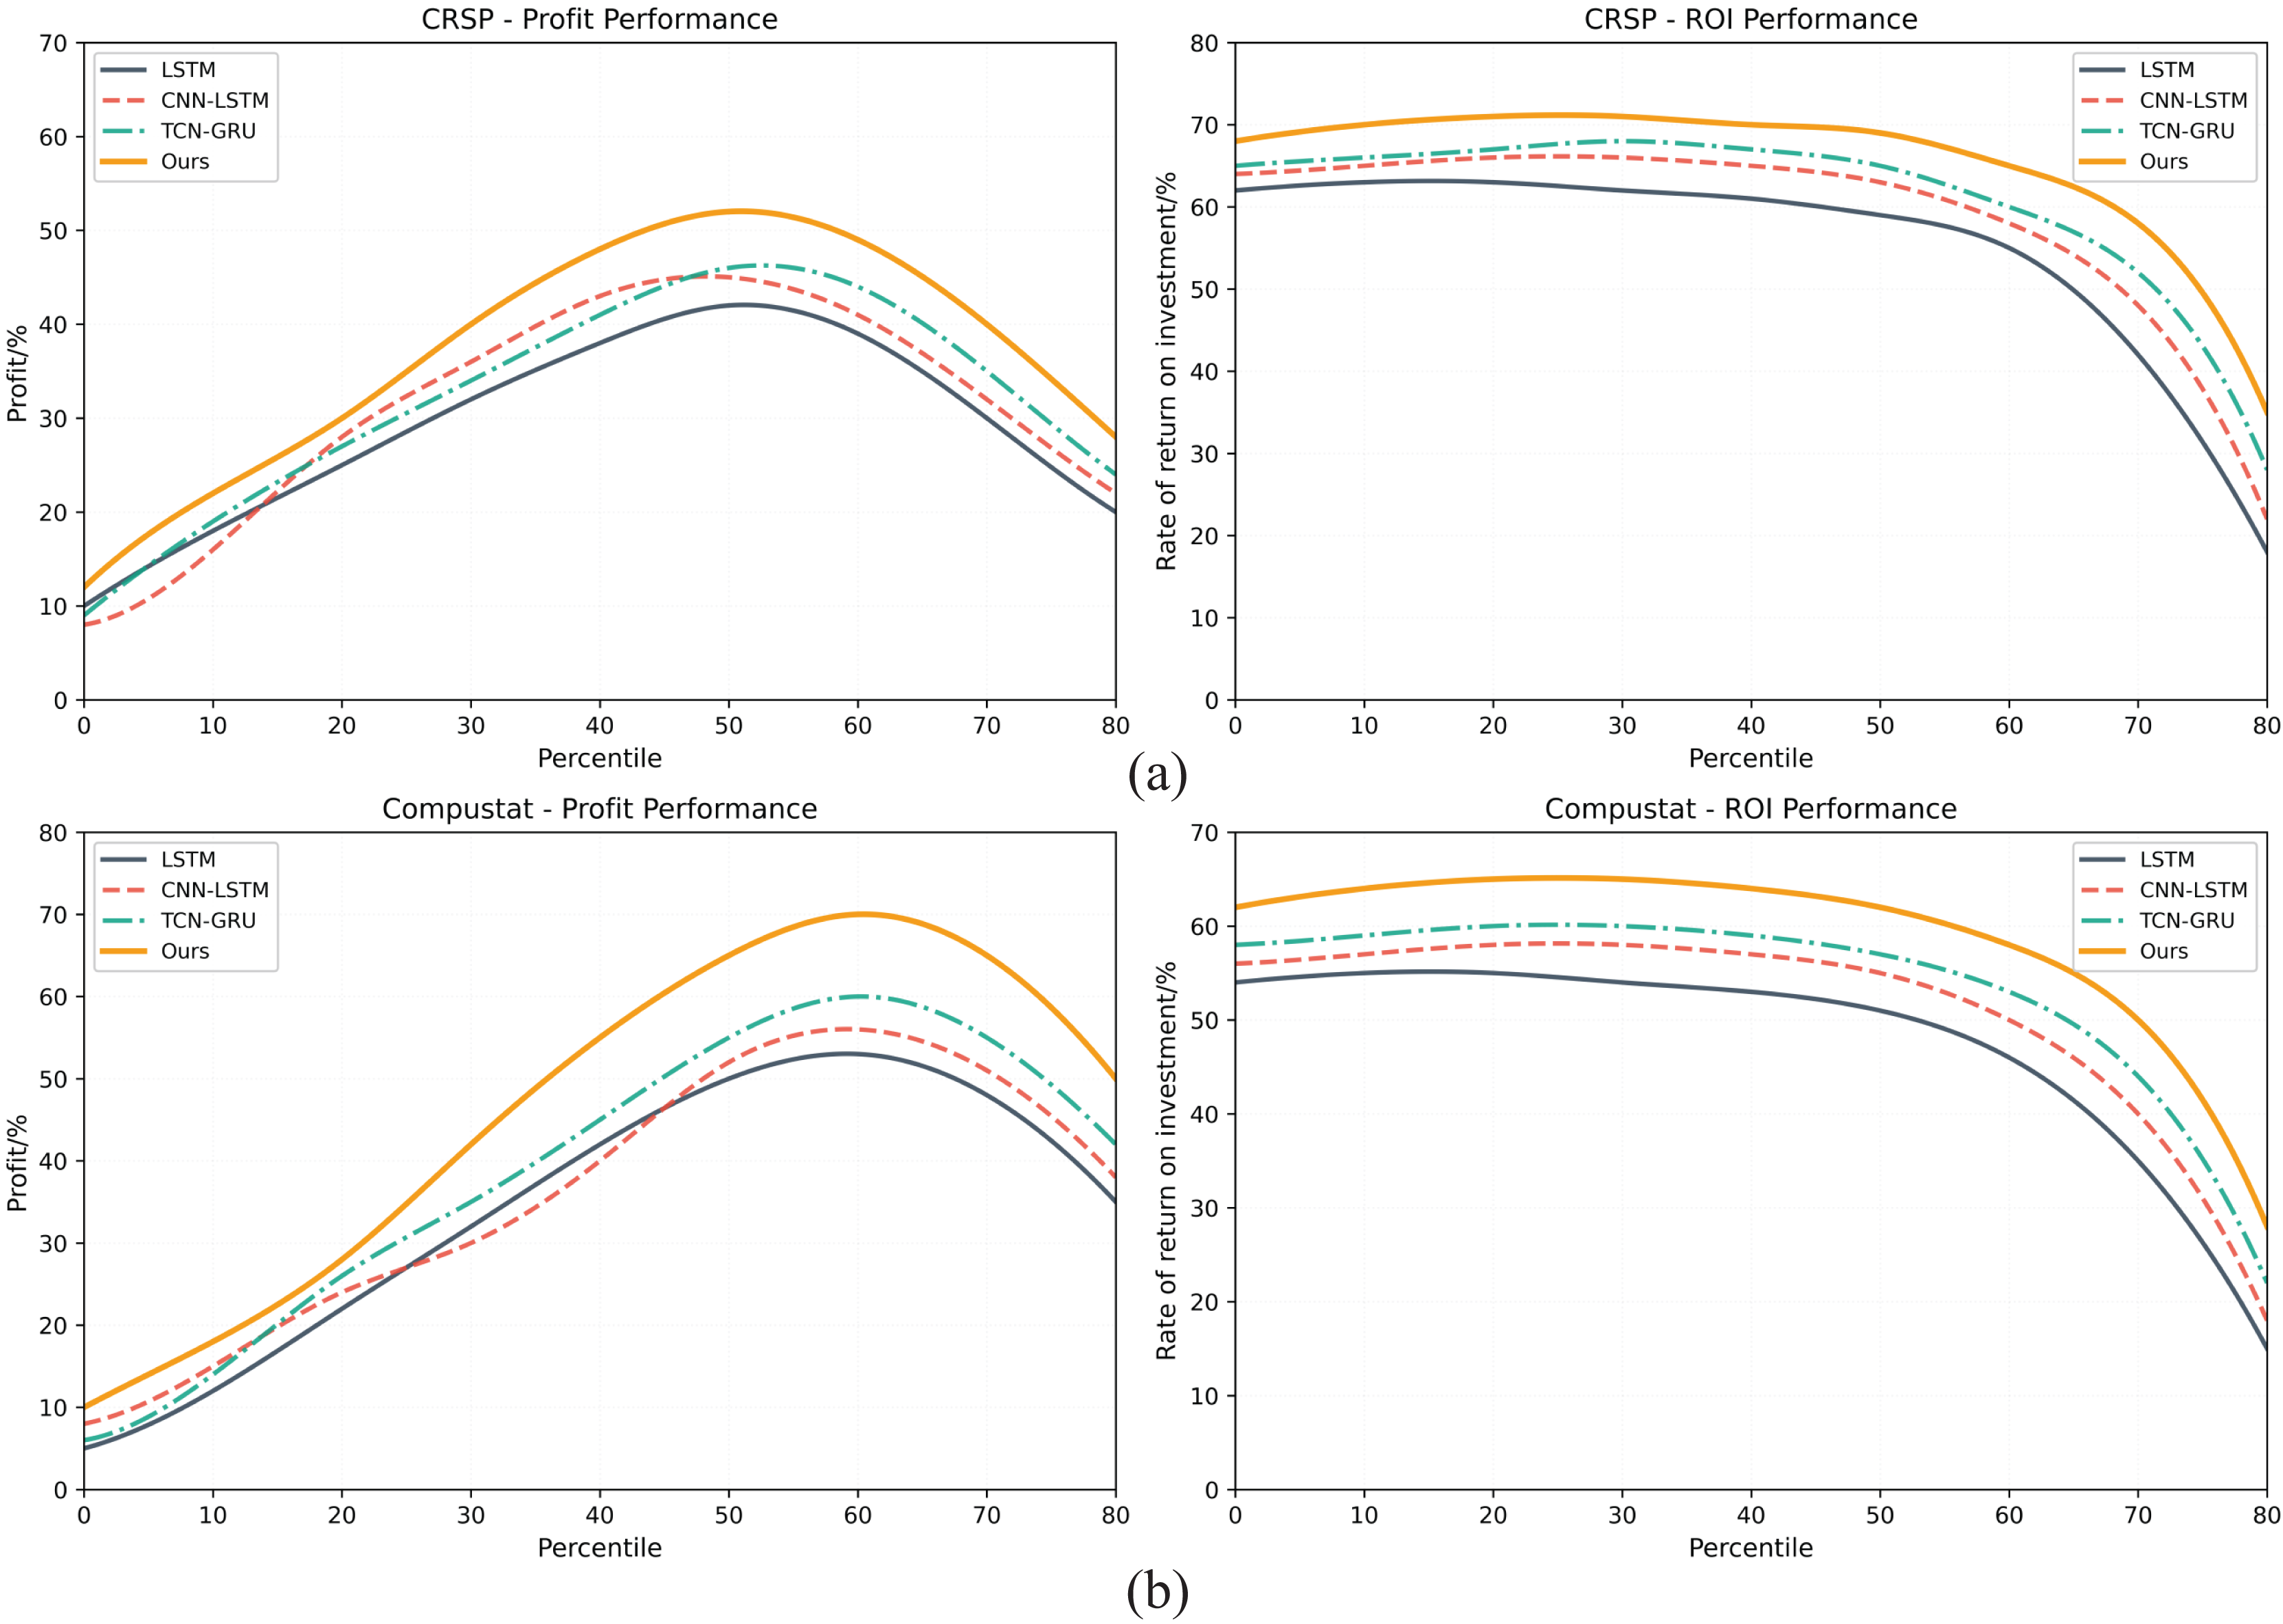
Figures 5A, 5B respectively present the comprehensive evaluation results of the investment decision-making performance of the GA-FL-Transformer model in comparison with three competing models, namely LSTM, CNN-LSTM, and TCN-GRU, on two financial datasets, CRSP and Compustat. From a profit margin perspective, the experimental results reveal significant performance differences. On the CRSP dataset, the GA-FL-Transformer achieves a peak profit margin of 52%, representing improvements of 30%, 20.9%, and 13% compared to LSTM’s 40%, CNN-LSTM’s 43%, and TCN-GRU’s 46%, respectively. On the Compustat dataset, the performance gap is even more pronounced, with the GA-FL-Transformer reaching a peak profit margin of 70%, far surpassing the other three models’ figures of 55%, 56%, and 60%. Although the performance of all models is similar in low-risk intervals, as risk increases, the GA-FL-Transformer demonstrates stronger profitability, highlighting the advantage of the proposed model in integrating multimodal features.
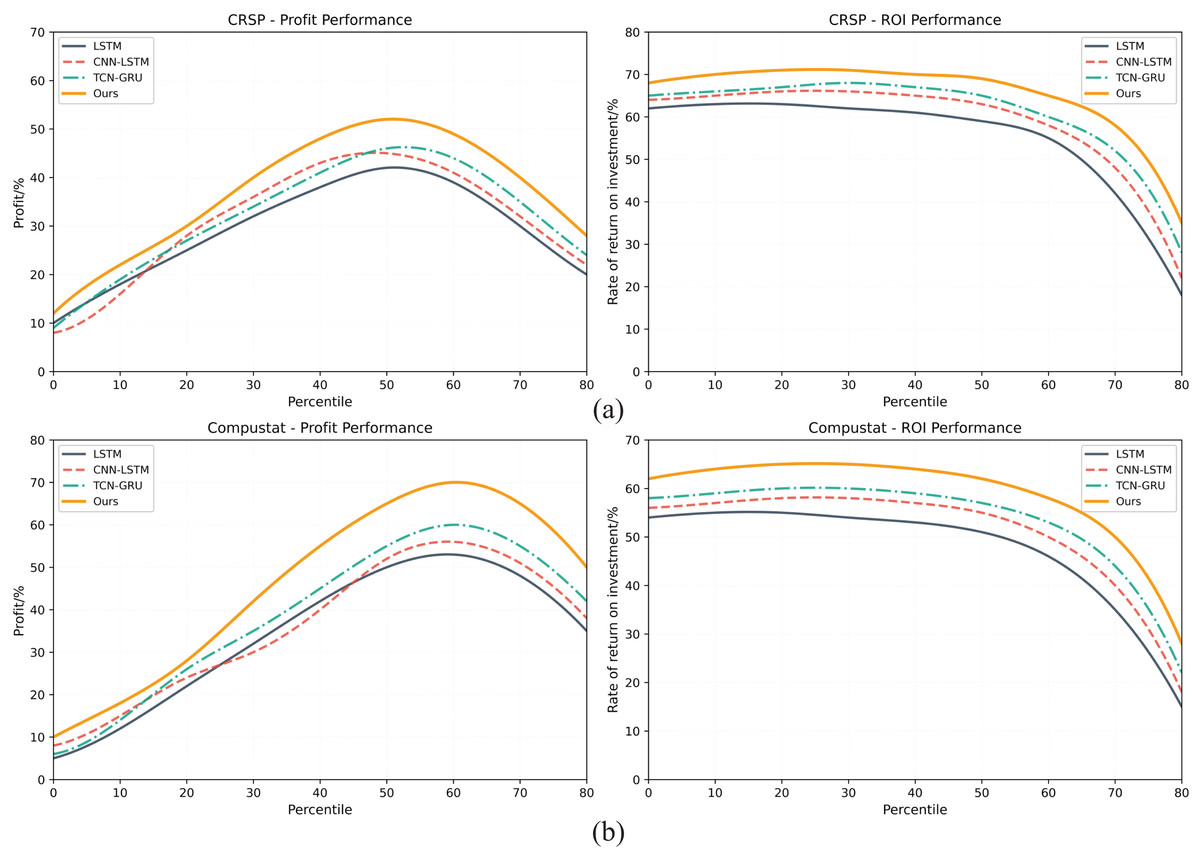
Figure 5: Investment decision-making performance on both datasets.
The Return on Investment (ROI) metric further validates the GA-FL-Transformer’s superiority and robustness. On the CRSP dataset, the model consistently maintains a high ROI of 70–71% across multiple intervals, while the competing models’ ROIs fluctuate between 62% and 68%. Similarly, on the Compustat dataset, the GA-FL-Transformer sustains a stable high ROI of 65%, clearly outperforming the competing models. In high-risk intervals, although all models experience a declining ROI, the GA-FL-Transformer’s decline curve is smoother, whereas traditional models like LSTM exhibit a sharper drop. This fully demonstrates that the effective integration of genetic algorithm optimization, fuzzy logic reasoning, and the Transformer architecture in the GA-FL-Transformer enhances the profitability of investment decisions.
Table 1 confirms the superior generalization capability of the proposed GA-FL-Transformer model across diverse financial datasets. When trained on CRSP and tested on Compustat, GA-FL-Transformer achieves an F1-score of 0.847, significantly outperforming LSTM (0.732), CNN-LSTM (0.769), and TCN-GRU (0.798), with relative improvements of 11.5 percent, 7.8 percent, and 4.9 percent, respectively. Bidirectional validation using Compustat for training and CRSP for testing yields a similarly strong F1-score of 0.851, demonstrating consistent cross-market generalization. Notably, GA-FL-Transformer exhibits only an 8.2 percent average performance decline when moving from within-dataset to cross-dataset evaluation, compared to substantially larger drops of 14.4 percent for LSTM, 12.1 percent for CNN-LSTM, and 10.6 percent for TCN-GRU. This confirms that the transformer-based attention mechanism and adaptive imputation strategy effectively learn generalizable temporal patterns rather than dataset-specific artifacts.
| Model | Train: CRSP | Train: Compustat | Train: CRSP | Train: Compustat |
|---|---|---|---|---|
| Test: Compustat | Test: CRSP | Test: CRSP | Test: Compustat | |
| GA-FL-Transformer (Proposed) | 0.847 | 0.851 | 0.923 | 0.918 |
| LSTM | 0.732 | 0.728 | 0.856 | 0.849 |
| CNN-LSTM | 0.769 | 0.774 | 0.881 | 0.876 |
| TCN-GRU | 0.798 | 0.803 | 0.894 | 0.887 |
Tables 2 and 3 present a comprehensive performance comparison of the proposed GA-FL-Transformer against three representative hybrid intelligent systems across four evaluation metrics on both Compustat and CRSP financial datasets. On the Compustat dataset, the GA-FL-Transformer achieves superior performance with Precision of 0.966, Recall of 0.952, F1-score of 0.959, and Error Rate of 0.85%, demonstrating substantial improvements over GA-Fuzzy with F1-score of 0.877 and Error Rate of 2.31%, Fuzzy-NN with F1-score of 0.895 and Error Rate of 1.97%, and Transformer-based models with F1-score of 0.918 and Error Rate of 1.45%, representing F1-score improvements of 9.4%, 7.2%, and 4.5% respectively. On the CRSP dataset, the proposed model exhibits even more pronounced advantages, with a Precision of 0.973, Recall of 0.982, F1-score of 0.977, and Error Rate of 0.62%, outperforming GA-Fuzzy by 9.9%, Fuzzy-NN by 7.4%, and Transformer-based methods by 4.8% in F1-score. Notably, the GA-FL-Transformer demonstrates exceptional Recall performance on both datasets, with values of 0.952 on Compustat and 0.982 on CRSP, indicating superior ability to identify true positives and minimize false negatives, which is critical for financial risk management, where overlooking potential risks can lead to severe consequences. The consistently low Error Rates of 0.85% on Compustat and 0.62% on CRSP further validate the robustness of the attention-guided co-evolutionary mechanism, which synergistically integrates genetic algorithm optimization, fuzzy logic reasoning, and Transformer-based feature learning to achieve both high prediction accuracy and strong generalization across different financial market conditions.
| Model | Precision | Recall | F1-score | Error rate (ER) |
|---|---|---|---|---|
| GA-FL-Transformer (Proposed) | 0.966 | 0.952 | 0.959 | 0.85% |
| GA-Fuzzy (Huang et al., 2025) | 0.883 | 0.871 | 0.877 | 2.31% |
| Fuzzy-NN (Fonseca, Wanke & Correa, 2020) | 0.901 | 0.889 | 0.895 | 1.97% |
| Transformer-based (Wu et al., 2024a) | 0.921 | 0.915 | 0.918 | 1.45% |
| Model | Precision | Recall | F1-score | Error rate (ER) |
|---|---|---|---|---|
| GA-FL-Transformer (Proposed) | 0.973 | 0.982 | 0.977 | 0.62% |
| GA-Fuzzy (Huang et al., 2025) | 0.891 | 0.886 | 0.889 | 1.98% |
| Fuzzy-NN (Fonseca, Wanke & Correa, 2020) | 0.912 | 0.907 | 0.910 | 1.73% |
| Transformer-based (Wu et al., 2024a) | 0.935 | 0.928 | 0.932 | 1.21% |
Ablation experiments and application analysis
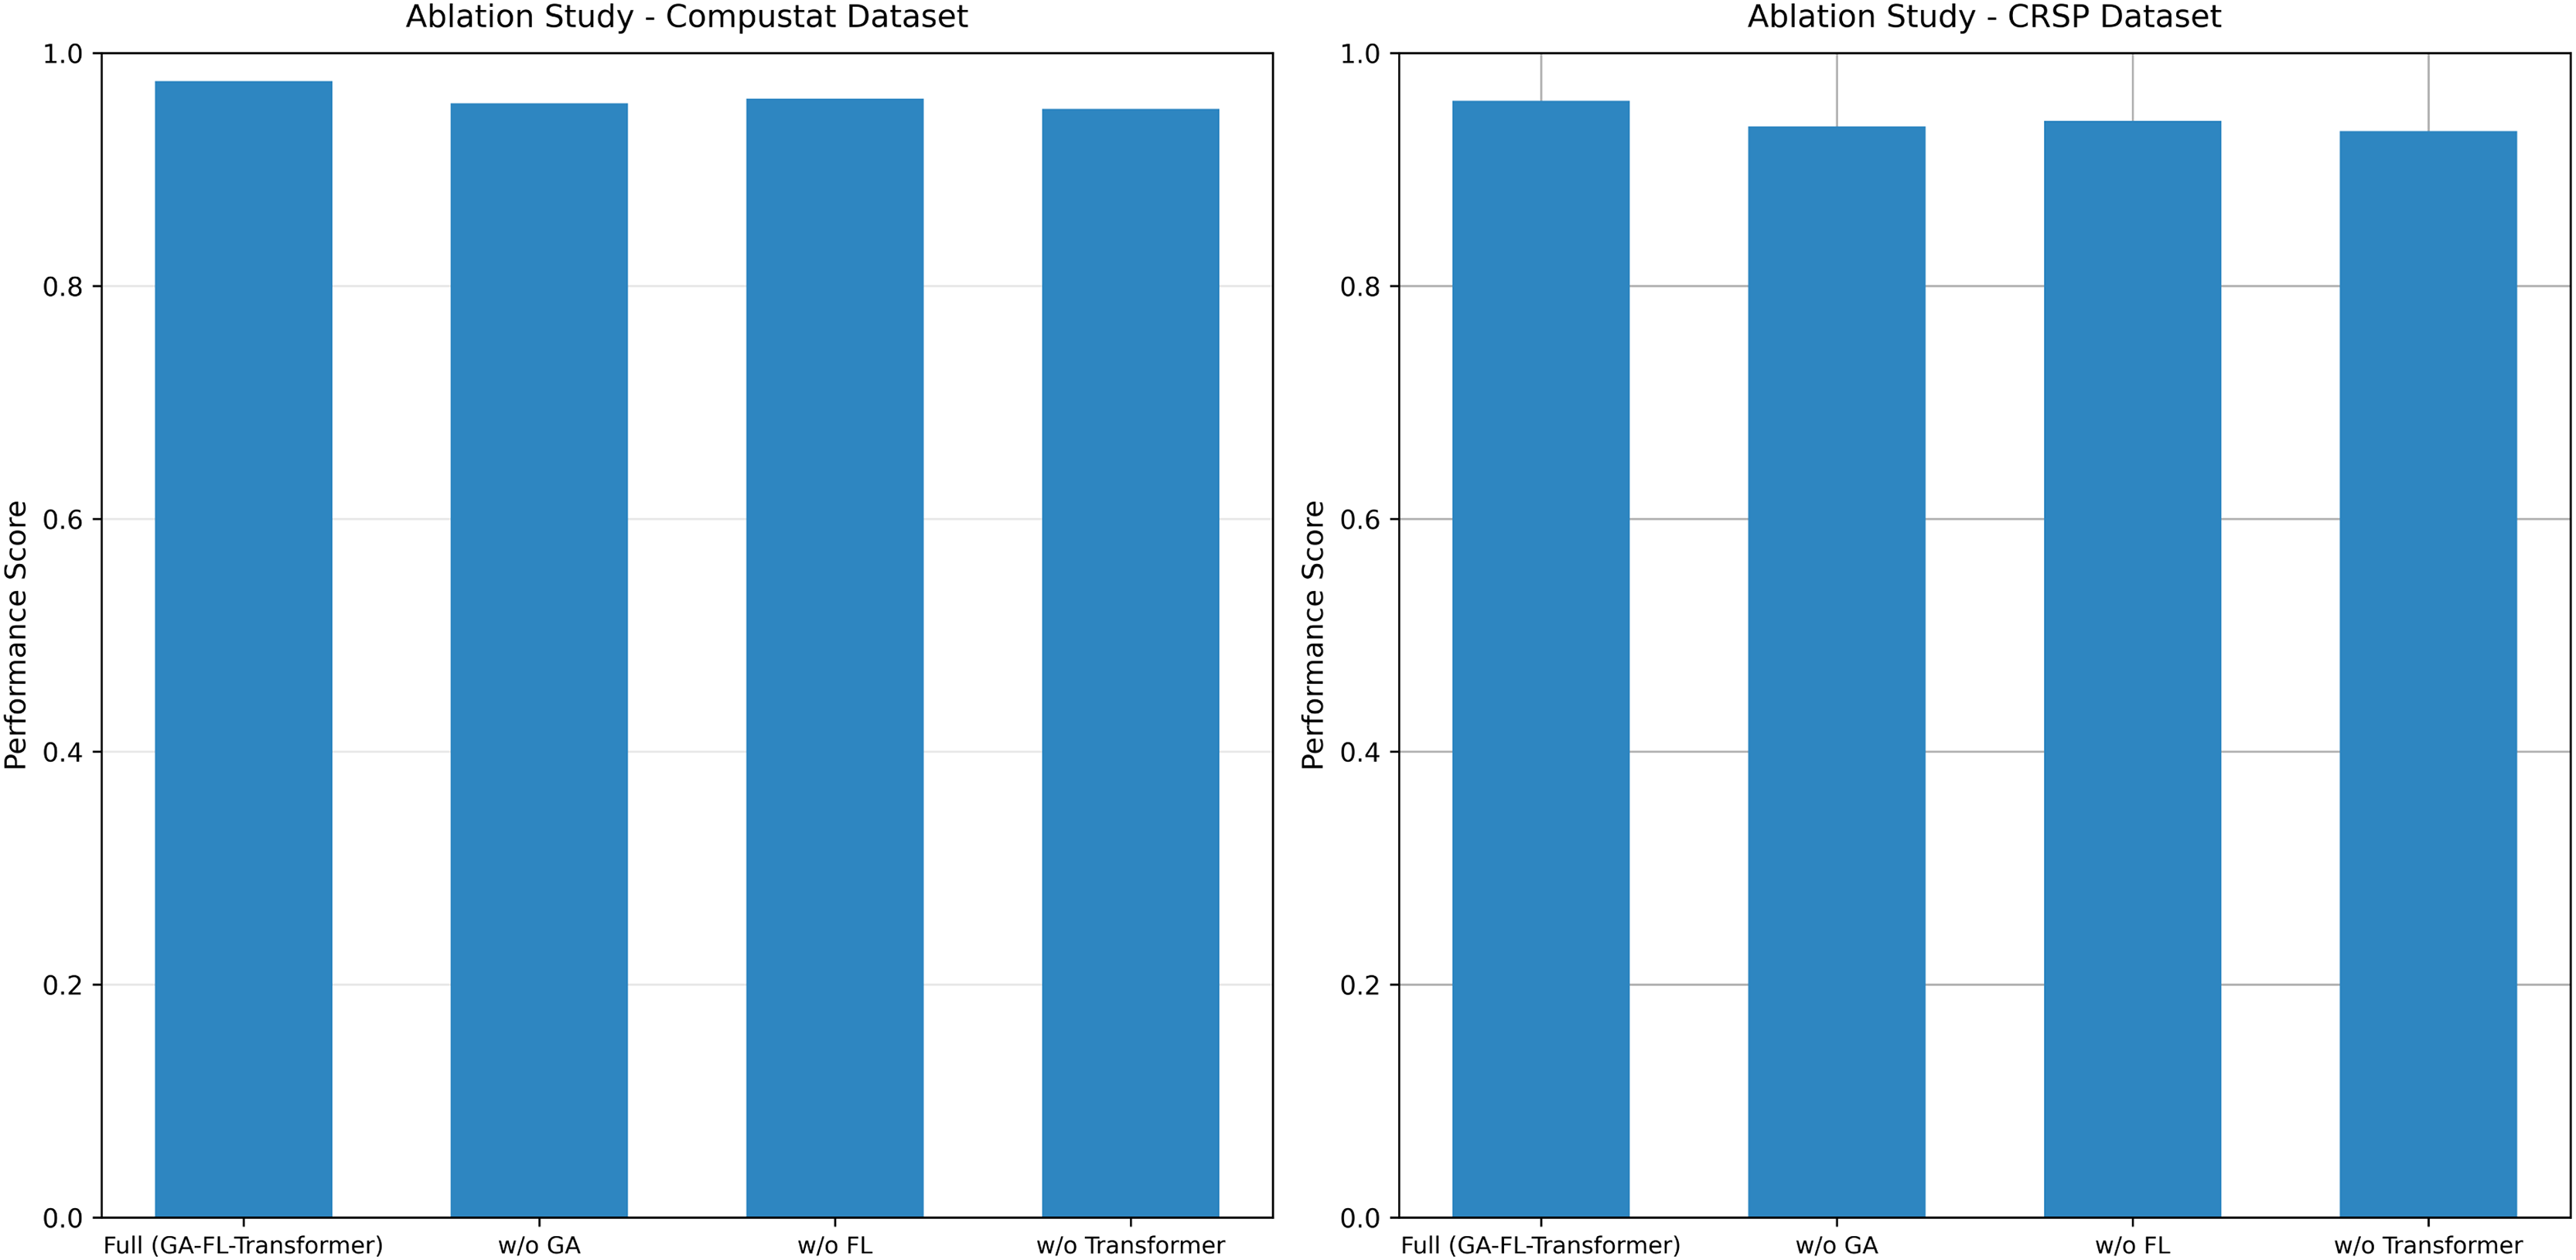
To thoroughly analyze the contributions of each core component and their collaborative mechanisms within the proposed model, this article systematically performs ablation experiments. The results are presented in Fig. 6.
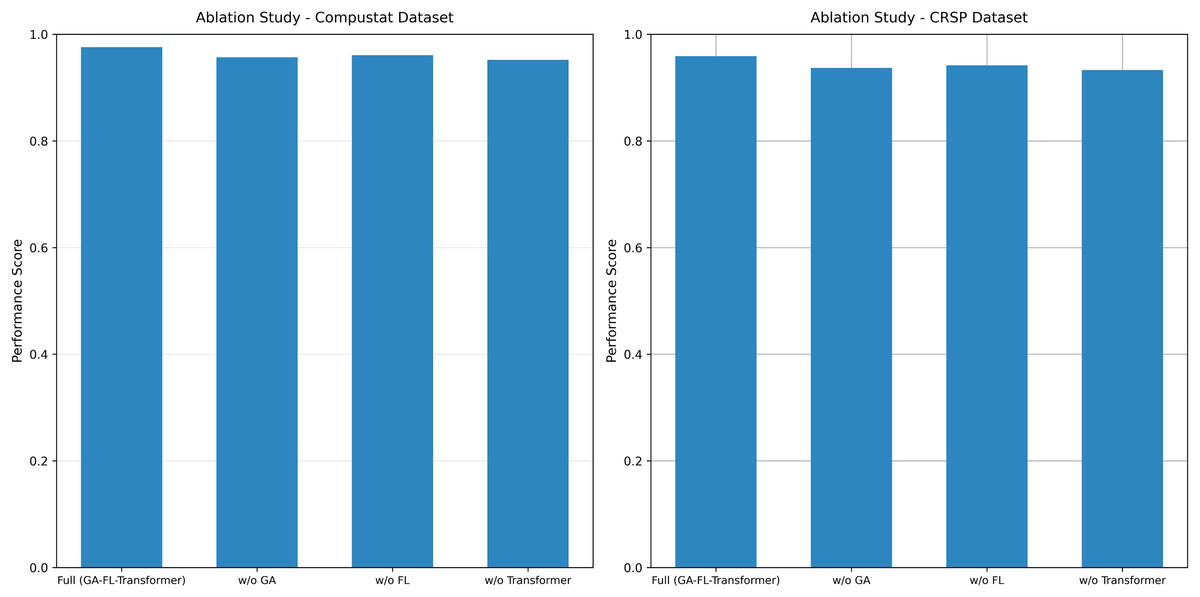
Figure 6: Ablation study results on both datasets.
On the Compustat dataset, the complete GA-FL-Transformer model achieves an F1-score of 0.959. After sequentially removing each component, a systematic decline in performance is observed: the removal of the GA reduces the F1-score to 0.938, representing a performance degradation of 2.2%; eliminating FL results in an F1-score of 0.942, a decrease of 1.8%; and removing the Transformer module leads to a performance drop to 0.934, with an amplitude of decline reaching 2.6%. A consistent trend is observed on the CRSP dataset. The complete model attains an F1-score of 0.977, whereas removing the GA, FL, and Transformer components results in scores of 0.958, 0.961, and 0.952, respectively, corresponding to performance losses of 1.9%, 1.6%, and 2.6%.
These results clearly indicate that the Transformer module plays a pivotal role in feature extraction and multi-source information fusion. At the same time, GA and FL make significant contributions in high-dimensional optimization and uncertainty reasoning, respectively.
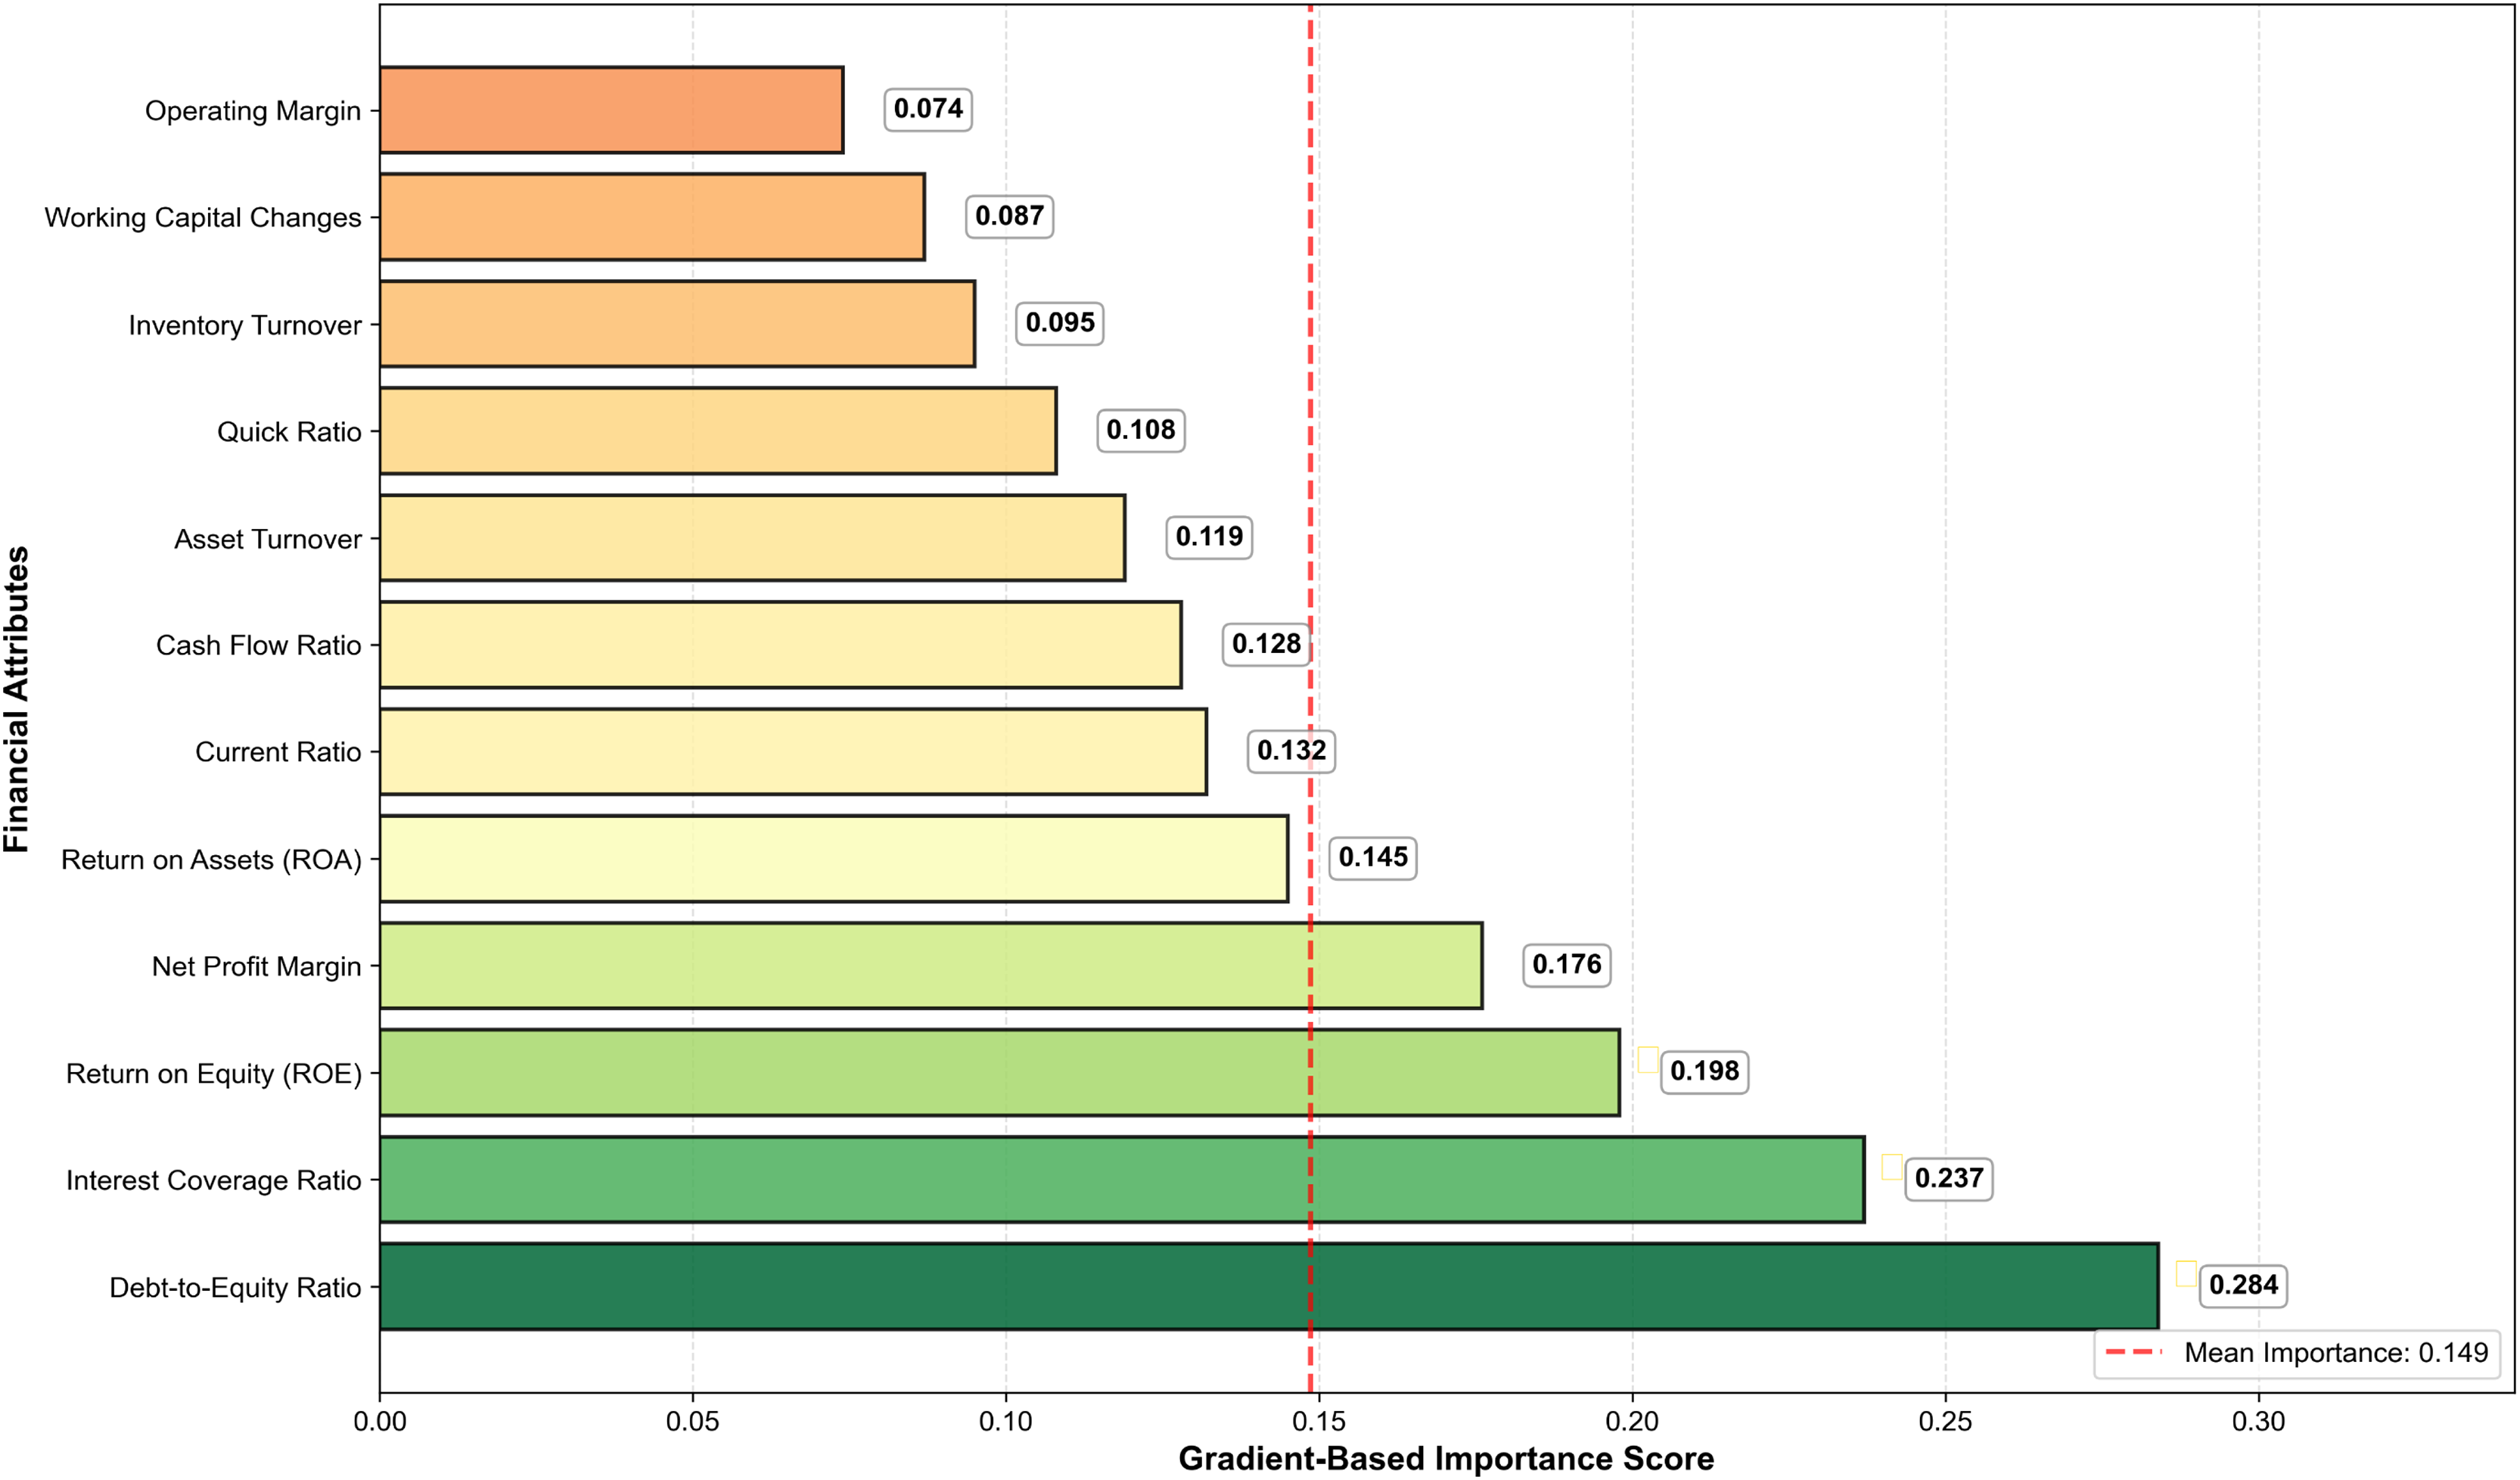
Figure 7 presents the gradient-based feature importance analysis, revealing the hierarchical contribution of financial attributes to the GA-FL-Transformer model’s optimization outcomes. The results demonstrate that leverage-related indicators, specifically the debt-to-equity ratio and interest coverage ratio, have the highest importance scores of 0.284 and 0.237, respectively, accounting for 52.1% of the cumulative feature contribution and underscoring their critical role in financial risk assessment. Profitability metrics, including ROE, net profit margin, and ROA, constitute the secondary tier of influential features, with scores of 0.198, 0.176, and 0.145, respectively, indicating that earnings quality and operational efficiency significantly influence risk prediction accuracy. The gradient analysis further reveals a complementary learning mechanism in which the GA module prioritizes features with high temporal volatility, such as cash flow ratios and changes in working capital, to enable dynamic adaptation to market fluctuations. In contrast, the FL module focuses on features characterized by inherent uncertainty and qualitative judgment, such as leverage and coverage ratios, to handle ambiguous risk signals through fuzzy reasoning effectively. This synergistic feature utilization mechanism allows the GA-FL-Transformer to simultaneously capture both quantitative Precision in numerical financial analysis and qualitative reasoning in complex uncertainty scenarios, thereby achieving superior adaptive learning performance in dynamic financial environments.
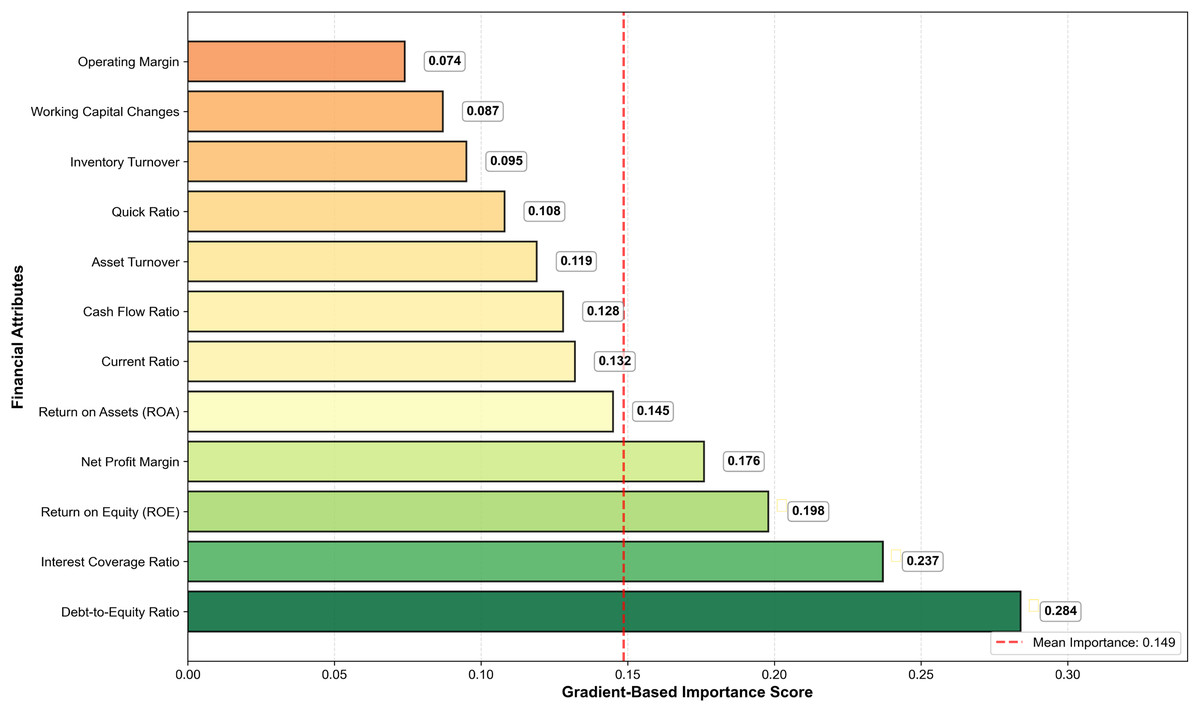
Figure 7: The gradient based feature importance analysis chart.
Discussion
This article proposes a GA-FL-Transformer-based optimization framework for corporate financial management. By effectively integrating the Transformer, GA, and FL, it achieves multi-source data perception, intelligent optimization, and decision-making in corporate financial management.
Firstly, in terms of Transformer-based multi-source data perception and feature extraction, the proposed model can effectively fuse structured financial indicators, unstructured text data, and time-series information via a multi-head attention mechanism, thereby forming a more discriminative unified feature representation. Experimental results demonstrate that this component improves performance across both datasets, highlighting its crucial role in capturing cross-modal semantic associations and long-term dependencies.
Secondly, the attention-guided genetic-fuzzy collaborative evolution mechanism exhibits strong innovation. By incorporating the Transformer’s attention weights into chromosome encoding, fitness functions, and genetic operations, the model enables the evolutionary process to perceive key feature dimensions. The introduction of fuzzy logic effectively handles uncertain information in the financial environment, enhancing the model’s interpretability while maintaining high accuracy. Ablation experiments show that removing either the GA or FL components leads to a significant performance decline, validating their importance in the model.
Thirdly, the design of the GA-FL-Transformer framework effectively integrates perception, optimization, and decision-making. Through forward reasoning and feedback learning mechanisms, the framework forms a complete closed loop from multi-source data input to final decision output. The perception layer provides high-quality feature representations, the optimization layer generates environment-adaptive rules, and the decision-making layer performs interpretable reasoning. The collaborative work of these three layers significantly enhances the comprehensive performance of the GA-FL-Transformer framework.
Finally, experiments conducted on the Compustat and CRSP datasets in this study validate the model’s effectiveness and generalization capability. The results indicate that the GA-FL-Transformer outperforms competing methods across multiple key metrics. However, the model still has certain limitations, including relatively high computational complexity. Addressing these issues will provide important directions for future research while laying the foundation for the deployment and application of the model in practical financial management systems.
Beyond performance metrics, the superior results of GA-FL-Transformer stem from its synergistic mechanisms that address fundamental challenges in financial optimization. The attention-guided genetic evolution effectively mitigates premature convergence to local minima by dynamically adjusting search directions based on feature importance—when market conditions shift, the attention weights automatically redirect genetic operators toward newly critical financial indicators, preventing the population from being trapped in outdated optimal solutions. Meanwhile, fuzzy logic enhances decision interpretability by translating continuous financial variables into linguistic terms that align with expert reasoning patterns.
While our proposed model achieves superior performance in corporate financial management tasks, we acknowledge that integrating the Transformer, Genetic Algorithm, and Federated Learning modules results in substantial computational requirements. The current architecture prioritizes prediction accuracy and robustness, aligning with strategic financial decision-making requirements that involve longer time horizons. However, we recognize the growing importance of efficient model architectures in expanding AI applicability. Future work will focus on developing lightweight variants through knowledge distillation, neural architecture search, and dynamic computation strategies to maintain strong performance while reducing computational costs. These directions aim to enable deployment in resource-constrained environments and support real-time decision-making scenarios.
Conclusion
This article addresses key challenges in corporate financial management, including difficulties in processing heterogeneous multi-source data, insufficient adaptability to dynamic environments, and a lack of systematic integration in the decision-making process. It proposes an intelligent optimization framework that integrates the Transformer, genetic algorithm, and fuzzy logic. Firstly, by leveraging the multi-head self-attention mechanism, it achieves deep fusion of structured financial indicators, unstructured text, and time-series data, significantly improving the quality and interpretability of cross-modal feature representations. Secondly, it designs an attention-weight-guided genetic algorithm-fuzzy logic collaborative evolution mechanism that combines deep feature perception with multi-objective optimization processes, enhancing the model’s financial prediction accuracy and reasoning ability regarding uncertain information. Finally, it constructs an intelligent optimization framework that integrates perception, optimization, and decision-making, enabling closed-loop optimization from data to decisions via a bidirectional flow mechanism. Experimental results demonstrate that the GA-FL-Transformer framework delivers exceptional performance on both the Compustat and CRSP datasets, achieving F1-scores of 0.959 and 0.977, respectively, with error rates of only 0.85% and 0.62%, respectively. Cross-dataset validation confirms superior generalization capability, with an average performance decline of 8.2% compared to 10.6-14.4% for baseline models. These results provide essential theoretical and practical foundations for the construction of intelligent corporate financial decision-making systems.