
Nocturnal non-speech sound classification with multi-spectrogram feature fusion and an attention-based stacked hybrid convolutional bidirectional long short-term memory–vision transformer architecture
- Published
- Accepted
- Received
- Academic Editor
- Davide Chicco
- Subject Areas
- Artificial Intelligence, Data Mining and Machine Learning, Multimedia, Neural Networks
- Keywords
- Sleep sound classification, Hybrid deep learning architecture, Vision transformer (ViT), Spectrogram-based feature representation, Stacking ensemble learning
- Copyright
- © 2026 Sağbaş
- Licence
- This is an open access article distributed under the terms of the Creative Commons Attribution License, which permits unrestricted use, distribution, reproduction and adaptation in any medium and for any purpose provided that it is properly attributed. For attribution, the original author(s), title, publication source (PeerJ Computer Science) and either DOI or URL of the article must be cited.
- Cite this article
- 2026. Nocturnal non-speech sound classification with multi-spectrogram feature fusion and an attention-based stacked hybrid convolutional bidirectional long short-term memory–vision transformer architecture. PeerJ Computer Science 12:e3536 https://doi.org/10.7717/peerj-cs.3536
Abstract
Nocturnal non-speech sounds encapsulate critical physiological and behavioral information, making them a valuable modality for non-invasive assessment of sleep quality. Despite this potential, existing approaches predominantly rely on single-view spectral features or shallow learning architectures, limiting their ability to generalize across diverse acoustic patterns. To overcome these limitations, this study proposes a hybrid deep learning architecture tailored for the classification of seven distinct nocturnal sound categories. The system employs a tri-branch design that independently processes Mel-frequency cepstral coefficients (MFCC), Mel-spectrogram, and constant-Q transform (CQT)-spectrogram representations. Each branch passes through a dedicated pipeline comprising convolutional neural networks (CNN), bidirectional long short-term memory (BiLSTM) layers, and attention-equipped vision transformers (ViT). This configuration facilitates hierarchical learning of local, temporal, and global contextual features. The softmax outputs of each branch are fused using a stacking ensemble strategy, with an XGBoost-based meta-classifier performing the final decision integration. A complementary weighted ensemble is also implemented for comparative evaluation. Experimental results on a publicly available seven-class non-speech sound dataset demonstrate the proposed model’s outstanding performance, achieving 99.71% accuracy under 10-fold cross-validation, along with consistently high precision, recall, and F1-scores across all classes. Comparative benchmarks show substantial improvements over existing state-of-the-art models, including CNNs, long short-term memory (LSTM) variants, classical machine learning approaches, and metaheuristic-based ensembles. Supporting analyses such as confidence score distributions and dimensionality reduction visualizations (principal component analysis (PCA), t-distributed stochastic neighbor embedding (t-SNE)) further validate the model’s robustness and discriminative power. These findings highlight the effectiveness of integrating multi-spectral representations, deep hierarchical modeling, and ensemble strategies for high-fidelity nocturnal non-speech sound classification.
Introduction
Sleep is a fundamental human behavior essential for maintaining mental and physical health, as well as overall quality of life (Akbal & Tuncer, 2021; Akyol, Yildirim & Alatas, 2023). Adequate and regular sleep is a physiological necessity, yet numerous factors (such as gastrointestinal or respiratory disorders, socio-economic stress, urban lifestyle, excessive technology use) can impair sleep quality (Ben-Israel, Tarasiuk & Zigel, 2010; Chattu et al., 2018). Poor sleep often leads to chronic disorders accompanied by broader health complications (Otsuka et al., 2017). Although self-regulated sleep hygiene may alleviate mild disturbances, there remains a pressing need for non-invasive, low-error, and continuous systems capable of real-time detection and diagnosis (Pandey et al., 2024).
Traditionally, sleep disorders have been through polysomnography in specialized sleep laboratories. While effective, these approach is costly, equipment-dependent, and intrusive for patients (Akbal & Tuncer, 2021). As a more accessible alternative, audio and video-based analyses have been explored (Kim et al., 2019). Nocturnal sounds can be recorded using low-cost devices and analyzed via artificial intelligence, enabling efficient acquisition and interpretation of sleep-related data. Such analyses provide diagnostic insights and actionable feedback to improve sleep quality (Akyol, Yildirim & Alatas, 2023).
A growing body of research has focused on the automatic classification of nocturnal sounds using artificial intelligence methodologies. Previous studies have addressed diverse diagnostic objectives, including the detection of obstructive sleep apnea (Sillaparaya et al., 2022; Cheng et al., 2022; Kim et al., 2017, 2019), identification of snoring episodes (Adesuyi, Kim & Kim, 2022; Ding & Peng, 2022; González-Martínez et al., 2024; Jiang, Peng & Zhang, 2020; Khan, 2019), sleep stage classification (Dafna, Tarasiuk & Zigel, 2018; Hong et al., 2022; Xue et al., 2019; Kalkbrenner et al., 2019), and general recognition of nocturnal vocalizations (Akbal & Tuncer, 2021; Akyol, Yildirim & Alatas, 2023; Pandey et al., 2024; Sağbaş, 2023). In these works, classical machine learning algorithms (such as logistic regression, support vector machines, and random forests) were initially employed (Kim et al., 2019; Xue et al., 2019; Sağbaş, 2023), followed by deep learning-based approaches utilizing convolutional neural networks (CNNs) and long short-term memory (LSTMs) to extract temporal and spectral patterns (Adesuyi, Kim & Kim, 2022; Cheng et al., 2022; Jiang, Peng & Zhang, 2020).
Although these architectures have achieved notable success, their capacity to model global contextual dependencies across the entire spectrogram remains limited. CNNs primarily capture localized spectral cues, while LSTMs focus on sequential dependencies; neither effectively represents long-range relationships within complex acoustic scenes. Consequently, the potential of vision transformer (ViT) architectures (designed to capture global patterns through self-attention) has not yet been explored in depth for sleep or nocturnal sound classification. This observation defines the principal research gap addressed in the present study.
ViTs have achieved remarkable performance across vision and time-series domains due to their ability to model inter-patch relationships using multi-head self-attention (Bravo-Ortiz et al., 2024). By representing spectrograms as sequences of patches, ViTs enable global reasoning that complements the local and temporal modeling capabilities of CNN and LSTM networks (Chilet-Martos et al., 2025; Belal & Sundaram, 2023). However, their high computational cost and large data requirements present challenges for smaller datasets (Poonia & Al-Alshaikh, 2024; Li et al., 2023). These limitations have motivated the design of hybrid architectures that combine CNNs, BiLSTMs, and ViTs, thereby integrating local, temporal, and global feature extraction within a unified framework.
In the present study, a novel hybrid deep learning architecture is proposed for the classification of diverse non-sleep nocturnal sounds. Within this framework, three distinct spectral representations (mel-frequency cepstral coefficients (MFCC), Mel-spectrogram, and constant-Q transform (CQT)-spectogram) are independently processed through dedicated pipelines comprising convolutional neural networks, bidirectional long short-term memory units, and vision transformer blocks with attention mechanisms. The softmax outputs of these parallel branches are then integrated via a stacked ensemble strategy based on a meta-classifier, enabling joint modeling of local, sequential, and contextual acoustic dependencies.
The performance of the proposed model was evaluated through both stacking and weighted ensemble techniques on a publicly available seven-class non-speech sound dataset of nocturnal sounds (Akbal & Tuncer, 2021). The evaluation process involved systematic 10-fold cross-validation, where each model configuration was examined with respect to accuracy, precision, recall, and F1-score to ensure fair and reproducible assessment. Through these analyses, the generalization capability and robustness of the proposed hybrid framework were comprehensively examined and compared against existing state-of-the-art approaches in the same domain.
The main contributions of this study can be summarized as follows:
-
1.
A hybrid deep learning architecture was introduced in which three distinct spectral representations (MFCC, Mel-spectrogram, and CQT-spectrogram) were each processed through a unified convolutional bidirectional long short-term memory–vision transformer (ConvBiLSTM-ViT) pipeline enhanced with attention mechanisms. To the best of our knowledge, such a configuration has not been previously explored in the literature.
-
2.
A stacked softmax-based fusion strategy was adopted, allowing the meta-classifier to learn inter-branch dependencies and provide a more adaptive integration of spectral features than static ensemble methods.
-
3.
The robustness and separability of the proposed framework were analyzed through confidence-based and dimensionality-reduction visualizations, offering deeper insight into model reliability and inter-class discriminability.
-
4.
When evaluated against current state-of-the-art approaches on the same dataset, the proposed architecture showed a consistent improvement trend across evaluation criteria, demonstrating reliable generalization and methodological robustness.
Taken together, these contributions establish a methodological basis for future research on non-invasive and intelligent acoustic monitoring systems. Beyond quantitative performance improvements, this research contributes to the broader development of intelligent, non-invasive monitoring frameworks that can support future applications in sleep health and environmental sound analysis. By combining local, temporal, and global acoustic feature modeling within a unified hybrid architecture, the proposed system demonstrates a methodological advancement that extends beyond incremental accuracy and provides a foundation for real-world acoustic health-monitoring solutions.
Proposed method
Input representation and preprocessing
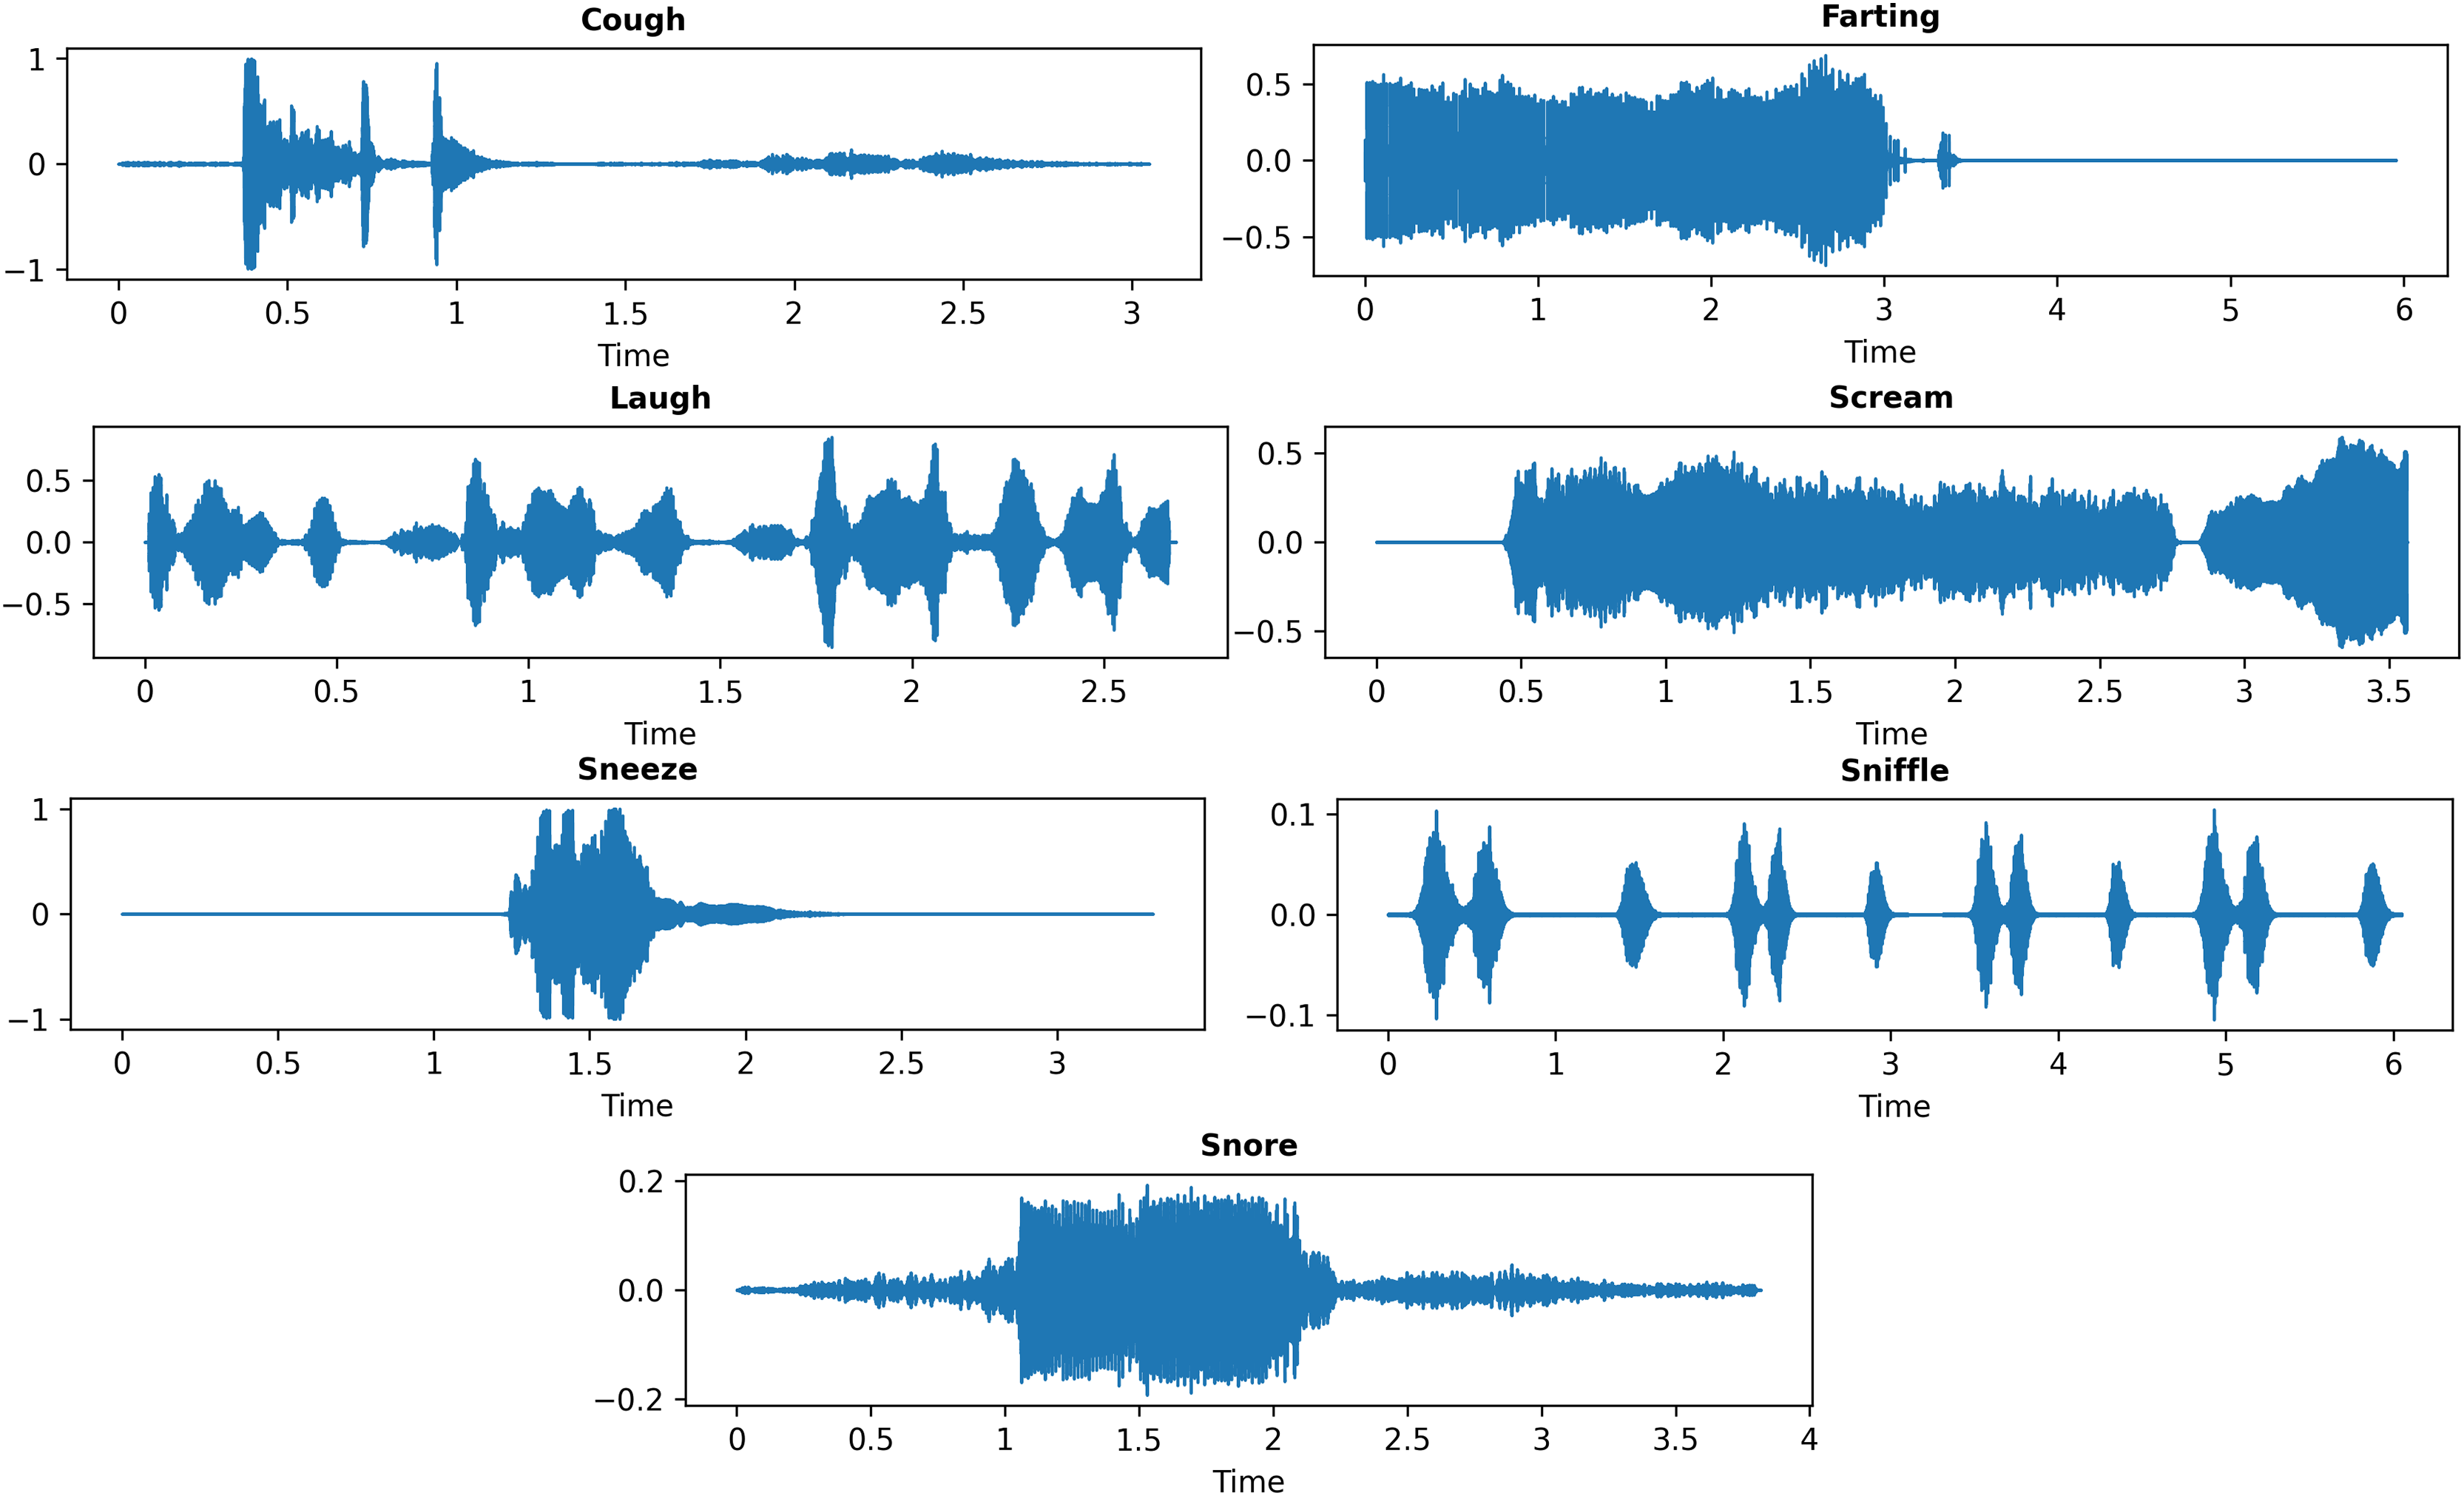
In this study, the publicly available nocturnal non-speech sound dataset compiled by Akbal & Tuncer (2021) was utilized. It was incorporated into the experimental setup to investigate the general classification of nocturnal acoustic events rather than the clinical diagnosis of sleep disorders. This dataset was originally introduced in their work titled “FusedTSNet: An automated nocturnal sleep sound classification method based on a fused textural and statistical feature generation network”, published in Applied Acoustics (Vol. 171, 2021). It is openly accessible for academic research, and the dataset access details can be found in the original article at https://doi.org/10.1016/j.apacoust.2020.107559. The dataset comprises a total of 700 audio samples evenly distributed across seven categories: laugh, sneeze, cough, snore, farting, sniffle, and scream. Each class consists of 100 audio segments extracted from 20 to 40 different video recordings to ensure diversity and intra-class variability. All recordings were sampled at a frequency of 48 kHz, with durations ranging between 4 and 8 s. Representative waveform examples for each class are presented in Fig. 1, while dataset statistics and detailed specifications are summarized in Table 1.
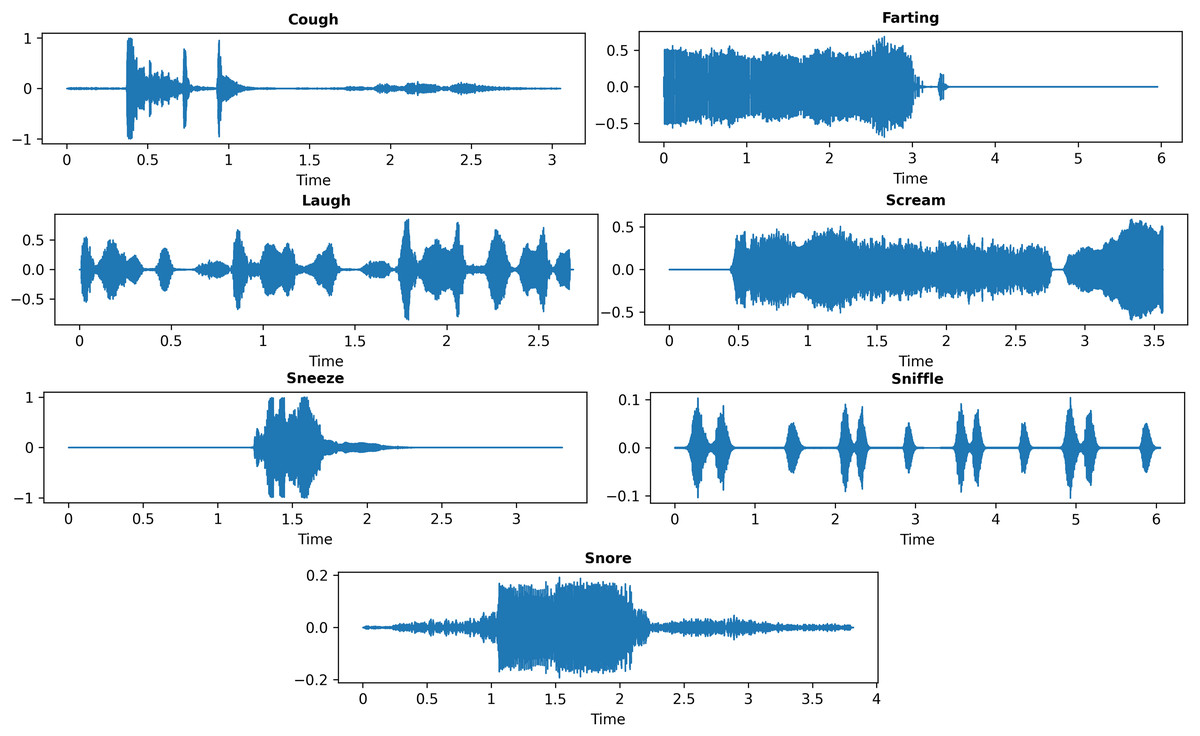
Figure 1: Representative waveform samples from each sleep sound class.
| Class no | Non-speech class name | Number of recording | Number of audio signals | Signal length (s) |
|---|---|---|---|---|
| 0 | Cough | 30 | 100 | 400 |
| 1 | Laugh | 40 | 100 | 500 |
| 2 | Scream | 20 | 100 | 400 |
| 3 | Sneeze | 20 | 100 | 600 |
| 4 | Snore | 20 | 100 | 600 |
| 5 | Sniffle | 30 | 100 | 400 |
| 6 | Farting | 40 | 100 | 500 |
| Total | 200 | 700 | 3,400 |
Although the dataset includes sleep-related categories such as snore and sniffle, it also contains non-sleep but nocturnal acoustic events (e.g., laugh, scream, sneeze, farting). Therefore, the present study focuses on the general classification of nocturnal non-speech sounds rather than the diagnosis of specific sleep disorders.
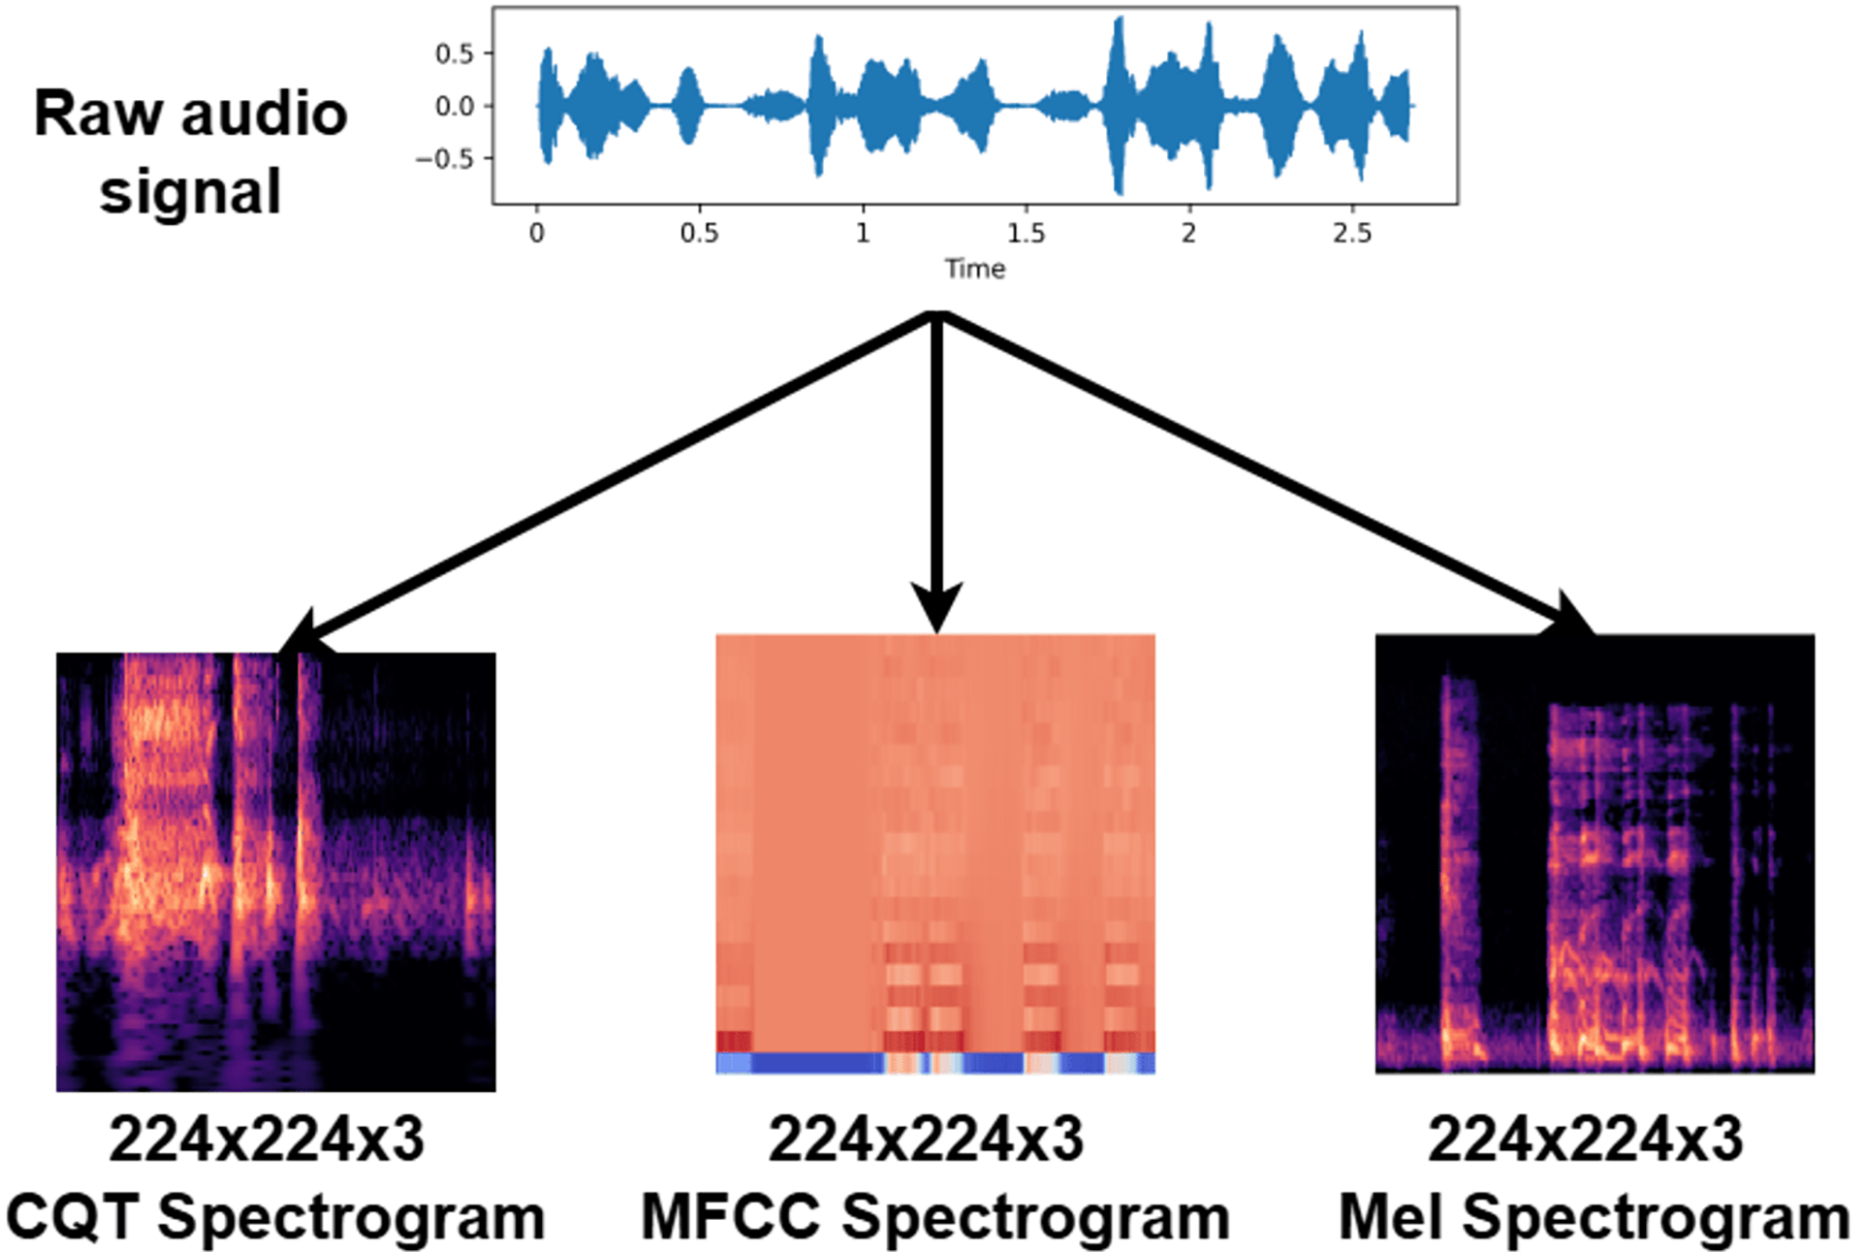
Three complementary spectral representations were extracted from each audio sample to capture distinct acoustic characteristics. MFCCs emphasize perceptually weighted frequency components, Mel-spectrograms retain broader spectral energy distributions, and CQTs provide fine resolution in the lower frequency range. While this combination offers a balanced view of the spectral content, each representation also has inherent limitations in resolution or computational complexity. To ensure architectural compatibility between the CNN and ViT components, all spectral representations were converted into pseudo-RGB images and resized to 224 × 224 pixels. High-resolution bicubic interpolation was used during resizing to preserve the fine-grained temporal and frequency structure of each spectrogram, thereby minimizing potential distortion of subtle acoustic cues.
Although the dataset provides a balanced distribution across seven classes, its overall size (700 audio recordings) is relatively limited for deep learning applications. To mitigate the risk of overfitting and enhance model generalization, SpecAugment-based time–frequency masking (Park et al., 2019) was applied during preprocessing. This augmentation approach introduces controlled spectro-temporal variability without adding artificial noise or pitch distortions, which is particularly suitable for relatively small datasets. In addition, a 10-fold cross-validation strategy was employed to ensure robust and unbiased evaluation. Therefore, the reported performance should be interpreted within the context of this data constraint. The complete data representation and preprocessing workflow is illustrated in Fig. 2.
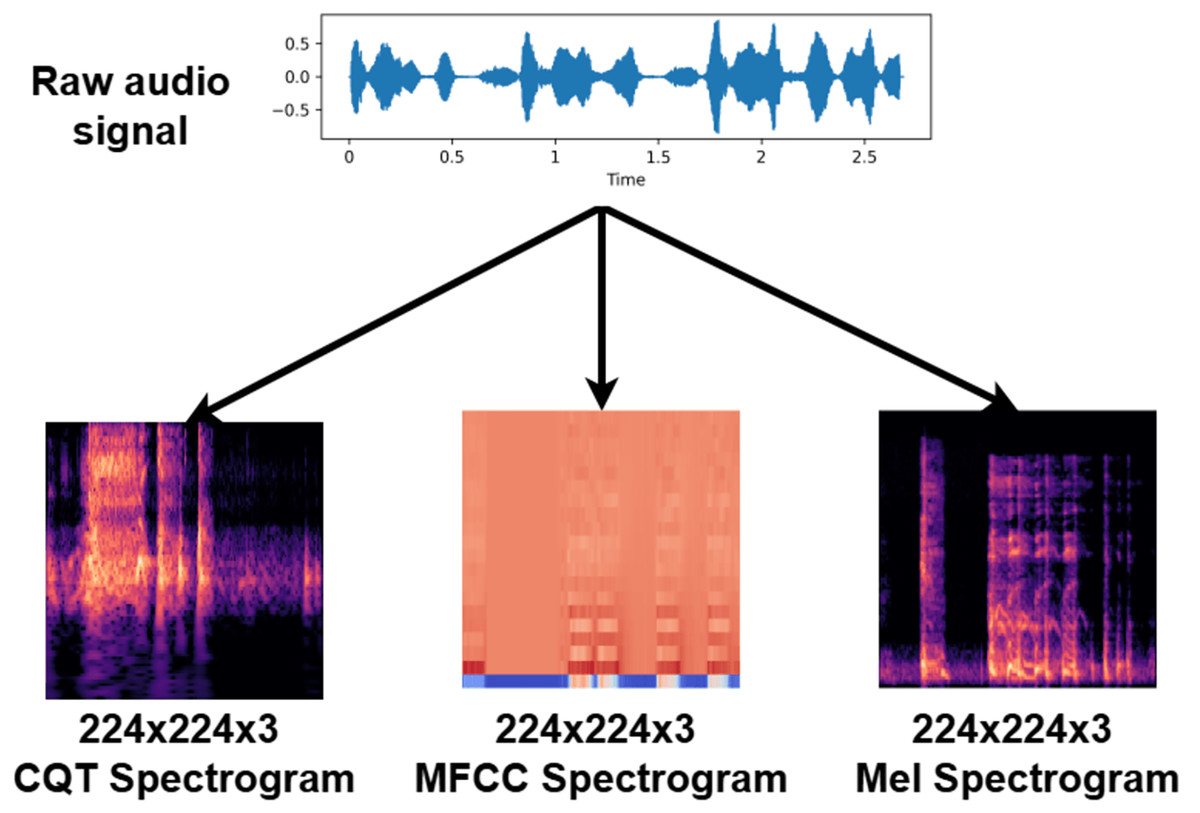
Figure 2: Schematic diagram of the spectral feature extraction and image-based data representation process.
Mel-Frequency Cepstral Coefficients: MFCCs are among the most widely used features for extracting meaningful information from audio signals, particularly in speech and sound recognition tasks (Akbal & Tuncer, 2021; Yıldırım, 2022; Ayvaz et al., 2022). Originally introduced by Davis & Mermelstein (1980), MFCCs are based on the human auditory perception system, which exhibits limited sensitivity to frequency differences above 1 kHz. The technique captures the nonlinear frequency resolution of the human auditory system by projecting the power spectrum of the signal onto the Mel scale, a perceptual frequency scale where equal distances correspond to equal perceived pitch intervals. On this scale, frequencies below 1,000 Hz are spaced linearly, while those above 1,000 Hz are distributed logarithmically, using a bank of triangular filters (Martinez et al., 2012). This process enables the extraction of features that closely align with human auditory discrimination capabilities, making MFCCs particularly effective for characterizing complex acoustic patterns.
Mel-spectrogram: The Mel-spectrogram is a visual representation of the time-varying power spectrum of an audio signal, projected onto the Mel scale. Owing to its frequency resolution characteristics that closely align with human auditory perception, it has become a widely adopted representation in sound classification tasks (Zhou et al., 2021). By providing enhanced detail particularly in the low and mid-frequency bands, the Mel-spectrogram effectively captures fundamental acoustic properties of the signal (Zhang et al., 2021). Its two-dimensional structure (spanning time and frequency) makes it highly compatible with convolutional neural networks and other visual deep learning models, thereby enabling comprehensive analysis of complex acoustic patterns (Ustubioglu, Ustubioglu & Ulutas, 2023).
Constant-Q Transform spectrogram: CQT spectrogram provides a time–frequency representation of an audio signal with logarithmic frequency scaling. Unlike linear spectrograms, the CQT maintains a constant ratio (Q factor) between the center frequency and bandwidth for each frequency bin, resulting in high frequency resolution at lower frequencies and improved temporal resolution at higher frequencies (Neili & Sundaraj, 2025). This property enables precise capture of tonal and harmonic components in the signal (Tomar & Koolagudi, 2025). Moreover, the logarithmic scaling of the frequency axis aligns well with the nonlinear characteristics of human auditory perception, yielding a more perceptually meaningful spectral representation (Kim, Choi & Pan, 2024). Due to these advantages, the CQT spectrogram is extensively used in speech, music, and biomedical signal processing applications, offering a rich and informative input structure for deep learning models.
CNN block
The CNN block within each spectral branch is designed to extract localized time–frequency features from the input spectrograms derived from nocturnal non-speech sound recordings. These acoustic signals often exhibit subtle modulations, repetitive rhythmic patterns, and region-specific energy concentrations. CNNs offer an efficient and hierarchical mechanism for capturing such patterns and serve as foundational components within the proposed hybrid architecture. The extracted local features are subsequently forwarded to the BiLSTM and ViT blocks for higher-level temporal and contextual modeling.
At the core of the CNN block lies the 2D convolution operation, which detects localized patterns by applying learnable filters across the input feature maps. This process is formally defined in Eq. (1), where the input spectrogram is convolved with a filter kernel and added to a bias term :
(1)
This operation enables the detection of salient local patterns critical for identifying events such as snoring, sneezing, or gasping. The use of convolution in this context was formalized by LeCun et al. (2002) and has since become a standard in both image and audio signal processing tasks. Following convolution, a non-linear activation function is applied to introduce sparsity and mitigate the vanishing gradient problem. This is achieved via the Rectified Linear Unit (ReLU) function, expressed in Eq. (2):
(2)
As introduced by Nair & Hinton (2010), ReLU accelerates convergence and enhances the discriminative capacity of deep neural networks. To improve training stability and reduce internal covariate shift, the batch normalization technique is applied, as shown in Eq. (3):
(3)
Here, and are the mini-batch mean and variance, while and are learnable parameters. This normalization method, introduced by Ioffe & Szegedy (2015), smooths the optimization landscape and enhances generalization. To prevent overfitting and improve model robustness, dropout regularization is used. During training, a subset of neurons is randomly deactivated, as formulated in Eq. (4):
(4)
In this formulation, is a binary mask drawn from a Bernoulli distribution with retention probability , as proposed by Srivastava et al. (2014). Following these layers, max pooling is performed to reduce spatial dimensionality while preserving prominent activations. The pooling operation is defined in Eq. (5):
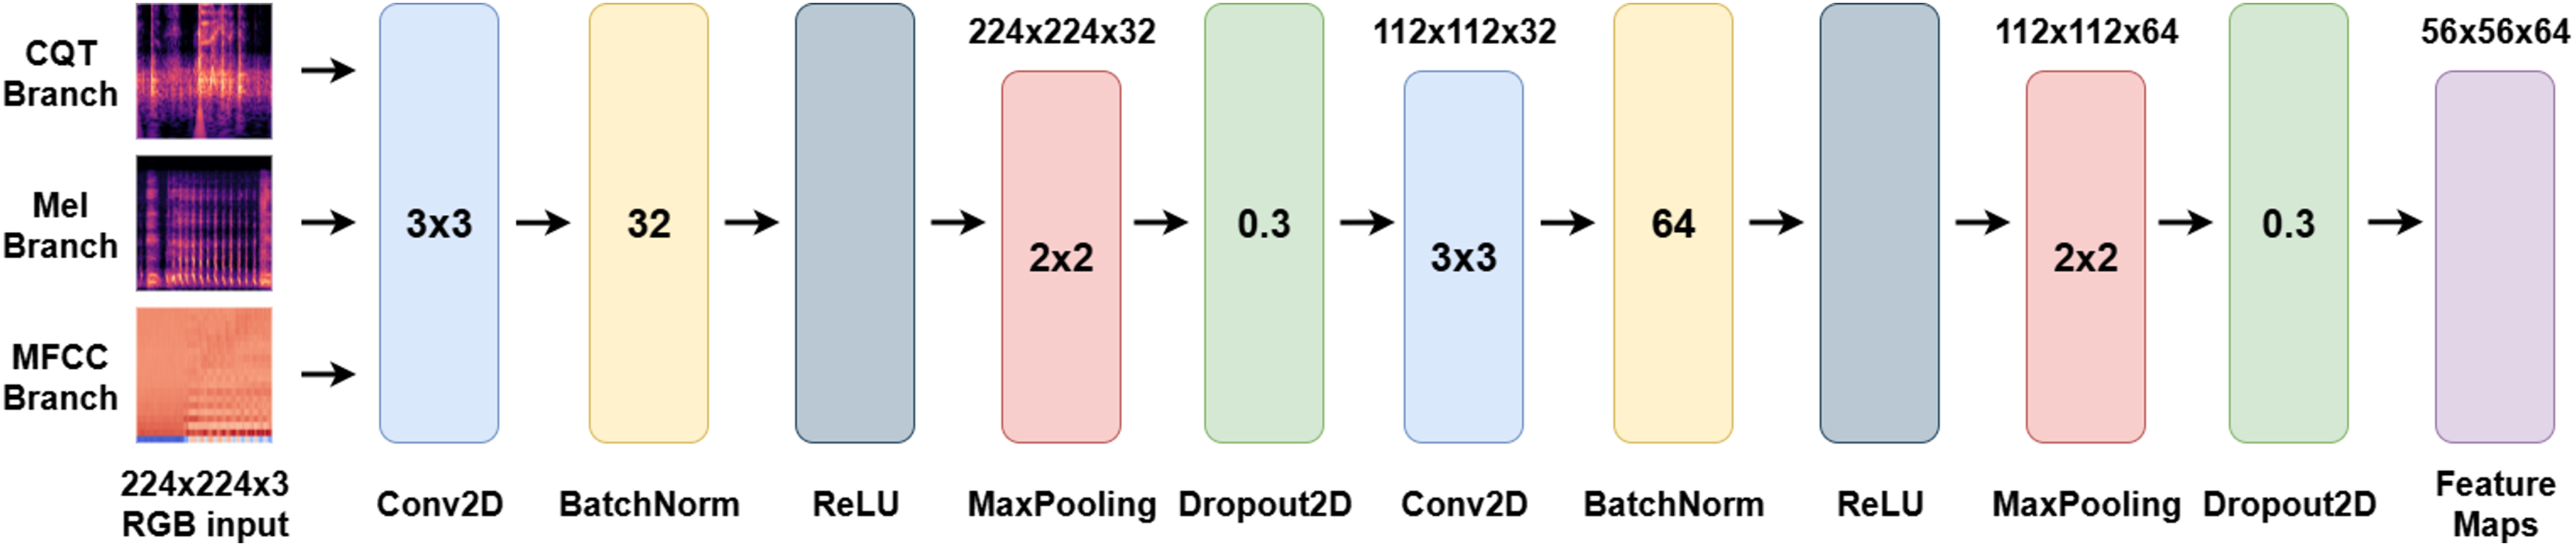
(5) where represents the pooling window (typically 2 × 2). This step reduces computational cost while enabling hierarchical abstraction. The proposed CNN block comprises two convolutional layers. The first uses 32 filters with a 3 × 3 kernel, followed by ReLU activation and 2 × 2 max pooling. The second layer increases the number of filters to 64, again followed by ReLU and pooling. Batch normalization is applied after each convolution, and dropout (rate = 0.3) is used to improve generalization. Overall, the CNN block plays a critical role in transforming raw spectrogram inputs into rich local feature maps, which are then processed by the BiLSTM and ViT blocks for temporal and global pattern modeling. The structure of the CNN block is visually summarized in Fig. 3.
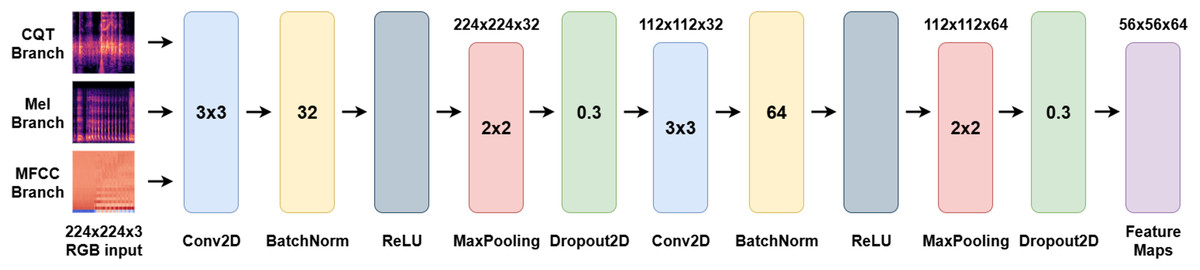
Figure 3: Schematic representation of the CNN block used for local feature extraction from input spectrograms.
BiLSTM block
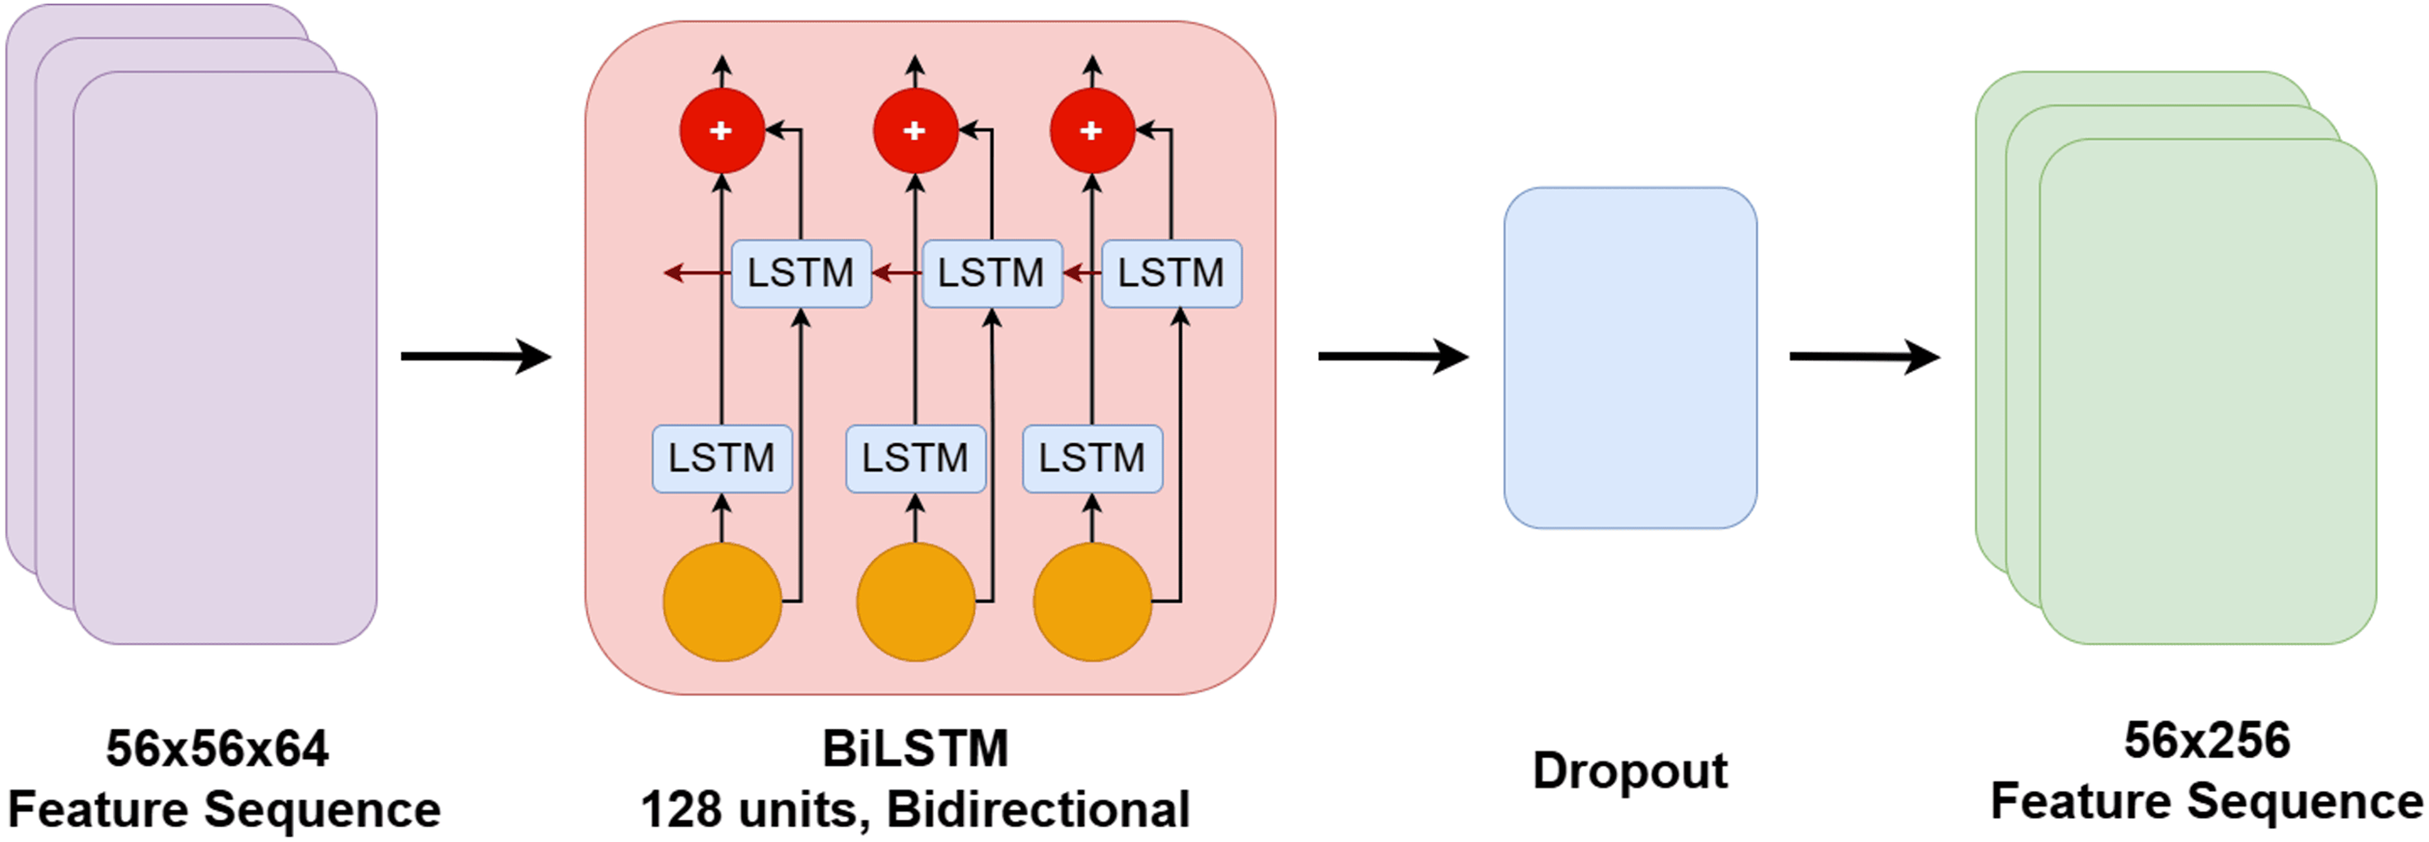
The bidirectional long short-term memory (BiLSTM) block within each spectral branch is designed to model the temporal dynamics inherent in the spectrograms extracted from nocturnal non-speech sound recordings. Acoustic events such as snoring cycles or breathing patterns often exhibit sequential dependencies, making it essential to capture correlations across time. The BiLSTM processes the local feature sequences extracted by the CNN block in both forward and backward temporal directions. This dual-directional processing enhances the model’s ability to learn long-range dependencies and improves the representation of temporally structured patterns.
Unlike standard LSTM networks that process input only in the forward direction, BiLSTM networks simultaneously access both past and future context at each time step, enabling more comprehensive temporal modeling (Graves, Mohamed & Hinton, 2013). In the proposed architecture, the CNN-derived feature maps are passed to a BiLSTM layer with 128 hidden units in each direction. The resulting context-enriched features are then forwarded to the attention mechanism. To reduce overfitting, a dropout layer with a rate of 0.5 is applied following the BiLSTM output.
The internal operations of the LSTM cell are governed by a series of gates that control the flow of information over time. These operations are defined as follows (Hochreiter & Schmidhuber, 1997):
(6)
(7)
(8)
(9)
(10)
(11)
Here, denotes the sigmoid activation, is the hyperbolic tangent function, and represents element-wise multiplication (hadamard product). The cell state carries long-term memory, while the hidden state encapsulates the output at each time step. In the BiLSTM configuration, each time step is processed in both directions. The forward pass generates hidden states , and the backward pass generates . These are concatenated to form the final output:
(12)
This bidirectional modeling enriches each time step representation with full contextual information from both the past and the future. The primary contribution of the BiLSTM block lies in its ability to learn recurring temporal patterns and transitional dynamics across time, which are critical for characterizing sleep-related events. While the CNN block captures localized spectral features, the BiLSTM contextualizes these features across the time axis. The resulting temporal representations are subsequently passed to the ViT block for global attention-based modeling. The architectural integration of the BiLSTM block is illustrated in Fig. 4.
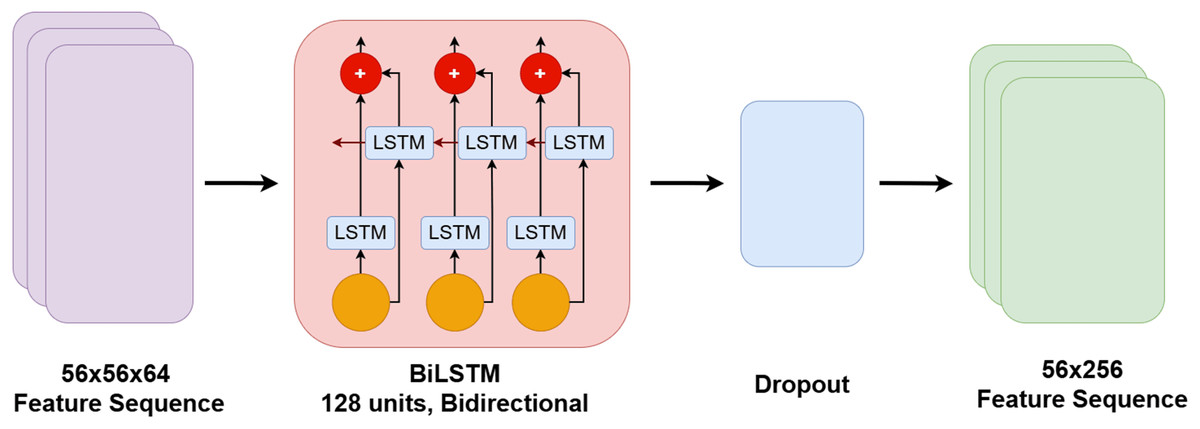
Figure 4: Architectural flow diagram of the BiLSTM block and its integration within the model pipeline.
Vision transformers + attention block
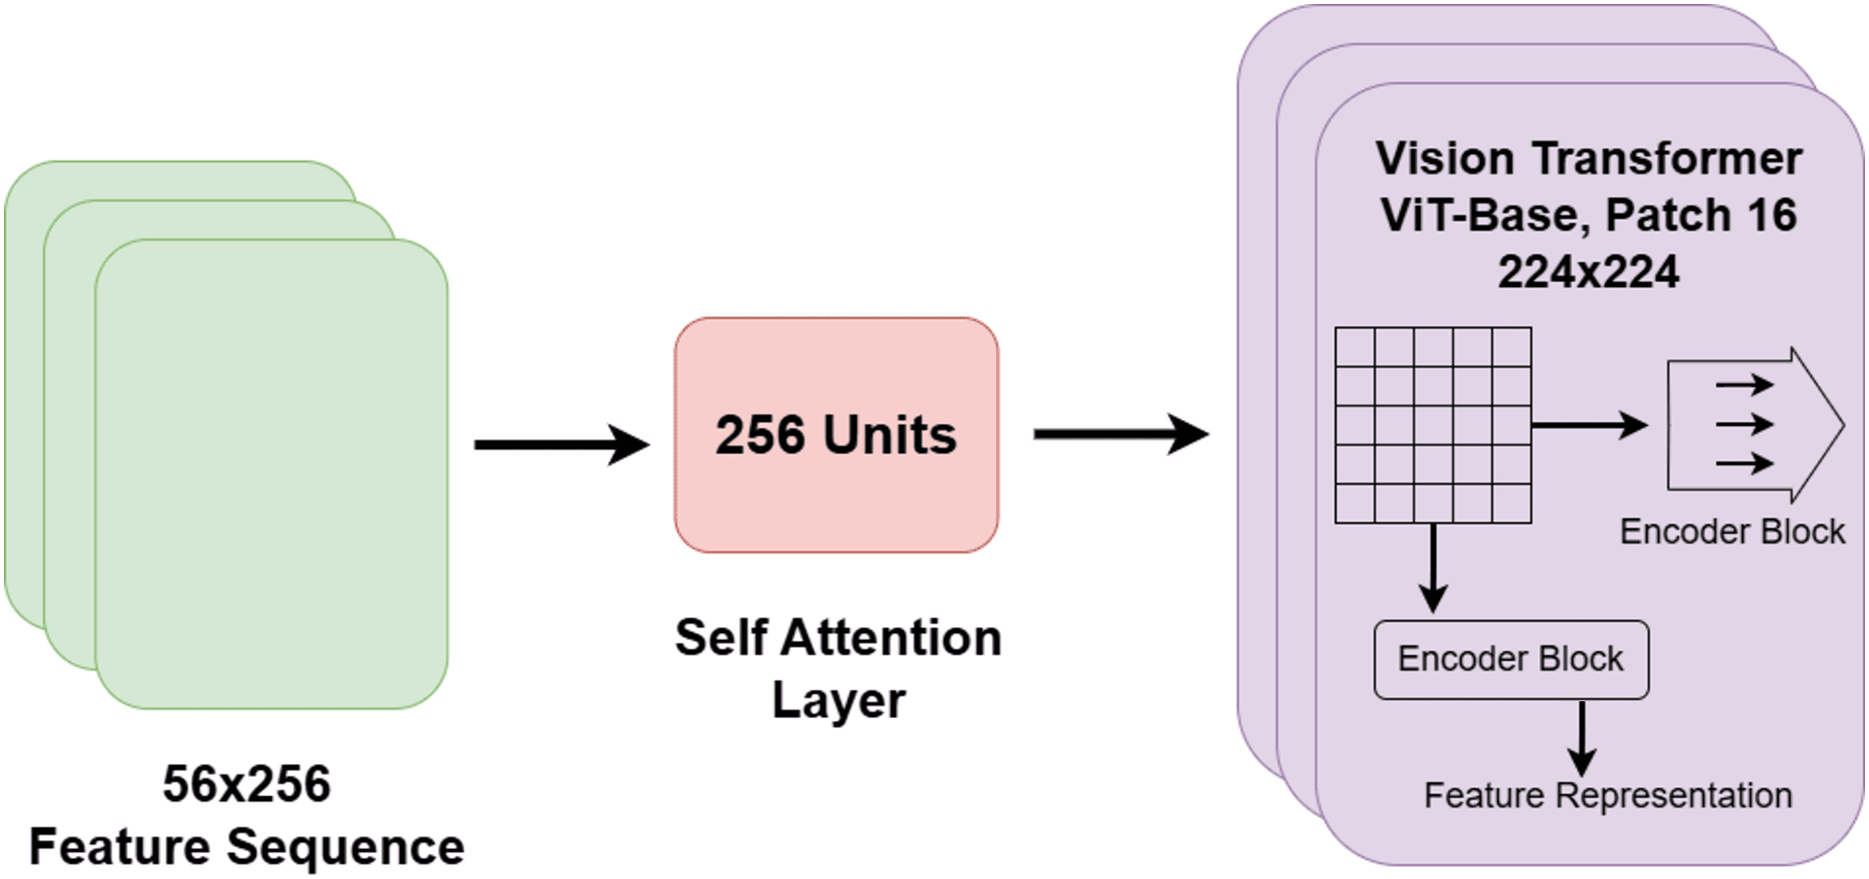
In the proposed system, the vision transformer (ViT) block within each spectral branch is employed to capture global contextual relationships across the spectrogram representations of nocturnal non-speech sounds. While conventional architectures such as CNNs and BiLSTMs are effective in modeling local patterns and sequential dependencies, they are inherently limited in capturing long-range interactions across the full input space. ViTs overcome this limitation by dividing the input spectrogram into fixed-size patches and leveraging a self-attention mechanism to learn dependencies between all pairs of patches. This allows the model to extract comprehensive global features that span spatially distant regions.
Within the proposed architecture, the ViT block is positioned after the CNN and BiLSTM components, receiving their extracted features as input. These features are first flattened into one-dimensional sequences to conform to the expected transformer input format. The ViT encoder consists of multiple layers of multi-head self-attention and position-wise feed-forward networks, enabling the model to capture fine-grained relationships between spectrotemporal regions and to generate semantically rich global representations. As such, the ViT block complements the local spatial modeling of the CNN and the temporal sequence modeling of the BiLSTM by incorporating a global attention perspective.
The core operation within the ViT block is self-attention, which computes the importance of each input element relative to others. Given the query , key , and value matrices, the scaled dot-product attention is defined as follows (Vaswani et al., 2017):
(13)
Here, denotes the dimensionality of the key vectors. As shown in Eq. (13), this formulation allows the model to assign adaptive attention weights to all token pairs, regardless of their spatial proximity, effectively modeling global dependencies across the spectrogram. Among the major advantages of the ViT block are its abilities to:
model long-range dependencies beyond local receptive fields,
capture high-level contextual interactions in the spectral–temporal domain,
and generate semantically informative embeddings suitable for final classification.
Additionally, attention matrices in ViT provide a degree of interpretability, offering insights into which spectrogram regions influence the model’s decisions. rad-CAM and other attention-based methods can reveal which parts of the input influenced the model’s decision, contributing to greater interpretability, which is vital for clinical applications (Poonia & Al-Alshaikh, 2024).
Despite these strengths, ViT models often require large-scale training data and incur high computational costs, which may limit their applicability in low-resource scenarios (Dosovitskiy et al., 2020; Li et al., 2023). To address these challenges, the proposed system adopts a hybrid architecture that integrates ViT with CNN and BiLSTM blocks. This combination allows the model to balance local feature extraction, temporal sequence learning, and global contextual attention in a unified manner. Furthermore, a softmax-based ensemble strategy is employed across branches to consolidate the predictive strengths of each path, thereby harnessing the benefits of ViT while mitigating its practical limitations. The architectural layout of the ViT block and its integration with the attention mechanism is depicted in Fig. 5.
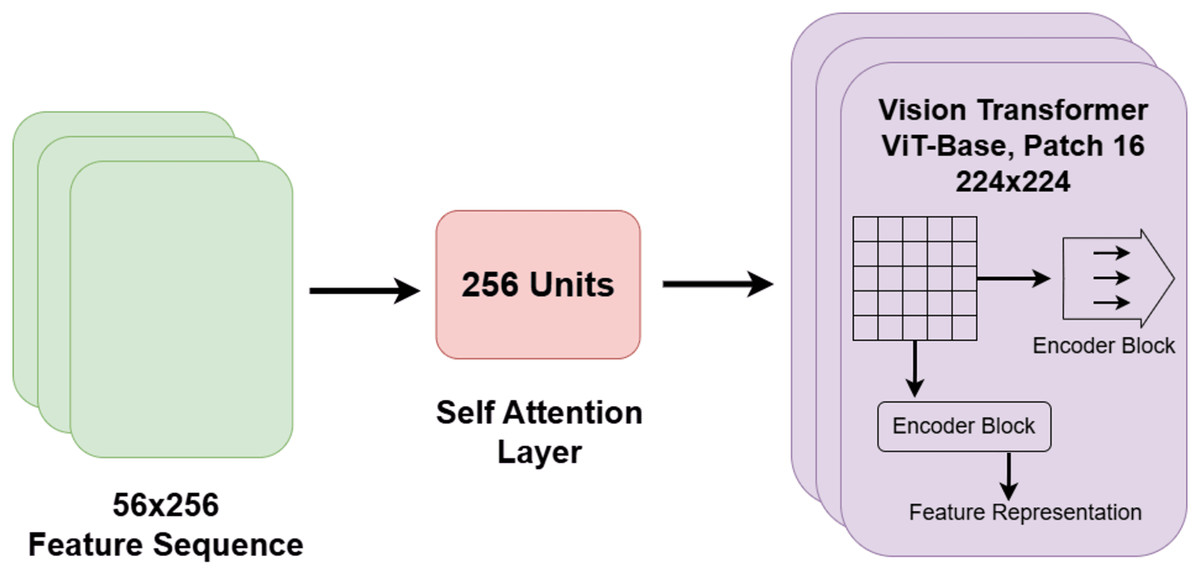
Figure 5: Architectural diagram of the vision transformer and attention mechanism within the hybrid model.
Stacking ensemble block
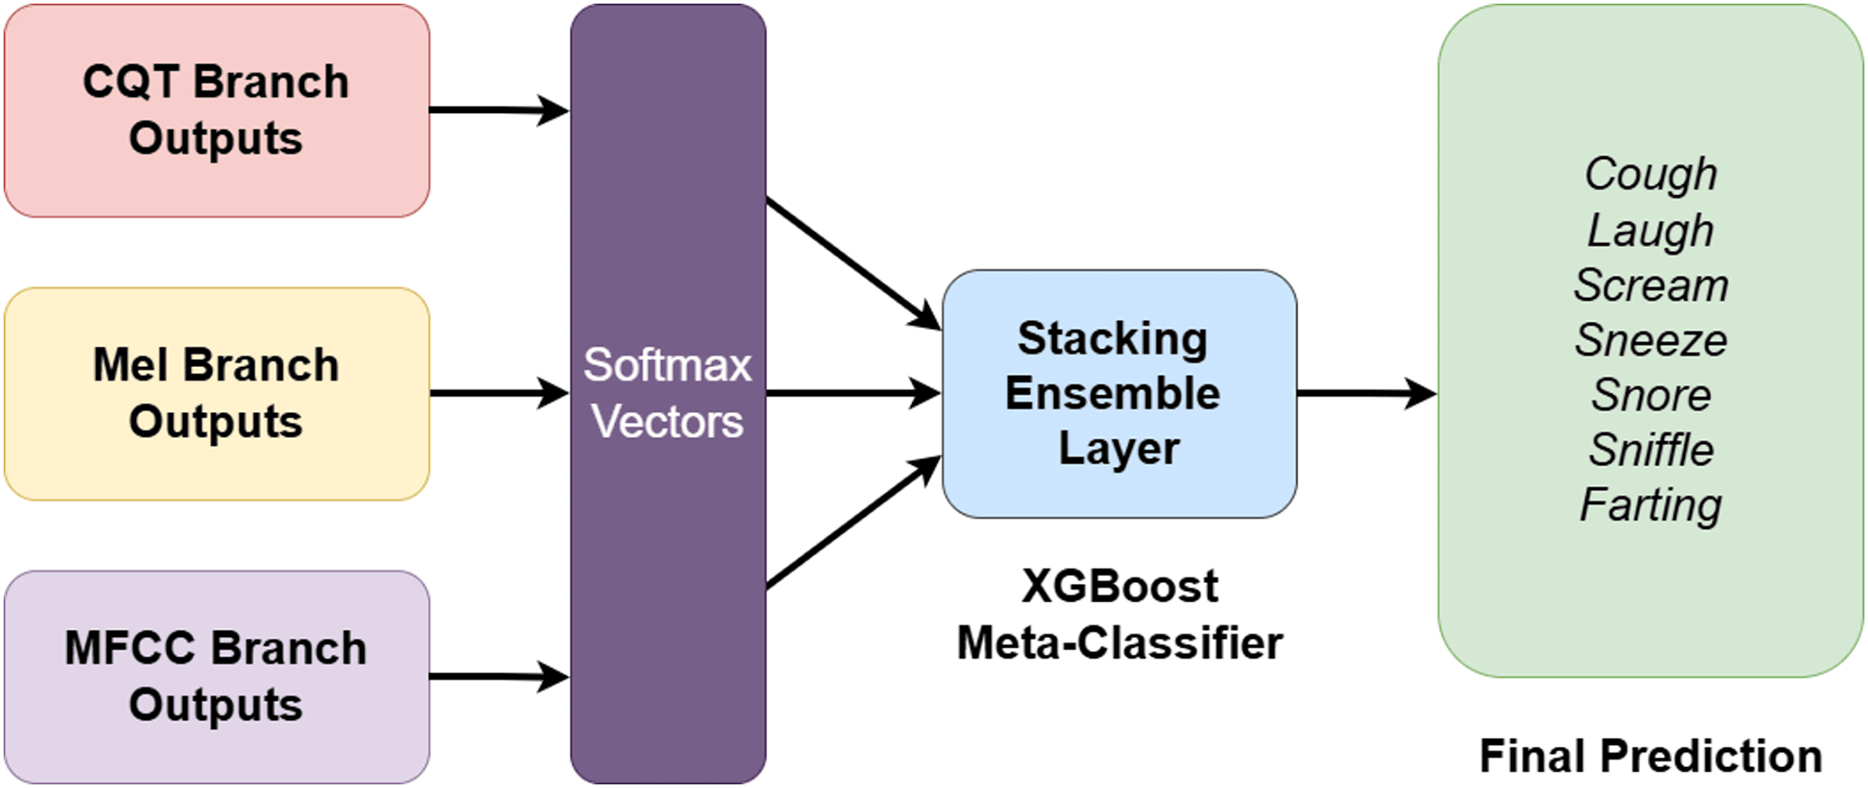
One of the most powerful components of the proposed architecture is its two-stage stacking ensemble strategy, which integrates the outputs from three independent spectral branches. In the first stage, after completing feature extraction through CNN, BiLSTM, ViT, and attention blocks, each branch independently generates a softmax-based classification output. These outputs represent class probability distributions across the seven nocturnal non-speech sound categories, forming a 7-dimensional probability vector for each branch. Given the final logits vector from branch , where , the softmax probability distribution is computed as:
(14)
As defined in Eq. (14), this operation ensures that each output vector forms a valid probability distribution. The softmax function is widely adopted in neural network-based multi-class classification tasks due to its ability to produce normalized outputs interpretable as class probabilities (Bishop & Nasrabadi, 2006).
By concatenating the softmax outputs from all three branches a unified 21-dimensional meta-feature vector is constructed for each instance. In the second stage, this meta-feature vector is passed into an XGBoost classifier, which acts as a meta-learner. Unlike conventional fusion approaches such as softmax averaging, the stacking strategy enables XGBoost to learn complex interdependencies and feature interactions across spectral domains, resulting in a more informed final classification decision.
Theoretically, stacking ensemble learning is a supervised meta-learning paradigm wherein a level-1 generalizer is trained to combine the outputs of multiple level-0 base learners optimally (Wolpert, 1992). In the proposed system, the softmax vectors from the three spectral branches ( ) are concatenated to form the composite meta-feature vector , which is then mapped to a predicted label using the XGBoost meta-learner, as described in Eq. (15):
(15)
This hierarchical integration enables the capture of nonlinear relationships across spectral domains that are difficult to learn in isolation. Through this two-stage ensemble mechanism, the system effectively consolidates the complementary strengths of each spectral representation—MFCC’s sensitivity to low-frequency modulations, Mel-spectrogram’s broader frequency coverage, and CQT’s logarithmic frequency resolution. Simultaneously, XGBoost provides a flexible and powerful decision layer capable of leveraging complex inter-feature patterns. The overall design of the stacking ensemble strategy is illustrated in Fig. 6.
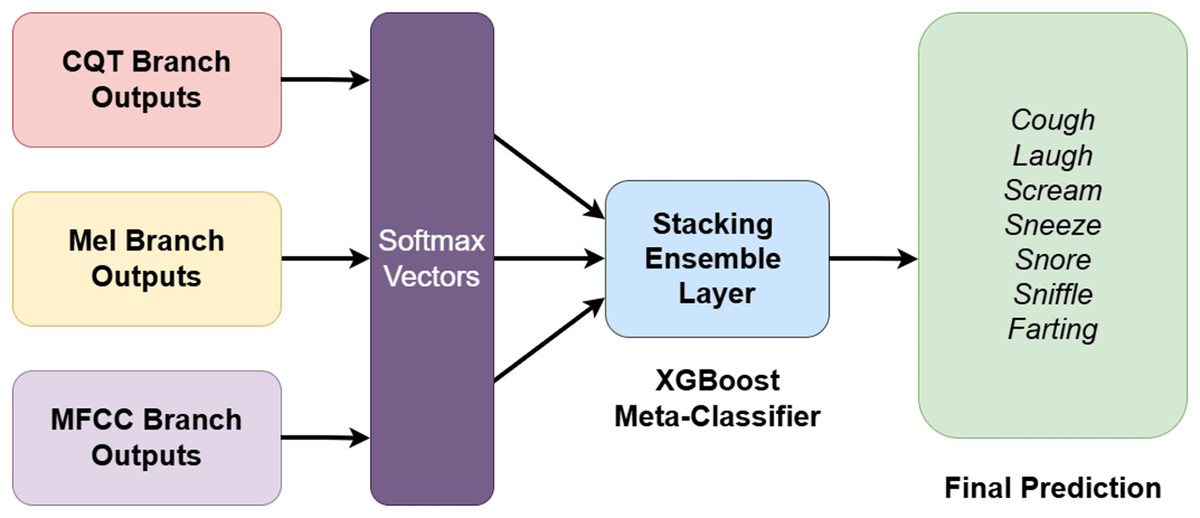
Figure 6: Overall architecture of the two-stage stacking ensemble strategy integrating spectral branches and XGBoost-based meta-classifier.
Overall architecture
The proposed system is structured around a hybrid multi-branch deep learning architecture designed to comprehensively classify nocturnal non-speech sound signals. It consists of three parallel branches, each tailored to process a distinct spectral representation. These branches operate concurrently and independently on the same input spectrogram, enabling the architecture to leverage spectral diversity for robust and complementary feature extraction. Each spectral branch follows a consistent processing pipeline composed of three core modules:
-
1.
A CNN for localized time–frequency pattern extraction,
-
2.
A BiLSTM for temporal sequence modeling,
-
3.
ViT equipped with an attention mechanism for capturing global contextual dependencies.
This configuration facilitates hierarchical feature learning across spatial, temporal, and contextual dimensions, allowing the model to generate a rich multi-perspective representation of the input signal. After processing, each branch produces a 7-dimensional softmax probability vector, reflecting the class-wise confidence levels across the seven nocturnal non-speech sound categories.
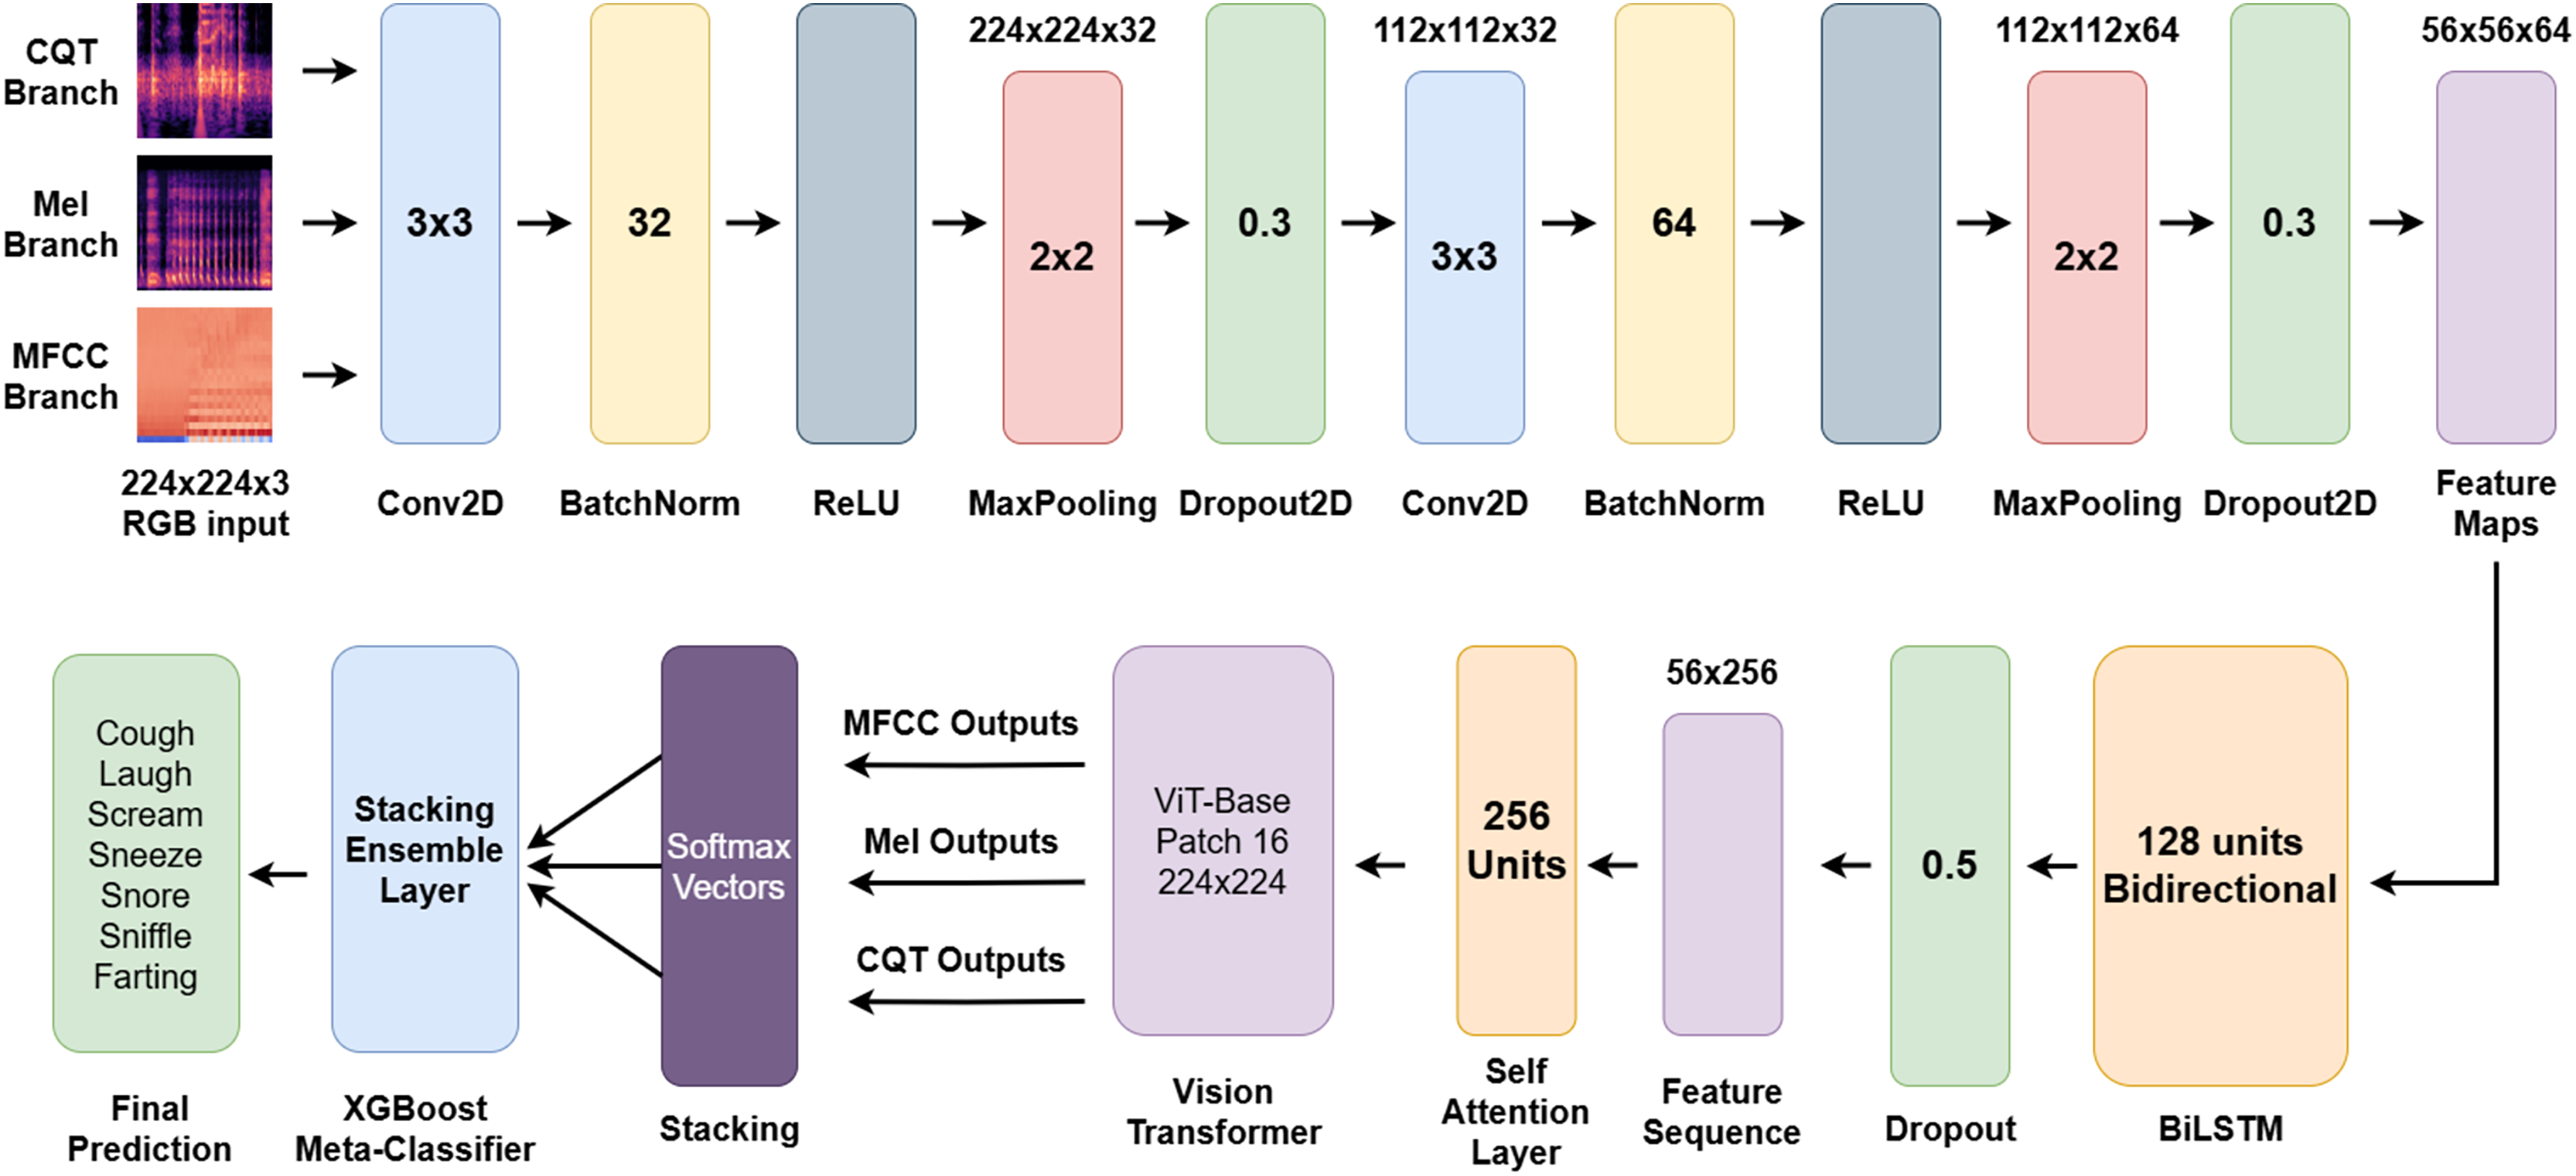
The outputs from all three branches are concatenated to construct a 21-dimensional meta-feature vector, which is then passed into an XGBoost-based stacking ensemble classifier. This ensemble layer acts as a powerful decision-making module, learning intricate interdependencies among spectral branches and yielding the final classification label. The complete pipeline of the proposed model is illustrated in Fig. 7.
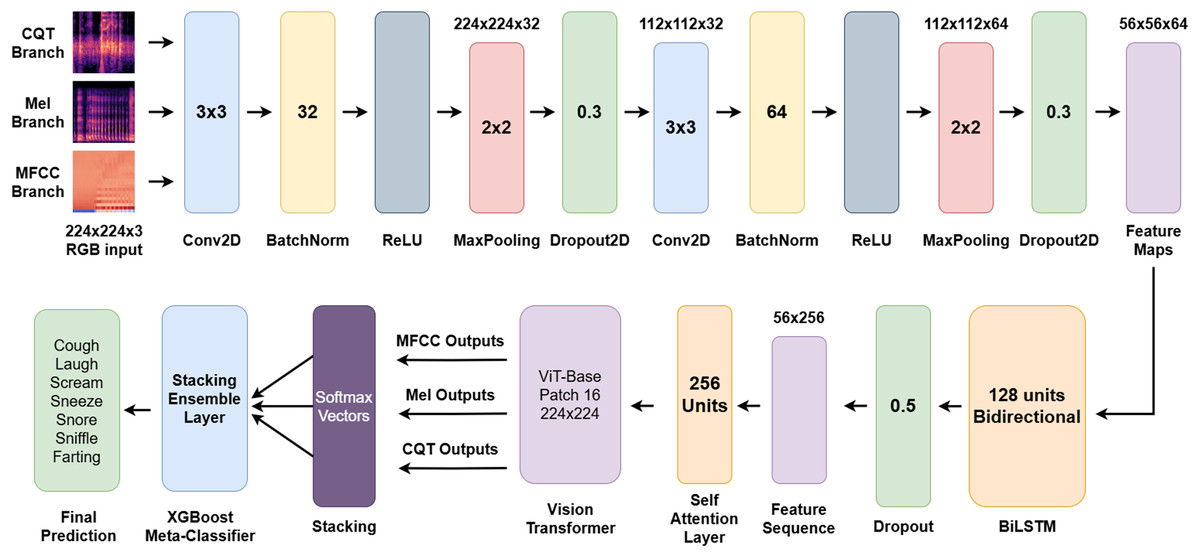
Figure 7: End-to-end architecture of the proposed multi-branch hybrid model for sleep sound classification.
The overarching objective of the architecture is to perform a comprehensive and multi-level analysis of nocturnal non-speech acoustic signals through three complementary spectral views. The integration of CNN, BiLSTM, and ViT modules enables the model to jointly learn local structures, temporal dynamics, and global semantic relationships. This enables the extraction of both fine-grained and holistic acoustic patterns, resulting in a deep and nuanced understanding of sleep sound characteristics. Furthermore, the softmax outputs from individual branches are integrated using an ensemble learning strategy, ensuring more robust, balanced, and accurate classification outcomes. By unifying feature learning across spectral, sequential, and global domains, the proposed architecture represents a significant methodological advancement over existing models in the literature.
Assessment metrics
To assess the classification performance of the proposed model, a range of standard evaluation metrics commonly used in multi-class classification tasks were computed. These included accuracy, recall, precision, F1-score, and the confusion matrix. These metrics were chosen due to their ability to capture different aspects of classification performance: accuracy measures overall correctness, precision evaluates false positive control, recall reflects true positive sensitivity, and F1-score balances both precision and recall. Given the potential for class imbalance within the dataset, both class-wise and aggregate scores were reported using macro-averaged and weighted-averaged formulations. Although the dataset is balanced (100 samples per class), macro- and weighted-averaging were used to ensure robustness and comparability with other studies. The mathematical definitions of the evaluation metrics are presented in Eqs. (16)–(20) (Sağbaş, 2024).
Accuracy is defined as the proportion of correctly predicted instances to the total number of instances. It provides a general indication of the model’s overall classification performance, as shown in Eq. (16).
(16)
Precision is defined as the proportion of instances predicted to belong to a specific class that are actually members of that class. It reflects the model’s ability to avoid false positives in class assignment, as given in Eq. (17).
(17)
Recall is defined as the proportion of instances that actually belong to a specific class and are correctly identified as such by the model. It measures the model’s effectiveness in detecting true positives for each class, as defined in Eq. (18).
(18)
F1-score is defined as the harmonic mean of precision and recall. It provides a balanced measure of a model’s accuracy by considering both false positives and false negatives, making it especially useful in scenarios with class imbalance. The formulation is presented in Eq. (19).
(19)
Matthews correlation coefficient (MCC) is a balanced binary classification metric that incorporates all confusion matrix components (TP, TN, FP, FN) into a single value. It ranges from –1 (total disagreement) to +1 (perfect agreement), with 0 indicating random prediction. Compared to accuracy or F1-score, MCC provides a more reliable measure when error types are asymmetric or when class distributions are uneven. The computation formula is given in Eq. (20) (Chicco & Jurman, 2020).
(20)
Here, true positive (TP), false positive (FP), false negative (FN), and true negative (TN) are defined based on the comparison between the model’s predictions and the ground truth labels.
These metrics were computed separately for each fold under the 10-fold cross-validation protocol and subsequently reported as mean values accompanied by standard deviations. This evaluation protocol was selected to ensure consistent, reproducible, and fair measurement of performance across all model configurations and class labels.
Model training and evaluation protocol
The training and evaluation of the proposed three-branch hybrid model were carried out within a rigorously designed experimental framework. All experiments were implemented using Python 3.10 and the PyTorch 2.1 deep learning library, and executed on a workstation equipped with an NVIDIA GeForce RTX 4060 GPU. Multiple regularization mechanisms, including dropout, batch normalization, and early stopping, were incorporated to prevent overfitting. In addition, a stratified 10-fold cross-validation setup and SpecAugment-based augmentation were applied to ensure statistical robustness and generalizable evaluation.
Model training was performed using the Adam optimizer with a learning rate of 0.0001. A mini-batch size of 16 was used, and training was conducted for up to 30 epochs. An early stopping mechanism was incorporated to prevent overfitting, whereby training was terminated if no improvement in validation performance was observed for 10 consecutive epochs. The categorical cross-entropy loss function was adopted, in accordance with the multi-class classification nature of the task. The CNN and BiLSTM components employed lightweight architectures, complemented by regularization layers such as batch normalization and dropout to enhance generalization capacity.
To ensure a statistically rigorous evaluation, a stratified 10-fold cross-validation protocol was applied. The dataset was partitioned into ten equal-sized folds while maintaining class distribution within each fold. During each iteration, one-fold was used for testing while the remaining nine were used for training, ensuring that each sample was evaluated exactly once. Performance metrics were computed separately for each fold, and the final results were reported as mean ± standard deviation across all folds. This setup provides a robust estimate of the model’s generalization performance, accounting for variability in data partitioning and reducing the risk of evaluation bias.
The entire evaluation process was designed not only to assess overall classification accuracy but also to capture class-wise discriminative capability. For this purpose, a comprehensive set of assessment metrics (accuracy, precision, recall, F1-score, and area under the ROC curve) was employed. These metrics were selected for their ability to characterize different aspects of classification performance.
In addition to internal validation, a comparative evaluation was designed against state-of-the-art nocturnal non-speech sound classification approaches reported in the literature. Specifically, the proposed approach was benchmarked against the method introduced by Akbal & Tuncer (2021), which utilized handcrafted feature extraction and classical machine learning classifiers. Identical dataset partitions and metrics were used where applicable to ensure a fair and meaningful comparison. A detailed comparison with existing sleep sound classification approaches is provided in the Discussion section.
Experiments
To empirically assess the effectiveness of the proposed hybrid framework, a series of controlled experiments were conducted using different baseline architectures, spectral input representations and ensemble strategies. This section presents the results of these experiments in three parts: (i) baseline evaluation of individual CNN, BiLSTM, and ViT models, (ii) evaluation of individual spectral branches and (iii) final classification performance via ensemble integration.
Baseline evaluation of individual CNN, BiLSTM, and ViT architectures
To rigorously evaluate the effectiveness of the proposed hybrid ConvBiLSTM–ViT framework, a series of baseline experiments were conducted. These experiments were designed to isolate and assess the contribution of each architectural component (CNN, BiLSTM, and ViT) when applied individually to the same dataset and under identical experimental conditions. In other words, each baseline corresponds to a single-branch variant of the hybrid model, following exactly the same preprocessing, augmentation, and training parameters employed in the full architecture.
The goal of this analysis is twofold: (1) to establish fair and controlled reference points for each modeling paradigm (convolutional, recurrent, and transformer-based), and (2) to quantify how much improvement is achieved when these complementary learning mechanisms are integrated within the proposed hybrid structure.
All baseline models were trained using the same SpecAugment-based data augmentation, Adam optimizer, cosine learning rate scheduling, dropout configuration, and 10-fold cross-validation setup as implemented in the hybrid framework. This ensures that observed performance differences reflect the representational capacity of the architectures themselves, rather than discrepancies in training configuration. The resulting classification accuracies obtained from these baseline experiments are summarized in Table 2.
| Branch/Method | Only CNN | Only BiLSTM | Only ViT |
|---|---|---|---|
| Mel | 97.86% | 78.00% | 98.43% |
| MFCC | 94.86% | 71.86% | 96.00% |
| CQT | 94.71% | 66.29% | 96.57% |
The results summarized in Table 2 highlight the performance gap between the individual baseline architectures. Among the three, the ViT consistently achieved the highest accuracy across all spectral representations, reaching 98.43% on Mel-spectrogram inputs. The CNN model also performed strongly, particularly with Mel features (97.86%), but its reliance on local feature extraction limited its ability to capture long-range temporal dependencies. In contrast, the BiLSTM model produced substantially lower accuracies (ranging from 66.29% to 78.00%), indicating its relative weakness in modeling spectral–spatial structures without convolutional or attention mechanisms.
These baseline results highlight the necessity of integrating complementary architectures rather than relying on a single network type. While CNN and BiLSTM models independently achieved moderate accuracy due to their limited ability to capture both local and global dependencies, the inclusion of the ViT component and the subsequent hybrid integration markedly improved performance. This outcome empirically supports the rationale for adopting the CNN, BiLSTM, and ViT configuration, as it leverages convolutional, sequential, and attention-based mechanisms to jointly model short-term temporal cues and long-range contextual dependencies, resulting in more stable and generalizable representations.
Evaluation of single-branch hybrid models based on MFCC, Mel, and CQT inputs
In this section, three distinct input representations (MFCC, Mel-spectrogram, and CQT-spectrogram) each characterized by unique spectral properties, were independently trained and evaluated using the proposed ConvBiLSTM-ViT + attention architecture. For each representation, the model was trained separately under identical hyperparameter settings and training strategies, ensuring that performance differences could be attributed solely to the input modality. To provide a deeper understanding of the model’s training behavior across different spectral inputs, the average training and validation accuracy and loss curves over the 10-fold cross-validation are presented in Fig. 8.
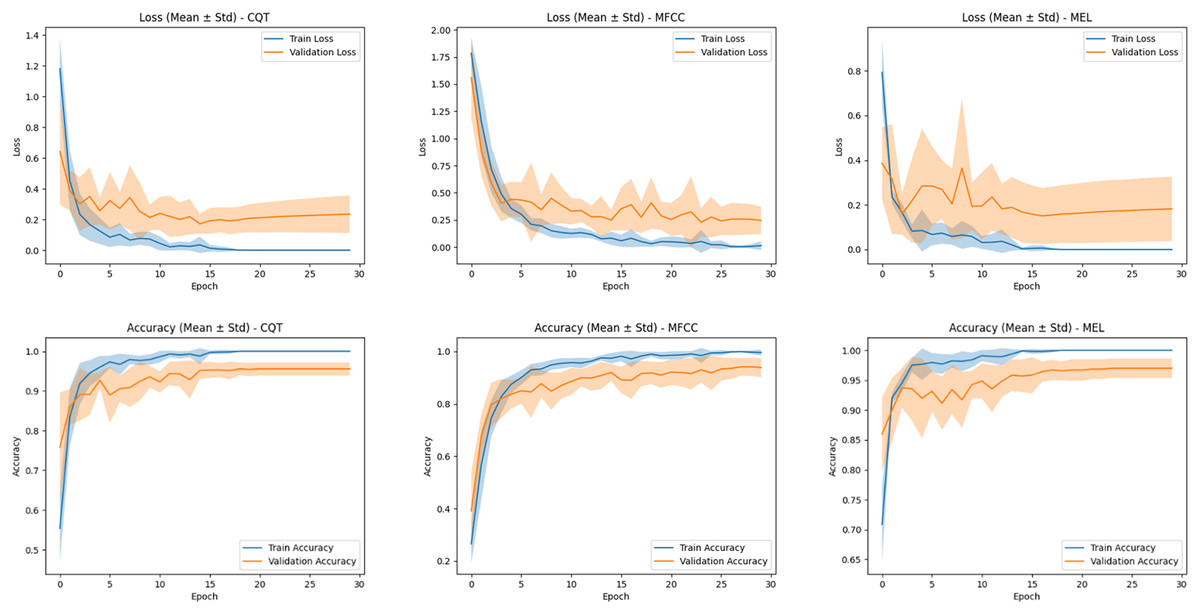
Figure 8: Average training and validation accuracy/loss curves over 10-fold cross-validation for the MFCC, Mel-spectrogram, and CQT representations.
Shaded regions indicate standard deviation across folds.
For the MFCC-based model, the accuracy curves show a steady improvement over epochs, with the validation curve closely following the training curve, indicating relatively stable learning. However, the validation loss curve exhibits slightly higher variance and a visible gap between training and validation loss in later epochs, suggesting a moderate overfitting trend. Despite this, the MFCC model achieves consistent performance due to its robust spectral encoding capabilities.
The CQT-based model displays similar training behavior, but with a slightly wider gap between training and validation curves. The loss curves further reveal that while training loss decreases rapidly and stabilizes, the validation loss plateaus early and slightly increases in later epochs. This may reflect greater spectral ambiguity in the CQT domain, particularly for acoustically overlapping classes.
In contrast, the Mel-spectrogram-based model demonstrates the most favorable training behavior. Both accuracy and loss curves indicate not only rapid convergence but also a minimal gap between training and validation metrics. The narrow standard deviation bands across folds confirm that the Mel representation yields stable and repeatable results across different training splits. These trends corroborate the superior classification outcomes reported earlier, and reinforce the Mel-spectrogram’s advantage in capturing discriminative features with high generalization ability.
Building upon these training dynamics, the classification performance of each branch was subsequently evaluated using a stratified 10-fold cross-validation scheme. Standard evaluation metrics (including accuracy, precision, recall, and F1-score) were computed to provide a comprehensive performance analysis. To further examine the model’s discriminative capability across different classes, confusion matrices were generated for each input type. These visual tools facilitated the identification of classes that were consistently well classified as well as those more susceptible to misclassification. A consolidated summary of the classification outcomes across all three input types is presented in Table 3.
| Branch | CQT spectrogram | MFCC spectrogram | Mel-spectrogram | |||||||||
|---|---|---|---|---|---|---|---|---|---|---|---|---|
| Precision | Recall | F1-score | MCC | Precision | Recall | F1-score | MCC | Precision | Recall | F1-score | MCC | |
| Cough | 0.9143 | 0.9600 | 0.9366 | 0.9261 | 0.9394 | 0.9300 | 0.9347 | 0.9239 | 0.9898 | 0.9700 | 0.9798 | 0.9765 |
| Laugh | 0.9677 | 0.9000 | 0.9326 | 0.9227 | 0.9126 | 0.9400 | 0.9261 | 0.9137 | 0.9901 | 1.0000 | 0.9950 | 0.9942 |
| Scream | 0.9703 | 0.9800 | 0.9751 | 0.9710 | 0.9796 | 0.9600 | 0.9697 | 0.9648 | 1.0000 | 0.9900 | 0.9950 | 0.9942 |
| Sneeze | 0.9394 | 0.9300 | 0.9347 | 0.9239 | 0.9495 | 0.9400 | 0.9447 | 0.9356 | 0.9706 | 0.9900 | 0.9802 | 0.9769 |
| Snore | 0.9804 | 1.0000 | 0.9901 | 0.9885 | 0.9804 | 1.0000 | 0.9901 | 0.9885 | 1.0000 | 1.0000 | 1.0000 | 1.0000 |
| Sniffle | 1.0000 | 1.0000 | 1.0000 | 1.0000 | 1.0000 | 1.0000 | 1.0000 | 1.0000 | 1.0000 | 1.0000 | 1.0000 | 1.0000 |
| Farting | 1.0000 | 1.0000 | 1.0000 | 1.0000 | 1.0000 | 0.9900 | 0.9950 | 0.9942 | 1.0000 | 1.0000 | 1.0000 | 1.0000 |
| Average | 0.9674 | 0.9671 | 0.9670 | 0.9617 | 0.9659 | 0.9657 | 0.9658 | 0.9601 | 0.9929 | 0.9929 | 0.9929 | 0.9917 |
| Accuracy | 96.71% | 96.57% | 99.29% | |||||||||
The experimental findings presented in Table 3 demonstrate that all three spectral representations achieved high classification performance when processed through the proposed hybrid architecture. However, a comparative analysis reveals that the Mel-spectrogram consistently yielded superior results across all evaluation metrics. Specifically, the Mel-based model achieved the highest precision, recall, F1-score, and overall accuracy, both at the class-wise level and in terms of macro-averaged scores. Notably, for acoustically complex classes such as cough, laugh, scream, and sneeze, the Mel-spectrogram enabled more accurate class discrimination, leading to elevated F1-scores compared to the MFCC and CQT counterparts.
In contrast, acoustically distinct classes such as snore, sniffle, and farting were classified with near-perfect accuracy across all three representations, likely due to their highly salient and distinguishable spectral signatures. In terms of macro-averaged F1-scores, the CQT-based model achieved 0.9670, the MFCC-based model 0.9658, and the Mel-spectrogram-based model reached a peak value of 0.9929. A similar trend was observed in overall accuracy, with the Mel-based model attaining the highest score of 99.29%. This trend is further reinforced by the MCC, which provides a more stringent and correlation-based measure of binary discrimination. The Mel-spectrogram attained the highest macro-averaged MCC (0.9917), indicating not only high correctness but also a stronger balance between positive and negative predictions in one-vs.-rest decompositions. By contrast, the MFCC (0.9601) and CQT (0.9617) representations exhibited slightly lower MCC values, suggesting comparatively greater sensitivity to asymmetric error patterns. These results suggest that the Mel scale’s finer frequency resolution facilitates the extraction of more discriminative features, thereby enhancing model performance. Nevertheless, the consistently strong results observed with both the MFCC and CQT representations further validate the robustness and generalization capability of the proposed hybrid model. To further visualize class-specific prediction behavior, confusion matrices for each spectral representation are depicted in Fig. 9.
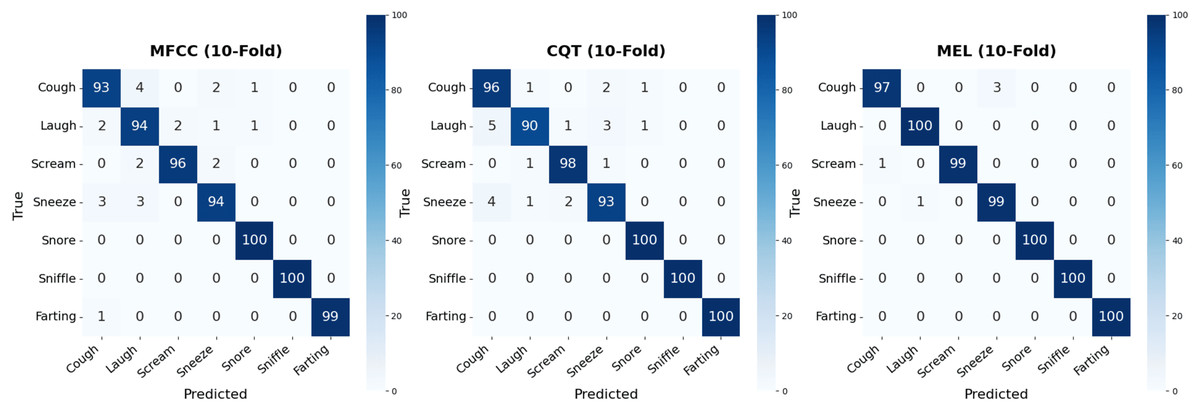
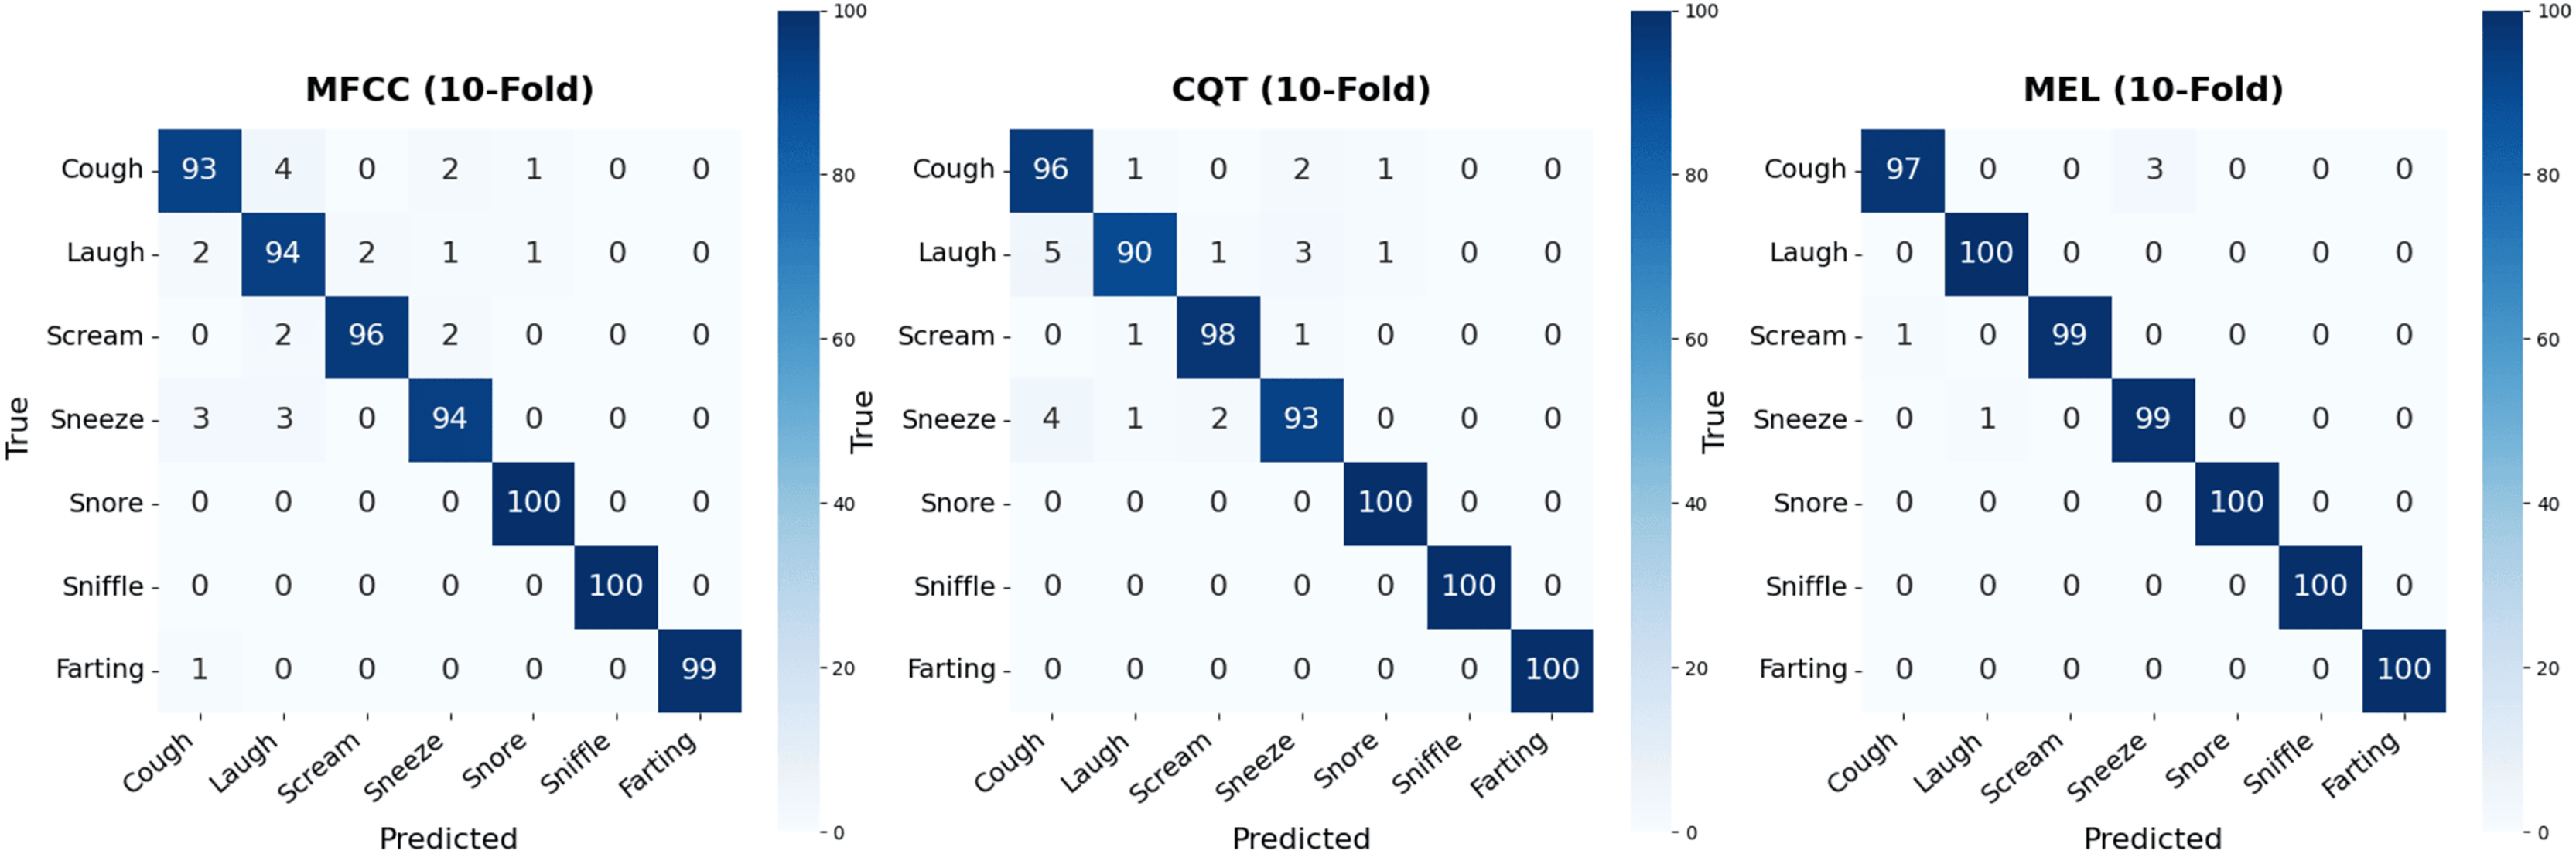
Figure 9: Confusion matrices obtained from the classification results of the three individual spectral representations.
Confusion matrices offer an effective means of visually assessing the model’s discriminative capacity across different nocturnal non-speech sound categories. Utilizing the results obtained from 10-fold cross-validation, separate confusion matrices were generated for the models trained on MFCC, CQT, and Mel-spectrogram inputs. While all three spectral representations demonstrated strong overall classification performance, a closer examination of the matrices reveals certain class-specific misclassification patterns.
For the MFCC-based model, instances belonging to the cough class were occasionally misclassified as either laugh or sneeze, leading to a class-specific accuracy of approximately 93%. Similarly, a limited number of laugh instances were erroneously identified as cough or sneeze, suggesting that overlapping acoustic characteristics among these classes may hinder precise discrimination. Conversely, classes such as snore, sniffle, and farting were recognized with near-perfect accuracy, reflecting their distinctive and highly separable spectral profiles within the MFCC feature domain.
The CQT-based model demonstrated a slightly higher degree of inter-class confusion compared to the MFCC-based counterpart. Notably, misclassifications were frequently observed among the laugh, cough, and sneeze categories. For instance, five laugh instances were erroneously predicted as cough, while three were misclassified as sneeze. These misclassification trends suggest that the sneeze class exhibits spectral overlap with other phonetically similar classes, which may account for its recurrent confusion across both CQT and MFCC representations. Despite these ambiguities, the CQT-based model achieved perfect classification accuracy for snore, sniffle, and farting, reaffirming the distinctive spectral signatures of these classes.
In contrast, the confusion matrix of the Mel-spectrogram-based model exhibited a markedly clearer structure. This model achieved perfect classification for the laugh, snore, sniffle, and farting categories. Only three cough instances were misclassified as sneeze, while the scream and sneeze categories each experienced a single misclassification. These findings indicate that the Mel-spectrogram-based model not only attains the highest overall accuracy but also minimizes inter-class confusion, thereby producing more balanced and reliable classification outcomes.
The Mel-spectrogram representation demonstrates a clear advantage not only in terms of numerical performance metrics but also in its ability to achieve finer class-wise separability. This strength is particularly evident in challenging scenarios involving acoustically similar categories such as cough and sneeze, where the Mel-based model exhibits fewer misclassifications and more consistent decision boundaries. To further substantiate these empirical findings, statistical significance tests were conducted to evaluate whether the performance differences observed across the MFCC, Mel-spectrogram, and CQT-spectrogram models were meaningful. Paired t-tests revealed that the Mel-based model significantly outperformed both the MFCC (p = 0.00003) and CQT (p = 0.00012) models, while no significant difference was found between MFCC and CQT (p = 0.86195). These results were corroborated by McNemar tests, which likewise indicated statistically significant differences between Mel and MFCC (p = 0.00002) and between Mel and CQT (p = 0.00012), but not between MFCC and CQT (p = 1.00000). Collectively, these results confirm that the superior performance of the Mel-spectrogram model is not only numerically evident but also statistically robust, highlighting its capacity to capture nuanced acoustic distinctions and supporting its effectiveness in nocturnal non-speech sound classification tasks. Additionally, this robust representational quality provides a compelling rationale for incorporating Mel features into ensemble modeling strategies. To further elucidate the predictive behavior of each spectral branch, Fig. 10 presents the softmax confidence histograms for the MFCC, CQT, and Mel models, offering insight into the distribution of confidence scores for both correct and incorrect predictions.
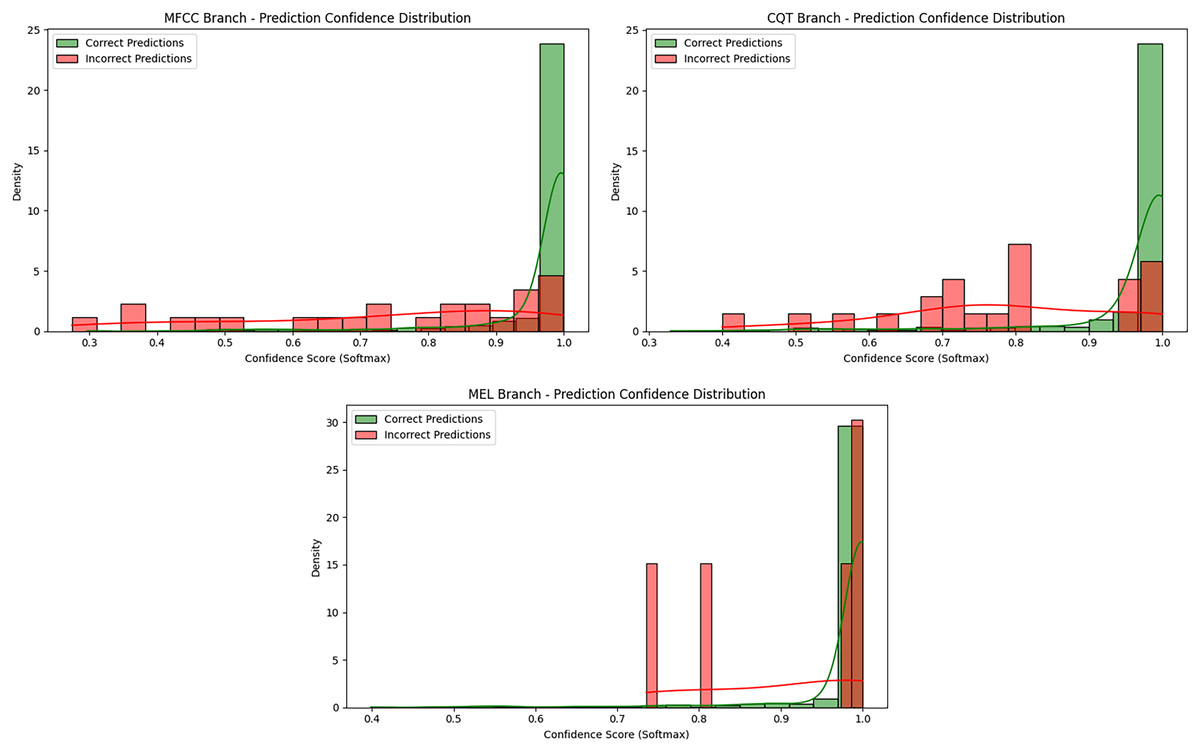
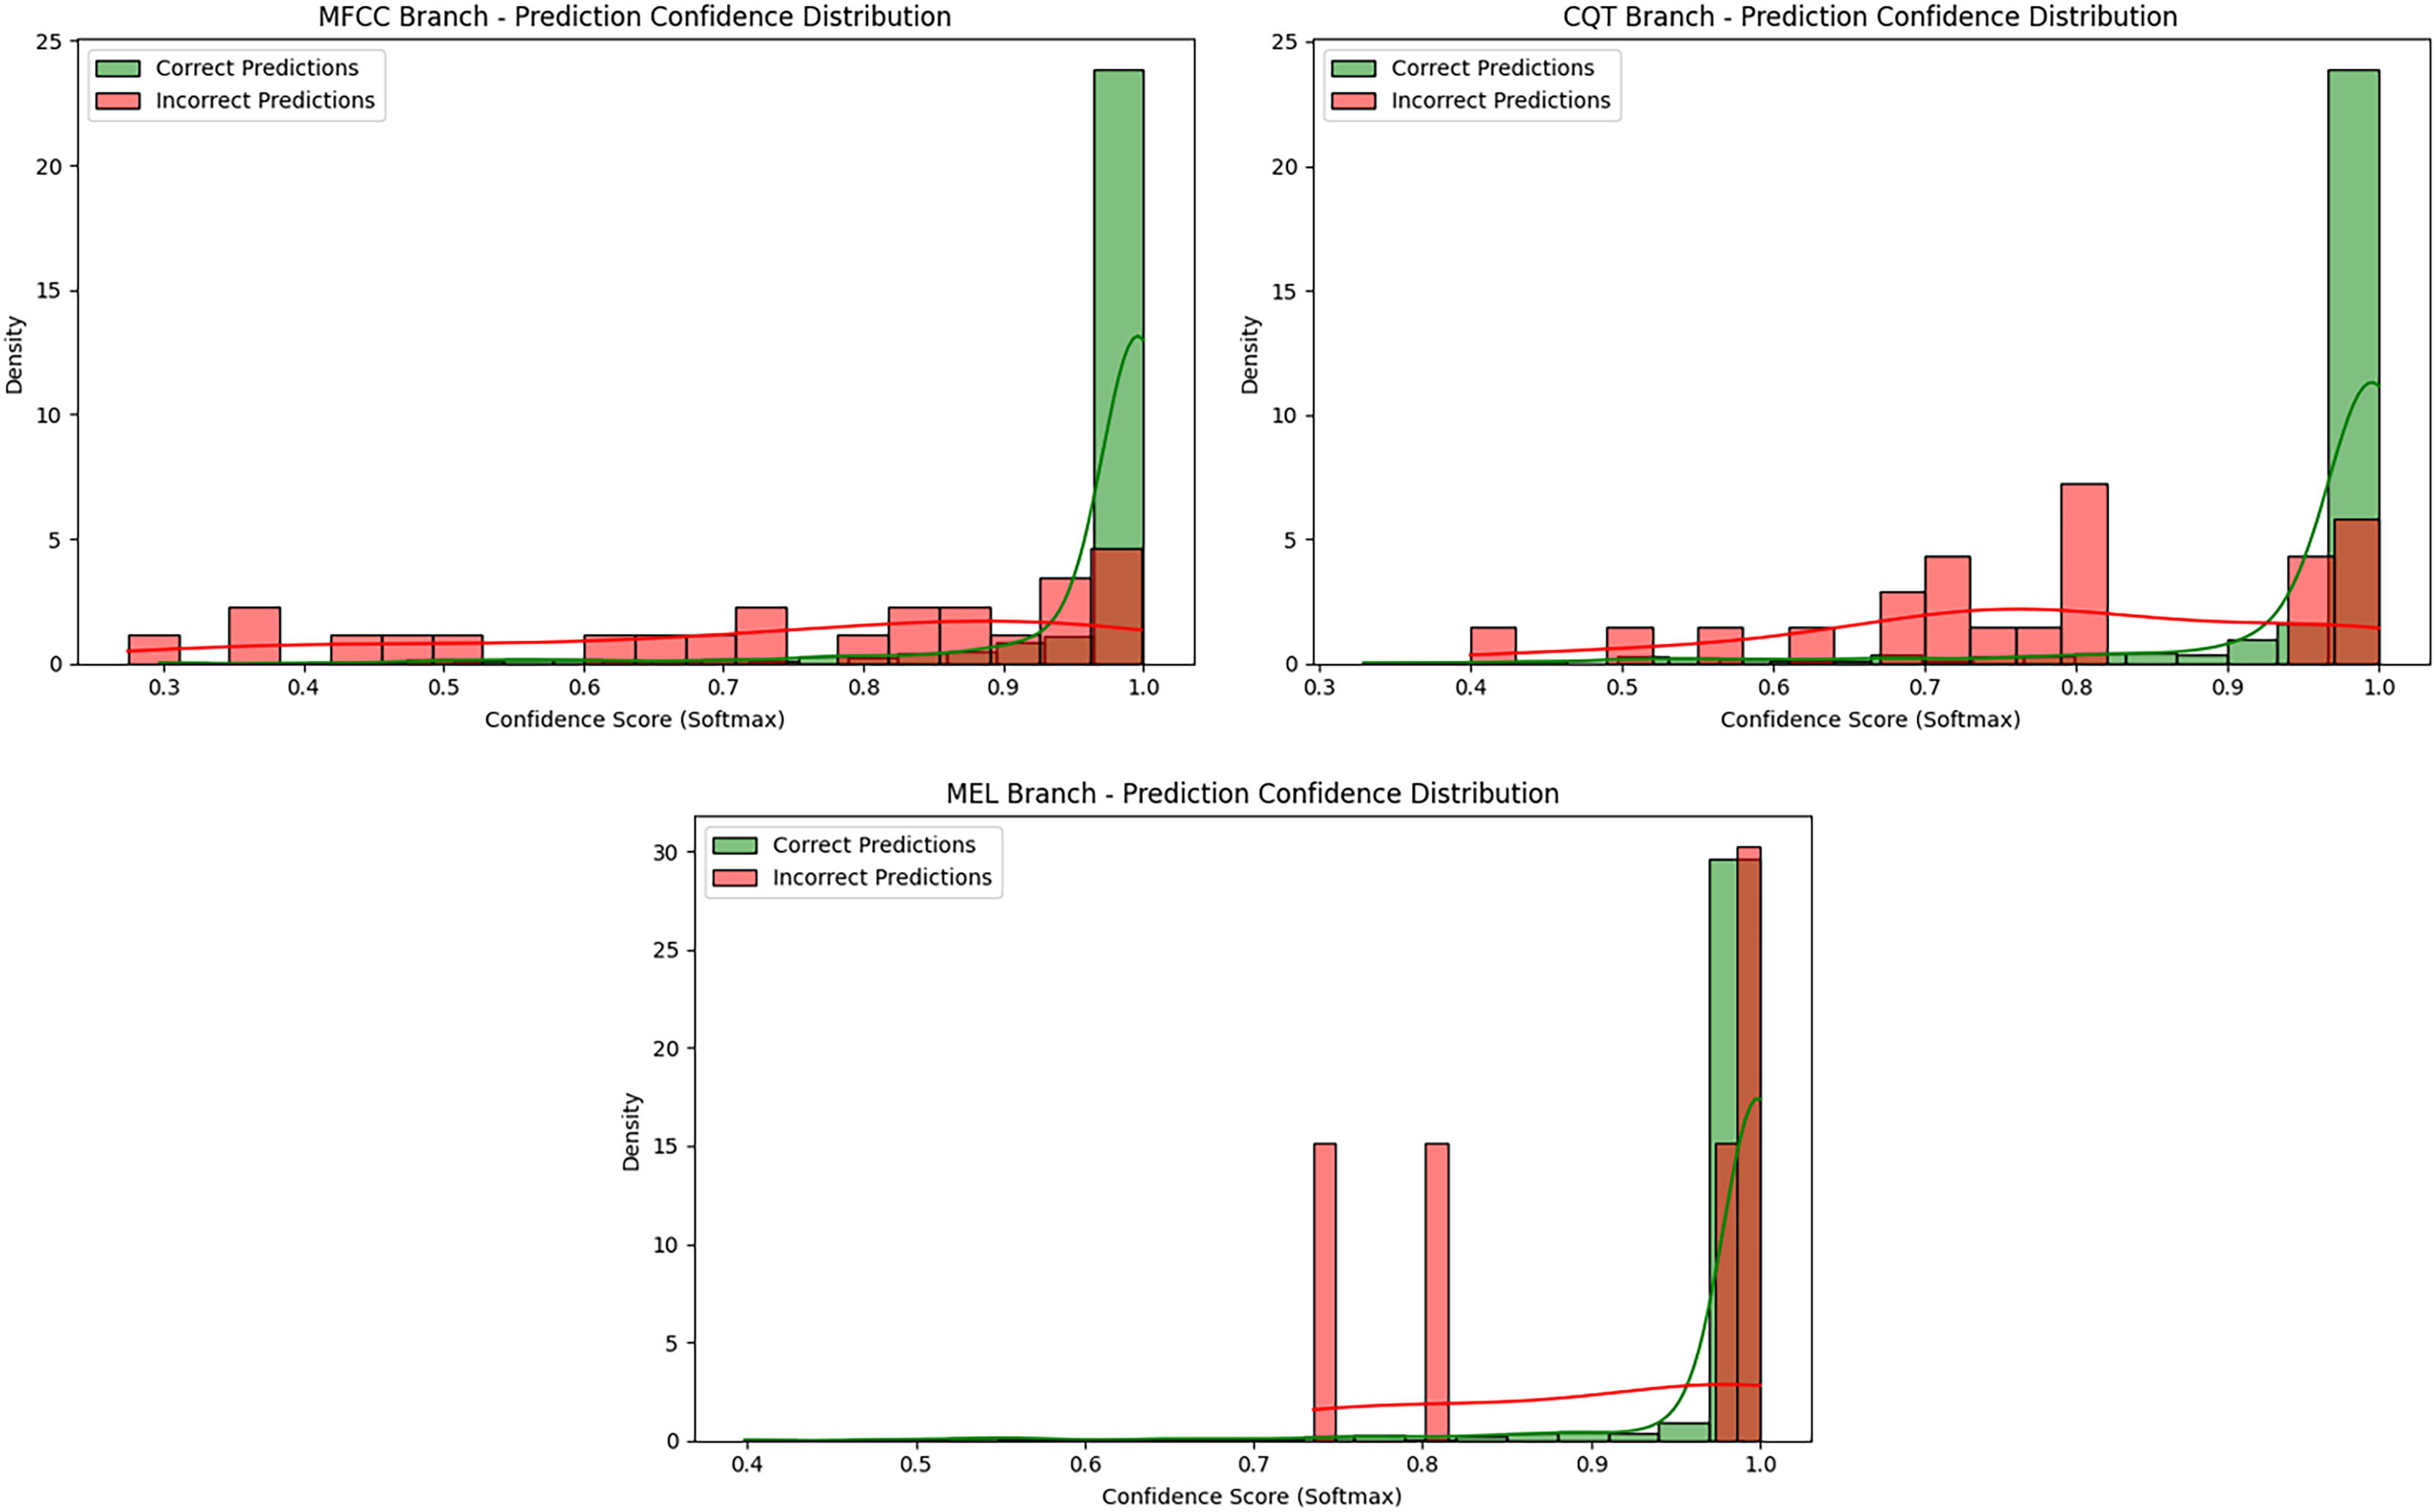
Figure 10: Prediction confidence histograms for the MFCC, CQT, and Mel-spectrogram branches.
The prediction confidence histograms for the MFCC, CQT, and Mel-spectrogram branches provide a detailed view of the certainty associated with correct and incorrect classifications within each model stream, as illustrated in Fig. 10. In all three branches, the majority of correct predictions are concentrated near the upper end of the softmax scale, close to 1.0, indicating that the models tend to assign high confidence to accurate predictions.
This trend is especially pronounced in the Mel-based branch, where both correct and incorrect predictions are tightly clustered in the high-confidence range. This suggests that the model is able to separate classes in a stable and consistent manner. In the MFCC branch, a similar distribution is observed; however, a small portion of incorrect predictions fall below the 0.9 threshold, showing some dispersion in confidence and indicating less certainty in certain decision boundaries. In contrast, the CQT-based model exhibits a broader spread of incorrect predictions, with many falling within the 0.4–0.9 range. This may reflect intrinsic ambiguity within the CQT representation or increased spectral overlap between classes.
Among the three, the Mel-spectrogram branch not only achieved the highest classification performance but also produced the most consistent and confident predictions. While the MFCC-based model performed robustly overall, it showed slightly more variability in confidence scores for misclassifications. The CQT-based model, despite yielding competitive results, demonstrated a higher proportion of high-confidence incorrect predictions, suggesting potential instability in certain classification scenarios.
These confidence distribution analyses serve as a complementary assessment beyond traditional performance metrics, offering valuable insight into model behavior under uncertainty. Furthermore, they provide a quantitative foundation for the ensemble strategy introduced in the following section by highlighting the distinct decision characteristics of each spectral representation.
Final classification via ensemble integration: stacking-based decision layer
The individual models presented in the previous section (trained separately using MFCC, Mel-spectrogram, and CQT-spectrogram inputs) demonstrated strong classification performance when evaluated independently. However, given that each spectral representation captures different aspects of the audio signal, combining their outputs holds the potential to further improve classification accuracy. To investigate this, the outputs of the three spectral branches were evaluated using both basic fusion techniques and higher-level meta-learning strategies.
Before applying the stacking approach, a weighted voting ensemble was implemented using the softmax outputs of the three individual models. In this method, the predicted class probability distributions were aggregated with weights proportional to the standalone performance of each model. The weights were set as follows: 0.3394 for the Mel-spectrogram model, 0.3300 for the MFCC model, and 0.3306 for the CQT model. This ensured that each representation contributed to the final decision in proportion to its classification strength. Results from the weighted ensemble confirmed that spectral diversity positively influenced overall performance.
To further exploit the complementary strengths of the spectral inputs, a stacking ensemble approach was also adopted. In this setup, the softmax probabilities from all three models were concatenated into a 21-dimensional meta-feature vector—each branch contributing seven class probabilities. A stacking architecture was implemented in which both logistic regression and XGBoost were evaluated as meta-learners. Logistic regression (LogReg) was selected for its simplicity and effectiveness in modeling linear relationships, making it a strong baseline for ensemble integration. In contrast, XGBoost was chosen due to its high discriminative capacity and robustness in capturing complex, non-linear decision boundaries. This dual-meta-learner evaluation enabled the assessment of how both linear and non-linear aggregation strategies affect overall classification performance. This architecture preserves the contributions of individual spectral branches while enabling a more refined decision-making process. The results, including detailed metrics for each method, are summarized in Table 4.
| Weighted ensemble | Stacking ensemble (LogReg) | Stacking ensemble (XGBoost) | ||||||||||
|---|---|---|---|---|---|---|---|---|---|---|---|---|
| Precision | Recall | F1-score | MCC | Precision | Recall | F1-score | MCC | Precision | Recall | F1-score | MCC | |
| Cough | 0.9800 | 0.9800 | 0.9800 | 0.9767 | 0.9899 | 0.9800 | 0.9849 | 0.9824 | 0.9800 | 0.9900 | 0.9850 | 0.9883 |
| Laugh | 0.9703 | 0.9800 | 0.9751 | 0.9710 | 0.9802 | 0.9900 | 0.9851 | 0.9826 | 1.0000 | 1.0000 | 1.0000 | 1.0000 |
| Scream | 1.0000 | 0.9800 | 0.9899 | 0.9883 | 1.0000 | 0.9800 | 0.9899 | 0.9883 | 0.9900 | 0.9900 | 0.9900 | 0.9942 |
| Sneeze | 0.9703 | 0.9800 | 0.9751 | 0.9710 | 0.9706 | 0.9900 | 0.9802 | 0.9769 | 0.9900 | 1.0000 | 0.9950 | 0.9942 |
| Snore | 1.0000 | 1.0000 | 1.0000 | 1.0000 | 1.0000 | 1.0000 | 1.0000 | 1.0000 | 1.0000 | 1.0000 | 1.0000 | 1.0000 |
| Sniffle | 1.0000 | 1.0000 | 1.0000 | 1.0000 | 1.0000 | 1.0000 | 1.0000 | 1.0000 | 1.0000 | 1.0000 | 1.0000 | 1.0000 |
| Farting | 1.0000 | 1.0000 | 1.0000 | 1.0000 | 1.0000 | 1.0000 | 1.0000 | 1.0000 | 1.0000 | 1.0000 | 1.0000 | 1.0000 |
| Average | 0.9887 | 0.9886 | 0.9886 | 0.9867 | 0.9915 | 0.9914 | 0.9914 | 0.9900 | 0.9943 | 0.9971 | 0.9957 | 0.9967 |
| Accuracy | 98.86% | 99.14% | 99.71% | |||||||||
Table 4 summarizes the effect of ensemble strategies on the final classification performance by aggregating the outputs of the three individual models. The first approach, a weighted voting ensemble, combined the softmax outputs of the three branches using weights proportional to each model’s individual classification accuracy. Despite being well-structured, the weighted ensemble yielded a slightly lower overall accuracy (98.86%) compared to the standalone Mel-spectrogram model (99.29%). These results suggest that although the fusion respected individual model performance, the impact of the strongest branch (Mel) may have been diminished by weaker components. This observation is further reflected in the one-vs.-rest MCC values, where the weighted ensemble achieved lower macro-level correlation consistency relative to the stacking-based approaches, indicating reduced balance between correct and incorrect predictions across binary partitions.
To explore alternative aggregation strategies, a stacking ensemble was also constructed using logistic regression as the meta-classifier. This linear model, due to its simplicity and interpretability, served as a strong baseline for combining predictions from the three spectral branches. The logistic regression-based stacking model achieved a higher overall accuracy of 99.14%, outperforming the weighted voting approach. Moreover, it improved classification outcomes particularly for acoustically confounding classes such as laugh and cough, demonstrating that even a linear fusion strategy can yield effective results when the base models are well-calibrated. The improved MCC values obtained with the logistic regression meta-model highlight its enhanced discrimination stability across classes, suggesting that the linear combination effectively mitigates asymmetric error patterns that remained in the weighted ensemble.
In contrast, the stacking ensemble approach employed XGBoost (Chen et al., 2015) as a meta-classifier to learn complex non-linear decision boundaries from the combined 21-dimensional softmax feature vector. This method achieved highly accurate classification performance, with class-wise precision, recall, and F1-scores exceeding 98% across all categories. Notably, it corrected the majority of misclassifications observed in individual MFCC and CQT models—particularly improving the recognition of previously confused classes such as cough and sneeze. Although not perfectly error-free, the stacking approach significantly reduced class-level confusion and achieved a macro-averaged accuracy of 99.71%, outperforming the weighted ensemble configuration. The XGBoost-based stacking model also achieved the highest macro-averaged MCC among all ensemble strategies, indicating a near-perfect correlation between predicted and true labels across binary decision boundaries. This reinforces its superior ability to preserve class separability while suppressing residual false positives and false negatives.
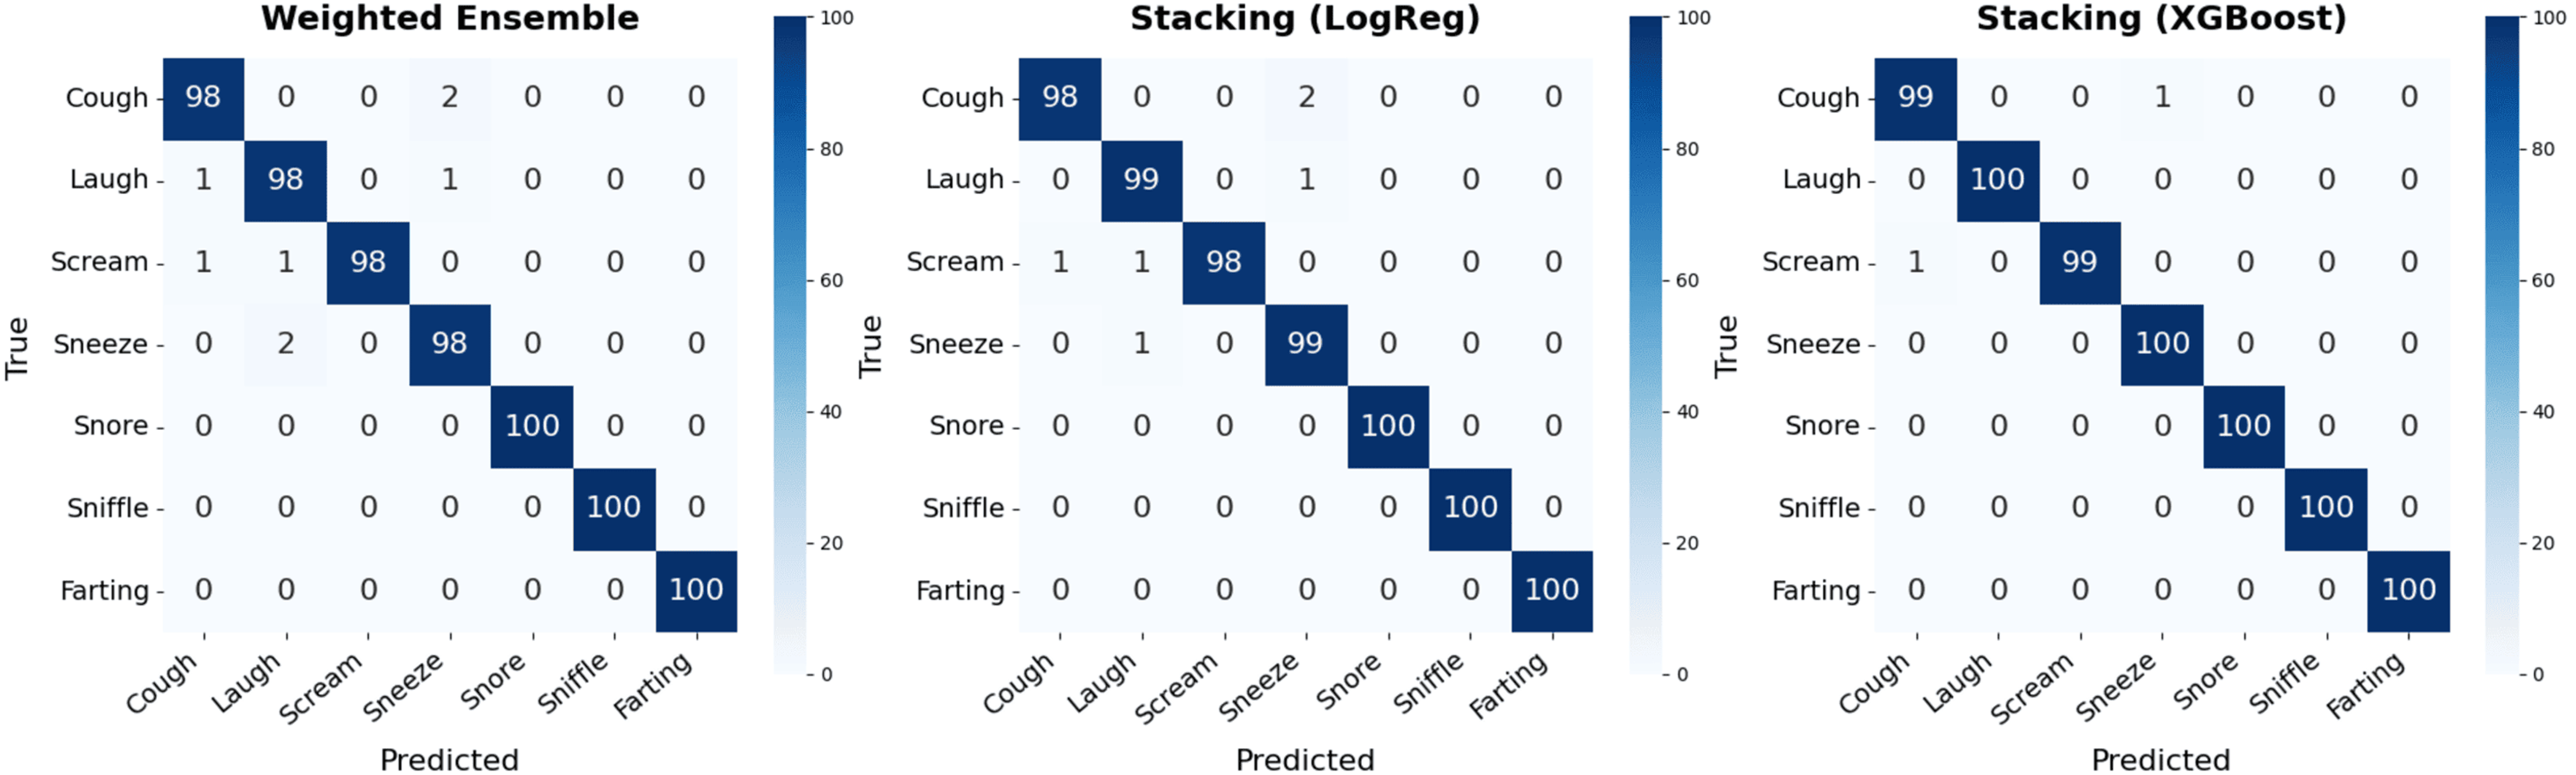
Although the weighted voting scheme reflects a basic fusion strategy, the meta-learning capability of stacking led to a clearly superior generalization outcome. This underscores the importance of not only considering individual model performance but also capturing the complementary strengths of diverse spectral representations. The superior results obtained with both logistic regression and XGBoost further emphasize that stacking (regardless of whether linear or non-linear meta-models are employed) offers significant advantages over static aggregation schemes. The stacking ensemble not only achieved higher accuracy but also ensured a more stable and balanced decision process, reducing residual ambiguities left by the individual models. These findings are further supported by the confusion matrices presented in Fig. 11.
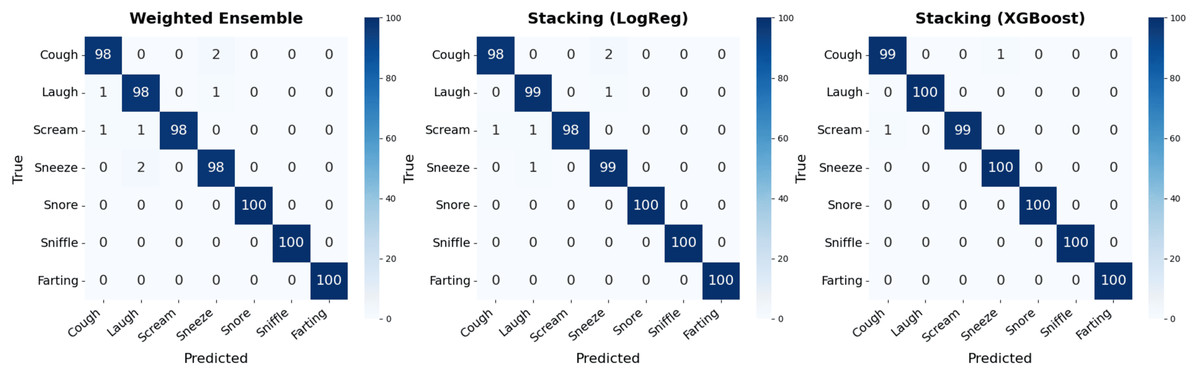
Figure 11: Confusion matrices for the weighted voting and stacking ensemble methods.
The confusion matrix for the weighted ensemble method indicates that while most classes were predicted correctly, a small number of misclassifications occurred (particularly in the cough, laugh, sneeze, and scream categories). These errors suggest that mispredictions made by the individual models may propagate into the ensemble outcome. The core limitation lies in the nature of weighted voting, where class decisions are derived from the weighted average of softmax probabilities without explicitly modeling complex class boundaries.
The stacking ensemble with logistic regression as the meta-classifier demonstrated improved performance compared to the weighted scheme, correcting a number of these residual misclassifications. While minor errors were still observed (for instance, occasional confusion between cough and scream) the model achieved notably higher overall accuracy. This outcome underscores the ability of even a linear meta-learner to leverage the complementary strengths of the spectral branches, surpassing static combination strategies.
In contrast, the confusion matrix for the stacking ensemble reveals near-perfect classification across all instances, with only minimal residual misclassifications. The XGBoost-based meta-classifier effectively learned the intricate relationships among the outputs of the three branches, resolving most of the uncertainties that persisted in the individual models. Notably, for the classes where the standalone models exhibited confusion (such as cough and sneeze) the stacking ensemble significantly improved recognition accuracy, highlighting its superior decision fusion capability.
Overall, although the weighted ensemble combines high-performing models, its reliance solely on averaged softmax outputs limits its ability to construct optimal decision boundaries. The logistic regression-based stacking approach mitigates some of these limitations through linear aggregation, while the XGBoost-based variant further enhances decision boundaries via non-linear modeling. In contrast, the stacking ensemble integrates complementary information across spectral representations more effectively through meta-learning, leading to superior generalization. This advantage is evident in the enhanced class-wise and macro-averaged metrics, particularly through the reduction of residual misclassifications present in the weighted scheme. While not achieving perfect accuracy, the stacking approach still attained a near-perfect classification performance, clearly outperforming its weighted counterpart as evidenced by the confusion matrices.
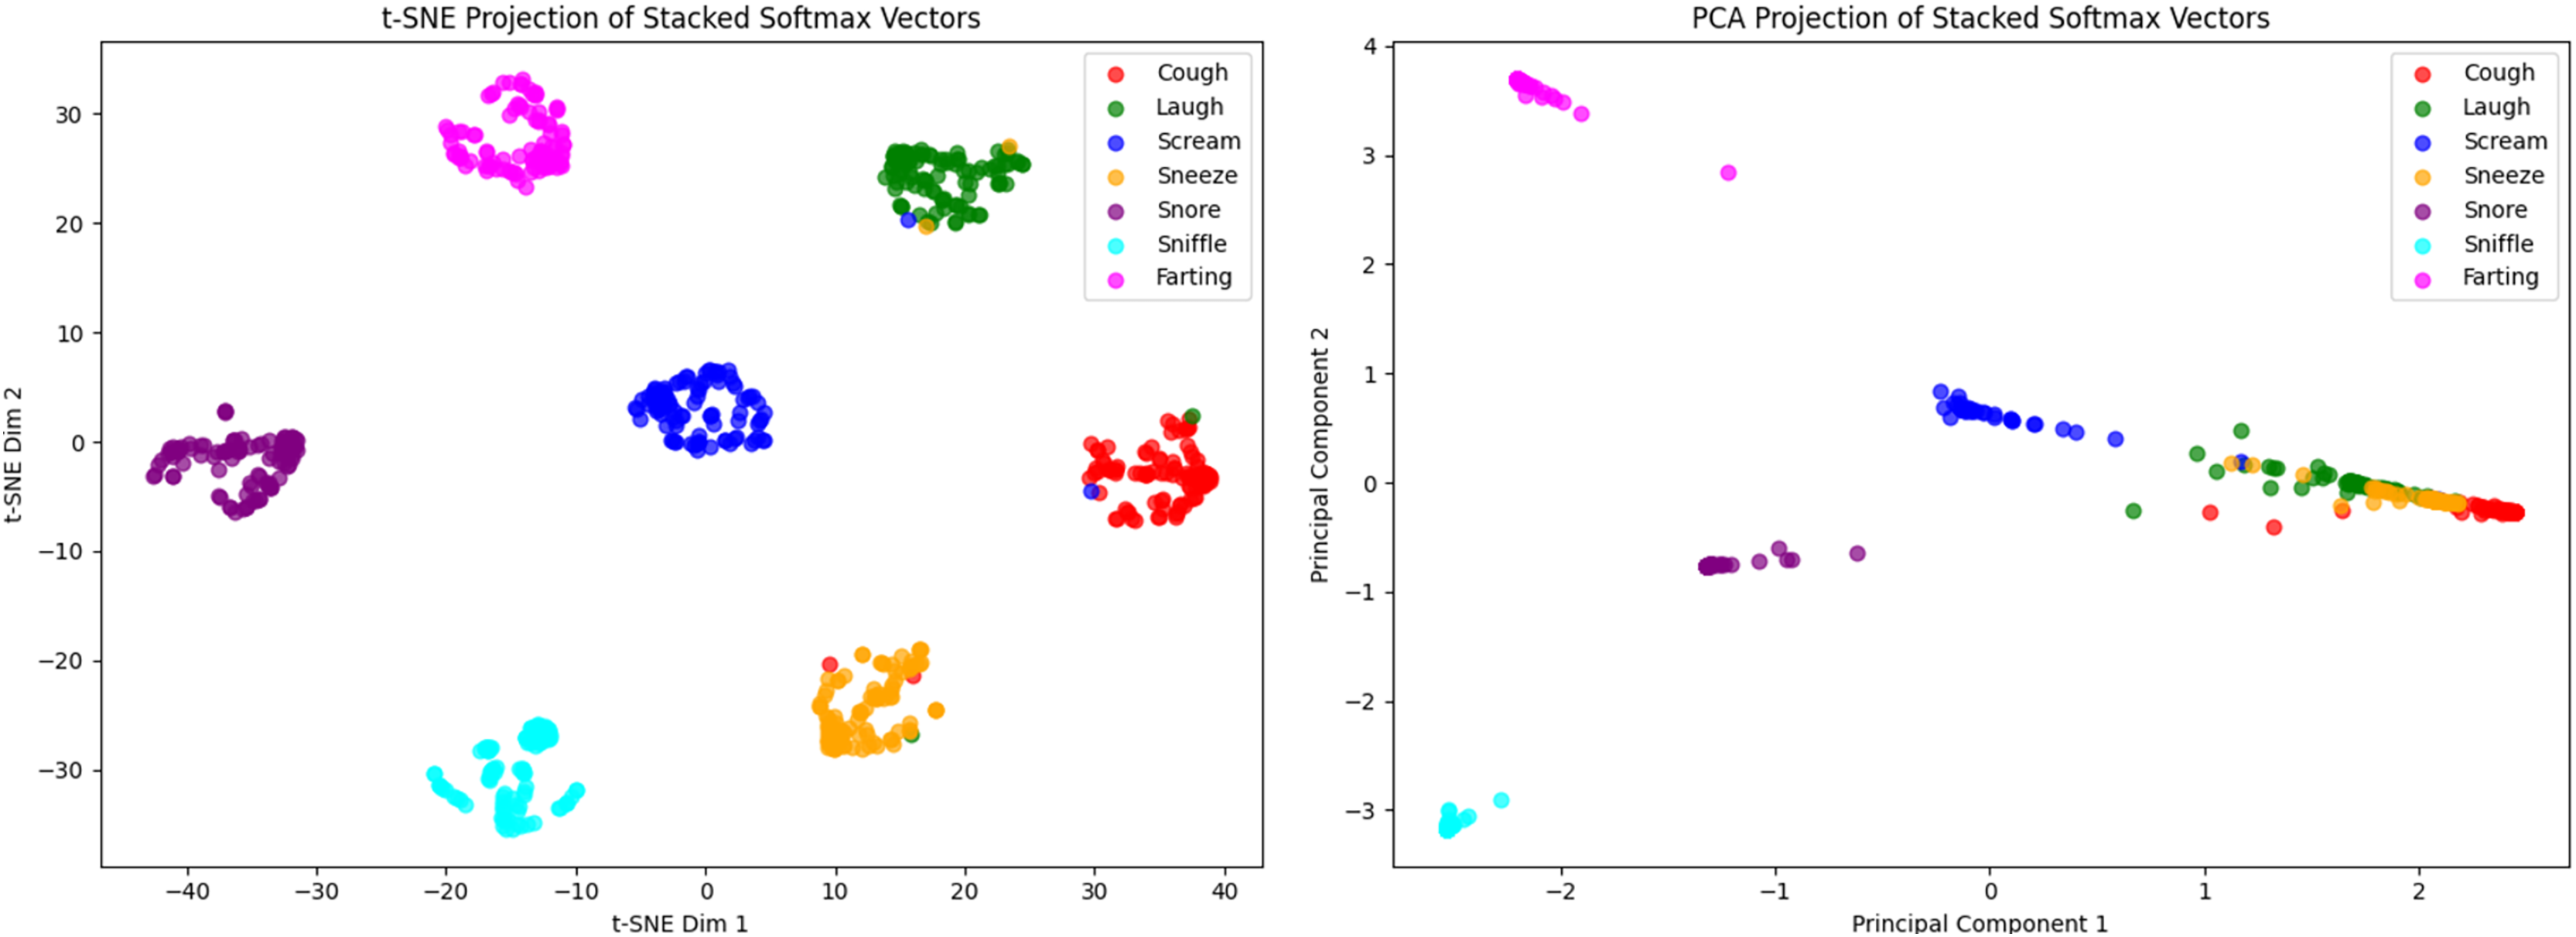
To gain further insights into class separation and visualize the model’s behavior in the decision space, the softmax output vectors from the MFCC, Mel-spectrogram, and CQT branches were concatenated into 21-dimensional decision vectors. These high-dimensional vectors were projected into a two-dimensional space using two dimensionality reduction techniques: principal component analysis (PCA) (Balli, Sağbaş & Peker, 2019) and t-distributed stochastic neighbor embedding (t-SNE) (Sağbaş, Peker & Balli, 2017). The resulting visualizations represent individual samples using color-coded markers by class and aim to provide an intuitive understanding of the structural separation between class clusters. The corresponding projections are presented in Fig. 12.
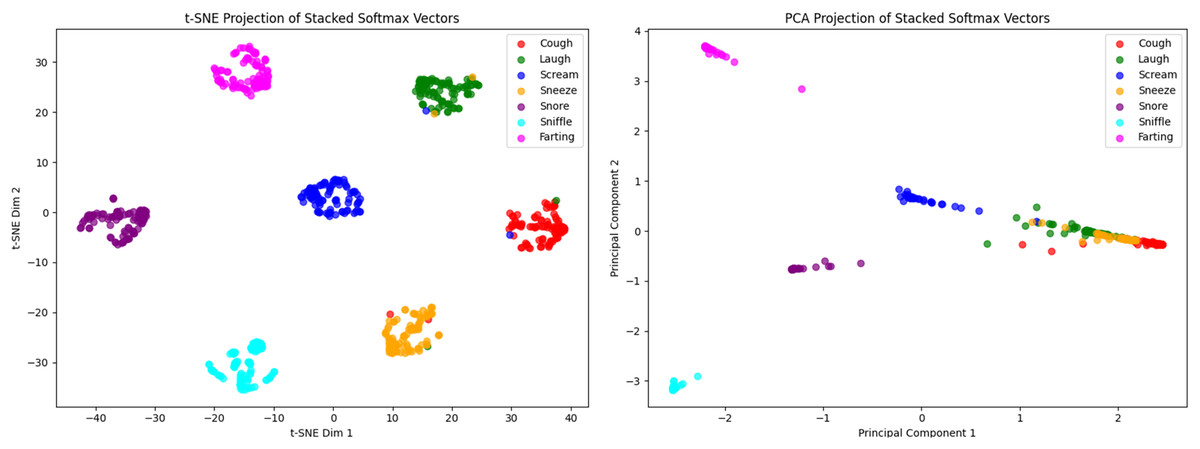
Figure 12: Two-dimensional visualization of the stacked softmax output vectors: (left) t-SNE projection and (right) PCA projection.
Figure 12 presents two-dimensional projections of the 21-dimensional stacked softmax output vectors using t-SNE and PCA. Each point represents a classified nocturnal non-speech sound instance, color-coded by class, allowing for intuitive visual examination of inter-class separation. The t-SNE projection reveals distinct class clusters with minimal overlap, indicating strong non-linear separability in the learned decision space. Notably, the scream, snore, sniffle, and farting classes form compact, well-separated clusters, demonstrating the model’s capacity to construct high-confidence and semantically meaningful decision boundaries.
In contrast, the PCA visualization (while offering a more interpretable, linear projection) exhibits minor overlaps between some classes. Nevertheless, classes such as sniffle, snore, and farting remain clearly separated from others, suggesting that the model maintains consistent discriminative power for these categories even in linearly constrained spaces. These visualizations collectively validate the effectiveness of the stacking ensemble in producing decision vectors with high inter-class discriminability. In particular, the t-SNE projection highlights the model’s ability to map class representations into distinct and homogeneous regions, further supporting the robustness and generalization capacity of the proposed ensemble framework.
Discussion
The proposed three-branch hybrid architecture demonstrated outstanding performance in the classification of nocturnal non-speech sound events. A key factor contributing to this success was the simultaneous processing of input signals using three distinct spectral representations. Each representation captures unique temporal and frequency-domain characteristics of the acoustic signal, enabling a multi-perspective feature learning framework.
Although some sound categories in the dataset (such as snore and farting) are acoustically distinct and thus relatively easy to classify, others (e.g., sneeze and sniffle) exhibit highly overlapping temporal–spectral structures. The hybrid ConvBiLSTM–ViT design ensures consistent discriminability across both simple and challenging categories by leveraging localized, sequential, and global contextual representations. Accordingly, the novelty of this work extends beyond achieving high numerical accuracy by demonstrating the complementary strengths of multi-level acoustic modeling and validating their unified integration within a single framework for nocturnal non-speech sound analysis. This superior performance can be attributed not only to the hybrid structure itself but also to the complementary learning mechanisms of its components. CNN blocks specialize in extracting localized spectral details, BiLSTM units capture long-term temporal continuity, and ViT layers enhance global contextual reasoning through self-attention. The combination of these feature hierarchies allows the model to construct a more holistic representation of acoustic events than single-architecture baselines reported in prior works.
Despite its strong performance, several limitations should be acknowledged. Although generalization capability was validated via 10-fold cross-validation, the dataset was collected under controlled conditions, which may limit the model’s robustness in real-world environments with unpredictable noise. Nevertheless, the use of SpecAugment during preprocessing likely introduced sufficient spectral and temporal variability to help mitigate overfitting, providing a partial substitute for larger real-world diversity. This interplay between controlled data and synthetic variability is a key factor explaining the model’s strong yet stable performance. Additionally, all sound samples were short and corresponded to isolated vocal events; this restricts the model’s applicability to more complex nocturnal acoustic patterns, suggesting the need for more extensive datasets. The model’s success is also partially attributable to the well-balanced class distribution; its performance under imbalanced conditions remains to be explored in future experiments. Finally, the computational complexity of ViT-based architectures may pose challenges for deployment on resource-constrained hardware, and should be carefully considered in practical applications.
Benchmark-based performance comparison with state-of-the-art studies
Within this phase of the experimental evaluation, a focused comparison was carried out to assess the performance of the proposed multi-branch deep learning architecture against existing state-of-the-art models that have utilized the same benchmark dataset. The dataset in question, originally introduced by Akbal & Tuncer (2021), consists of seven distinct categories of nocturnal sounds and provides a standardized basis for objective model comparison in the domain of nocturnal non-speech sound classification.
The selected state-of-the-art studies for comparison include (Akbal & Tuncer, 2021), who proposed a hybrid textural and statistical feature extraction method classified by traditional machine learning models; Akyol, Yildirim & Alatas (2023), who applied a metaheuristic optimization framework for hybrid feature construction and classification; Pandey et al. (2024) who used spectrogram based feature generation; and Sağbaş (2023), who employed ensemble learning techniques (AdaBoost and random forest) on pre-extracted multi-domain features. These studies serve as the comparative baseline for evaluating the merits of the proposed approach, which integrates CNN, BiLSTM, vision transformer, and stacking ensemble mechanisms within a unified multi-branch framework. A comparative overview of these studies, along with the proposed method, in terms of key evaluation metrics (accuracy, precision, recall, F1-score), is presented in Table 5.
| Study | Year | Method | Accuracy | Precision | Recall | F1 |
|---|---|---|---|---|---|---|
| Akbal & Tuncer (2021) | 2021 | Textural and statistical features with kNN | 98.01% | 0.9803 | 0.9800 | 0.9801 |
| Akyol, Yildirim & Alatas (2023) | 2023 | NI-GWO+SVM | 99.28% | 0.9931 | 0.9936 | 0.9929 |
| Akyol, Yildirim & Alatas (2023) | 2023 | IBO+SVM | 99.28% | 0.9931 | 0.9936 | 0.9929 |
| Sağbaş (2023) | 2023 | Adaboost+random forest | 96.44% | 0.9600 | 0.9640 | 0.9614 |
| Pandey et al. (2024) | 2024 | Spectrogram based feature generation with ANN | 97.90% | 0.9714 | 0.9700 | 0.9700 |
| This study | 2025 | Stacked ConvBiLSTM+ViT | 99.71% | 0.9943 | 0.9971 | 0.9957 |
The results presented in Table 5 clearly demonstrate the superiority of the proposed multi-branch hybrid deep learning architecture over existing state-of-the-art methods evaluated on the same dataset. A classification accuracy of 99.71% and macro-averaged metrics above 0.99 underscore the model’s ability to deliver both exceptional accuracy and consistently balanced performance across all classes.
Although Akyol, Yildirim & Alatas (2023) reported high accuracies (up to 99.28%) using new improved gray wolf optimization (NI-GWO)+support vector machine (SVM) and improved bonobo optimizer (IBO)+SVM frameworks, their evaluations were conducted using a fixed 80% training and 20% testing split. Given that only 20 samples per class were used for testing, these results may be less generalizable. By contrast, this study adopted a 10-fold cross-validation approach, offering a more statistically robust estimate by involving every sample in both training and testing phases. The near-perfect classification metrics obtained in this setting highlight the model’s strong generalization capability, providing more robust evidence of effectiveness than single-split evaluations. The method proposed by Akbal & Tuncer (2021), which combines handcrafted textual and statistical features with a kNN classifier, achieved 98% accuracy, while the AdaBoost + random forest ensemble used in Sağbaş (2023) reached 96.44%. As these classical approaches rely on manual feature engineering and external classifiers, their representational capacity remains inherently limited. Pandey et al. (2024) employed a spectrogram-based feature generation strategy combined with an artificial neural network (ANN), achieving an accuracy of 97.90%. Their evaluation was conducted using 5-fold cross-validation, which (while more generalizable than a single train-test split) still exposes the model to fewer training-testing permutations compared to the 10-fold protocol adopted in the current study. Moreover, the relatively shallow ANN architecture may limit its capacity to learn hierarchical temporal patterns from spectrogram inputs. In contrast, the proposed deep multi-branch model integrates both spectral richness and structural modeling capacity, resulting in substantially improved classification performance.
In contrast, the proposed architecture autonomously extracts deep features from three complementary spectral domains and jointly models local (via CNN), temporal (via BiLSTM), and global (via ViT + attention) dependencies. This unified and automated feature learning strategy contributes to its superior classification performance, as evidenced by the highest accuracy (99.71%) and macro-averaged metrics among all compared methods. Collectively, the results indicate that the proposed model not only achieves the highest numerical performance but also embodies a more advanced artificial intelligence paradigm by effectively integrating complementary spectral representations. The optimization performed at the decision level by the stacking ensemble layer substantially reduces inter-class confusion, enabling the model to deliver near-perfect classification performance across all categories while maintaining consistent generalization.
Comparison with other nocturnal non-speech sound classification studies
In order to position the proposed model within the broader landscape of nocturnal sound classification research, a comparative evaluation was conducted against previously published studies focusing on similar auditory tasks. These studies vary widely in terms of their objectives, classification targets, model architectures, and dataset characteristics. While some works aim to detect sleep apnea (e.g., Cheng et al., 2022; Kim et al., 2017), others are centered around snoring detection (e.g., Jiang, Peng & Zhang, 2020; Ding & Peng, 2022), sleep stage classification (e.g., Dafna, Tarasiuk & Zigel, 2018; Hong et al., 2022; Xue et al., 2019), or general sleep sound recognition (e.g., Christofferson et al., 2022). The number of target classes in these tasks also varies: sleep apnea and snoring detection are typically modeled as binary problems, whereas sleep stage classification tends to involve multi-class setups—ranging from two up to four stages. Notably, the accuracy scores reported in such studies tend to decrease as the number of classes increases, particularly in sleep staging tasks (e.g., Xue et al., 2019; Kalkbrenner et al., 2019).
From a methodological perspective, earlier studies predominantly employed classical machine learning techniques such as support vector machines (Kim et al., 2017) or logistic regression (Kim et al., 2019), as well as shallow neural models like ANN (Dafna, Tarasiuk & Zigel, 2018). More recent efforts have explored deeper and more complex architectures including CNN (Ding & Peng, 2022), LSTM (Cheng et al., 2022), CNN-LSTM hybrids (Jiang, Peng & Zhang, 2020), and attention-based models. Despite these advances, most models are optimized for specific and narrowly defined tasks, often using private datasets and lacking in generalizable architectural design. In contrast, the present study introduces a stacked ConvBiLSTM+ViT framework designed to handle seven distinct sleep sound classes simultaneously. The classification accuracy achieved by the proposed model (99.71%) outperforms all previously reported results on comparable tasks, as summarized in Table 6. It should be noted that the studies summarized in Table 6 address different diagnostic targets, including snoring detection, sleep stage classification, and general nocturnal sound analysis. Therefore, the reported accuracies are presented only for contextual comparison to illustrate methodological trends in acoustic-based sleep analysis, rather than as direct indicators of equivalent task complexity or dataset difficulty.
| Study | Year | Aim (Detection) | Method | Accuracy |
|---|---|---|---|---|
| Cheng et al. (2022) | 2022 | Sleep apnea | LSTM | 95.30% |
| Christofferson et al. (2022) | 2022 | Sleep sounds | Modified TSM | 91.00% |
| Dafna, Tarasiuk & Zigel (2018) | 2018 | Sleep stage | ANN | 91.70% |
| Ding & Peng (2022) | 2022 | Snoring | CNN | 78.85% |
| Hong et al. (2022) | 2022 | Sleep stage | CNN-BiLSTM | 89.40% |
| Jiang, Peng & Zhang (2020) | 2020 | Snoring | CNNs-LSTMs-DNNs | 85.45% |
| Kalkbrenner et al. (2019) | 2019 | Sleep stage | Linear discriminant classifier | 86.90% |
| Khan (2019) | 2019 | Snoring | CNN | 96.00% |
| Kim et al. (2017) | 2017 | Sleep apnea | SVM | 92.78% |
| Kim et al. (2019) | 2019 | Sleep apnea | Simple logistik regression | 85.30% |
| Xue et al. (2019) | 2020 | Sleep stage | ReliefF+CCA | 84.40% |
| Adesuyi, Kim & Kim (2022) | 2022 | Snoring | 1D-CNN | 99.70% |
| Sillaparaya et al. (2022) | 2022 | Sleep apnea | Deep learning | 85.25% |
| This study | 2025 | Sleep sounds | Stacked ConvBiLSTM+ViT | 99.71% |
The results presented in Table 6 highlight the performance disparity between the proposed approach and previous works. The majority of prior studies reported accuracy rates ranging between 84% and 97%, with very few exceeding the 98% threshold. Even the most accurate studies (e.g., Adesuyi, Kim & Kim, 2022) focus on relatively simple binary classification tasks such as snore vs. non-snore. In contrast, the current study addresses a more complex seven-class classification problem involving diverse non-speech sleep sounds, yet achieves a near-perfect accuracy of 99.71%. This outstanding performance can be attributed to several architectural innovations, including the integration of spectral diversity (MFCC, Mel, CQT), hybrid feature modeling via CNN, BiLSTM, and vision transformer, and a robust stacking ensemble strategy. Furthermore, the model was evaluated using 10-fold cross-validation, ensuring statistical rigor and enhanced generalizability. From a methodological perspective, these findings demonstrate that integrating global attention mechanisms within sequential and convolutional frameworks can substantially improve acoustic event discrimination. In practical terms, such hybrid transformer-based systems could form the basis for intelligent health-monitoring or ambient-sound recognition applications where both interpretability and robustness are essential.
Although the proposed framework achieved near-perfect classification accuracy, these results should be interpreted with caution given the dataset’s limited scale and controlled acoustic conditions. Future studies will focus on external validation using larger and more diverse real-world recordings to confirm generalization.
Furthermore, the comparative results in Table 6 should be interpreted qualitatively, as the referenced studies vary in diagnostic scope and dataset composition. The intention was to position the proposed hybrid model within the broader methodological landscape rather than to claim direct numerical superiority.
Beyond the methodological contributions, the proposed framework also holds practical relevance for real-world deployment. Automatic recognition of nocturnal non-speech sounds can serve as a foundation for intelligent home monitoring systems, assisting in detecting unusual or distress-related sounds during sleep. Such systems could operate in a fully non-invasive manner using low-cost microphones or IoT-based sensors integrated into smart home infrastructures. Furthermore, the approach may be adapted for use in healthcare or elderly-care contexts, where early detection of abnormal nocturnal acoustic patterns could support preventive interventions and improve safety and quality of life.
Conclusion and future works
This study proposed a novel hybrid deep learning architecture for nocturnal non-speech sound classification by leveraging the representational richness of three distinct spectral transformations. Each spectral branch was processed through a multi-stage pipeline comprising CNN, BiLSTM, and ViT augmented with an attention mechanism. The fusion of local, temporal, and global feature modeling enabled the system to capture intricate acoustic patterns embedded in sleep-related audio signals, thereby facilitating a robust and comprehensive learning framework. The softmax outputs derived from the three parallel branches were consolidated through both weighted voting and a meta-level stacking ensemble, the latter employing XGBoost as the final decision layer. Experimental results demonstrated that while individual branches already achieved near-perfect classification performance, the stacking ensemble strategy further enhanced generalization and yielded the highest accuracy (99.71%) and macro-averaged metrics reported in the literature for multi-class nocturnal non-speech sound classification.
Beyond traditional evaluation metrics, auxiliary analyses such as prediction confidence histograms and low-dimensional projections using t-SNE and PCA further validated the model’s strong discriminative capacity and the separability of class-specific decision boundaries. These supplementary experiments highlighted the ensemble’s ability to reconcile heterogeneous feature representations and improve inter-class discrimination, particularly in acoustically overlapping sound categories. Overall, the results confirm that harmonizing diverse spectral features within a hierarchical ensemble framework is not only feasible but also more effective than relying on isolated or single-stream modeling strategies.
Despite its outstanding performance, this study acknowledges several limitations. The dataset was recorded under controlled conditions with limited ambient noise and consisted of relatively short-duration audio clips, which may not fully capture the complexities of real-world sleep environments. Future research should explore extending the proposed architecture to more challenging real-time and noisy settings, potentially through the integration of denoising autoencoders or data augmentation techniques tailored to low signal-to-noise conditions. Moreover, expanding the dataset to include compound or overlapping nocturnal events would provide a more rigorous testbed for assessing model generalization. Finally, investigating lightweight transformer variants or pruning strategies could improve computational efficiency, making the model more viable for deployment on edge devices and mobile sleep monitoring platforms.
The findings of this study demonstrate that the proposed multi-branch stacked ConvBiLSTM+ViT architecture provides a state-of-the-art solution for nocturnal non-speech sound classification. By integrating spectral diversity, temporal dynamics, and global attention within a unified deep learning framework, the model achieves near-perfect accuracy (99.71%) and outperforms previously published approaches on comparable tasks. This architecture establishes a robust foundation for future advancements in intelligent and scalable sleep monitoring systems, paving the way for non-invasive, at-home diagnostic solutions powered by deep learning.