
Reducing defect rates in smart manufacturing processes: deep learning-based quality control for automotive tow hooks
- Published
- Accepted
- Received
- Academic Editor
- Xiangjie Kong
- Subject Areas
- Algorithms and Analysis of Algorithms, Artificial Intelligence, Data Mining and Machine Learning, Software Engineering, Visual Analytics
- Keywords
- Defect classification, Deep learning, Quality control
- Copyright
- © 2026 Canlı and Varıcı
- Licence
- This is an open access article distributed under the terms of the Creative Commons Attribution License, which permits unrestricted use, distribution, reproduction and adaptation in any medium and for any purpose provided that it is properly attributed. For attribution, the original author(s), title, publication source (PeerJ Computer Science) and either DOI or URL of the article must be cited.
- Cite this article
- 2026. Reducing defect rates in smart manufacturing processes: deep learning-based quality control for automotive tow hooks. PeerJ Computer Science 12:e3533 https://doi.org/10.7717/peerj-cs.3533
Abstract
In the automotive industry, quality control in the production of critical components is of great importance. One such critical component is the tow hook, a specialized connecting element mounted on the rear of motor vehicles, enabling them to safely tow another vehicle or load. Defective tow hooks can lead to both safety hazards and economic losses. This study aims to compare the performance of deep learning-based models for the classification of defective parts in industrial production processes. The constructed dataset includes defects such as burrs, dents on the thread, non-filling and dents on the surface. Additionally, a class for intact parts was created, resulting in a total of five categories. These categories were used to train and comprehensively evaluate models with different architectures, including residual neural network (ResNet), Mobile Convolutional Neural Network (MobileNet), Visual Geometry Group (VGG), and conventional convolutional neural networks (CNNs), using validation metrics. Experimental results indicate that the ResNet34 model achieved the highest performance, with a 100% accuracy rate and precision, recall, and F1-score values of 1.00 across all classes. The MobileNetV2 model achieved 96% accuracy, with class-wise validation metrics exceeding 0.90, demonstrating strong performance. These findings suggest that the proposed models can effectively distinguish between defective and intact parts with high accuracy, offering a reliable solution for industrial quality control applications. Future work will focus on enhancing the models’ generalization capabilities through the evaluation of larger datasets and diverse production conditions.
Introduction
Industry 4.0 is a transformation process that increases efficiency and reduces costs by integrating technologies such as digitalization, artificial intelligence, big data and the Internet of Things (IoT) into production processes (Xu, David & Kim, 2018). This transformation optimizes processes through smart production systems, while at the same time making quality control mechanisms more precise and reliable. It is stated that smart statistical process control and data-driven quality monitoring approaches improve decision-making processes and increase process efficiency in modern production facilities (Goecks et al., 2024). Real-time analysis and defect detection ensure higher quality standards in production while minimizing the rate of defective products, enabling the achievement of sustainable production goals. In the automotive industry, the production of defect-free, high-quality parts is of great importance in terms of both safety and customer satisfaction. One of these parts, the tow hook, is a part mounted on the rear of motor vehicles that allows vehicles to tow another vehicle or load safely and efficiently. The material and cross-sectional shape used in the design of this part directly affect its tensile capacity and require high strength and proper stress distribution to ensure durability (Raj & Ganesha). Insufficient material or an incorrect cross-sectional shape can lead to adverse situations.
Previous studies have applied deep learning models to defect classification in metal and steel surfaces. For instance, Prihatno et al. (2021) and Konovalenko et al. (2020) utilized CNNs and deep residual networks to classify specific types of surface defects. Similarly, Feng, Gao & Luo (2021) and Nimsarkar et al. (2024) focused on surface defect classification using architectures such as Residual Network with 50 layers (ResNet50) and MobileNetV2. Fu et al. (2019) and Kumaresan et al. (2023) applied transfer learning and adaptive fine-tuning for the classification of weld and sheet metal defects. However, the existing literature has largely focused on specific defect types and has not sufficiently addressed multi-class classification or comparative evaluations of different deep learning models. This gap highlights the importance of classifying multiple defect types and comparing different models for automotive components, particularly parts with complex geometries such as tow hooks. The present study aims to fill this research gap by classifying multiple defect types using a custom tow hook dataset and evaluating the performance of various deep learning models.
Defects occurring during production can pose serious safety risks. A manufacturing defect in a tow hook may lead to breakage or deformation during towing, creating a safety hazard. Therefore, defect classification is critical for enhancing quality control and ensuring safety in production processes.
Deep learning models such as residual neural network (ResNet), Mobile Convolutional Neural Network (MobileNet), Visual Geometry Group 19 (VGG19) and convolutional neural network (CNN) were used to classify the defects. Each of the models was trained with different depths and architectures to improve the defect classification capabilities. Four defect classes were defined based on observed manufacturing defects: burrs, dents on the thread, non-filling and dents on the surface. Each class represents a specific type of defect that may occur during production, and accurate classification is essential for improving product quality. In addition, an intact class was created to identify intact parts. Thus, a total of five classes were obtained, and the models were trained. Training based on five classes enables the separation of defective products and the correct identification of intact products.
The performance of the deep learning models was compared based on accuracy and loss metrics. The ResNet34 model achieved the highest performance, with 100% accuracy and a loss of 0.6%. MobileNetV2 achieved 96% accuracy with a 13% loss, VGG19 reached 90% accuracy and a 35% loss, and the CNN achieved 93% accuracy with a 48% loss. Analysis of these metrics indicates that each model offers distinct advantages. The results demonstrate that deep learning techniques can accurately classify defects on tow hooks, thereby contributing to improved manufacturing processes.
The second part of this study presents a comprehensive literature review, examining existing approaches and prior work in the field. Subsequently, the employed methods and developed systems are described in detail. The Experimental Studies and Results section evaluates the obtained outcomes and compares model performances. In the Discussion section, the findings are interpreted in relation to the research objectives, linked to the literature, and both the strengths and limitations of the study are addressed. Finally, the Conclusion provides a general assessment and highlights the potential of deep learning techniques to enhance efficiency in industrial production processes.
Lıterature
Industry 4.0 is a revolution in manufacturing based on the integration of digitalization, robotics, big data and artificial intelligence (Xu, David & Kim, 2018). Traditional production approaches have been replaced by smart factories that utilize robotic technologies, artificial intelligence, the IoT, and 3D printing systems (Philbeck & Davis, 2018). Through Industry 4.0, manufacturing processes have become more efficient, costs have been reduced, and greater flexibility and speed have been achieved. Moreover, real-time analysis of production data enables more accurate decision-making and process optimization.
In Industry 4.0 projects, the design of intelligent quality control systems requires the establishment of a well-defined target framework. These systems aim to improve the quality of manufacturing processes through digital technologies such as sensors and data analytics (Albers et al., 2016). Quality control in industrial production can be applied at every stage, from product design to the final manufacturing steps. However, criticisms regarding the lack of emphasis on human factors and environmental impacts within this technology-driven approach have led to the emergence of the Industry 5.0 concept. Sheikh et al. (2024) define Industry 5.0 as a transformation built upon three main pillars: resilience, sustainability, and human-centricity. Golovianko et al. (2023) explore the relationship between Industry 4.0 and Industry 5.0 by questioning whether the connection represents coexistence, transition, or a hybrid model. Their study suggests that the technological foundations of Industry 4.0 serve as a necessary infrastructure for realizing the vision of Industry 5.0, implying that these two concepts are not entirely independent from one another (Golovianko et al., 2023). In the context of Industry 4.0 and 5.0, quality control in smart production systems plays a key role in achieving operational efficiency as well as sustainability and resilience goals. Through early and accurate classification, material waste is prevented, energy consumption is reduced, and unnecessary downtime on the production line is avoided, significantly increasing the overall resilience of the system.
Deep learning (Goodfellow et al., 2016) is a machine learning method that provides the ability to automatically learn from large datasets with multi-layered structures. Neural networks form the basis of deep learning with their layered structure and have been successfully used in many fields such as image recognition, audio processing, natural language processing. Recent studies have shown that deep learning models, particularly convolutional neural networks, demonstrate superior performance compared to traditional methods in industrial object classification and defect detection tasks (Chen et al., 2022). Studies emphasize that deep learning-based surface defect detection methods are important for real-time defect detection in industrial products (Liu, Zhang & Dong, 2023; Ameri, Hsu & Band, 2024). Unlike traditional methods, deep learning models can achieve high accuracy by automatically extracting powerful features from data. Weimer, Scholz-Reiter & Shpitalni (2016) showed in their study that CNNs trained with large data sets can achieve high accuracy with low false alarm rates. Tabernik et al. (2020) showed that deep learning can overcome data constraints by proposing a segmentation architecture that provides effective results even with a small dataset to detect surface cracks.
Practical applications of these models have also been addressed in various studies. For example, Albers et al. (2016) addressed the development of monitoring systems in manufacturing processes such as spring coiling to ensure quality production and presented a system procedure that aims to identify and resolve production-related quality issues. Similarly, Prihatno et al. (2021) developed deep learning-based steel plate defect classification to prevent losses due to production defects in smart factories. The study revealed that the deep learning method exhibited high performance with an accuracy rate of 96% (Prihatno et al., 2021). Ma et al. (2024) investigated the use of deep learning-based object detection algorithms in industrial product defect detection and proposed various methods to overcome the challenges faced in industrial environments (Albers et al., 2016). Gong et al. (2020) discussed the applications of deep learning methods in industrial product defect detection and compared them with traditional detection methods (Ma et al., 2024). These studies reveal the importance of deep learning-based approaches in manufacturing processes.
Various deep learning models have achieved high accuracy rates in detecting surface defects. For example, Konovalenko et al. (2020) achieved 96.91% accuracy with a ResNet50-based model, while Wen et al. (2021) achieved high accuracies with their novel methods for detecting insulator defects. Nimsarkar et al. (2024) investigated the performance of MobileNetV2 for detecting steel plate surface defects and achieved the highest accuracy. Lee et al. (2019) achieved high accuracy rates using CNN and class activation maps to detect steel surface defects. Kumaresan et al. (2023) proposed a VGG16-based model to detect welding defects and achieved 90% accuracy with a small X-ray dataset. Feng, Gao & Luo (2021) used a ResNet50-based method to classify surface defects in hot rolling steel strip, achieving 94.11% accuracy, and improved the accuracy to 94.85% with ensemble learning methods. Wang et al. (2021) used ResNet34 to classify metal surface defects, achieving 93.67% accuracy on the NEU dataset. Fu et al. (2019), Golovianko et al. (2023) made significant progress with a CNN model that emphasizes low-level features to automatically identify steel surface defects, while Zhang et al. (2023) made significant progress with IDD-Net, which can cope with large-scale variations and effectively resolve diverse defects. These studies show that deep learning-based methods provide high accuracy rates in the detection of steel and metal surface defects and can significantly improve defect detection performance with different model structures.
Alongside these advances, the challenges faced by deep learning-based surface defect detection have also been investigated. Surveys of recent work in this area generally categorize deep learning methods into three main categories: supervised, unsupervised, and other learning models (Liu, 2020). Saberironaghi, Ren & El-Gindy (2023) adopted a similar approach and discussed deep learning methods from three different perspectives, namely supervised, semi-supervised and unsupervised learning methods, and presented common problems and solutions in this field. Cumbajin et al. (2023), on the other hand, presented a systematic investigation of defects on different surfaces such as metal, construction, ceramics, and wood, demonstrating the relevance of deep learning-based detection methods in the industry. Bhatt et al. (2021) provided a better understanding of the research in the field by classifying deep learning-based surface defect detection studies in the literature in three different ways. These three ways are based on the context of defect detection, learning techniques, and defect localization and classification method (Bhatt et al., 2021). Furthermore, studies such as a CNN-based model successfully classifying wafer defects without additional feature extraction (Cheon et al., 2019), generative adversarial network (GAN)-based data augmentation (Jain et al., 2022), pixel-level segmentation using deep feature fusion (Cao, Yang & Yang, 2020), and real-time small part defect detection (Yang et al., 2019) demonstrate the versatility and effectiveness of deep learning in industrial quality control. These studies show that deep learning is a powerful tool in industrial defect detection and is a field that will further develop with future research.
The literature reveals that numerous deep learning–based approaches have been investigated for detecting surface defects in manufacturing processes. He et al. (2024) presented a comprehensive review of defect inspection methods based on generative models, highlighting their potential in anomaly detection, data augmentation, and realistic defect image generation. Similarly, Shafiee (2025) discussed recent applications of generative artificial intelligence in the manufacturing sector, emphasizing its transformative role in areas such as design optimization and process enhancement.
Research on generative model architectures has also progressed rapidly. Creswell et al. (2018), in their review of GANs, demonstrated the advantages these models offer in image synthesis and data augmentation. More recent studies show that diffusion models have become prominent in producing high-quality images. Croitoru et al. (2023) elaborated on the theoretical foundations of diffusion models and their applications in computer vision, while Zhang et al. (2023) showcased their success in generating semantically consistent and realistic images (Wang et al., 2022). These models are expected to provide significant contributions to future quality control systems by expanding data diversity and enabling better representation of rare defect types.
Table 1 summarizes the key characteristics of studies in the literature on the classification of metal and steel surface defects. These studies typically examine the performance of a single deep learning architecture or provide limited model comparisons, and the datasets used are often publicly available or do not fully reflect the complex defects found in specific product groups. In contrast, the current study aims to classify multiple defect types on a unique automotive tow hook dataset and compare the performance of different deep learning models. In this respect, it provides an innovative contribution to the literature in terms of both the multi-class structure based on real industrial data and the model-based performance analysis. While the current literature highlights the potential of deep learning and generative models in surface defect inspection, multi-defect classification in specific and critical components and the comparison of different model performances remain a gap that needs to be explored. This study addresses this gap by tackling different defect types in tow hooks within the framework of a multi-classification problem.
| Studies | Dataset | Method/Model used | Performance | Limitations/Focus AREA |
|---|---|---|---|---|
| Prihatno et al. (2021) | Pre-existing metal surface defect dataset | CNN architecture | 96% accuracy | Focused on general metal surface defects, used a single CNN architecture. |
| Feng, Gao & Luo (2021) | X-SDD dataset | ResNet50 + CBAM + FcaNet; VGG16 + SqueezeNet | First model: ~94.11% accuracy; Ensemble learning: ~94.85% accuracy | Focused on general strip steel defects, explored different architectures and ensemble learning. |
| Cheon et al. (2019) | Custom dataset | CNN architecture | ~96.2% accuracy | A multi-class problem on wafer surface defects, but only a single CNN model was experimented with. |
| Fu et al. (2019) | NEU dataset + enhanced dataset | SqueezeNet-based model | 100% (NEU); 97.5% (enhanced) | Focused on a pre-existing dataset, and the performance of a single SqueezeNet-based model was investigated. |
| Nimsarkar et al. (2024) | Steel surface dataset | Random forest | MobileNetV2: 83% accuracy | Focused on general steel surface defects, experimented with different traditional and deep learning models. |
| Xgboost | ||||
| MobileNet | ||||
| MobileNetV2 | ||||
| Current study | Custom dataset | Various deep learning models (ResNet, MobileNet, VGG, custom CNN architectures) | ResNet34: 100% accuracy; MobileNet: 96% accuracy | Focused on a specific part (tow hooks). Compared multiple deep learning architectures. The created dataset includes multiple defect classes. |
Material and method
In this section, the data, methods and implementation process used in the study will be explained in detail. In line with the purpose of the study, information about the preparation of the dataset, the characteristics of the models used and the evaluation methods will be provided.
Dataset
Tow hooks produced by a manufacturing company operating in the automotive sector were analyzed. Defective tow hooks that occurred during production were identified and a data set was created bay taking images. Four types of defects were observed on the tow hooks. These defects were identified as burrs, dents on the thread, non-filling and dents on the surface. Burrs are thin, sharp projections that are formed during the processing of metal and remain on the edge of the part. Dents on the threads disrupt the smooth structure of the threads. This prevents the tow hook from seating properly and jeopardizes the safety of the connection. Non-filling is when the material is missing or not evenly distributed in some areas during production. This causes the hook to form weak zones and adversely affects the bearing capacity of the hook. Dents on the surface are usually caused by the hook not being machined properly or being damaged by external influences. Such defects can weaken the structural integrity of the tow hook, cause it to wear faster and reduce its durability. Since each of these defects can directly affect the safety and functionality of the tow hook, these defects were studied. In addition, images of tow hooks with no defects were taken to complete the data set. A total of 193 images were obtained in five different categories: burrs (32), dents on the thread (42), non-filling (39), intact (62), and dents on the surface (18), and the study proceeded based on these categories. Figure 1 shows an example of a data set. Considering that the input dimensions of the models are usually 224 × 224, the dimensions of the data used were resized to 224 × 224 pixels. In addition, the data was normalized and made suitable for the model.
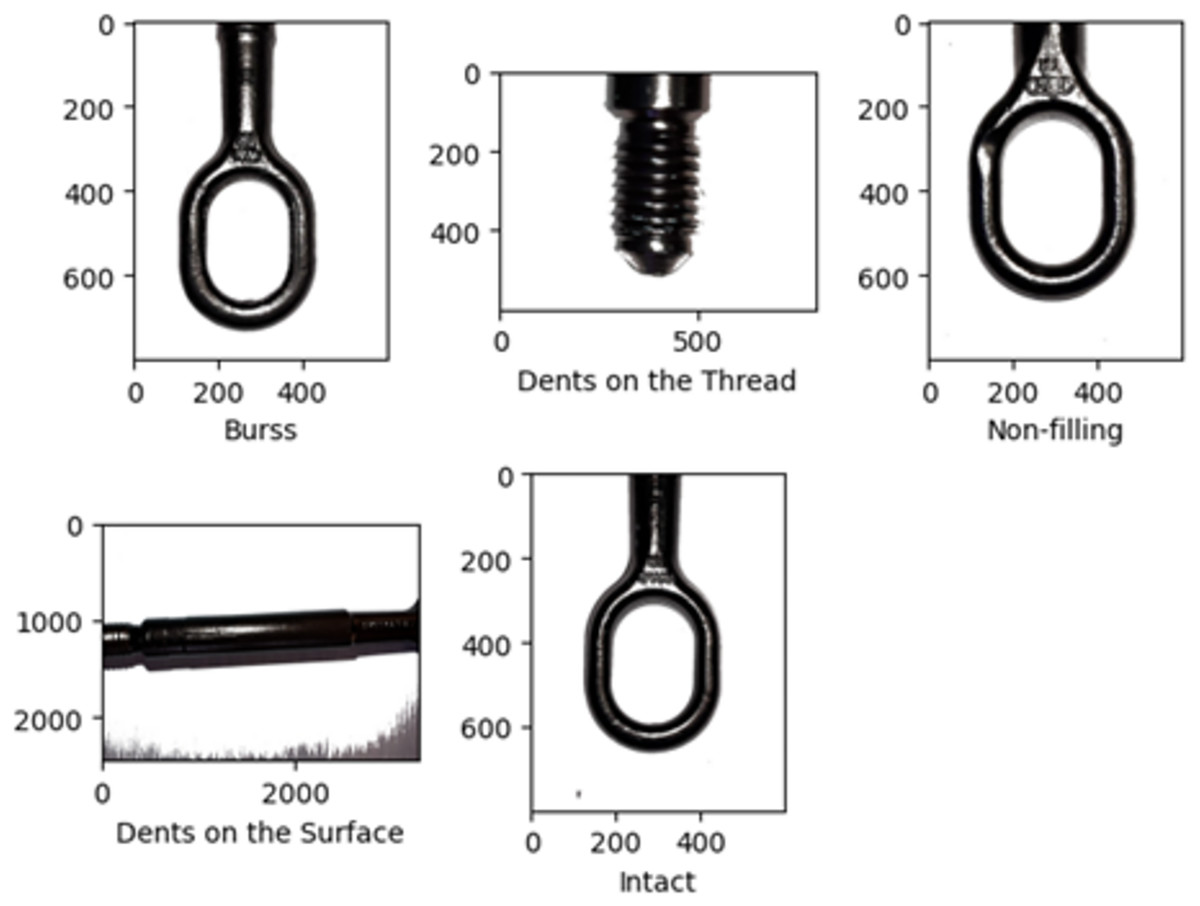
Figure 1: Dataset example.
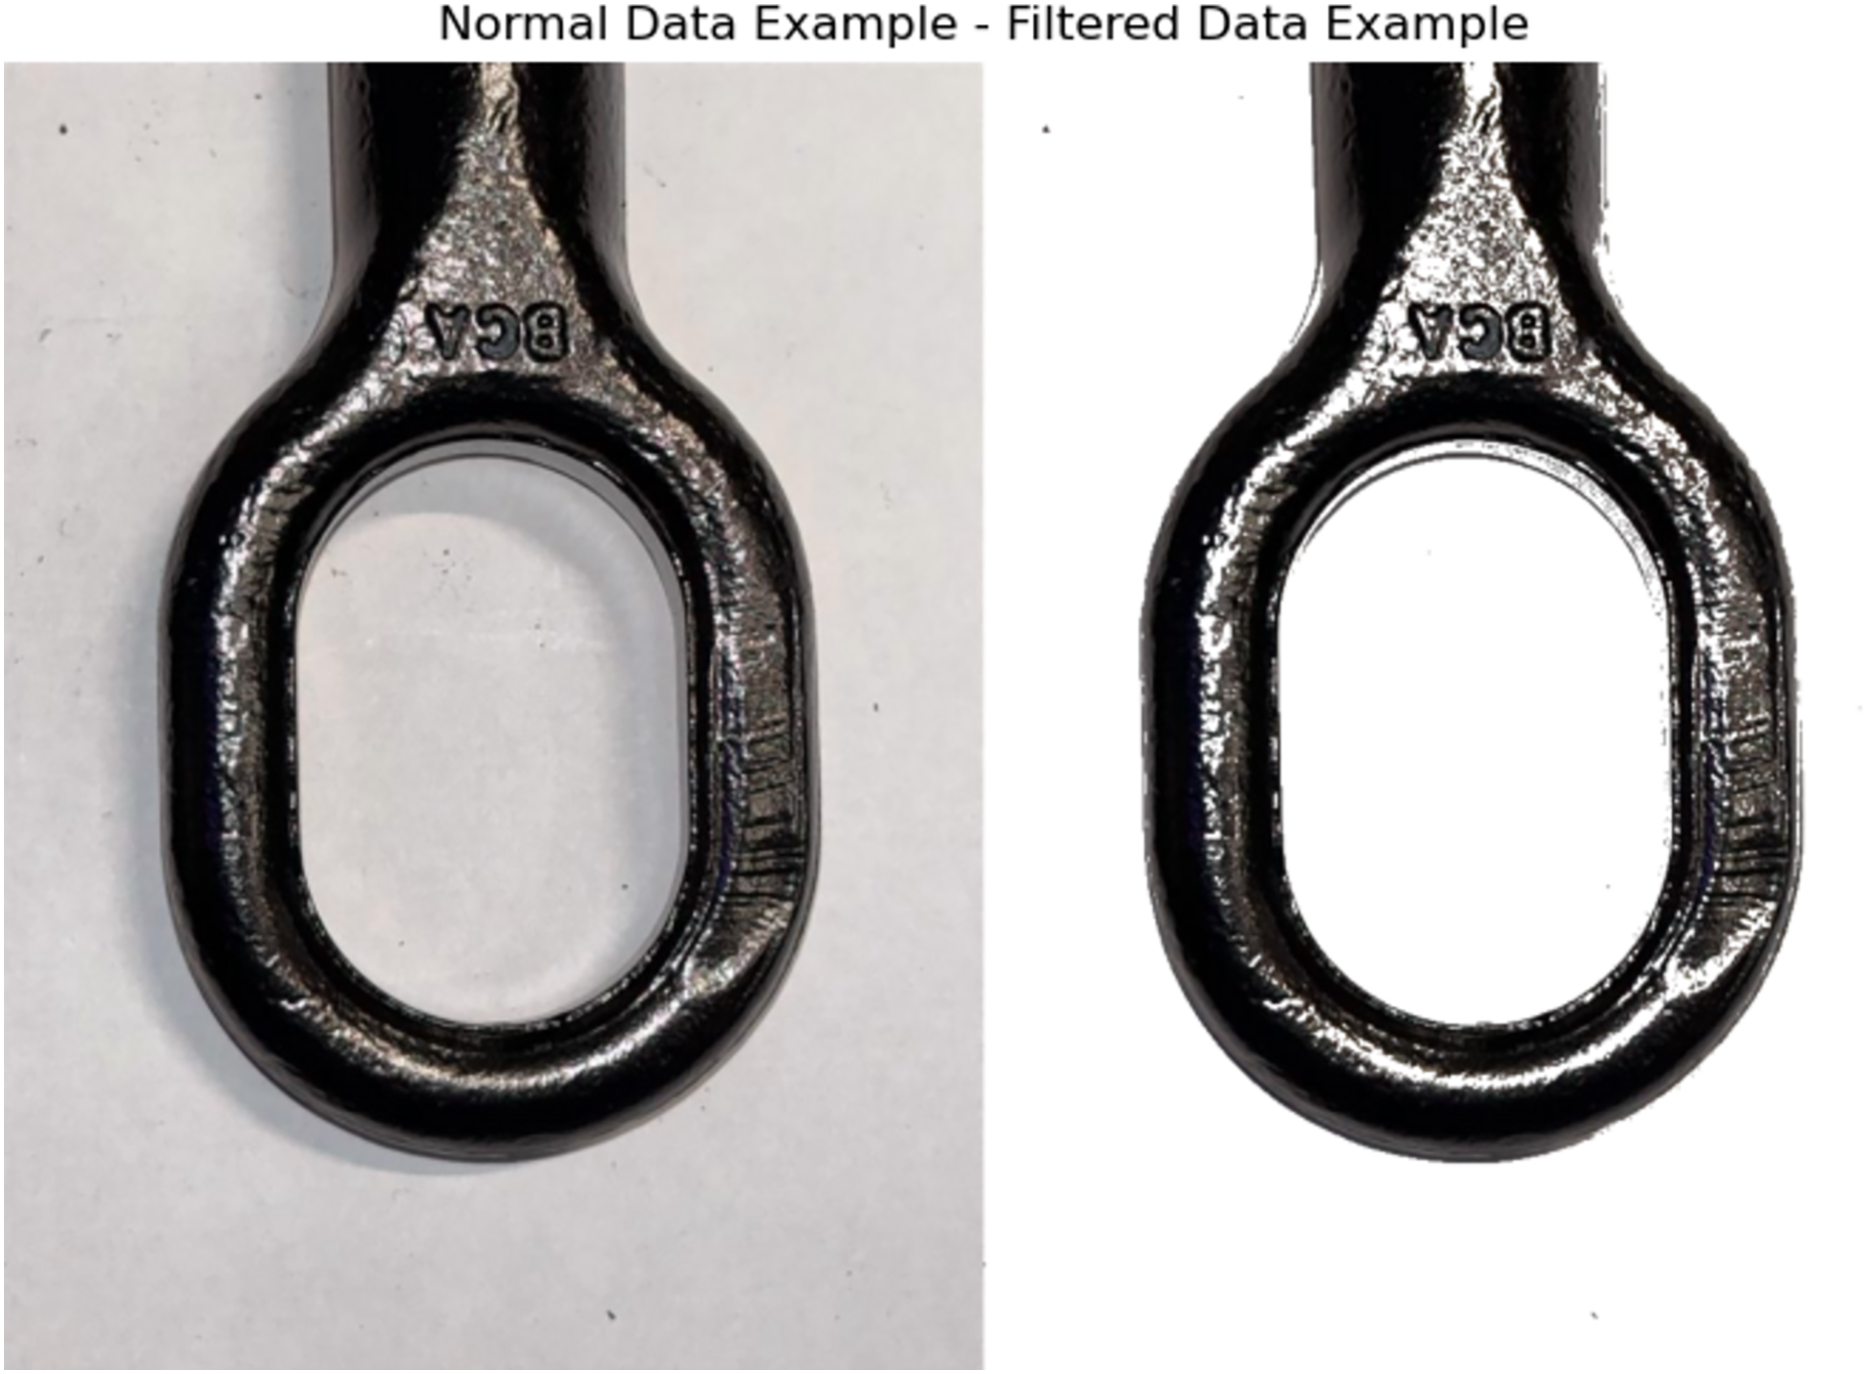
As a preprocessing step, images corresponding to the five classes obtained from the production area were filtered to remove visual distortions, thereby enhancing the model’s learning process. To obtain the sample shown in Fig. 2, Color Space Conversion and Color Masking techniques were applied. First, the images were converted from the BGR color space to the HSV (Hue–Saturation–Value) color space. Then, a specific color range was defined, and pixels within this range were selected to create a binary mask. All pixels outside the targeted color range were replaced with a white background to complete the masking process. This procedure made the object of interest more prominent, reduced noise effects, and produced clearer data, ultimately improving classification performance.
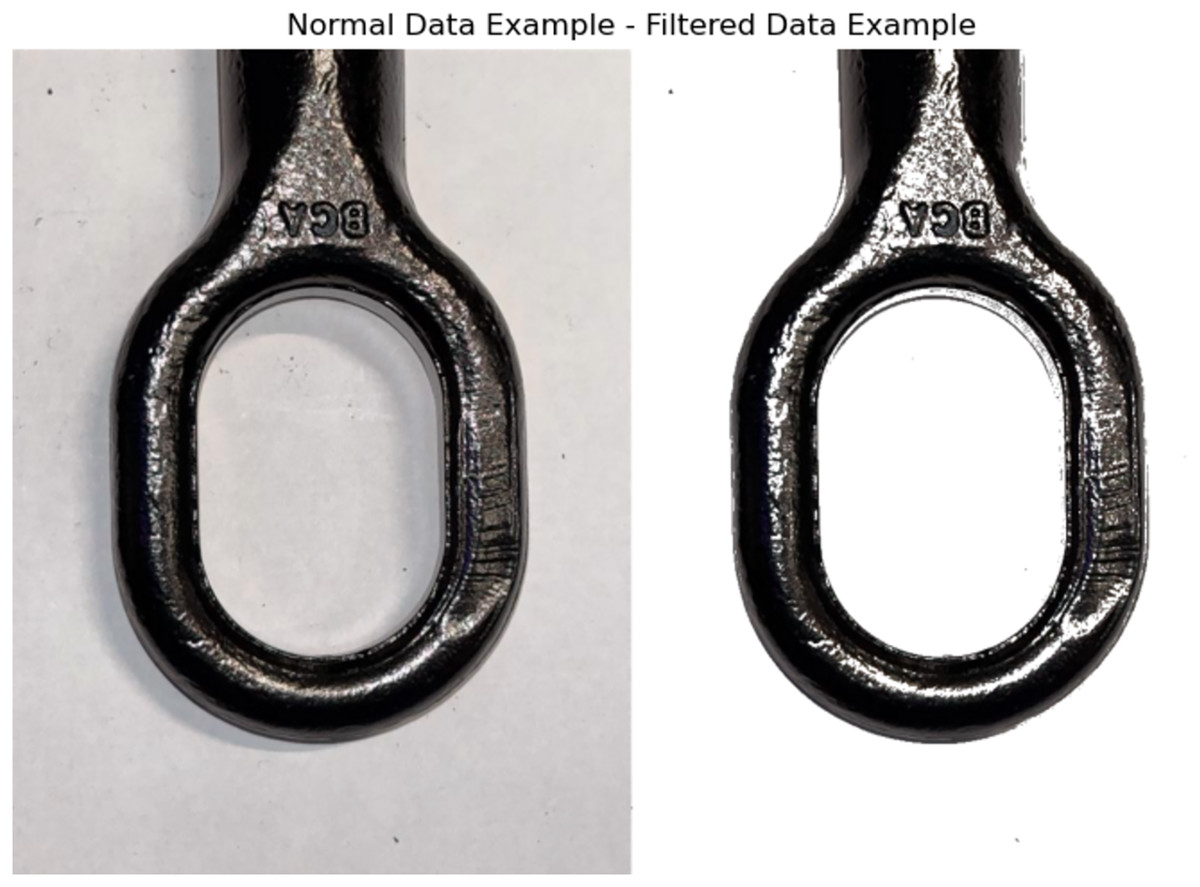
Figure 2: Normal and filtered data example.
Deep learning models
In this study, deep learning models are used to detect various defects in tow hooks. In the following, a description of the models used for the detection of these defects will be given. These models play an important role in classifying defective products by extracting meaningful features from images.
During model training, a batch size of 16 was selected to enable more efficient processing of the training data and to optimize memory usage. A learning rate of 0.001 was employed, allowing the model weights to be updated gradually, thereby ensuring both rapid and stable learning. The Cross-Entropy Loss function, commonly used in multi-class classification problems and based on class probabilities, was adopted as the loss metric. The Adam optimizer was chosen for its adaptive learning rate, which facilitates faster convergence and a more stable training process. Finally, the softmax activation function was applied in the output layer to calculate class probabilities and perform multi-class classification.
ResNet
In this study, ResNet18 and ResNet34 architectures were used. These models were restructured as pre-trained networks using the transfer learning method. This aimed to achieve high accuracy rates in a shorter time. The model’s fully connected layer was reorganized to fit the five classes defined in the study. To reduce the risk of overfitting, a 30% dropout was applied before this layer, thereby increasing the model’s generalization ability. The final layer was converted into a five-output classification layer.
The training process was initially planned for 50 epochs; an early stopping mechanism was used to minimize the risk of overfitting and maximize the model’s generalization ability. This mechanism was configured to automatically terminate the training process if the loss on the validation set did not improve over five consecutive epochs. This strategy ensured that the model also performed optimally on the test data. Additionally, the model was trained and tested multiple times using the five-fold Stratified K-Fold cross-validation technique, thereby minimizing the influence of random data splits on performance. Stratified K-Fold preserves the original class distribution within each fold, providing more reliable performance measurements, particularly in cases where the dataset is imbalanced. Due to the limited dataset size, the number of folds was set to five, ensuring a sufficient number of validation samples in each fold and allowing the model’s generalization capability to be assessed more reliably.
Model performance was continuously monitored at the end of each epoch by recording training and validation accuracy and loss values. Classification performance on the test set was evaluated not only in terms of overall accuracy but also using detailed metrics—precision, recall, and F1-score—to assess the model’s sensitivity and reliability for each defect class. Calculating these metrics on a per-class basis allowed for the identification of misclassifications. Furthermore, confusion matrices were utilized to perform a more in-depth analysis of classification errors and to visualize which classes were most frequently confused with one another.
MobileNet
In this study, the MobileNetV2 and MobileNetV3-Large models were employed using transfer learning. The feature extraction layers of the pre-trained models were frozen, allowing learning to occur only in the customized layers. A GlobalAveragePooling2D layer was added after the model outputs. This layer computes the average value for each channel in the feature maps, compactly summarizing information across the entire image and reducing its dimensionality.
Subsequently, fully connected (Dense) layers with varying numbers of neurons were added to increase the model’s learning capacity and enable it to capture more complex relationships. A Dropout layer was also integrated between these Dense layers, randomly deactivating certain neuron connections, thereby significantly reducing the risk of overfitting. Finally, an output layer was added to predict the five classes, with the model output structured to generate probabilities corresponding to each class.
The training process was initially planned for 50 epochs. However, to optimize training duration and prevent overfitting, an early stopping mechanism was implemented. This mechanism automatically terminated training if the validation loss did not improve over five consecutive epochs, ensuring that the model achieved the best generalization performance on the test data. During training, accuracy and loss values were meticulously recorded at the end of each epoch for both the training and validation sets, allowing continuous monitoring of the learning process.
Moreover, precision, recall, and F1-score metrics were employed to analyze the prediction accuracy and error patterns for each defect class in detail. Confusion matrices were used to visualize the distribution of classification errors and identify which classes were most frequently misclassified.
VGG
In this study, the VGG19 deep learning architecture was employed for multi-class classification of tow hook defects. Transfer learning was adopted to leverage the model’s strong feature extraction capabilities and facilitate effective learning on the dataset. The base layers of the model were frozen to preserve pre-learned features, while training was conducted on the additional layers. A GlobalAveragePooling2D layer and fully connected (Dense) layers with varying numbers of neurons were added to the model output. This design aimed to enable the model to learn more complex features and enhance classification performance. Additionally, a Dropout layer with a rate of 0.3 was integrated to randomly deactivate neurons during training, effectively reducing the risk of overfitting by preventing the model from becoming overly dependent on specific features. The final layer was configured with a softmax activation function to produce class probabilities for the five defect categories.
The model was initially trained for 50 epochs, with an early stopping mechanism implemented to terminate training if the validation loss did not improve over a specified number of epochs. This approach ensured optimal generalization performance on the test data while avoiding unnecessarily prolonged training.
After training, the model’s performance, reliability, and generalization ability were evaluated on a test set completely independent of the training and validation data. The evaluation considered not only overall accuracy and loss but also employed precision, recall, and F1-score metrics to analyze prediction accuracy and error patterns for each defect class in detail. Additionally, a confusion matrix was used to perform a more in-depth analysis of misclassifications.
CNN
In this study, a custom CNN model was designed and employed. The model architecture consisted of five Conv2D layers with increasing depth. The first convolutional layer began with 16 filters, and the number of filters was progressively increased in subsequent layers to 32, 64, 128, and 256. This approach allows the model to learn more general features in the initial layers and capture increasingly abstract and complex feature representations in deeper layers. Each convolutional layer was followed by a BatchNormalization layer to stabilize the learning process and accelerate convergence. Additionally, MaxPooling2D layers were applied after each convolutional layer to reduce spatial dimensions and optimize the model’s learning capacity.
Following the convolutional and pooling layers, the resulting 2D feature maps were flattened into a 1D vector via a Flatten layer. This vector was then fed into a fully connected (Dense) layer to make classification decisions. A Dense layer with 128 neurons was added to enable the analysis of complex relationships among the learned features. Finally, a five-neuron output layer with a softmax activation function was included to predict the probabilities for the five defect classes in tow hooks, enabling multi-class classification.
During the 100-epoch training process, a ModelCheckpoint callback was used to automatically save the model weights corresponding to the epoch with the lowest validation loss, ensuring that the best-performing model was retained.
Model performance was evaluated using accuracy and loss metrics. Additionally, to assess performance in more detail, class-wise precision, recall, and F1-score metrics were calculated. These metrics provide a detailed understanding of the model’s predictive accuracy for each class and highlight which classes are more frequently misclassified. Furthermore, confusion matrices were used to visualize the distribution of misclassification errors across classes.
Experimental studies and results
In this section, the performance of the models used will be evaluated and the details of the results will be discussed. The accuracy of the model and its success on each class will be compared. The results obtained will be supported and interpreted with visualizations.
Table 2 shows the parameters used in the models. These parameters include basic adjustments that affect the training process of each model. Careful tuning of these parameters plays an important role in improving the overall success of the model. The data set was split into three different distribution ratios before the training process. Each model started the training process with these data distributions.
| Parameter | Value |
|---|---|
| Train | 60%, 70%, 80% |
| Validation | 10%, 15%, 20% |
| Test | 10%, 15%, 20% |
| Batch size | 16 |
| Activation function | Softmax |
| Optimiser | Adam |
| Learning rate | 0.001 |
| Loss function | Cross entropy loss |
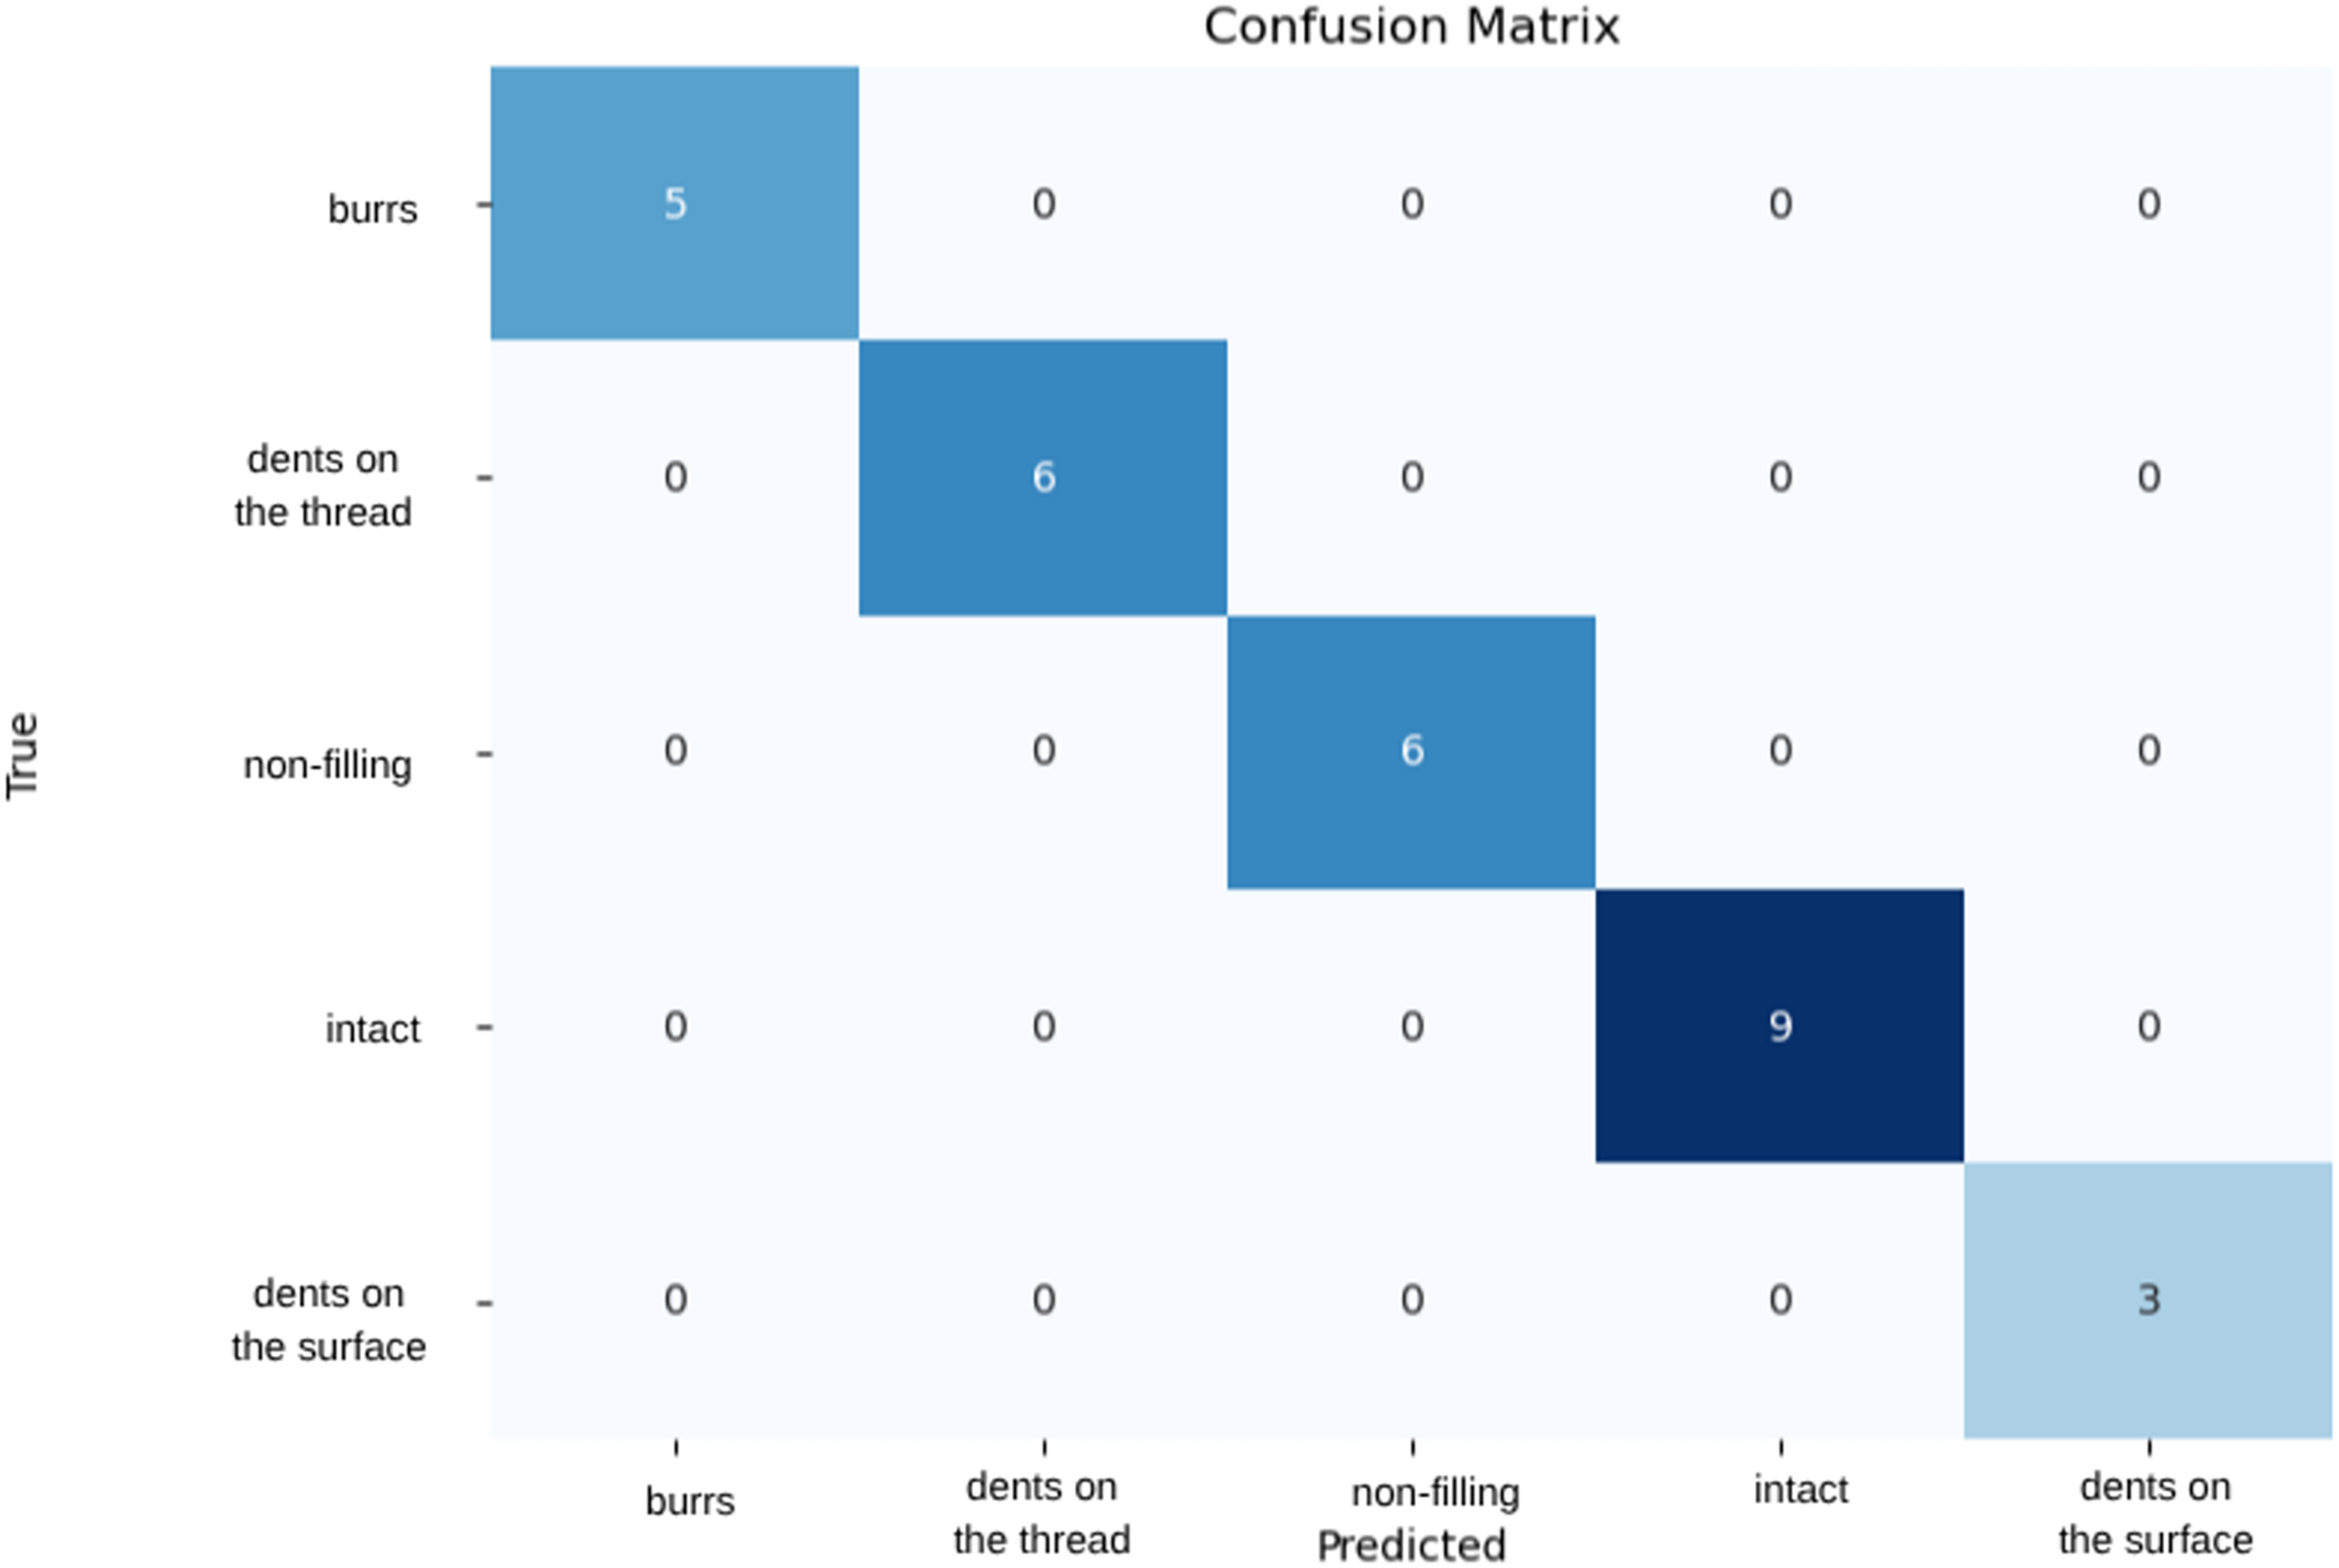
In this study, Resnet18 and Resnet34 models were used and trained on five classes. Training with different data ratios allowed us to compare the performance of the model on each data set. The training and validation sets were used to optimize the learning capacity of the model, while the test set was used to evaluate the accuracy of the trained model on previously unseen data. Among the models, ResNet34 demonstrated the best performance, achieving 100% accuracy. When evaluated on a dataset split with 80% training, 10% validation, and 10% test data, the model correctly classified all samples. As a result of five-fold Stratified K-Fold cross-validation, the average accuracy was calculated as 0.98 with a standard deviation of 0.02. These results indicate that the model performs consistently across different data subsets and exhibits a low risk of overfitting. The confusion matrix shown in Fig. 3 confirms that the model accurately classified all samples. Additionally, on the validation data, the ResNet34 model achieved precision, recall, and F1-score values of 1.00 across all classes, demonstrating its ability to classify samples with high reliability and strong generalization performance.
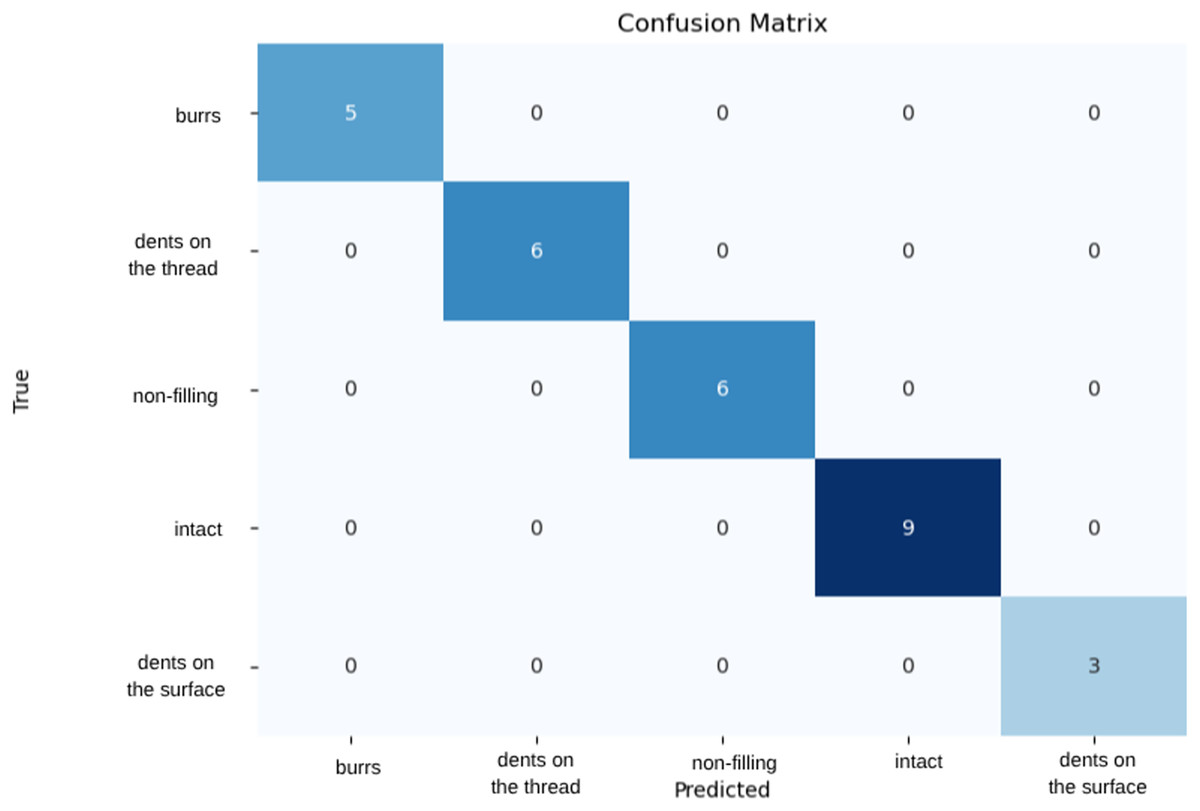
Figure 3: Confusion matrix of ResNet34 model.
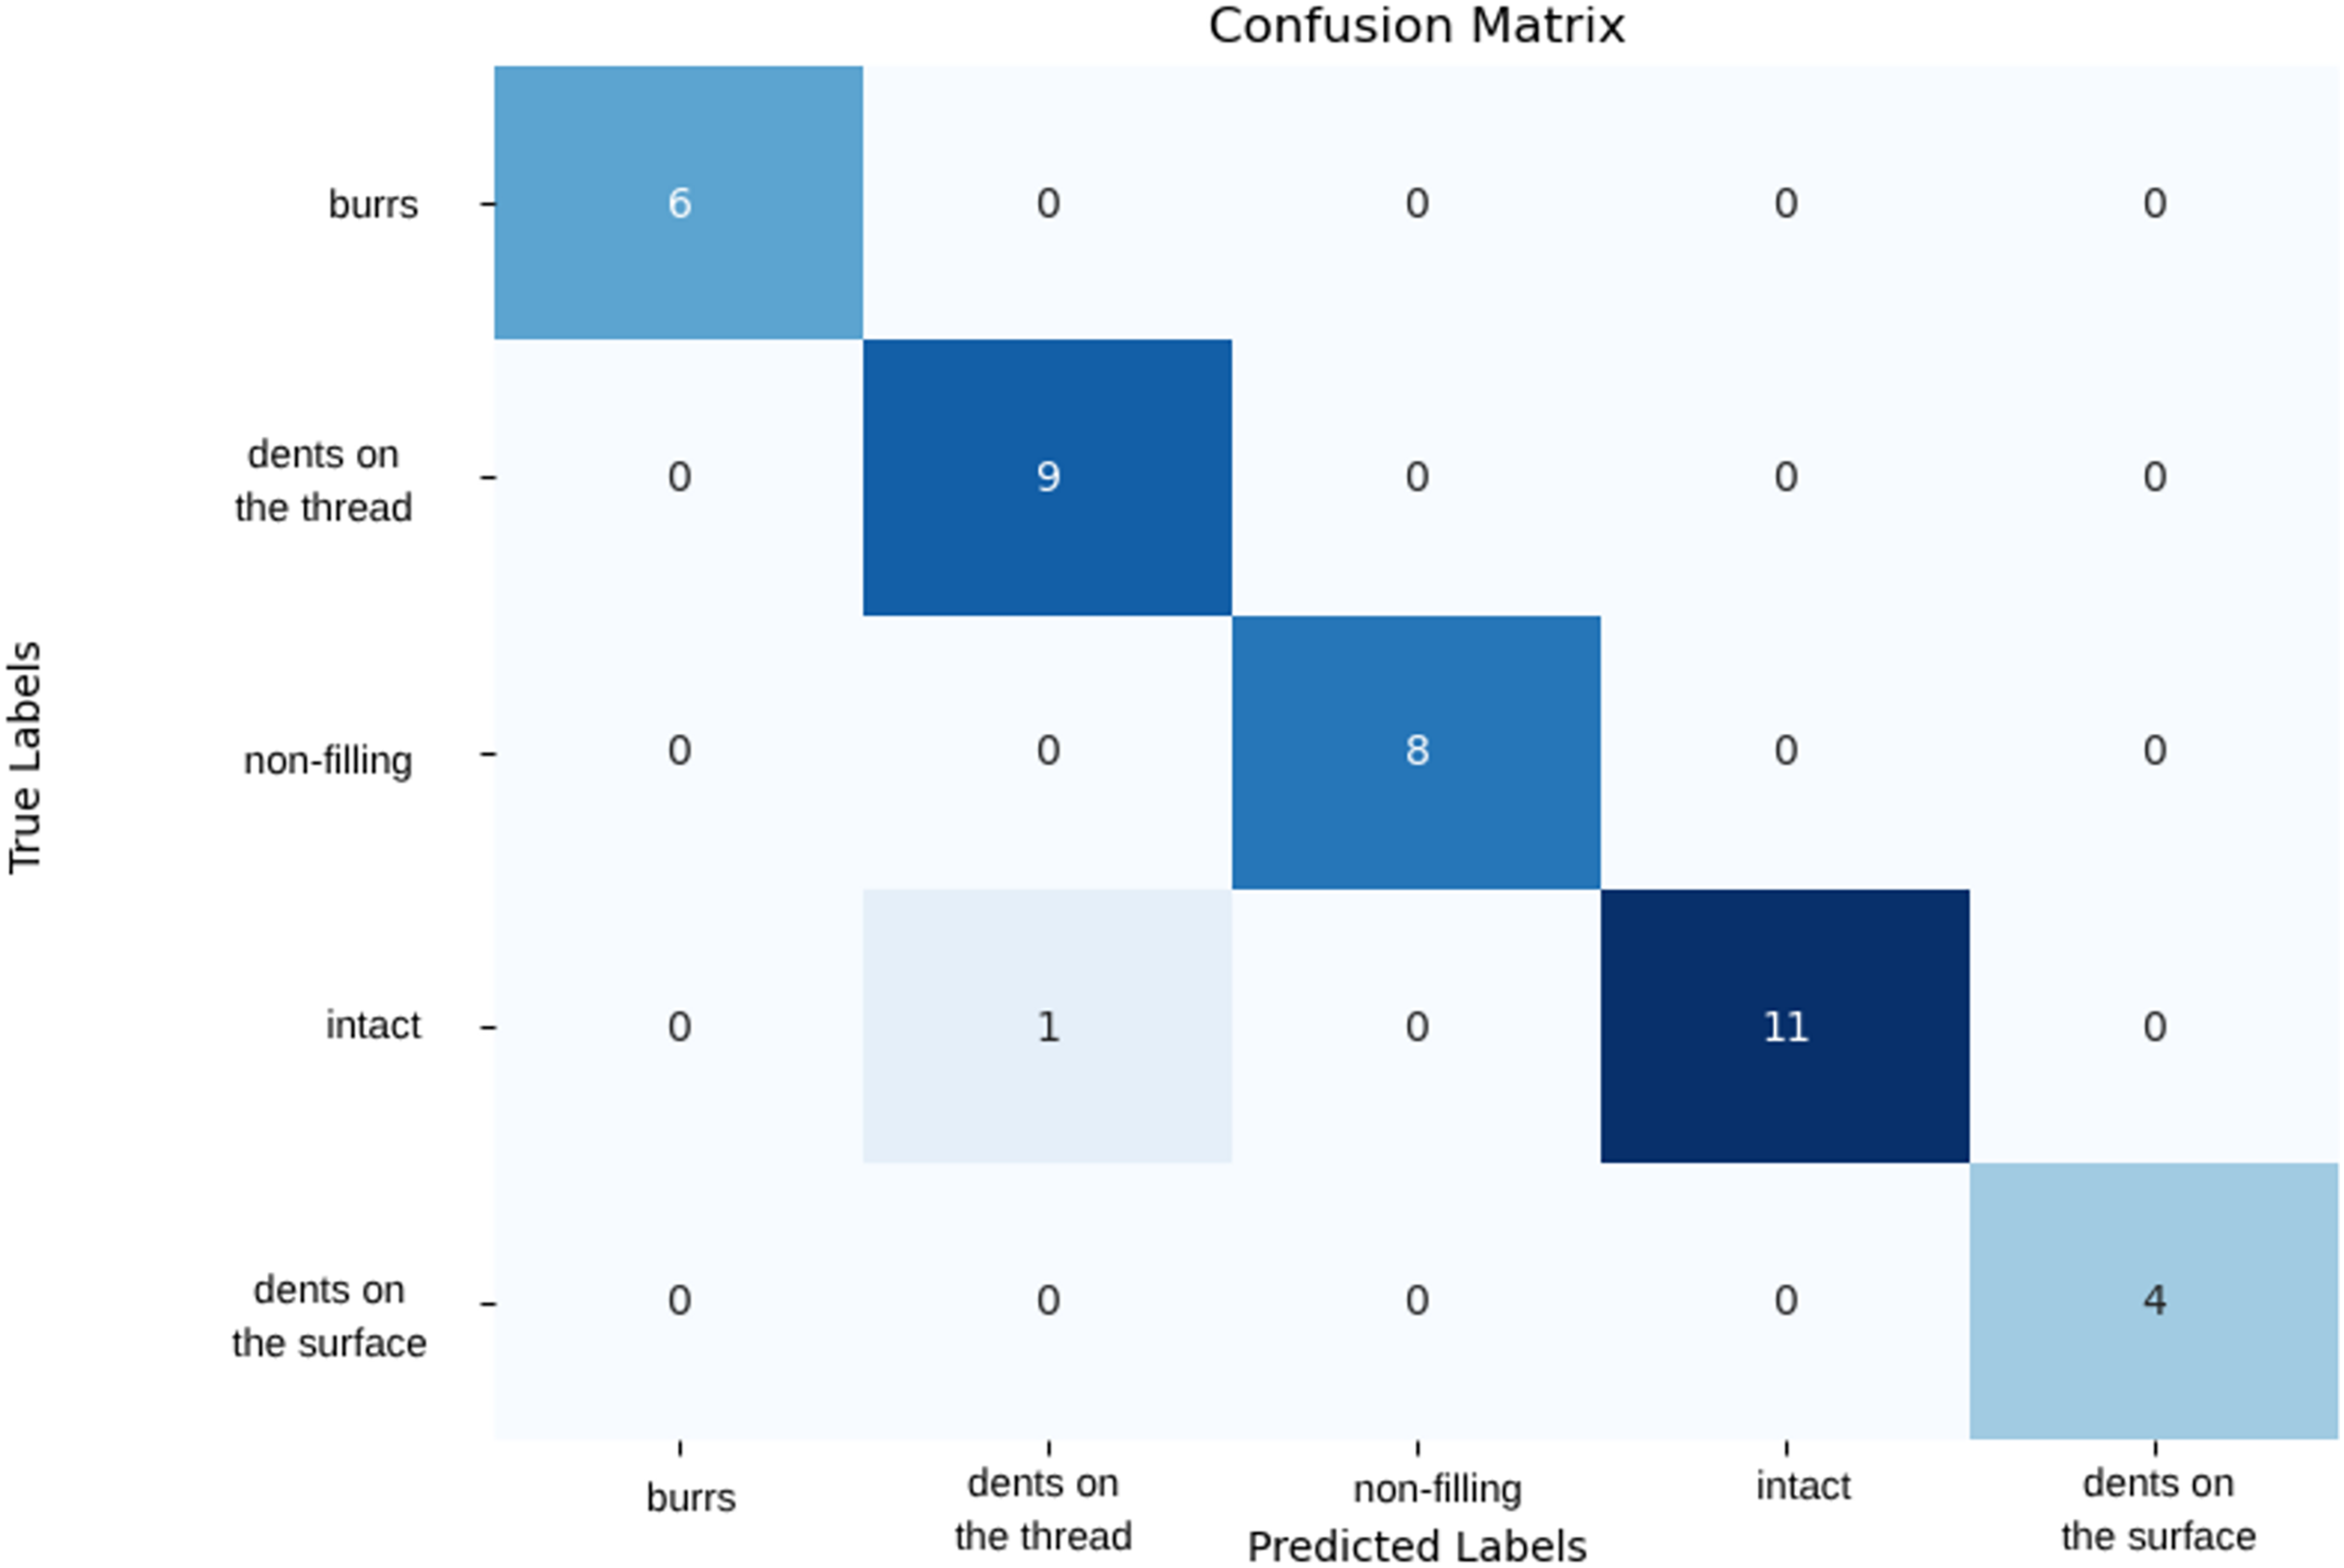
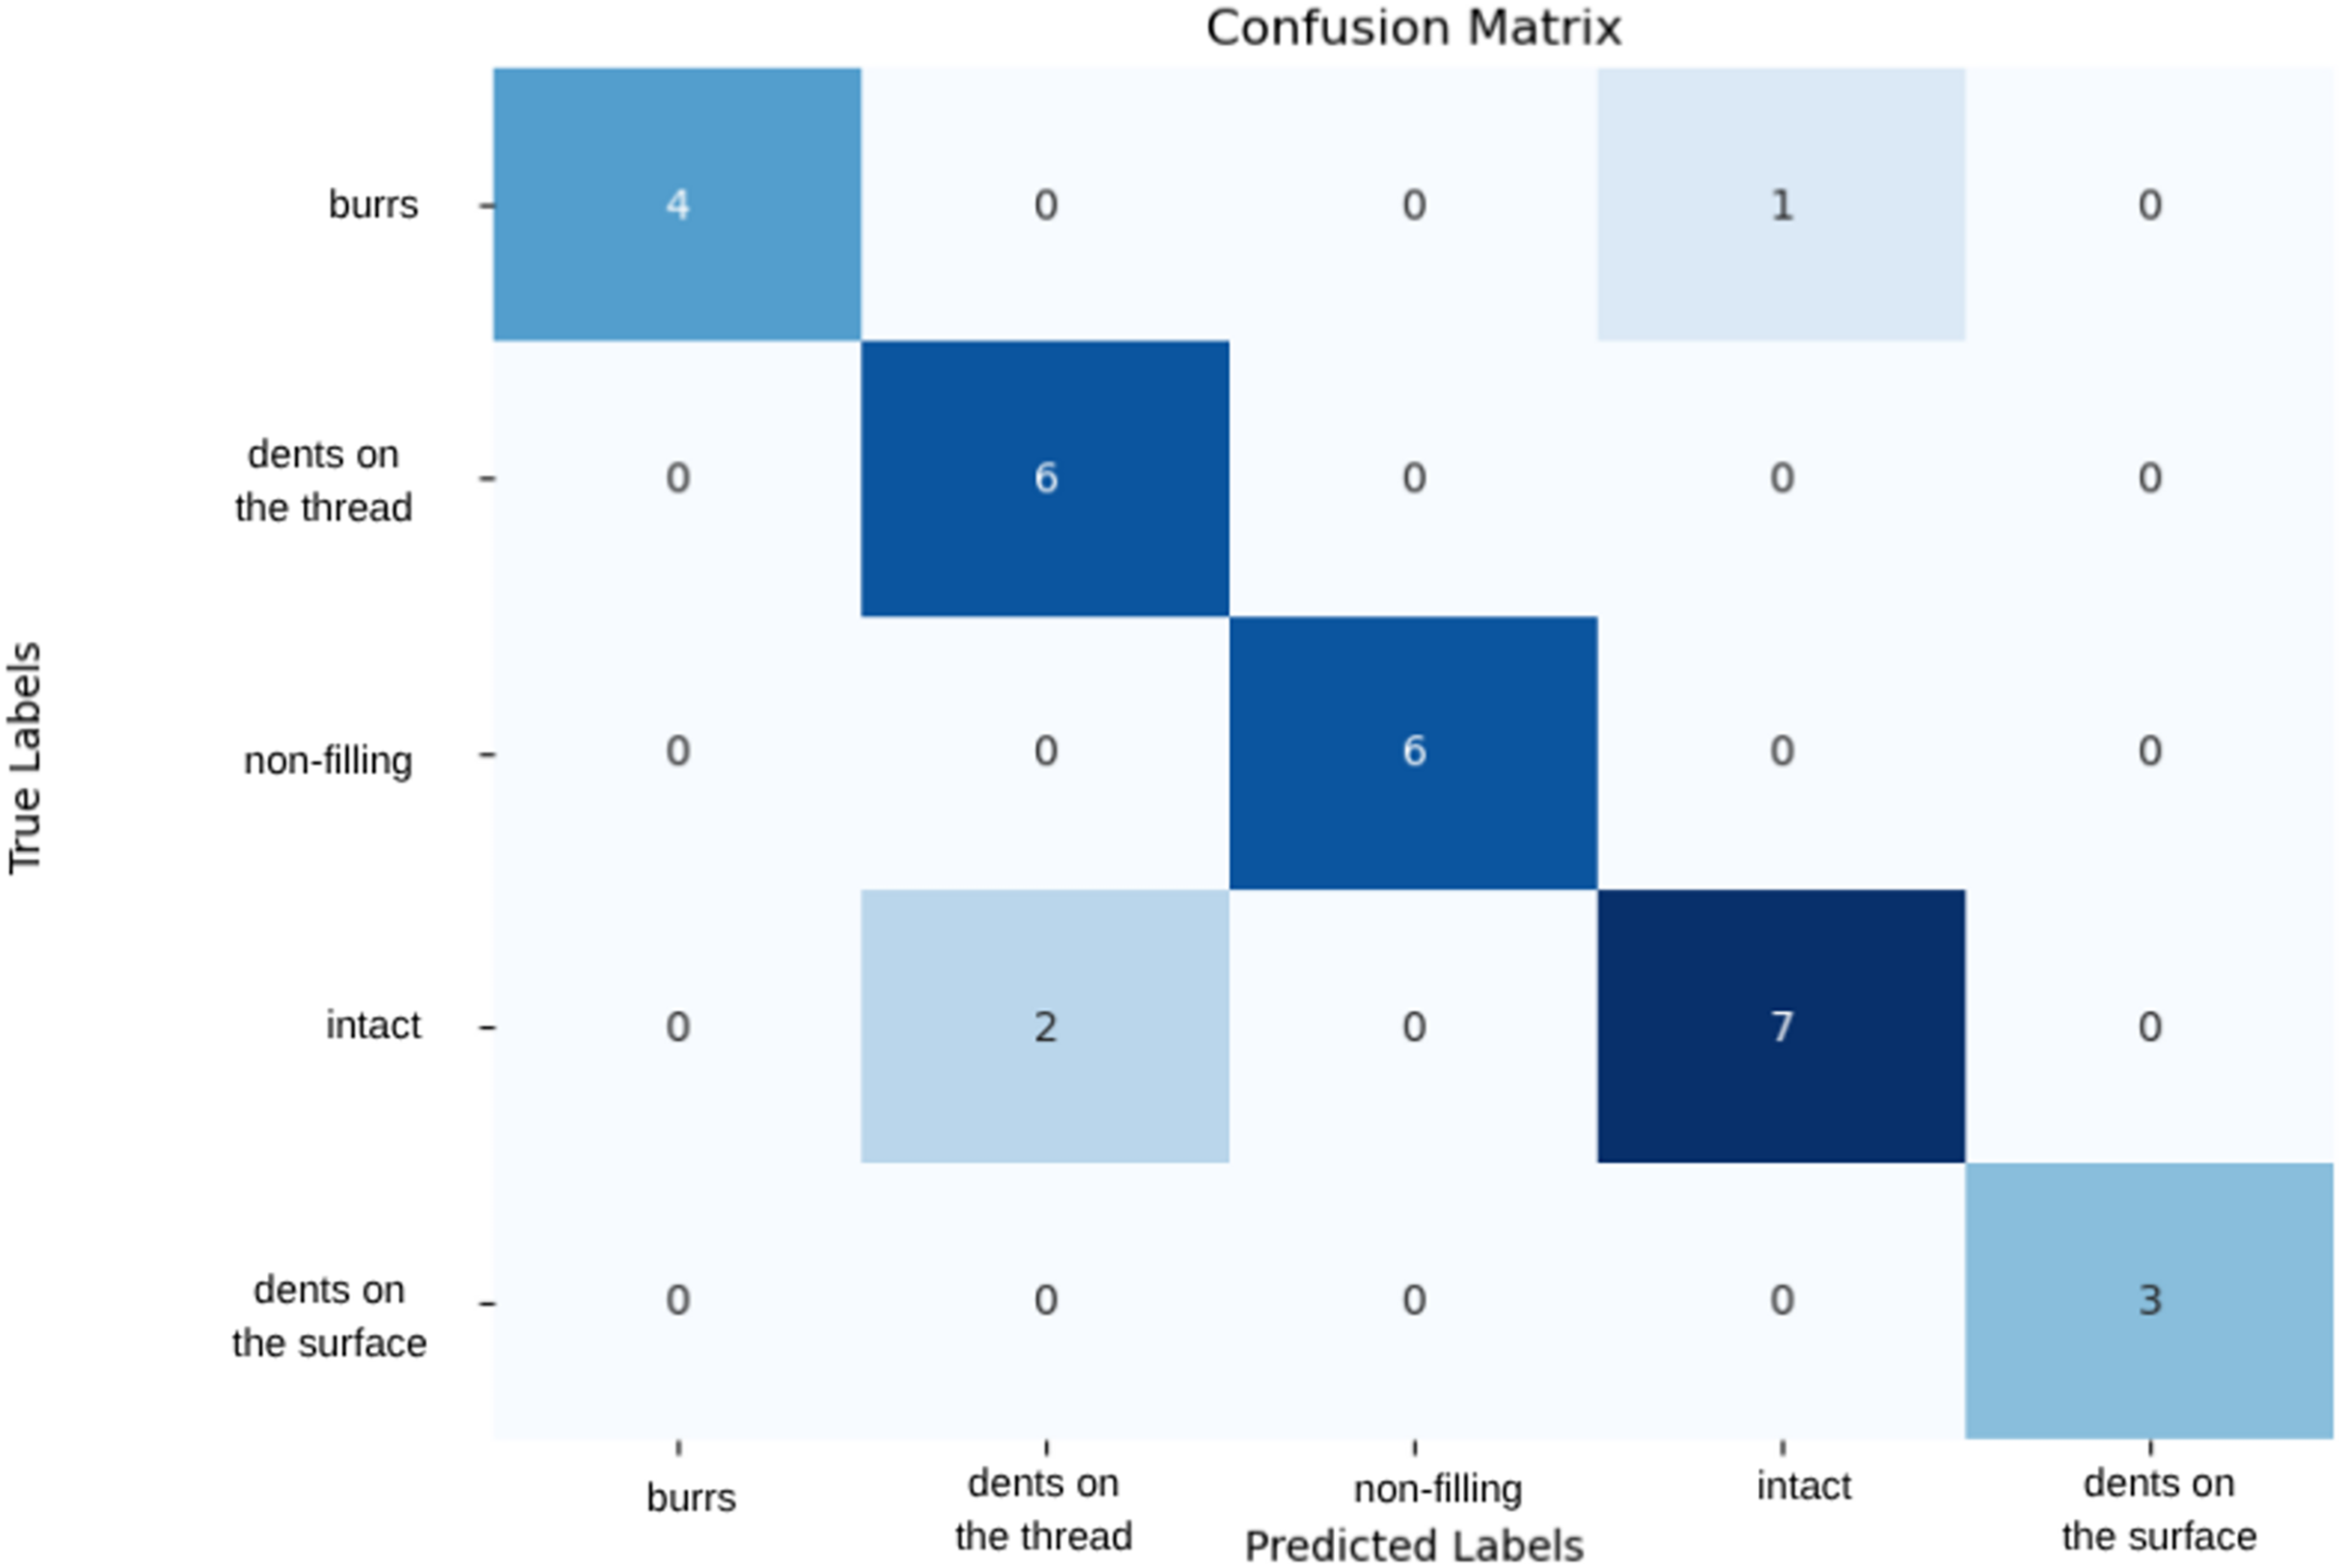
Within the scope of the study, MobileNetV2 and MobileNetV3-Large models were used for training. The performances of the models trained with different data distribution were compared and accuracy and loss metrics were used to evaluate the performances. The MobileNetV2 model performed the best with 96% accuracy and 13% loss when trained with 70% training, 15% validation and 15% testing data. Class-wise evaluation showed that MobileNetV2 achieved precision, recall, and F1-score values of 1.00 for the ‘Burrs,’ ‘Non-filling,’ and ‘Dents on the Surface’ classes. For the ‘Dents on the Thread’ class, precision was 0.90, recall 1.00, and F1-score 0.95. In the ‘Intact’ class, precision, recall, and F1-score were calculated as 1.00, 0.92, and 0.96, respectively. Figure 4 visualizes the model’s performance using a confusion matrix. The evaluation indicates that all classes were largely correctly classified, with only one misclassification observed in the ‘Intact’ class. These results demonstrate that the model exhibits generally high performance and maintains consistent discriminative capability across classes.
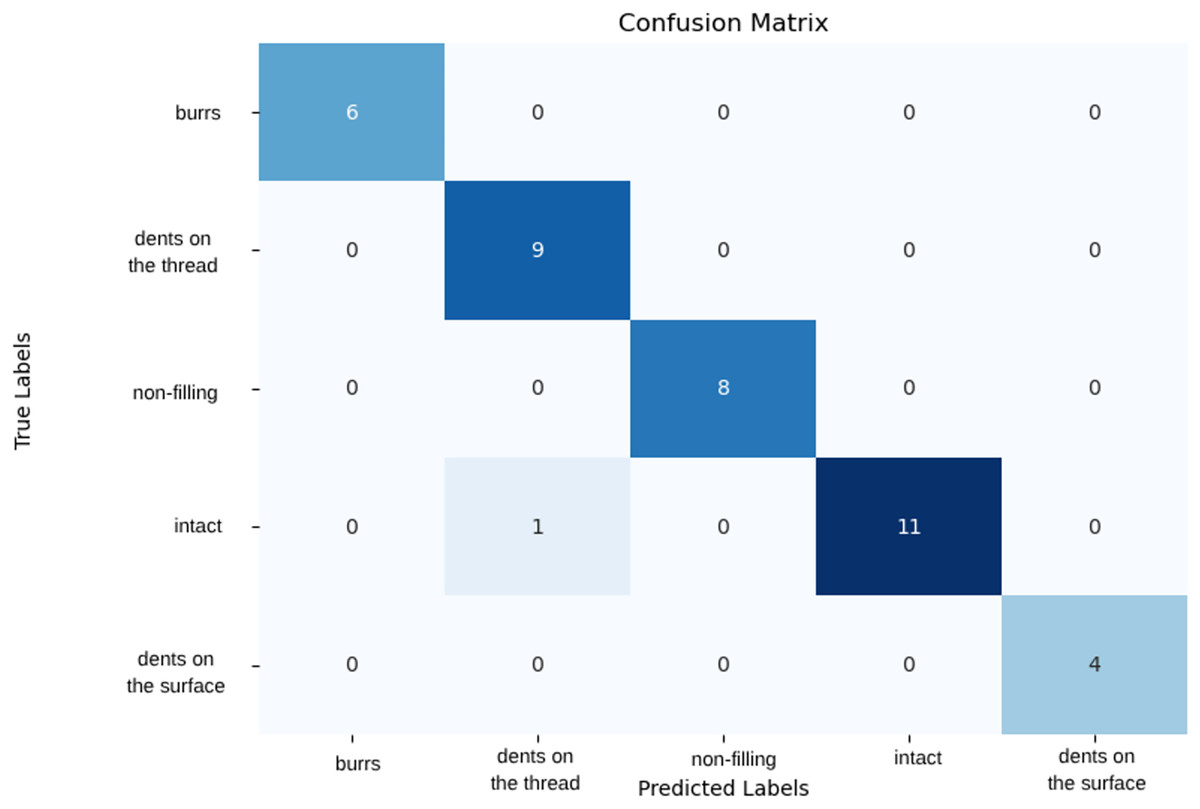
Figure 4: Confusion matrix of MobileNetV2 model.
Trained with various data set distributions, the Vgg19 model showed the highest performance when divided into 15% test set, 15% validation set and 70% training set. This distribution allowed the model to test its generalization ability in the best way and minimized the risk of overfitting by showing high success on previously unseen data The model demonstrated high performance with 90% accuracy and 35% loss under this data split. The VGG19 model achieved precision, recall, and F1-score values of 1.00 for the “Dents on the thread,” “Non-filling,” and “Dents on the surface” classes. However, for the “Burr” class, precision was 0.71 and F1-score 0.83, while for the “Intact” class, recall was 0.78 and F1-score 0.88. Examination of the confusion matrix in Fig. 5 reveals that the model misclassified two samples from the “Intact” class as “Burr.” The validation metrics and confusion matrix results indicate that the model exhibits minor deviations in distinguishing classes for certain similar or rare samples. Overall, the model provides high accuracy and reliable classification across most classes, while the small errors in the “Burr” and “Intact” classes may be attributed to class similarity and the distribution of the dataset.

Figure 5: Confusion matrix of VGG19 model.
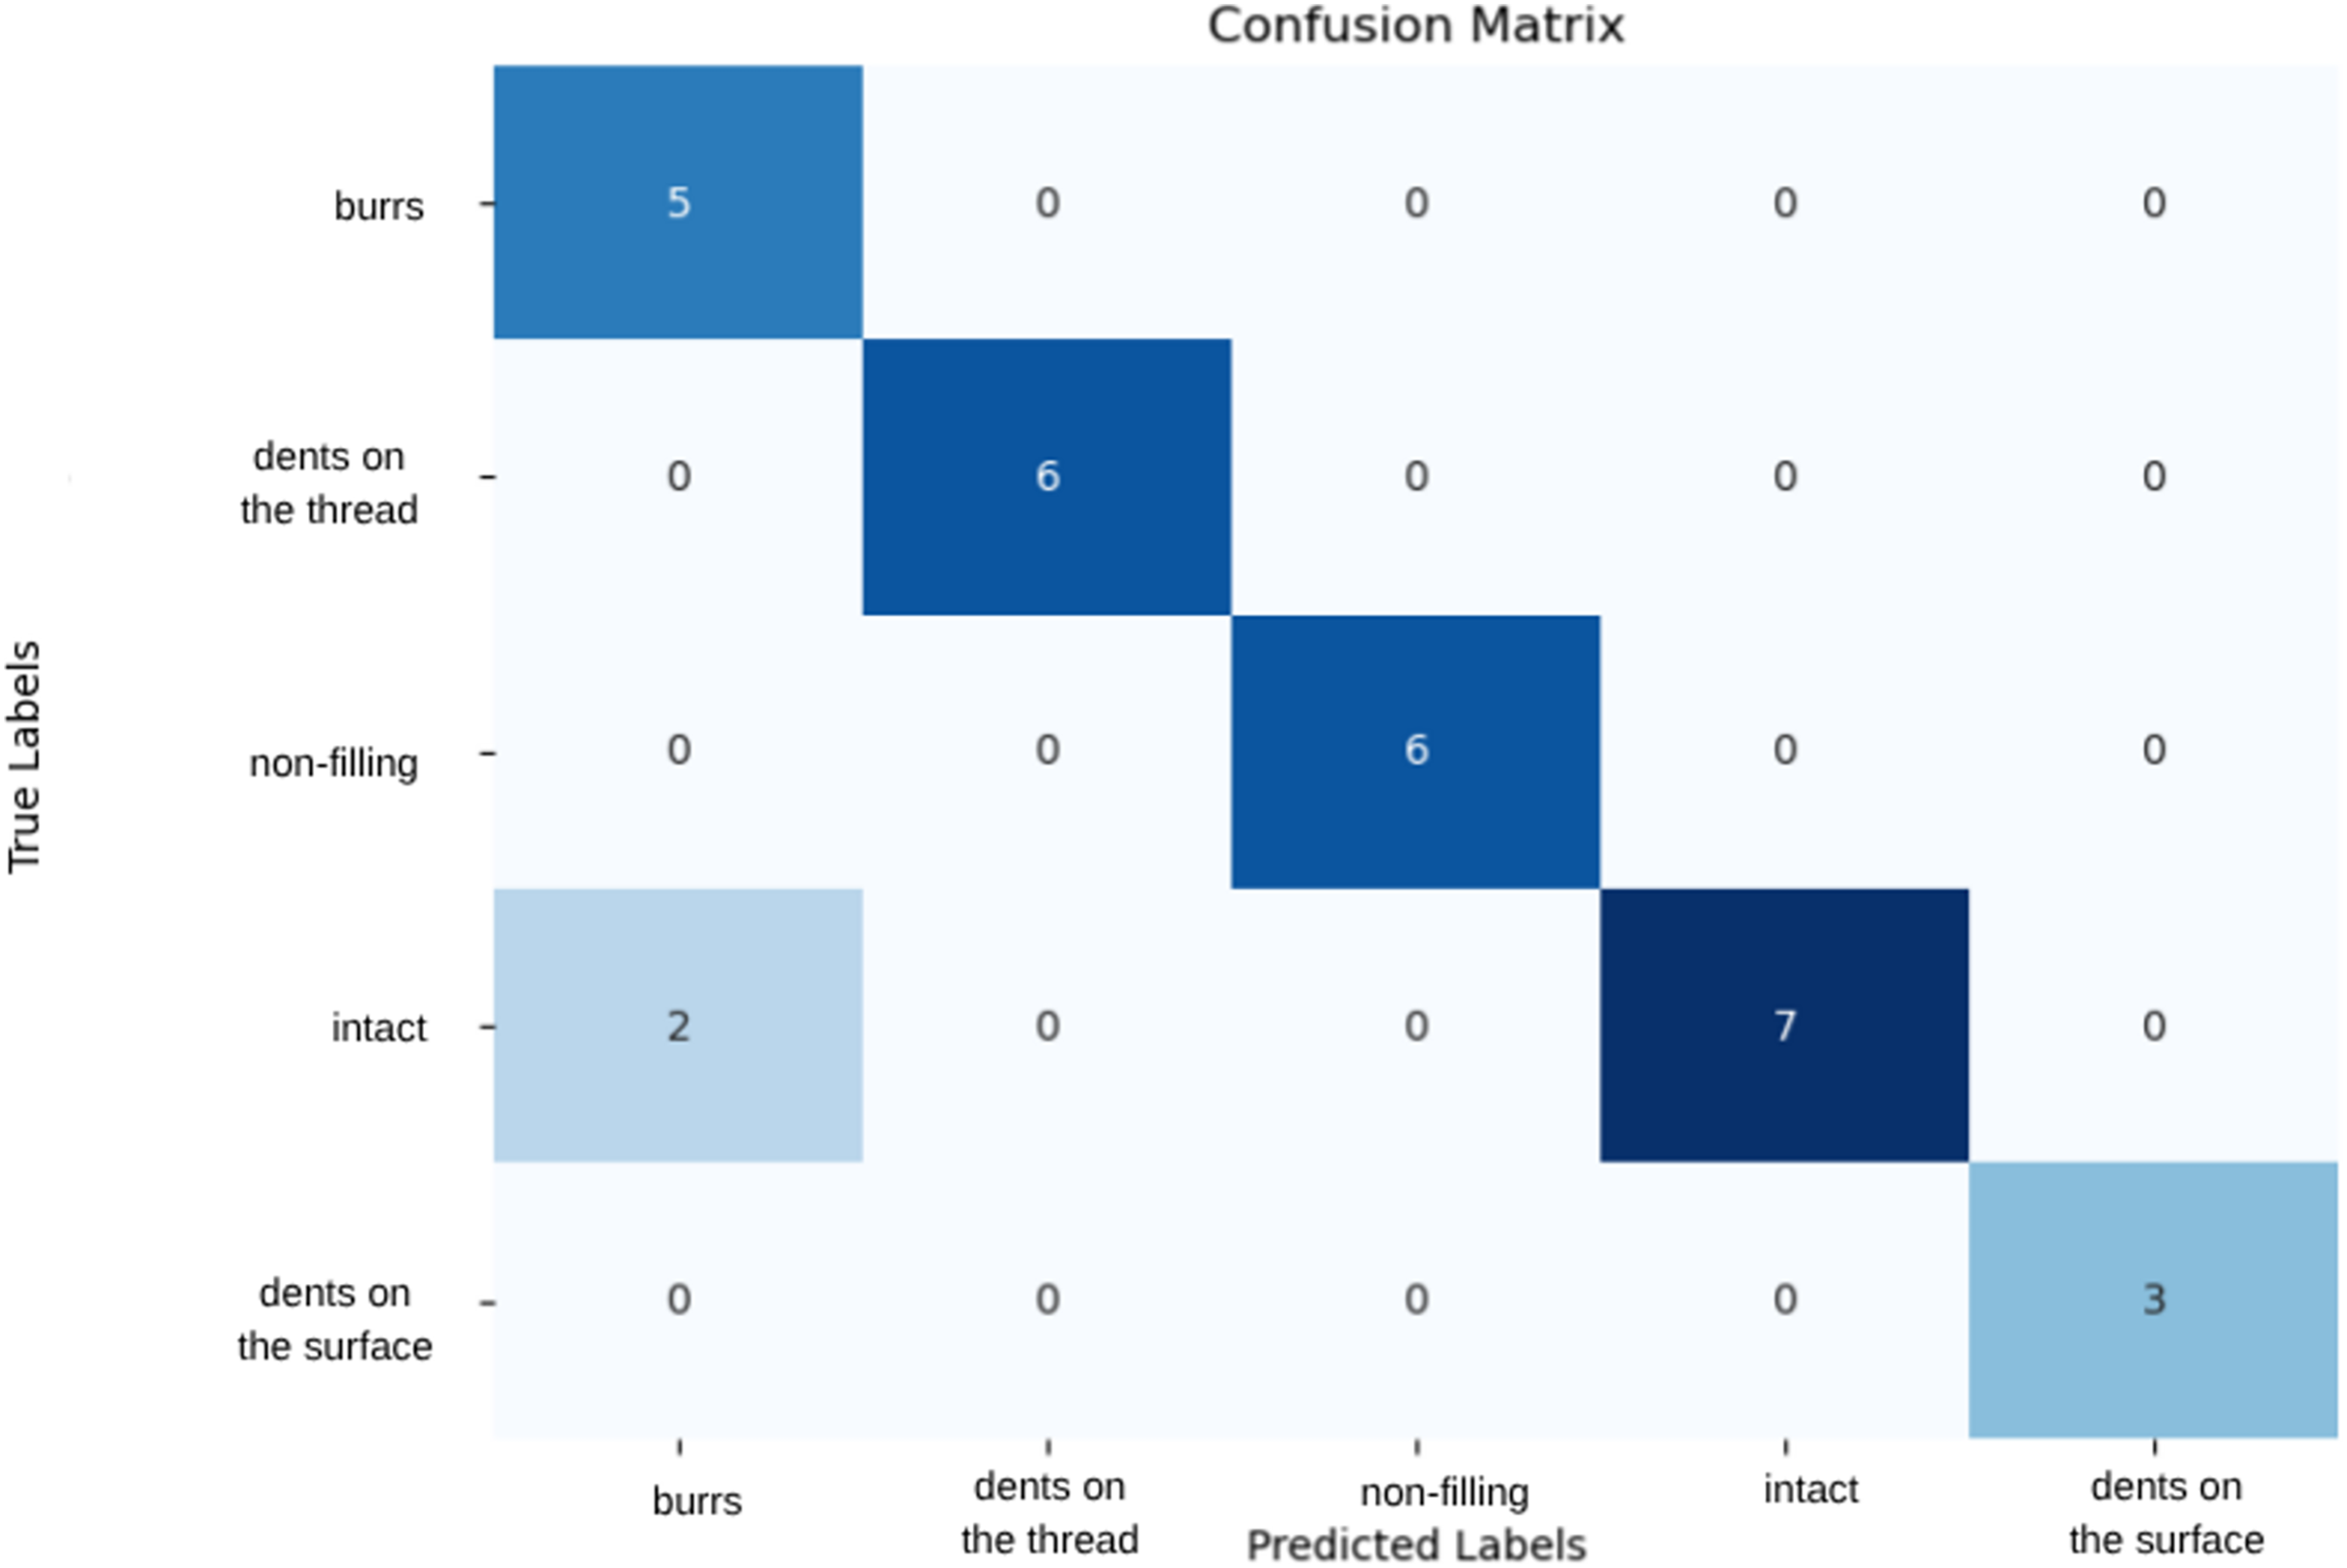
The latest model used in the study is a CNN model composed of various layers. The CNN model created from various layers showed the highest performance on 70% training set, 15% validation set and 15% test set. Using this dataset, it performed well with 93% accuracy and 48% loss. Class-based evaluations indicate that the model generally achieves high classification performance. In particular, all metrics being 1.00 for the “Non-filling” and “Dents on the surface” classes demonstrate that the model can perfectly recognize samples in these categories. For the “Burr” class, a recall of 0.80 and an F1-score of 0.89 indicate that some burr samples were misclassified, though the class is overall well distinguished. Similarly, for the “Dents on the thread” class, a precision of 0.75 and an F1-score of 0.86 suggest that the model may occasionally over- or under-classify some instances. In the “Intact” class, a recall of 0.78 and an F1-score of 0.82 show that some intact samples were confused with other classes, indicating limited deviation between classes for rare or visually similar examples. As illustrated in Fig. 6, the model misclassified one out of five burr samples as intact and two out of nine intact samples as dents on the thread. The relatively high loss rate implies that misclassifications can have a significant impact, highlighting the need for further model improvements.
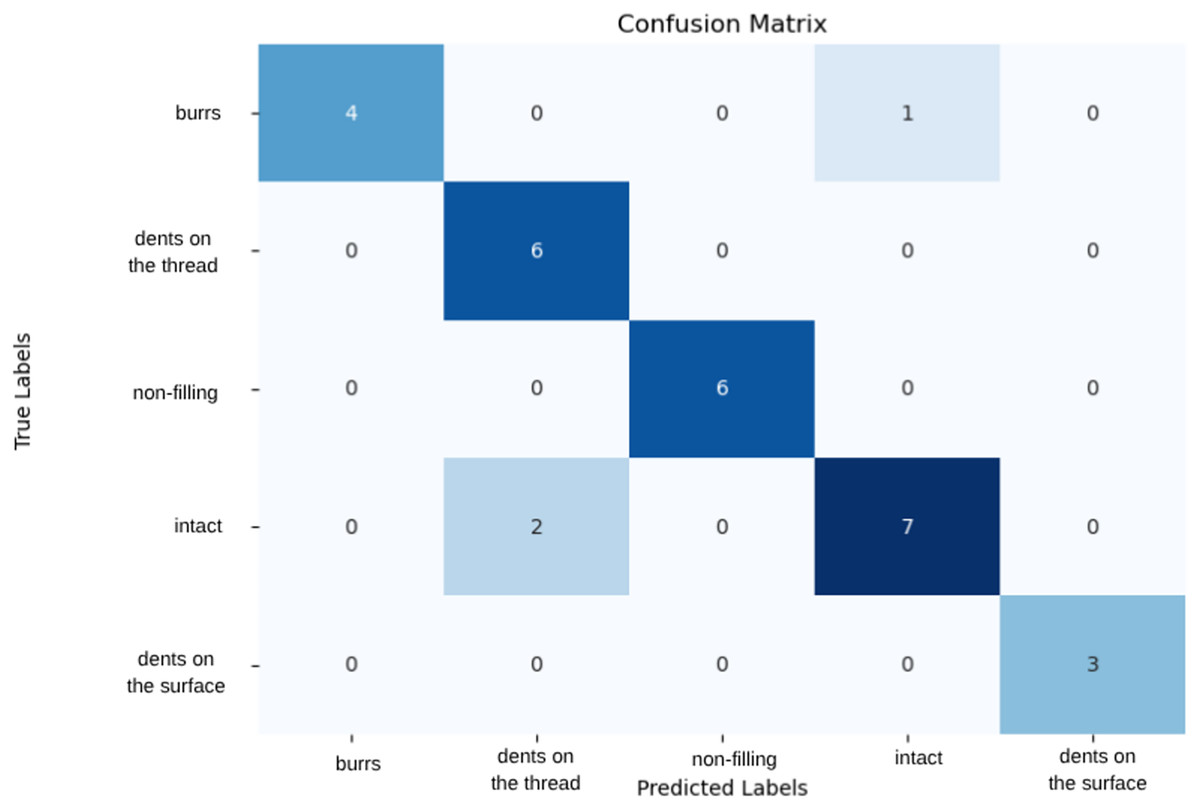
Figure 6: Confusion matrix of CNN model.
Looking at the models used in general, ResNet34 and MobileNetV2 models stand out with their very high performance. ResNet provides more efficient learning thanks to its residual connections, while MobileNet offers high performance with low computational power. Both models have different advantages and offer ideal solutions for different data sets and use cases.
The graphs in Fig. 7 show the variation of the accuracy values of each model during the training and validation process according to the number of epochs. The models were trained with 80% training, 10% validation and 10% test data. MobileNetV2 and ResNet34 have achieved good results in training and validation accuracy and are observed to be more generalizable models. Vgg19, on the other hand, was more stable in training but did not perform as well as ResNet34 in validation accuracy. CNN, on the other hand, showed a rapid increase in accuracy in training but lower accuracy in validation data, indicating that the model may be overfitting.
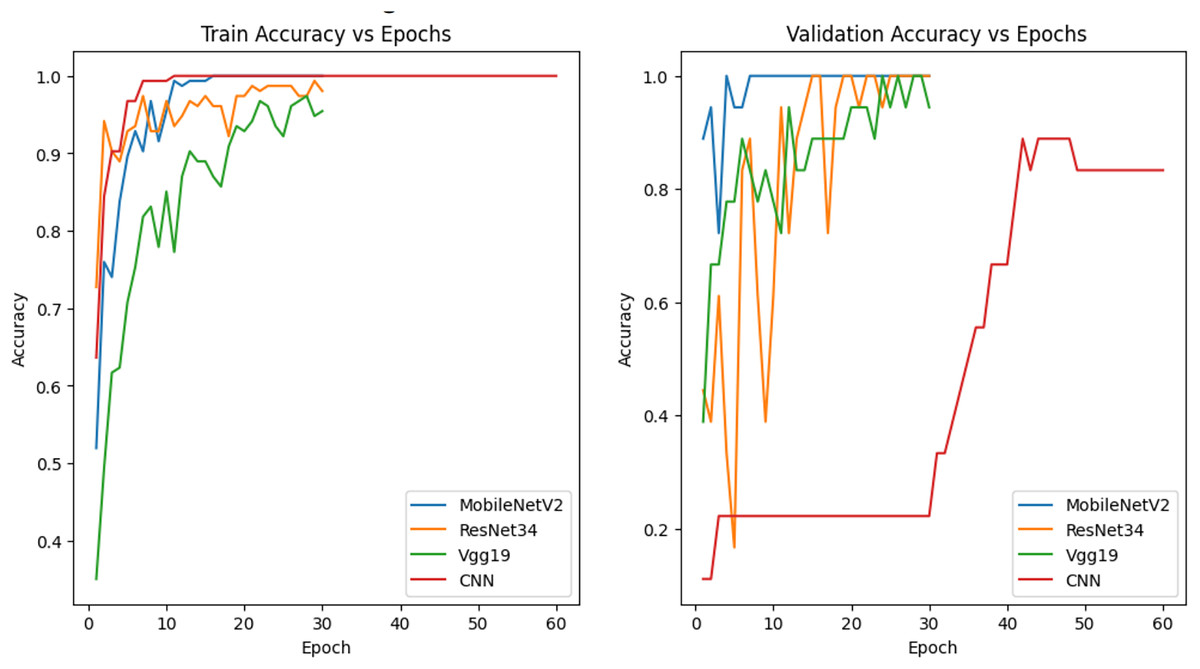
Figure 7: Accuracy graph of the model trained with 80% training data.
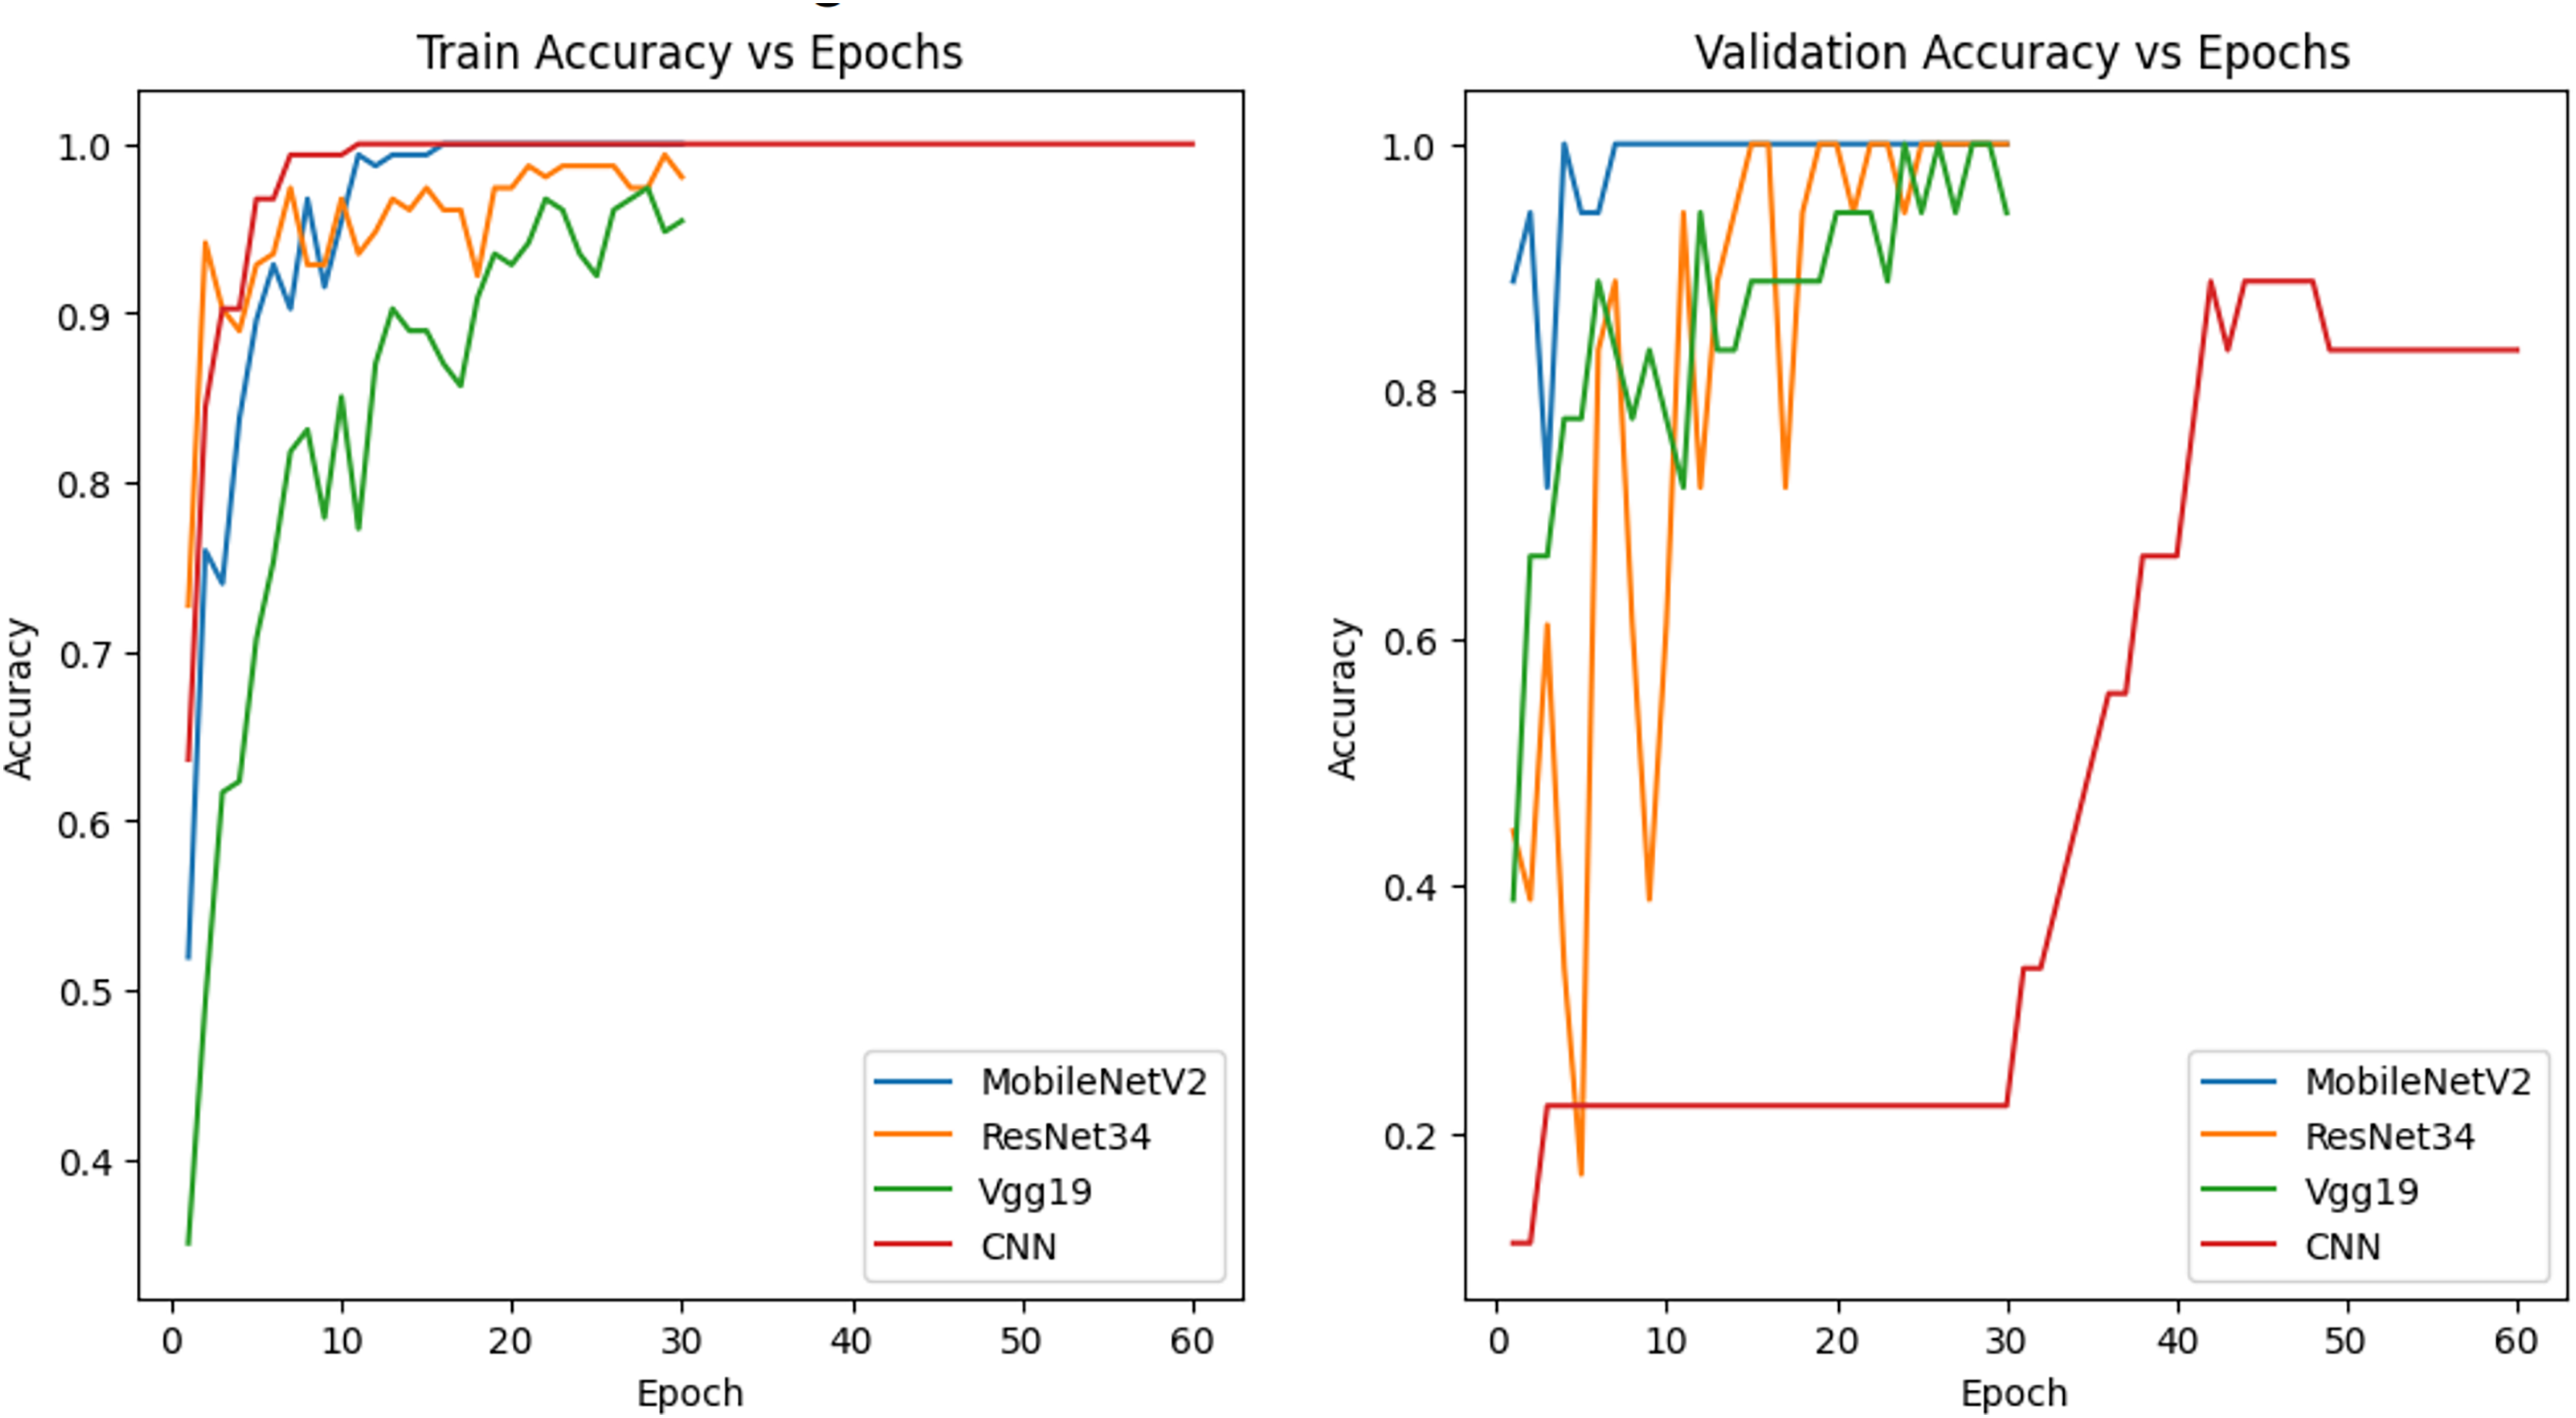
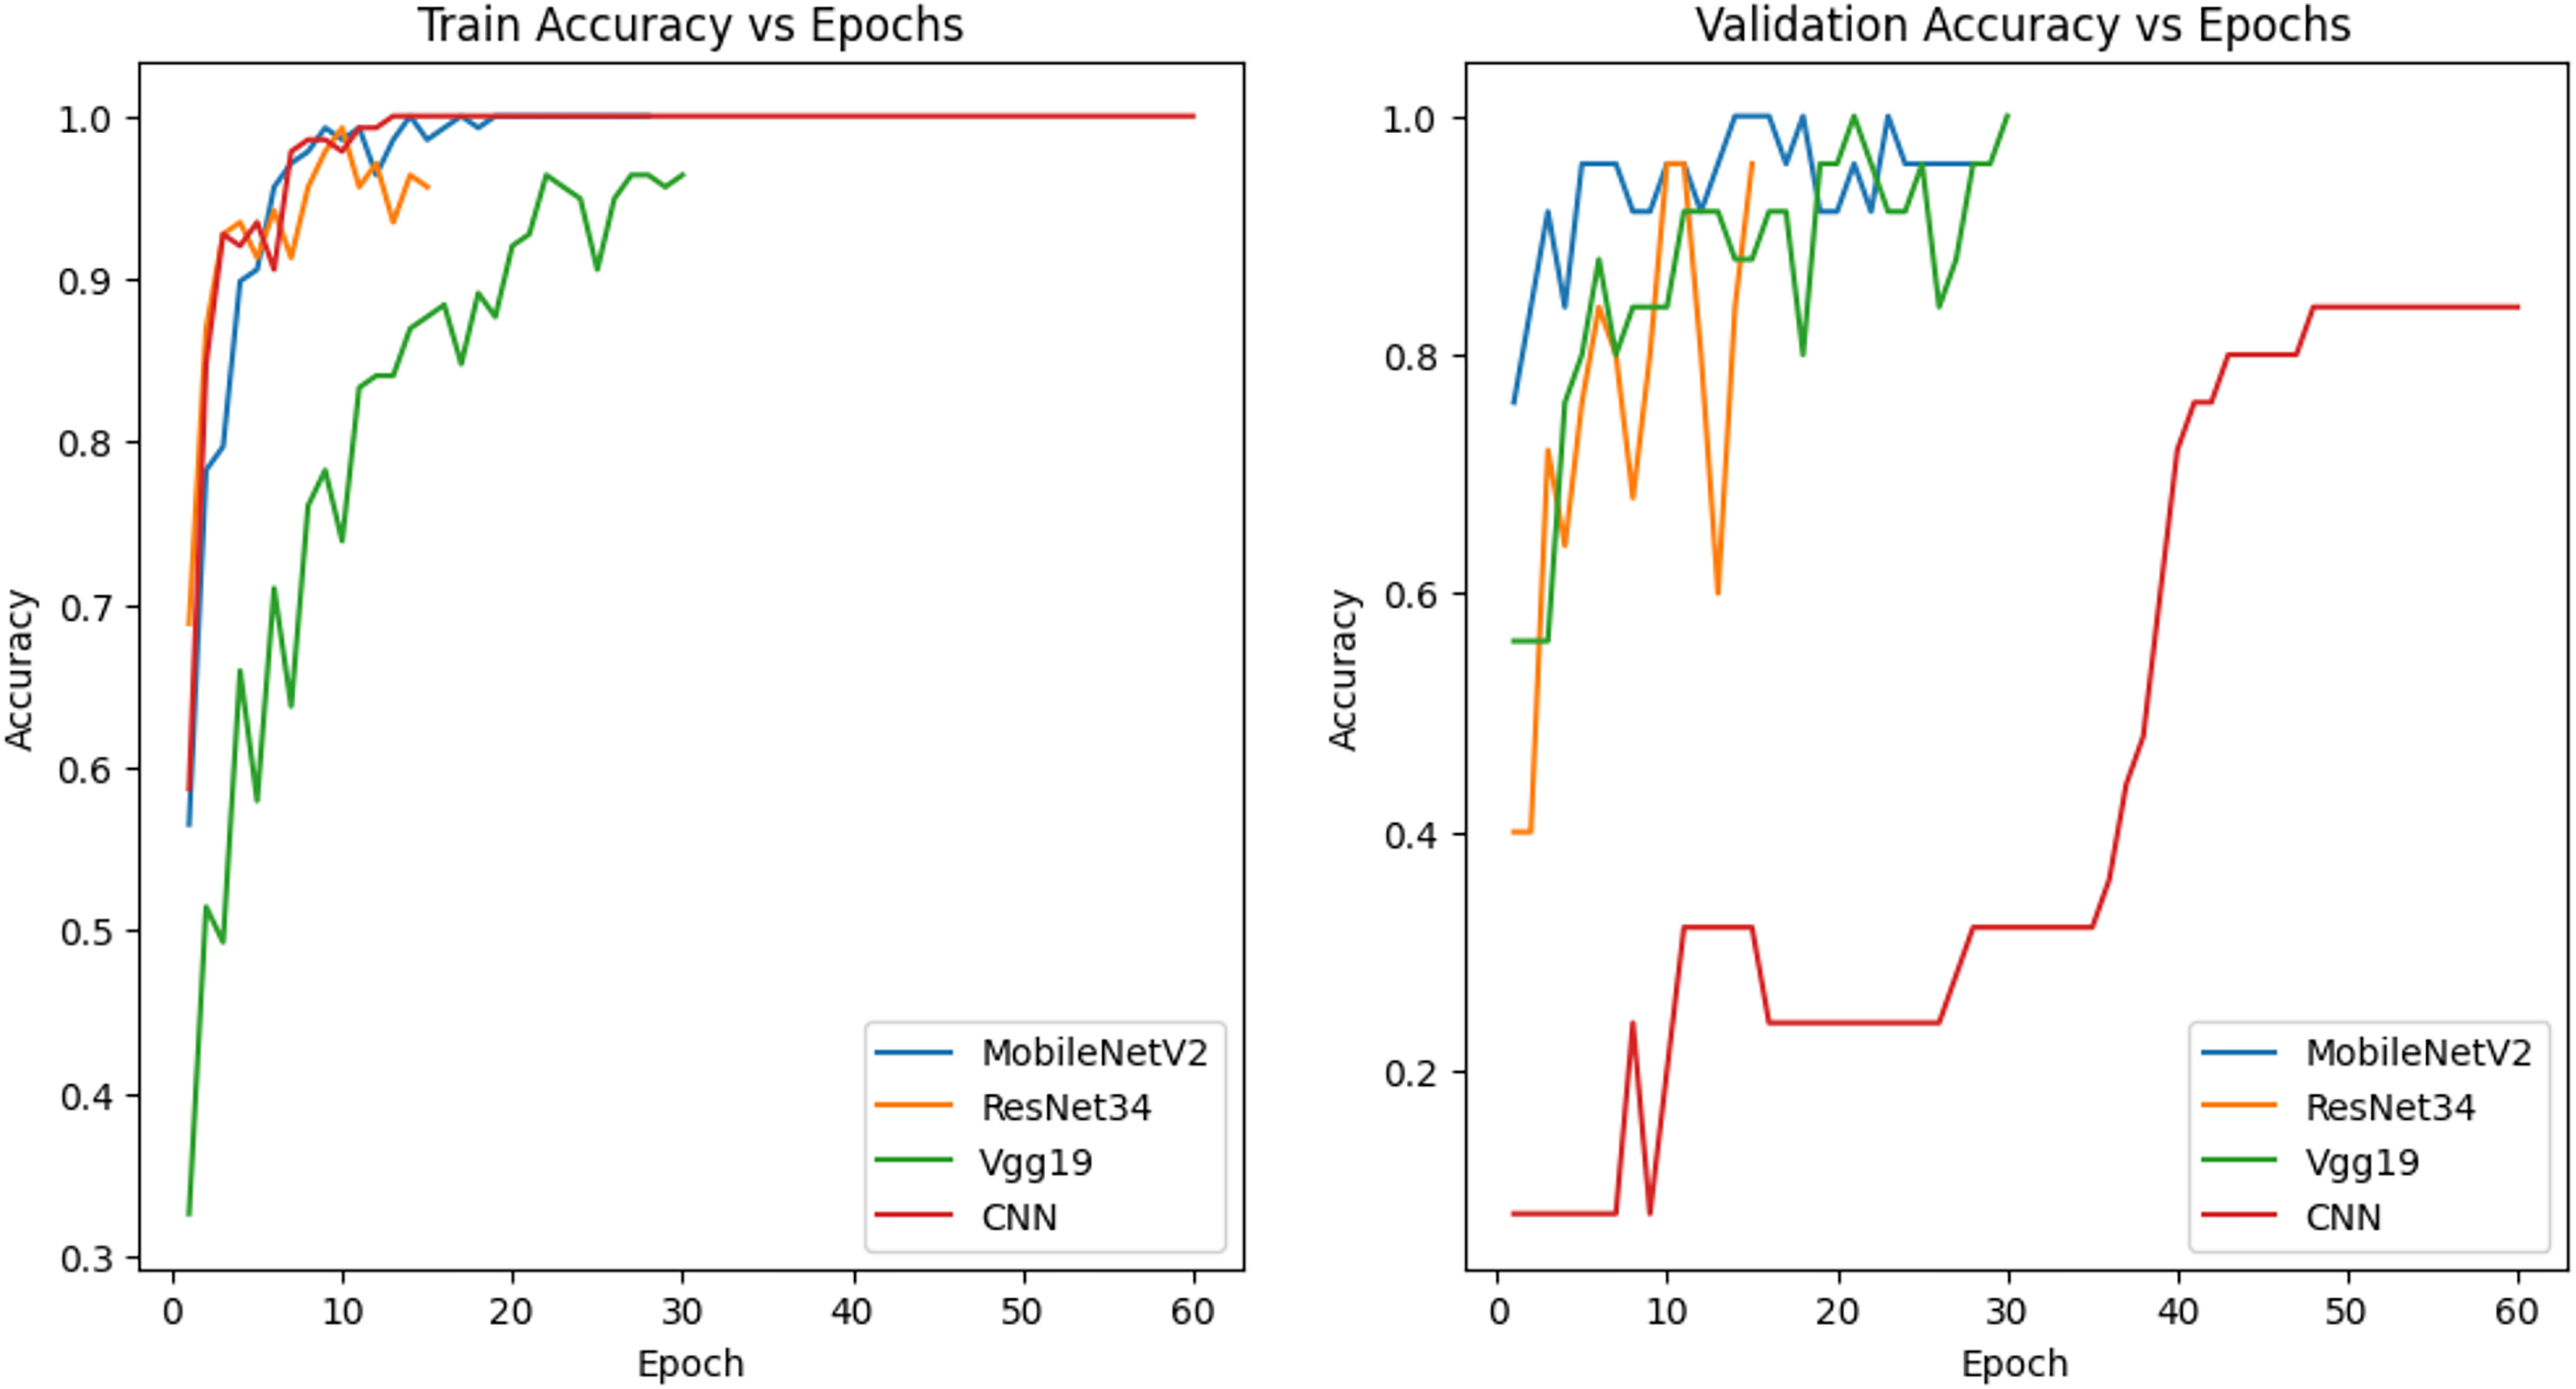
The models in Fig. 8 were trained with 70% training, 15% validation and 15% test data and the accuracy graphs are given. MobileNetV2, ResNet34 and Vgg19 show a more balanced relationship between training and validation accuracy. All three models achieved high accuracy on training data and the fluctuating behavior of the validation accuracy indicates potential overfitting and sensitivity to training data. These fluctuations indicate that hyperparameter optimization can be used to provide a more stable training process and a stronger generalization capability. Although the CNN architecture performed quite well with training data, it exhibited lower accuracy on validation data, indicating that it has limitations in generalization capability.
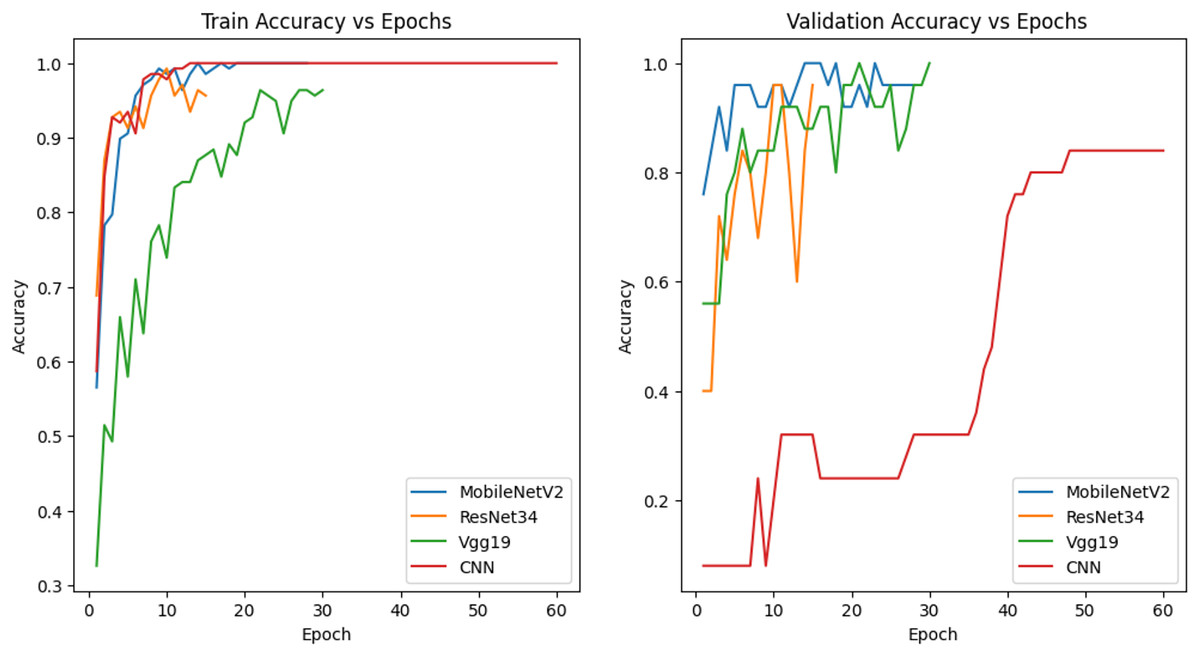
Figure 8: Accuracy graph of the model trained with 70% training data.
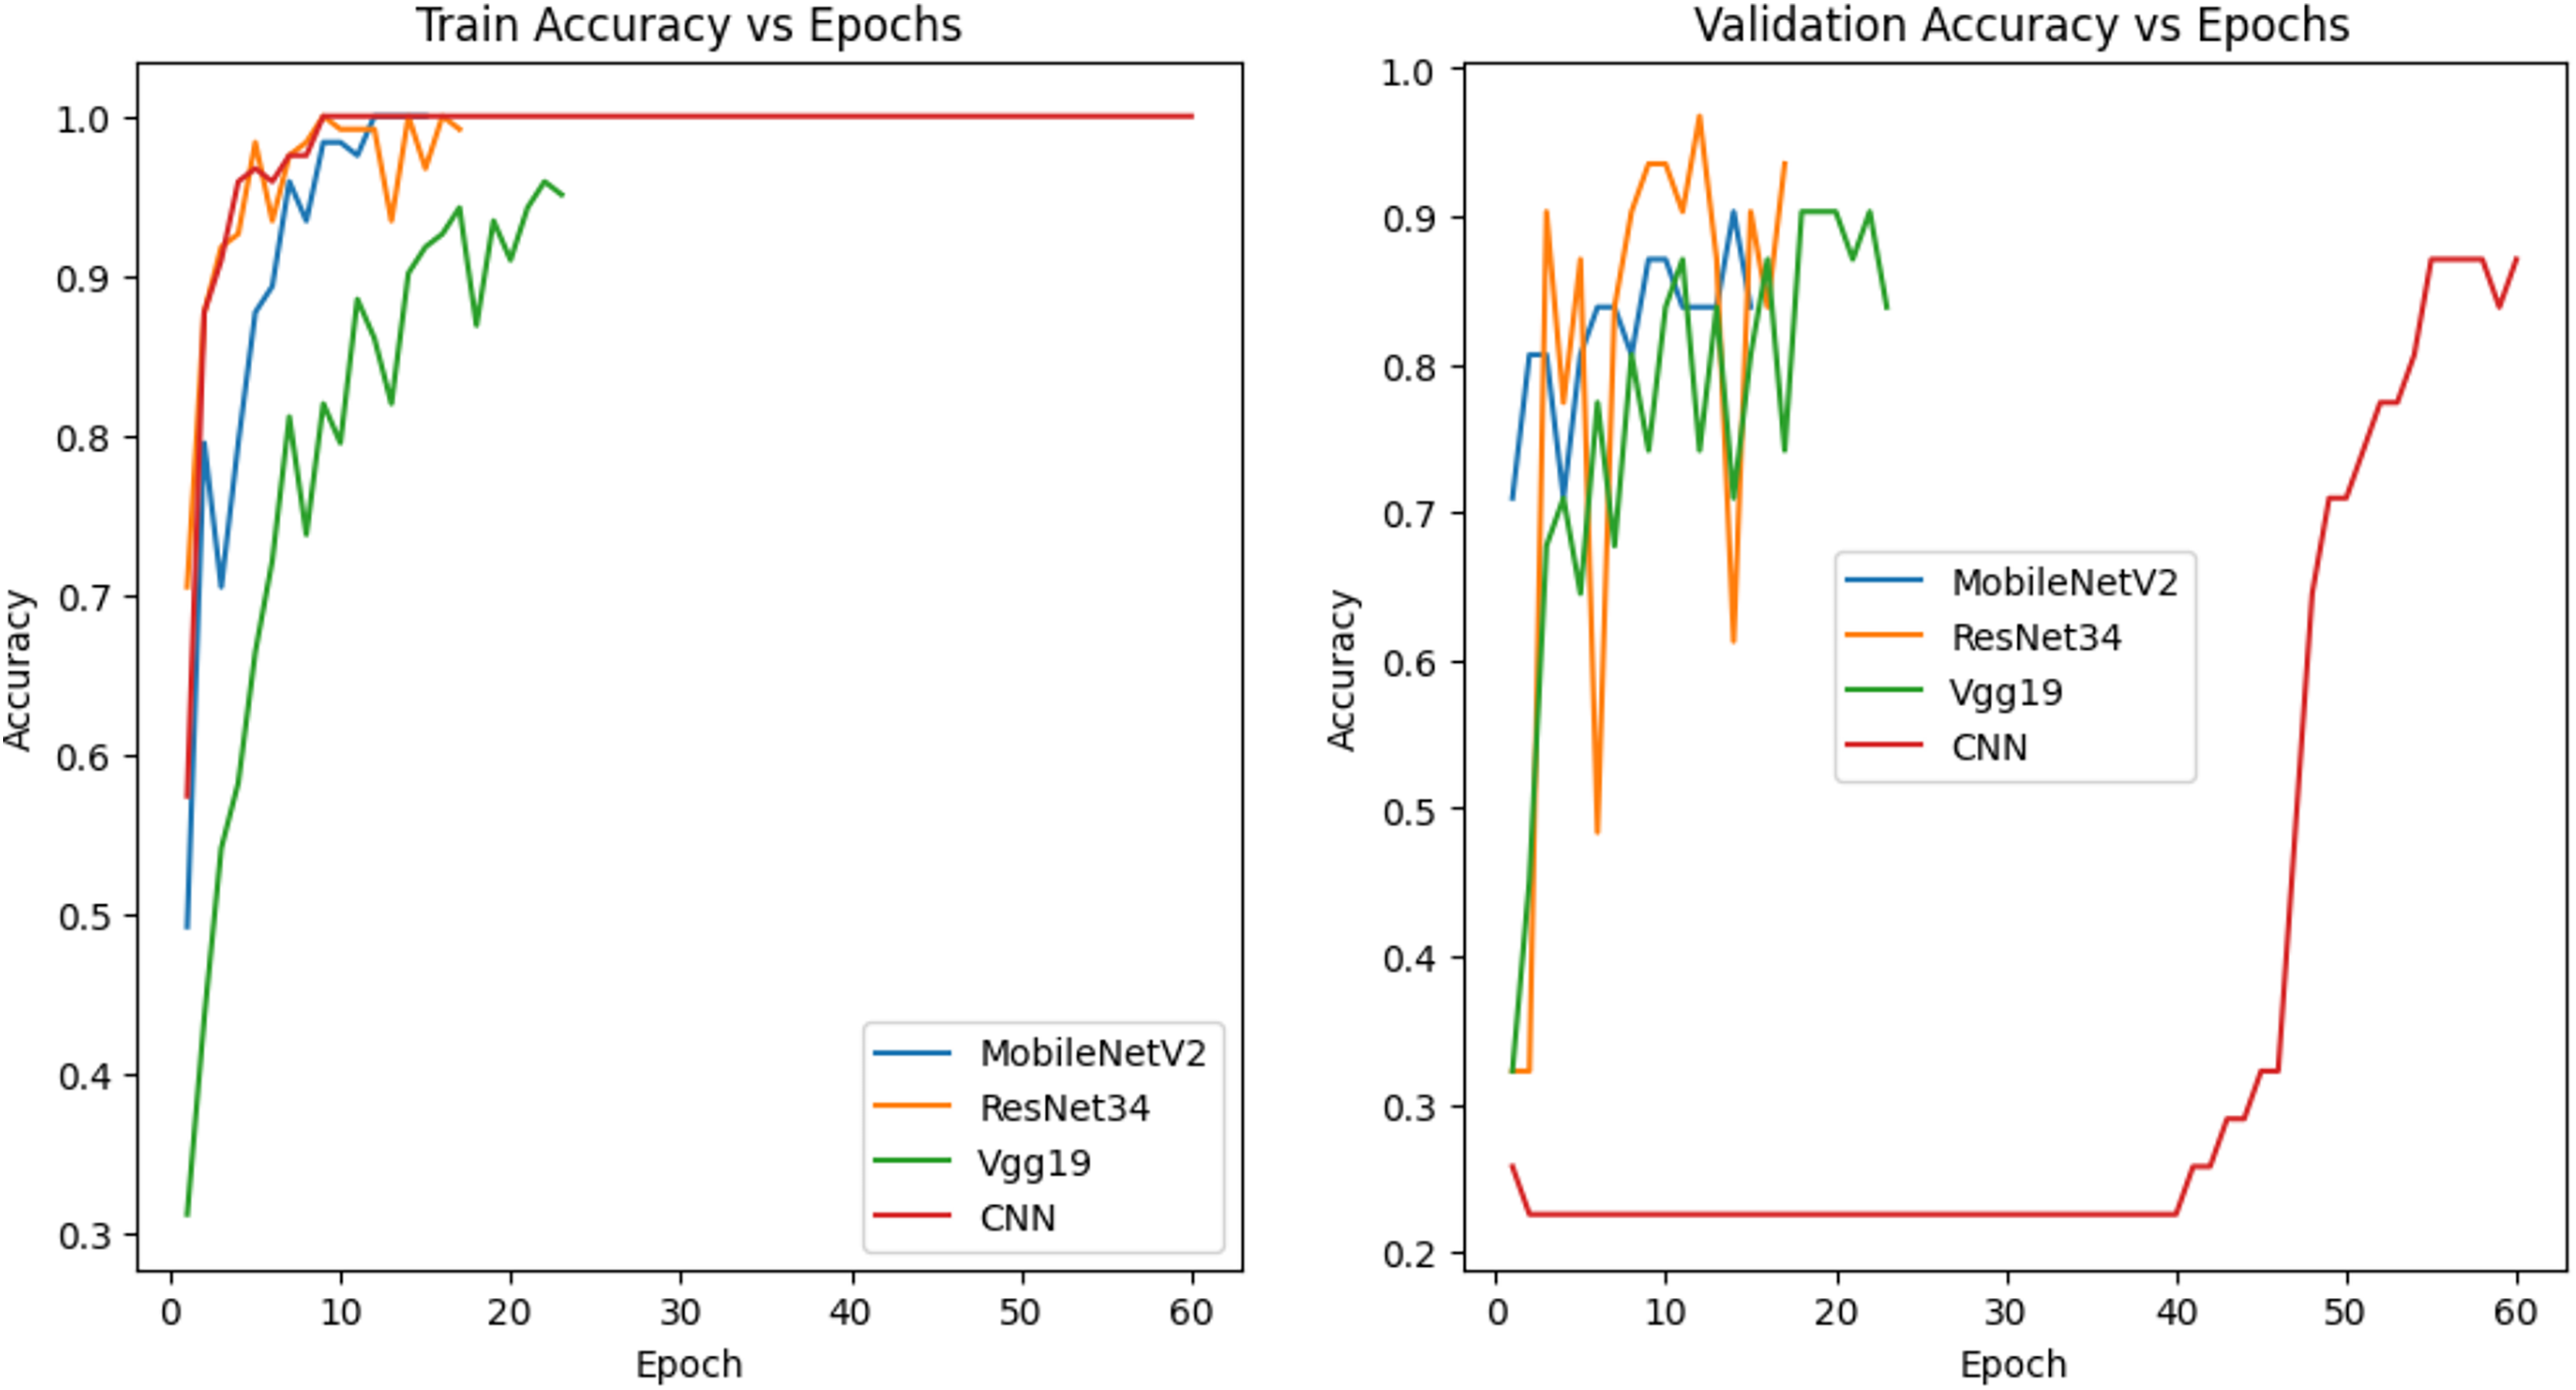
The models in Fig. 9 were trained with 60% training, 20% validation and 20% test data and their accuracy graphs are given. The accuracy of MobileNetV2, ResNet34 and Vgg19 models is quite good in both graphs. This shows that the generalization capabilities of the models are good. The CNN model, on the other hand, showed a rapid increase in training accuracy, indicating that it may have overfitting. In the validation accuracy, it showed a lower performance, which indicates that the generalization rate is low.
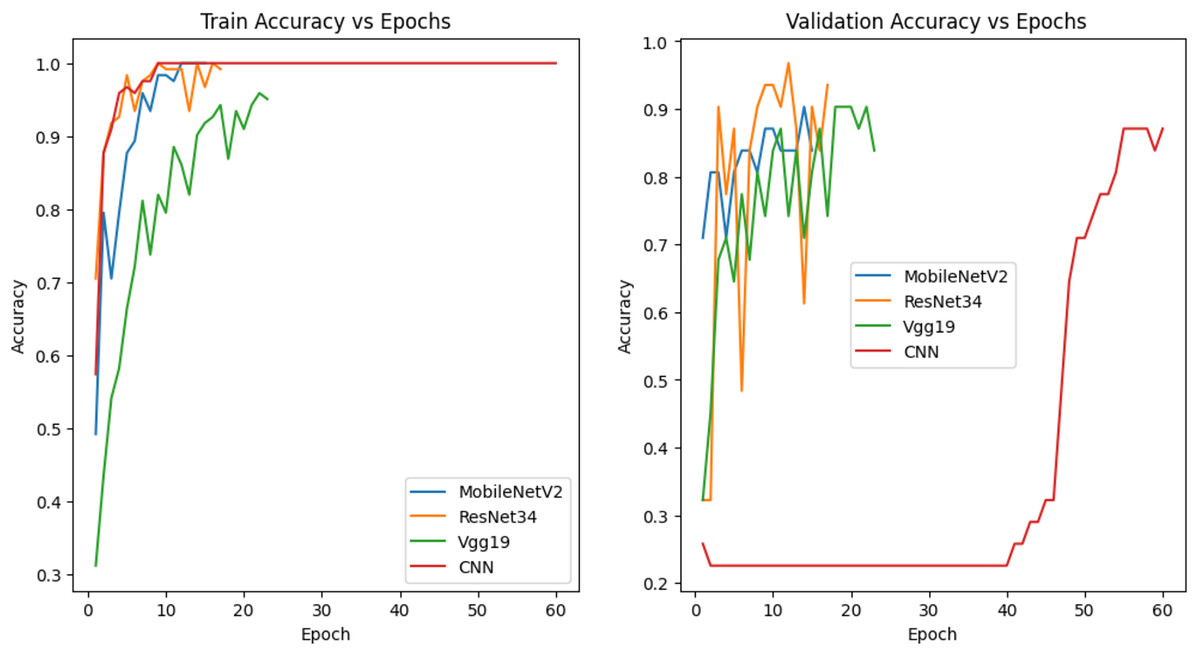
Figure 9: Accuracy graph of the model trained with 60% training data.
Table 3 shows the data for different dispersion rates and the results of all trained models. This table contains various information to compare the model performances for each distribution rate. The impact of each type of error on the results of the trained models is shown along with the accuracy and loss values of the models on the test data. This data allows to evaluate how effectively each model copes with each type of error and its overall performance, taking into account different model structures and distribution rates. In this way, model strengths and weaknesses can be identified and areas for improvement can be identified.
| Models | Data ratio | Burrs | Dents on the thread | Non-filling | Dents on the surface | Intact | Test acc/Loss |
|---|---|---|---|---|---|---|---|
| ResNet18 | 10% test | 100% | 100% | 100% | 100% | 86% | Acc: 95% |
| 10% val | Loss: 12% | ||||||
| 15% test | 80% | 100% | 100% | 100% | 90% | Acc: 93% | |
| 15% val | Loss: 23% | ||||||
| 20% test | 86% | 100% | 100% | 100% | 92% | Acc: 95% | |
| 20% val | Loss: 39% | ||||||
| ResNet34 | 10% test | 100% | 100% | 100% | 100% | 100% | Acc: 100% |
| 10% val | Loss: 0.6% | ||||||
| 15% test | 80% | 100% | 100% | 67% | 100% | Acc: 93% | |
| 15% val | Loss: 9% | ||||||
| 20% test | 86% | 100% | 100% | 100% | 62% | Acc: 85% | |
| 20% val | Loss: 51% | ||||||
| MobileNetV2 | 10% test | 100% | 0% | 100% | 100% | 71% | Acc: 70% |
| 10% val | Loss: 50% | ||||||
| 15% test | 80% | 100% | 100% | 100% | 100% | Acc: 96% | |
| 15% val | Loss: 13% | ||||||
| 20% test | 86% | 89% | 100% | 100% | 77% | Acc: 87% | |
| 20% val | Loss: 79% | ||||||
| MobileNetV3 | 10% test | 67% | 0% | 100% | 100% | 57% | Acc: 60% |
| 10% val | Loss: 56% | ||||||
| 15% test | 60% | 100% | 100% | 67% | 60% | Acc: 76% | |
| 15% val | Loss: 70% | ||||||
| 20% test | 43% | 100% | 100% | 100% | 54% | Acc: 75% | |
| 20% val | Loss: 61% | ||||||
| VGG19 | 10% test | 100% | 100% | 100% | 100% | 43% | Acc: 80% |
| 10% val | Loss: 43% | ||||||
| 15% test | 80% | 100% | 100% | 100% | 80% | Acc: 90% | |
| 15% val | Loss: 35% | ||||||
| 20% test | 71% | 100% | 100% | 100% | 62% | Acc: 82% | |
| 20% val | Loss: 52% | ||||||
| CNN | 10% test | 100% | 75% | 100% | 100% | 71% | Acc: 85% |
| 10% val | Loss: 128% | ||||||
| 15% test | 100% | 100% | 100% | 100% | 80% | Acc: 93% | |
| 15% val | Loss: 48% | ||||||
| 20% test | 86% | 78% | 100% | 100% | 85% | Acc: 87% | |
| 20% val | Loss: 148% |
An examination of the results in the table shows that both MobileNetV3 and MobileNetV2 exhibit outlier accuracy values for certain test and validation samples. For instance, when using 10% test and 10% validation data, accuracy reaches 0% for some classes while rising to 100% for others. This high variance indicates that the models are sensitive to small data subsets and class imbalance. The overall accuracy and loss values (MobileNetV3: Acc: 60%, Loss: 56%; MobileNetV2: Acc: 70%, Loss: 50%) remain at moderate levels, suggesting that the models tend to either overfit or fail to generalize adequately for specific samples. These observations emphasize the importance of balancing the data distribution and performing hyperparameter optimization to ensure more consistent and reliable performance on validation and test datasets.
By looking at this table, the results of various models can be compared and inferences can be made about the performance of each model. The effect of dispersion ratios on the model can be evaluated in terms of accuracy. If a dispersion ratio increases the accuracy of the model, it can be considered as a parameter that allows the model to generalize better. The loss value of the model indicates the magnitude of the errors made during the training process and the effectiveness of the model in the learning process. A high loss value indicates that the model cannot minimize its errors sufficiently during training and has difficulties in the learning process.
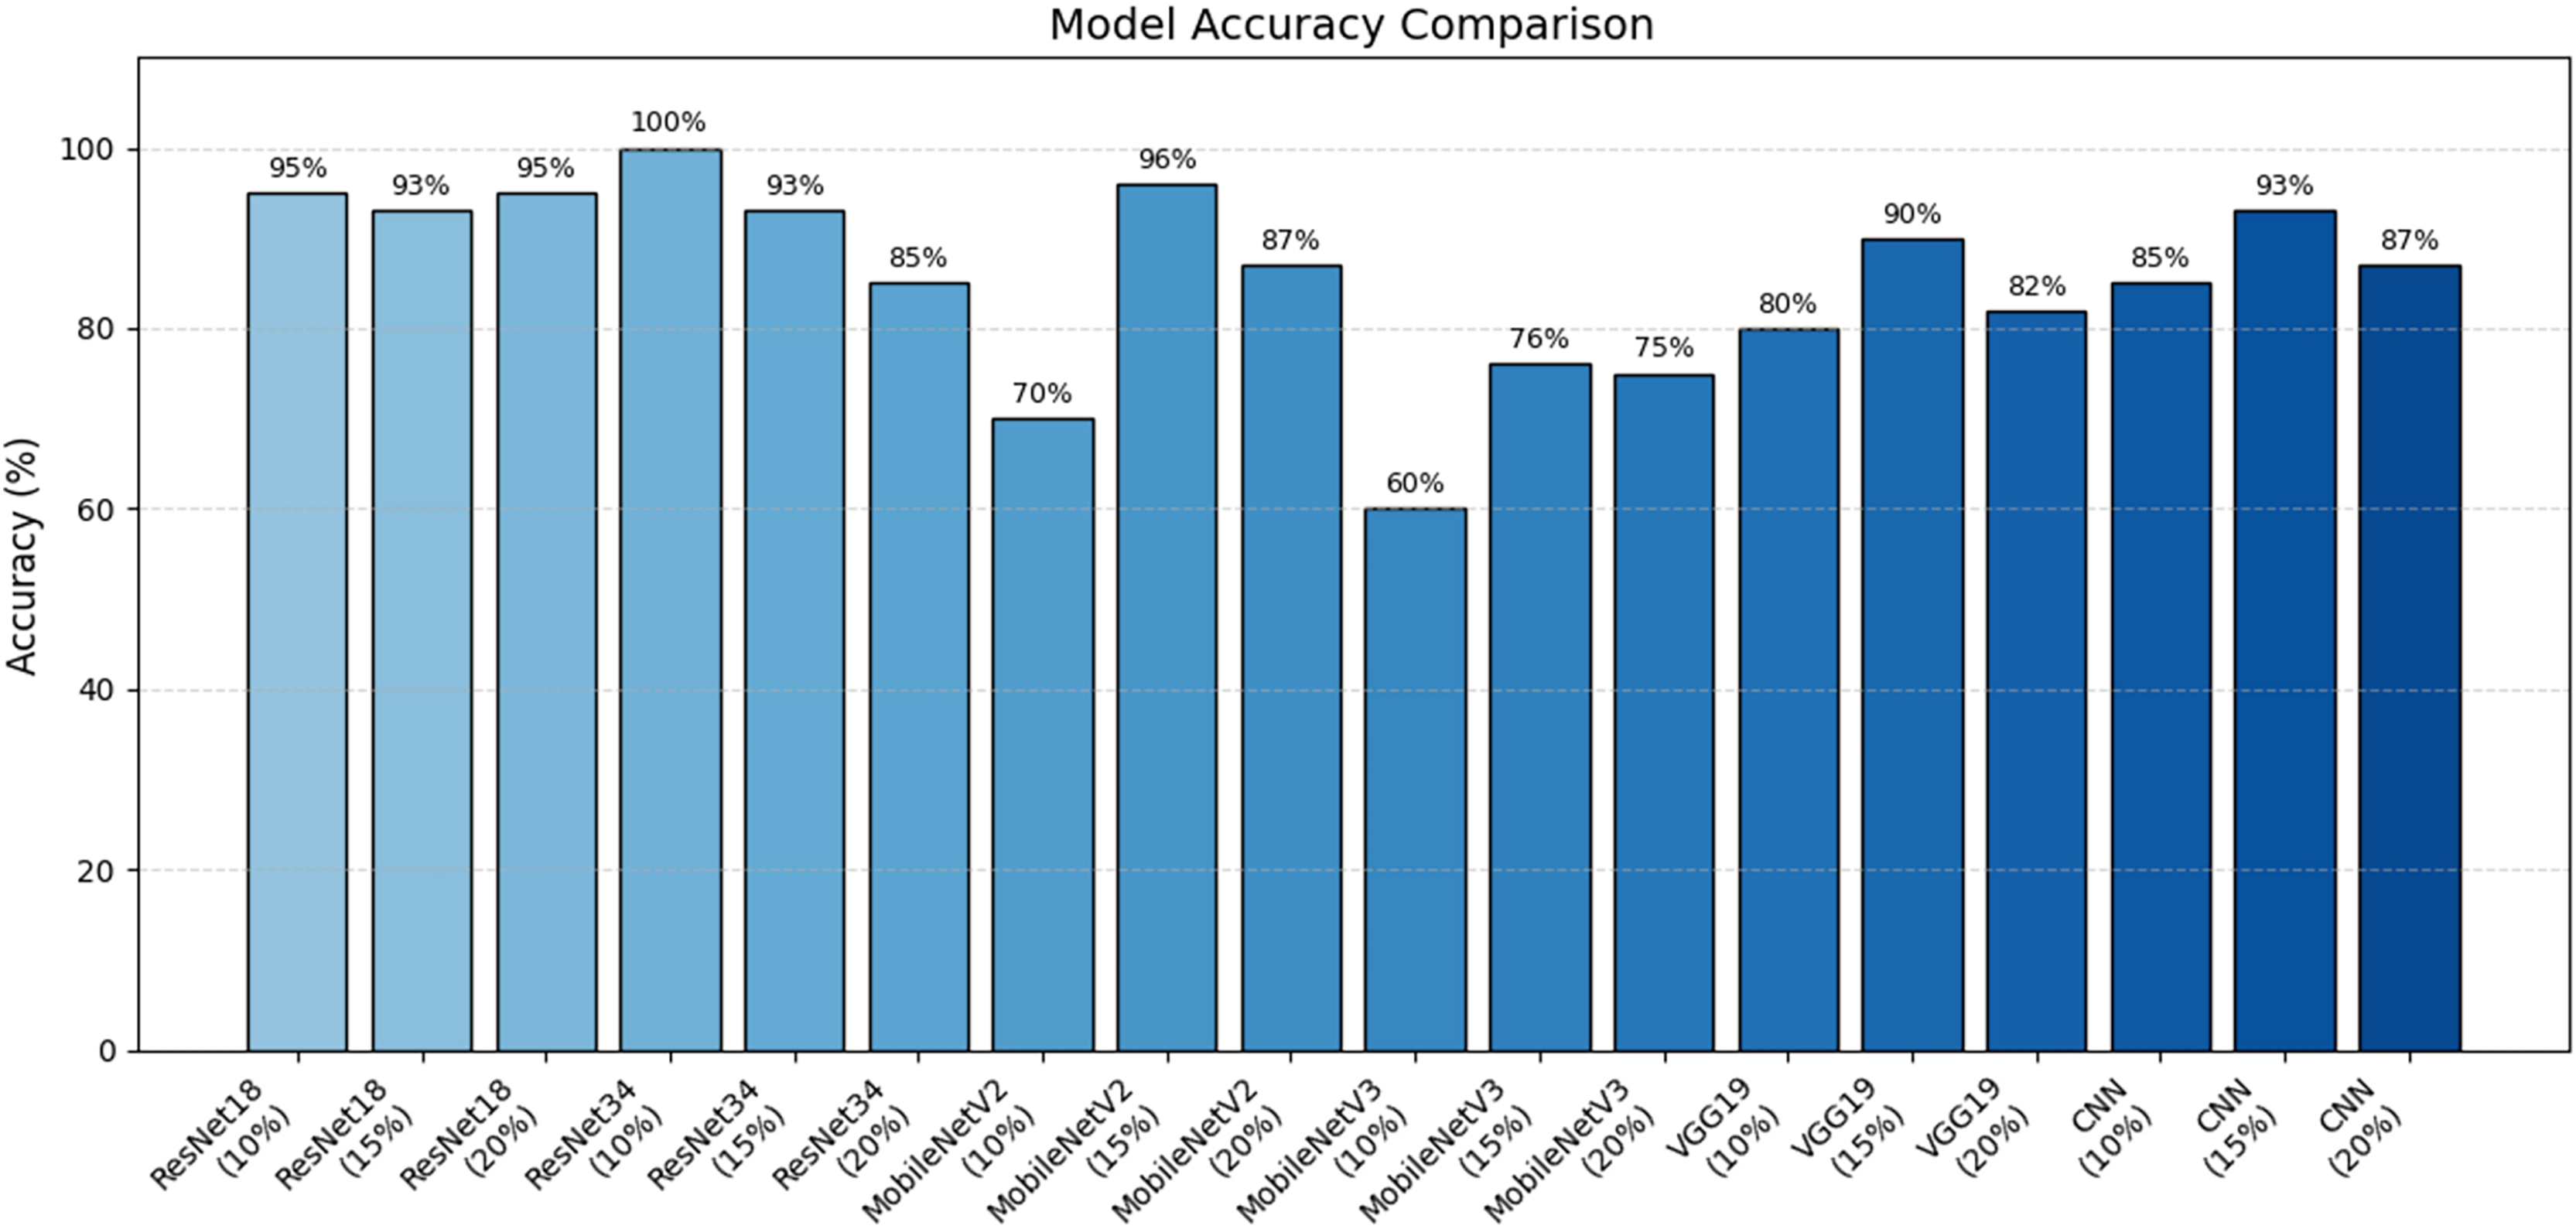
In addition, the accuracy performance of the models is shown visually in Fig. 10. The results obtained with the Resnet34 model are clearly superior to those obtained with other models.
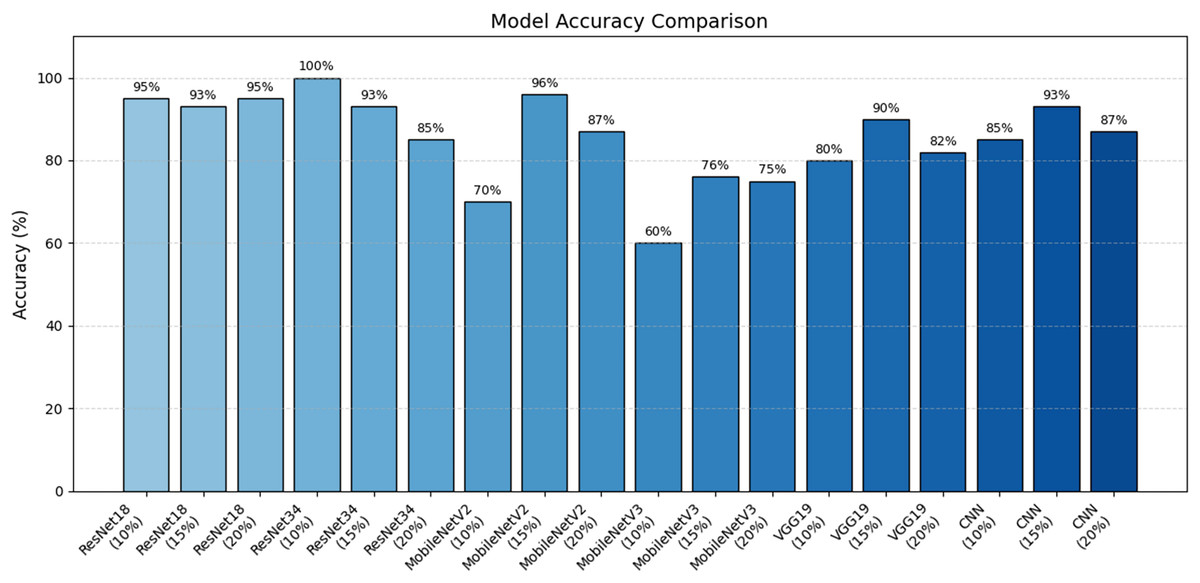
Figure 10: Model accuracy comparison.
Discussion
The results obtained in this study demonstrate that deep learning–based classification models can effectively distinguish surface defects in towing hooks with high accuracy. In particular, the superior performance of the ResNet34 architecture is consistent with the findings reported by Prihatno et al. (2021) and Fu et al. (2019) on metal and steel surface defects. Similarly, the effectiveness of ResNet-based architectures in industrial surface inspection has been supported by Konovalenko et al. (2020) and Feng, Gao & Luo (2021). The results of our study align with these general observations.
The selection of models and performance comparisons have been evaluated in light of the criteria outlined in the comprehensive review by Chen et al. (2022) on convolutional neural network (CNN)-based image classification algorithms. Their study highlights the strengths and weaknesses of different CNN architectures, providing a context for understanding the performance variations observed in our evaluations. Furthermore, the use of CNNs for wafer surface defect classification and unknown defect detection demonstrated by Cheon et al. (2019) illustrates the flexibility and broad applicability of deep learning models in industrial inspection tasks. Additionally, the effectiveness of transfer learning for small datasets aligns with the findings emphasized by Kumaresan et al. (2023).
Among the limitations of this study is the restricted nature of the dataset, which is specific to a single product type and controlled conditions. The generalization capability of the model could be more thoroughly assessed using larger and more diverse datasets representing varying production environments.
For future work, synthetic data augmentation and generative models present significant opportunities. GAN-based approaches (Creswell et al., 2018) and more recent diffusion models (Croitoru et al., 2023; Wang et al., 2022) may be effective in expanding defect variations and addressing class imbalance issues. The potential of generative models in industrial manufacturing workflows, highlighted by He et al. (2024) and Shafiee (2025), suggests that integrating such technologies into defect classification systems could lead to more robust and flexible inspection mechanisms.
Conclusion
In this study, various deep learning architectures—ResNet, MobileNet, VGG, and a custom CNN—were trained using the transfer learning approach to classify surface and structural defects on towing hooks. The dataset consists of five categories: burr, dent on the thread, non-filling, dent on the surface, and intact parts. This comprehensive classification task forms the main motivation of the study, as it involves complex and multi-source defect types that closely represent real production line scenarios.
Experimental results show that the ResNet34 model achieved the highest performance, with 100% accuracy, 0.6 loss, and class-wise precision–recall–F1-score values of 1.00. These results indicate that the model successfully learned the distinctions between classes and possesses strong generalization capability. MobileNetV2 demonstrated the second-best performance with 96% accuracy and 13% loss. Despite having a lighter architecture, it delivered robust results, making it suitable for real-time applications and systems with limited computational resources. Overall, the models exhibited high performance despite the limited size of the dataset. These findings indicate that deep learning-based classification models can make significant contributions to quality control mechanisms in production processes.
Since the data were collected from a single source, variations in operating conditions, lighting changes, or different camera angles may affect model performance. Considering these limitations, future work may focus on expanding the dataset, increasing diversity through synthetic data generation, and performing a more detailed analysis of misclassified samples.