
Learning analytics for reducing student dropout in digital video platforms
- Published
- Accepted
- Received
- Academic Editor
- Arkaitz Zubiaga
- Subject Areas
- Computer Education, Multimedia
- Keywords
- Learning analytics (LA), Digital video platforms (DVPs), Dropout
- Copyright
- © 2026 Al-Hafdi and Alhalafawy
- Licence
- This is an open access article distributed under the terms of the Creative Commons Attribution License, which permits unrestricted use, distribution, reproduction and adaptation in any medium and for any purpose provided that it is properly attributed. For attribution, the original author(s), title, publication source (PeerJ Computer Science) and either DOI or URL of the article must be cited.
- Cite this article
- 2026. Learning analytics for reducing student dropout in digital video platforms. PeerJ Computer Science 12:e3532 https://doi.org/10.7717/peerj-cs.3532
Abstract
Digital video platforms (DVPs) are experiencing increased popularity as educational resources, yet they face challenges in achieving sustainability due to dropout among students. This research aims to examine the effect of Learning Analytics (LA) on reducing dropout in a DVP environment. A quasi-experimental design was employed to compare experimental and control groups, each consisting of 30 sixth-grade students. The experimental group utilized DVP with LA, while the control group used DVP without LA. LA data included the completion percentage of full video viewing, time spent watching the video, correct and incorrect answers to the questions embedded within the video, number of views for each segment of the video and date and time of the last video viewing. A dropout scale was developed, encompassing three dimensions: satisfaction, engagement, and continuity. The results showed a significant reduction in dropouts in the LA group. LA also contributed to improving student satisfaction, engagement, and continuity within the DVP environment. The results also showed correlations and mutual influence between satisfaction, engagement, and continuity.
Introduction
There has been an increase in the use of e-learning in the last few years. This, in turn, led to a noticeable increase in the amount of data and its accumulation (Da Silva et al., 2022). This data can be used to predict the students’ achievements, evaluate their behavior, and enhance their educational experience (Olga & Ake, 2023). In addition to facilitating the continuous learning and communication process, these digital systems provide a lot of data that is associated with tracking the students’ learning process and make appropriate interventions to improve the educational process using data analysis methods (Salman et al., 2025). As a result of this huge amount of data that can be used to monitor the students’ performance, Learning Analytics (LA). LA focuses on data analyzing and understanding it to come up with a set of accurate recommendations that contribute to enhancing the quality of learning and providing a new meaning to its practices and the environments in which it occurs (Quadri & Shukor, 2021). The LA concept is associated with the digital technologies that collect the data, analyze it, and report it to develop the teaching-learning process, enhance the students’ deep understanding, provide immediate feedback, and raise the learning proficiency (Banihashem et al., 2022). It focusses on providing qualitative educational services based on collecting a lot of data through which we can determine the students’ needs and challenges they might face, and the ways and methods used to overcome them to achieve best results (Wong & Li, 2020). In addition, it helps teachers to uncover students’ conditions and gain a better understanding of how they learn by analyzing their interaction with technical resources such as digital video platforms (DVP), learning management systems, and mobile learning (Caspari-Sadeghi, 2022; Phillips & Ozogul, 2020). Moreover, it helps to predict the students’ performance through their different activities in the learning environment, evaluate the risks and possibility of their dropout from the course by tracking their behaviors (Qazdar et al., 2023). Also, by providing digital indicators in the form of easy-to-read and use reports and graphs that can be used to observe the learning process undertaken by learners and provide them with appropriate support to achieve the learning goals (Hernández-de-Menéndez et al., 2022).
The dropout is considered one of the problems that face the usage of electronic learning (Bañeres et al., 2023). This term refers to the learner’s preoccupation with digital learning, whether complete or partial preoccupation by leaving out parts of the content, tasks, and activities (Coussement et al., 2020). Therefore, this concept relates to learner failure in achieving the educational tasks required from him/her through the Internet and that must be accomplished (Aldowah et al., 2020). With the expansion of the scope of e-learning as platforms for learning management, digital videos, and the increase of their usage (Mubarak, Cao & Zhang, 2022), the percentages of digital dropout increased noticeably where a study (Wang et al., 2019) confirmed that the dropout rate in the e-learning is 20% higher than traditional learning and that this percentage will increase in the future if suitable solutions are not developed to address it. To address this, some interventions must be carried out to contribute to early detection and prediction of the level of risk of dropout and a mechanism for reducing its potential risks in online learning environments (Tamada, Giusti & Netto, 2022). One of the practical ways for this is using LA which plays a crucial role in evaluating the students’ behaviors and educational activities which might help in reducing the dropout rates through determining the factors that motivate the students to continue their e-learning (Laato et al., 2019; Xavier & Meneses, 2020).
Based on the above-mentioned; a research gap in reducing the digital dropout can be identified among the primary stage students where the digital dropout is considered one of the challenges facing using online learning as DVP. With the expansion of the use of DVP in education, it becomes necessary to search for solutions that ensure the sustainability of these platforms in achieving learning objectives (Alharbi, Al-Hafdi & Alhalafawy, 2025; Alnimran & Alhalafawy, 2024; Alsayed, Al-Hafdi & Alhalafawy, 2024a, 2024b; Ibrahim, Al-Hafdi & Alhalafawy, 2024; Najmi, Alameer & Alhalafawy, 2024; Zohdi, Al-Hafdi & Alhalafawy, 2024). Student dropout is one of the threats facing students through DVP (Zaki et al., 2024). Several studies have emphasized (Bañeres et al., 2023; Greenland & Moore, 2022; Lee & Choi, 2011; Sun et al., 2019; Tan & Shao, 2015) the importance of reducing the digital dropout and its impact on the learning efficiency, achieving the desired educational goals, and the need for addressing this problem through conducting scientific research which might introduce qualitative solutions to overcome it and introduce digital learning with high quality which reflects the improvement of the educational environment and its different practices. Although many studies have addressed learning environments based on LA, there are limited studies that have addressed these environments via DVP to address digital dropout for primary school students (Bayazit et al., 2023; Evi-Colombo, Cattaneo & Betrancourt, 2023; Girón-García & Fortanet-Gómez, 2023). Through this, many indicators can be obtained to help track the learners, their progress in their educational tasks, to offer feedback, and meet their educational needs to affect the reduction of their digital dropout (Barreiros et al., 2023; Ustun et al., 2023). Accordingly, the research aims to examine the impact of LA through DVP on reducing the digital dropout among the primary stage students. Hence, the research question is as follows:
RQ1: What is the impact of LA through DVP on reducing the digital dropout among the primary stage students?
Addressing the afore mentioned question can provide educational institutions with effective strategies for leveraging LA tools to mitigate digital dropout on educational platforms. The findings from this inquiry will guide the development of structured approaches for utilizing LA to foster learning sustainability and curb digital attrition. Within the scope of this investigation, the first hypothesis, derived from numerous studies demonstrating the efficacy of learning analytics in promoting educational sustainability, will be validated (Staneviciene et al., 2024; Wong, Li & Liu, 2025). Consequently, the research hypothesis is stated as follows:
H1: The use of DVP with LA will significantly reduce digital dropout scores (p ≤ 0.05) in the experimental group compared to the control group, which used DVP without LA, as measured by the post-test.
Theoretical framework
Learning Analytics
LA refers to the collection, analysis, and reporting of the data related to students and learning environments to understand and improve learning processes (Grimm et al., 2023). This field is based on an integrated cycle that includes inputs representing data, processes focused on analysis and inference, and outputs aimed at improving the teaching and learning process (Heikkinen et al., 2023). LA is used to evaluate students’ activities and monitor their performance to improve learning processes and support the educational decision-making process (Motz et al., 2023). In addition, these analytics help to predict at-risk students and develop early intervention scenarios in order to support them (Romero & Ventura, 2020). Moreover, they contribute to exploring and understanding learning outcomes and improving academic performance levels (Lim et al., 2021).
The Constructivist theory emphasizes that learning is an active process in which students construct knowledge through interaction and practice (Pande & Bharathi, 2020). This is reflected in LA through the data collected on student interactions within DVPs, which enables educational recommendations to help students self-regulate, engage positively, and construct knowledge gradually. The Flow theory also suggests that students reach a state of full immersion when goals are clear and immediate feedback is provided (Sharek & Wiebe, 2011). This is embodied in LA through monitoring student performance and promptly intervening based on their learning data, maintaining flow and preventing withdrawal from learning activities. In addition, the motivation theory stresses that encouraging and motivating students enhances their motivation and reduces frustration (Lonn, Aguilar & Teasley, 2015). This theory is reflected in the role of LA, which enables teachers to provide encouraging messages and feedback based on real data about student performance, which increases their motivation and persistence in learning. Finally, the Cognitive load theory views managing mental load as a prerequisite for successful learning (Ayres, 2020). Its connection to LA is demonstrated by the use of performance data to estimate students’ cognitive load level and organize learning tasks, which helps to provide appropriate instruction that reduces mental load and improves their academic achievement.
Dropout
Digital dropout is considered as one of the most prominent challenges of e-learning. It refers to a student’s failure to complete lessons, learning tasks, or continue with the online learning activity (Alghamdi, Soh & Li, 2025). Benoit et al. (2024) explained that it is a growing problem in digital courses, where students stop completing content and activities despite being enrolled. In addition, Loder (2024) demonstrated that this failure to continue directly leads to failure to achieve educational objectives. Studies indicate multiple causes; Grazia, Molinari & Mameli (2024) focused on students’ academic and digital proficiency. Also, Heradstveit et al. (2024) mentioned the impact of negative attitudes towards technology, while Van Den Berghe et al. (2024) emphasized the importance of ongoing support and feedback.
The self-determination theory states that the lack of fulfillment of students’ basic psychological needs, such as autonomy, competence, and relatedness, leads to decreased motivation and an increased likelihood of dropping out of digital courses (Ryan & Deci, 2000). This is reflected in current research, which shows that students who do not find a digital learning environment that meets these needs are more likely to drop out. The Engagement theory suggests that poor engagement and interaction with learning activities contributes to high dropout rates (Fredricks, Blumenfeld & Paris, 2004). This reflection is evident in DVPs when students lack social interaction and collaborative discussions, which reduces their engagement and increases their likelihood of dropping out. The cognitive load theory emphasizes that increased mental loads or poorly designed educational content leads to students feeling overwhelmed and subsequently dropping out (Sweller, 2011). This is obvious in DVPs when students encounter long or complex passages that do not take their cognitive abilities into account, causing them to lose the desire to continue. Finally, the flow theory states that the lack of immersion and a balance between the difficulty level of tasks and the student’s abilities leads to a loss of motivation to continue (Csikszentmihalyi, 1990). This is what may happen in DVPs when videos or educational activities do not provide an appropriate level of challenge, weakening student immersion and increasing the probability of dropout.
Based on the above, these theories together provide an integrated framework for understanding the phenomenon of dropout considering cognitive, motivational, and social aspects. They emphasize the importance of LA as a tool capable of monitoring early indicators of dropout, such as viewing rates, engagement patterns, and interaction behaviors, allowing for targeted and effective interventions to reduce this phenomenon.
Materials and Methods
Approach
The current research relied on a quasi-experimental approach, as it is the most suitable approach to study the causal relationship represented in the results of the independent variable, LA across DVP, on the dependent variable, digital dropout.
Experimental design
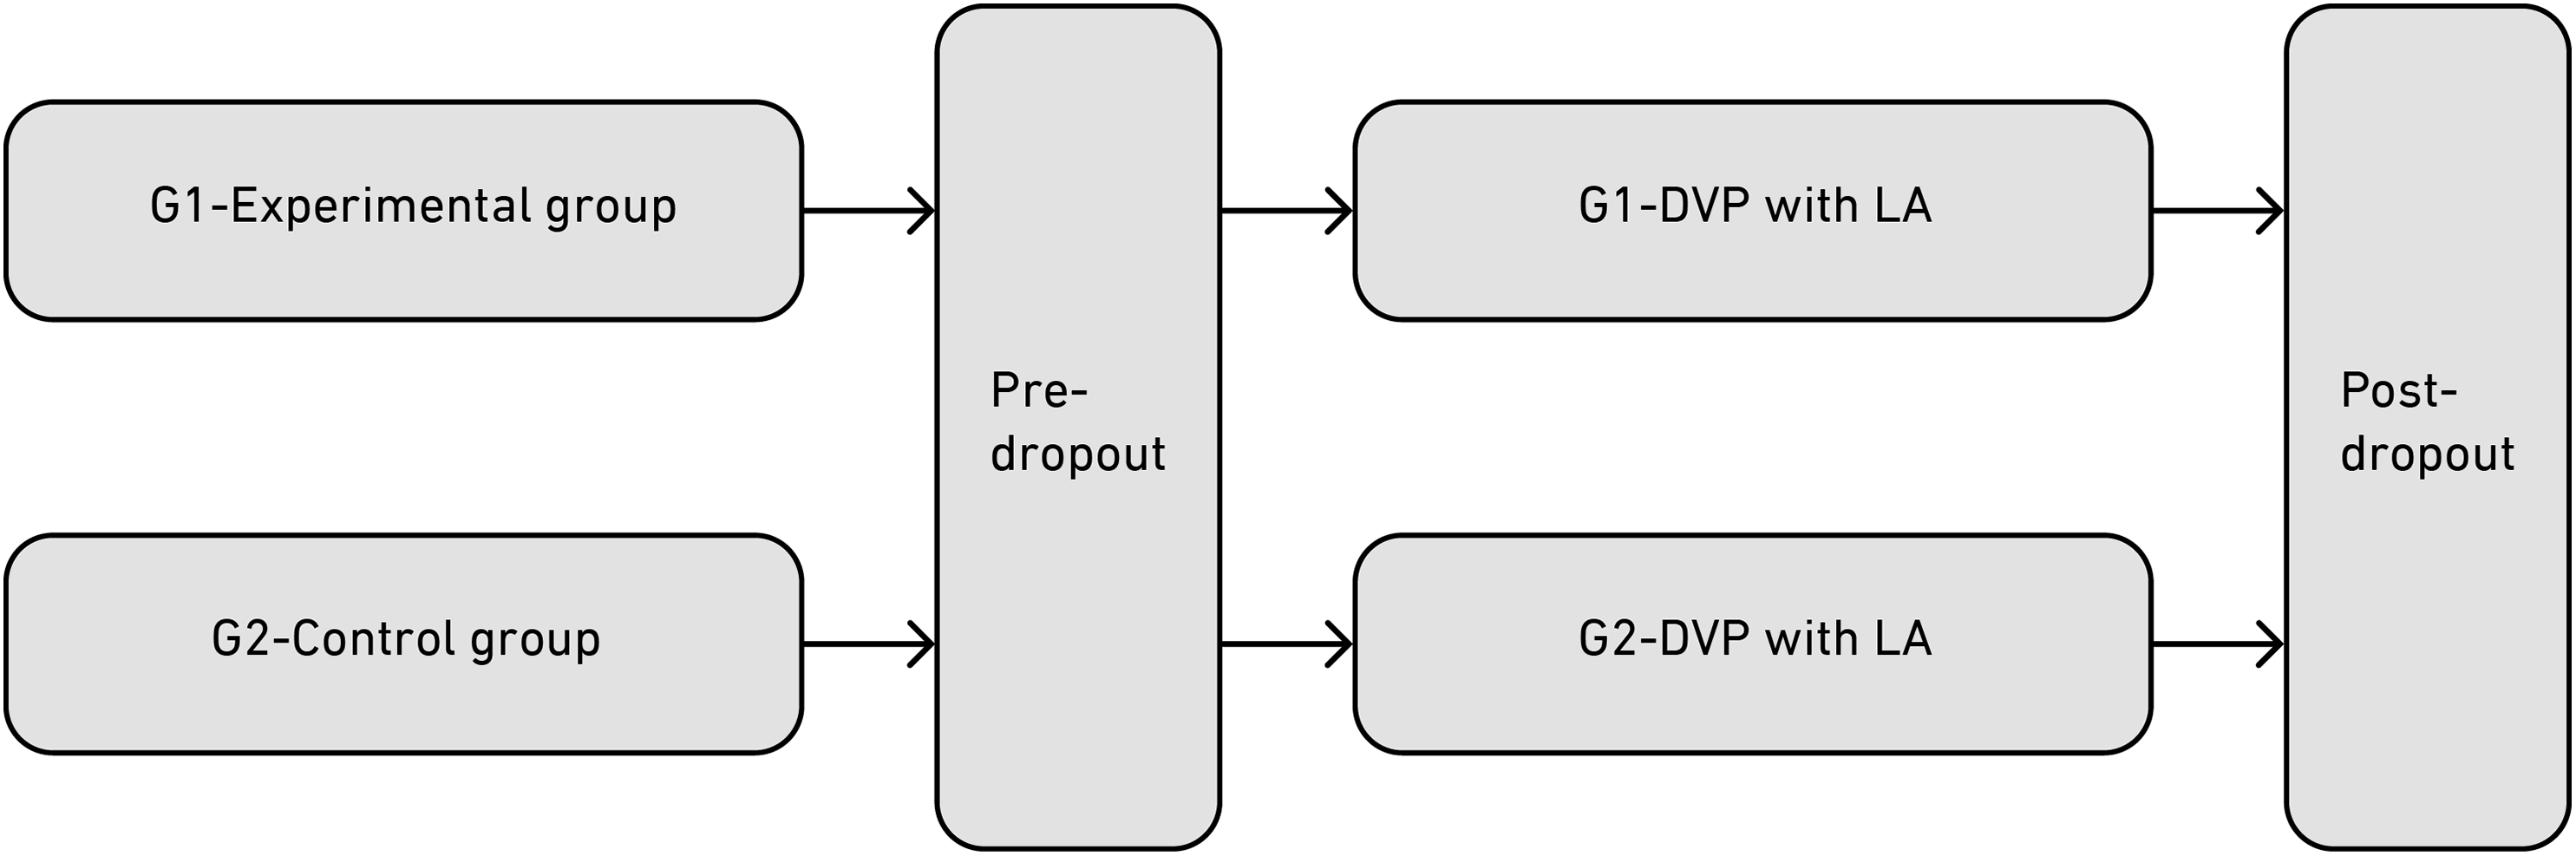
This research adopted a two-group experimental design to examine the effect of LA on reducing digital dropout in DVP. The experimental group used a DVP integrated with LA features, while the control group used the same platform without any LA functions. The overall structure of the experimental design is presented in Fig. 1.
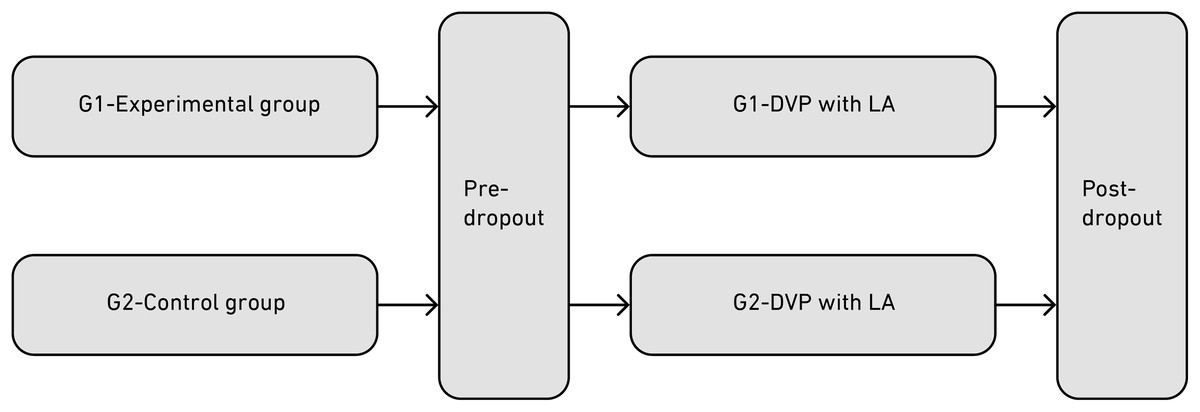
Figure 1: Experimental design for research variables.
The quasi-experimental approach was used in the current research to reveal the relationship between the following variables:
Independent variable: Learning analytics through DVP
Dependent variable: dropout
Sample
The participants in this research were students in the sixth grade of primary school who were studying the unit of integers and absolute value in the mathematics course in a school in the city of Jeddah for the second semester of the year (2023/2024 AD). The research population was 217 students, and 60 students were randomly assigned. The ages of the students ranged between 11–12 years. Convenience samples were taken, and they were randomly divided into experimental group utilized DVP with LA that included 30 students, and control group used DVP without LA that included also 30 students. We considered criteria for equality between the two groups in terms of their levels of study and academic average, and to ensure that the students in the two groups have equal capabilities to use computers, the Internet, and smart devices, and how to play and control the interactive video while watching it.
Ethical considerations
The University of King Abdulaziz University-Faculty of Education granted Ethical approval to carry out the research. Informed consents were obtained from the parents. The school administration was involved in supervising the experiment. Parents and the school administration were informed of the possibility of withdrawing students at any time and without giving any reasons. The privacy of the data of all participants in the research was maintained. We have received written informed consent from the parents/guardians of the study participants.
Instrument
The instrument used in this research was a digital dropout scale (Appendix 1). To prepare the scale, several different scales and literatures about digital dropout were reviewed (Aydin et al., 2019; Bağrıacık Yılmaz & Karataş, 2022; Levy, 2007; Lizarte Simón & Gijón Puerta, 2022; Park & Yoo, 2021; Parker, 1999; Street, 2010). For the research procedures, these scales were used to create the instrument based on the nature of the digital dropout and the educational environment via DVPs. Accordingly, the scale was developed and consisted of three dimensions: satisfaction, engagement, and continuity. Each dimension included 10 items with a total of 30 items. Corresponding to these items are three alternatives to answer using the triple Likert method (Agree, Undecided, Disagree). The total scale ranges between 30–90 degrees. A score of 90 is the highest score a student may obtain on the scale, and the closer a student is to this score, it is an indication of a decrease in electronic dropout. A score of 30 is considered the lowest score a student may obtain on the same scale, and the closer a student is to this score, it is an indication of the high dropout he/she has. The validity of the internal consistency of the scale was also verified by applying it to the exploratory population, and the results concluded that the correlation between each item in the scale and the axis to which it belongs ranged from 0.76–0.89. The correlation coefficients between the items and the scale ranged from 0.77–0.82. These are acceptable values that indicate the validity of the scale. The stability of the scale was also confirmed by the re-measurement method by applying it to the exploratory population as a first stage, and after a period of 2 weeks had passed since the application of the first stage, it was applied again as a second stage. Using the Pearson correlation coefficient, the stability coefficient was calculated, where the stability value was 0.90. The reliability of the scale was also calculated using Cronbach’s alpha method for internal consistency, where the calculated reliability value was 0.87. These values are acceptable and indicate the stability of the scale.
Procedures
The experiment was conducted in the second semester of the year 2023–2024 and lasted for 8 weeks. The educational content related to the second unit, integers, in the mathematics course was presented to the experimental group via interactive video clips using the Edpuzzle platform supported by LA, while the control group received the content via interactive video clips using the Edpuzzle platform without LA.
The learning environment relied on employing the Edpuzzle platform to manage video clips by:
Creating classrooms.
Downloading or retrieving video clips from video-sharing sites such as YouTube.
Providing free downloading of clips.
Enabling the recording and editing of video and re-watching each part separately.
Featuring the prevention of skipping any part of the video clip.
Offering the possibility of obtaining statistical information about whether a student watched the video or not, the last time they watched it, and the total percentage of completion of watching the video clip.
Controlling whether to allow watching the clip again.
Adding notes, comments, and questions within the video clips.
Obtaining feedback for students during the viewing process.
In accordance with the educational content objectives, nine digital video clips were designed, each no longer than 3 min, to cover all educational objectives. These clips were segmented to reduce the cognitive load. Furthermore, questions were included at the beginning and end of each segment within the videos.
An account was also created on the Edpuzzle platform, and the previously produced educational content was included, in addition to various questions and illustrative comments. Activities ranged between questions that depend on texts and others that depend on images, besides the answered questions through a short video that has been watched.
Five core data points were utilized for learning analytics within the edpuzzle. These included:
The completion percentage of full video viewing.
The time spent watching the video.
The correct and incorrect answers to the questions embedded within the video.
The number of views for each segment of the video.
The date and time of the last video viewing.
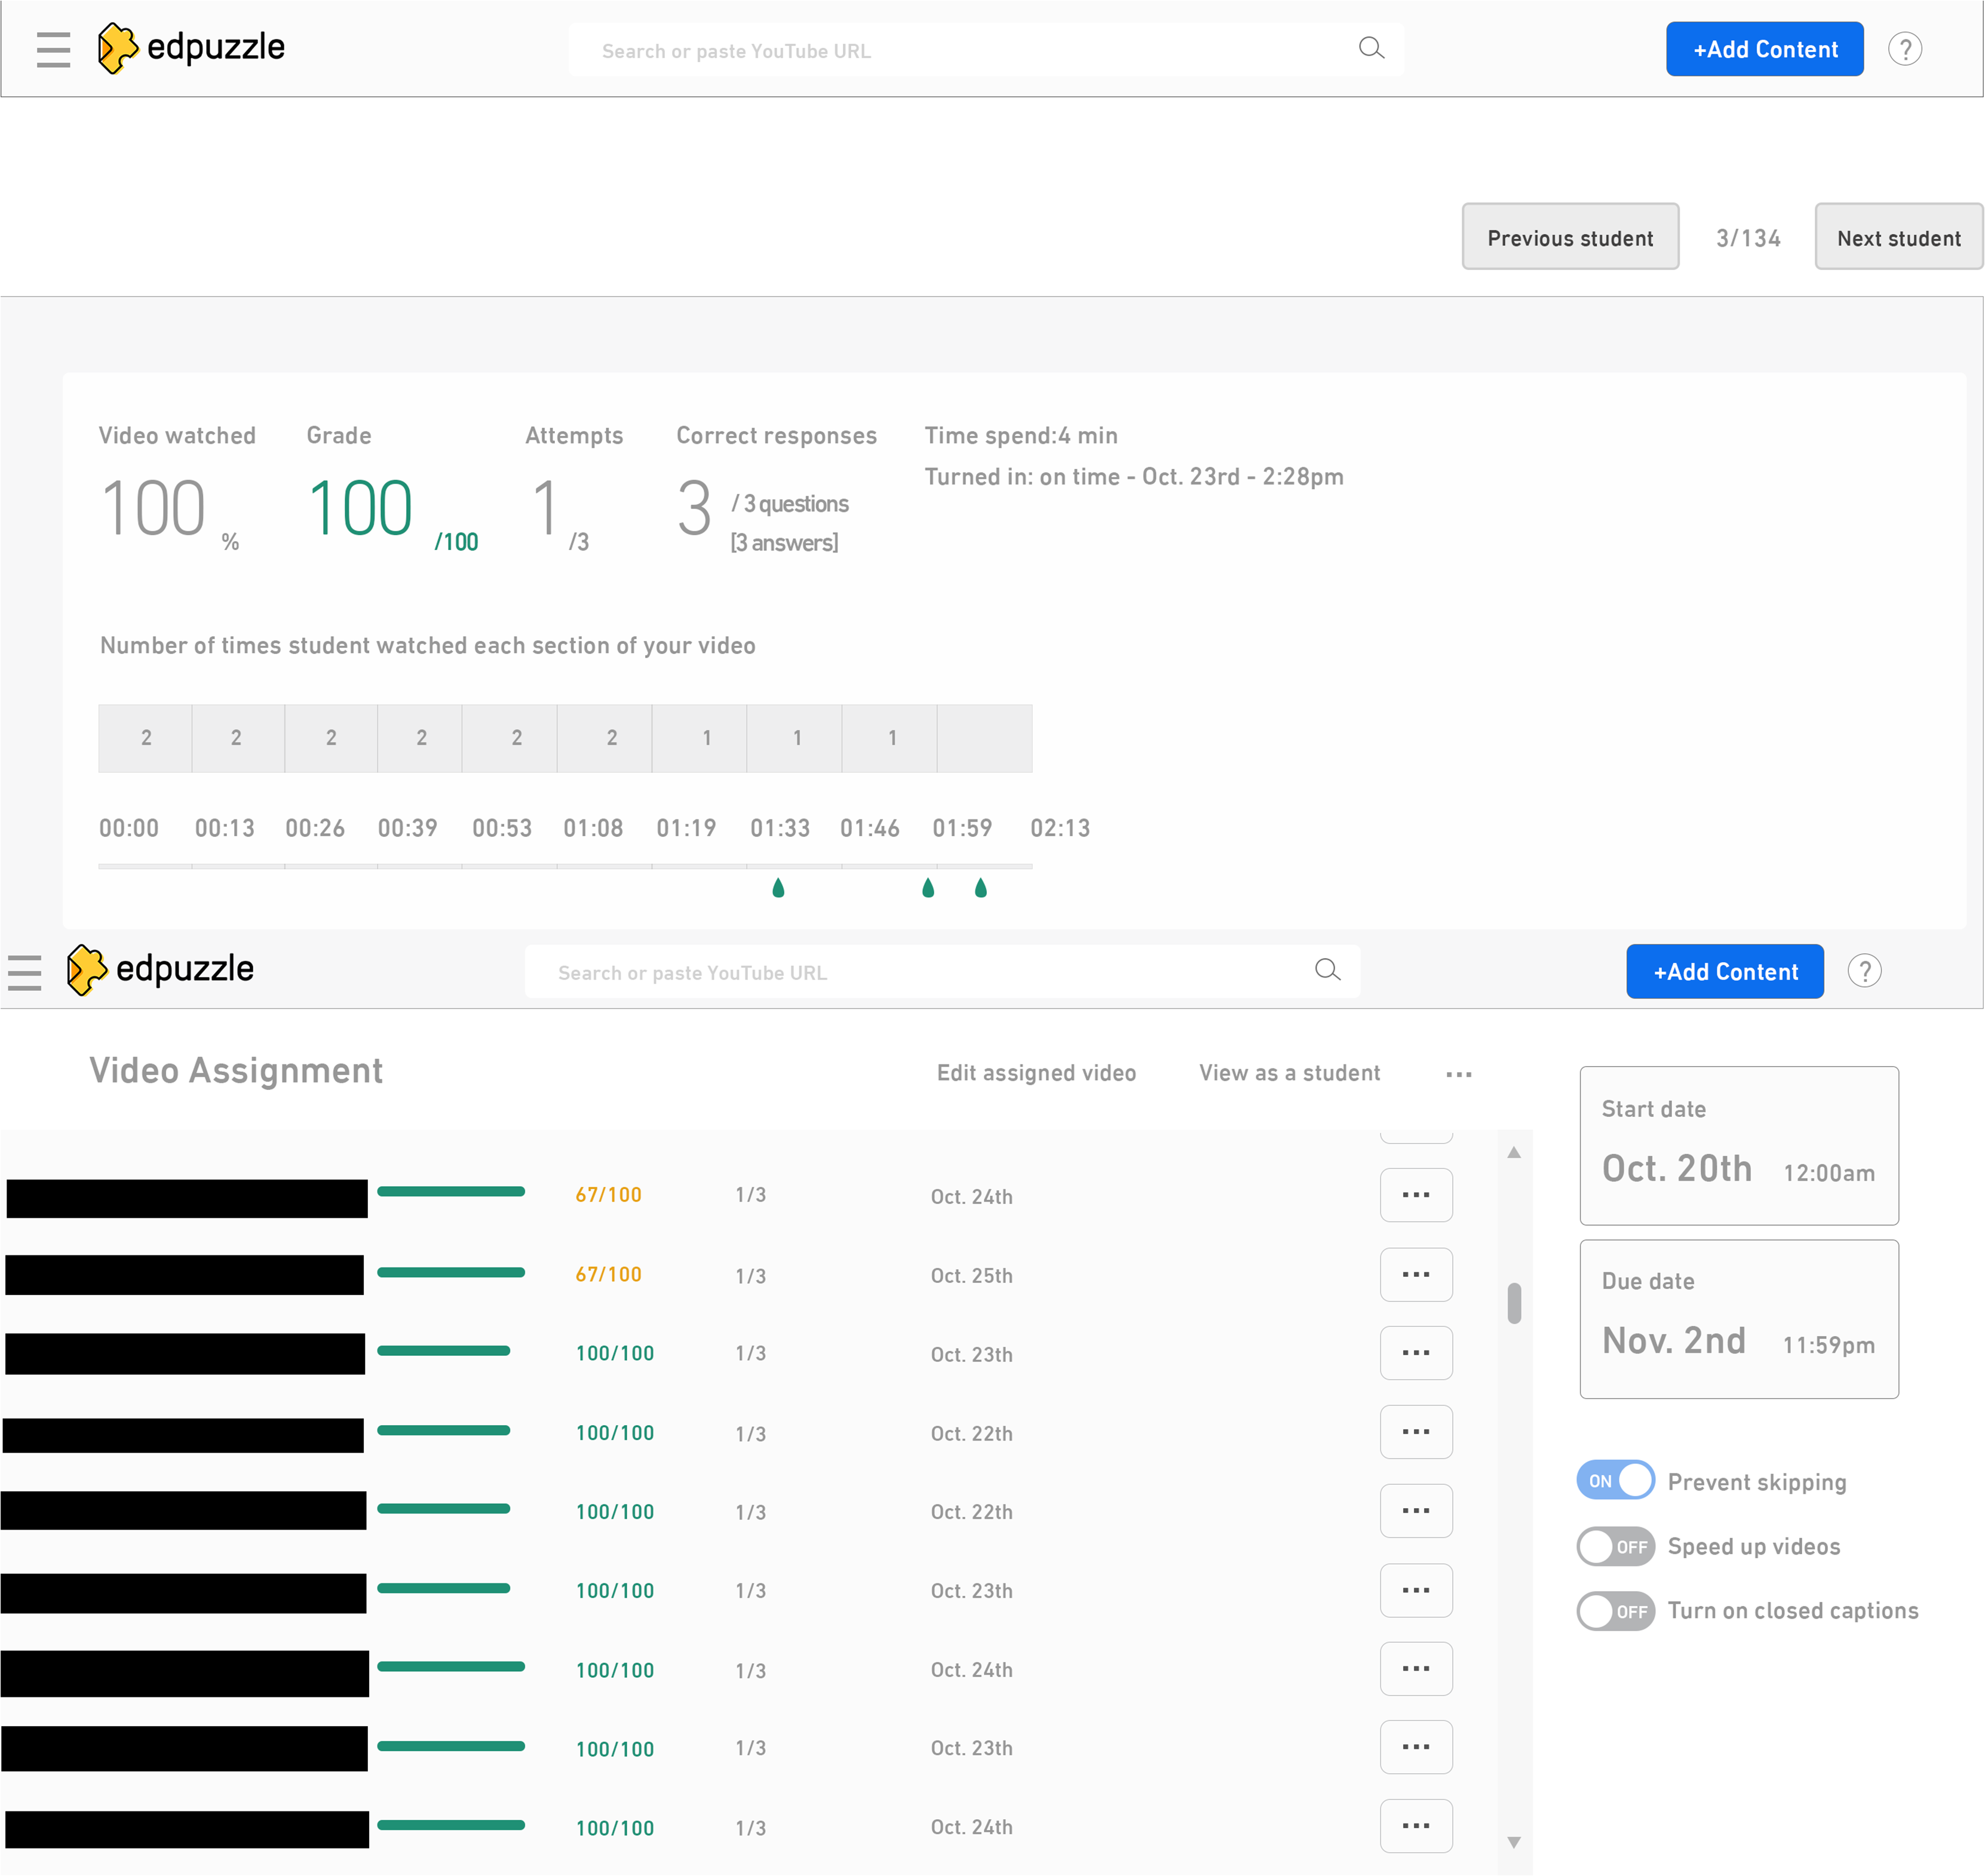
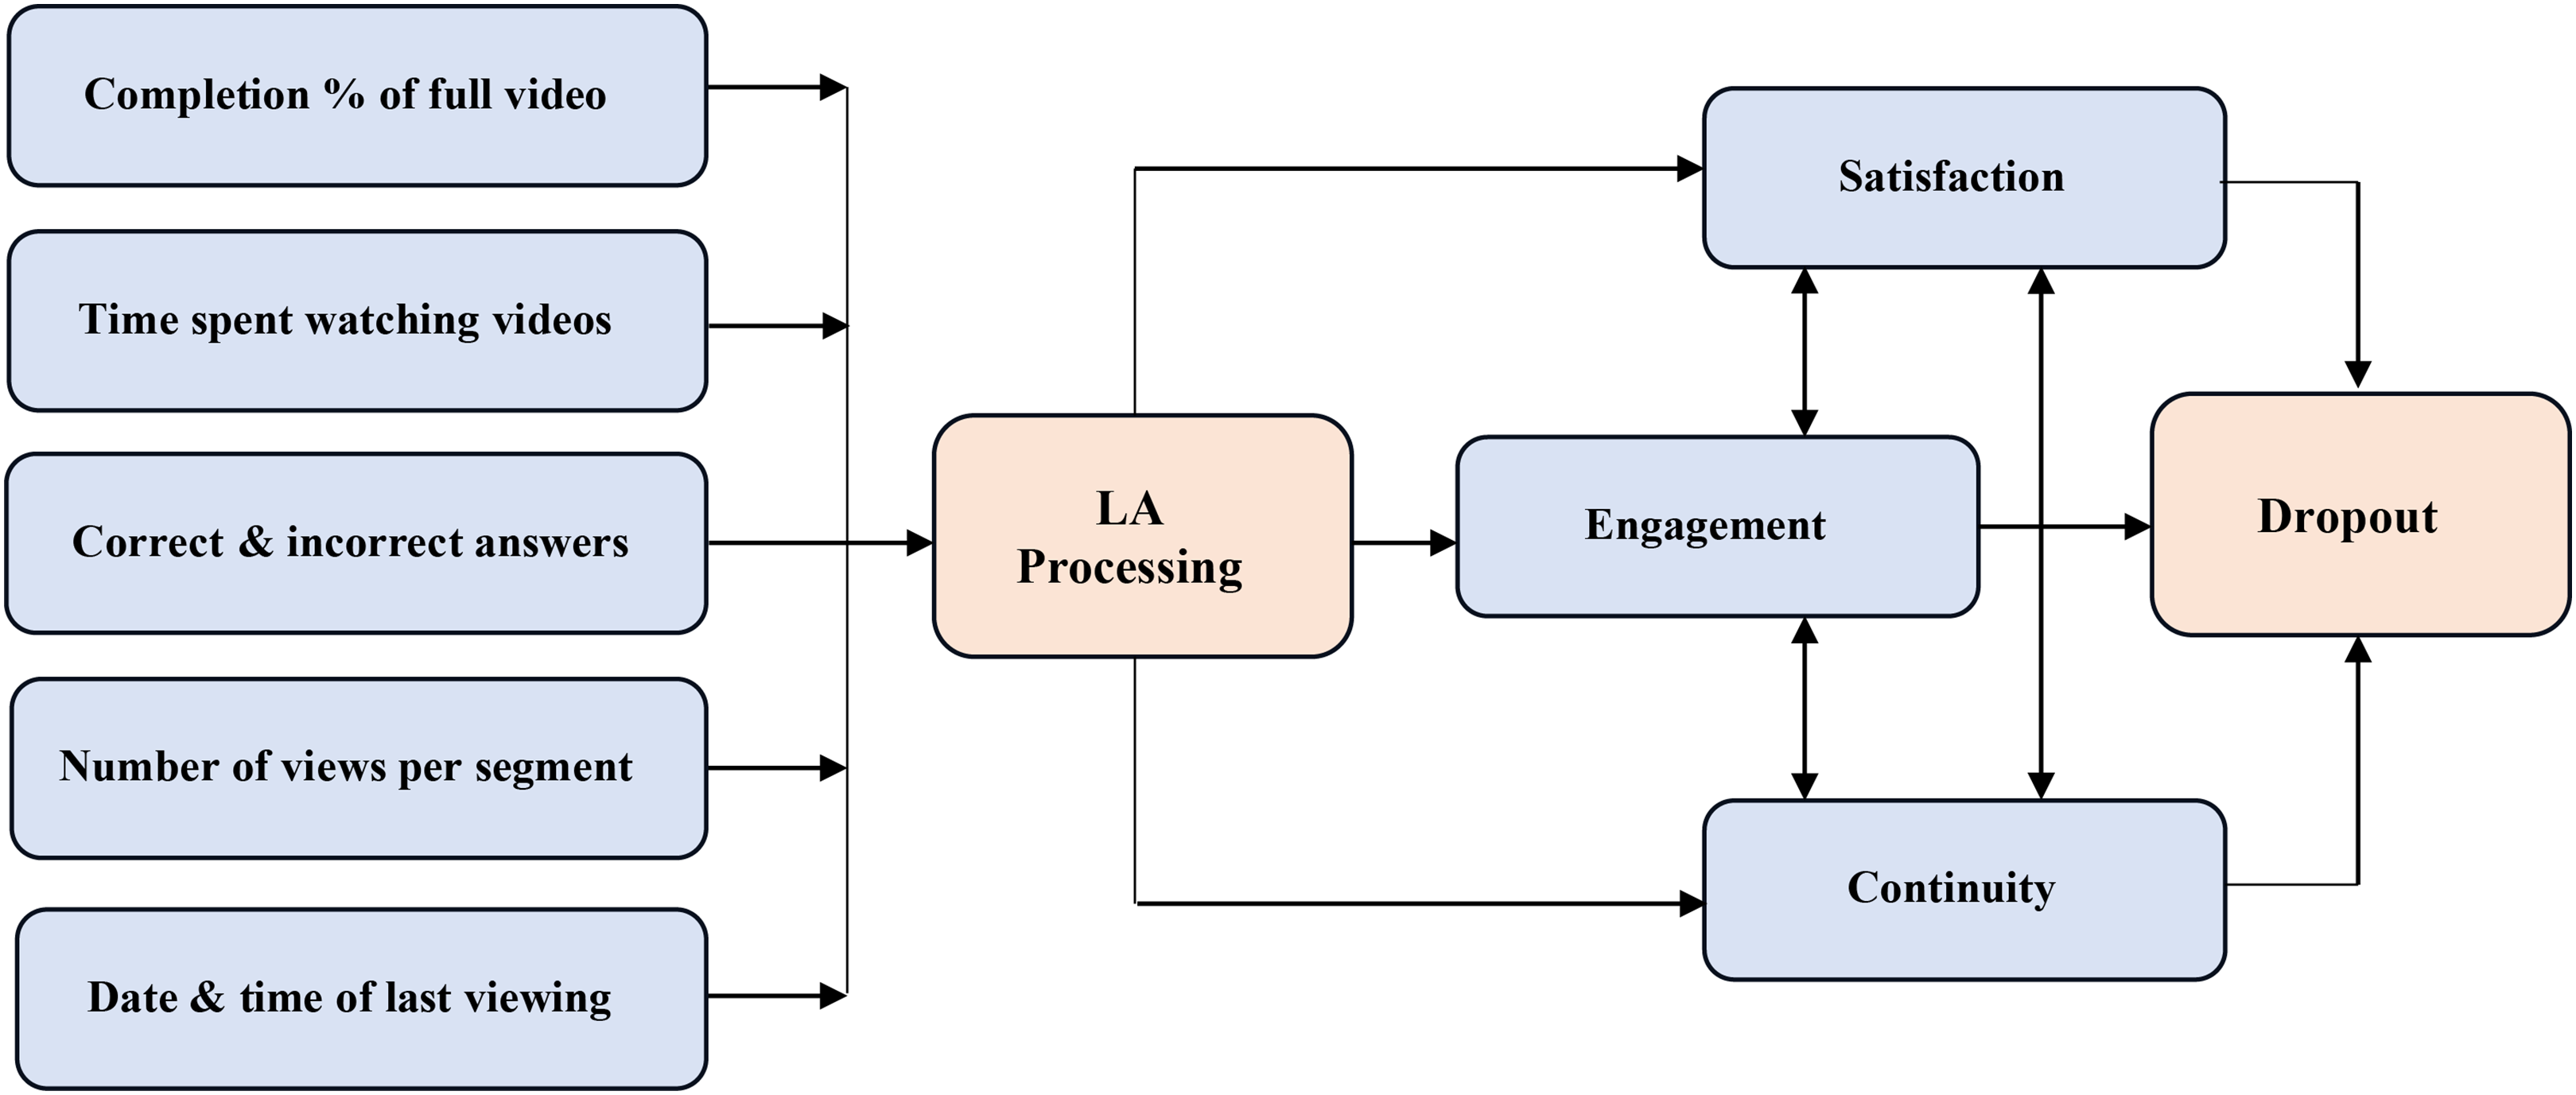
Figure 2 illustrates the learning analytics items used to prevent digital dropout and enhance sustainability rates in DVP.
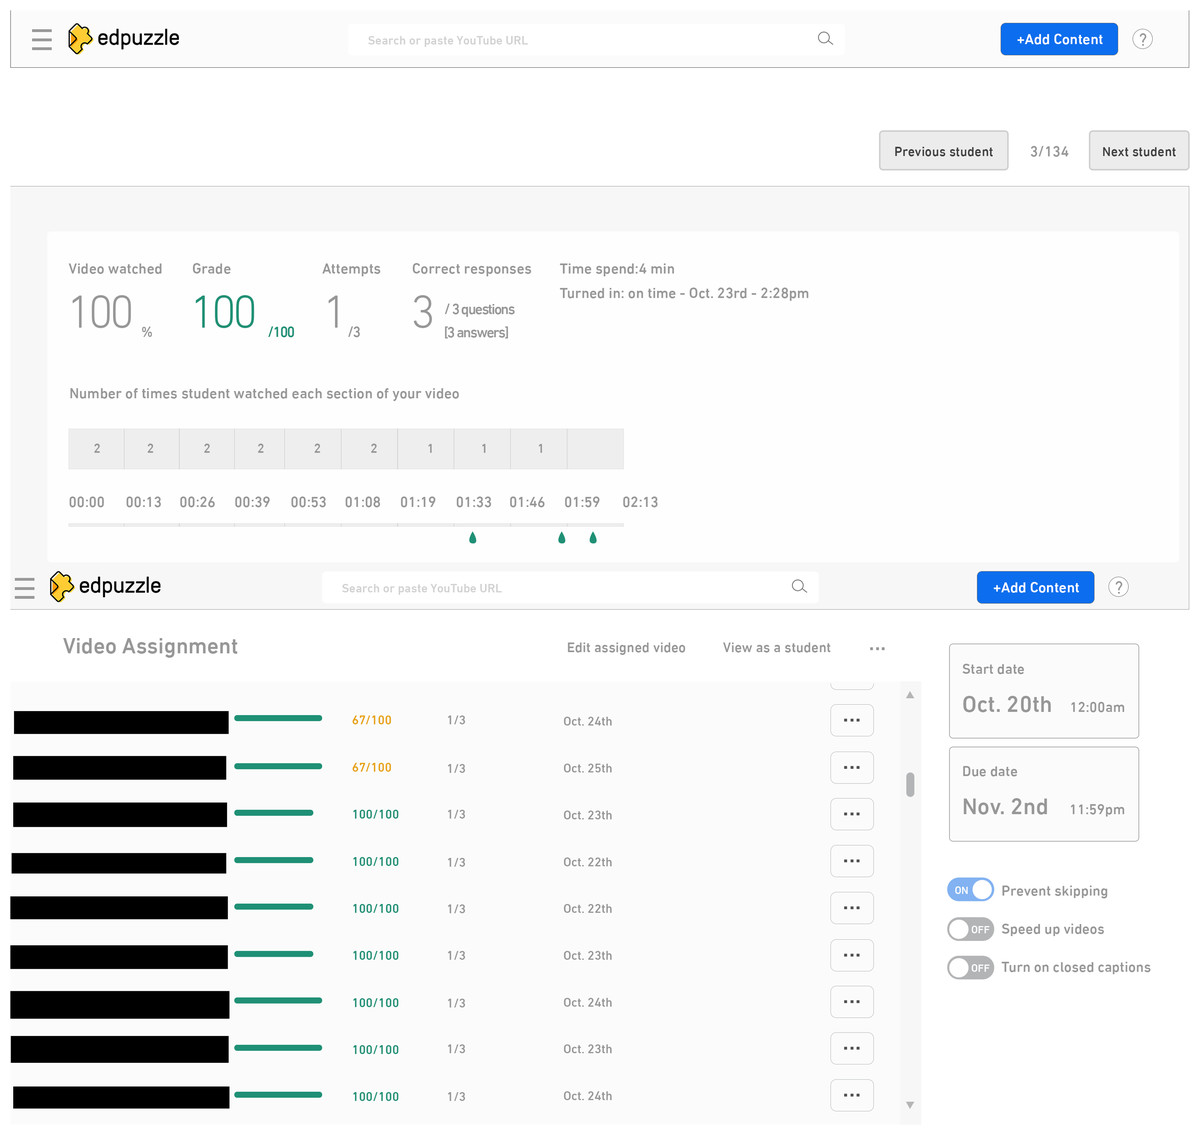
Figure 2: LA items used to prevent digital dropout.
According to the activities and behaviors of students in learning through DVP and their interaction with various videos, student performance was monitored and their data analyzed in five main dimensions. Based on the analysis outputs, a set of actions were taken to ensure the sustainability of learning through DVP and reduce digital dropout, whether for students with high performance or low performance, in order to ensure the sustainability of learning for all students. Table 1 shows the actions taken based on the outputs of LA.
| LA dimensions | Action in high stat | Action in low stat |
|---|---|---|
| Completion percentage | Guiding students to additional video clips | Guiding students to complete the remaining parts |
| Time spent watching | Provide students with additional questions | Guiding students to re-watch the entire video |
| Correct & Incorrect answers | Provide students with additional questions | Re-solve questions after watching the related parts |
| Number of views per segment | Guiding students to additional video clips | Guiding students to re-watch the important Segment |
| Date and time of last viewing | Guiding students to share the video with colleagues | Remind students to come back again to watch |
Table 1 illustrates how LA was used to provide insights into student behavior, allowing proactive measures to promote digital sustainability and prevent digital dropout. For example, when data showed low viewership of a video, students were instructed to complete the remaining portions or rewatch the entire video. Similarly, if students spent a short time watching a video or answered questions incorrectly, they were provided with additional questions or instructed to rewatch relevant portions. Through LA over DVB, patterns and trends indicating potential digital dropout were identified, and timely corrective action was taken. LA was used to personalize the learning experience for each student, providing the support and resources they needed to sustain learning.
Thus, the use of LA during the experiment contributed to improving the learning experience over DVB by:
Identifying students at risk of dropout: Using LA to identify students who were struggling with content or who were lagging behind their peers, these students were then provided with additional support through additional resources.
Improving video design: LA was used to identify the most engaging and least engaging parts of the videos. This information could be used to improve the design of the videos, making them more engaging and effective, whether by re-segmenting them if they were difficult, including additional questions, or improving the content presented.
Personalizing the learning experience: LA was used to personalize the learning experience for each student, providing the content and resources they needed to continue, even for high-performing students, as outstanding students are also at risk of dropping out if DVB is unable to meet their additional cognitive needs.
It is worth noting that a set of operational thresholds has been identified for the current LA system. These thresholds aim to monitor student performance and detect early indicators that may lead to digital dropout, thereby activating appropriate educational intervention. These thresholds have been identified as follows:
Completion percentage: A student’s viewing percentage of less than 100% of the total video duration is an indicator of digital dropout, even if it is minor, especially since all videos are short and do not exceed (3) minutes.
Actual time spent watching: A student’s actual viewing time less than the total video duration is considered evidence of a loss of educational content and partial dropout.
Correct and incorrect answers: If the percentage of incorrect answers exceeds 20%, or if the student ceases to interact with the questions included, this indicates that the required proficiency level (80%) has not been reached. This requires gradual intervention.
Number of views per segment: If the number of rewatches of important educational videos falls below at least two views per segment, this indicates incomplete viewing and weak engagement, requiring the student to be directed to rewatch.
Date and time of last viewing: If a student does not log in to the platform or watch any video within one day of the educational assignment or during the last day, this is a clear sign of potential digital dropout, requiring immediate intervention.
Based on these thresholds, cases showing signs of decreased engagement or activity are monitored to activate appropriate interventions, as shown in Table 1, to prevent digital dropout and ensure actual engagement, not superficial engagement or engagement.
Results
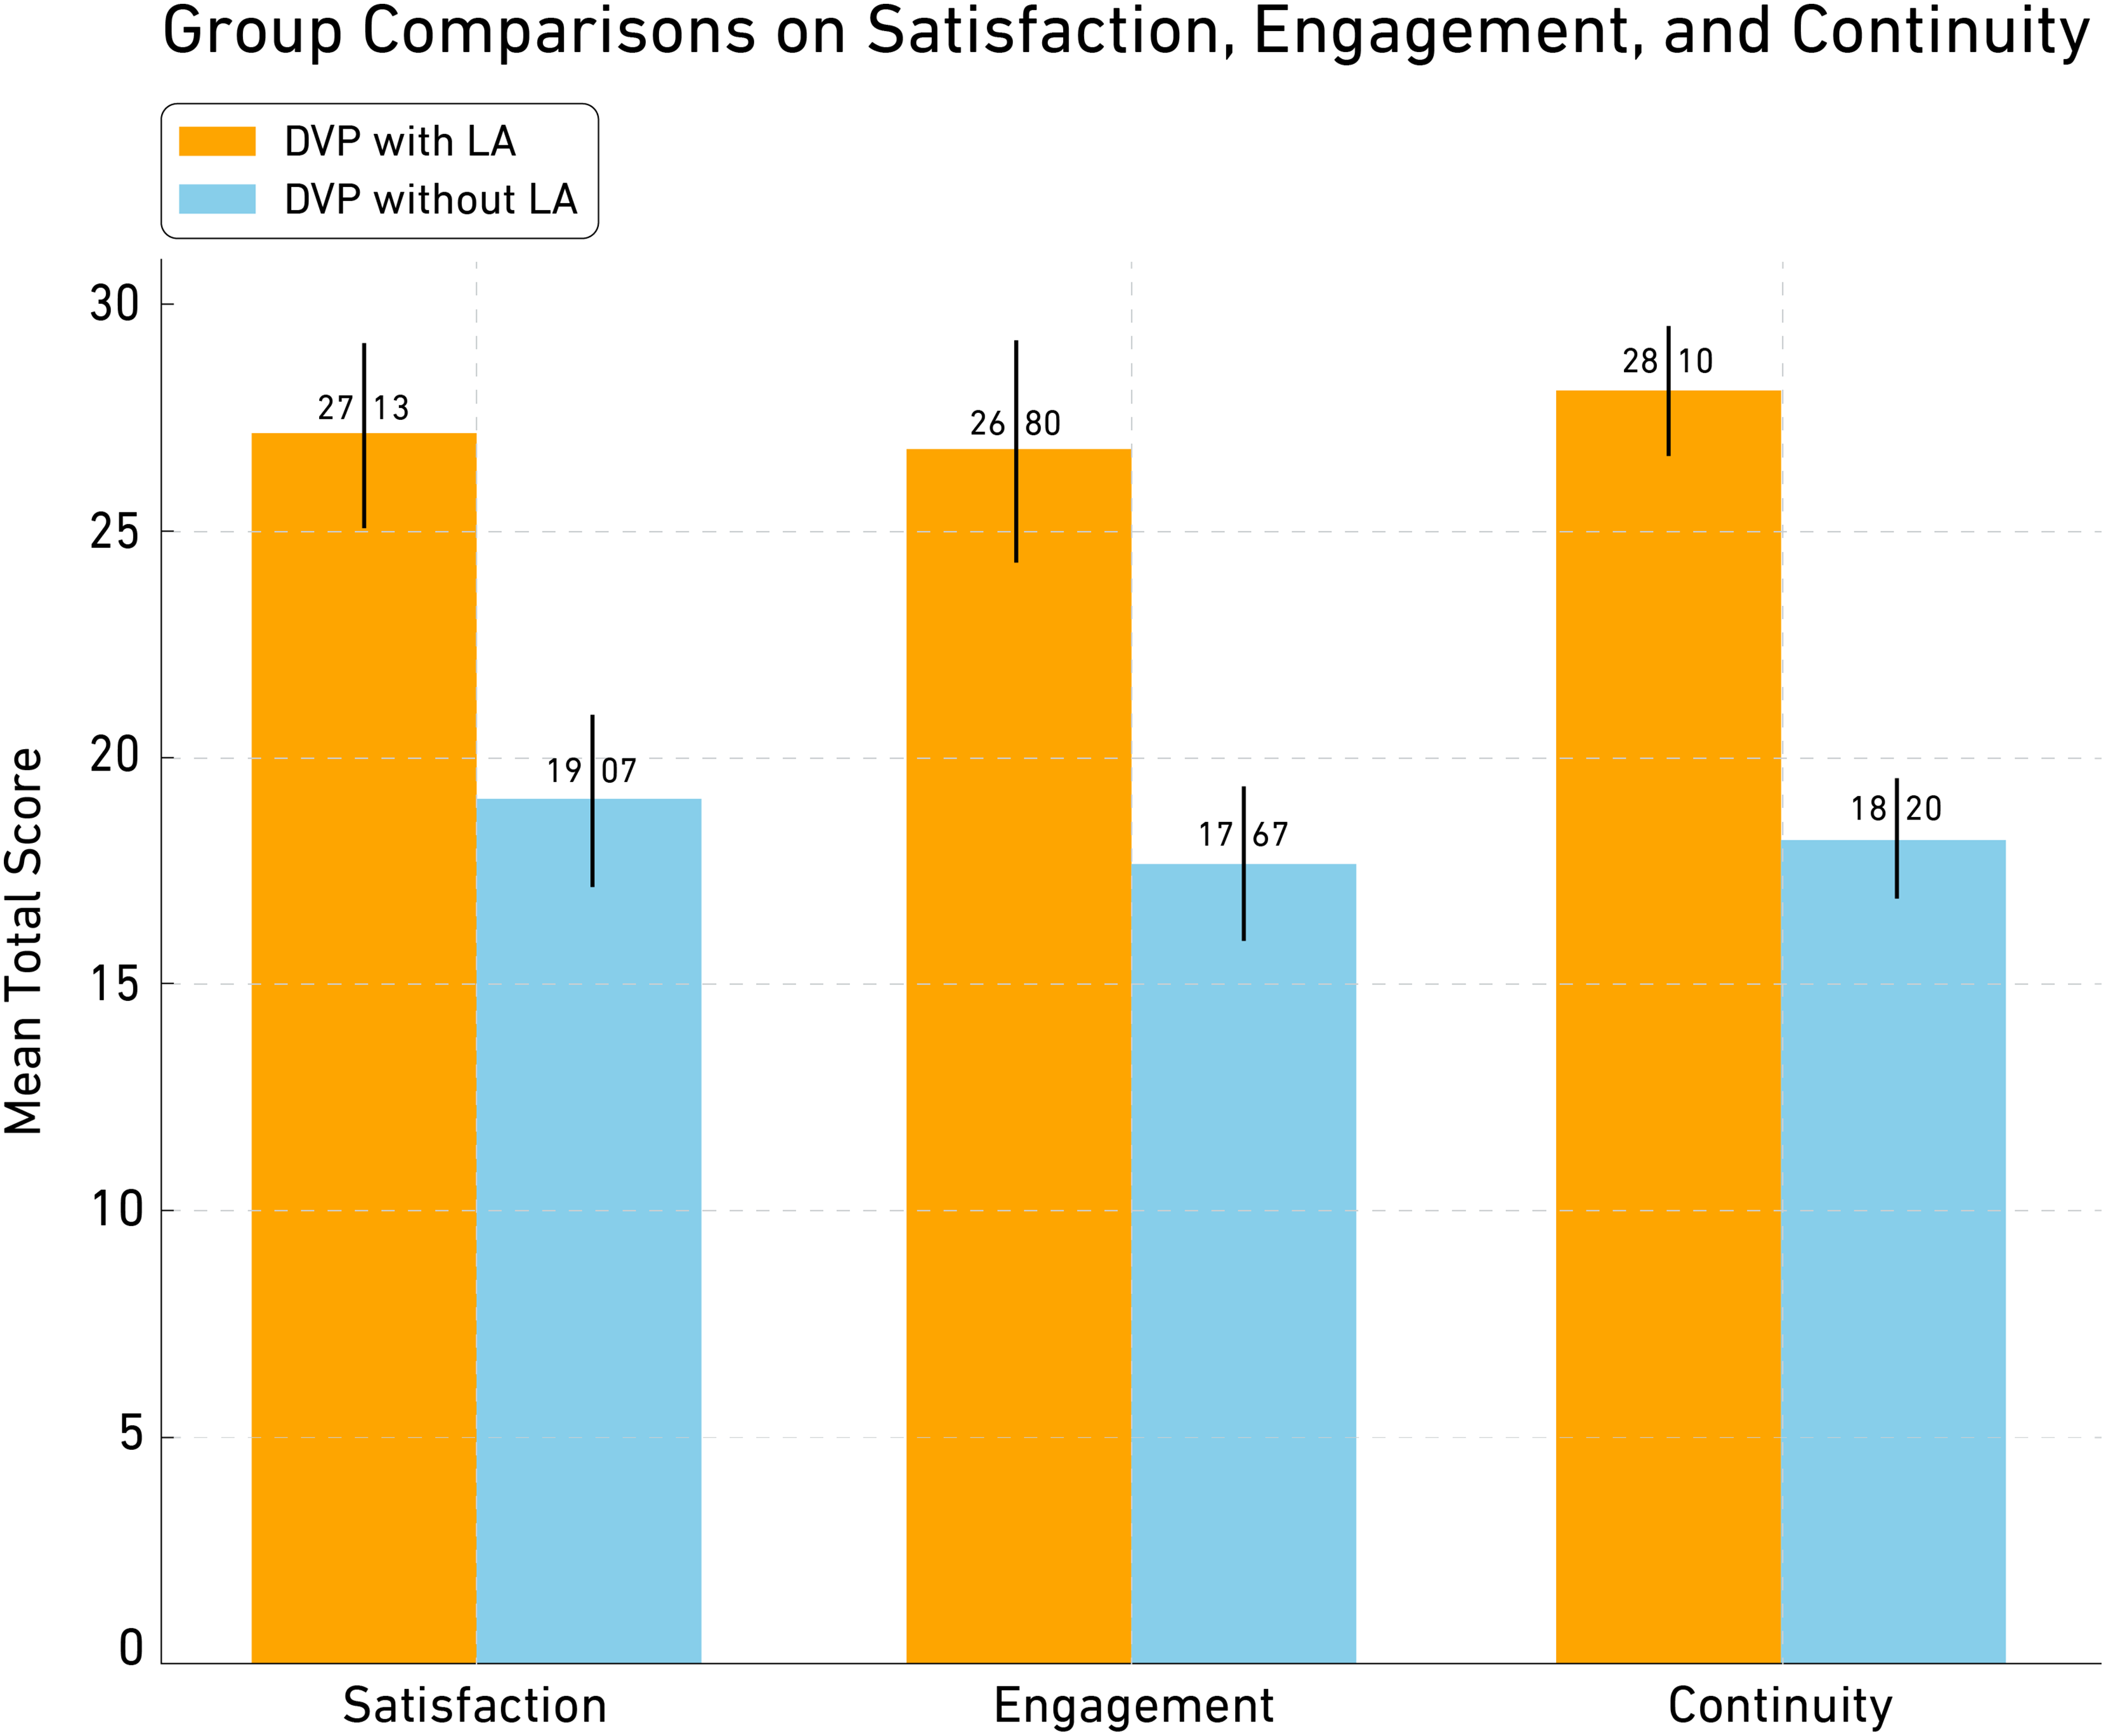
Table 2 shows the arithmetic means and standard deviations for the three dimensions of digital dropout: satisfaction, engagement, and continuity, for the two research groups: the group of students who used DVP with LA and the group who used DVP without LA. This table aims to reveal descriptive differences between the two groups in each of the three dimensions before conducting advanced statistical analyses.
| Dimension | Group | M | SD | N |
|---|---|---|---|---|
| Satisfaction | G1–DVP with LA | 27.13 | 2.06 | 30 |
| G2–DVP without LA | 19.07 | 1.93 | 30 | |
| Engagement | G1–DVP with LA | 26.80 | 2.47 | 30 |
| G2–DVP without LA | 17.67 | 1.71 | 30 | |
| Continuity | G1–DVP with LA | 28.10 | 1.45 | 30 |
| G2–DVP without LA | 18.20 | 1.35 | 30 |
Table 2 shows that the means of the three digital dropout dimensions—satisfaction, engagement, and continuity—were significantly higher for the first group of students who used DVP with LA compared to the second group, who used DVP without LA. The mean satisfaction (M = 27.13) vs. (M = 19.07) for the second group, the mean engagement (M = 26.80) vs. (M = 17.67), and the mean continuity (M = 28.10) vs. (M = 18.20), indicating that integrating LA into DVP contributes to higher levels of student satisfaction, engagement, and continuity in learning compared to using the platform alone without LA. These preliminary results show descriptive differences in favor of the experimental group that benefited from LA features, supporting the hypothesis that using these analyses enhances the quality of the educational experience and reduces digital dropout. Figure 3 shows a visual comparison between the means of the two groups on the dropout dimensions for the three axes—satisfaction, engagement, and continuity—with the descriptive difference being evident for the group using DVP with LA.
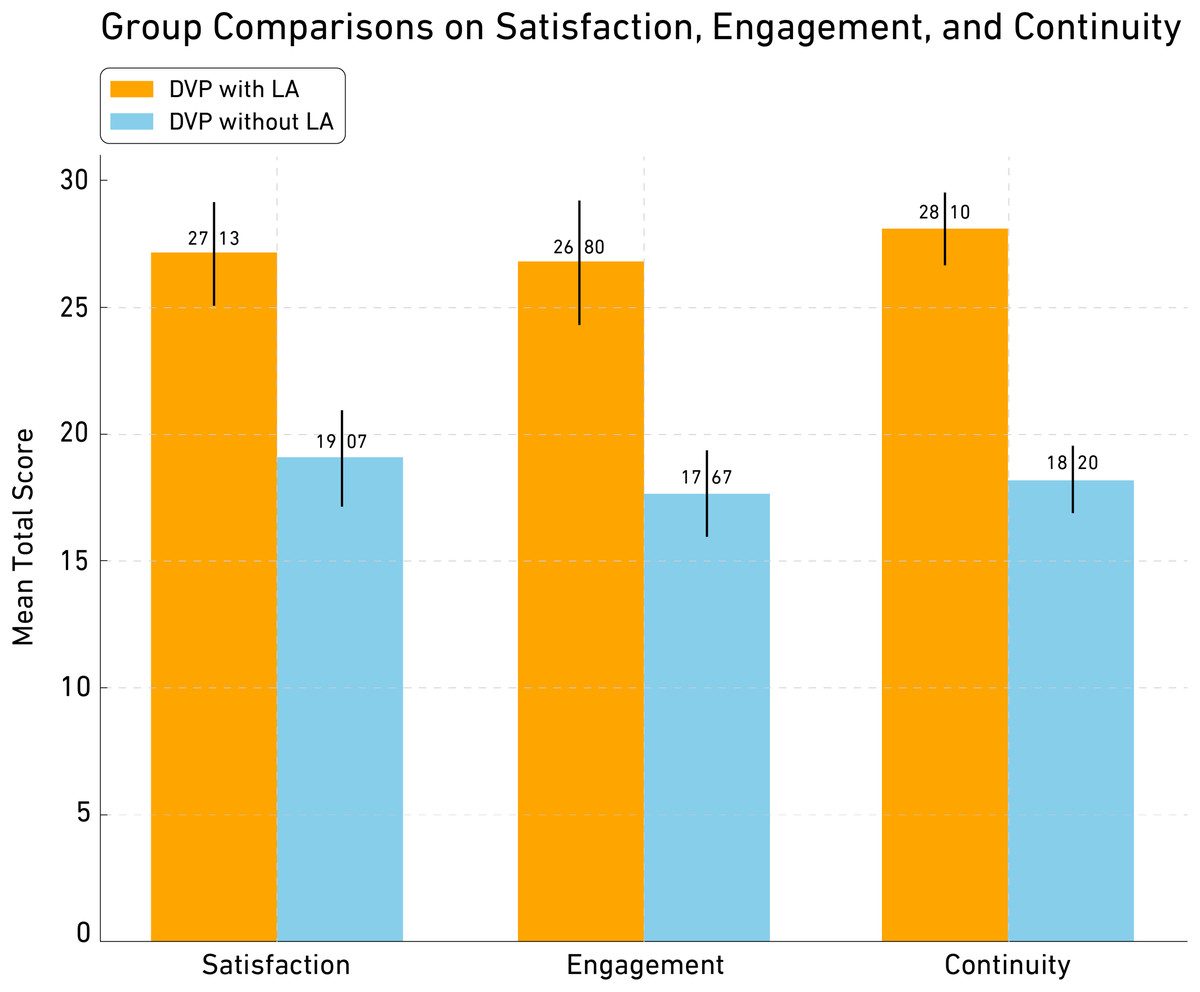
Figure 3: Group comparison on dropout.
After determining the arithmetic means and standard deviations for the three dimensions of the digital dropout—satisfaction, engagement, and continuity—for the two research groups, multivariate analysis of variance (MANOVA) was used to verify the presence of statistically significant differences between the two groups on the combined dependent variables. This test is appropriate because the three dimensions are related and measure a common aspect: the level of digital dropout among students. Table 3 shows the results of the MANOVA using the Pillai’s Trace and Wilks’ Lambda tests to determine the significance of the differences between the two groups.
| Effect | Test | Value | F | Hypothesis df | Error df | Sig. |
|---|---|---|---|---|---|---|
| Groups | Pillai’s trace | 0.962 | 472.92 | 3 | 56 | 0.000 |
| Wilks’ lambda | 0.038 | 472.92 | 3 | 56 | 0.000 |
Table 3 shows that there are statistically significant differences between the two groups in the combined dependent variables: satisfaction, engagement, and continuity, according to the values of Pillai’s Trace and Wilks’ Lambda. The value of Wilks’ Lambda was 0.038 and the value of Pillai’s Trace was 0.962, which are both statistically significant at the (Sig. = 0.000) level. These results indicate a significant effect of LA over DVP in reducing digital dropout and improving the three dimensions among students, which justifies moving to the subsequent analysis of variance (ANOVA) test to determine the dimensions in which these differences appeared more specifically, as shown in Table 4.
| Dimension | F | Sig. | Partial η2 |
|---|---|---|---|
| Satisfaction | 244.72 | 0.000 | 0.808 |
| Engagement | 277.56 | 0.000 | 0.827 |
| Continuity | 751.27 | 0.000 | 0.928 |
Table 4 shows the ANOVA results for each dimension of digital dropout separately, after the MANOVA test revealed significant overall differences between the two groups. The results indicate statistically significant differences at the Sig. = 0.000 level in all three dimensions: satisfaction, engagement, and continuity, in favor of the group that used DVP with LA. The value of (F = 244.72) for the satisfaction dimension reached a high effect size (Partial η2 = 0.808), while the value of (F = 277.56) for the engagement dimension reached a high effect size (Partial η2 = 0.827), while the continuity dimension achieved the highest significance value (F = 751.27) with the largest effect size (Partial η2 = 0.928). These high values of the η2 coefficient indicate that the integration of LA into DVP is a powerful factor in enhancing student satisfaction, engagement, and continuity, thus reducing digital dropout rates and improving the quality of the educational experience.
Furthermore, it was important to explore the interrelationships between the three dependent variables that collectively constitute the components of the digital dropout. Although the differences between groups confirmed the effectiveness of LA, these analyses do not clarify how the dimensions relate to each other. To address this gap, Pearson correlation and multiple regression analyses were conducted to examine both the strength of the overall relationships and the predictive paths between the three dimensions. Table 5 demonstrates the correlation analysis between the dimensions of satisfaction, engagement, and continuity.
| Variable | Satisfaction | Engagement | Continuity |
|---|---|---|---|
| Satisfaction | 1.00 | 0.834 | 0.881 |
| Participation | 0.834 | 1.00 | 0.846 |
| Continuity | 0.881 | 0.846 | 1.00 |
Table 5 shows the Pearson correlation coefficients between the three dependent dimensions: satisfaction, engagement, and continuity. The results indicate strong, statistically significant positive correlations at the 0.01 level across all dimensions. The correlation between satisfaction and engagement was (r = 0.834, p < 0.01), between satisfaction and continuity (r = 0.881, p < 0.01), and between engagement and continuity (r = 0.846, p < 0.01). These results indicate that higher student satisfaction with DVP is associated with higher levels of engagement and continuity in learning. The strength of these relationships also suggests that these dimensions are interconnected, and that enhancing one of them, such as satisfaction or engagement, contributes to enhancing continuity and reducing digital dropout rates.
Given the strong, statistically significant correlations between the three dimensions: satisfaction, engagement, and continuity, a multiple regression analysis was conducted to examine the predictive relationships between these variables in greater depth. Table 6 shows the regression model with satisfaction as the dependent variable, Table 7 shows the regression model with engagement as the dependent variable, and Table 8 shows the regression model with continuity as the dependent variable.
| Predictor | B | SE B | β | t | Sig. | VIF |
|---|---|---|---|---|---|---|
| Constant | 4.432 | 1.253 | — | 3.537 | 0.001 | — |
| Engagement | 0.278 | 0.098 | 0.311 | 2.830 | 0.006 | 3.511 |
| Continuity | 0.539 | 0.096 | 0.618 | 5.616 | 0.000 | 3.511 |
| Predictor | B | SE B | β | t | Sig. | VIF |
|---|---|---|---|---|---|---|
| Constant | 0.754 | 1.744 | — | 0.433 | 0.667 | — |
| Continuity | 0.486 | 0.137 | 0.497 | 3.553 | 0.001 | 4.464 |
| Satisfaction | 0.443 | 0.157 | 0.396 | 2.830 | 0.006 | 4.464 |
| Predictor | B | SE B | β | t | Sig. | VIF |
|---|---|---|---|---|---|---|
| Constant | −0.408 | 1.530 | — | −0.267 | 0.791 | — |
| Satisfaction | 0.660 | 0.118 | 0.577 | 5.616 | 0.000 | 3.278 |
| Engagement | 0.373 | 0.105 | 0.365 | 3.553 | 0.001 | 3.278 |
Table 6 presents the results of a multiple regression analysis predicting satisfaction based on the variables of engagement and persistence. The model was found to be statistically significant (p < 0.001), indicating that these two variables explain the variance in students’ satisfaction with the learning environment across DVP. The results showed that both engagement (β = 0.311, p = 0.006) and persistence (β = 0.618, p = 0.000) had a positive and statistically significant effect on satisfaction, indicating that increased student engagement and persistence in learning clearly contribute to higher levels of satisfaction with the learning environment. Continuity was found to be the strongest predictor of satisfaction, as students who consistently continue their learning activity tend to report higher levels of satisfaction. The VIF value of 3.511 also indicates no multicollinearity between the variables, enhancing the reliability of the statistical model.
Table 7 shows the results of a multiple regression analysis predicting engagement based on continuity and satisfaction. The model demonstrated statistical significance (p < 0.001), indicating that the two variables together explain a significant proportion of the variance in students’ engagement with the learning environment via DVP. Both continuity (β = 0.497, p = 0.001) and satisfaction (β = 0.396, p = 0.006) were found to have a positive and statistically significant effect on engagement levels, meaning that students who are more satisfied with their educational experience and who maintain continuity in their learning tend to have higher levels of engagement and active engagement. Continuity appeared to be the strongest predictor of engagement, reflecting that continued engagement in educational activities contributes to increased interaction and activity within the DVP. The VIF value of 4.464 also indicates no collinearity between the independent variables, enhancing the reliability of the model and the validity of its statistical results.
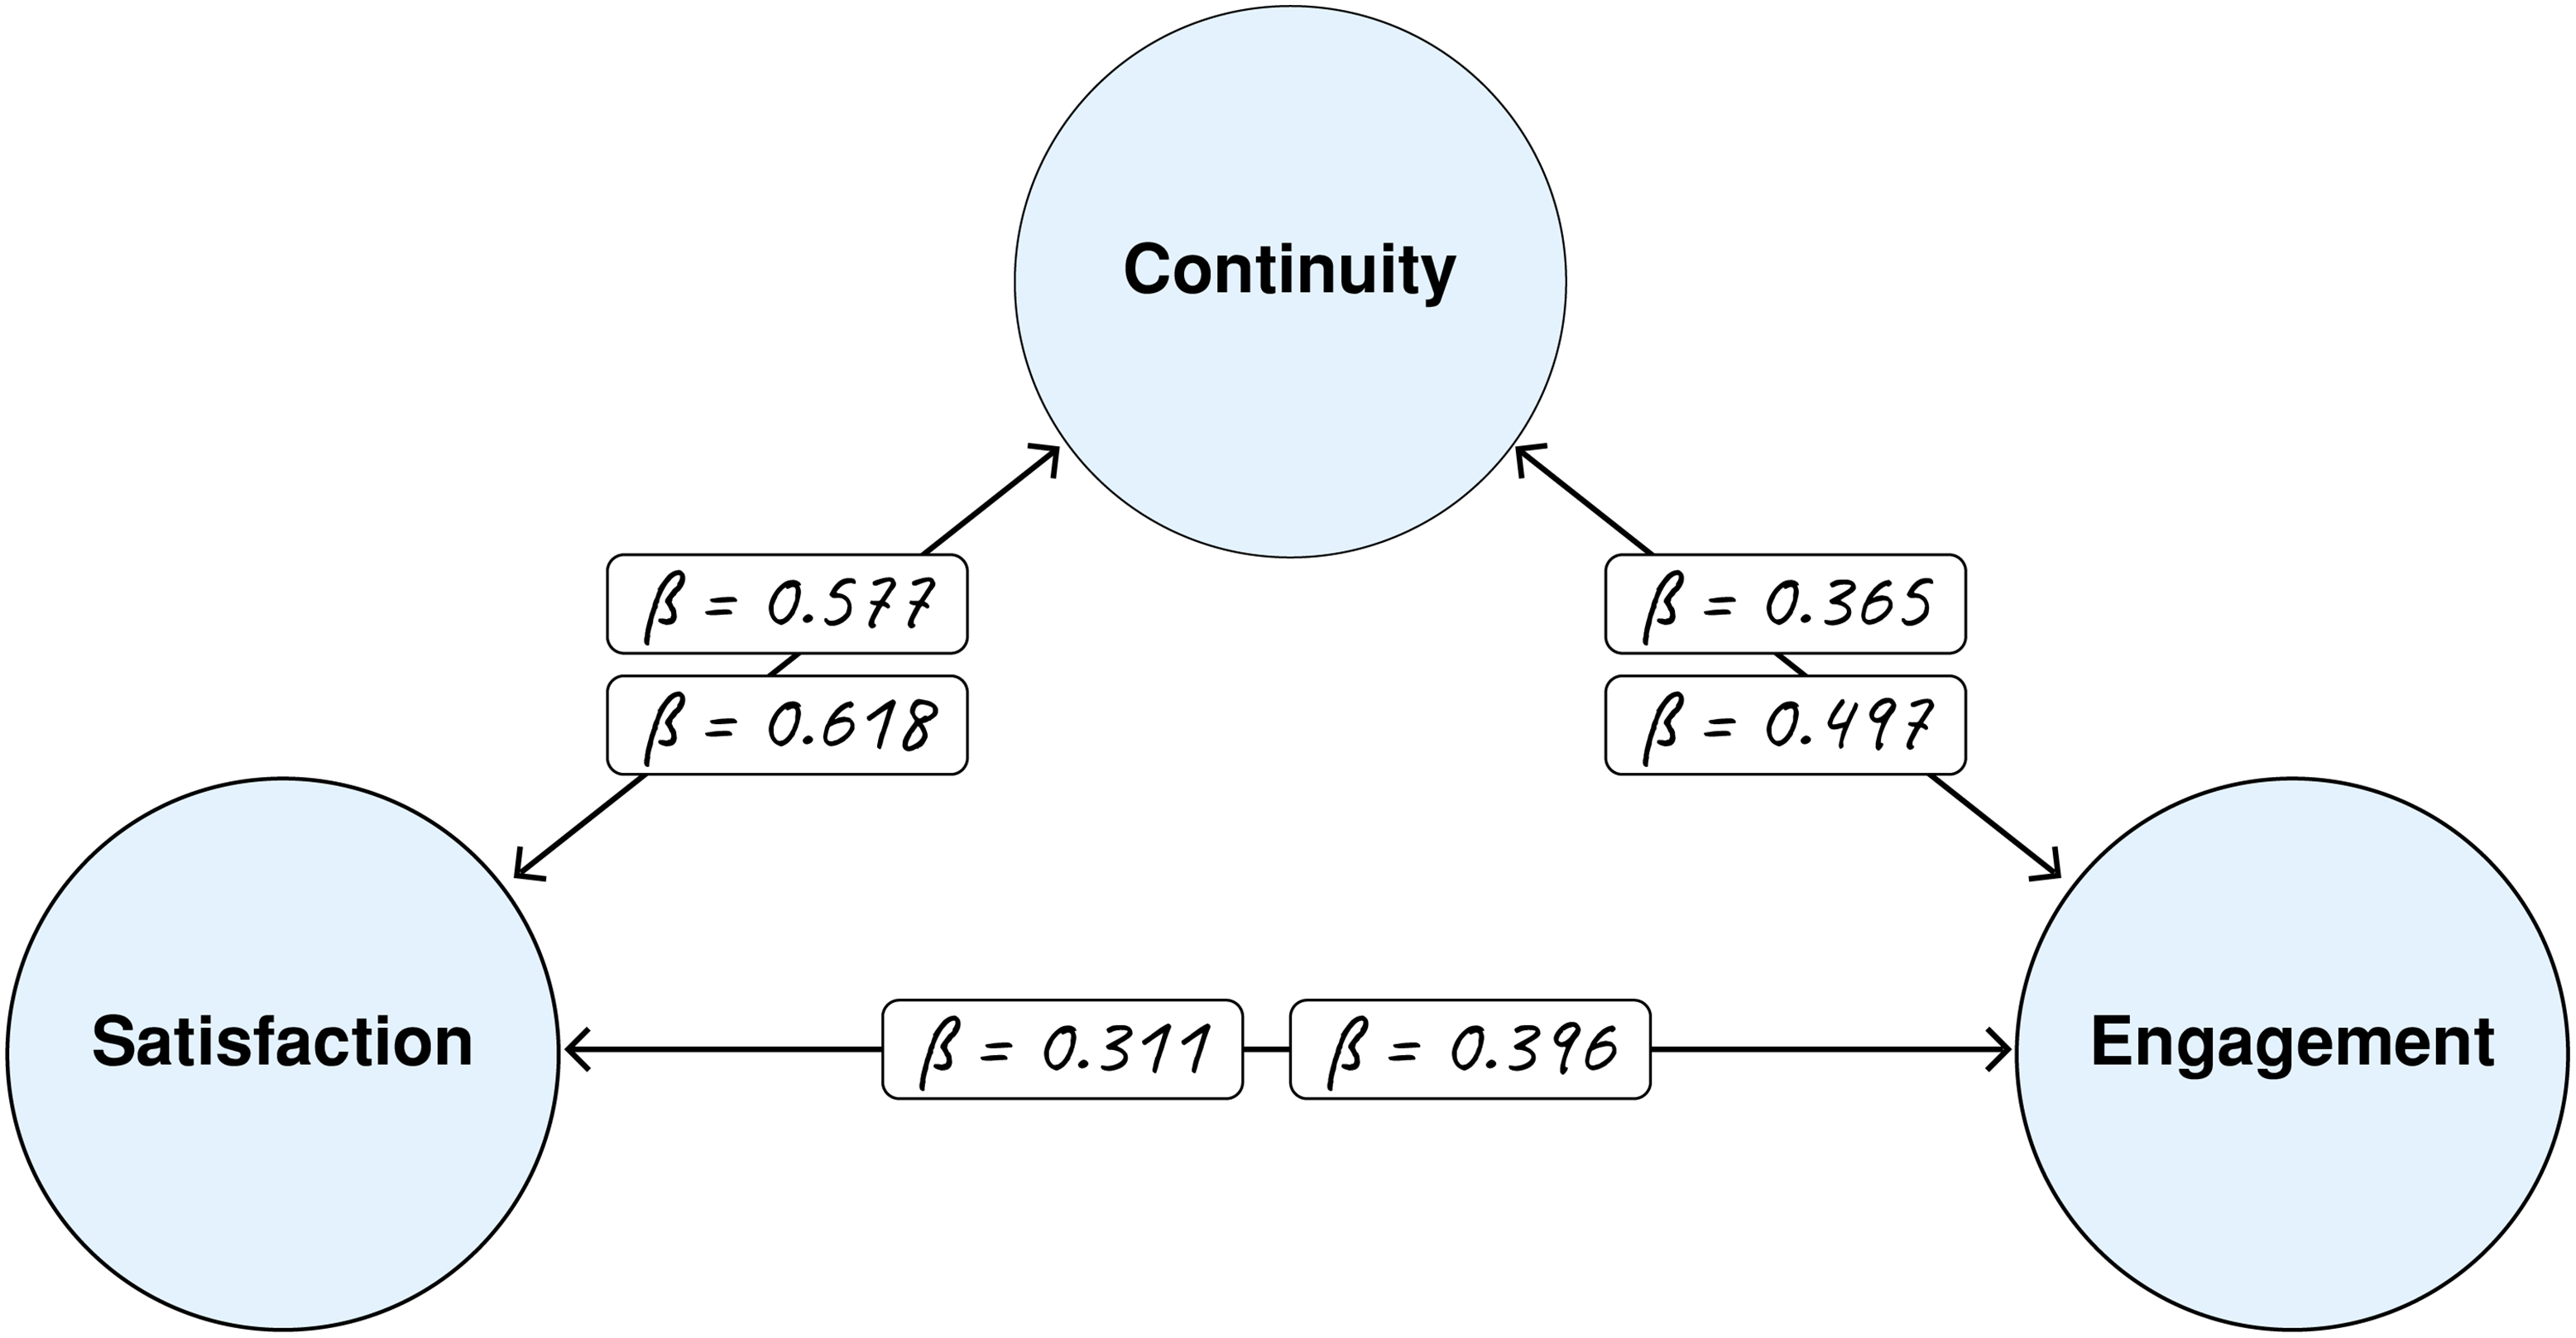
Table 8 shows the results of a multiple regression analysis predicting persistence through satisfaction and engagement. The model was found to be statistically significant (p < 0.001), indicating that these two variables, together, explain the variance in student learning persistence within the DVP. The results showed that both satisfaction (β = 0.577, p = 0.000) and engagement (β = 0.365, p = 0.001) had a positive and statistically significant effect on persistence. This means that students who were more satisfied and engaged in learning were more likely to persist in their educational tasks. Satisfaction was found to be the strongest predictor of persistence, reflecting that student satisfaction is a crucial factor in their persistence in learning within the DVP. The VIF value of 3.278 also indicates no multicollinearity between the independent variables, confirming the validity of the statistical model and the accuracy of its interpretation. Figure 4 shows the predictive paths between the three dimensions, with both satisfaction and engagement predicting continuity, while continuity supports both satisfaction and engagement. This conceptualization underscores the circular and reinforcing nature of the digital dropout phenomenon. Figure 4 also summarizes all six predictive relationships between the three variables, with β values indicating the strength and direction of the relationship based on multiple regression analysis.
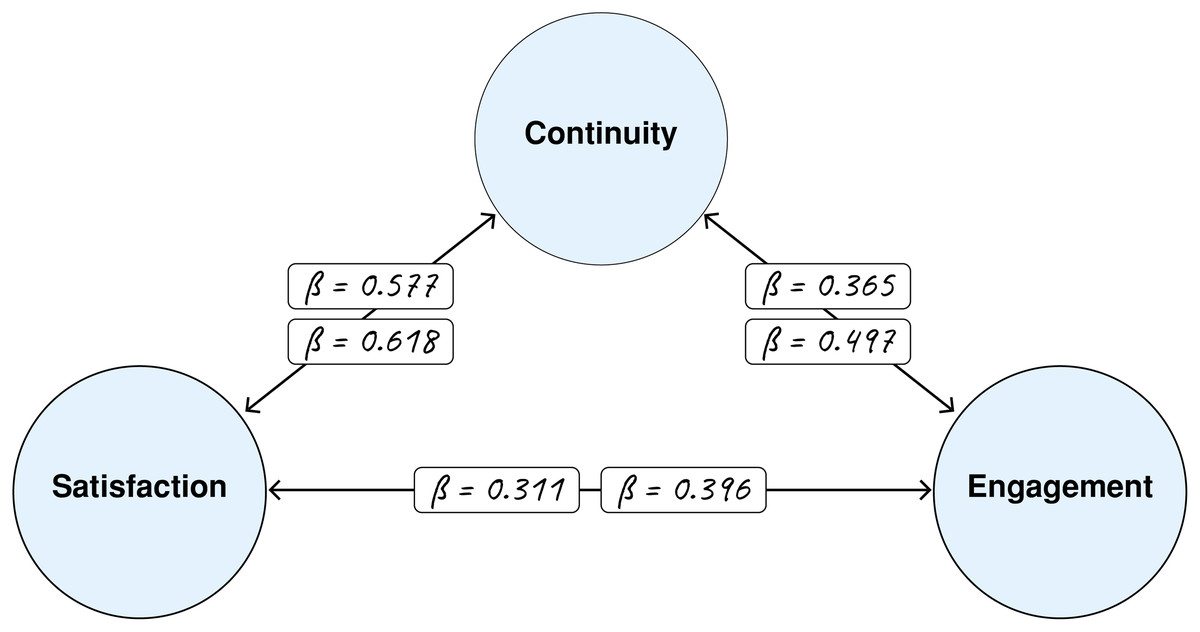
Figure 4: Interrelationship model of satisfaction, engagement, and continuity.
Therefore, the overall results revealed a complementary relationship between all studied variables, demonstrating how LA indicators via DVP contribute to student satisfaction, engagement, and continuity, ultimately leading to a reduction in digital dropout. To summarize these interconnected relationships and provide a comprehensive visualization of the results, Fig. 5 presents a model that links all dimensions into a unified framework. Figure 5 illustrates the conceptual map that illustrates the relationship between video-based LA indicators and their impact on student satisfaction, engagement, and continuity, which contributes to a reduction in digital dropout. The model demonstrates that the learning analytics process includes indicators such as the percentage of video completion, time spent watching, correct and incorrect answers, number of views per clip, and date and time of last viewing; produces educational insights that help improve the learning experience. Together, these indicators contribute to increased student satisfaction, increased engagement in learning, and enhanced continuity. The two-way arrows between satisfaction, engagement, and continuity indicate the reciprocal relationships between these variables, indicating that improving one enhances the other, thereby reducing the likelihood of digital dropout. This figure clearly summarizes the role of LA in transforming raw behavioral data into meaningful interpretive patterns that contribute to predicting and reducing the risk of dropout.
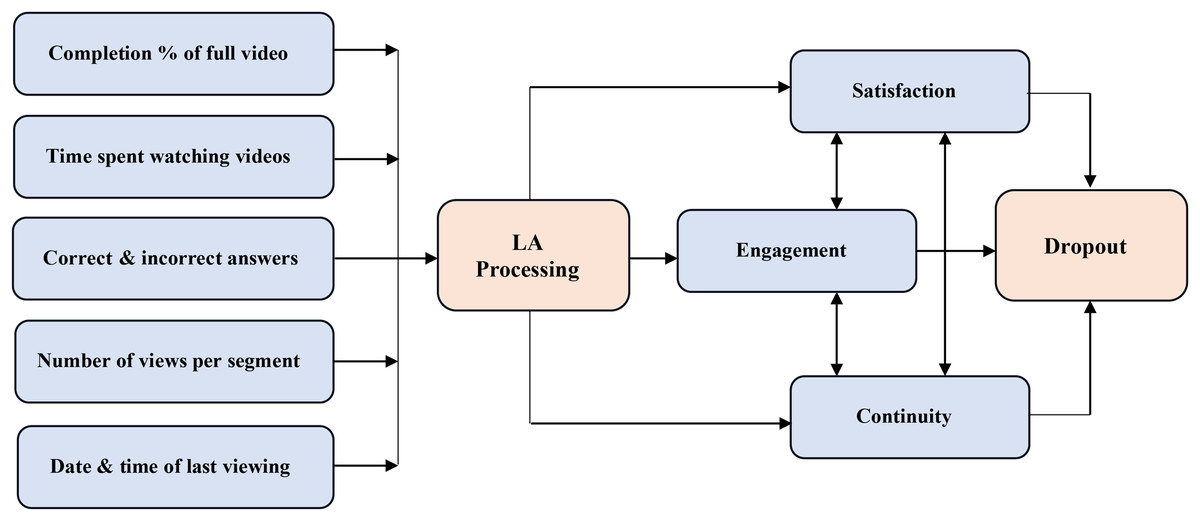
Figure 5: Model of the effects of LA Indicators on dropout.
Discussion
The results of analyzing quantitative data related to the impact of LA via DVP on reducing digital dropout among primary school students revealed that students who learned in a DVP based on LA achieved higher rates of reduction in digital dropout compared to students who learned in a DVP without LA. The results can be discussed through the following three dimensions:
Satisfaction
Students’ satisfaction is considered as a crucial element that contributes to the quality and acceptance of learning via DVP. It also helps in measuring the effectiveness of course books being taught online (Alwahaby et al., 2022). Some factors that affect students’ satisfaction are the difficulty in dealing with the digital instrument, lack of continuous support, frustration and boredom. If these factors are not overcome on time, they may cause dissatisfaction with the educational environment (Aldowah et al., 2020). LA via DVP offers various ways to enhance student satisfaction by tracking digital traces (views, assessments, tests, and time spent on tasks) to provide personalized learning environments (Zain-Alabdeen, 2023). Through these statistics, we could identify the videos that were not watched completely and evaluations that were not accomplished. Some of the reasons that caused that were: some students prefer short videos and to minimize the information in the videos in addition to their desire to vary tests and not being satisfied with one type of tests which is multiple-choice questions; the thing that helped provide educational environments that suit the preferences of each student. This aligns with Constructivist Theory, which stresses the importance of designing a suitable environment that facilitates active learning and positive engagement. Under this theory, students construct their own knowledge, learning best when they positively interact with resources tailored to their interests (Bada & Olusegun, 2015; Banihashem et al., 2022). Moreover, providing instant and continuous feedback based on LA for students contributed to motivate students, arouse their interests, and feel comfortable while using the DVP (Xu, Bautista & Yang, 2024). Providing immediate feedback and comments after an incorrect answer enables the student to re-study the challenging content until mastery is achieved. This also serves to direct the student to complete video viewing or listen to accompanying audio commentary. For the video clip, it directly helped students enjoy and feel comfortable and reduce boredom and frustration when using the DVP in learning. This result aligns with Motivation Theory, which stresses leveraging student needs for better learning. By tracking student interactions on the DVP, the system can identify their needs and deliver suitable interventions (comments and notes) that encourage and motivate them. The more the student’s needs are satisfied, the more his/her performance will be reflected (Khalil, Prinsloo & Slade, 2023). In addition, the LA environment can explore problems that students may face when using digital video, which makes the process of using this environment simple and easy to use (Wong & Li, 2020). Monitoring student actions on the platform enables the diagnosis of progress hindrances—such as issues with video playback or test completion—so that suitable support can be delivered. This, in turn, creates a state of activity, focus, and desire to learn through the video platform. This can be explained through the Flow Theory, which states that one of the main components of the flow experience is receiving immediate feedback, which includes course corrections and patches of improvement in performance. By monitoring students’ behaviors and educational performance, appropriate interventions and immediate support are made; this is with the aim of maintaining the flow channel and ensuring that one does not withdraw from educational activities (Pastushenko et al., 2020). Tracking student activities and performance within the DVP, coupled with feedback and comments based on LA reports, fostered student ownership of their learning and a continuous desire to improve their performance (Amashi, Koppikar & Vijayalakshmi, 2023). All the above greatly helped in students’ satisfaction with the learning environment based on LA, thus increasing their rates of engagement in learning, which is reflected in their continuity in completing educational tasks and activities and reducing their digital dropout (Bañeres et al., 2023). These results are consistent with many studies that indicated that the use of LA has positive effects on the learning process and learner’s satisfaction (Quadri & Shukor, 2021; Susnjak, Ramaswami & Mathrani, 2022; Zheng et al., 2023).
Despite these positive results, there are some limitations that should be taken into account when interpreting the impact of LA on student satisfaction. The sample was limited in size and was restricted to a single mathematics course, which may affect the generalizability of the results to other disciplines or educational settings. Furthermore, relying on satisfaction surveys may make the results susceptible to momentary or social biases. Additionally, while the instructor may have a role in enhancing student satisfaction through direct interaction with them, this role is primarily based on the outcomes of LA, which enabled them to intervene effectively and provide appropriate support at the appropriate time, indirectly enhancing satisfaction. Although video formats and pedagogical elements, such as short duration and varied tests, may have an impact on student satisfaction, this is consistent with the nature of the current digital age, characterized by the effectiveness of short videos, especially when combined with LA, which allows for precise monitoring of learner preferences and adapting the learning environment to suit their needs. Thus, there is a need for more extensive future studies that include different courses and disciplines, using longitudinal designs to measure the continuity of satisfaction over time, and combining quantitative data from LA with qualitative data such as interviews and observations, to help build a deeper understanding of the drivers and dimensions of student satisfaction.
Engagement
A crucial factor for developing positive attitudes toward digital learning is ensuring effective and adequate student engagement. This requires the necessary effort and psychological commitment to remain active participants in acquiring knowledge and building skills. It is important in the learning process and has a positive impact on participants’ satisfaction (Kaliisa & Dolonen, 2023). Key challenges limiting student engagement in digital learning environments include: the suitability of learning strategies for task planning and organization, difficulty building social relationships, lack of immediate feedback, and process deficiencies. Enhancing learner performance, these challenges, if not overcome on time, tend to reduce the effective engagement of learners (Kew & Tasir, 2022). LA via DVP fostered better student engagement by creating environments that track key metrics, including the number of cooperative tasks, test/evaluation statistics based on social help requests, and the quantity of learner comments (Kleftodimos & Evangelidis, 2014). These statistics enabled exploring the learner’s engagement in this environment and his/her interaction with his/her peers and teacher through the number of times the learners visit the platform and reach the questions and evaluations, number of questions raised, and uncompleted activities (Ustun et al., 2023). Suitable interventions were implemented to boost engagement, primarily by encouraging students with low engagement to interact. This guidance, based on tracking student activities and providing performance feedback, increased the effectiveness and efficiency of the e-learning environment and fostered knowledge creation. Consequently, the learner’s ability to gain knowledge and acquire skills increases. This strengthened the construction of the mental model of the learner by relying on the Constructivist Theory that emphasizes the learner’s activity and that he/she learns best when he/she interacts positively with educational activities and tasks and through his cooperation and engagement with his/her peers in learning (Bada & Olusegun, 2015). Regular tracking and monitoring of student progress in completing activities and tasks motivated them to finish tests and assessments, which boosted their engagement rates. This led to appropriate interventions that helped students submit work efficiently and meet required educational outcomes. The accomplishment of activities related to tests and assessments in group work has increased the students’ ability to interact and engage in the learning environment which motivates them to think and build knowledge and develop it through social interactions that occur inside work groups. This result supports the Motivation Theory where the learner is more active and engaged in learning if he/she is helped and motivated while accomplishing educational tasks (Lonn, Aguilar & Teasley, 2015). This is what happened in the LA environment through which it was possible to benefit from tracking the learner’s digital traces and conducting the appropriate intervention that is considered an incentive to complete the learner’s educational tasks (Khalil, Prinsloo & Slade, 2023). Providing instant feedback to facilitate communication and cooperation among students to get engaged in educational activities and complete the unfinished assignments and supporting the learners in the right time while learning led to the accomplishment of educational tasks and assignments in a smooth and easy way away from stress and anxiety. This also increases the motivation rate and desire to accomplish those tasks and improves the learning experience and the students’ active engagement to a great extent. This is reflected in preventing dropout, frustration, and weak performance. This result is in line with the Cognitive Load Theory which believes that learning accompanied by follow-up, instant evaluation, and appropriate feedback processes contributes to managing the students’ cognitive load (Strohmaier et al., 2023). When LA is used to track the learner’s performance, through which the learner is provided with instructions related to completing educational tasks and provides the information he/she needs at the appropriate time, then the learner can focus on completing those tasks, progressing in the achievement and performance processes, and reducing the increase in his/her cognitive load. All the above-mentioned contributed to students’ engagement in the learning environment based on LA, which was reflected in their educational performance and desire to learn; thus, reducing their digital dropout (Bağrıacık Yılmaz & Karataş, 2022). These results are consistent with several previous studies (Bakar & Sabli, 2023; Banihashem et al., 2022; Caspari-Sadeghi, 2022) which emphasized that the use of LA has important roles in supporting students’ engagement in digital educational environments.
Despite the above findings, there are some considerations that should be taken into account to more critically understand the impact of LA on student engagement. The research focused on quantitatively observable patterns of engagement, such as the number of views and grades obtained. However, engagement encompasses qualitative dimensions that are difficult to measure with numerical data alone, such as the depth of interaction in discussions, the quality of collaboration between students, and the extent to which they feel a sense of belonging to the learning community. Furthermore, the activities designed within the experiment were specific to the nature and needs of the course, which may make the impact of analytics on engagement more tied to a specific activity pattern than generalizable to all forms of engagement. Furthermore, the increased engagement in this research may be linked to the direct support students received when their engagement levels were low, raising the question of whether LA alone is sufficient to stimulate engagement, or whether it becomes more effective when combined with human-based intervention. These findings open the way for future research that could explore dimensions of engagement not captured in quantitative data, examine the relationship between the design of educational activities and the level of engagement, and test the sustainability of engagement across diverse courses and over a longer period of time, incorporating qualitative tools such as student interviews and observations to gain a deeper understanding of engagement motivations and behaviors.
Continuity
The issue of students’ continuity in learning is considered of great importance according to researchers and educators and has implications for the learner’s sense of connection and commitment to the educational process via digital platforms. Therefore, we should make use of tools that contribute to preserving the learner and ensuring his/her continuity and engagement in learning, as these factors help students’ engagement and are a good indicator of their satisfaction with the educational environment (Ye, 2022). Learning via the DVP faces several problems that hinder learner continuation, including weak digital skills, a lack of attractiveness and excitement in video design, the feeling that the environment is unimportant or burdensome, and insufficient encouragement, support, and motivation. If these problems are not addressed appropriately, they will have impacts on the learner’s continuity in the learning process (Hartati, Islami & Rahmad, 2023).
The LA environment showed that learning via DVP has the ability to enhance the students’ continuity in the learning process, by containing several tools through which it is possible to observe the percentage of students completing watching the full lesson clips, as well as the students who did not complete watching the lesson clips (Shelby & Fralish, 2021). Therefore, several instant interventions can be made to identify the difficulties they face and prevent them from continuing learning and providing them with the appropriate support which helps them continue watching video clips for complete lessons. This result can be interpreted based on the principles of the Flow Theory, as putting the learner in a state of immersion in educational activities by performing rapid interventions based on analyses that help him/her overcome the problems he/she faces while learning via DVP and maintain the flow channel that leads to its continuity and not withdrawing from educational activities (Pastushenko et al., 2020). The LA environment via DVP can meet the emotional needs of students, such as feeling interested, satisfied, and comfortable, which is reflected in the learner’s continuity in the learning process (Ouhaichi, Spikol & Vogel, 2023). By monitoring platform performance and noting a student’s lack of access, incomplete video viewing, or abandonment of assessments, appropriate interventions and assistance can be provided. This helps students overcome obstacles and enhances their educational performance through continuous and effective feedback and support. This affects their feeling of attention from the teacher and their comfort in learning through that environment. This is reflected in their continuity of learning and spending long time learning on the platform. Attributing this to Constructivist Theory, the data collected from student activities on the DVP (like viewing and completion records) enables the delivery of educational recommendations. These interventions are key to sustaining and guiding learning, facilitating the self-building of knowledge, and supporting social interaction (Banihashem et al., 2022). This result can also be interpreted according to the Cognitive Load Theory through using the data associate with students’ learning to give directions that help them in a practical follow-up and overcome the obstacles they face during their learning, which is reflected in their cognitive load (Choi & Kim, 2021). One of the things that limits students’ continuity of learning via DVP is the weakness of digital capabilities (da Costa et al., 2021). But through support that is based on LA provided to students to identify the areas of weakness associated with digital capabilities and identify them accurately, appropriate intervention can be made. This intervention can address this problem and make the learner more optimistic and able to solve problems and make decisions in addition to helping him/her continue learning without interruption. So, he/she can be guided towards the mechanism of using DVP, sending some comments and notes about how to answer in the exam, in addition to sending some explanations related to interactions with the videos being displayed by the comments and notes tool on the platform (Motz et al., 2023). These factors lead to the learner’s feeling of getting benefit from learning via DVP and increasing his/her own self-confidence. This enhances his/her desire to continue the learning process. This result is in line with the Motivation Theory which emphasizes that motivation is associated with guiding, encouraging, and helping students in solving their problems and accomplishing the tasks required. This makes them more eager to learn, reduces feelings of frustration, achieves enjoyment in learning, and contributes to raising their motivation (Lonn, Aguilar & Teasley, 2015). What was mentioned previously helped in the continuity of learners in the learning environment based on LA, which was reflected in their involvement in the learning process and their desire to continue to develop their educational performance, which was reflected in reducing their digital dropout (Wang et al., 2019, 2023). These results agreed with several previous studies (Da Silva et al., 2022; Daoudi, 2022; Elmoazen et al., 2023) which proved that employing LA has positive impact on students’ continuity of learning across digital educational environments.
Despite the positive results demonstrating LA’s ability to enhance student continuity in learning through DVP, there are some limitations that should be taken into account. Indicators of continuity were limited to quantitative data such as video completion or platform access. While these are important, they do not fully reflect the depth of long-term psychological and cognitive commitment. Moreover, the research did not extend over a sufficiently long period to assess the sustainability of the effect. Furthermore, continuity may be affected by uncontrolled external factors, such as the student’s personal circumstances or external support they may receive outside of the academic context. Additionally, alternative explanations for these results are possible. continuity may be linked to the direct interventions and support provided by the teacher. However, this role was essentially based on LA outcomes that enabled them to identify students at risk of discontinuity and provide them with appropriate support, enhancing the effectiveness of LA in the educational context. Besides, the design of the videos and their engaging elements may have a decisive impact in encouraging students to persist, while some students may view continuous feedback as a monitoring mechanism that increases their commitment for external reasons rather than as an indicator of intrinsic motivation. Accordingly, future research recommends conducting longitudinal research across multiple courses, combining quantitative and qualitative data to gain a deeper understanding of persistence motivations. It also recommends examining the effect of video design features as a mediating variable in the relationship between analytics and student persistence. Furthermore, platform differences may play a role, as DVPs other than Eddbuzzle may have a different impact.
In addition to discussions of the impact of each dropout dimension, correlation and regression analyses revealed that satisfaction, engagement, and continuity are closely interconnected. Satisfaction not only directly reduces dropout, but it also predicts continuity, which in turn enhances both satisfaction and engagement. Engagement also contributes to raising satisfaction levels and ensuring continuity. These mutual predictive effects confirm that the three dimensions form an integrated system and are not independent factors. Accordingly, strategies to reduce digital dropout should focus on the interplay between satisfaction, engagement, and continuity, to ensure that improving any one dimension enhances the others.
Limitations
Despite the LA positive results reported by students, this research has some limitations that need to be addressed by future researchers so that they can study the issue in a more comprehensive way. The limitations of the research were based on research relying on quasi-experimental treatment, which lacks a qualitative methodology that would help provide a better and deeper understanding of the digital dropout issue and the use of LA within the limits of some simple and specific tasks in addition to the recent use of LA in the primary school environment. Based on these limitations, future researchers are recommended to conduct more research to evaluate the quantitative and qualitative effects of using LA on student learning outcomes and addressing school dropouts. The research relied on a relatively limited sample size, which may limit the statistical power and generalizability of the findings to broader populations. Although LA provided rich behavioral data, the research did not include longitudinal tracking to understand changes in satisfaction, engagement, and continuity in the long term. Future studies are therefore recommended to address these limitations by expanding the sample size, implementing randomization, and using more in-depth longitudinal designs to enhance the robustness and generalizability of the findings. In addition, additional research to explore the application of artificial intelligence-based on LA and its impact on reducing digital dropout and student retention should be conducted. Also, it is essential to conduct research aimed at studying the impact of LA to overcome learning problems such as dropout and poor learning performance on groups of male and female students at different educational stages and for longer periods of time.
Conclusion
In closing, this research demonstrates the positive impact of LA on mitigating digital dropout in DVPs. The findings indicate that LA not only reduces dropout rates but also enhances student satisfaction, engagement, and persistence. This research provides compelling evidence for the role of LA in alleviating digital dropout in DVPs. The significant reduction in dropout, coupled with improvements in student satisfaction, engagement, and persistence, highlights the practical implications of LA for educators and designers of digital learning environments. By leveraging LA, DVPs can be transformed into more engaging, supportive, and ultimately sustainable learning platforms. Furthermore, the significant results obtained in this research pave the way for future investigations into specific LA interventions and their long-term impact on student success in digital learning environments. Future research can also explore the application of LA in diverse DVP contexts and across different student populations.