
EDCRAN: an enhanced dual-channel residual attention network for real-time DDoS attack detection in IoT
- Published
- Accepted
- Received
- Academic Editor
- Sedat Akleylek
- Subject Areas
- Artificial Intelligence, Computer Networks and Communications, Security and Privacy, Neural Networks, Internet of Things
- Keywords
- DDOS attack, Deep learning, Cyber security, Internet of things
- Copyright
- © 2026 Almazroi
- Licence
- This is an open access article distributed under the terms of the Creative Commons Attribution License, which permits unrestricted use, distribution, reproduction and adaptation in any medium and for any purpose provided that it is properly attributed. For attribution, the original author(s), title, publication source (PeerJ Computer Science) and either DOI or URL of the article must be cited.
- Cite this article
- 2026. EDCRAN: an enhanced dual-channel residual attention network for real-time DDoS attack detection in IoT. PeerJ Computer Science 12:e3531 https://doi.org/10.7717/peerj-cs.3531
Abstract
Cybersecurity is becoming important in healthcare, transportation, and urban infrastructure due to the increased implementation of Internet of Things (IoT) technology. Distribution Denial of Service (DDoS) attacks, which use IoT edge devices’ limited capacity to iterrupt systems, are a major issue. Scalability issues, ineffective feature extraction, and high computing overhead make traditional Intrusion Detection Systems (IDS) unsuitable for real-time operation on restricted devices. Enhanced Dual Channel Residual Attention Network (EDCRAN), a deep learning architecture for accurate and efficient DDoS detection, is introduced in this study to solve these constraints. The Transform Attention Channel (TAC) catches global temporal patterns in network data, whereas the Scaled Convolutional Channel (SCC) focusses on localised, context-aware characteristics. The model learns rich and discriminative representations from varied traffic sources using this dual-channel technique. To address class imbalance, a Dynamic Weighted Balancing Strategy (DWBS) adjusts learning contributions across classes, while Selective Hybrid Extraction (SHE) filters irrelevant features to improve generalisation. Offline tuning with the Golden Jackal Optimisation (GJO) method produces a lightweight model for IoT edge devices. In the IN-DDoS24 dataset, EDCRAN outperforms fifteen benchmark models with 98.9% accuracy, 99.5% AUC, and 22 s inference time. To assess temporal consistency and attack resilience, two new metrics CPS and ACWS are provided. The realistic, scalable EDCRAN solution detects DDoS in real time in next-generation IoT environments.
Introduction
The Internet of Things (IoT) is crucial to healthcare, transportation, farming, and smart cities. Distribution Denial of Service (DDoS) attacks pose a significant danger to IoT ecosystems due to the rapid exchange of data across billions of devices (Sun et al., 2019). Current occurrences, such as the Tbps-scale Mirai assaults, demonstrate the potential for stolen IoT devices to form massive botnets, disrupting critical internet services (Sun et al., 2018). New botnets, such as IoT Reaper, Torii, and Satori, exploit vulnerabilities in routers, webcams, and embedded devices, necessitating more adaptable detection approaches (Liu et al., 2025; Zeng et al., 2025; Tang et al., 2025; Wu et al., 2025). Rule-based intrusion detection systems struggle to keep up with DDoS attacks since they cannot adapt and have fixed signatures. Thus, more individuals are protecting the Internet of Things using Long Short Term Memorys (LSTMs), Recurrent Neural Networks (RNNs), and Conventional Neural Networks (CNNs). The algorithms identified detailed traffic patterns (Rafique et al., 2024; Bukhowah, Aljughaiman & Rahman, 2024). The CICIoT-2023 and TON-IoT datasets offer numerous attack scenarios, thereby simplifying model creation (Saiyed, Al-Anbagi & Hossain, 2024; Zhou et al., 2025; Zhang et al., 2024c; Xu et al., 2025). However, processing costs are considerable, features are often unneeded or overly noisy, and it’s challenging to fit large models on the limited number of Internet of Things devices. Because irrelevant features can mislead classifiers, it is crucial to efficiently select features and reduce dimensionality (Alshdadi et al., 2024).
Quick processing near the data source is also necessary for real-time detection. As billions of devices continually create traffic, centralized systems experience delays (Mahadevappa et al., 2024). On the other hand, edge-based anomaly detection provides decreased latency and enhanced responsiveness. However, many current models are either too cumbersome to implement at the edge or are unable to adapt to the highly unpredictable and uneven nature of IoT traffic, despite these benefits. That is why there has been a lot of focus on lightweight IDS systems (Maiwada et al., 2024). New approaches include attention-based models, such as DDOS Vision Transformer (DDoSViT), small CNN-LSTM hybrids, and networks inspired by MobileNet. Likewise, methods such as adaptive federated learning, Synthetic Minority Oversampling Technique (SMOTE) variations, and Open-Set Recognition have been used to tackle class imbalance (Anley et al., 2024). However, these systems are not particularly effective at capturing long-range temporal relationships, as well as localised burst patterns, and their performance deteriorates when traffic distributions change rapidly.
Lightweight, time-aware, and imbalance-resistant intrusion detection models are necessary for real-world IoT deployments due to these restrictions. Our proposed Enhanced Dual-Channel Residual Attention Network (EDCRAN) is a deep learning architecture that can efficiently and accurately identify DDoS attacks on devices with limited resources. To describe larger temporal relationships, EDCRAN uses Transform Attention Channels (TAC), whereas Scaled Convolutional Channels (SCC) capture fine-grained local patterns. The model can learn both short-term fluctuations and long-range contextual behaviour more successfully than single-stream architectures because of its dual-path structure. To address the extreme class imbalance commonly found in IoT datasets, the Dynamic Weighted Balancing Strategy (DWBS) is employed, thereby further enhancing resilience. The Selective Hybrid Extraction (SHE) module improves feature quality by reducing duplication and highlighting beneficial properties. Moreover, reliable performance is supported in low-power edge situations by efficiently tuning the hyperparameters offline using Golden Jackal Optimisation (GJO). This study’s main contributions are listed below, in line with previous research on lightweight intrusion detection systems and imbalance handling:
-
1.
IoT-based DDoS detection struggles to capture fine-grained local patterns and long-range traffic interdependence. EDCRAN uses a Scaled Convolutional Channel (SCC) for local feature extraction and a Transform Attention Channel (TAC) for global traffic modelling to address this. These routes and residual attention processes allow the model to learn complicated, multi-dimensional network traffic behaviours that conventional architectures miss.
-
2.
Biased learning and poor detection of uncommon attacks result from imbalanced class distributions, when benign traffic dominates malignant occurrences. Dynamic Weighted Balancing Strategy (DWBS) addresses this. Adaptively reweighting class contributions and selectively generating synthetic examples for under-represented attack types. Thus, the model improves stealthy or occasional threat sensitivity while maintaining robust generalisation.
-
3.
Noise, redundancy, and weak relevance can degrade model performance and increase computational cost, especially in resource-constrained IoT scenarios. EDCRAN’s Selective Hybrid Extraction (SHE) method filters low-utility inputs via statistical and nonlinear feature selection. Keeping only the most informative features improves detection accuracy and makes the model lightweight and efficient.
-
4.
When implemented on edge devices, tuning deep learning models for real-time inference requires significant resources. The model uses Golden Jackal Optimisation (GJO), a computationally efficient metaheuristic algorithm, to adjust the learning rate and dropout ratio. This speeds training convergence and eliminates post-deployment adjusting.
-
5.
Standard evaluation metrics rarely show how well a model performs over time or under different attack intensities. To solve this gap, two unique metrics are introduced: Contextual Prediction Stability (CPS), which measures prediction temporal consistency, and assault Complexity-Weighted Score (ACWS), which measures detection performance across assault sophistication. These indicators illuminate the model’s real-world reliability and resilience.
The EDCRAN model was trained and tested using the IN-DDoS24 dataset, which represents a diverse range of actual distributed denial-of-service (DDoS) attack scenarios targeting IoT networks. To see how well the algorithm can detect various traffic behaviors and danger patterns, this dataset is ideal. An extensive sensitivity test is conducted on critical hyperparameters to strengthen the model’s reliability further. Among these hyperparameters are the batch size, learning rate, and dropout rate. This test guarantees that the model will maintain consistent and stable operation regardless of the tuning parameters. These design decisions and assessment methodologies demonstrate EDCRAN’s strength, suggesting that it is a dependable solution for protecting future IoT systems from dynamic cyberattacks.
Recent research has yielded lightweight CNN-LSTM models, MobileNet-based feature extractors, Vision Transformer-based detectors, and SMOTE-based algorithms for addressing imbalances; however, most of these systems still have significant issues. The short-lived burst patterns and long-range temporal linkages of Internet of Things traffic may be complex to depict. This is traffic-related. They also lack a framework to correct imbalances, improve operations, and sustain the efficiency of edge deployment. All of these sections are combined in EDCRAN. More specifically, it uses the adaptive Dynamic Weighted Balancing Strategy (DWBS), SHE, and dual-path attention–convolution processing (TAC and SCC) to optimize features non-linearly. This comprehensive approach overcomes oversmoothing, biased learning, duplicated features, and excessive computing costs. Its framework provides a thorough and methodical overview of the outcomes. It begins by reviewing the current methods for detecting DDoS attacks in IoT networks, highlighting key findings and identifying areas that remain unexplored. The following section describes the architecture of the suggested EDCRAN framework, including preprocessing and model improvements. Simulation-based assessments give execution time, classification accuracy, and comparisons to state-of-the-art techniques. The study concludes by reviewing the most notable results and discussing strategies to enhance the flexibility and scalability of real-time Internet of Things network security architecture.
Related work
The possibility of DDoS attacks on network systems has produced research on improved detection methods. The complexity and frequent evolution of new threats challenge statistical and signature-based solutions. Recent research has employed machine learning and deep learning frameworks to identify DDoS attacks with precision and scalability. Hybrid architectures, LSTM networks, and CNNs may uncover patterns in massive, changing datasets. Despite these gains, unbalanced datasets, real-time performance, and novel or hidden attack strategies need further research. Researchers use adaptive and ensemble methods, feature selection, and optimization to improve detection and reduce processing time. The following section reviews key contributions to addressing these concerns. The authors of Anley et al. (2024) introduced a DDoS detection system that enhances classification accuracy across datasets using transfer learning and CNN. Their method identified hazardous activities and attack groups better than baseline models. Its dependence on high-quality datasets and the computational expense of developing adaptive designs limited its real-time usefulness. Hidden attack resilience was another issue. In Wanda & Hiswati (2024), Deep Belief Networks (DBN) were introduced as an alternative to traditional machine learning for automated feature representation. DBNs, based on Restricted Boltzmann Machine layers, may extract hierarchical characteristics from traffic data. In complex attack settings, the model enhanced DDoS detection accuracy with low loss. Scalability to larger datasets was not thoroughly examined, and its greedy layer-wise training increased computer complexity.
In order to identify and counteract DDoS attacks in real-time cloud environments, DeepDefend employed a CNN-LSTM-Transformer hybrid model, as detailed in Ouhssini et al. (2024). By merging evolutionary algorithms for optimal feature selection with deep learning for entropy prediction, our strategy demonstrated high accuracy on the CIDDS-001 dataset. Despite its impressive results, this integrated approach requires a significant amount of resources, making it challenging to employ for large-scale, real-time applications. The authors of Hekmati et al. (2024) emphasized the need for monitoring traffic patterns between nodes to detect IoT DDoS assaults. Moreover, it further discussed correlation-aware designs and found significant performance increases when utilizing transformer and LSTM models, particularly in cases where attackers repeated harmless data. Although the correlation-based strategy performed effectively, it raised concerns about its efficacy in IoT networks with restricted resources. According to Shieh et al. (2024), the CNN-Routing Protocol for Low-Power and Lossy Networks (CNN-RPL) model uses CNN and RPL to detect both known and new DDoS threats. Its excellent accuracy rates, at 99.93% for known attacks and 98.51% for unknown threats, made the model durable. Open-Set Recognition (OSR) was challenging to set up and required extensive testing on big datasets; hence, it couldn’t be utilized on larger datasets. Another study used fuzzy Q-learning and Chebyshev’s inequality to predict cloud workloads and prevent low-rate DDoS attacks. The technique anticipated server loads and discovered concealed behavior, reducing false positives. However, further study is required to assess its effectiveness in diverse and dynamic cloud systems, especially in multi-tenant environments (Kumar, Dutta & Pranav, 2024). Across unbalanced datasets, the adaptive federated learning framework (FLAD), as suggested in Doriguzzi-Corin & Siracusa (2024), improved convergence times and DDoS detection accuracy. FLAD removed centralized test data by dynamically assigning computation to challenging attack scenarios. The accuracy is improved; however, there is still a need for further study into the issue of scalability in large-scale Internet of Things and cross-dataset contexts. The first description of lightweight cybernetic models was in Salih & Abdulrazaq (2023). These models utilized CNN-LSTM architectures that reduced processing overhead by employing fewer than 225,000 learnable parameters. On the imbalanced CIC-DDoS2019 dataset, the models achieved an impressive 99.99% accuracy. However, it is not used in as many scenarios since it is not thoroughly evaluated in real-life contexts, which are constantly changing.
In Ali et al. (2025), a model called DDoSViT is introduced to enhance DDoS detection in IoT environments, particularly for safeguarding Over-The-Air (OTA) firmware updates. This model is built on Vision Transformer (ViT). The model can identify both subtle and high-volume DDoS attacks, leveraging the self-attention characteristics of Vision Transformers to capture temporal patterns in network data effectively. Using a wide variety of IoT datasets, the model demonstrated exceptional performance in detecting fraudulent traffic. A significant decrease in the frequency of false positives accompanied an increase in accuracy. Despite encouraging performance metrics, transformer-based designs are too complex to be useful in low-power edge contexts, and real-time deployment remains a significant challenge. Using ensemble Graph Neural Networks (GNNs), a method for identifying DDoS attacks was proposed in a related study (Bakar et al., 2024). This approach improved the F1-score by 3.2% when compared to baselines using a combination of hierarchical GNNs and ensemble approaches such as boosting and bagging. The process was not scalable, even though it improved performance. The computational burden was considerably raised because of the reliance on ensemble learning and substantial hyperparameter tuning, which made real-world deployment more complex. The MMEDRL-ADM framework, suggested in Paidipati, Kurangi & Uthayakumar (2024), aims to detect DDoS attacks in Software-Defined Networking (SDN) settings and is another significant contribution. This design makes use of state-of-the-art metaheuristic algorithms to optimise an ensemble reinforcement learning approach. For feature selection, we use Grasshopper Optimisation, and to fine-tune the model hyperparameters, we use African Buffalo Optimisation. While these methods operate together to improve detection accuracy, there are obstacles to scalability and deployment caused by the framework’s complexity and resource requirements. These approaches had good detection performance, but SDN-based datasets’ computational intensity and restrictions limited their use. In Benmohamed, Thaljaoui & Elkhediri (2024), the E-SDNN design improves detection accuracy with 99.94% on CICDS2017 and 98.86% on CICDDoS2019 using stacked multi-layer perceptrons in an encoder-based framework. However, its vast feature selection and lack of real-time validation hindered its real-world usability.
The Federated Learning-based FL-DAD approach (Alhasawi & Alghamdi, 2024) introduced a decentralised perspective for privacy-preserving DDoS detection in IoT networks. This convolutional neural network-based technique improved detection without centralised data collecting. FL-DAD performed well on the CICIDS2017 dataset, but higher-scale IoT deployments are needed to assess its scalability and computational efficiency. The MSCBL-ADN model in Yin, Fang & Liu (2024) uses bi-directional LSTM and multi-scale CNN architectures to protect against low-rate DDoS attacks. The model achieved 96.74% accuracy on the ISCX-2016-SlowDos dataset using a hybrid feature extraction process with sliding window methods and arbitration networks. Even with these results, its adaptability was constrained because the architecture was tightly connected to dataset structures. A study (Shukla, Krishna & Patil, 2024) found that leveraging IoT traffic for DDoS detection resulted in an 84.4% reduction in feature dimensionality and a 5.19% increase in classification accuracy compared to earlier models. The framework improved multiclass classification with cross-validation. It needs validation under real-world IoT traffic scenarios and scalability improvements across various deployment environments. A Temporal Convolutional Network (TCN)-based frequency monitoring approach was proposed in Akhi, Eising & Dhirani (2025) to prevent DDoS assaults in 5G Healthcare-IoT networks. By merging adaptive thresholding with temporal feature extraction, the approach has the potential to uncover anomalous traffic frequency patterns. It demonstrates a high level of sensitivity and resilience to aggression. To secure critical IoT equipment in healthcare, research emphasizes the importance of capturing temporal dynamics. It does, however, highlight specific problems that may arise when applying the approach to a broader range of IoT applications and addressing the computing demands of real-time operations. An outline of the existing literature is shown in Table 1.
| Ref | Objective | Methodology | Key findings | Limitations |
|---|---|---|---|---|
| Anley et al. (2024) | Propose adaptive transfer learning with CNN for DDoS detection. | Leveraged CNNs and transfer learning on publicly available datasets. | Achieved high accuracy for attack detection and classification. | High computational cost; limited robustness to unseen attack patterns. |
| Wanda & Hiswati (2024) | Detect DDoS attacks using Deep Belief Networks. | Utilized DBN with Restricted Boltzmann Machines for feature representation. | Enhanced detection accuracy in complex attack settings. | Scalability and training complexity were major concerns. |
| Ouhssini et al. (2024) | Real-time DDoS detection in cloud using hybrid deep models. | Combined CNN, LSTM, and Transformer with genetic algorithm-based feature selection. | Achieved high accuracy on CIDDS-001 dataset. | High resource demands challenge scalability. |
| Hekmati et al. (2024) | Detect DDoS attacks using correlation-aware models in IoT. | Used LSTM and Transformer architectures to model traffic across nodes. | Improved performance in detecting disguised attacks. | Computational burden limits use in resource-constrained environments. |
| Shieh et al. (2024) | Detect known and unknown DDoS attacks using CNN-RPL. | Combined CNN with Reciprocal Points Learning and Open-Set Recognition. | Achieved over 99.93% accuracy for known and 98.51% for unknown attacks. | Complex OSR implementation and limited large-scale testing. |
| Kumar, Dutta & Pranav (2024) | Predict server load to mitigate low-rate DDoS attacks. | Used fuzzy Q-learning with Chebyshev’s inequality for proactive detection. | Reduced false positives and detected stealthy traffic. | Requires validation in diverse cloud scenarios. |
| Doriguzzi-Corin & Siracusa (2024) | Improve FL-based DDoS detection on unbalanced datasets. | Proposed adaptive federated learning with task-specific partitioning. | Achieved faster convergence and high accuracy. | Cross-dataset generalization remains a challenge. |
| Salih & Abdulrazaq (2023) | Design lightweight CNN-LSTM for cyber DDoS detection. | Implemented under 225k learnable parameter architecture. | Reached 99.99% accuracy on CIC-DDoS2019 dataset. | Needs real-world testing for generalizability. |
| Ali et al. (2025) | Enhance OTA firmware protection in IoT via DDoSViT. | Applied Vision Transformer to model temporal traffic patterns. | Reduced false positives and improved precision. | Transformer complexity impairs edge deployment feasibility. |
| Bakar et al. (2024) | Boost DDoS detection using ensemble GNNs. | Combined hierarchical GNNs with bagging and boosting. | Improved F1-score by 3.2% over traditional models. | Requires extensive hyperparameter tuning and high compute resources. |
| Paidipati, Kurangi & Uthayakumar (2024) | Detect DDoS in SDN using reinforcement learning. | Integrated MMEDRL-ADM with African Buffalo and Grasshopper optimization. | Achieved strong performance in SDN datasets. | Real-time feasibility and dataset availability are issues. |
| Benmohamed, Thaljaoui & Elkhediri (2024) | Increase detection on benchmark datasets with E-SDNN. | Used encoder-stacked DNNs with automated feature selection. | Scored 99.94% (CICIDS2017) and 98.86% (CICDDoS2019). | Needs online validation and reduced feature engineering overhead. |
| Alhasawi & Alghamdi (2024) | Promote privacy-aware DDoS detection in IoT. | Used CNN within a federated learning (FL-DAD) framework. | Enabled decentralized detection with good performance. | Needs study on scalability in dense IoT deployments. |
| Yin, Fang & Liu (2024) | Detect low-rate DDoS with multi-scale CNN-biLSTM. | Employed sliding windows and arbitration networks. | Achieved 96.74% on ISCX-2016-SlowDos. | Model tied to specific dataset configuration. |
| Shukla, Krishna & Patil (2024) | Perform multi-class DDoS detection on IoT traffic. | Applied feature reduction with cross-validation. | Reduced features by 84.4% and improved accuracy by 5.19%. | Needs broader testing in live IoT scenarios. |
| Akhi, Eising & Dhirani (2025) | Develop a robust DDoS detection strategy in 5G Healthcare-IoT environments. | Proposed a monitoring frequency-based detection system using Temporal Convolutional Networks (TCNs) and a dynamic thresholding mechanism. Simulated traffic using Cooja and ns-3 with MQTT and UDP protocols. | Achieved 99.98% accuracy for detection and 95–99.99% prediction accuracy across MQTT and UDP datasets. Effectively mitigated 80% of DDoS nodes and outperformed BiLSTM and CNN-based models. | Limited real-world deployment; effectiveness in highly heterogeneous H-IoT scenarios yet to be tested. |
Problem statement
A significant threat to network security, DDOS has increased in tandem with the proliferation of Internet of Things devices. Modern distributed DDoS assaults are complex and dynamic, making it difficult to control them using static statistical and signature-based approaches. Since these attacks employ low-rate, high-volume, and covert techniques, we require more robust detection systems that can effectively navigate the challenges posed by the Internet of Things. Recent advancements in deep learning and machine learning have led to the development of CNNs, LSTM networks, and hybrid models capable of detecting DDoS attacks. When analysing attack patterns, DBN-based frameworks (Wanda & Hiswati, 2024) and CNN-LSTM-Transformer models (Ouhssini et al., 2024) demonstrate a high level of accuracy. Many models struggle with scaling because they are not well-suited for handling large datasets and various types of IoT traffic. Though they were restricted in their ability to generalize, the lightweight models given in Salih & Abdulrazaq (2023) demonstrated remarkable accuracy in actual applications. Using computationally costly ensemble techniques, including GNN-based approaches, in Internet of Things contexts with limited resources is not practicable (Bakar et al., 2024) due to their significant resource demands. The computational requirements of MMEDRL-ADM (Paidipati, Kurangi & Uthayakumar, 2024) and CNN-LSTM-Transformer (Ouhssini et al., 2024) restrict their application in vast Internet of Things networks, while their detection rates show promise. Since malicious traffic is more prevalent than benign traffic, the situation is far worse, and the imbalance in the statistics of IoT traffic is even more apparent. The DDoSViT-based framework (Ali et al., 2025) and the Federated Learning-based DDoS detection (Alhasawi & Alghamdi, 2024) are two examples of attempts to rectify this imbalance. More advanced and adaptable balancing techniques are nevertheless needed to ensure accurate detection in various attack scenarios.
Recent DDOS threats, such as zero-day attacks and advanced persistent threats (APTs), further aggravate the situation. Even though Open-Set Recognition (OSR) frameworks (Shieh et al., 2024) have demonstrated that they are resistant to unknown attacks, scalability and validation on larger datasets remain issues. In addition, Internet of Things devices sometimes have resource limitations, which makes it challenging to build models that need a lot of processing power. Despite adaptive federated frameworks (Doriguzzi-Corin & Siracusa, 2024) and lightweight architectures (Salih & Abdulrazaq, 2023; Huang & Wang, 2025) partially addressing this problem, it remains crucial to develop resource-efficient solutions for low-power Internet of Things installations. This requires efficient feature selection and optimization to achieve the goal of improving detection accuracy while simultaneously reducing computational cost. It has been established that timestamp-based clustering (Akhi, Eising & Dhirani, 2025) and the DDoSViT-based architecture (Ali et al., 2025) are effective in improving performance; however, both methods need considerable preprocessing and manual setup, which restricts their use in dynamic Internet of Things contexts. Despite these advancements, a shortage of specialized detection techniques for the IoT remains, which are scalable, real-time, and resource-efficient. Current models cannot generalize to a wide variety of Internet of Things contexts and datasets; innovative solutions are necessary. It is vital to have real-time capabilities, adaptable architectures, and advanced feature selection to overcome these restrictions. To facilitate future research and applications, these frameworks must be resilient, efficient, and responsive to the ever-changing threats posed by the IoT.
Proposed methodology
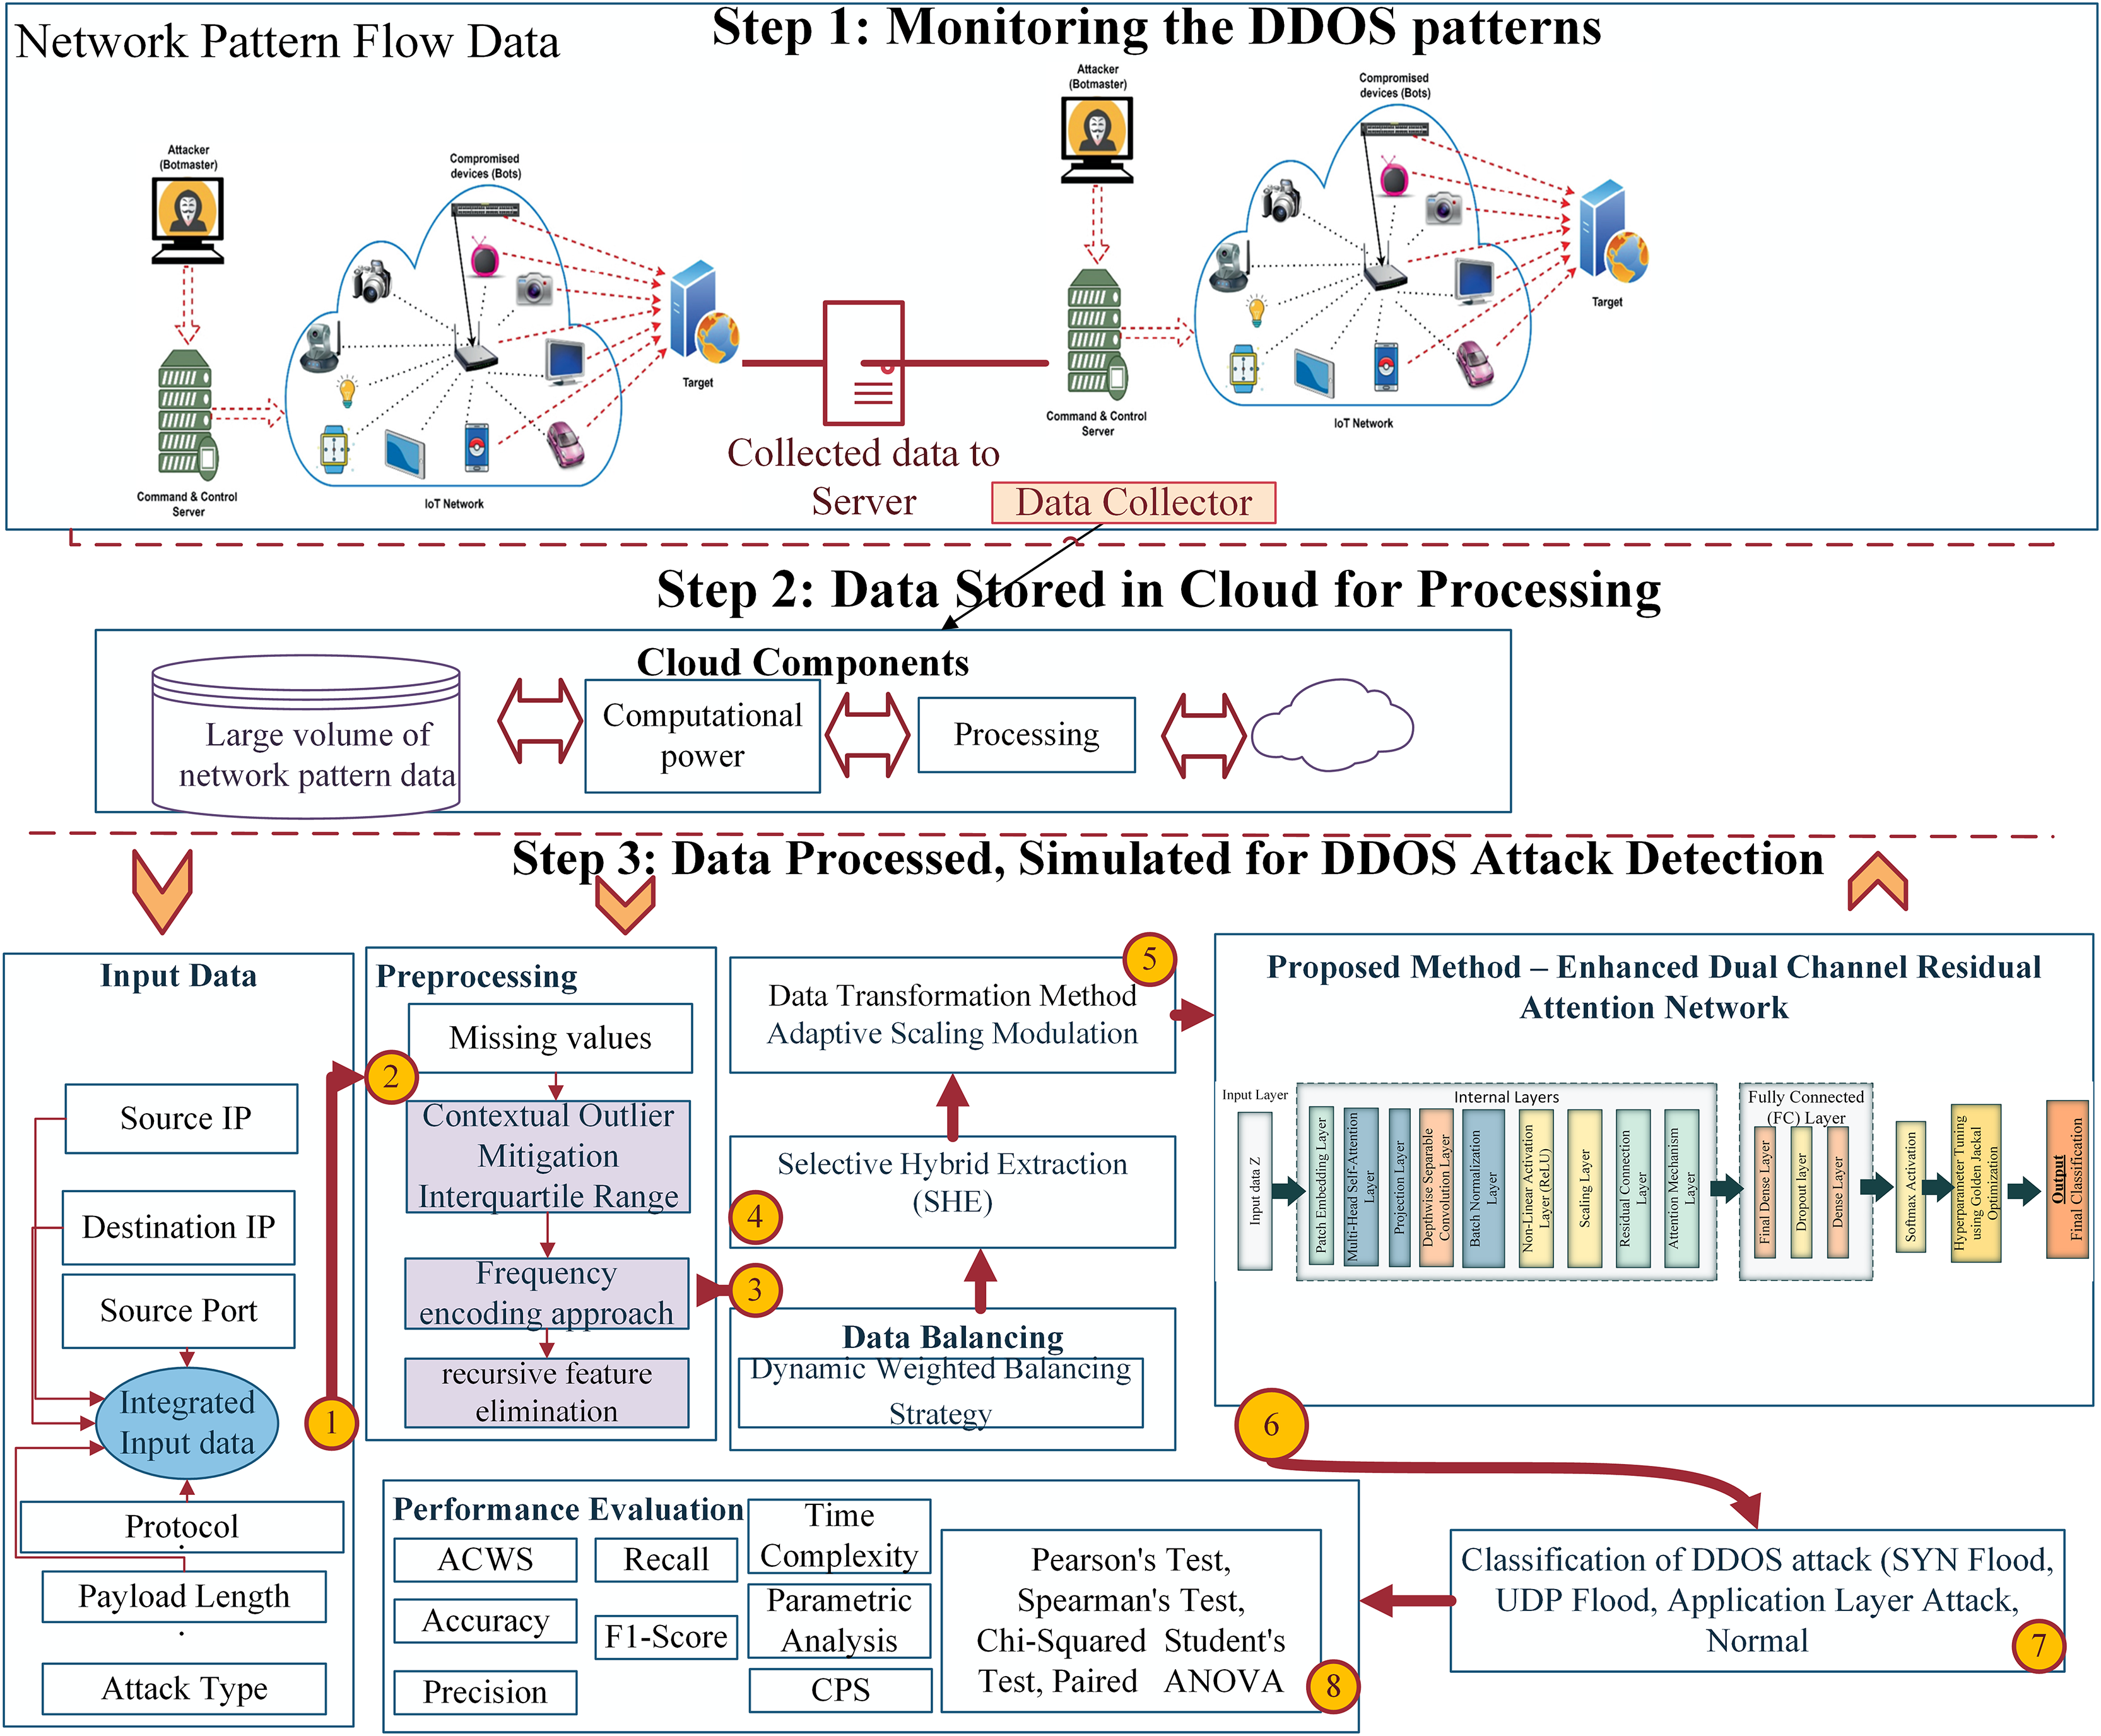
The novel EDCRAN architecture detects and mitigates DDoS attacks in IoT networks. This approach accurately and efficiently classifies harmful actions, despite the multidimensional and heterogeneous nature of IoT traffic data. Extensive data preprocessing, dynamic feature selection, and a hybrid dual-channel architecture are used to maximize performance. The framework is trained and verified under realistic settings using the IN-DDoS24 dataset of DDoS attack scenarios. In addition, a unique Dynamic Weighted Balancing Strategy (DWBS) addresses dataset imbalance, and Selective Hybrid Extraction (SHE) refines feature selection to improve classification accuracy and computing efficiency. Figure 1 shows how our system model is presented architecturally.
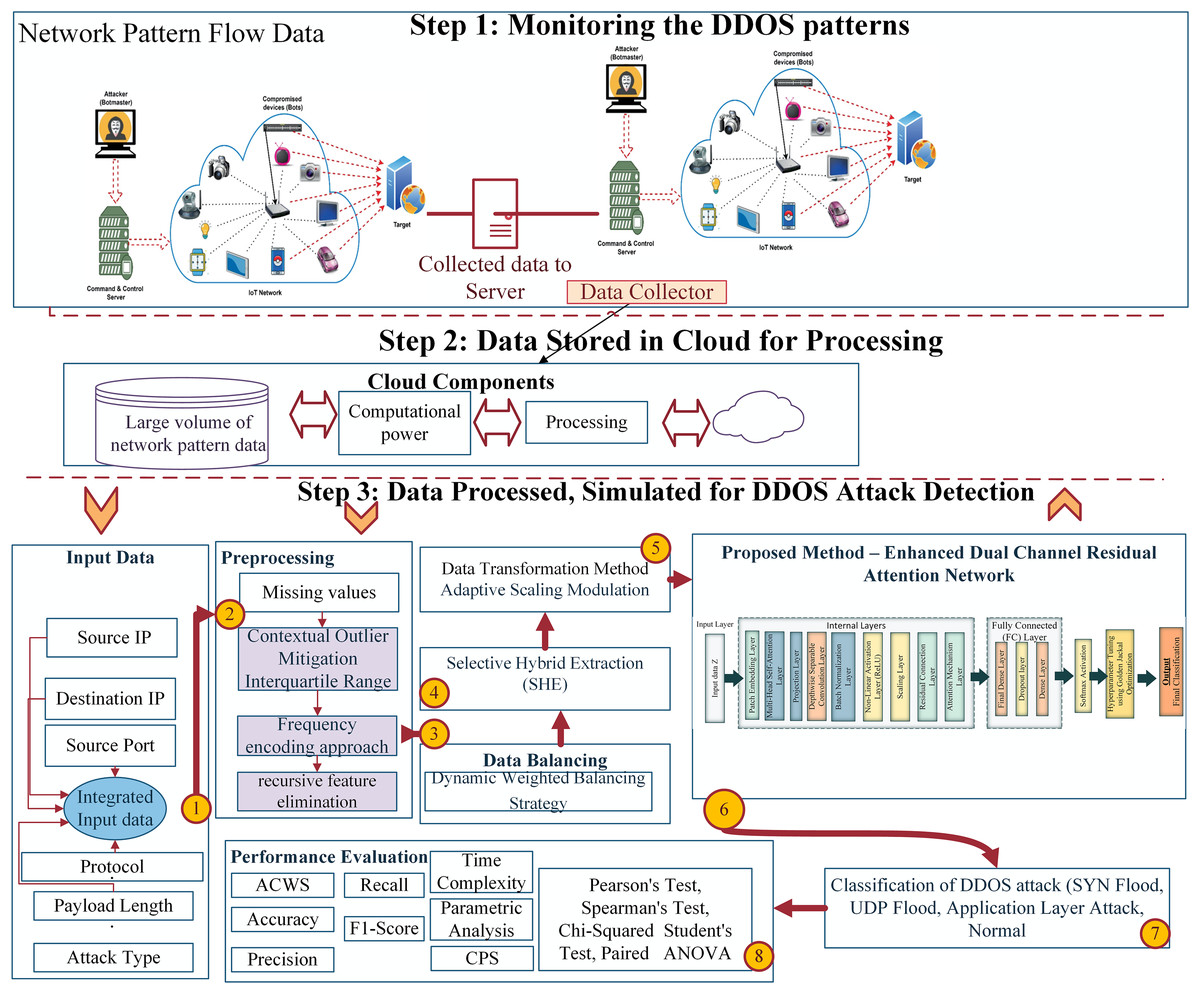
Figure 1: Proposed method architectural representation.
Dataset description
This study uses the Kaggle-hosted open-source IN-DDoS24 dataset. The dataset shows real IoT network traffic from a number of various types of devices functioning normally. It includes a number of distinct DDoS assault scenarios. It is a suitable option for evaluating modern intrusion detection algorithms since it is both realistic and varied.
Data collection and labeling: The packets from the network were organized into flows using the conventional 5-tuple. The protocol, source and destination IP addresses, and ports were all part of this. To label each flow, we utilized scripts that generated attacks, device logs, and execution records, which were time-stamped, that we obtained during the compilation of the dataset. This ensured that legitimate ground truth was used to classify both positive and negative traffic features.
Feature set: This dataset encompasses a wide range of data types, including statistical, temporal, and protocol-level information. Intrusion detection in the IoT is its primary function. All the attributes used in this inquiry are detailed in Table 2. In addition to features, this table also includes descriptions and classifications.
| S. No | Features of the dataset | Features short description |
|---|---|---|
| 1 | Inter-arrival time | Measures the duration between consecutive packets in the traffic flow. |
| 2 | Device type | Categorizes the IoT device generating traffic (e.g., Sensor, Camera). |
| 3 | Timestamp | Records the specific time and date of the network activity. |
| 4 | Attack duration | Represents the length of time the detected attack persisted in seconds. |
| 5 | Source port | Refers to the port number utilized by the originating device. |
| 6 | Operating system | Specifies the OS of the IoT device (e.g., Linux, RTOS). |
| 7 | Packet size | Captures the total size of an individual packet in bytes. |
| 8 | Bytes in flow | Details the cumulative data volume transmitted during the flow. |
| 9 | Protocol | Identifies the protocol used for communication, such as TCP or UDP. |
| 10 | Anomaly score | Quantifies how much the traffic deviates from normal patterns. |
| 11 | Firmware version | indicates the specific firmware version of the IoT device. |
| 12 | Destination port | Shows the port number of the target device in the communication. |
| 13 | Packets in flow | Reflects the number of packets exchanged within the data flow. |
| 14 | Flow duration | Represents the total duration of the flow activity in seconds. |
| 15 | Rate of packets | indicates the number of packets transmitted per second. |
| 16 | Unique source count | Tracks the count of distinct source IPs within the flow. |
| 17 | Source IP | The originating IP address of the traffic. |
| 18 | Attack type | Specifies the nature of any detected malicious activity (e.g., SYN Flood). |
| 19 | Payload length | Represents the actual data content size within the packet. |
| 20 | Destination IP | Refers to the target IP address of the transmitted traffic. |
| 21 | Average packet size | Computes the mean size of packets within the flow. |
| 22 | Labels | Contains classification labels indicating the types of attacks observed. |
| 23 | Unique destination count | Indicates the variety of destination IPs encountered during the flow. |
| 24 | Target device | Identifies the specific IoT device targeted during an attack. |
Class distribution: The dataset is very skewed, which is unfortunately typical of IoT systems. These attacks are relatively uncommon, with mixed-vector DDOS, HTTP flood, and ICMP flood being among the most unusual. Typical attacks on this group include regular traffic. Our solution was the Dynamic Weighted Balancing Strategy, also known as DWBS. To redirect the system’s attention and inspection efforts toward attack classes that are currently receiving insufficient attention, this method is being implemented.
Preprocessing steps: The training set was created by removing duplicate or broken flow entries and handling missing values in accordance with the guidelines provided by the first dataset. To standardize numerical data and alter categorical markers, the study used min-max scaling and one-hot encoding, respectively. Moreover, further filtering is performed using the Selective Hybrid Extraction (SHE) module to remove inconsistencies and preserve only the most essential features.
Train/Validation/Test split. To make it simpler to test a reliable model, the dataset was divided into three sections: 70% for training, 15% for validation, and 15% for testing. To ensure that each category had a representative number of unexpected attack types, a stratified sampling procedure was used.
Data preprocessing
Some preprocessing processes are used to make sure the dataset is clean, organized, and ready to be modeled (Mishra et al., 2020; Wang et al., 2024; Zhang et al., 2024b; Qiu et al., 2025). This procedure employs a collection of distinct methods, each tailored to deal with the dataset’s inherent heterogeneity and unique traits. Data normalization begins with bringing all continuous attributes’ scales into agreement on a single range, usually between 0 and 1. Having widely varying characteristic magnitudes aids convergence of numerous machine learning techniques. In order to normalize, the following equation must be obtained:
(1) with standing for the scaled feature, X for the raw attribute value, and and for its smallest and maximum observed values, respectively. Once normalization is complete, any outliers are selected and eliminated. As the dataset includes traffic data with very high and very low values, it is necessary to detect and deal with outliers. We take a fresh tack by updating the IQR method with a dynamic scaling factor that changes with the feature distribution; this makes our technique extremely advanced. The equation for identifying outliers adjusted:
(2)
The third quartile of the dataset is represented as and the first quartile is . To compute the interquartile range (IQR’), subtract Q3′ from Q1′ and use as a scaling factor to determine outlier identification sensitivity. The value of is fixed to 1.5 for standardization, but may be adjusted depending on dataset features. The next step involves managing the categorical variables ‘Device Type’ and ‘Operating System’. Frequency encoding substitutes categorical variables with their frequency instead of one-hot encoding. Use this equation:
(3)
The transformed variable is represented by W′, the category count by , and the total number of occurrences in the dataset is explicitly given by . Despite reduced dimensionality, each category remains significant. Next, identify the most informative aspects and remove the rest. To determine feature significance, recursive feature removal and correlation matrix are used, using the equation (Mishra et al., 2020):
(4) specifies the correlation coefficient between characteristics and , and indicates the total number of features. By quantifying the relative importance of each attribute in predicting the target label, this method improves and simplifies the model. We use a special preprocessing strategy to clean, organize, and optimize the dataset. This ensures that DDoS detection models perform effectively in Internet of Things scenarios. Every step of the process is improved in terms of accuracy, consistency, and reliability, and data issues are resolved using this strategy.
Advanced data preparation: balancing and feature optimization
The two crucial steps after initial data preparation are addressing the imbalance in the class distribution and prioritizing the features that will be most valuable for training the model (Susan & Kumar, 2021; Zhang et al., 2024a; Yue et al., 2025). Having said that, both of these things are vital. Due to underrepresentation of certain attack types in unbalanced datasets, inaccurate generalization and biased learning may result. Maintaining a customized approach throughout the prediction process is crucial for accurately representing all classes, including the ones with less frequent attack types. By extracting and selecting additional features, it is also possible to speed up and improve DDoS detection in IoT networks. To increase the feature space and balance the dataset, both methods are shown in Algorithm 1.
| 1: Input: Raw dataset D, target labels L, features F |
| 2: Output: Balanced dataset , optimized features |
| 3: |
| 4: |
| 5: for each class do |
| 6: |
| 7: end for |
| 8: for each minority class do |
| 9: while not enough samples in do |
| 10: Select random instance |
| 11: Select nearest neighbor |
| 12: Generate new sample |
| 13: Add to the dataset |
| 14: end while |
| 15: end for |
| 16: |
| 17: |
| 18: return |
Dynamic weighted balancing strategy
To fix the dataset’s class imbalance, this study utilizes the DWBS. Limiting oversampling and undersampling is critical to prevent overfitting and data loss when employing DWBS. To mitigate class effects, it uses a more flexible approach throughout the resampling process. The calculated plan assigns more weight to infrequently occurring courses and less weight to frequently occurring ones. Selective sample synthesis is used. Doing so will allow the model to learn from any group without bias or self-repetition. A dynamic weighting formula is the basis of DWBS. The impact of the class on the dataset can be determined using the following formula, which is referred to as Class . It considers the makeup and size of the sample. Factors determining class weight:
(5)
The variables and represent different aspects of the dataset. represents the total number of samples, and represents the count of unique class labels. Without drastically altering the distribution, the square root function gives underrepresented groups more weight. This produces a smoothing effect. To further enhance the representation of underrepresented groups, synthetic examples are generated through controlled interpolation. Instead of only updating or duplicating the data points, this method does more. Data points that are more likely to be accurate are instead added by using the structure of the present class members. This synthetic sample was created using the following formula:
(6)
In this particular equation, the symbol represents the newly introduced synthetic data point. Item is one of the most similar instances in the minority class to instance , and there is another example from the minority class that is similar to it. It should be remembered that may be any integer from 0 to 1. Because interpolation maintains the data space’s geometric structure, further samples will always be able to match the distribution. We are preparing the SHE module for training by refining it. This component helps prevent the slowdown of model learning by removing features that are noisy, useless, or of low quality. Both convergence and generalization are improved when the model is trained on the most informative characteristics. This is especially useful in complex IoT situations with high-dimensional, inconsistent data. Overall, DWBS improves the model’s capacity to classify rare but critical attack classes. By avoiding majority class tendencies from dominating the decision boundary, it promotes fairer and more balanced learning across all categories.
Feature optimization: selective hybrid extraction
Optimizing the feature set with data balance improves model performance. SHE is used to integrate feature selection and extraction into a single framework. SHE uses features’ statistical significance and non-linear data correlations.
In the first stage of SHE, known as Selective Feature Weighting (SFW), the relationship between each feature and the target labels determines the weighting of each feature. The equation is used to compute the weight of each feature, denoted as .
(7) represents the correlation between feature and target label , L is the number of target labels, is a tuning parameter, and is the variance of feature . This weight has been changed to account for the dataset’s linear correlations and feature variability.
In the second step of SHE, Non-linear Feature Extraction (NLFE) transforms a subset of features to capture higher-order interactions. NLFE maps chosen characteristics into higher-dimensional space using a kernel-based technique. Definition of transformation:
(8) is the non-linear transformation of feature , is the kernel width, and is the aggregate feature mean. This non-linear mapping reveals patterns that traditional approaches overlook.
DWBS is used for balancing, while SHE is used for feature optimization, balancing, and modifying the dataset to maintain the most helpful information for predictive modeling. These dataset-specific strategies improve model training and performance.
Classification: enhanced dual channel residual attention network
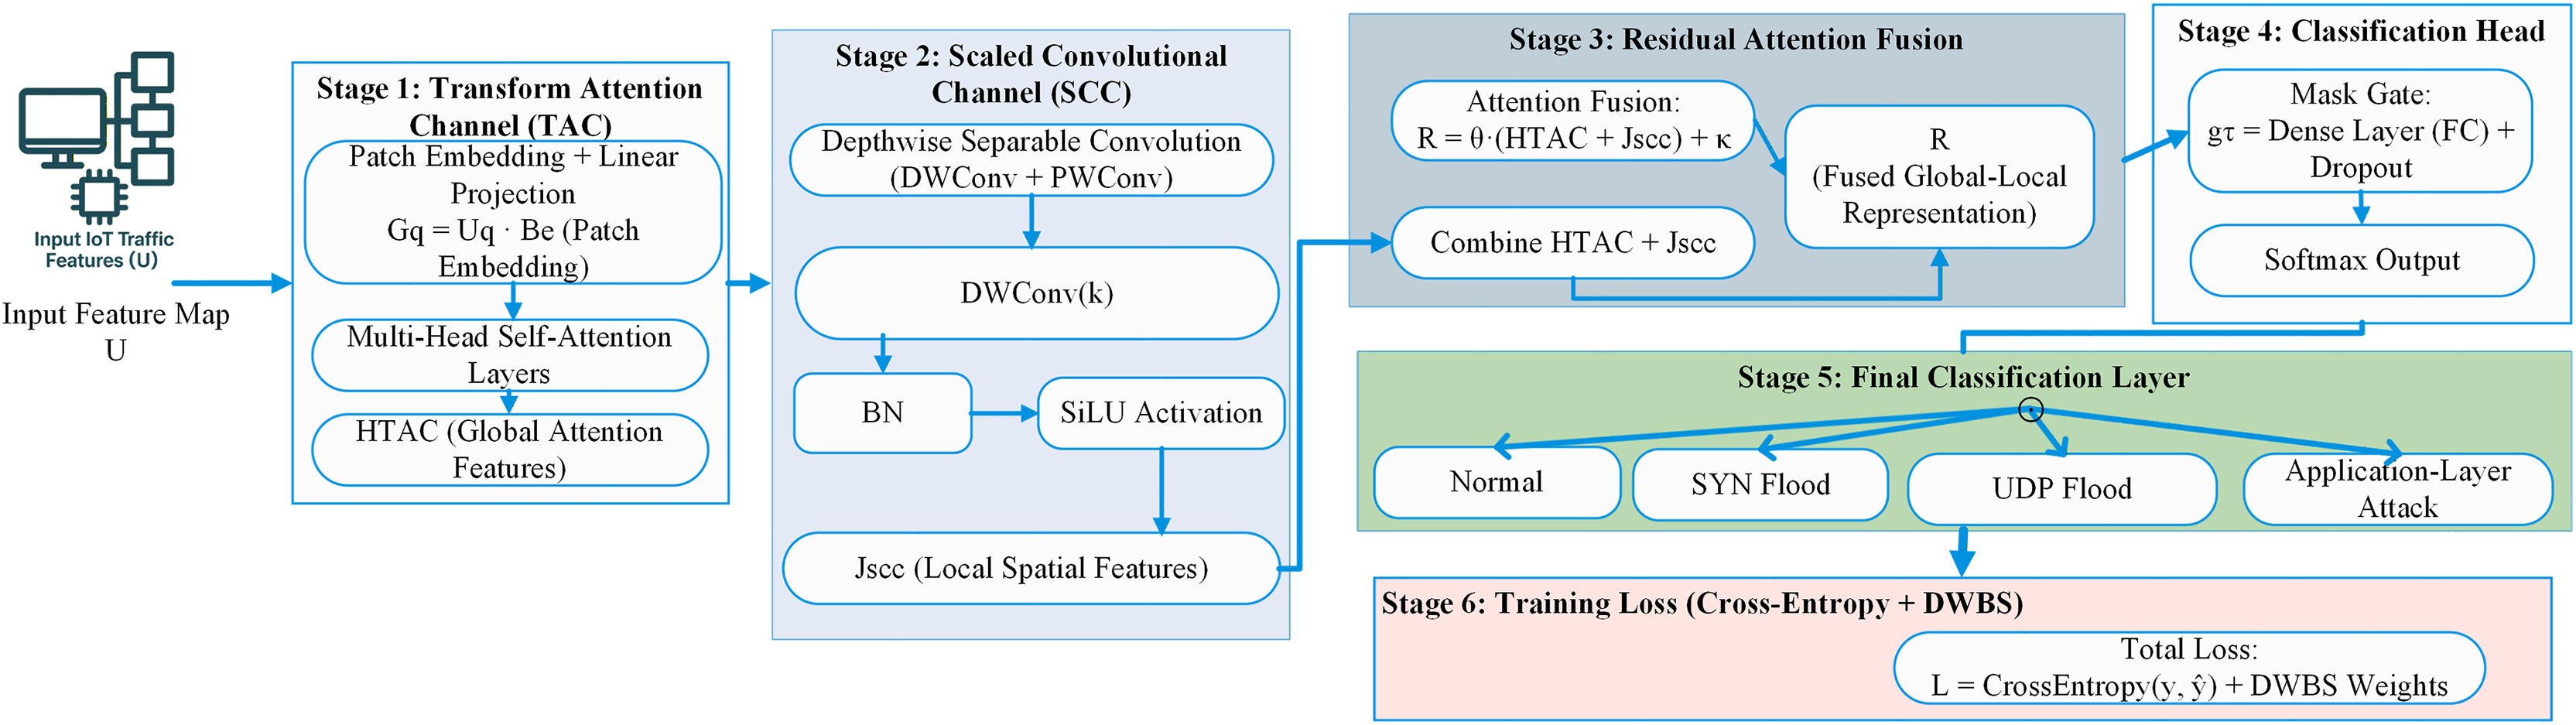
After preprocessing and optimising the dataset, a strong classification model called the EDCRAN is provided. To accurately identify DDOS attacks in IoT networks, this new model integrates the characteristics of EfficientNet (Navaneethakrishnan et al., 2024) and Vision Transformer (ViT) (Yin et al., 2022). A residual attention mechanism allows the EDCRAN’s two primary channels, the TAC and the SCC, to combine their outputs. The layered network is shown visually in Fig. 2.
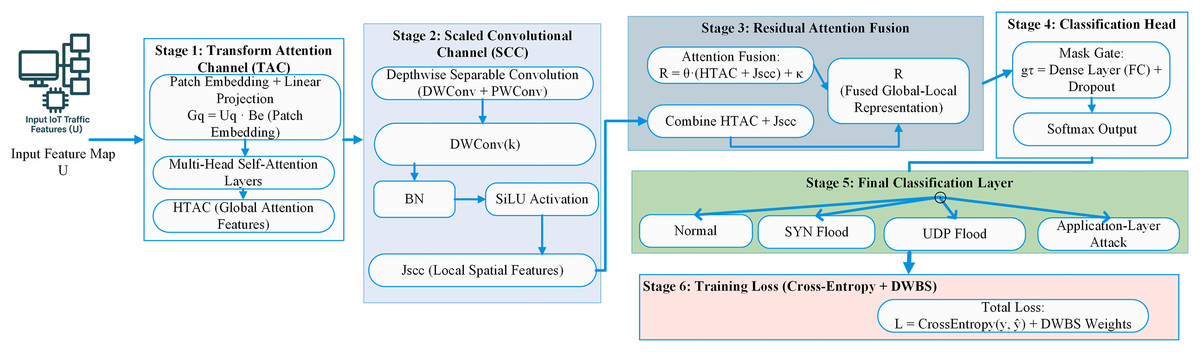
Figure 2: Proposed method architectural representation.
Transform attention channel
Using transformer-based attention, the TAC can capture the long-range relationships within input feature maps. Patch embedding, multi-head self-attention, and a projection layer comprise this channel, enabling it to learn global context successfully.
Multi-Head Self-Attention and Patch Embedding: For computational efficiency, TAC flattens and projects the input feature map U into a lower-dimensional space after dividing it into non-overlapping patches. Every patch is combined in this way:
(9) represents the embedded patch, while stands for a learnable weight matrix.
The model can grasp dependencies across the whole input space after processing the embedded patches using a multi-head self-attention layer. The process for determining the attention scores is done for every attention head .
(10) where is the dimensionality of the query/key and , , and are the corresponding matrices for the query, key, and value for the given head . Each head’s output is calculated as follows:
(11)
To create the globally contextualized feature map , a projection layer is used to combine and send the final output from each attention head. Adjusting the dimensions to align with the subsequent layers is the job of this layer. This study examines the evolution of traffic patterns, which helps identify complex DDOS attacks.
Scaled convolutional channel
The SCC uses depthwise separable convolutions to capture localised, high-resolution information, drawing inspiration from EfficientNet. Batch normalization and scaling follow depthwise separable convolutional layers in this channel. Each layer of a depthwise separable convolution network uses a depthwise convolution and a pointwise convolution to scale the network. As shown below, this method ensures the security of spatial information by using a distinct filter for every input channel:
(12) and represent depthwise and pointwise convolution weights, respectively. represents the convolution operation, and is a non-linear activation function like ReLU.
At each level, a scaling factor, denoted as , is used to modify feature dimensions dynamically. A scaling definition is:
(13) reflects the SCC’s scaled feature map output.
By capturing subtle, localized fluctuations, SCC enhances sensitivity to sudden volumetric spikes, which are typical of many-layered IoT-based attacks.
Residual attention fusion
A residual attention fusion module combines TAC ( ) and SCC ( ) outputs. This technique enhances gradient flow, feature learning, and information retention by integrating both global and local characteristics. Definition of fusion:
(14)
Learnable parameters and govern the fusion weight. Finding a happy medium between static global data and dynamic local data becomes much easier with this. Leading the categorization is: A fully connected layer plus a softmax layer provide the combined representation of the class probabilities, denoted as R. The softmax function may be described as follows:
(15)
Each class’s output is represented by , whereas class c’s probability is given by . Regarding the possibility of a DDOS attack, the classification head is the final location where information is disseminated. The EDCRAN paradigm employs a dual-channel configuration, as detailed in Algorithm 2. To extract all the characteristics, we utilize rapid convolutional processing and global attention. Improved data categorization accuracy is the outcome of this structure’s ability to understand complex patterns in data collected from IoT network traffic. With its speed and coverage, EDCRAN is an excellent choice for IoT network security applications that require handling large-scale data in real-time. Because TAC and SCC are also components of EDCRAN, this is indeed the case.
| 1: Input: Raw input feature map U |
| 2: Output: Predicted class probabilities |
| 3: Initialize: Projection weights , depthwise and pointwise convolution kernels , scaling factor , fusion weights , and bias term |
| 4: Step 1: Temporal Attention Channel (TAC) |
| 5: Divide the input feature map U into non-overlapping spatial-temporal patches |
| 6: for each patch do |
| 7: Generate patch embedding using a linear projection: |
| 8: end for |
| 9: Concatenate all embeddings to form a sequence: |
| 10: for each attention head l do |
| 11: Compute scaled dot-product attention scores: |
| 12: Generate attended output: |
| 13: end for |
| 14: Concatenate outputs from all heads and project to obtain TAC representation: |
| 15: Step 2: Spatial Convolution Channel (SCC) |
| 16: Apply depthwise separable convolution to extract spatial features: |
| 17: |
| 18: Scale the SCC output to match TAC dynamics: |
| 19: |
| 20: Step 3: Residual Attention Fusion |
| 21: Fuse the outputs from TAC and SCC channels using residual attention: |
| 22: |
| 23: Step 4: Classification Head |
| 24: Pass the fused representation through a fully connected layer followed by a softmax function to produce class probabilities: |
| 25: |
| 26: return |
Hyperparameter tuning with GJO
The GJO technique is used to optimize the hyperparameters of the EDCRAN model. Based on the golden jackal’s cooperative hunting, GJO efficiently explores and exploits the hyperparameter space. The optimization of the hyperparameters is represented by and the optimal solution is denoted by . The candidate who is performing is responsible for controlling the tracking intensity with , adjusting the attacking phase with , and increasing search space coverage and diversifying exploration with .
(16)
The optimization of the hyperparameters is represented by and the optimal solution is denoted by . The candidate who is performing is responsible for controlling the tracking intensity with , adjusting the attacking phase with , and increasing search space coverage and diversifying exploration with . GJO adaptively controls learning rate, batch size, and regularization in the EDCRAN model. Increasing the model’s exploration and exploitation improves its performance and helps it find ideal hyperparameters. GJO, which optimizes model hyperparameters using HPC servers, only works offline. By implementing these changes, we can ensure that the EDCRAN model works effectively before its implementation. The final model and parameters are sent to IoT edge devices after training. Inference does not need optimization or convergence overhead when everything is clear. Due to its minimal and efficient runtime, this method is suitable for resource-constrained environments. GJO’s quick convergence and small CPU footprint enable low-power Internet of Things devices to run the EDCRAN model in real-time without compromising performance.
Performance evaluation metrics
The Attack Complexity Weighted Score (ACWS) and Contextual Prediction Stability (CPS) are two new measures introduced in this study. Along with the more common metrics, such as recall, accuracy, precision, F1-score, and area under the curve (AUC), others are also included. To detect DDoS attacks in an IoT setting, these metrics are designed to track key elements of a model’s behavior. To sustain this conversation, forecasts must be robust against attacks of varying degrees of complexity and maintain their accuracy over time. Checking the accuracy of the model’s predictions over time is made easy using CPS. These metrics are used to measure the model’s reliability. When examining the anticipated class probabilities, CPS seeks volatility; lower volatility indicates greater stability over time. The standard approach primarily considers pointwise correctness; this is distinct from it. The definition of the metric is as follows:
(17)
The predicted probability at time is shown by the variable , the total number of time points is shown by the variable N, and the size of the window is shown by the variable W. The average flow time observed in the dataset over the whole method is used to determine the value of W for calibration, ensuring that temporal segments consistently display the correct traffic intervals. Although it is linked to smoothness metrics used in sequence modeling, CPS is especially developed to work for probability-based intrusion detection.
Another novel measure that demonstrates the model’s ability to detect attacks of varying degrees of complexity is the AACWS. Because specific attacks are uncommon, highly dynamic, or distributed across multiple protocol levels, it may be challenging to detect them. Each type of assault is assigned a complexity weight, denoted by , to account for these variations. This complexity weight is dependent on a wide range of variables, including anomaly score dispersion, payload variability, and rarity. ACWS is expressed as:
(18) The accurate results (TPj) and incorrect results (FPj) variables stand in for the relevant data in class j. All of the weights are set up so that they equal one when summed together. This weighting technique strengthens the impact of improved recognition of complex or low-frequency assaults on the final score. Because of their greater stealth, the second and third forms of attacks are much less prevalent.
To prove the efficacy of the measures, the CPS was compared to the moving-window F1 and temporal AUC, and the ACWS was compared to the weighted F1 and balanced accuracy measurement. ACWS provided clearer information on how well individuals fared in infrequent, high-impact assaults, which traditional measures often overlook. CPS was more sensitive to short-term prediction instability. CPS and ACWS demonstrate how the concept works in real-life applications utilizing the Internet of Things. Attack complexity and temporal consistency are crucial for intrusion detection in these cases. They enhance accuracy metrics and reveal model behavior.
Model deployment feasibility and practicality in IoT environments
Crucially, a high-performance server that is not linked to the internet executes the whole model pipeline, which consists of preprocessing, dynamic balancing using DWBS, feature selection with SHE, and training. Our goal is to demonstrate how user-friendly EDCRAN would be in practical Internet of Things scenarios. In contrast, IoT devices do not perform these resource-intensive activities. Nodes in the network’s periphery get only the model’s little inference module after it has undergone exhaustive training and optimization.
The architecture of EDCRAN has been designed to be efficient, allowing it to provide fast forecasts while using minimal memory. Using depthwise separable convolutions, the SCC differs from the TAC’s compact attention approaches. This two-step process involves training the model offline and then deploying it live to ensure that IoT devices remain responsive and use energy efficiently. Furthermore, it enables the identification of DDoS attacks in real-time, eliminating the need for expensive computing budgets.
Simulation results
Experimental setup and dataset description
The experiments were conducted on an Intel Core i7 workstation with 16 GB of RAM, utilising Python for model creation and assessment, with the aid of Scikit-learn, TensorFlow, and PyTorch. Automated hyperparameters for EDCRAN were chosen using the Golden Jackal Optimisation (GJO) technique. With its variety of DDoS attack behaviours and actual IoT traffic, the IN-DDoS24 dataset was used for training and validation. To prevent any potential impact from future traffic patterns on the training process, all flow data were first organised chronologically according to their timestamps. This was done before the train/validation/test divides were created. The complete architecture and parameters, layers along with values are shown in Table 3.
| Component | Specification | Value |
|---|---|---|
| Input and Encoding | ||
| Input shape | (Time steps features) | |
| Feature projection | Linear(24 64) | 64-d embedding |
| Scaled Convolutional Channel (SCC) | ||
| SCC Block 1 | DWConv(k = 5) + PWConv(64 64) | SiLU, Dropout 0.2 |
| SCC Block 2 | DWConv(k = 5) + PWConv(64 96) | SiLU, Dropout 0.2 |
| SCC Block 3 | DWConv(k = 3) + PWConv(96 128) | SiLU, Dropout 0.2 |
| Pooling | Global Average Pooling | -d output |
| Transform Attention Channel (TAC) | ||
| Patch size | Temporal patches | 8 |
| Tokens | Sequence length/patch size | 16 tokens |
| Embedding dimension | 128 | |
| Transformer layers | Encoder blocks | 3 |
| Attention heads | Multi-head attention | 4 |
| FFN dimension | Feedforward network | 256 |
| Activations | Attention: Softmax; FFN: GELU | – |
| Pooling | Mean over tokens | -d output |
| Fusion and Classification head | ||
| Fusion mechanism | Residual gated fusion | Learnable |
| Dense layer 1 | 128 96 | SiLU + Dropout 0.2 |
| Dense layer 2 | 96 C classes | Softmax |
| Training configuration | ||
| Optimizer | AdamW (GJO-tuned) | – |
| Learning rate | Selected by GJO | |
| Batch size | – | 96 |
| Epochs | – | 30 |
| Weight decay | – | |
| Loss function | Cross-entropy + DWBS weighting | – |
| Regularization | Dropout + Gradient Clipping (1.0) | – |
| Early stopping | Patience = 8 (val. AUC) | – |
| Precision mode | FP16 mixed precision | – |
| Model complexity | ||
| Total trainable parameters | – | 1.18 M |
| Total FLOPs (per sample) | – | 0.62 G |
| Inference suitability | Resource-constrained IoT/edge devices | Yes |
The accuracy, F1-score, AUC, CPS, and ACWS values shown here represent the mean across all pipeline runs, with minimal variation, and were used to evaluate the model’s stability. The initialisation seeds used were five separate random ones. After that, the dataset was cleaned, normalised, and class-balanced using DWBS. Then, features were refined using the SHE module to build an input space that was consistent and of high quality. We evaluated EDCRAN’s performance with many baseline intrusion detection models to assess its accuracy, processing efficiency, and suitability for IoT contexts with limited resources. Moreover, it further discusses in depth the design and training setup for repeatability in the parts that follow.
Edge efficiency analysis
To support the lightweight-deployment claim, the computational behaviour of EDCRAN was evaluated using its architecture profile and measured runtime performance. With 1.18 M trainable parameters and approximately 0.62 GFLOPs per forward pass, the model requires around 4.7 MB of memory in FP32 precision (and about 2.4 MB when using FP16). On the workstation used for experimentation (Intel Core i7, 16 GB RAM), the model achieves an average inference time of 2–3 ms per sample. This proves that EDCRAN can keep its computational cost and memory footprint low. This makes it a good fit for resource-constrained Internet of Things environments that rely heavily on real-time detection. With a variation of 0.3 milliseconds, the average inference latency across all five experiments was 2.8 milliseconds. To determine whether the data was consistent over time, we consulted this data. For real-time Internet of Things (IoT) deployments, EDCRAN’s constant timing characteristic is crucial because to its relative stability, especially in situations when network requirements are subject to change. Its minimal variance is evidence of this.
Attack analysis and traffic distribution
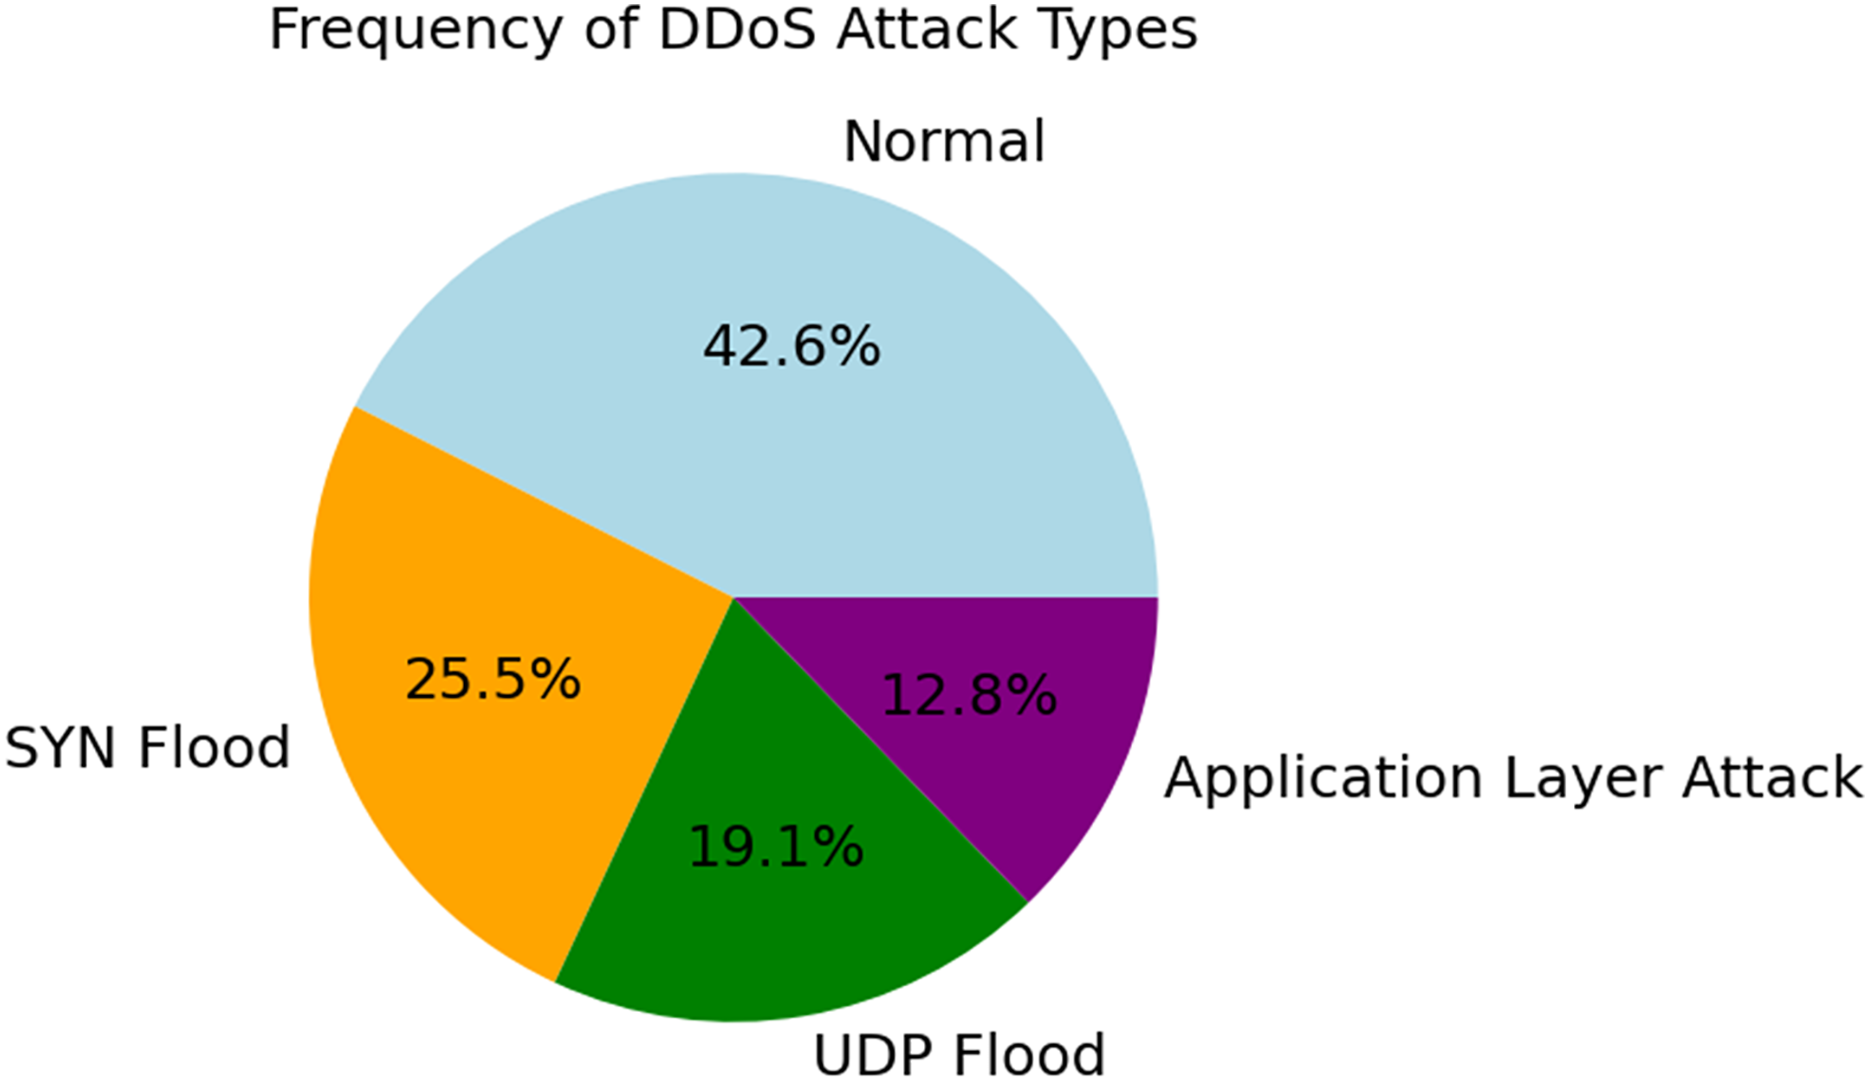
The various forms and distribution of DDoS assaults are shown in Fig. 3. In terms of frequency, the next most prevalent kinds of traffic are application layer attacks (12.8%), UDP flood (19.1%), SYN flood (25.5%), and regular traffic (42.6%). Using data balancing strategies during model training is essential to avoid bias in favor of majority classes. The need for this differentiation becomes clear when one considers how real networks operate. Consider the frequency of certain types of attacks while designing intrusion detection systems. Because of this, it is possible to take focused actions. This manner, both typical and out-of-the-ordinary dangers may be identified.

Figure 3: Frequency distribution of attack types.
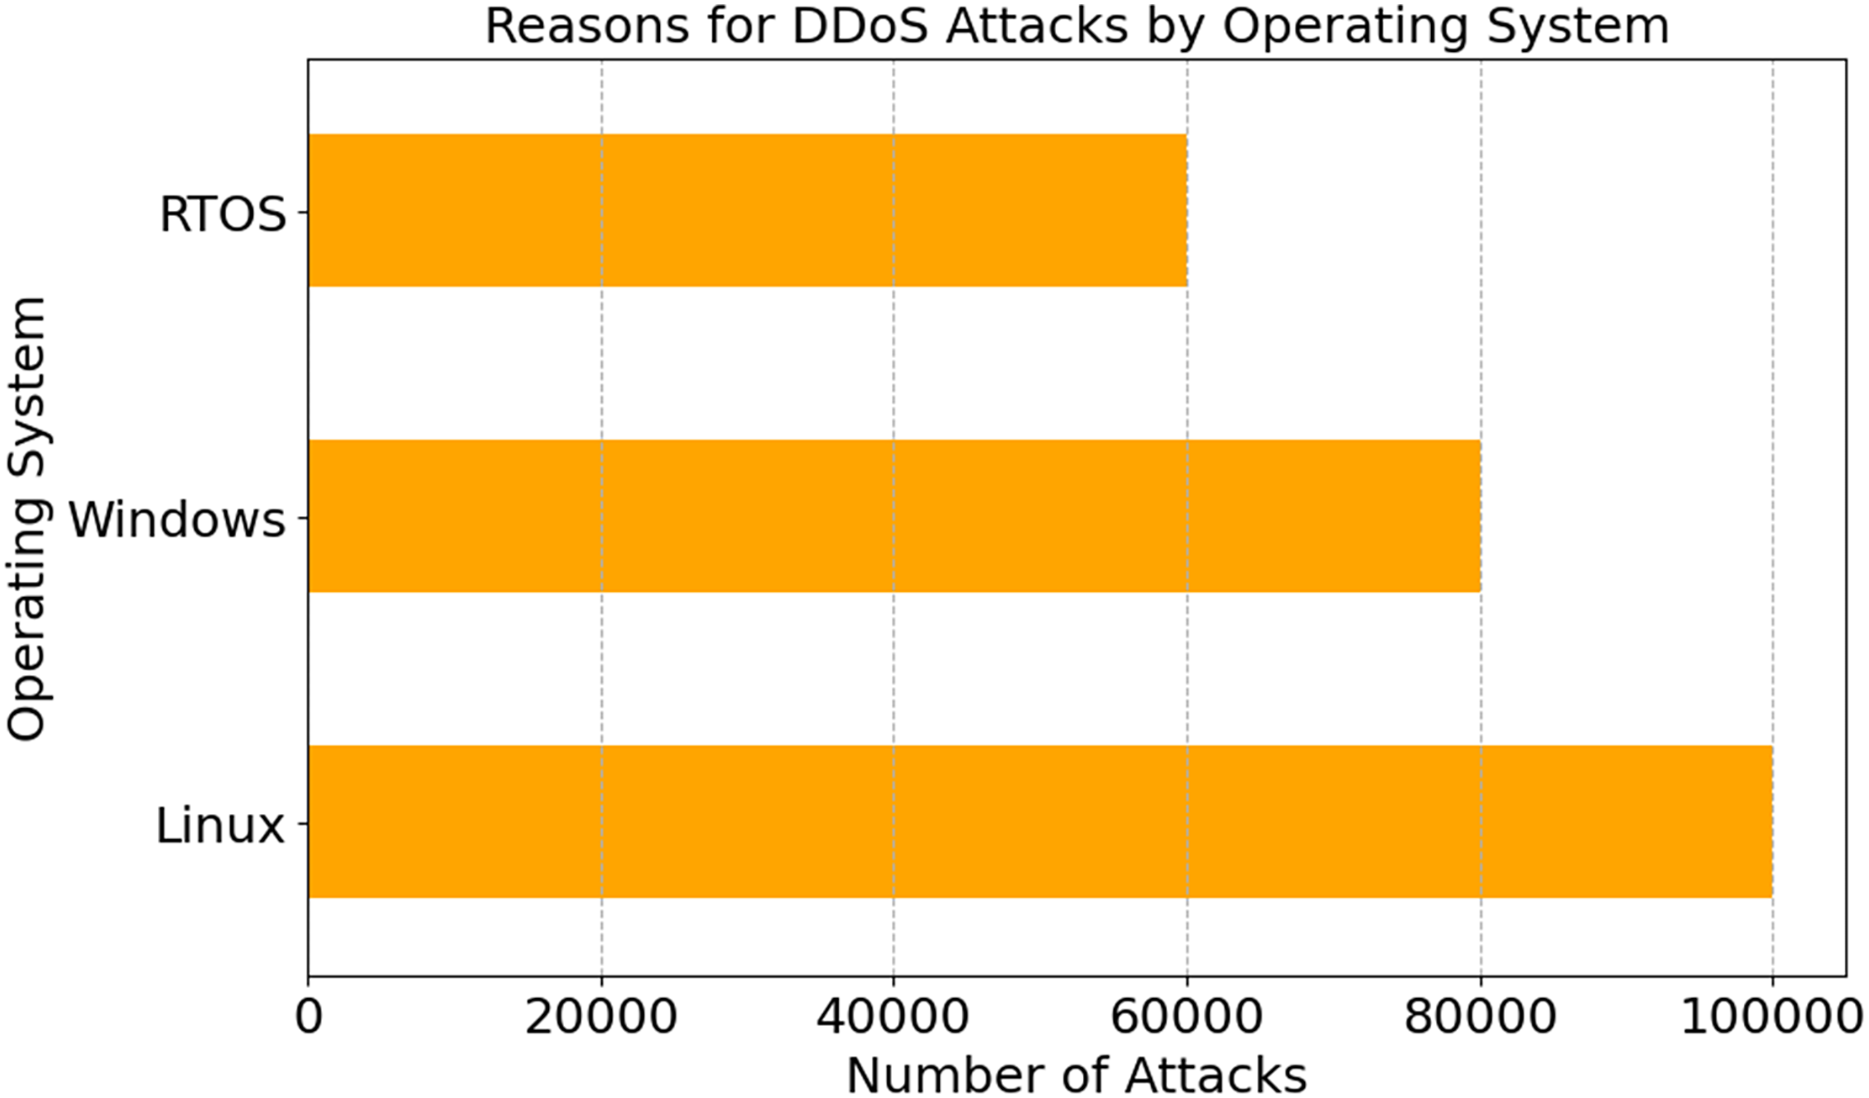
Figure 4 illustrates DDoS assaults on Linux, Windows, and RTOS operating systems. Most attacks target Linux, Windows, and RTOS. Linux has been attacked 100,000 times, Windows 80,000. Linux is open-source and widely utilized in industrial systems, thus attackers target it. Hackers target Linux, as seen by these statistics. Linux powers many IoT devices. The analysis demonstrates that Linux installation settings need custom security measures. Linux’s flexibility and customisation might make users more susceptible. Information security experts may use this data to understand OS-specific hardening tactics, fix important security gaps, and protect Internet of Things ecosystems from new attacks.
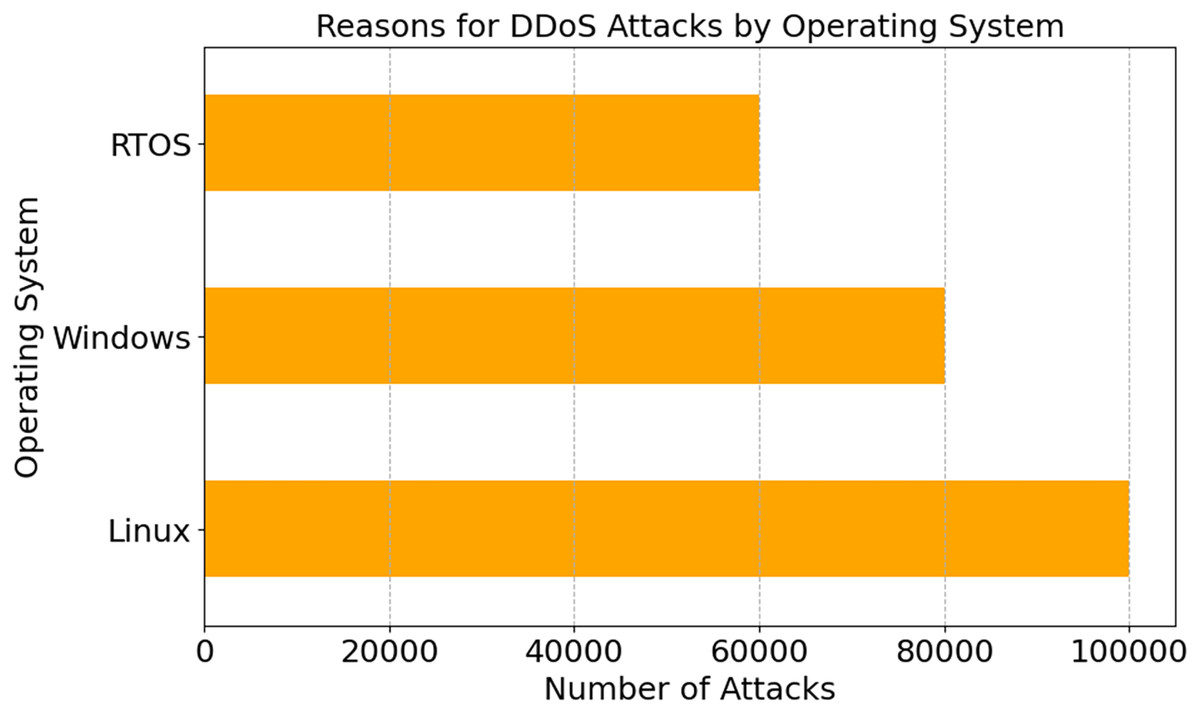
Figure 4: DDoS attack patterns by operating system type.
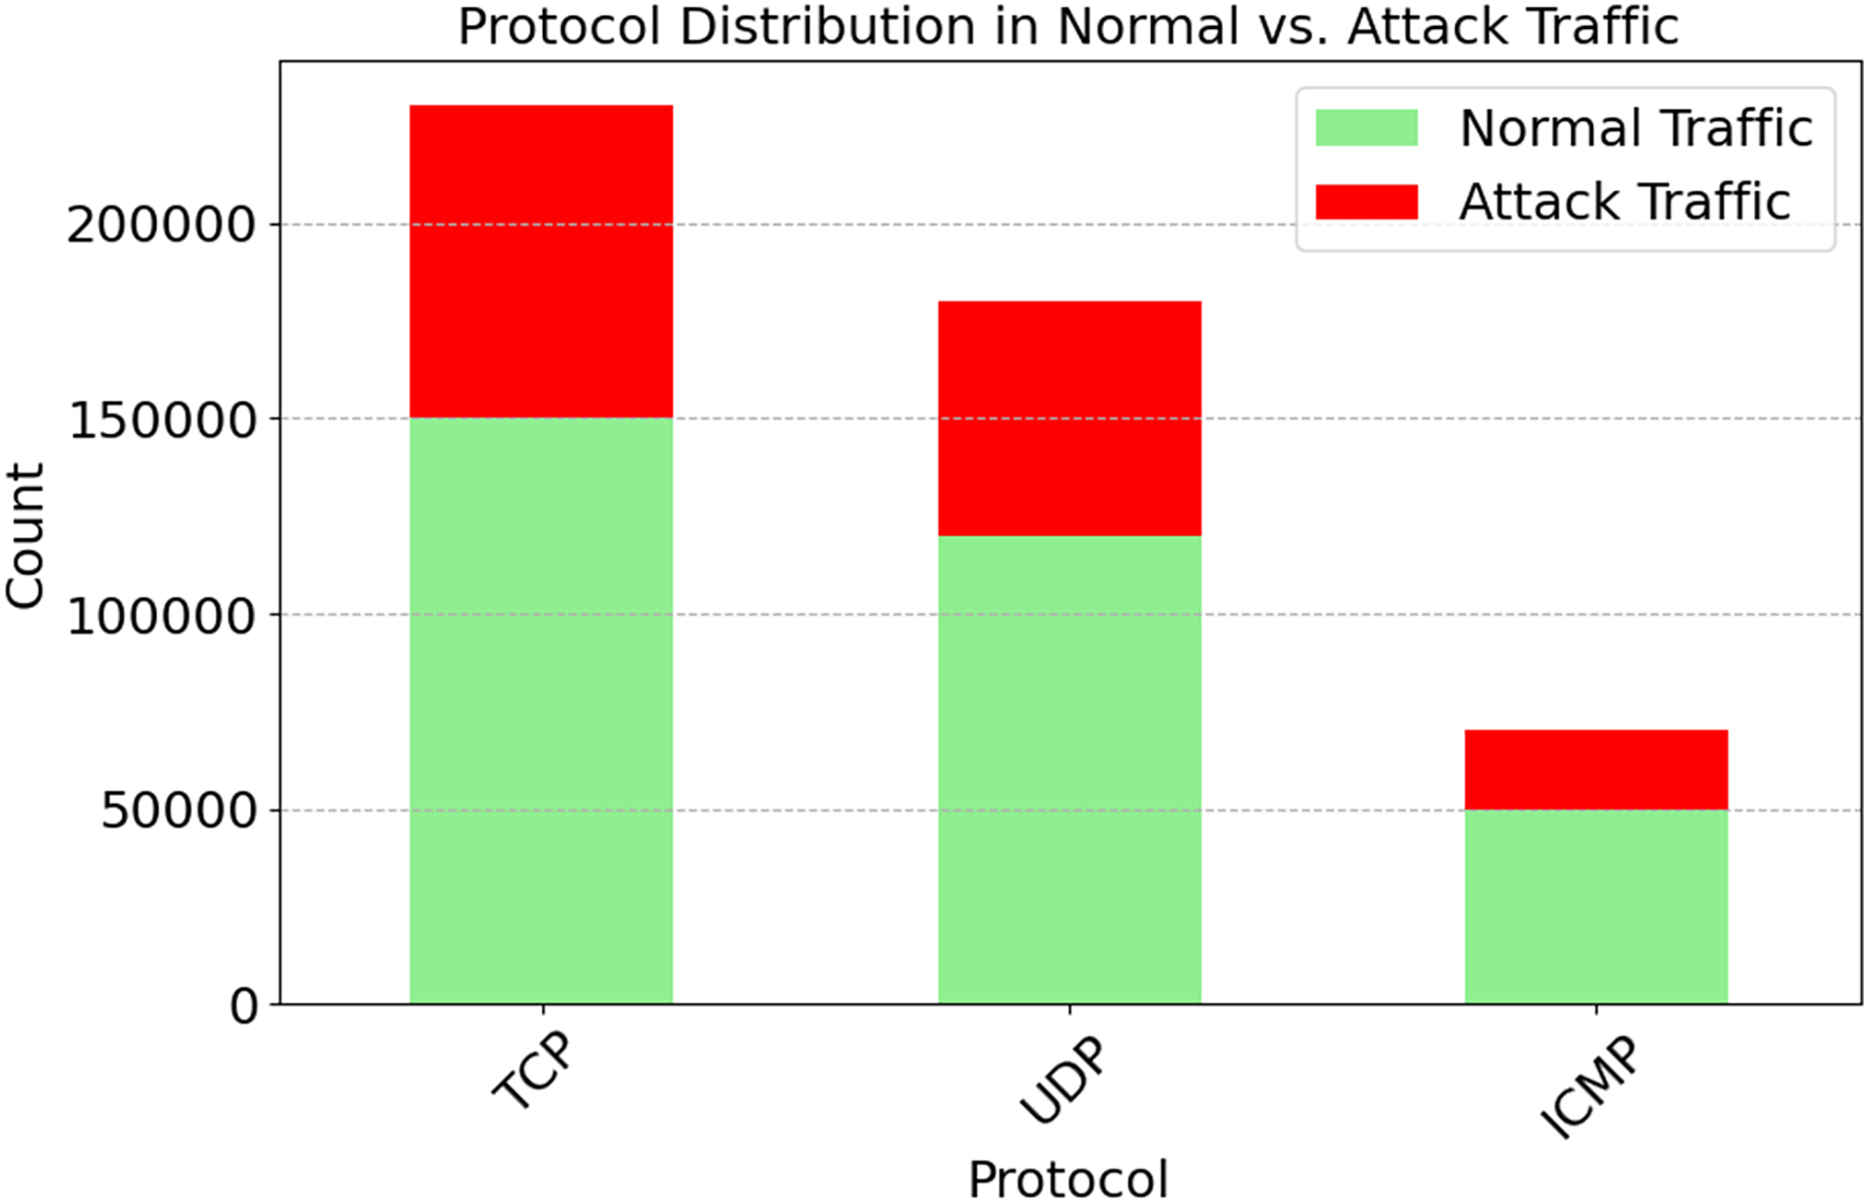
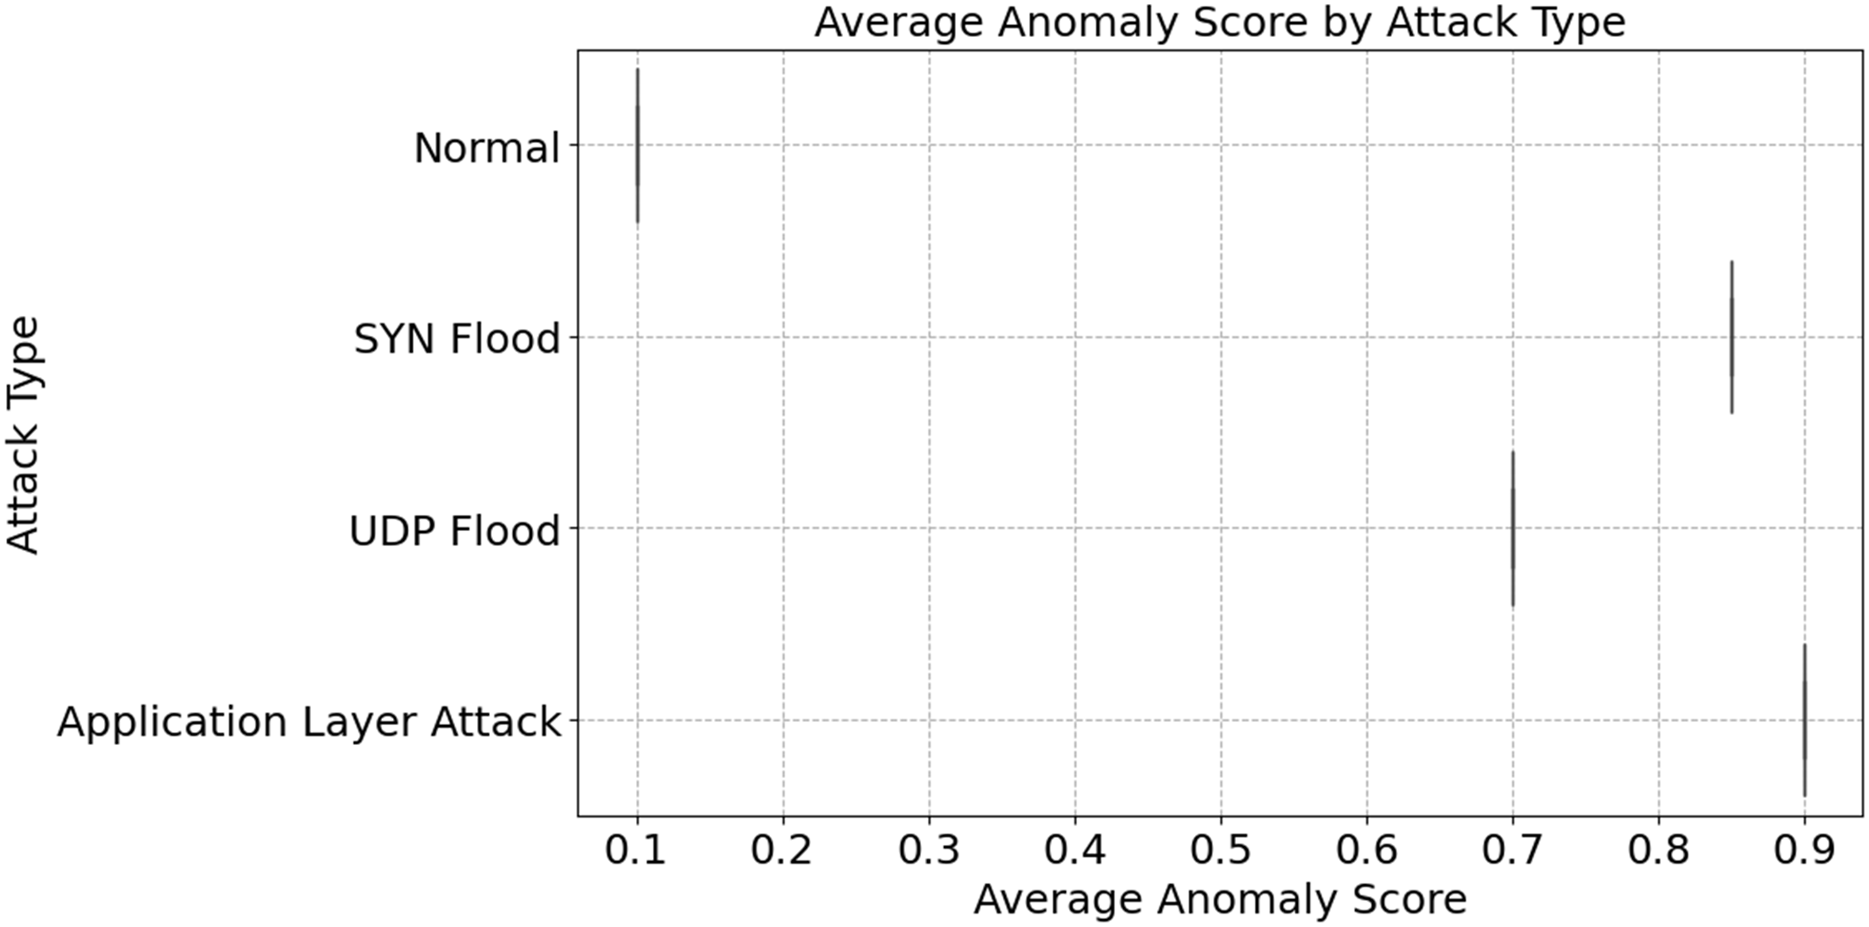
Network protocols (TCP, UDP, ICMP) are distributed in both regular and attack traffic, as seen in Fig. 5. With 150,000 everyday occurrences and 80,000 attacks, TCP traffic is the most prevalent. The prevalence of IoT devices is suggested. Then comes UDP with 120,000 normal and 60,000 attack events. Less-checked real-time apps utilize it. The lowest diagnostic distribution is ICMP, with 50,000 normal and 20,000 attack events. These numbers illustrate how protocols operate within a network. We need protocol-specific defenses since TCP might be targeted. Databases are susceptible to SYN Flood attacks; however, they are protected by TCP handshakes. For average anomaly scores across different attacks, refer to Fig. 6. A score indicates weird behavior. Typical traffic has an irregularity value of 0.1, whereas App Layer Attack has the highest score of 0.9. The App Layer Attack sees the most surprising behavior. It appears that there are distinct patterns of traffic. The anomaly ratings for SYN Flood and UDP Flood are 0.85 and 0.7, respectively. This is because, despite their diversity, they lack the sophistication of malicious actors operating at the application layer. The results show the significance of anomaly detection systems. They may distinguish the two types of traffic. System sensitivity and attack miss rate are both improved by increasing high-anomaly attack detection settings. This figure help adaptive detection systems find DDoS problems.
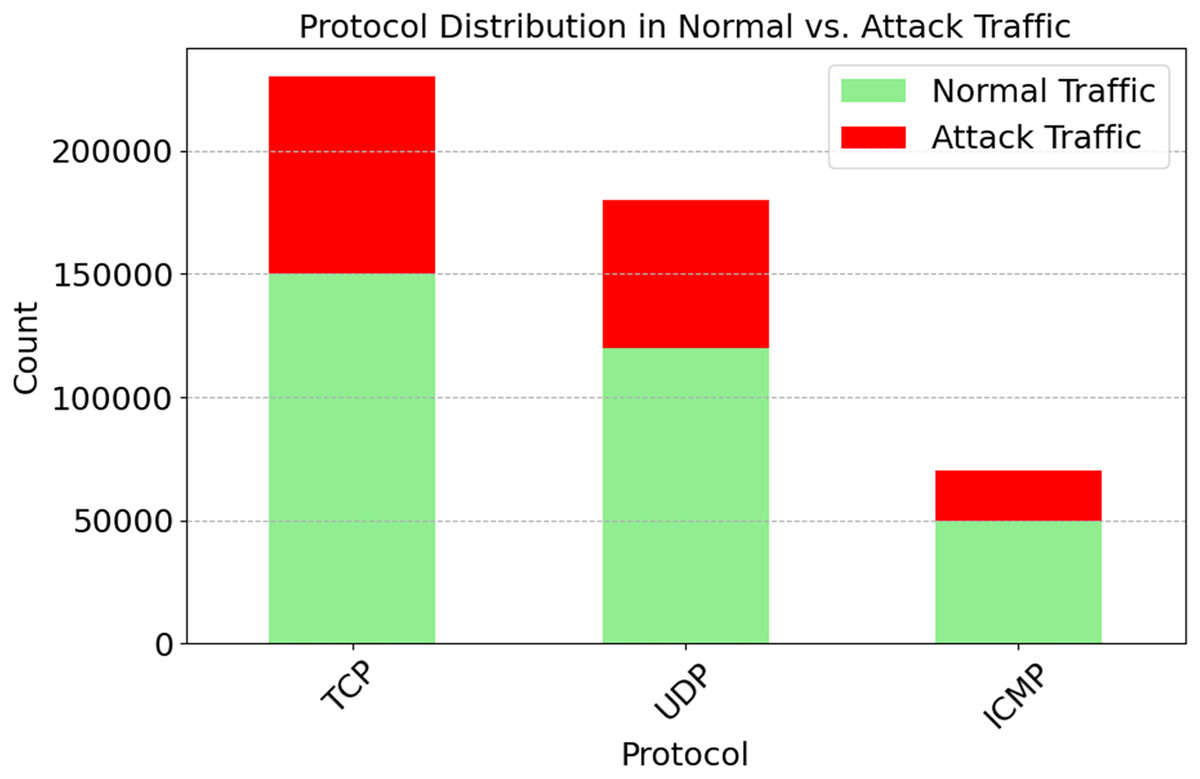
Figure 5: Protocol distribution in normal vs. attack traffic.
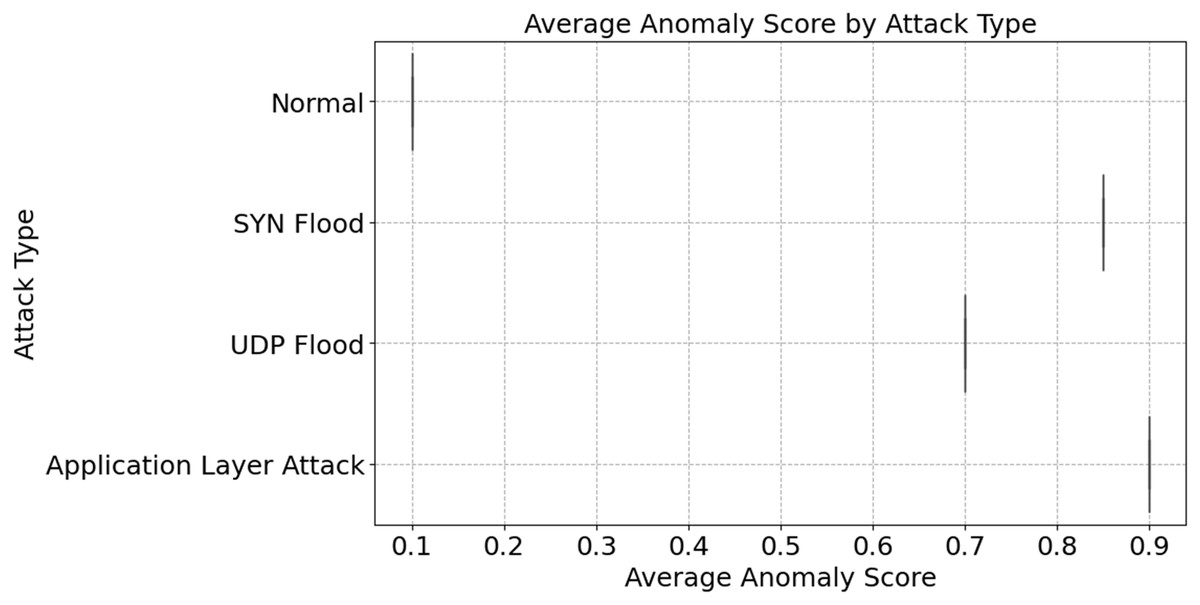
Figure 6: Average anomaly score by attack type.
Protocol behavior and temporal trends
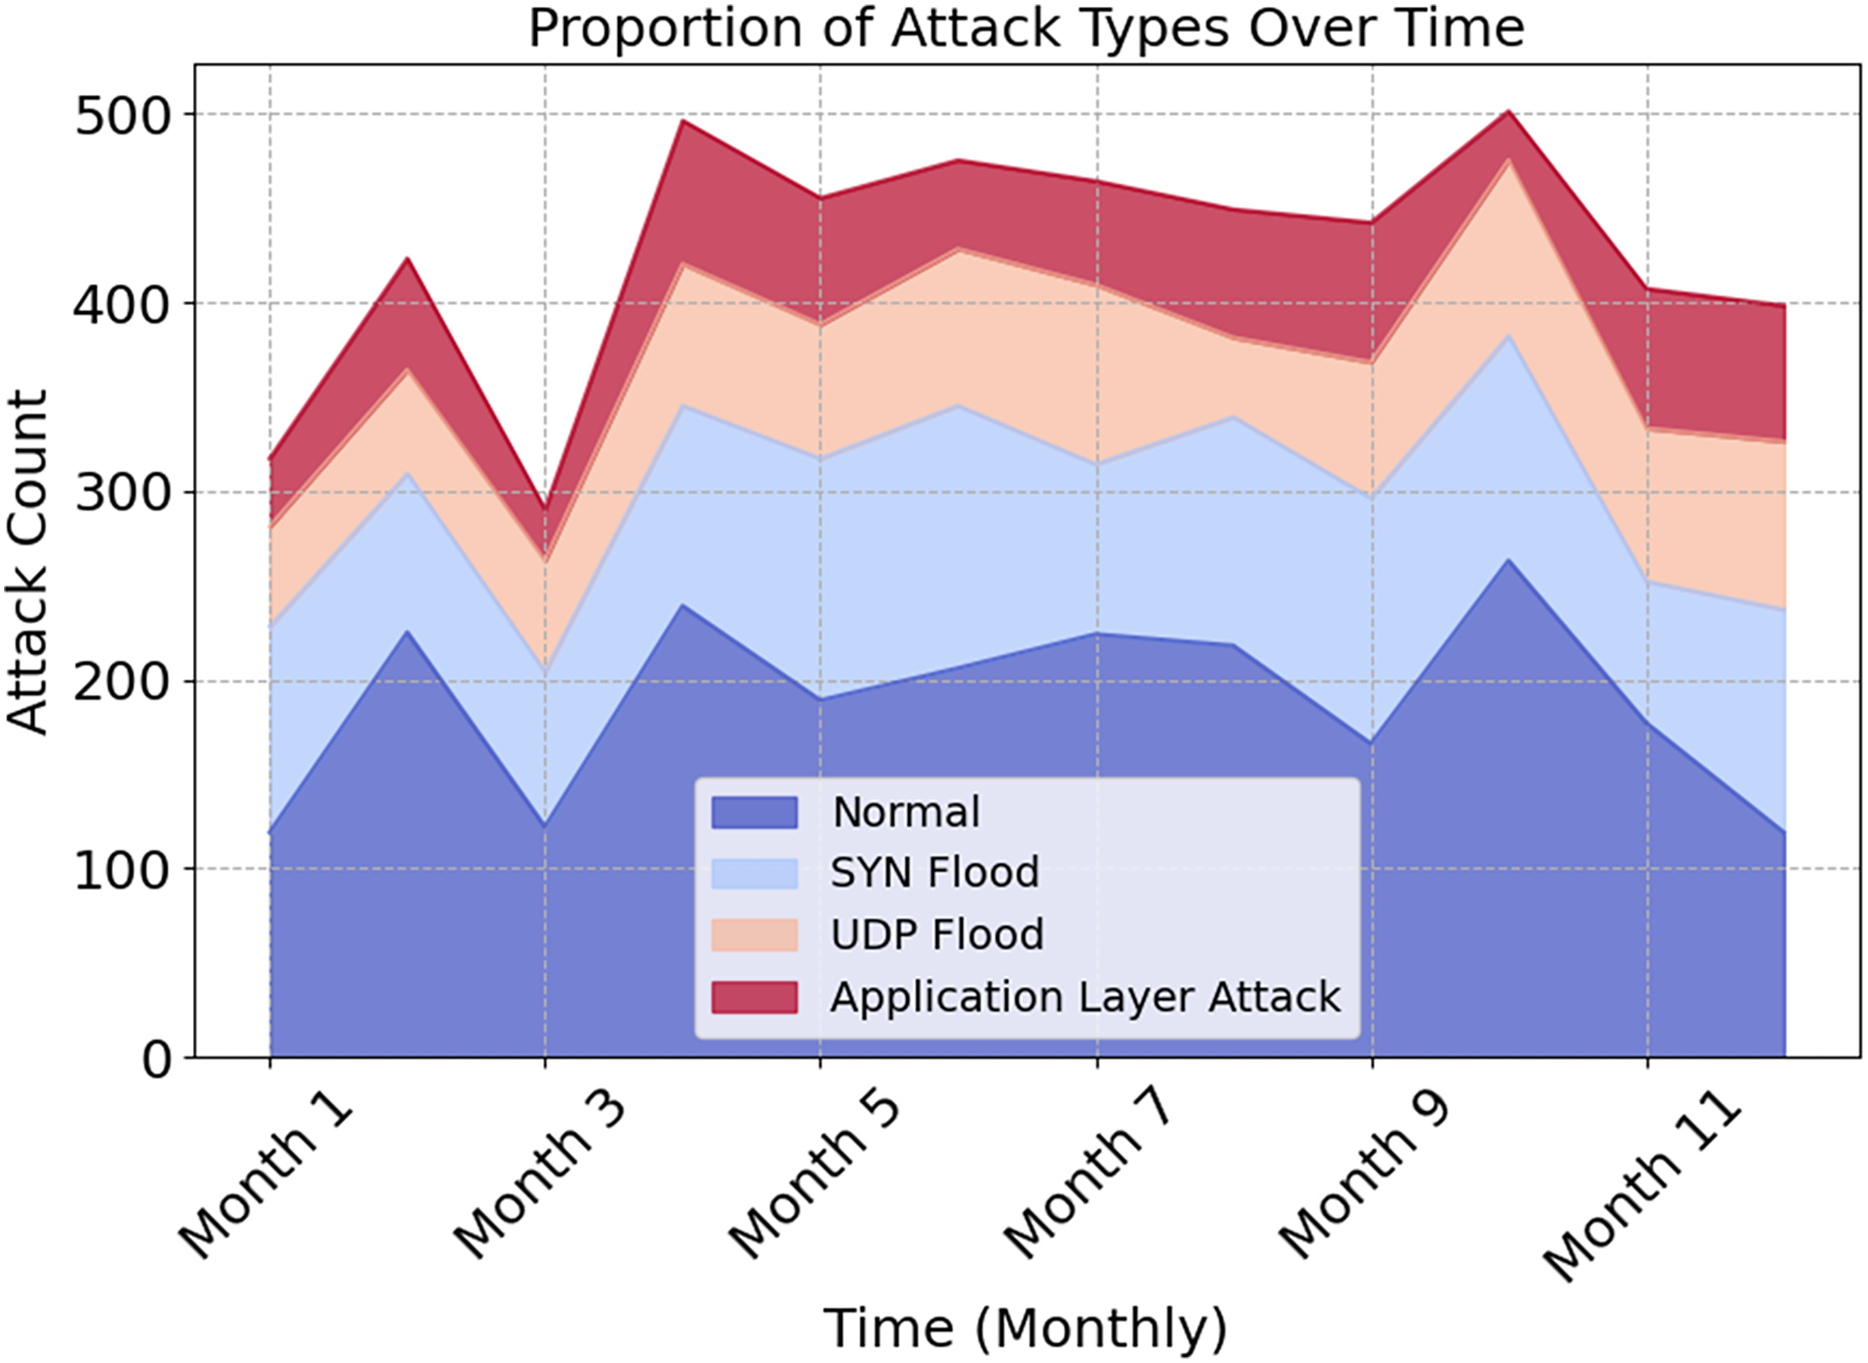
The distribution of attack types across the year is shown graphically in Fig. 7. This illustrates how types impact network traffic and security. Normal traffic dominates all months, as seen by the stacked area figure. In contrast, SYN Flood, UDP Flood, and Application Layer Attack exhibit various patterns across time. During seasonal or operational changes, preventive and adaptive measures must be taken to protect oneself. EDCRAN works effectively with IN-DDoS24, according to this study. It must be compatible with bigger and more diverse IoT networks. We will use datasets with varying network sizes, traffic patterns, and threats to demonstrate EDCRAN’s ability to adapt to dynamic Internet of Things circumstances.

Figure 7: Proportion of attack types over time.
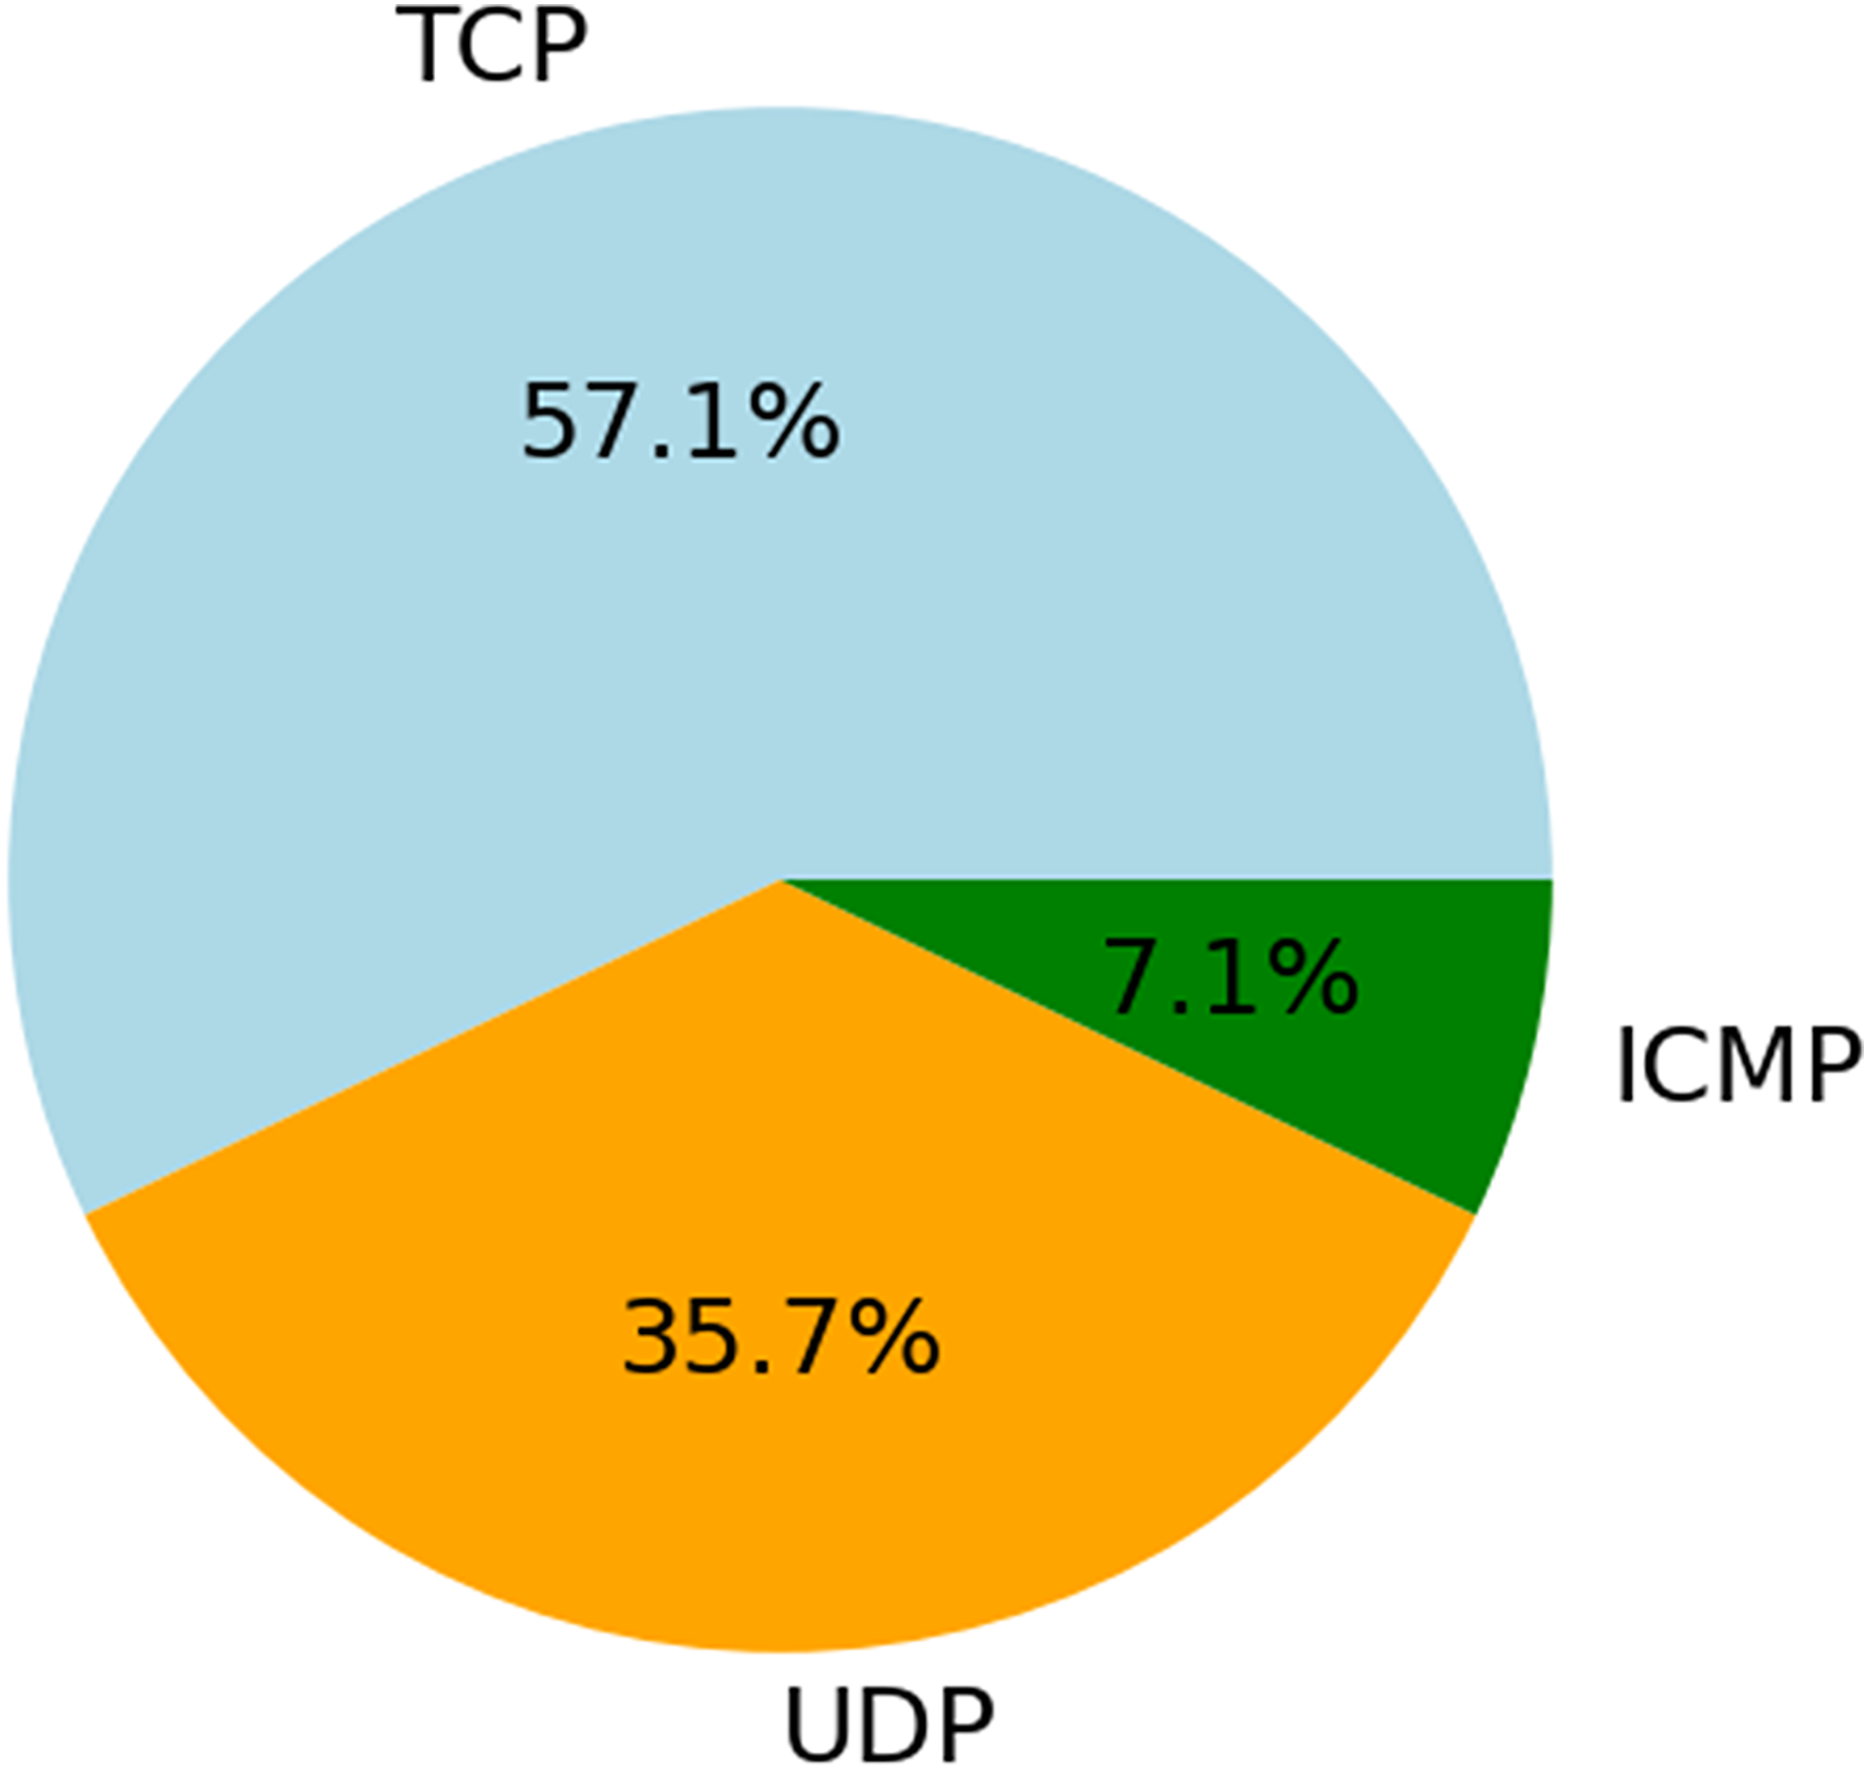
The data in Fig. 8 shows that out of all the traffic, 57.1% is carried by TCP, 35.7% is by UDP, and 7.1% is via ICMP. The widespread use of TCP demonstrates its dependability and suitability for connection-oriented communication. One indication that UDP excels in real-time applications is its widespread use. Diagnostic or flood attacks may still cause damage, even when ICMP attacks are infrequent. This research suggests that EDCRAN’s ability to generalize across protocols is a strong suit; however, to prove its robustness, it is necessary to use a wider variety of traffic scenarios and larger networks. To evaluate EDCRAN’s performance in actual Internet of Things environments, this approach will be used in subsequent experiments.
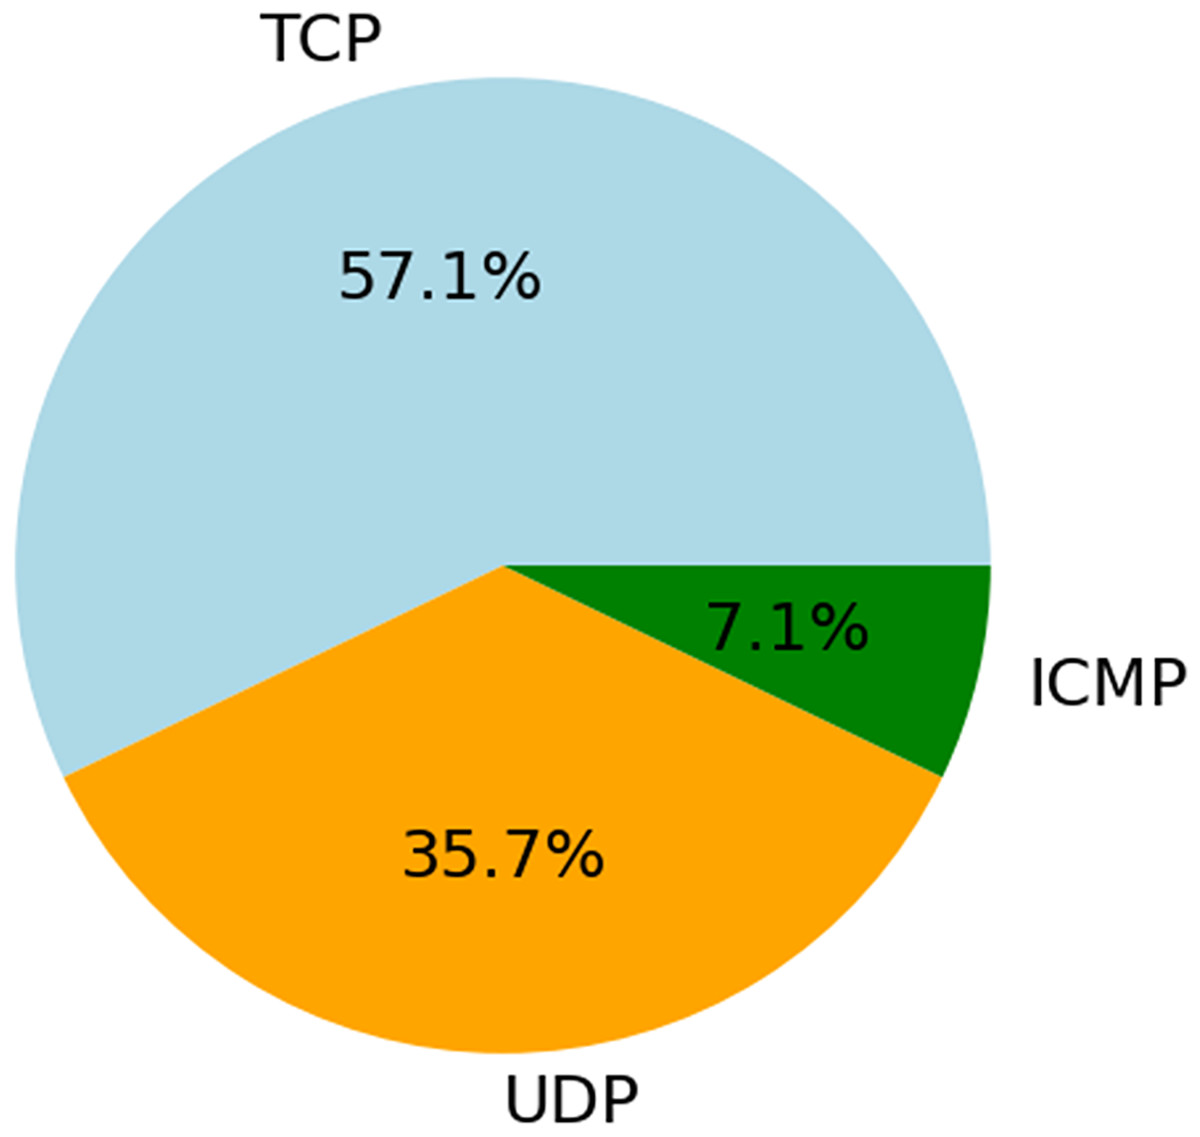
Figure 8: Protocol distribution in total traffic.
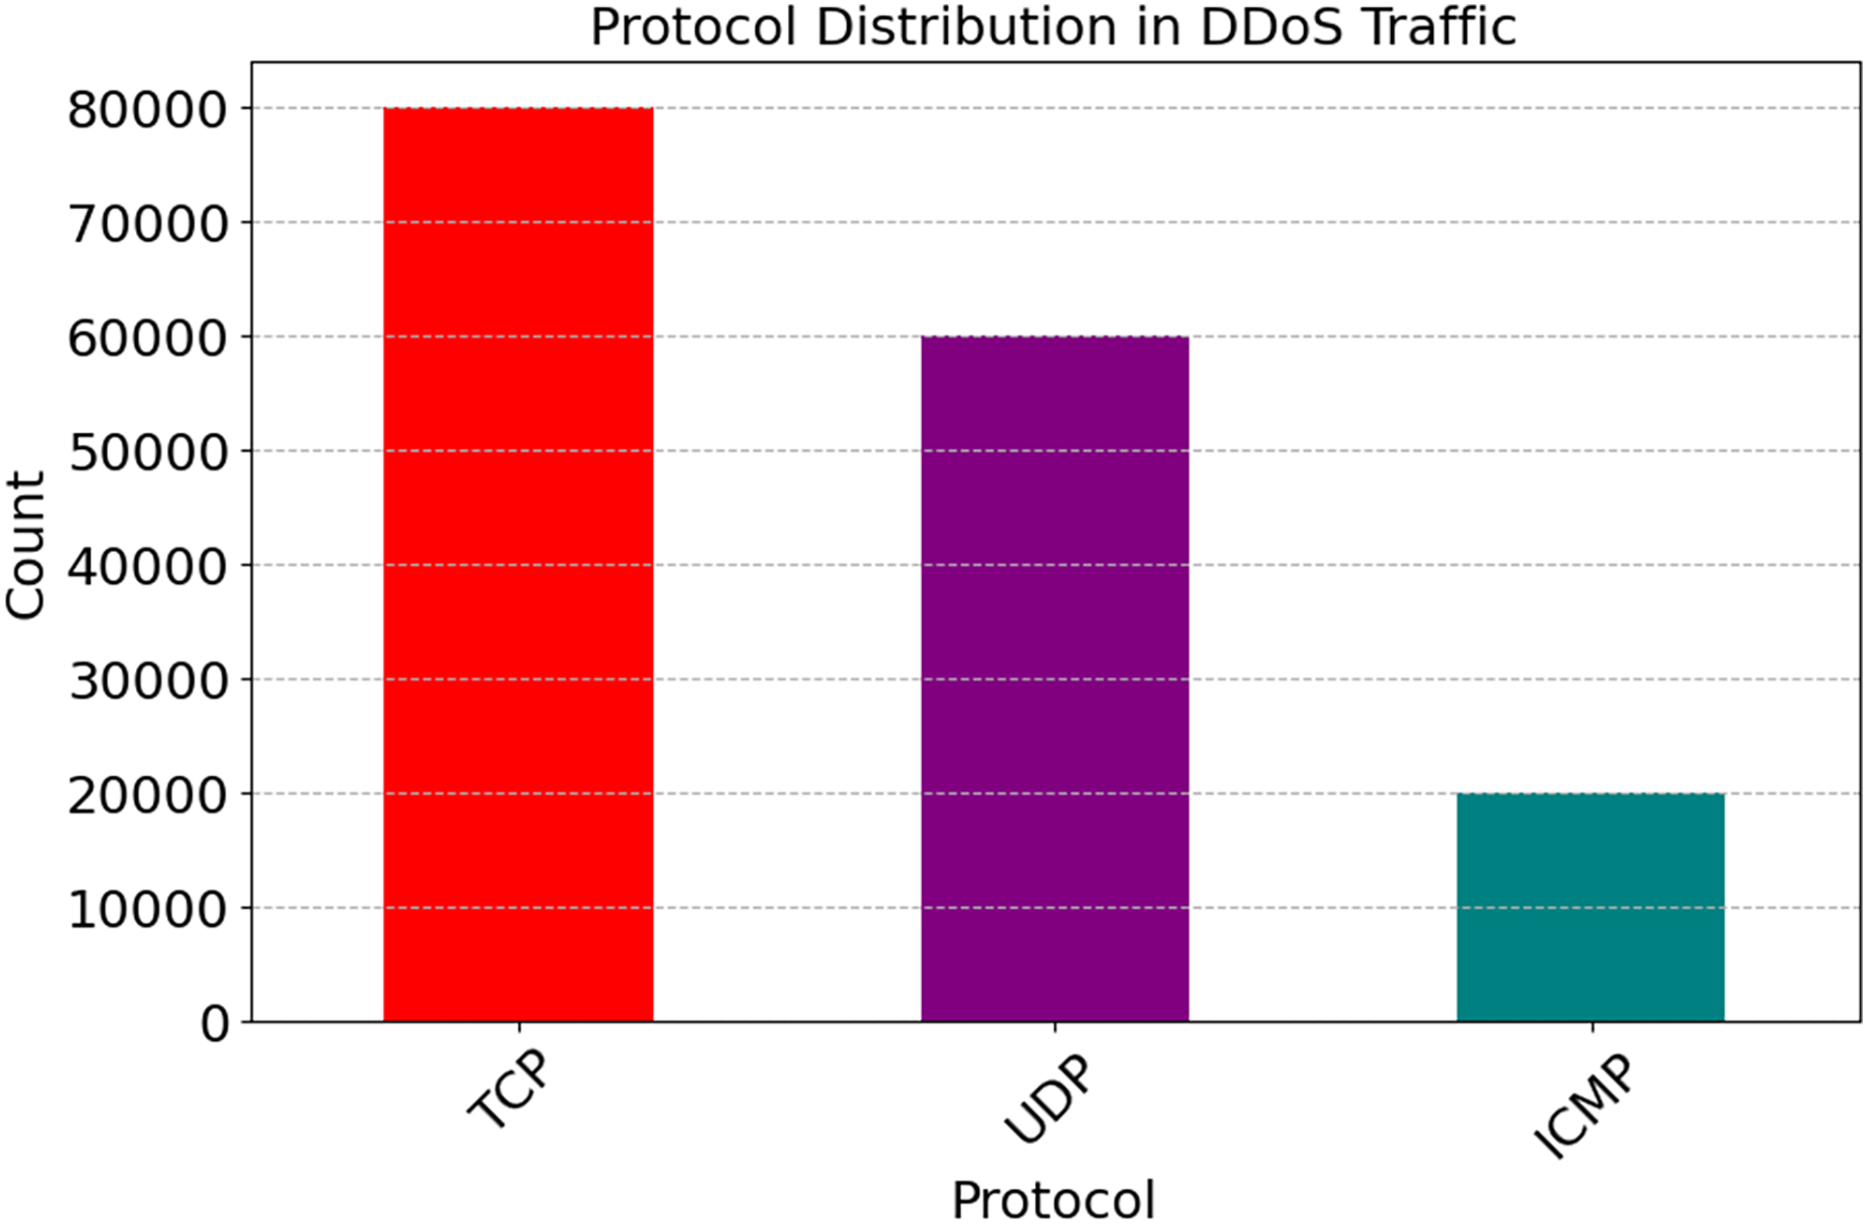
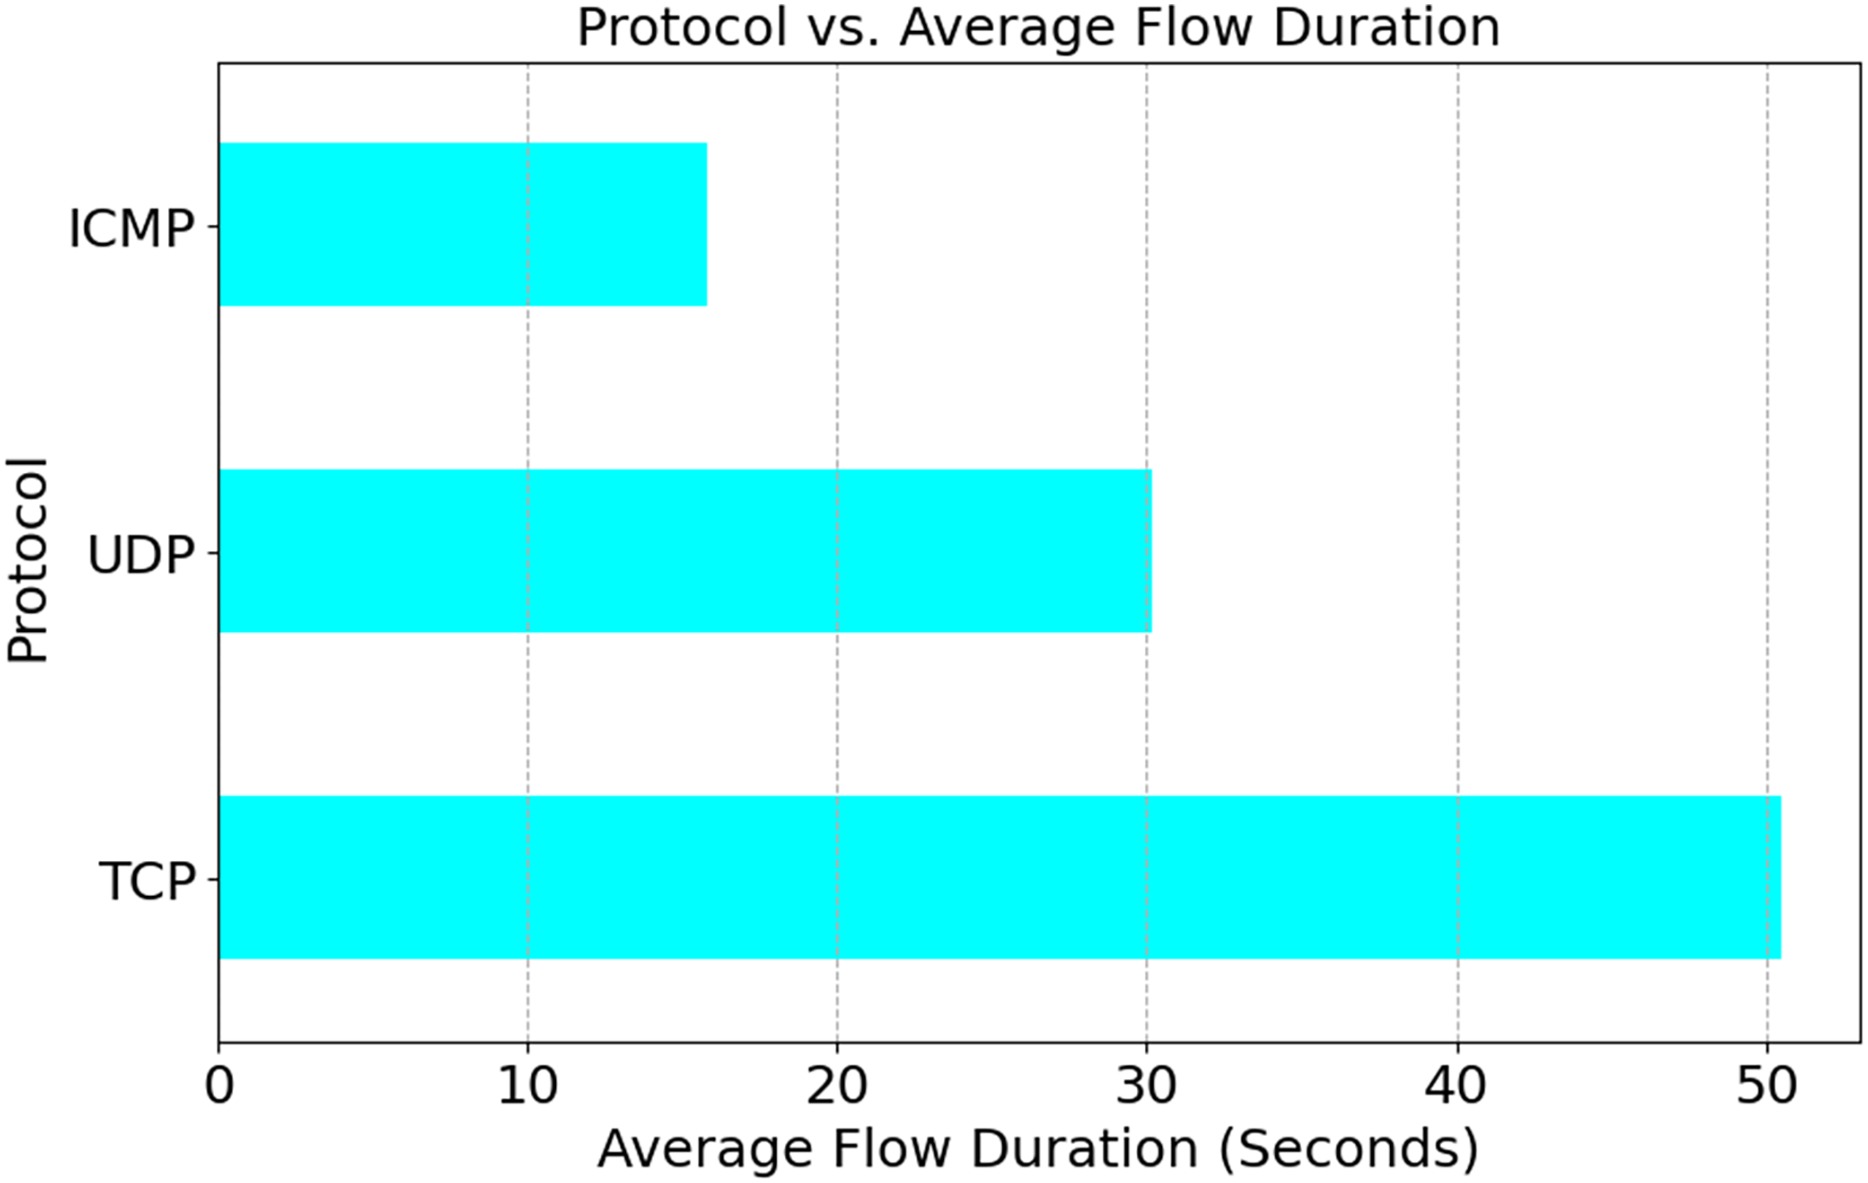
Figure 9 shows that 7.1% of DDoS traffic is ICMP, 35.7% is UDP, and 57.10% is TCP. DDoS assaults often use the TCP. TCP might be targeted by a SYN Flood, a connection-based assault, due to its prevalence. Data may overflow as UDP does not need a state. However, less common uses, such as reconnaissance and targeted flooding, utilize the Internet Control Message Protocol (ICMP). For this reason, adaptive systems and protocol-aware detection are crucial. As seen in Fig. 10, TCP sessions, which are primarily concerned with connections, tend to last longer than UDP sessions (30.2% of the time) and ICMP sessions (15.8% of the time). The reason is that a TCP session only lasts for fifty-five seconds. These enhancements have made it clear that flow time patterns are crucial for identifying DDoS attack types targeting specific protocols.
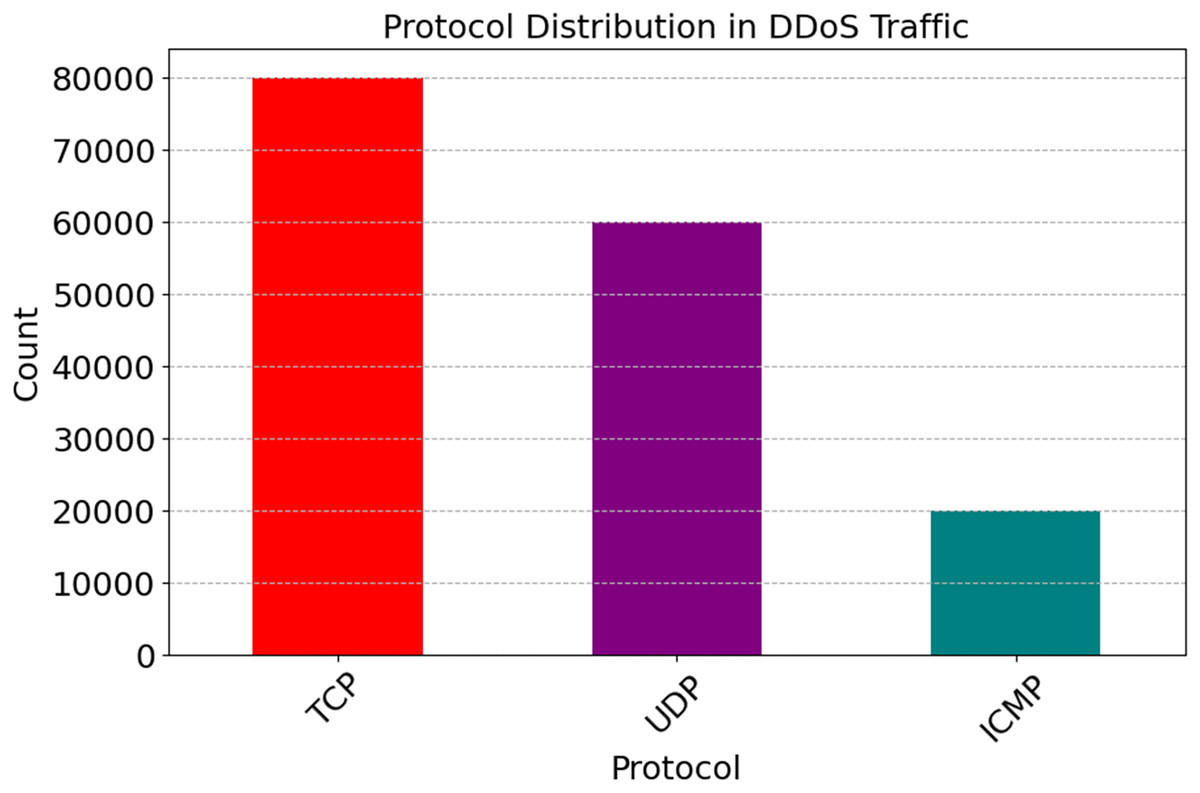
Figure 9: Analysis of protocol usage patterns in DDoS attacks.

Figure 10: Protocol vs. average flow duration.
Feature importance and anomaly detection
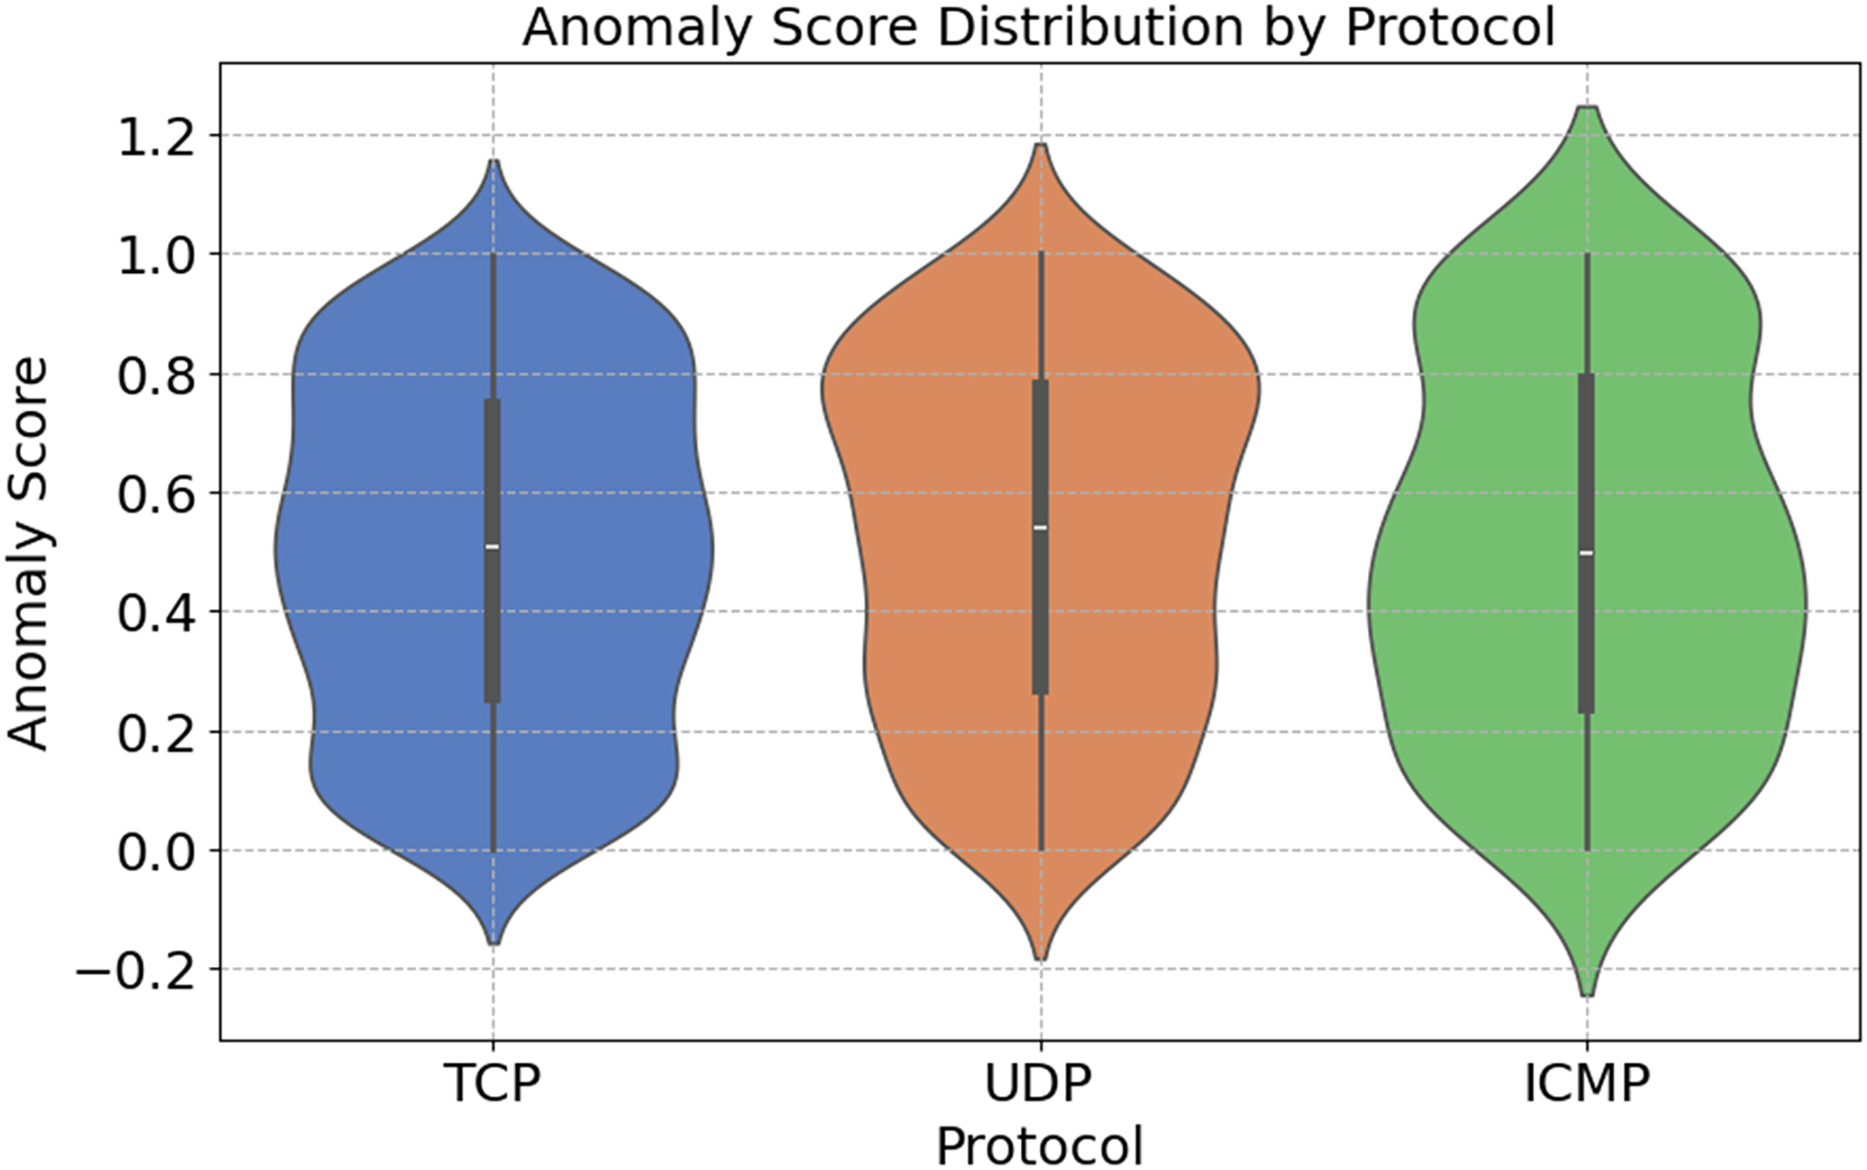
Figure 11 shows the distribution of anomaly ratings across different network protocols. These stages are shown in the figure. The SYN Flood and ACK Flood attacks exploit the fact that TCP can handle a wide range of anomaly scores. A security issue arises with the TCP, which is a connection-based protocol. UDP is susceptible to attacks such as UDP Floods because of its lack of connection-oriented features. In comparison to other algorithms, UDP has a smaller range of anomaly scores. Due to its primary use in network diagnostics, ICMP’s anomaly ratings are infrequently updated. In light of these results, it appears that protocol-specific anomaly detection systems are crucial for identifying and defending against targeted attacks.
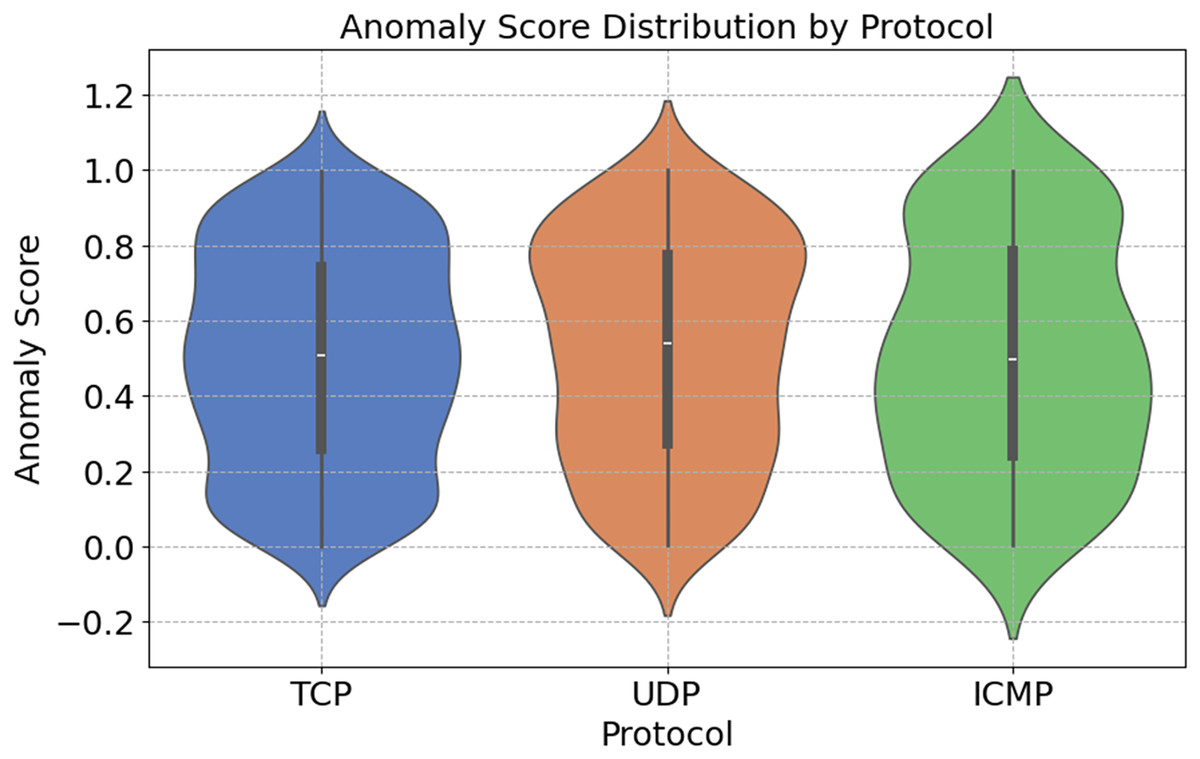
Figure 11: Protocol-specific anomaly score distribution.
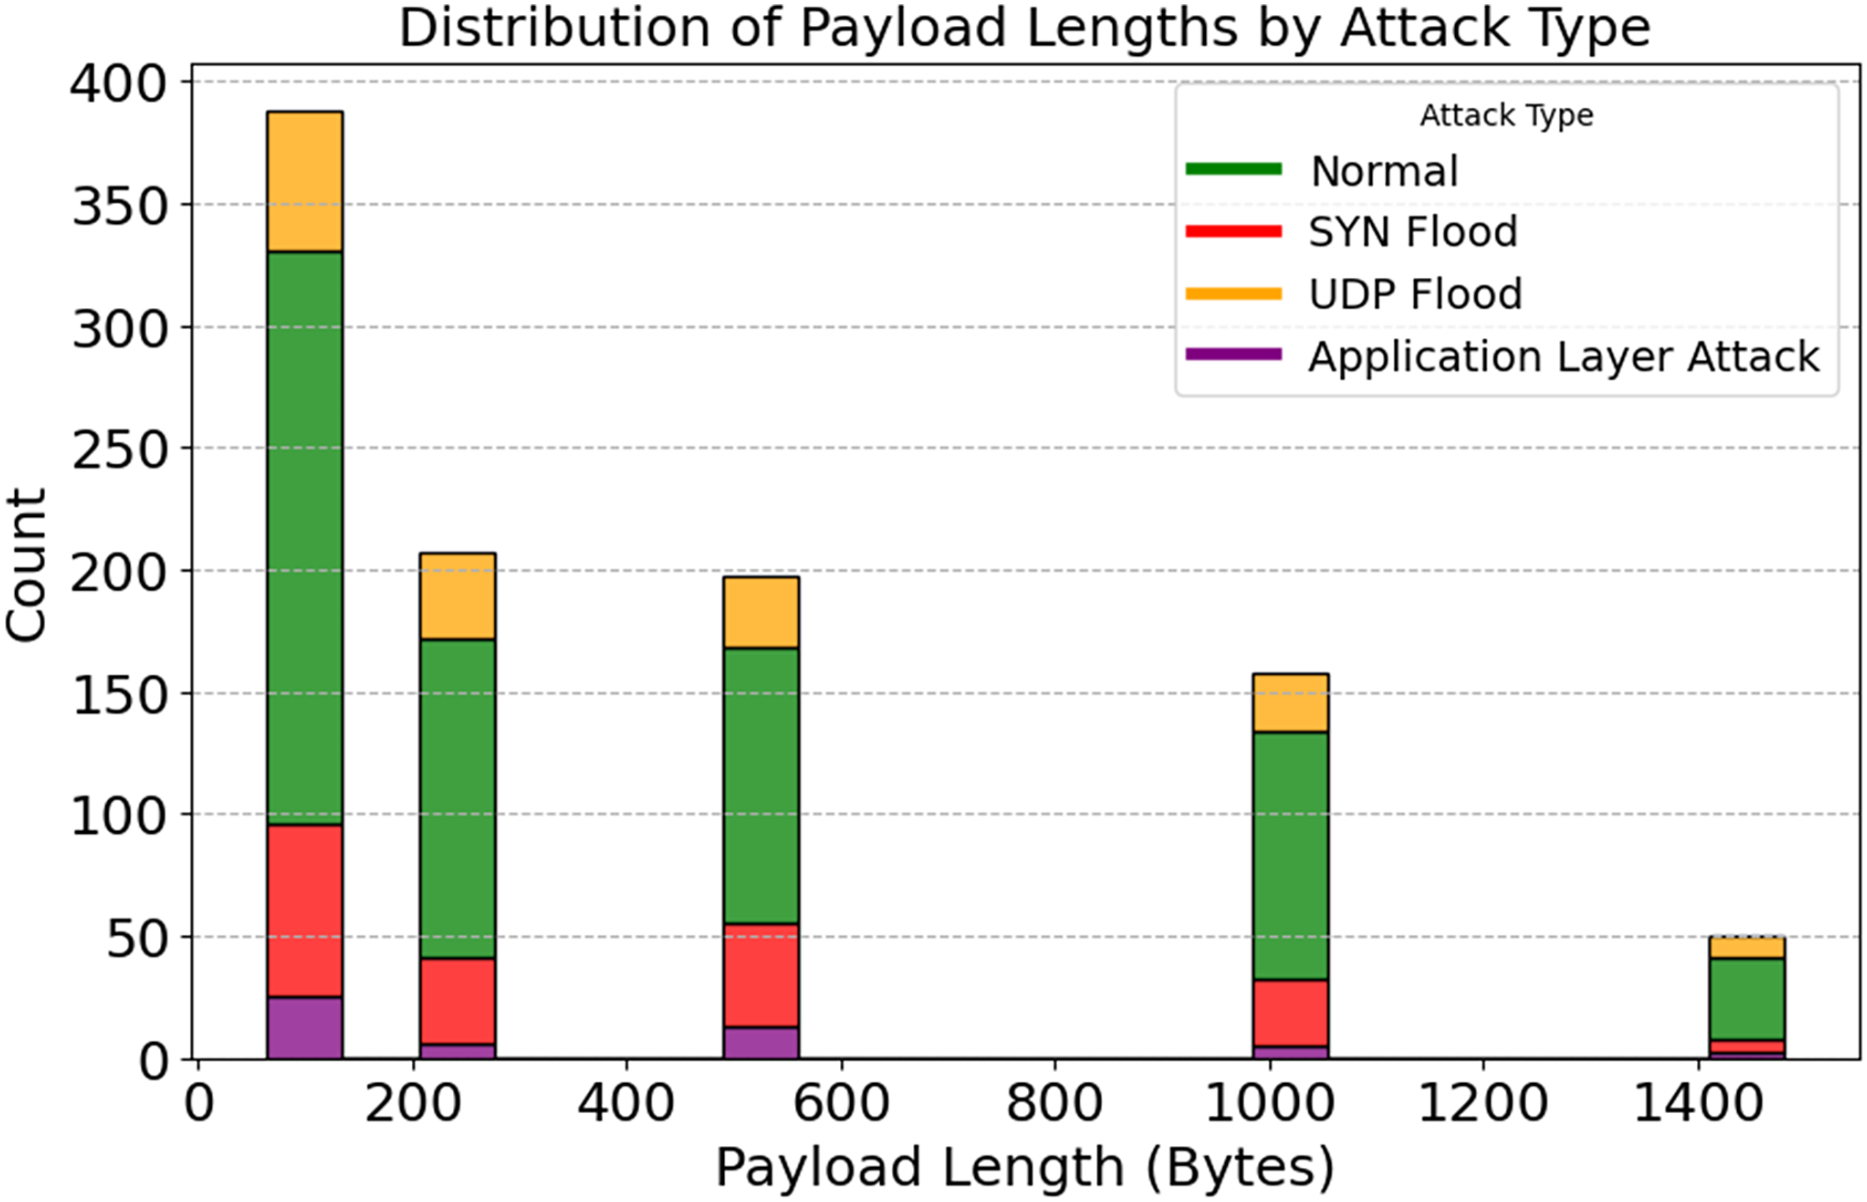
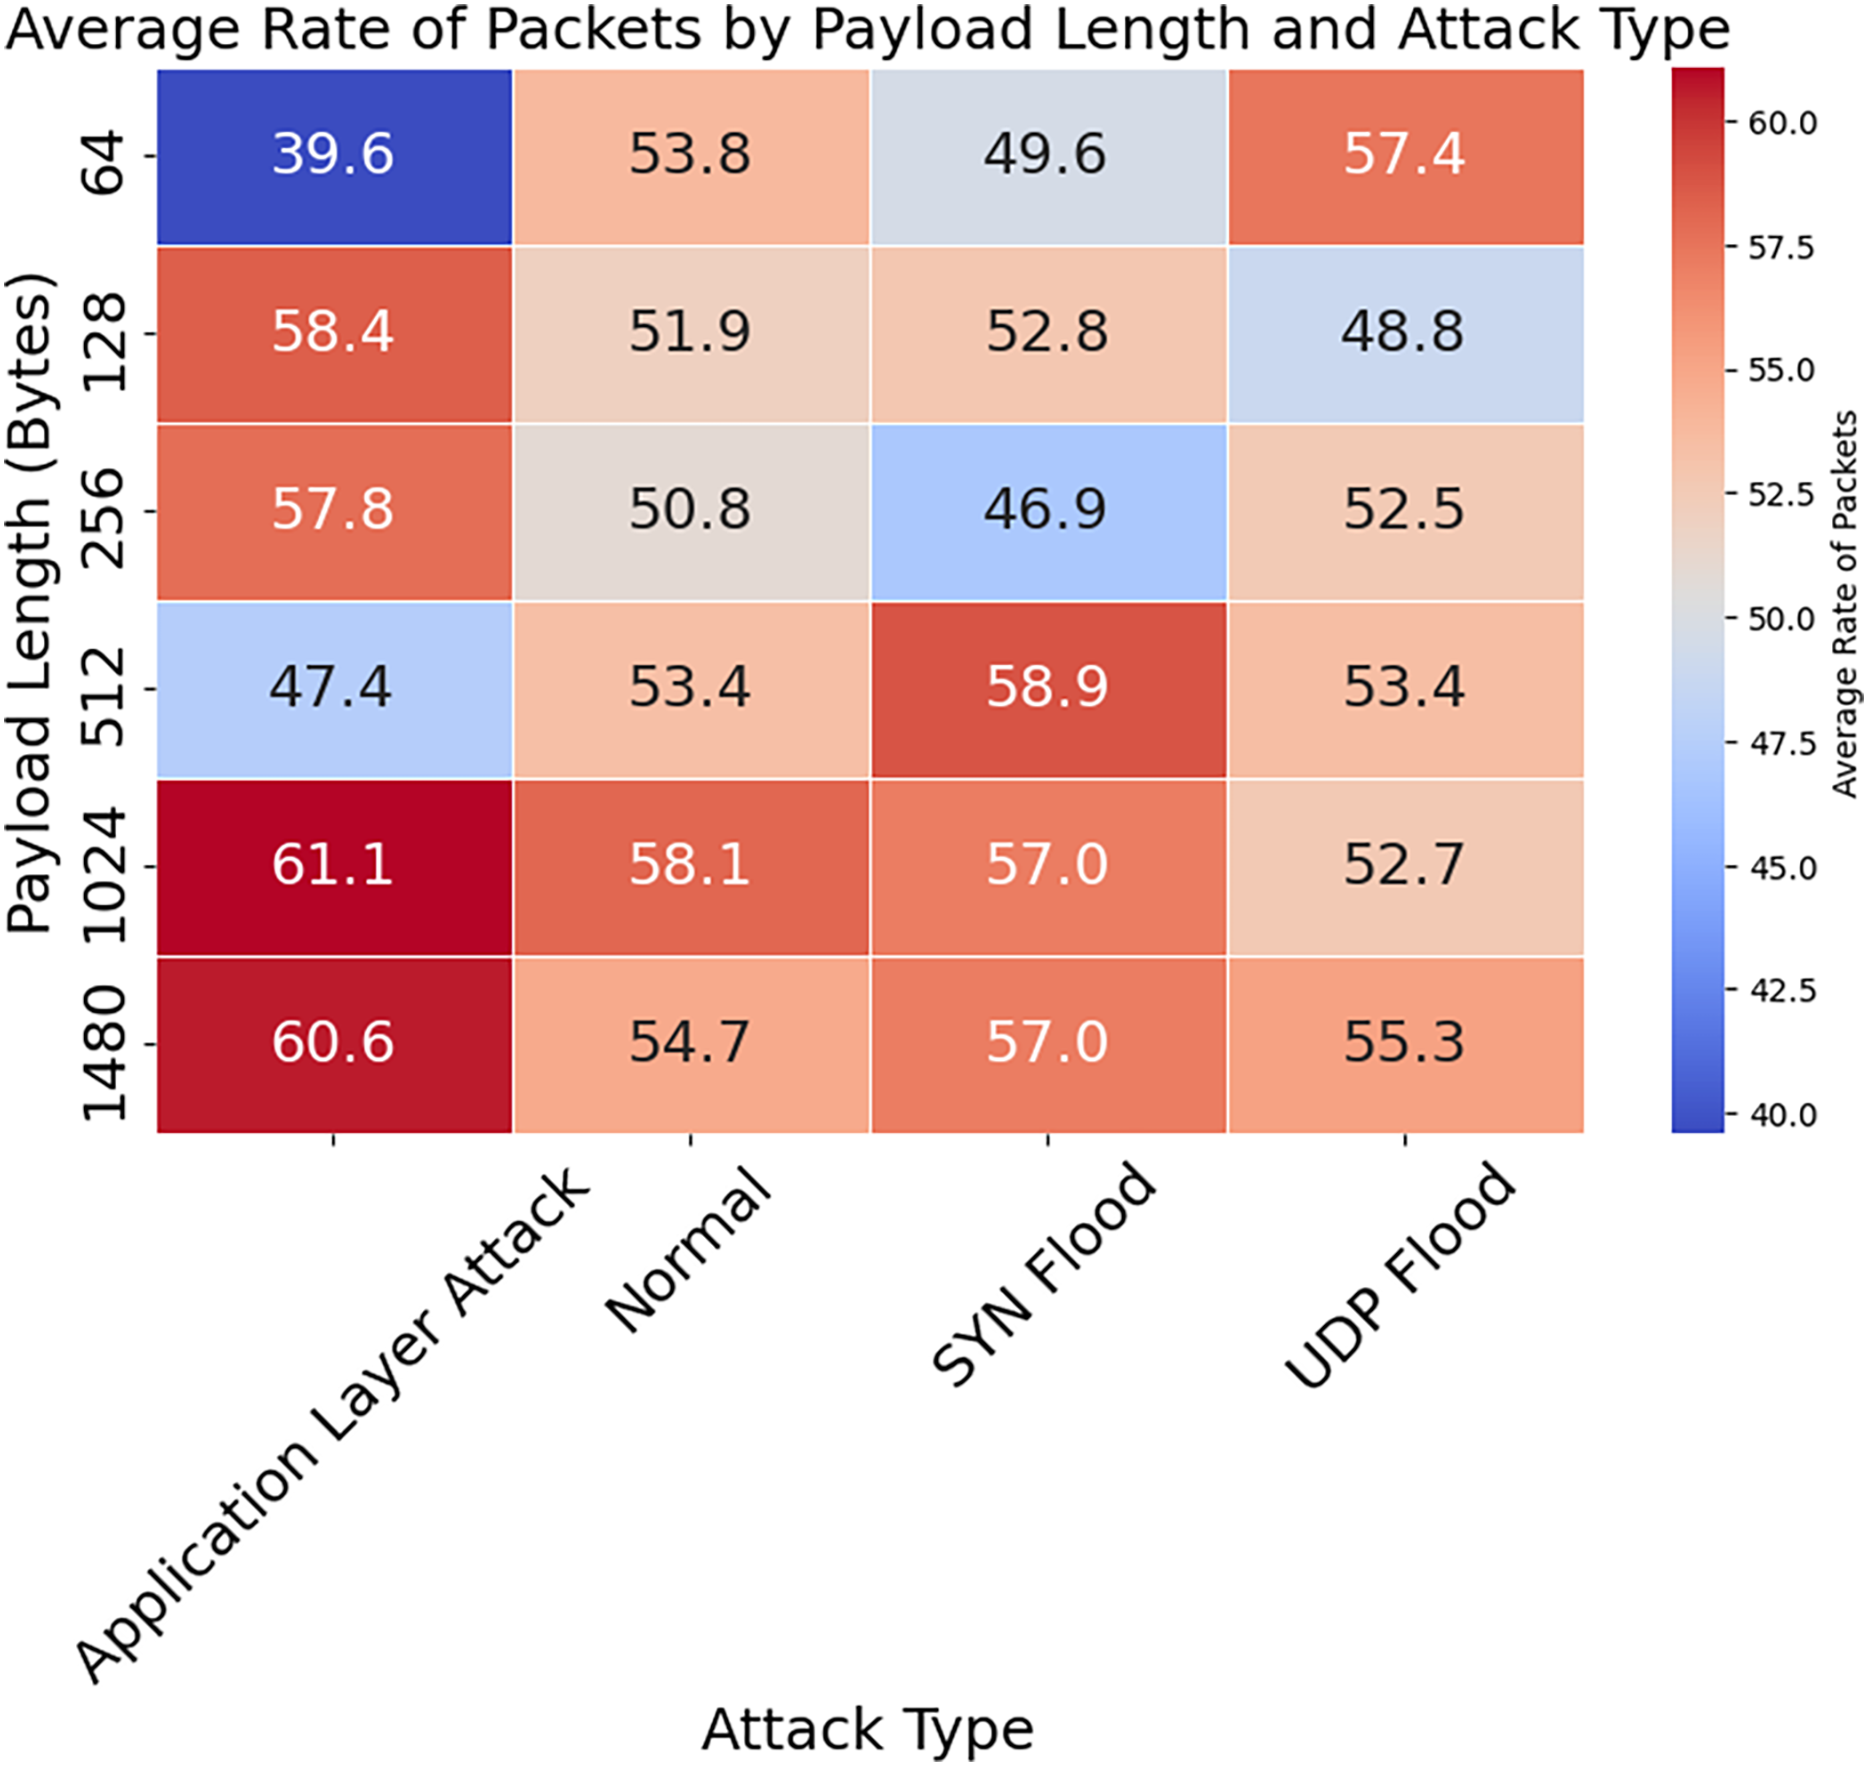
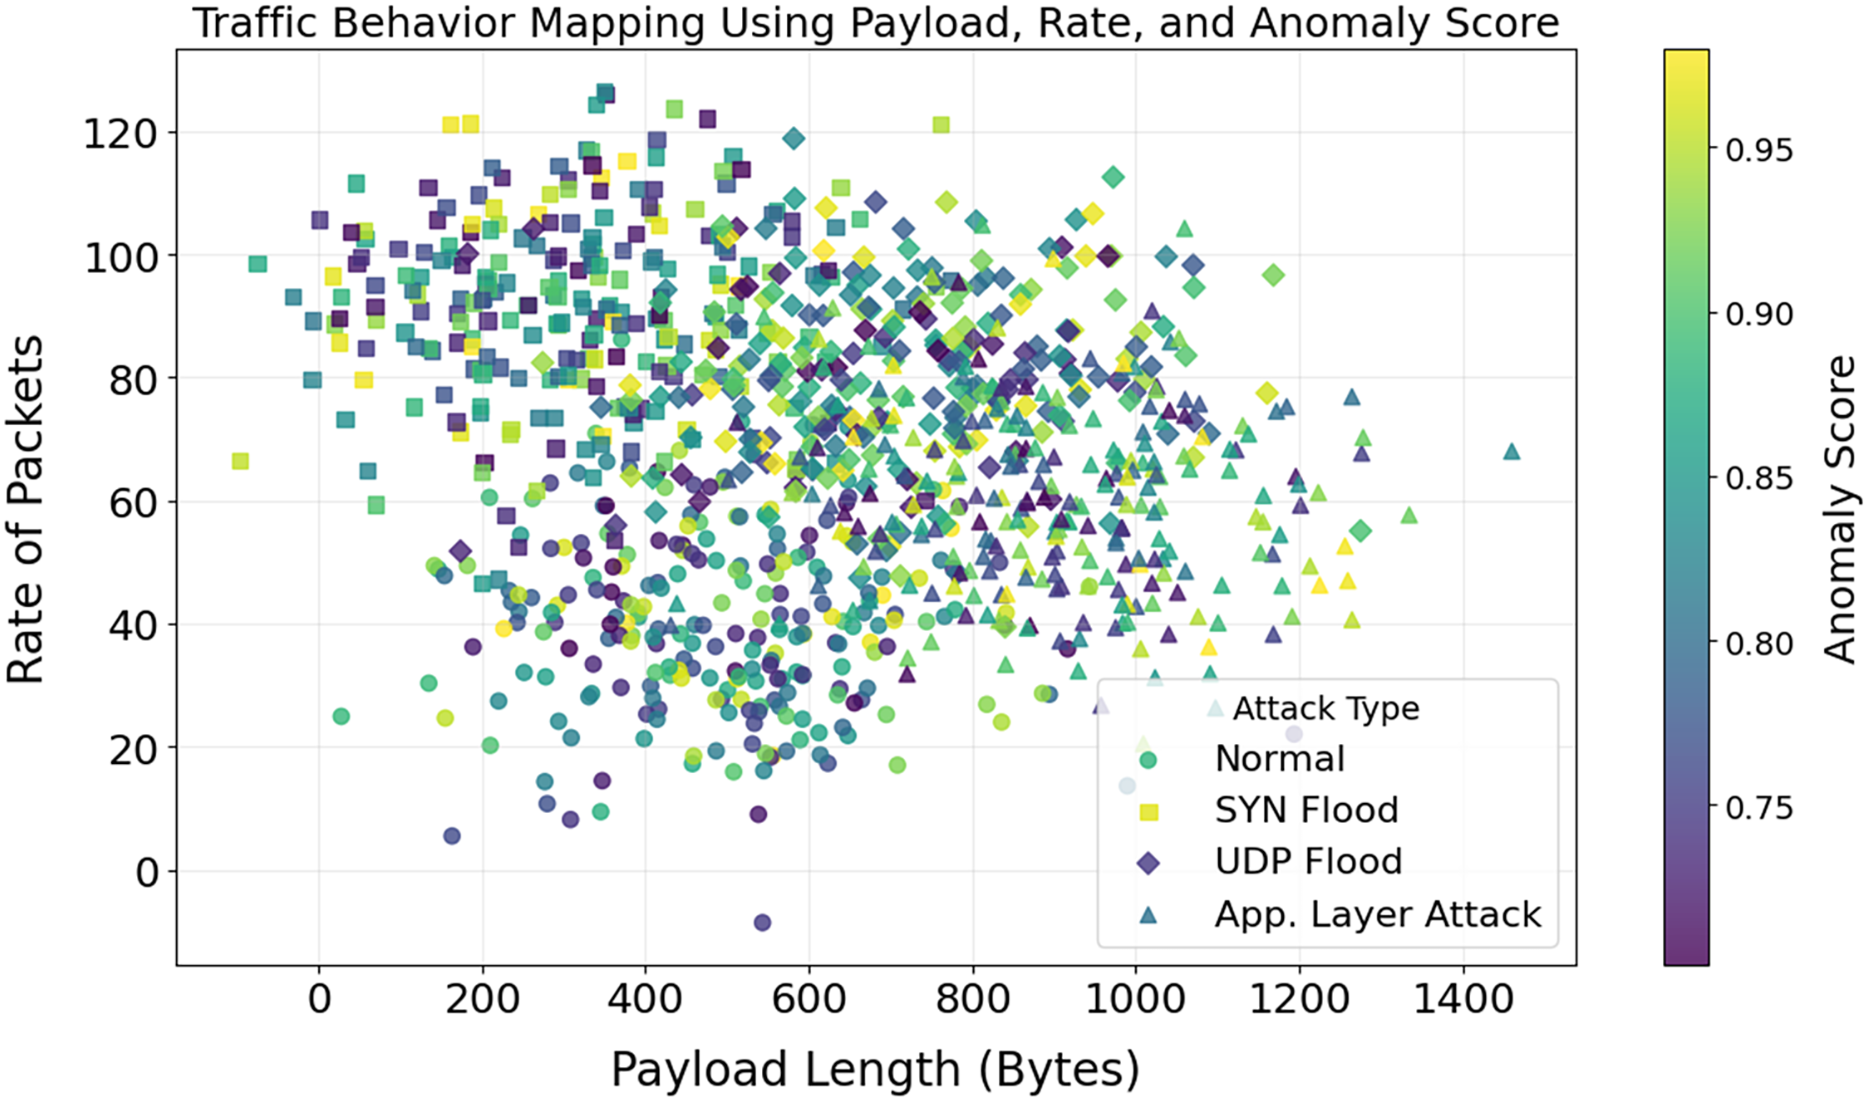
A stacked histogram showing changes in payload length with various attacks is shown in Fig. 12. Standard payload sizes for IoT network communication are 64 and 128 bytes. The 512-byte and 1,024-byte payloads are used by SYN and UDP Flood attack techniques, respectively. There are numerous ways that application-layer attacks can evade detection systems, even if their payloads differ. Unusual payload sizes may be uncovered via the discovery of anomalies. Reduce false positives and aid in detecting high-frequency attacks by utilizing payload-specific characteristics. The importance of attack-specific detection is further highlighted. It would lead to improved DDoS protection. By analyzing the relationship between packet rate, payload length, and anomaly scores, Figs. 13 and 14 illustrate how traffic responds to various attacks. Application Layer Attacks may cause system overload as a consequence of increasing traffic, as seen in Fig. 13. Under UDP Flood attacks, a 1024-byte payload is effective. These differences underscore the importance of traffic pattern analysis when developing systems to detect various types of attacks. Figure 14 displays a three-dimensional scatter plot illustrating a correlation between higher anomaly scores and faster packet speeds and payloads. The UDP Flood and the Application Layer Attack are two examples of aggressive attacks. The fact that benign traffic is more evenly distributed suggests that the model can differentiate between benign and harmful actions. In multidimensional traffic, they enhance anomaly detection systems. Systems can proactively handle intricate and ever-changing DDoS patterns.
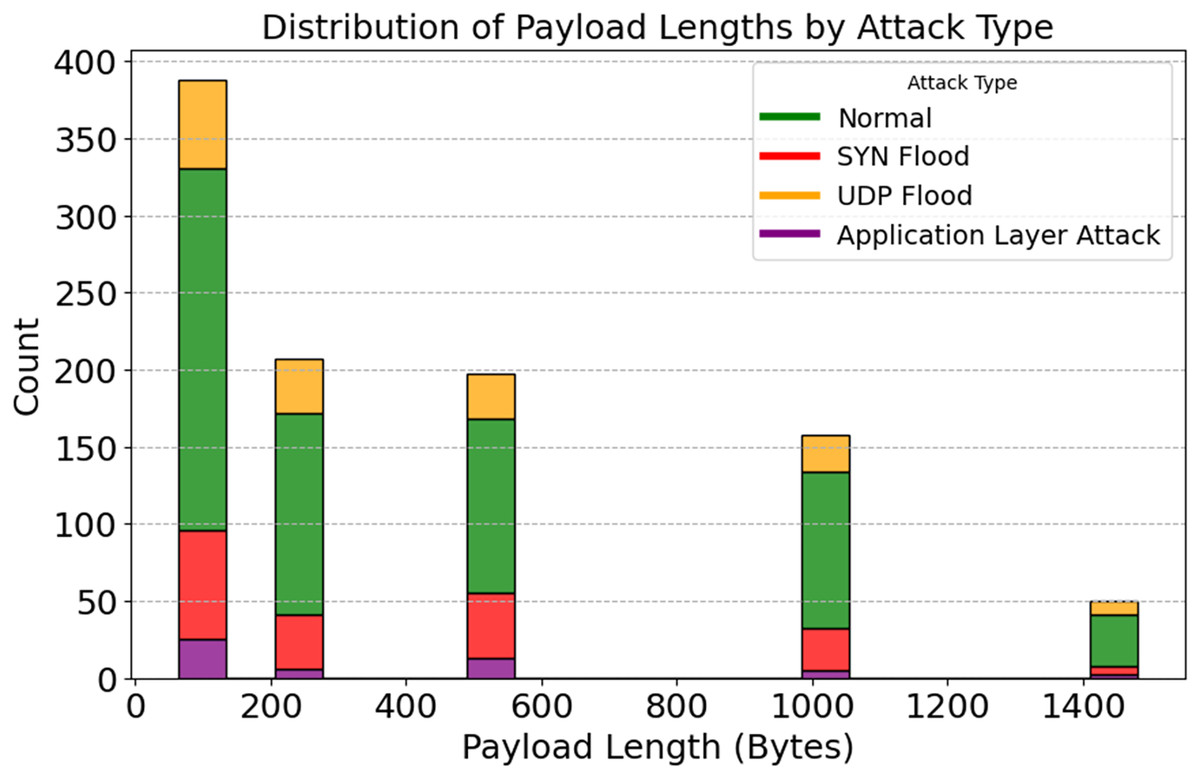
Figure 12: Distribution of payload lengths by attack type.
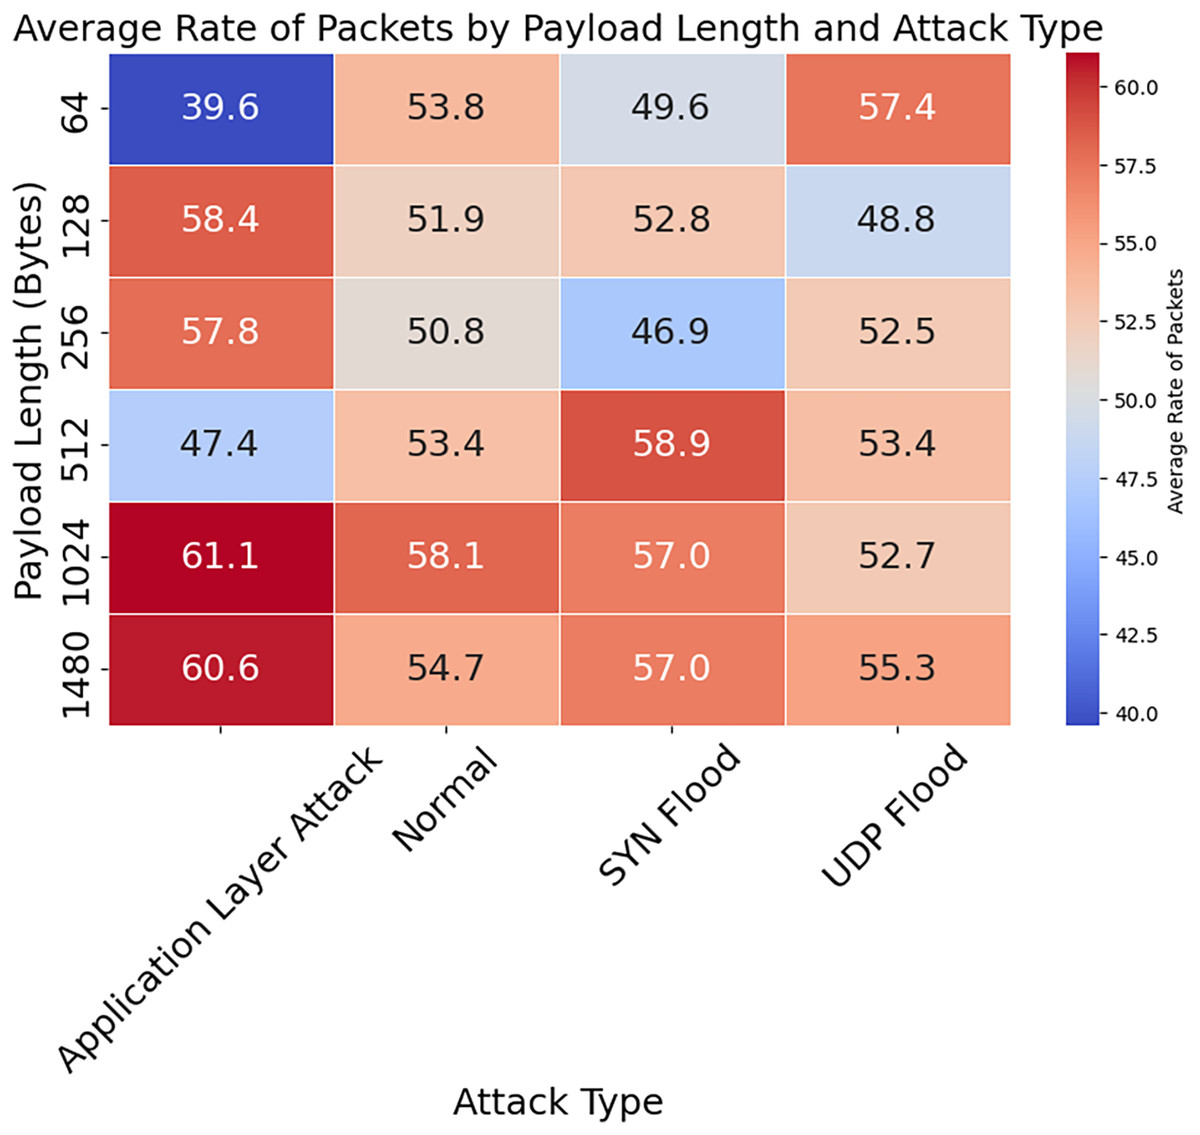
Figure 13: Average rate of packets by payload length and attack type.
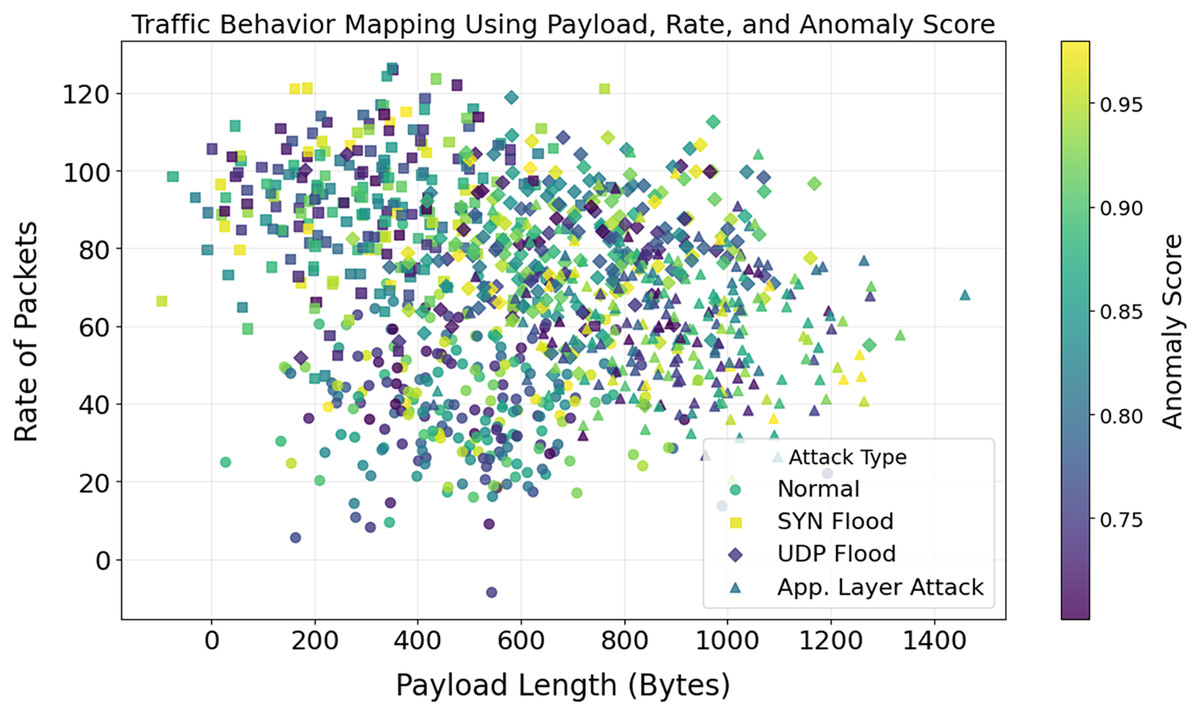
Figure 14: Correlation between payload length, rate of packets, and anomaly score.
Classification performance and statistical analysis
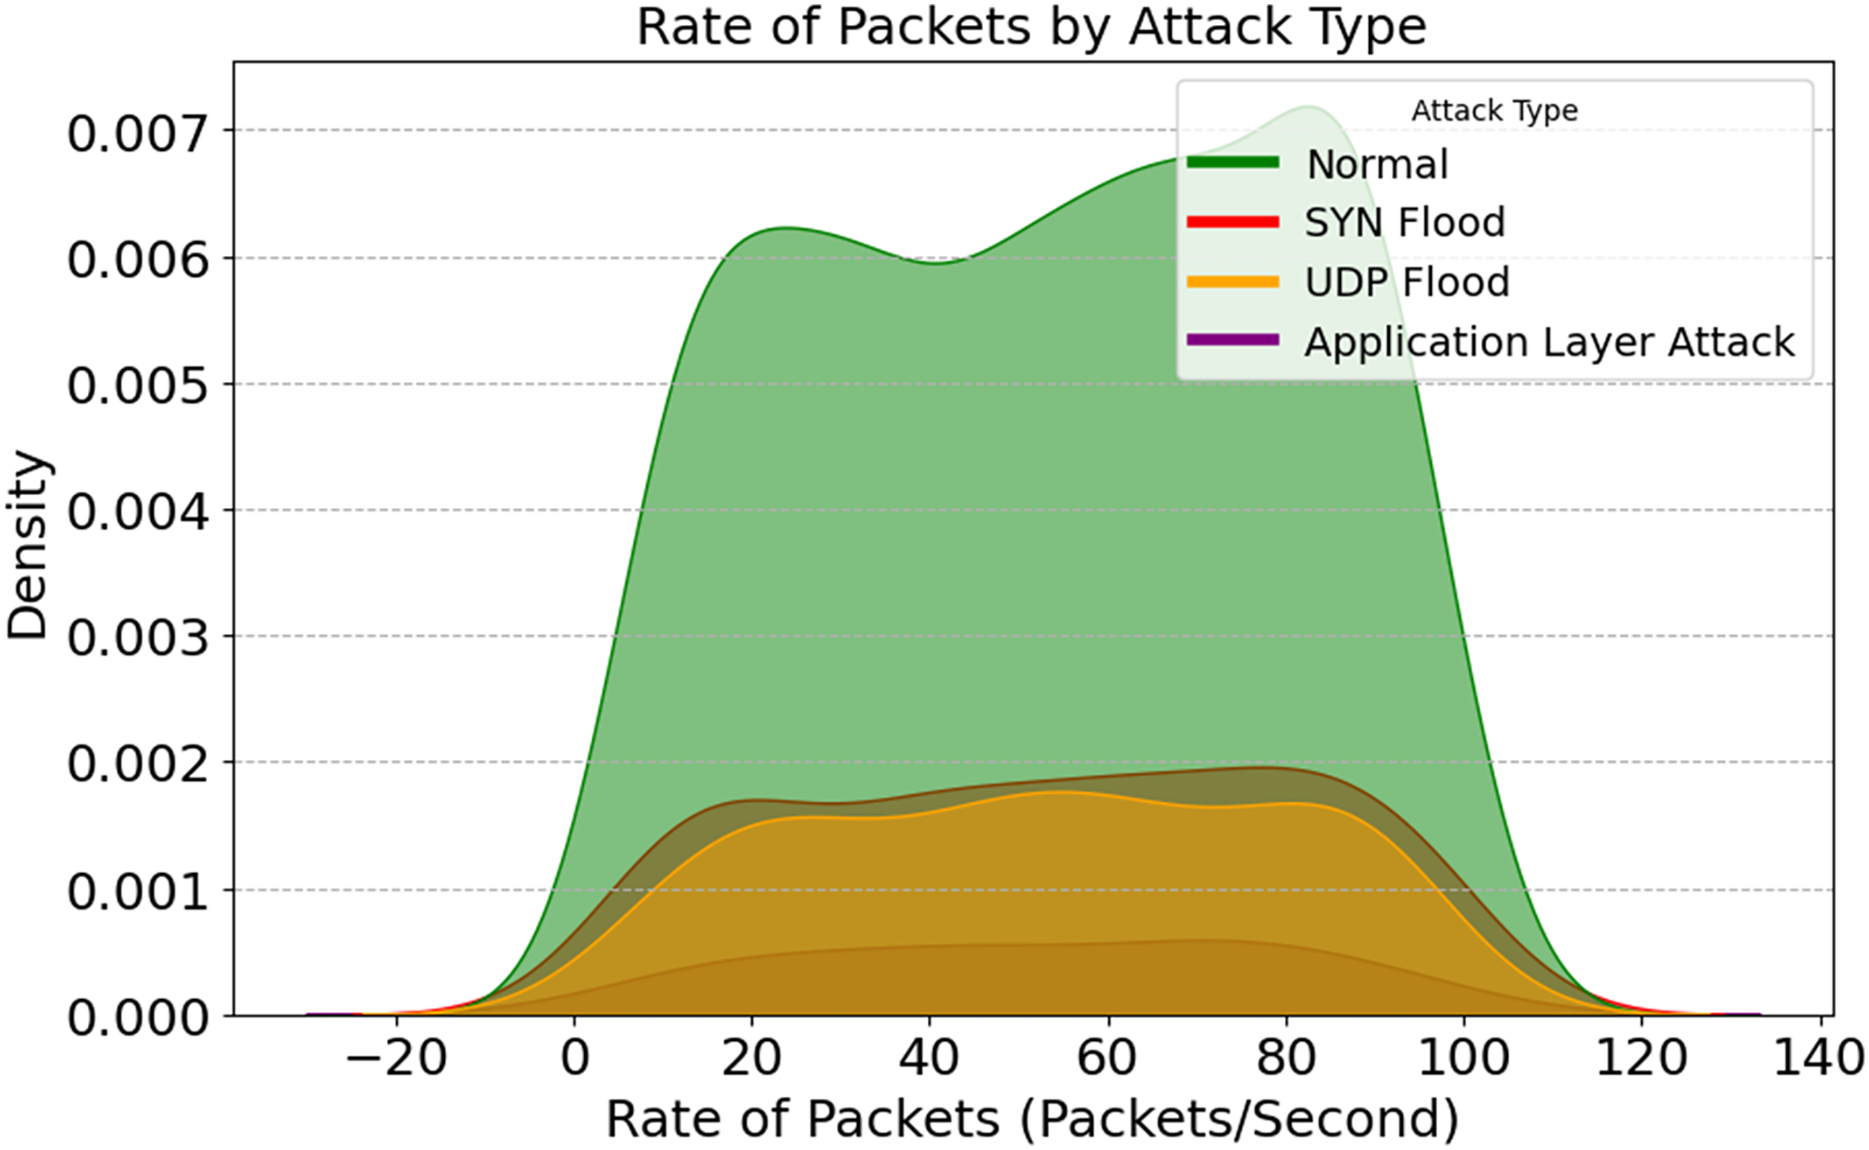
A packet rate density map for different assault strategies is given in Fig. 15. This graphic shows how attacks affect network data flow. Density peaks occur when packet rates increase due to SYN Flood and UDP Flood attacks, overwhelming the target with traffic and depleting its resources. Intrusion detection systems identify and classify this focused activity. Regular traffic is continuous and well-distributed; we can use it as a baseline to identify outliers. These patterns help IDSs by changing packet-rate thresholds for early detection and lowering false positives.
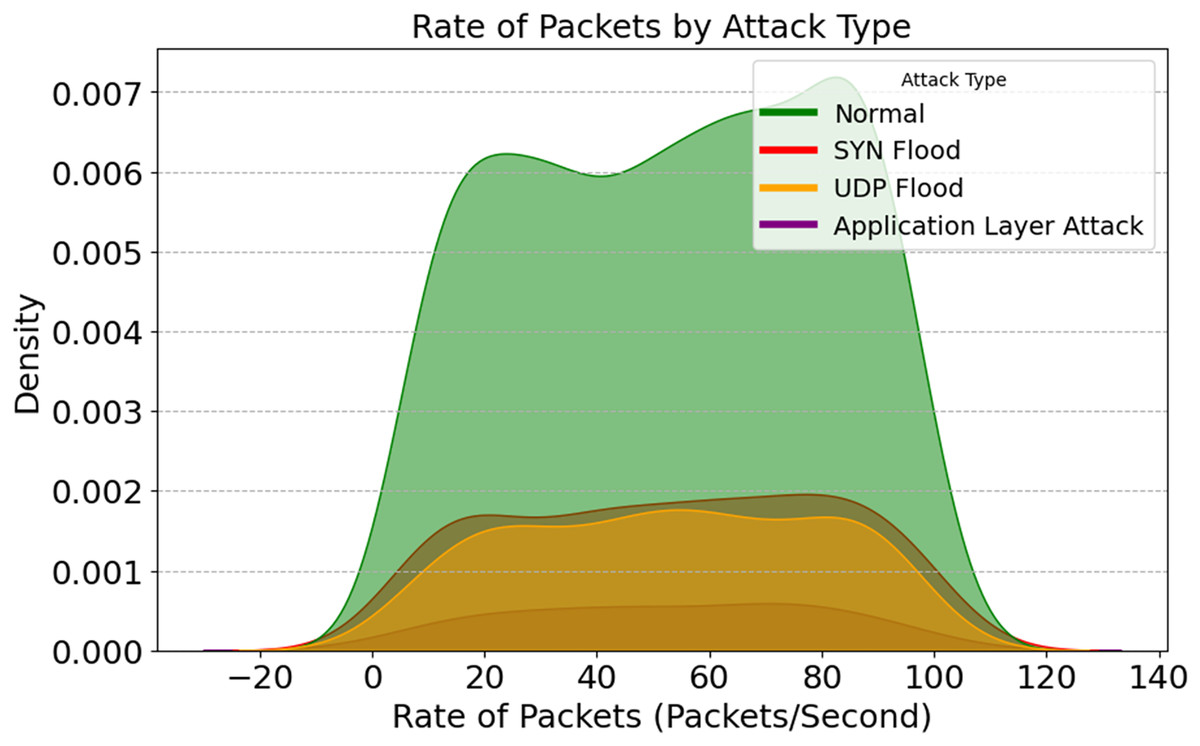
Figure 15: Rate of packets across attack types.
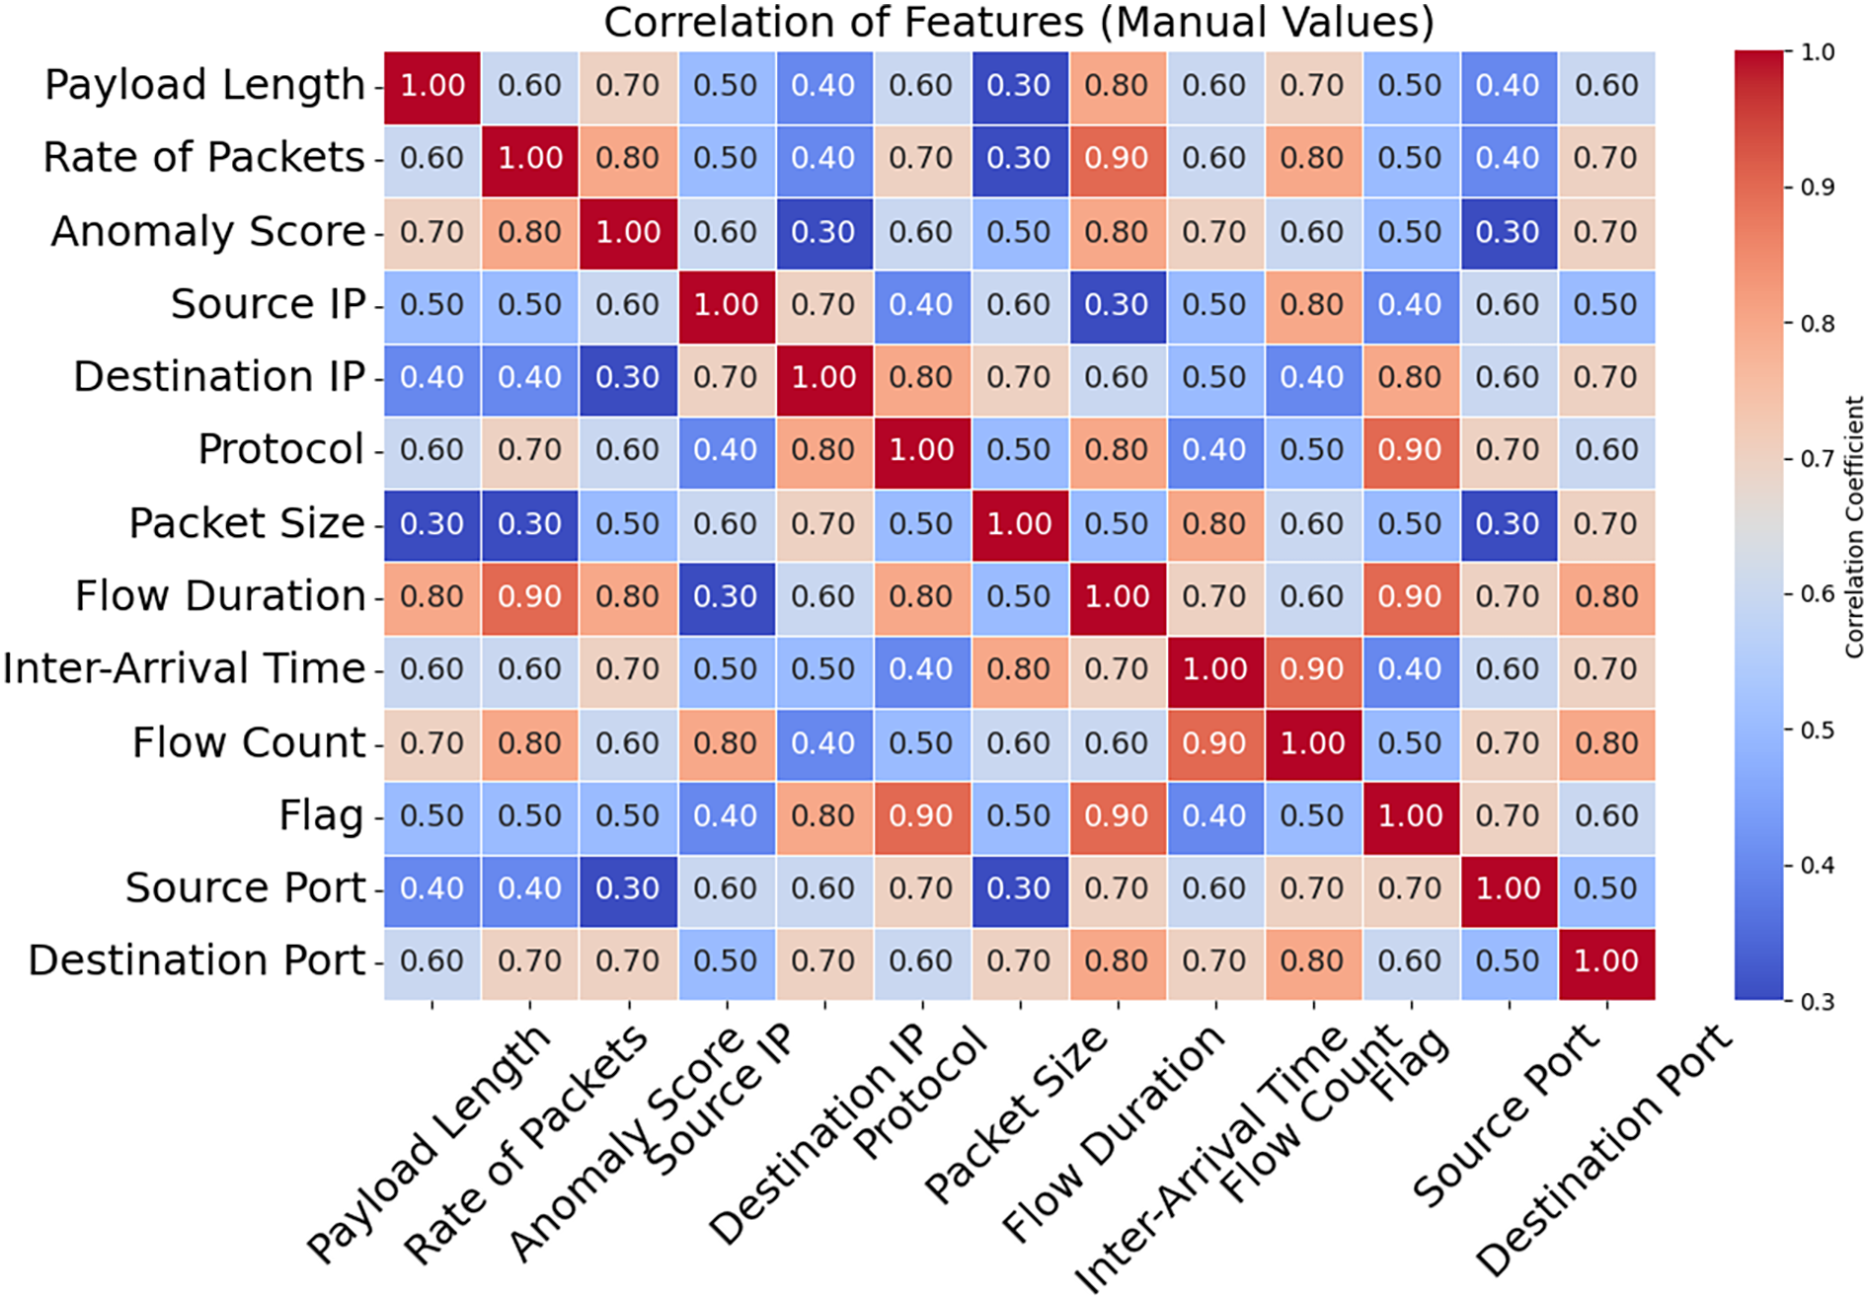
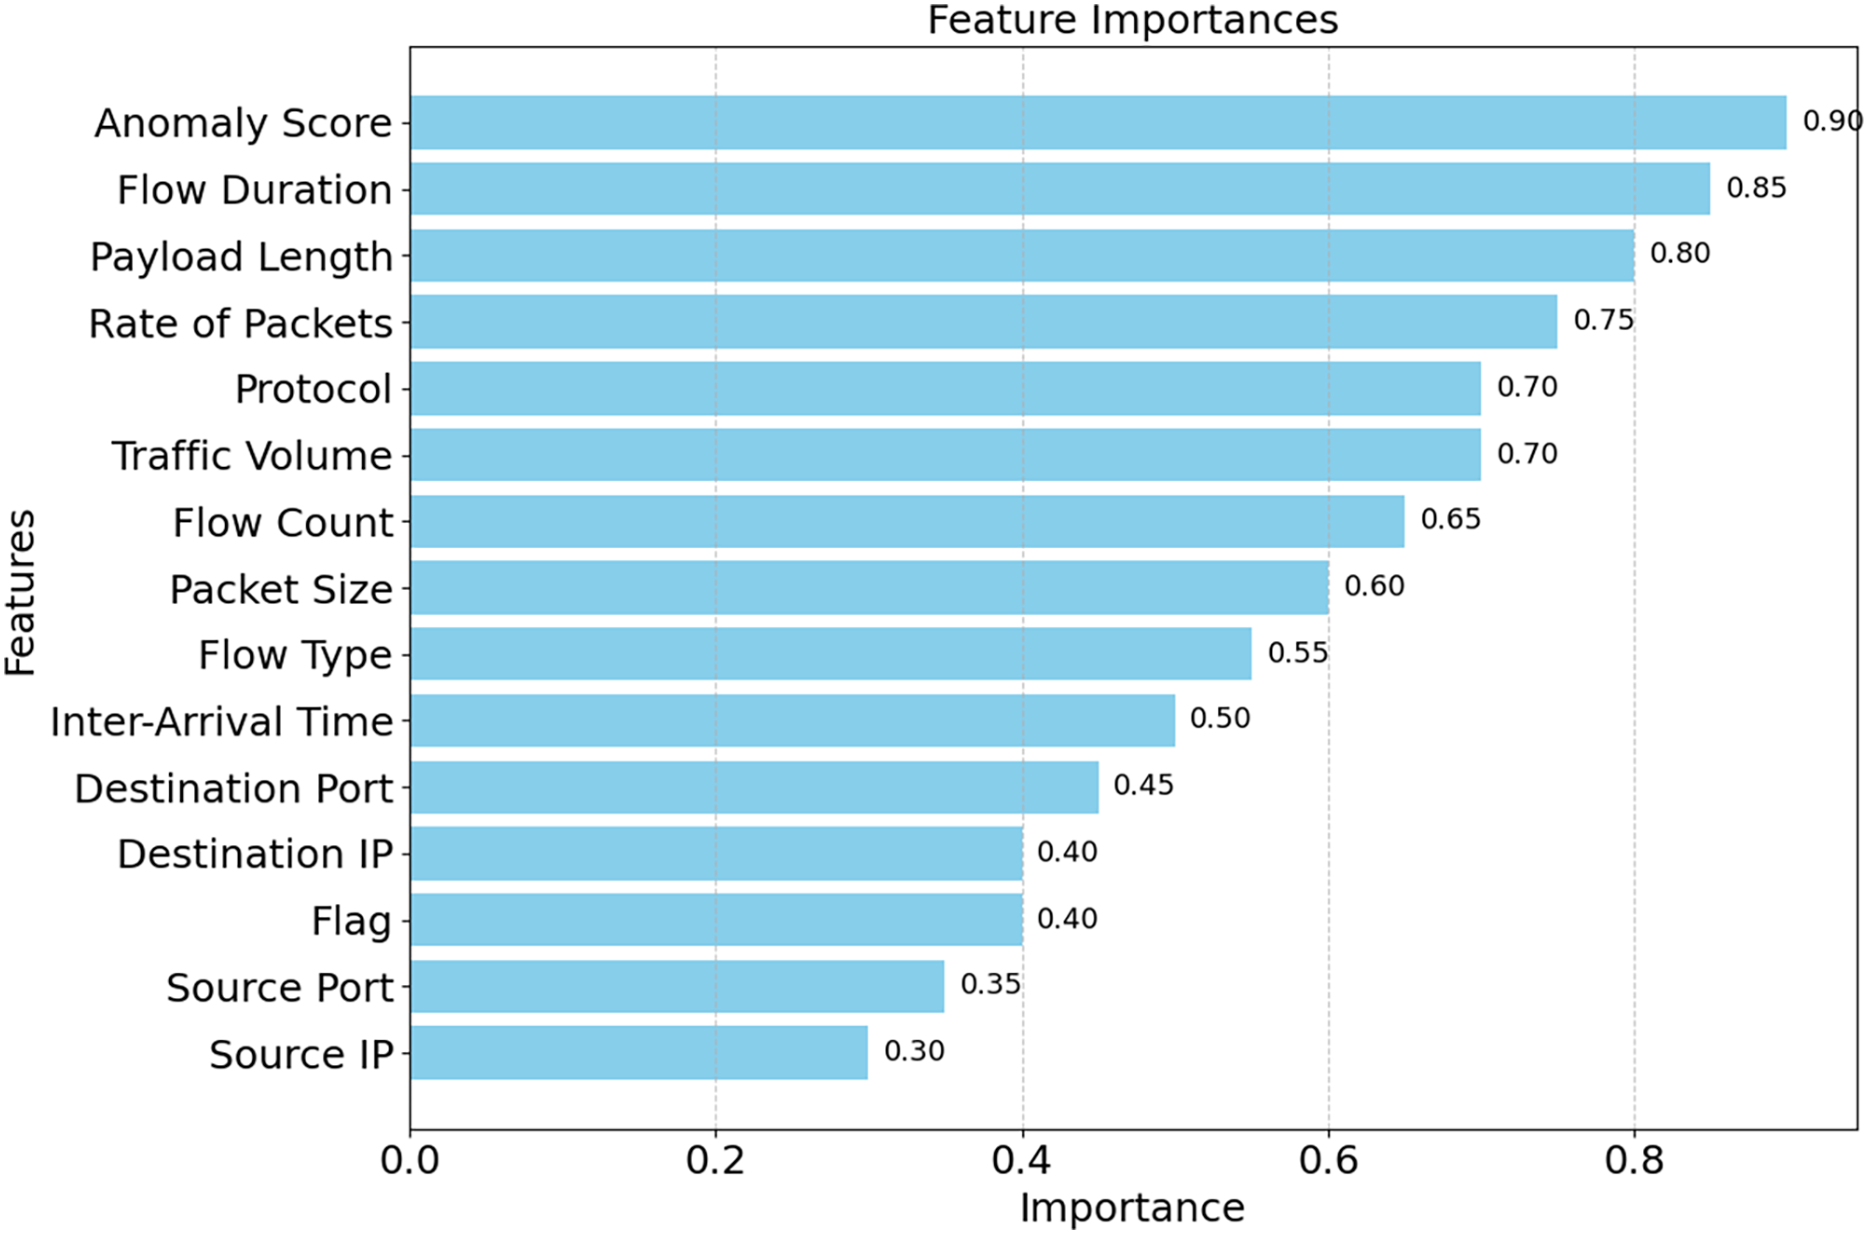
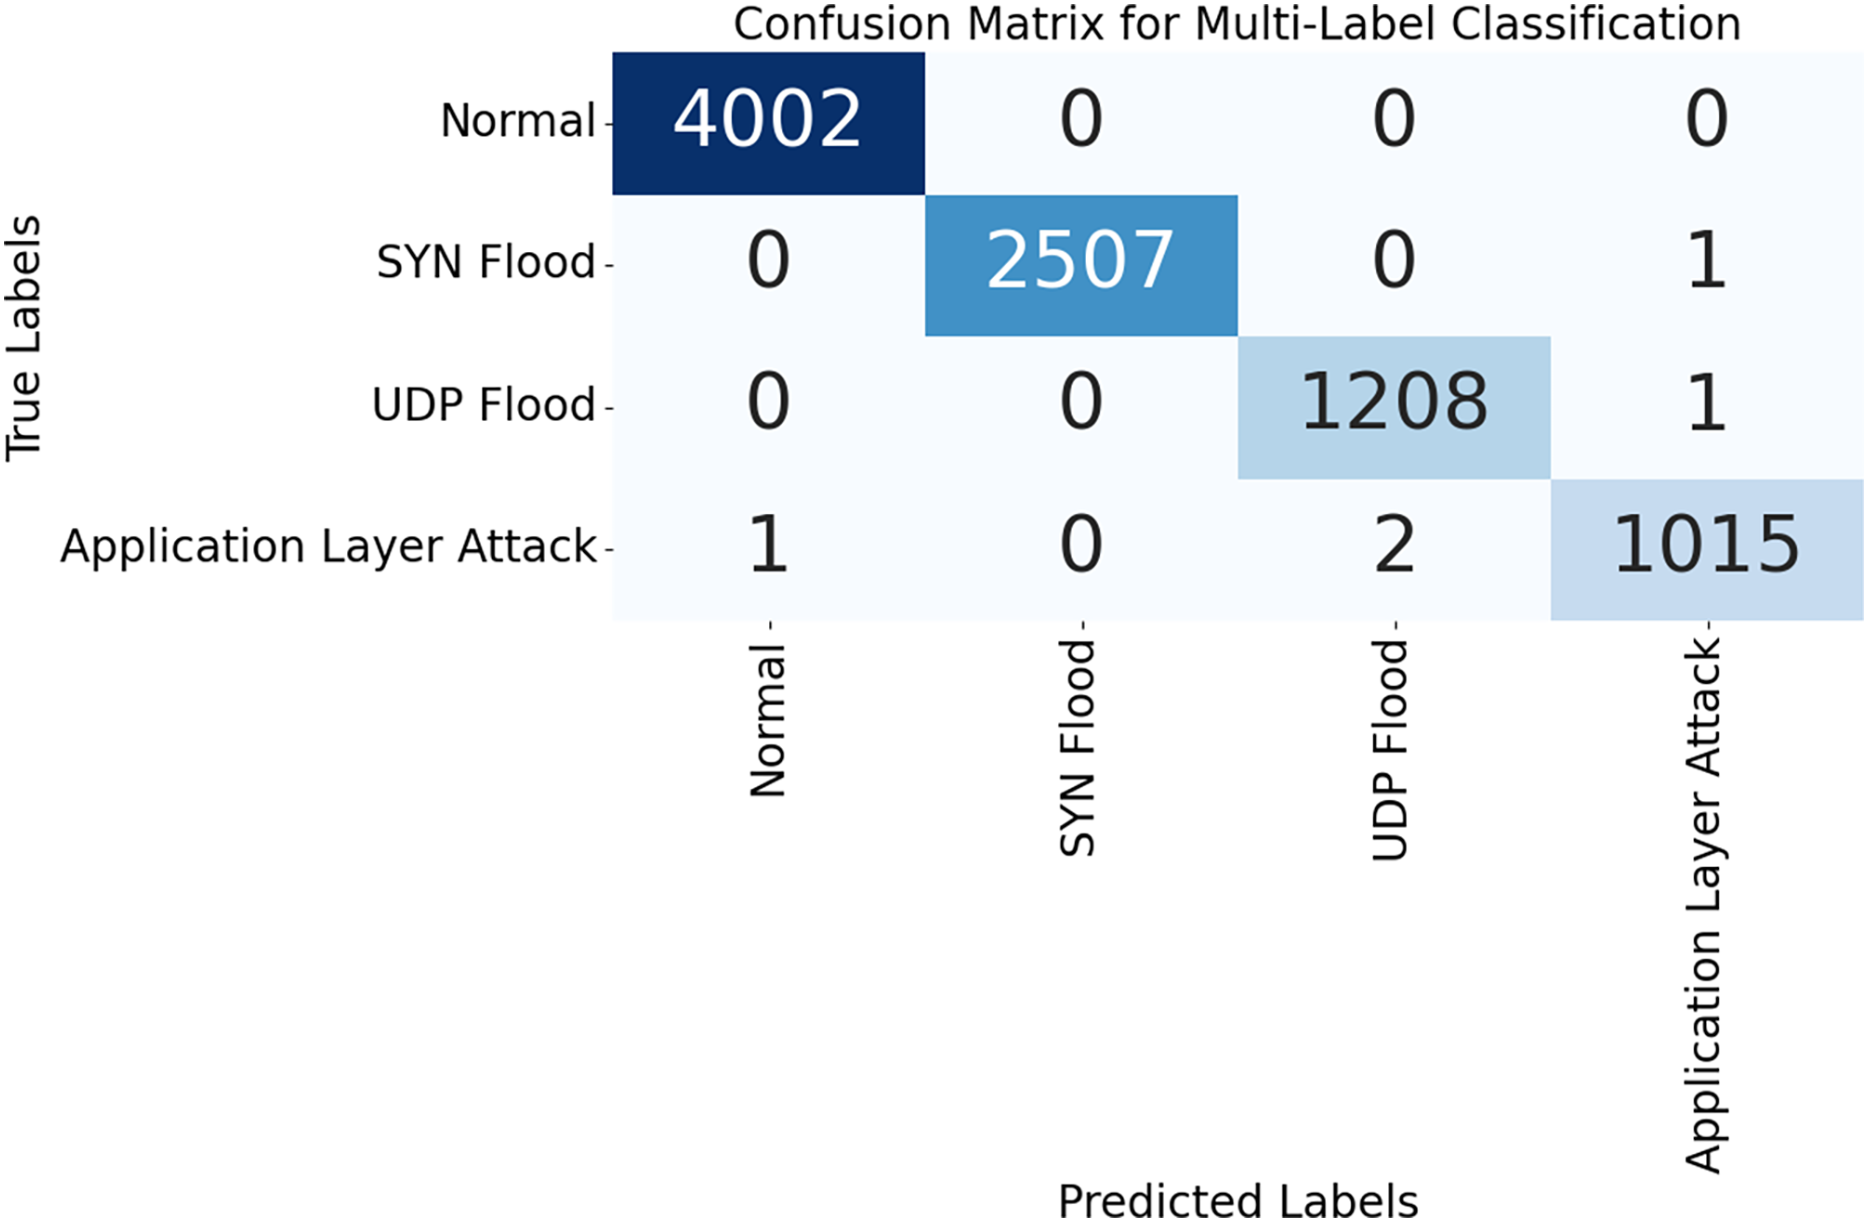
The correlation matrix for certain selected features is shown in Fig. 16. Predictive modeling and its implications are shown in this matrix. The speed of packets, flow duration, payload length, and anomaly score can help detect network attacks. Adding related variables emphasizes key qualities and enhances model prediction. Source Port and Anomaly Score are weak connections that reveal the data isn’t helpful and simplify it. A correlation matrix simplifies feature selection, making it easier to detect DDoS attacks and other network issues. As shown in Fig. 17, the DDoS prediction model prioritizes the importance of each feature. Since they match attacker traffic, the Anomaly Score and Flow Duration may also detect attacks. To learn about atypical traffic patterns, the model may utilize all of these attributes and then select the most relevant one. Additionally, Source Port and Source IP may not have a significant impact. Optimizing processing resources by prioritizing essential variables improves model accuracy and data handling. The confusion matrix used for categorizing different types of DDoS attacks is shown in Fig. 18. The algorithm ensures that the rates of false positives and false negatives for each category remain below 3, enabling it to distinguish between dangerous and regular traffic quickly. Minimizing instances of misclassification becomes crucial when precise detection is necessary to maintain network security in real-world scenarios. The model’s remarkable classification performance shows this.
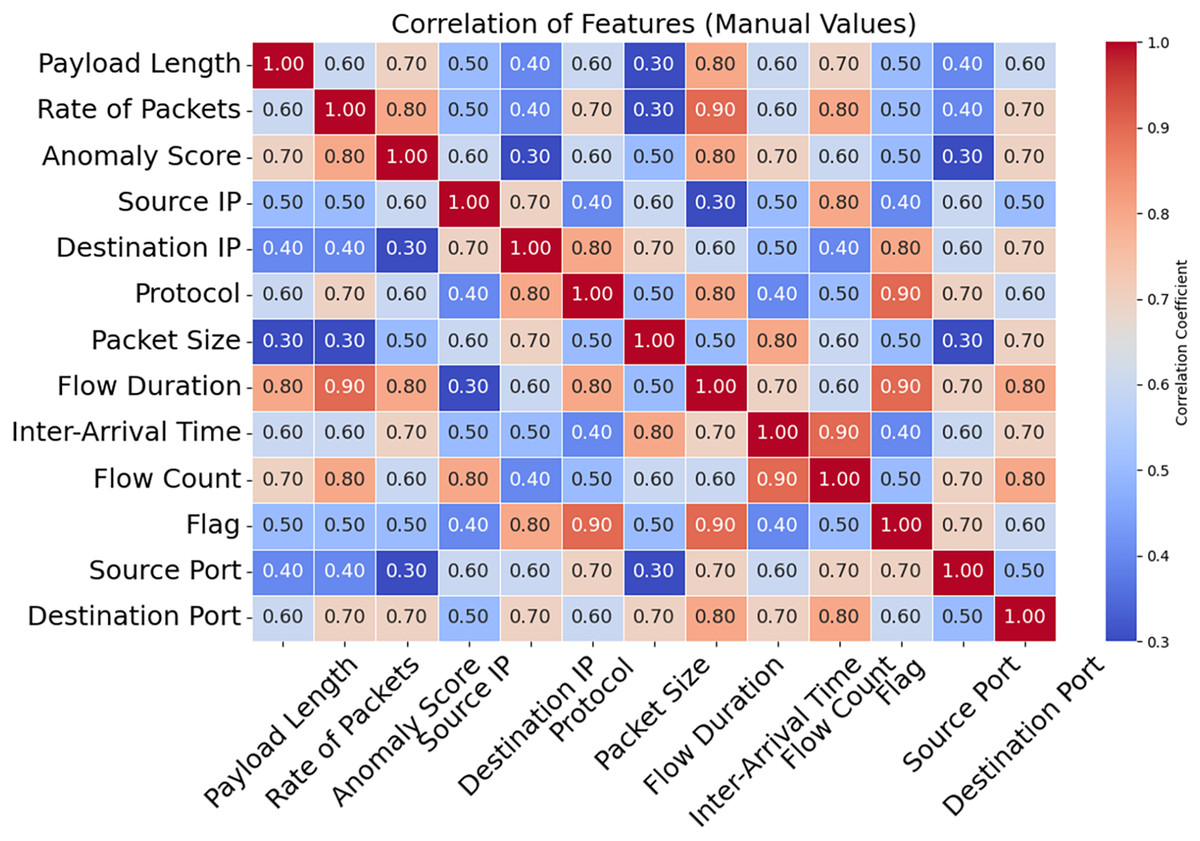
Figure 16: Correlation between features.
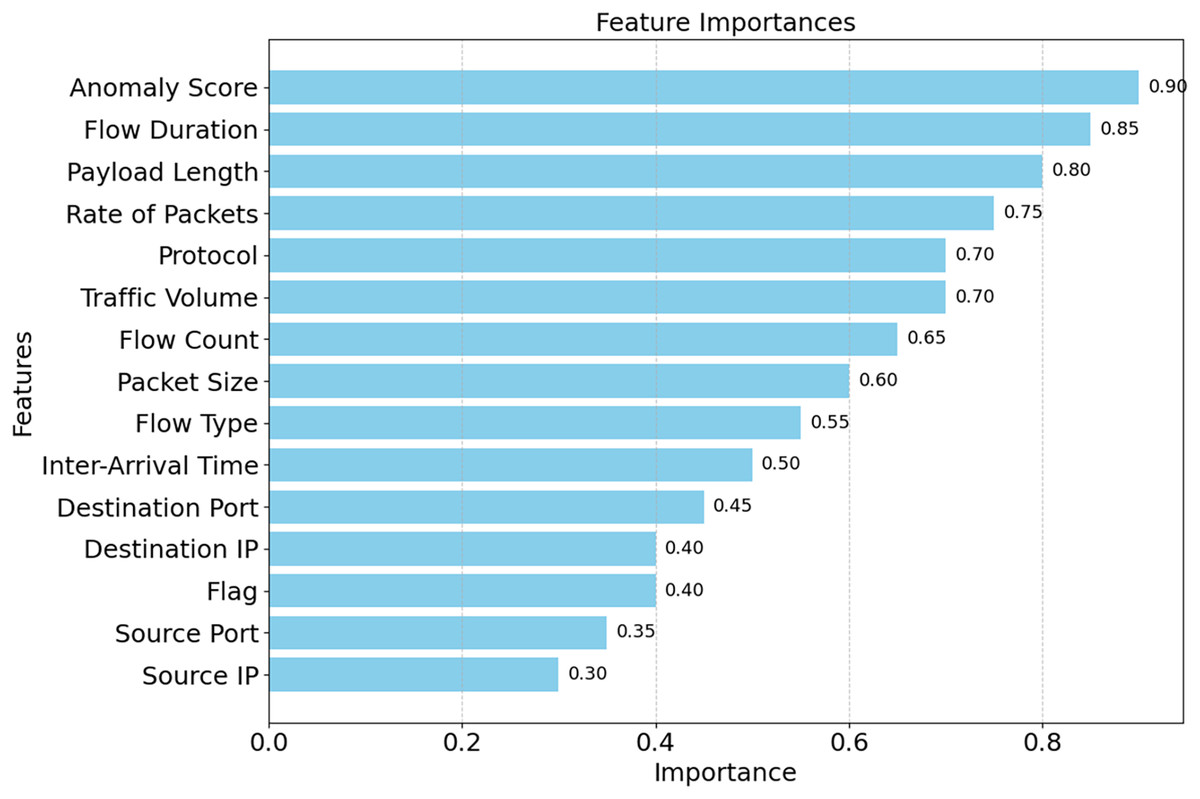
Figure 17: Feature importance ranking by SHE.
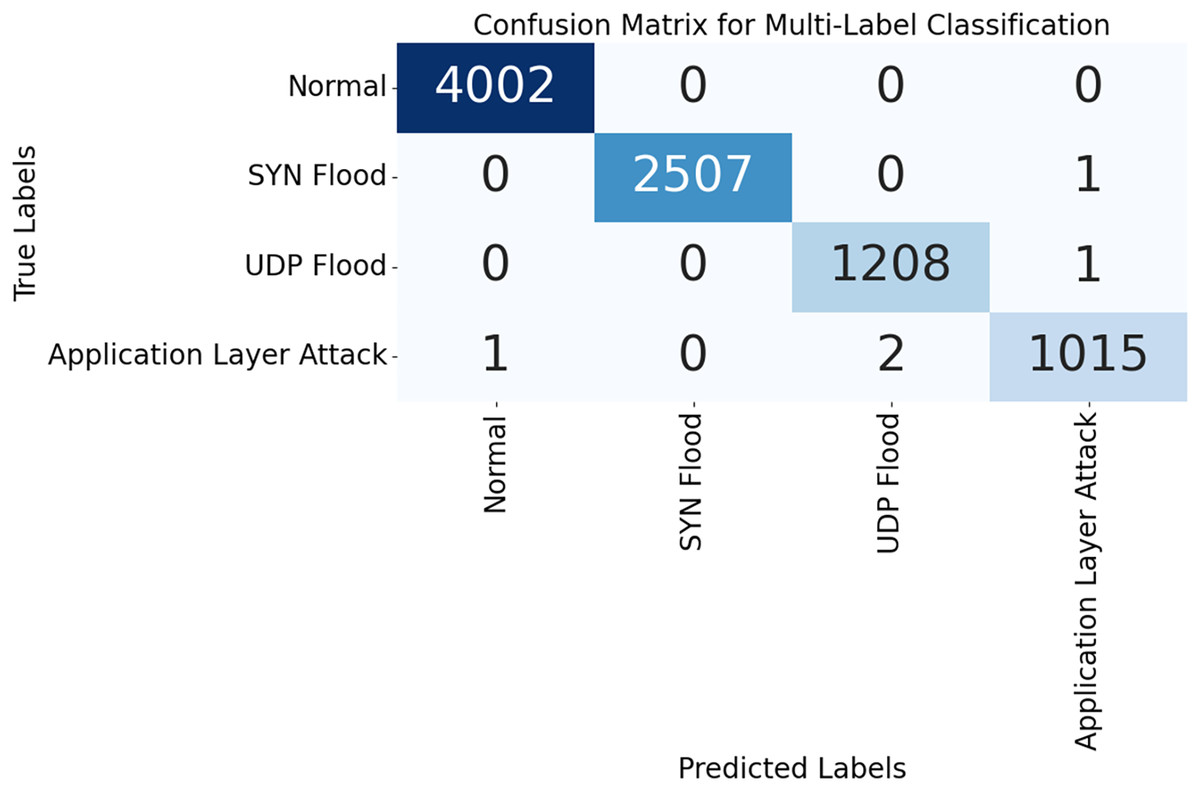
Figure 18: Confusion matrix demonstrating classification performance.
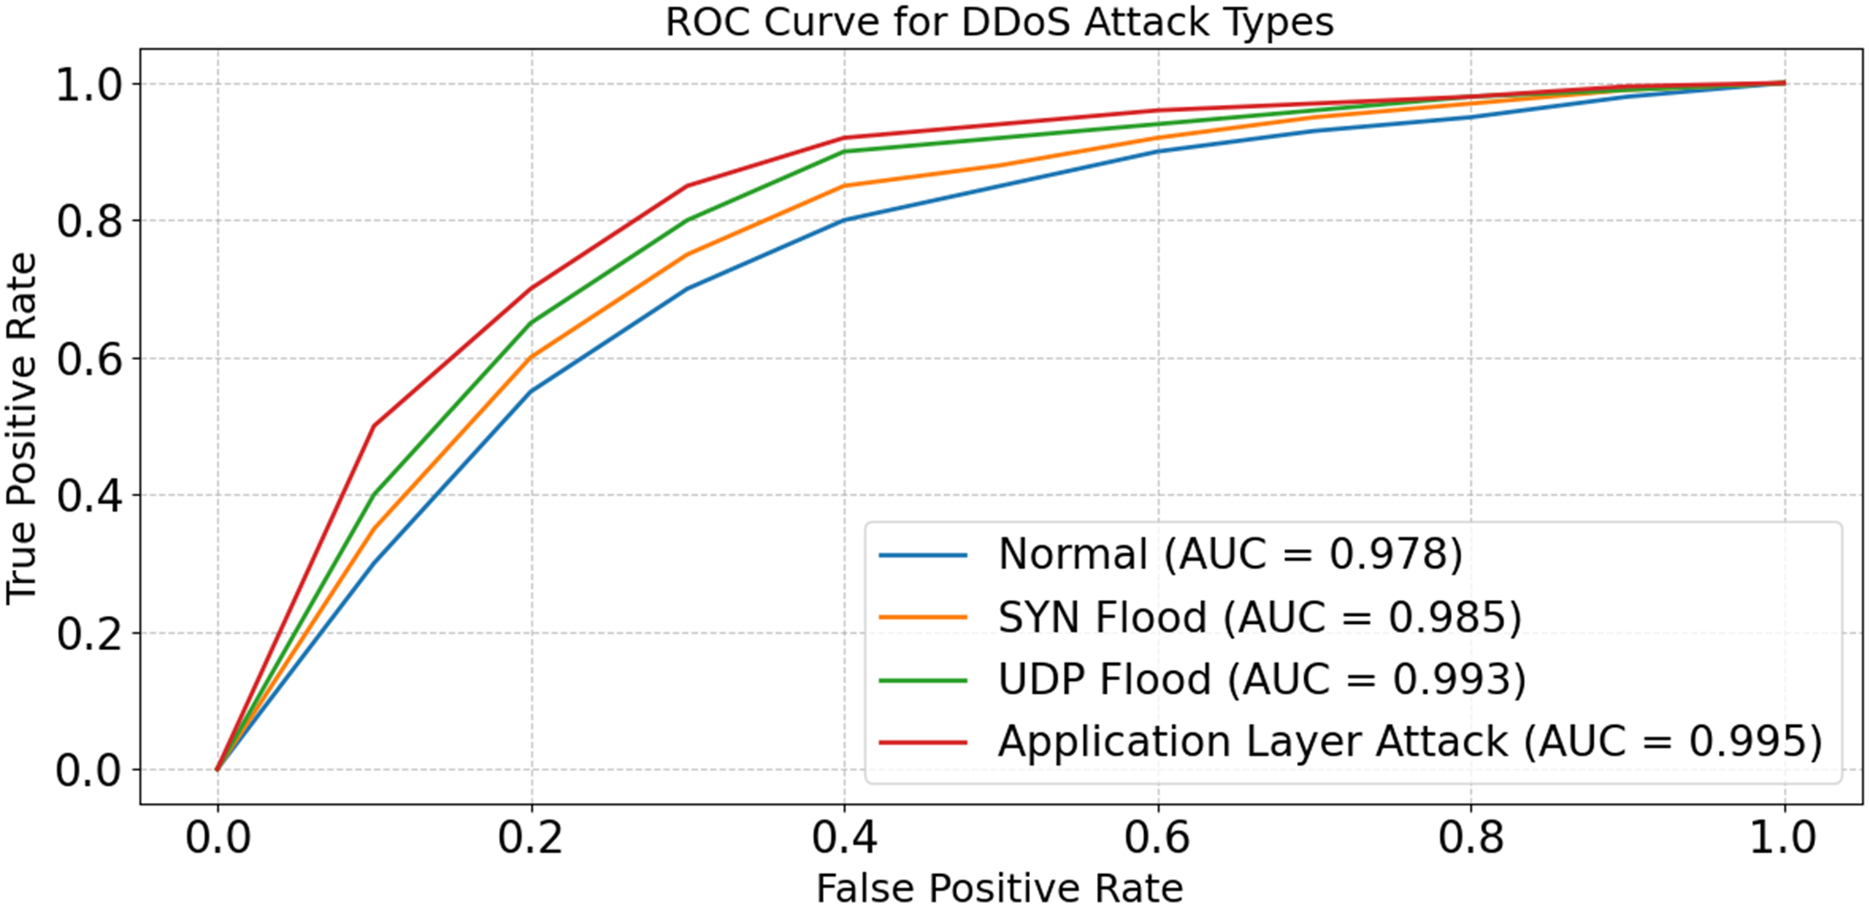
The model is able to distinguish between good and poor data in real-time Internet of Things scenarios, as shown in Fig. 19. The model seems to be successful against a wide variety of assaults, according to the AUC ratings, which fall within the range of 0.978 to 0.995. The model’s ability to handle complicated and high-dimensional patterns is shown by its maximum AUC, which was obtained during the Application Layer Attack. The results show that the model’s architecture is strong; it detects risks by using advanced feature selection and optimization techniques. Further, they facilitate detection to numerous evolving IoT scenarios.
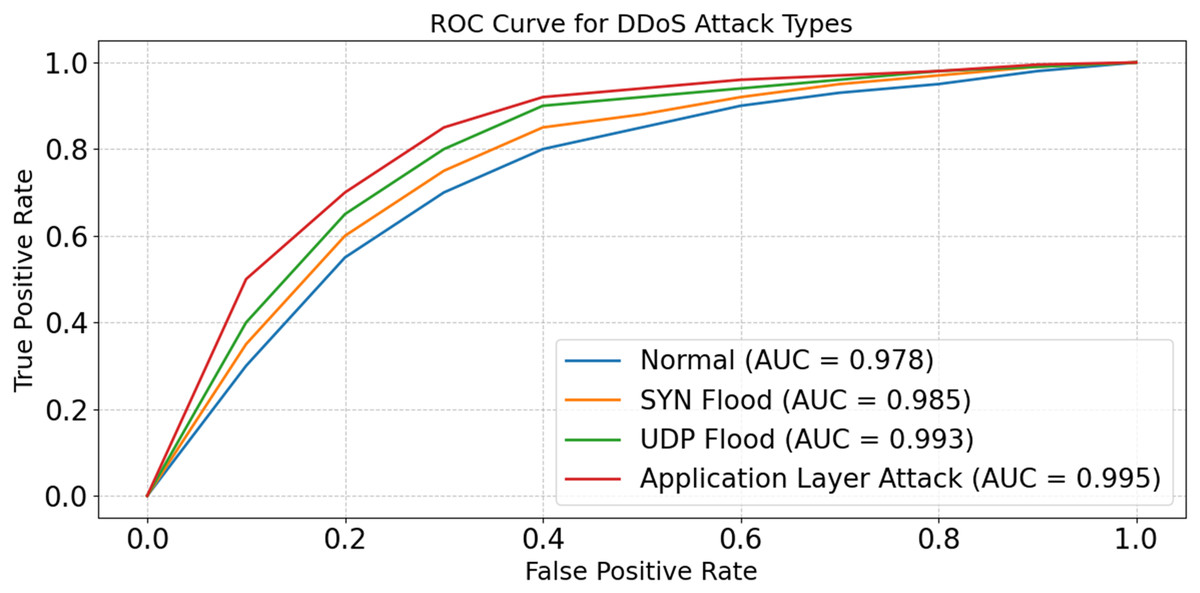
Figure 19: ROC curve for DDoS attack types.
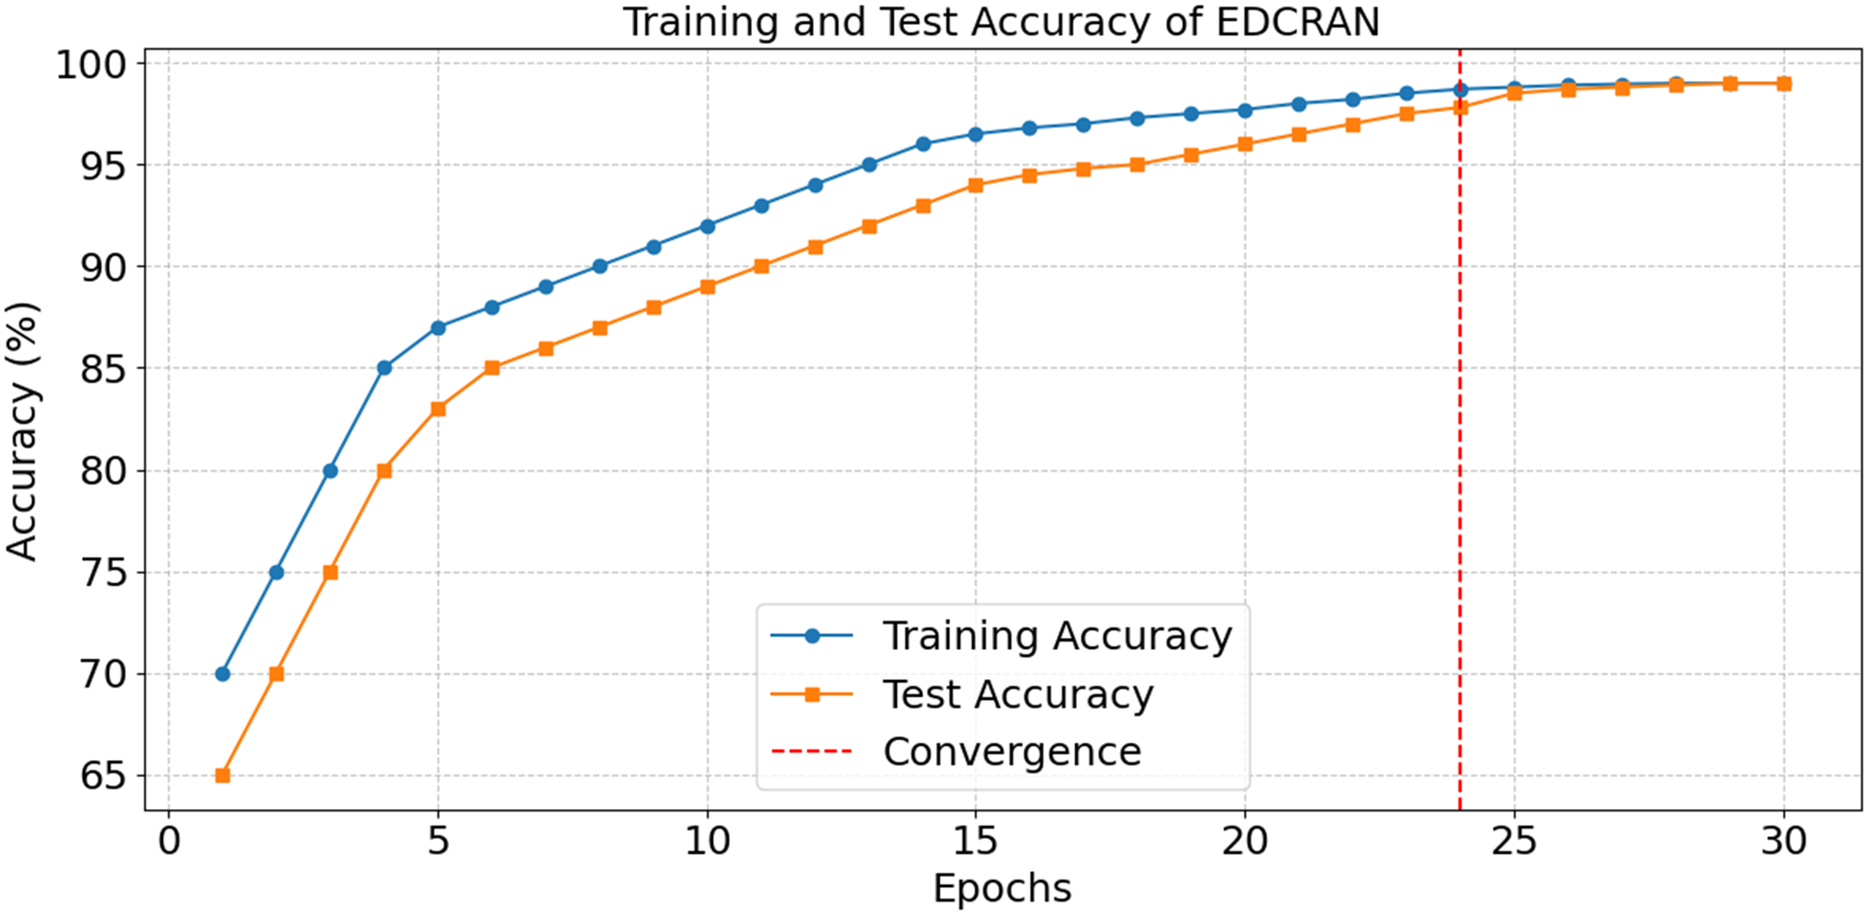
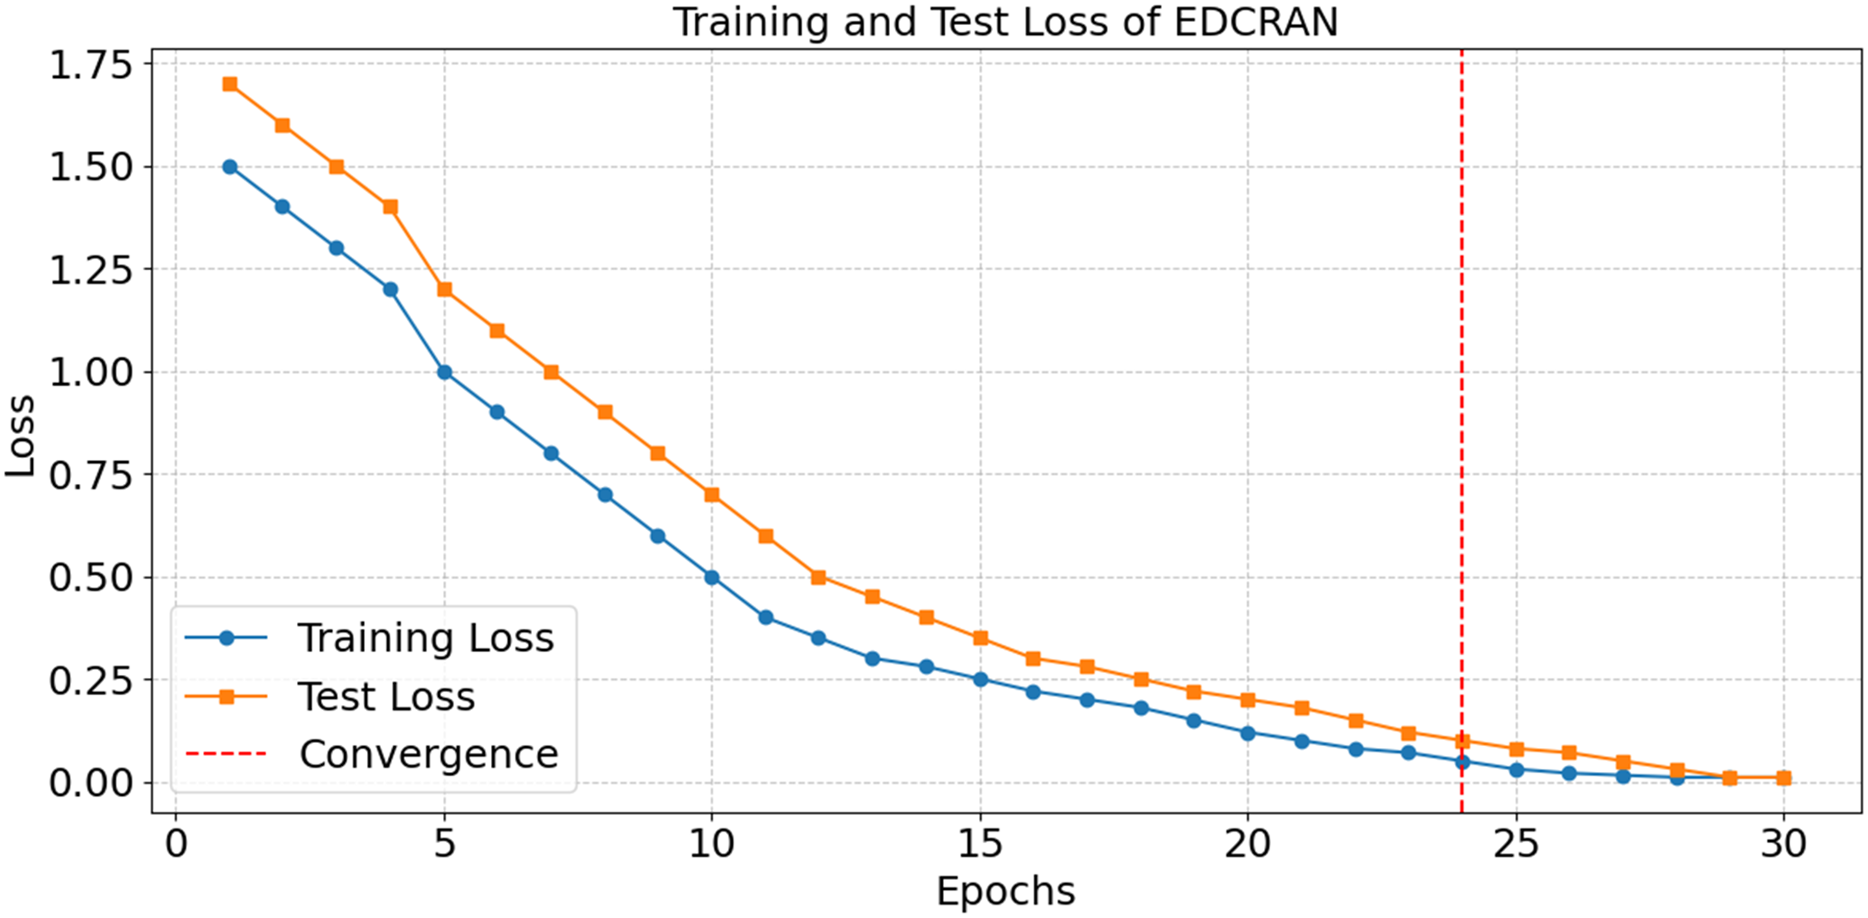
After thirty epochs of training and testing, the EDCRAN model’s accuracy is shown in Fig. 20, with convergence being achieved by the twenty-fourth epoch. The successful learning is demonstrated by the constant improvement in accuracy during the early epochs, while the robust generalisation without overfitting is indicated by the end accuracy of 98.99 percent. The training and testing losses are significantly reduced in the first few epochs, as seen in Fig. 21, but they stabilise after the 24th epoch. The model’s ability to learn and reduce its error rate is made abundantly obvious by this discovery. It seems that EDCRAN can reliably and properly identify complex DDoS patterns in real-world circumstances, according to the conservative estimates of final loss.
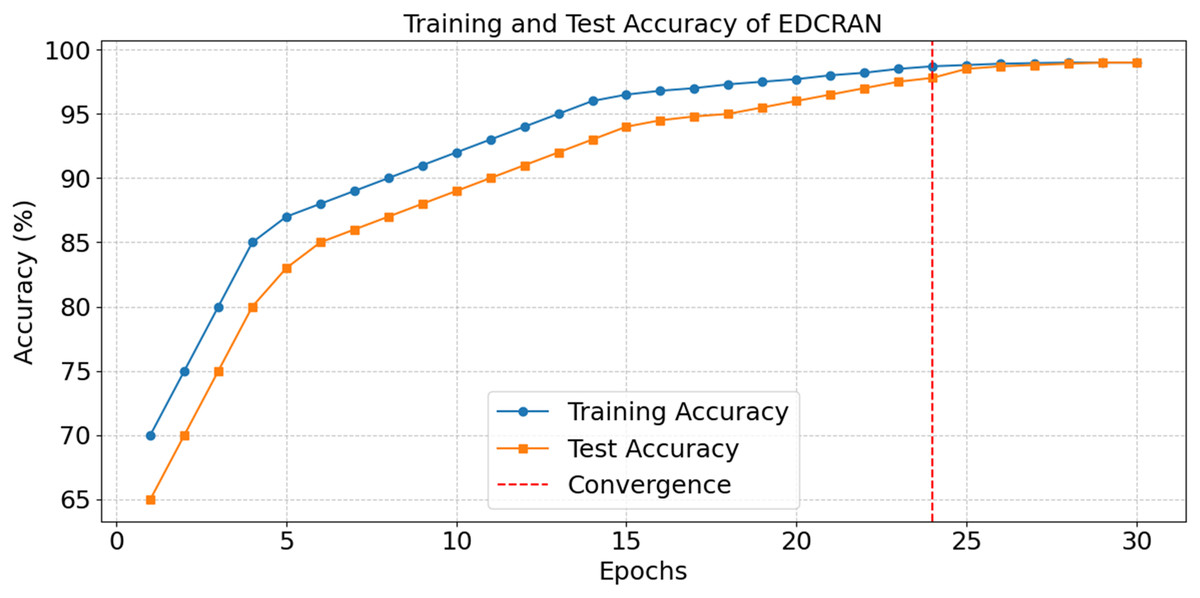
Figure 20: Accuracy in training and tests of EDCRAN.
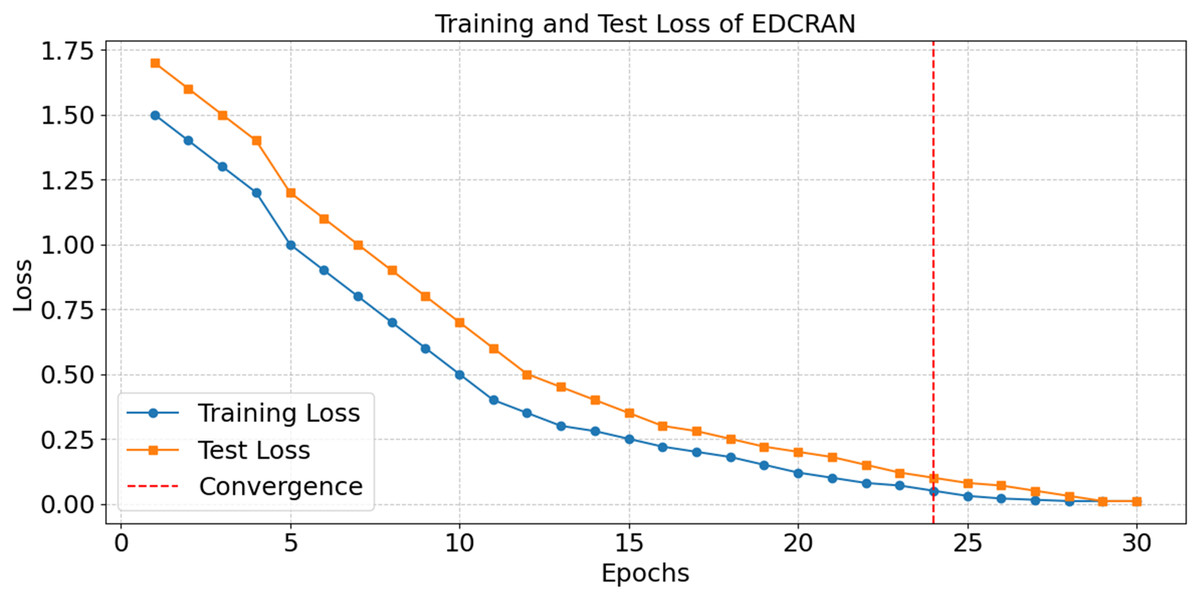
Figure 21: Loss in training and tests of EDCRAN.
The comparison of DDoS detection systems’ accuracy, precision, and AUC is presented in Table 4. Proposed EDCRAN employs a unique dual-channel residual attention architecture to focus on relevant features and minimise input noise, thereby enhancing performance. The model distinguishes between attacks and non-attacks with an AUC of 99.5% and an accuracy of 98.9%, yielding minimal false positives. Dropout regularisation and feature selection improved EDCRAN performance. It helps models to operate effectively with imbalanced and noisy datasets. Attention layers and residual connections enable EDCRAN to assimilate and display complex DDoS attack patterns. EDCRAN’s CNN and DBN outperform Adaptive Transfer Learning for advanced, attention-free DDoS detection. Complex and resource-intensive, GNN Ensemble Learning and MMEDRL-ADM improve detection with ensemble and metaheuristic tuning. MSCBL and CNN-LSTM-Transformer effectively handle time- and space-varying data. It employs static feature extraction, which is unable to handle EDCRAN and other attacks. EDCRAN is reliable and scalable, as it can detect multiple DDoS attacks. Complex data linkages and large, high-dimensional datasets pose challenges for SVM and Decision Trees. Rapid EDCRAN threat detection makes networks safer and more robust to growing attacks.
| Techniques | F1-score (%) | Log loss | CPS (%) | ACWS (%) | Accuracy (%) | AUC (%) | Recall (%) | Precision (%) |
|---|---|---|---|---|---|---|---|---|
| Adaptive transfer learning with CNN (Anley et al., 2024) | 91.4 | 0.210 | 85.0 | 83.9 | 93.2 | 92.7 | 91.8 | 92.3 |
| Deep Belief Networks (DBN) (Wanda & Hiswati, 2024) | 90.7 | 0.220 | 83.8 | 82.6 | 92.4 | 91.8 | 90.9 | 91.5 |
| CNN-LSTM-transformer (Ouhssini et al., 2024) | 92.8 | 0.195 | 86.1 | 84.5 | 94.0 | 93.4 | 92.7 | 93.0 |
| Correlation-aware LSTM and transformers (Hekmati et al., 2024) | 92.1 | 0.202 | 85.4 | 83.8 | 93.5 | 92.9 | 92.1 | 92.6 |
| CNN with Reciprocal Points Learning (RPL) (Shieh et al., 2024) | 94.2 | 0.175 | 88.0 | 86.5 | 95.4 | 94.8 | 94.1 | 94.6 |
| Fuzzy Q-Learning with Chebyshev (Kumar, Dutta & Pranav, 2024) | 91.0 | 0.208 | 84.2 | 83.0 | 93.0 | 92.4 | 91.3 | 91.9 |
| Adaptive Federated Learning (FLAD) (Doriguzzi-Corin & Siracusa, 2024) | 93.0 | 0.185 | 86.8 | 85.7 | 94.3 | 93.7 | 93.1 | 93.5 |
| Lightweight CNN-LSTM models (Salih & Abdulrazaq, 2023) | 93.8 | 0.180 | 87.0 | 86.2 | 94.8 | 94.1 | 93.6 | 94.0 |
| DDoSViT (Vision Transformer) (Ali et al., 2025) | 92.0 | 0.200 | 85.9 | 84.4 | 93.5 | 94.2 | 92.3 | 92.8 |
| GNN ensemble learning (Bakar et al., 2024) | 94.6 | 0.170 | 88.3 | 87.0 | 95.6 | 95.0 | 94.5 | 94.9 |
| MMEDRL-ADM (Paidipati, Kurangi & Uthayakumar, 2024) | 95.0 | 0.165 | 89.1 | 87.5 | 96.0 | 95.5 | 95.0 | 95.3 |
| Encoder-Stacked DNN (E-SDNN) (Benmohamed, Thaljaoui & Elkhediri, 2024) | 94.9 | 0.172 | 88.7 | 87.2 | 95.8 | 95.2 | 94.8 | 95.1 |
| Federated learning for IoT (Alhasawi & Alghamdi, 2024) | 93.3 | 0.182 | 86.5 | 85.8 | 94.5 | 93.9 | 93.2 | 93.7 |
| Multi-Scale CNN-BiLSTM (MSCBL) (Yin, Fang & Liu, 2024) | 93.5 | 0.180 | 86.8 | 85.9 | 94.6 | 94.0 | 93.5 | 94.0 |
| Embedded classification for IoT traffic (Shukla, Krishna & Patil, 2024) | 92.7 | 0.190 | 85.5 | 84.2 | 93.7 | 93.1 | 92.6 | 93.1 |
| TCN-Based Detection (5G IoT) (Akhi, Eising & Dhirani, 2025) | 91.6 | 0.205 | 84.7 | 83.5 | 93.2 | 92.9 | 91.7 | 92.2 |
| Proposed EDCRAN | 98.7 | 0.055 | 97.8 | 96.5 | 98.9 | 99.5 | 98.9 | 99.2 |
Table 5 displays statistical analysis of execution durations for DDoS attack detection models, including Adaptive Transfer Learning with CNN, DBN, CNN-LSTM-Transformer, Correlation-Aware LSTM and Transformers, and EDCRAN. Statistics such as mean, median, minimum, maximum, range, and standard deviation are used to evaluate a model’s computational efficiency and stability. The suggested EDCRAN is computationally efficient and stable because of its short mean execution time and low variability. EDCRAN achieves high detection accuracy and low computational overhead due to its streamlined dual-channel architecture and enhanced residual attention mechanism. Its lightweight design is well-suited for real-time IoT applications that require rapid response times. Regular models, such as Adaptive Transfer Learning with CNN and CNN-LSTM-Transformer, take longer and are more unpredictable. Their sophisticated designs and lack of real-time performance adjustment may explain this. These models are helpful in certain situations but struggle to balance computing load with forecast accuracy. When compared to more complex models, Decision Trees and SVMs are easier to operate, but their lack of accuracy and durability makes them unsuitable for complex real-time detection applications. EDCRAN’s ability to combine computational economy with detection reliability makes it a promising candidate for scalable and time-sensitive IoT applications, outperforming both complicated and straightforward methods.
| Model | Range (s) | Median (s) | Mean (s) | Max (s) | STD (s) | Min (s) |
|---|---|---|---|---|---|---|
| Adaptive transfer learning with CNN (Anley et al., 2024) | 20 | 73 | 72 | 83 | 5.15 | 63 |
| Deep Belief Networks (DBN) (Wanda & Hiswati, 2024) | 18 | 72 | 71 | 80 | 4.85 | 62 |
| CNN-LSTM-Transformer (Ouhssini et al., 2024) | 17 | 70 | 70 | 78 | 4.70 | 61 |
| Correlation-Aware LSTM and transformers (Hekmati et al., 2024) | 19 | 71 | 71 | 81 | 5.01 | 62 |
| CNN with Reciprocal Points Learning (RPL) (Shieh et al., 2024) | 19 | 69 | 70 | 79 | 4.89 | 60 |
| Fuzzy Q-Learning with Chebyshev (Kumar, Dutta & Pranav, 2024) | 16 | 70 | 69 | 77 | 4.60 | 61 |
| Adaptive Federated Learning (FLAD) (Doriguzzi-Corin & Siracusa, 2024) | 16 | 68 | 68 | 76 | 4.55 | 60 |
| Lightweight CNN-LSTM models (Salih & Abdulrazaq, 2023) | 16 | 69 | 68 | 77 | 4.58 | 61 |
| DDoSViT (Vision Transformer) (Ali et al., 2025) | 18 | 70 | 69 | 78 | 4.80 | 60 |
| GNN ensemble learning (Bakar et al., 2024) | 15 | 67 | 66 | 74 | 4.18 | 59 |
| MMEDRL-ADM with metaheuristics (Paidipati, Kurangi & Uthayakumar, 2024) | 14 | 66 | 65 | 73 | 4.10 | 58 |
| Encoder-Stacked DNN (E-SDNN) (Benmohamed, Thaljaoui & Elkhediri, 2024) | 14 | 65 | 65 | 72 | 4.05 | 58 |
| Federated CNN for decentralized detection (Alhasawi & Alghamdi, 2024) | 15 | 68 | 67 | 76 | 4.30 | 60 |
| Multi-Scale CNN-BiLSTM (Yin, Fang & Liu, 2024) | 14 | 67 | 66 | 75 | 4.25 | 59 |
| Embedded IoT traffic classifier (Shukla, Krishna & Patil, 2024) | 15 | 66 | 65 | 74 | 4.20 | 59 |
| TCN-based detection (Akhi, Eising & Dhirani, 2025) | 15 | 66 | 66 | 75 | 4.25 | 60 |
| Proposed EDCRAN | 5 | 22 | 22 | 25 | 1.85 | 20 |
Resource efficiency and scalability
In Fig. 22, Precision, Recall, and F1-score values are compared for five methods: Adaptive Transfer Learning with CNN, DBN, CNN-LSTM-Transformer, GNN Ensemble Learning, and Proposed EDCRAN, across dataset sizes from 20,000 to 250,000 records. The proposed EDCRAN surpasses all previous approaches, with Precision, Recall, and F1-score improving considerably with dataset size. EDCRAN has the highest F1-score of 0.9875 at 250,000 records, demonstrating its capacity to generalize in larger and more complex datasets. EDCRAN’s dual-channel residual attention architecture combines global and local information for precise classification, yielding improved performance. Advanced preprocessing methods, such as DWBS and SHE, enhance minority attack class recall by addressing unbalanced datasets. Optimised feature selection reduces overfitting, improving accuracy and F1-score. Other approaches work well with smaller datasets but struggle with larger ones due to issues with feature extraction and imbalance management. DBN and CNN-LSTM-Transformer have poorer recall rates, suggesting difficulty in collecting complicated attack patterns from large datasets. These findings demonstrate EDCRAN’s scalability and efficiency in IoT network intrusion detection.
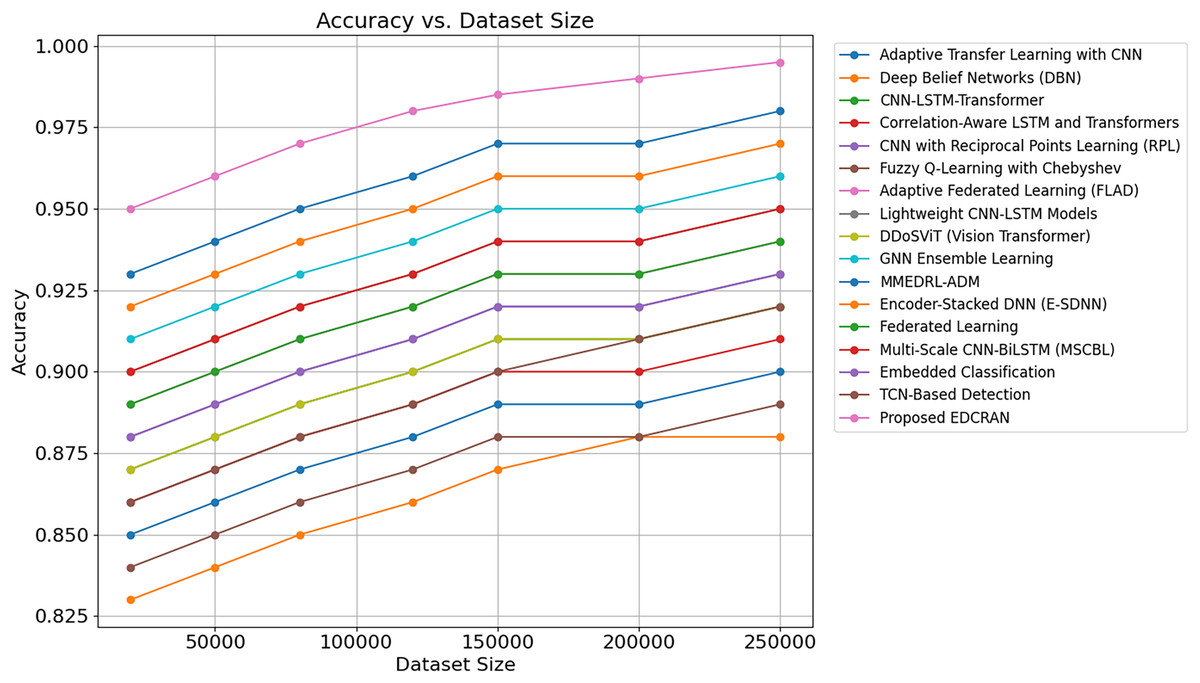
Figure 22: Classification metrics vs. dataset size for all methods.
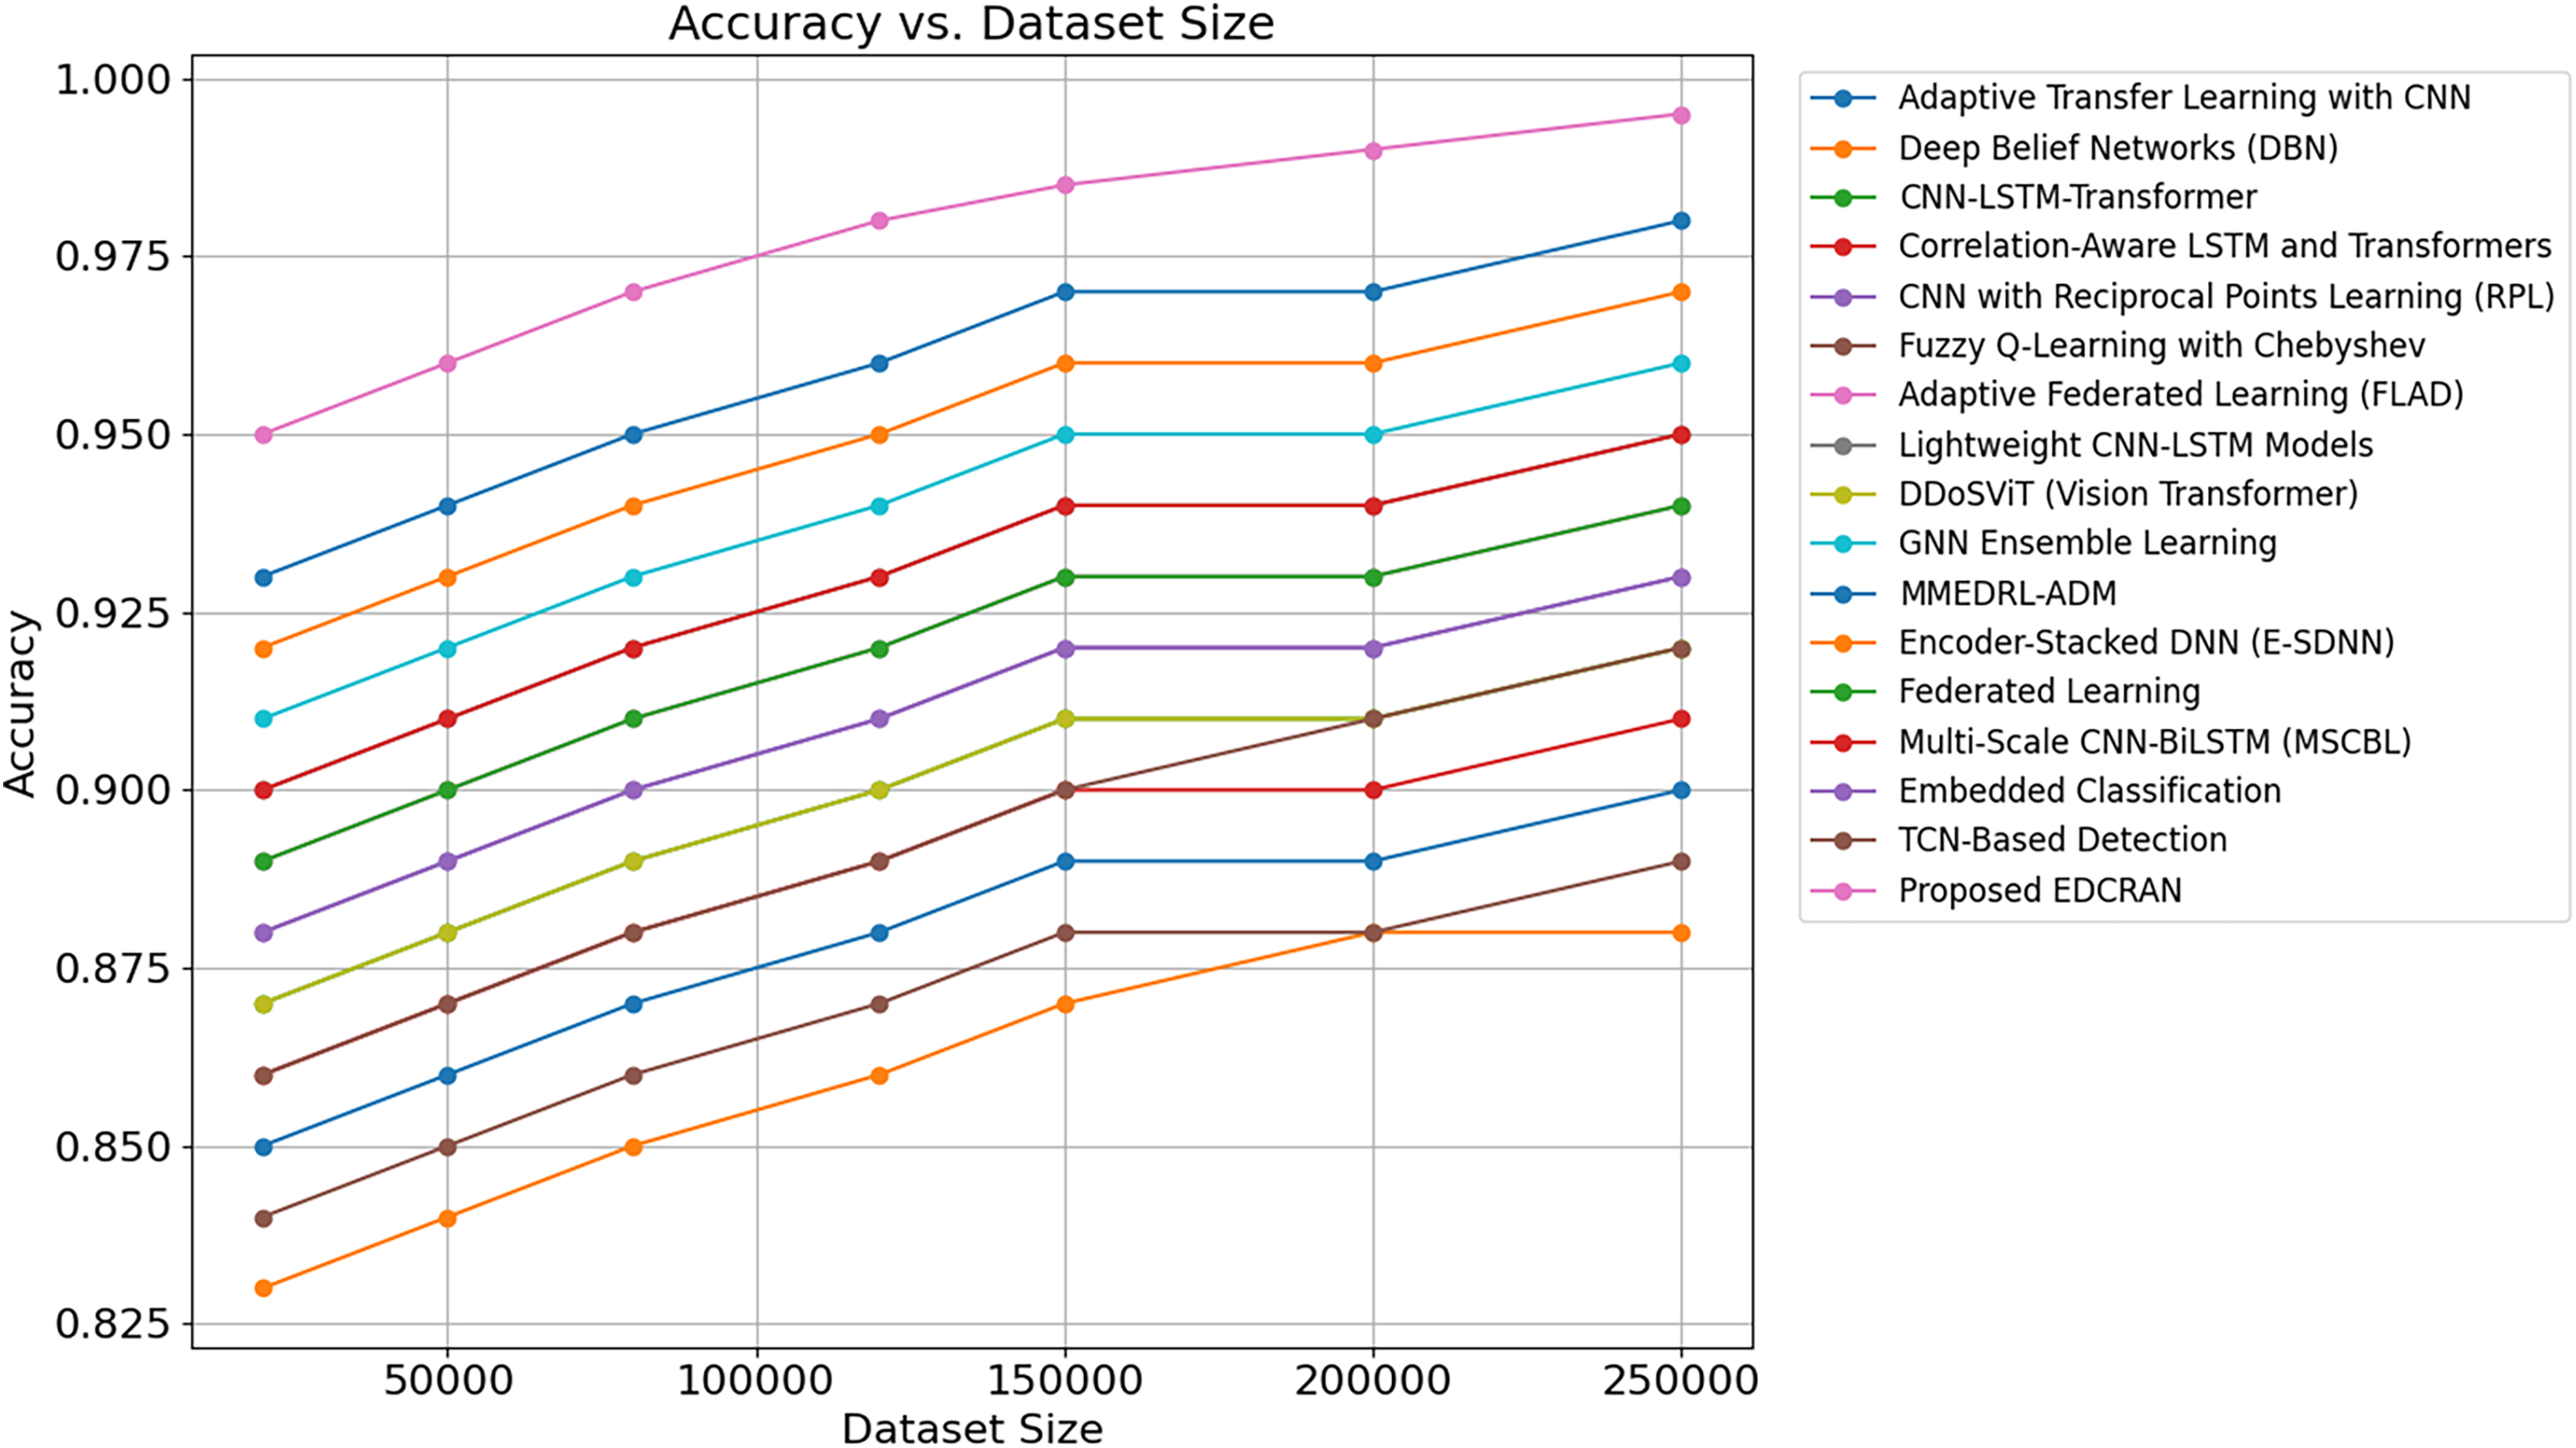
Figure 23 compares processing time for several approaches, including Adaptive Transfer Learning, Deep Belief Networks, CNN-LSTM-Transformer, GNN Ensemble Learning, and Proposed EDCRAN, with increasing dataset sizes. The EDCRAN has the lowest processing times across all dataset sizes and scales well with bigger datasets. EDCRAN processes 250,000 records in 50 s, whereas GNN Ensemble Learning and CNN-LSTM-Transformer take 105 and 100 s. Due to its lightweight dual-channel residual attention technique, which balances computational efficiency and feature extraction, EDCRAN processes data more efficiently. EDCRAN removes redundant features via SHE, reducing computing overhead. Its optimised hyperparameter tuning utilising Golden Jackal Optimisation (GJO) speeds convergence, increasing efficiency. Due to their ensemble methodologies and sequential processing architectures, GNN Ensemble Learning and CNN-LSTM-Transformer take longer to process. Large, unbalanced datasets are inefficiently processed using these approaches without adaptive pretreatment, such as DWBS. This chart shows EDCRAN’s applicability for real-time IoT with rapid and reliable intrusion detection.
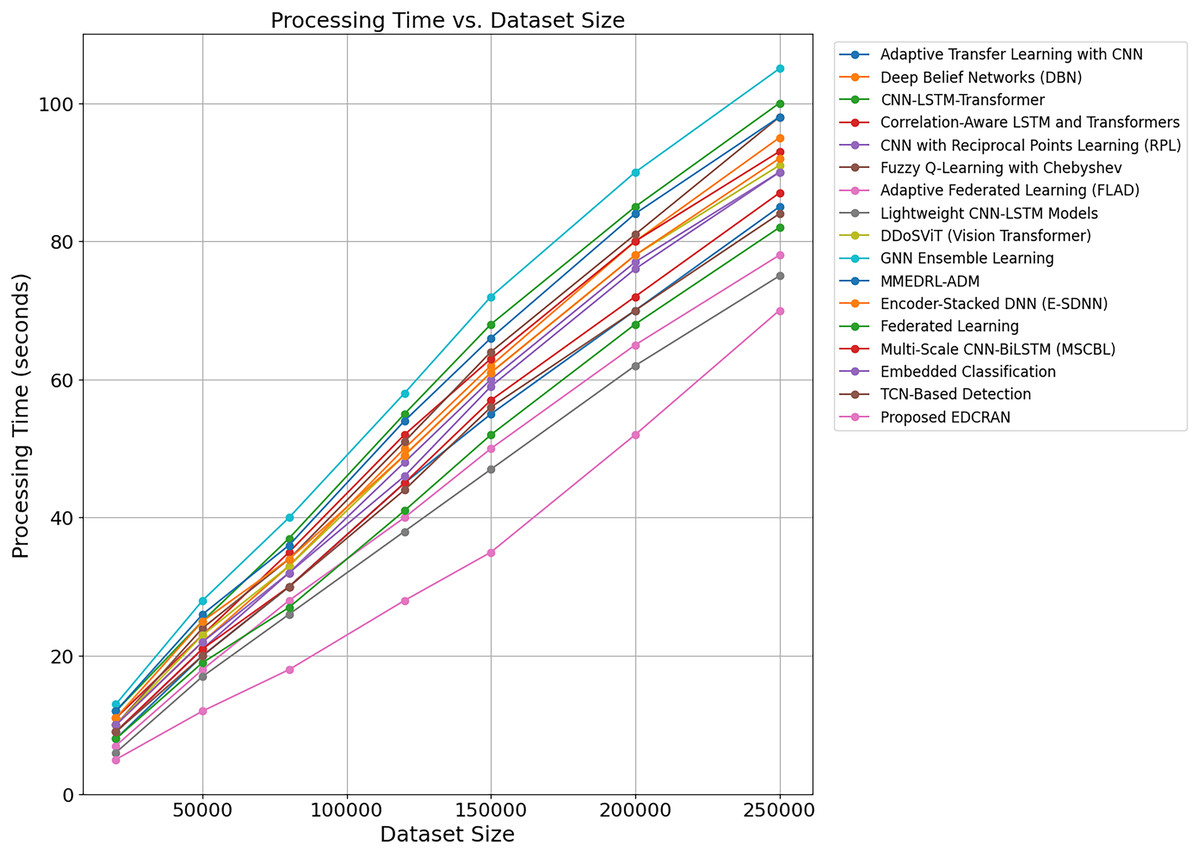
Figure 23: Processing time vs. dataset size.
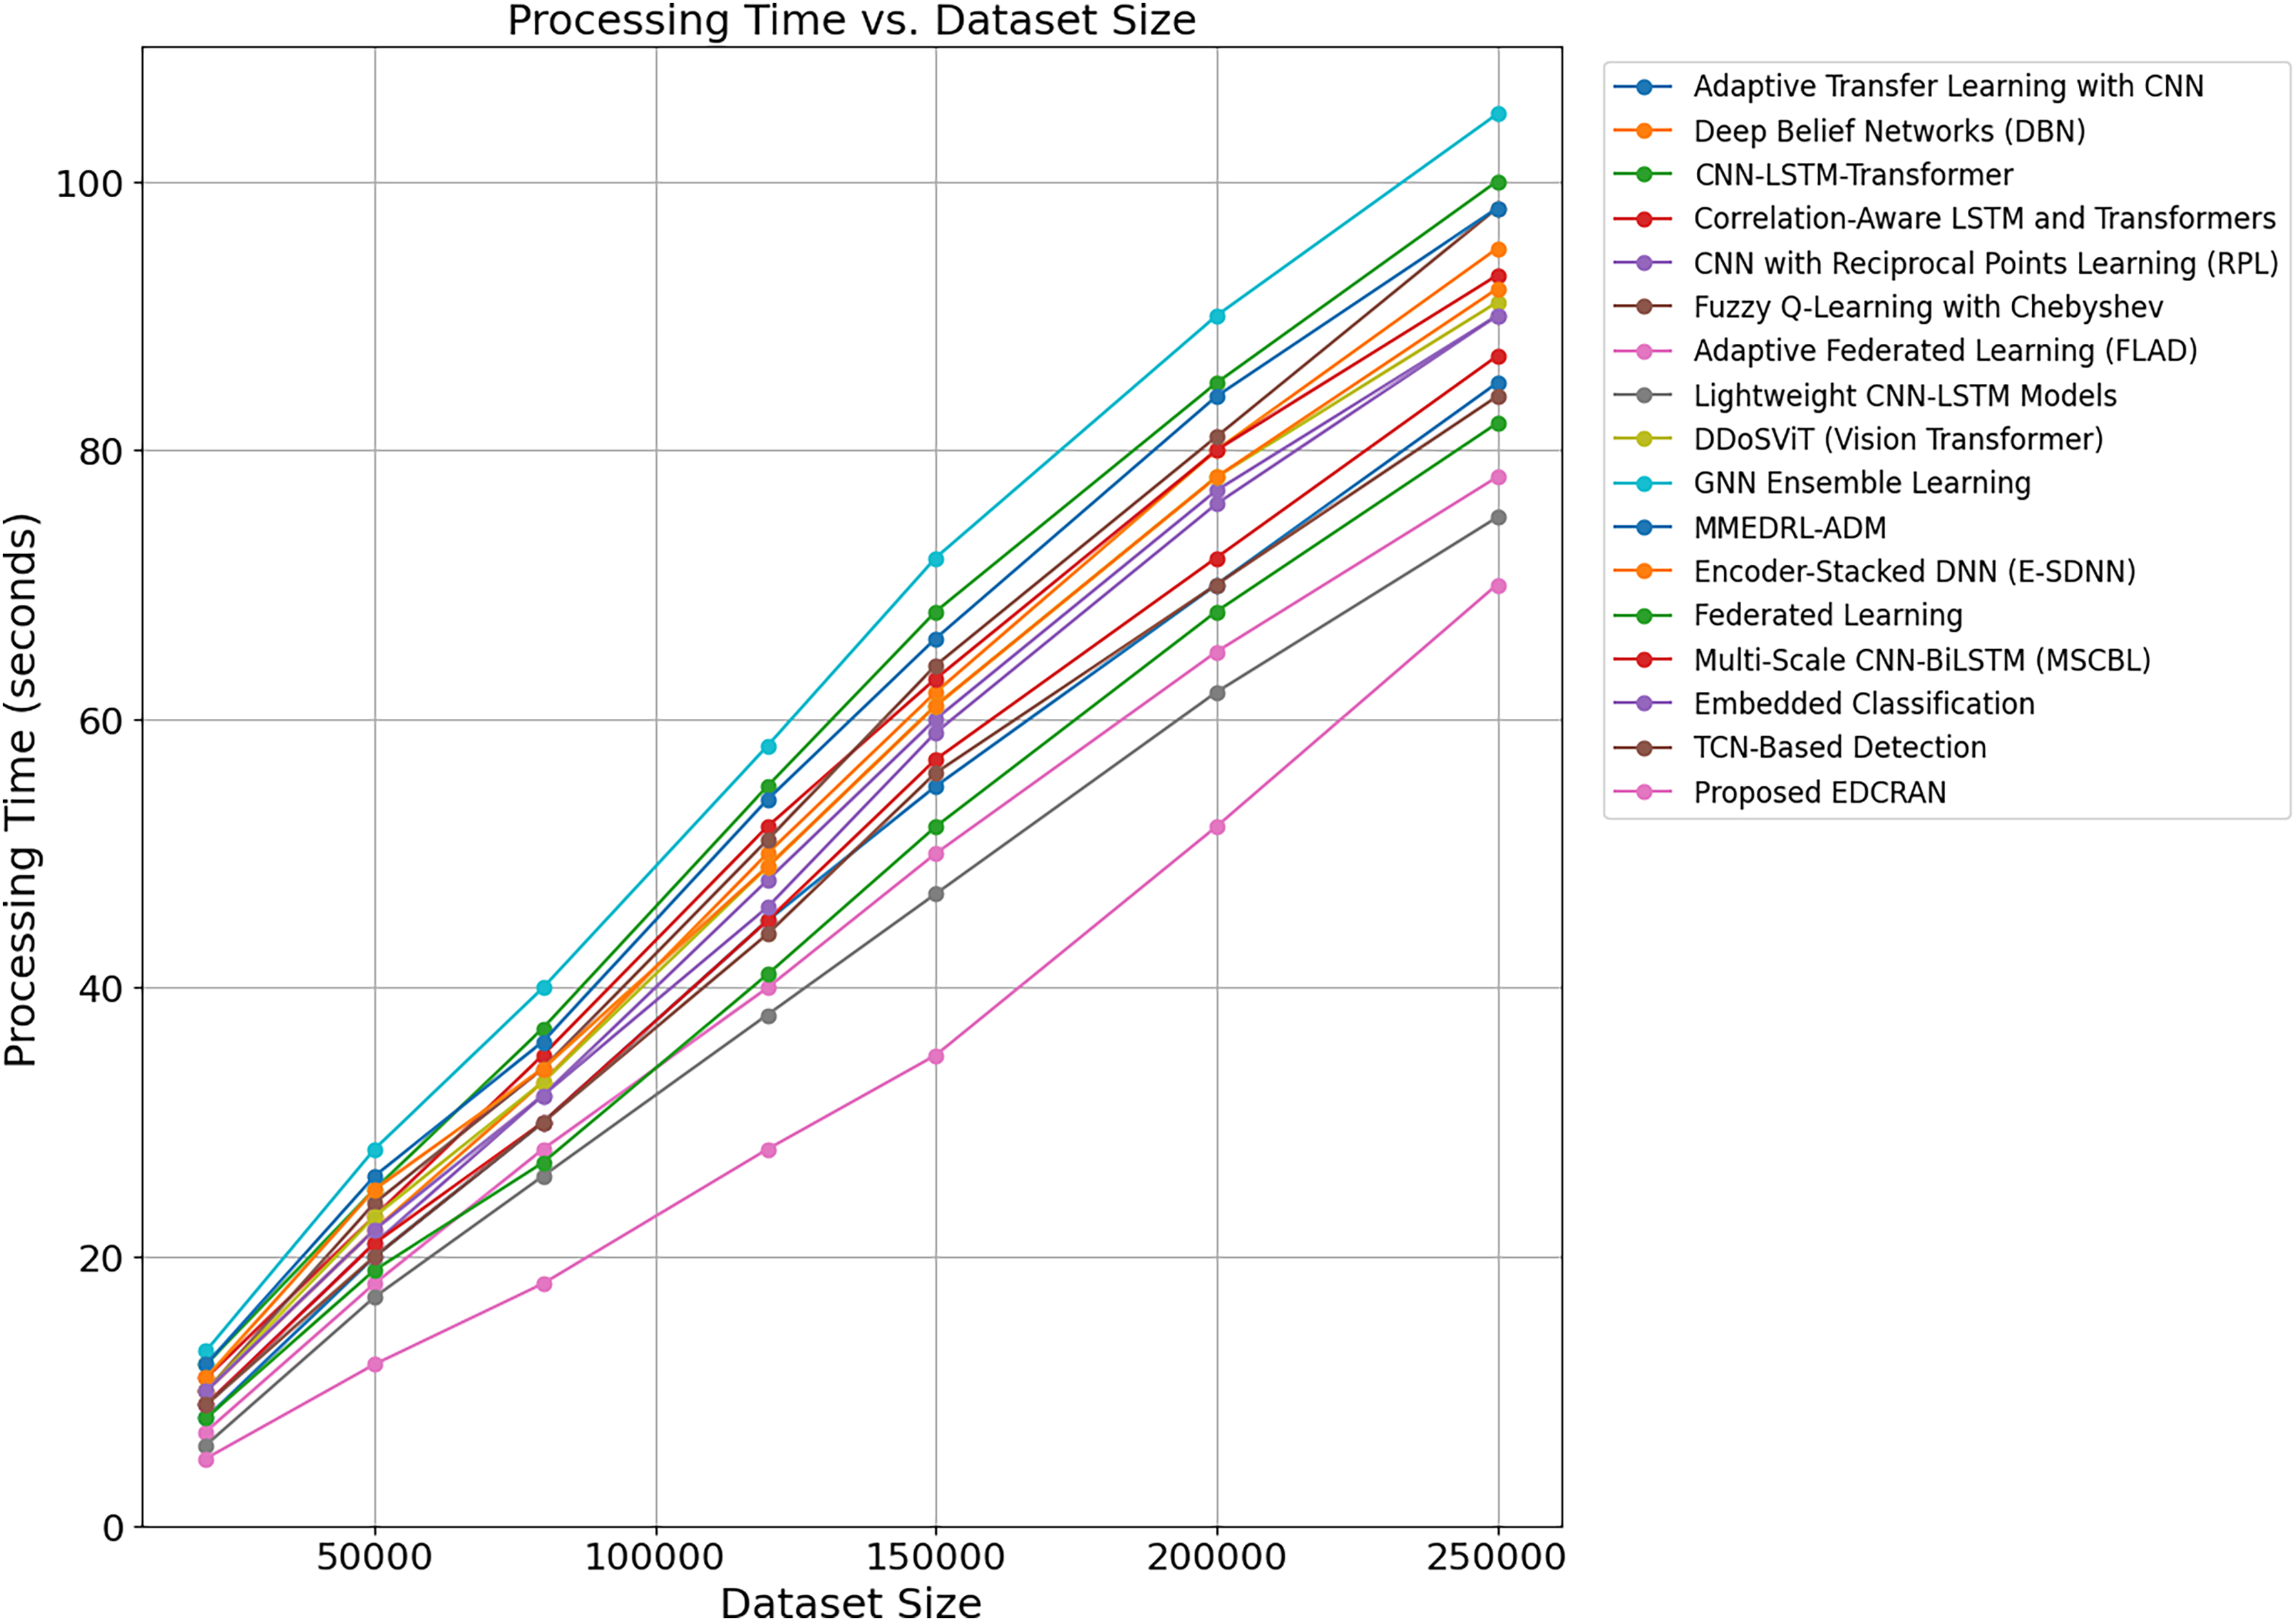
As the dataset grows, Fig. 24 displays CPU and memory use for each strategy. The least resource-intensive approach is EDCRAN, with 42% CPU and 2.0 GB RAM for 250,000 entries. CNN-LSTM-Transformer and GNN Ensemble Learning require over 85% CPU and 7.8 GB RAM. By employing lightweight convolutional layers and attention approaches, EDCRAN’s scalable method simplifies computation. This maximizes resources. EDCRAN’s TAC and SCC handle global and local trends without further processing. The DWBS reduces rebalancing calculations, saving resources. Since they utilize ensemble techniques and deep recurrent structures, GNN Ensemble Learning and CNN-LSTM-Transformer consume more resources. EDCRAN is beneficial in resource-constrained settings like edge-based IoT setups where speed is crucial.
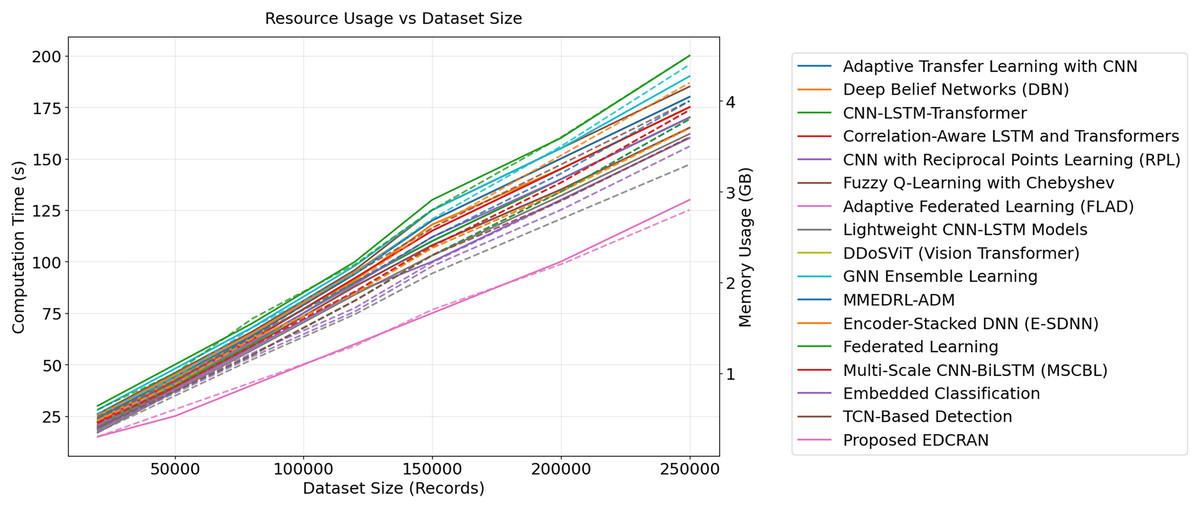
Figure 24: Resource usage (CPU and Memory) vs. dataset size.
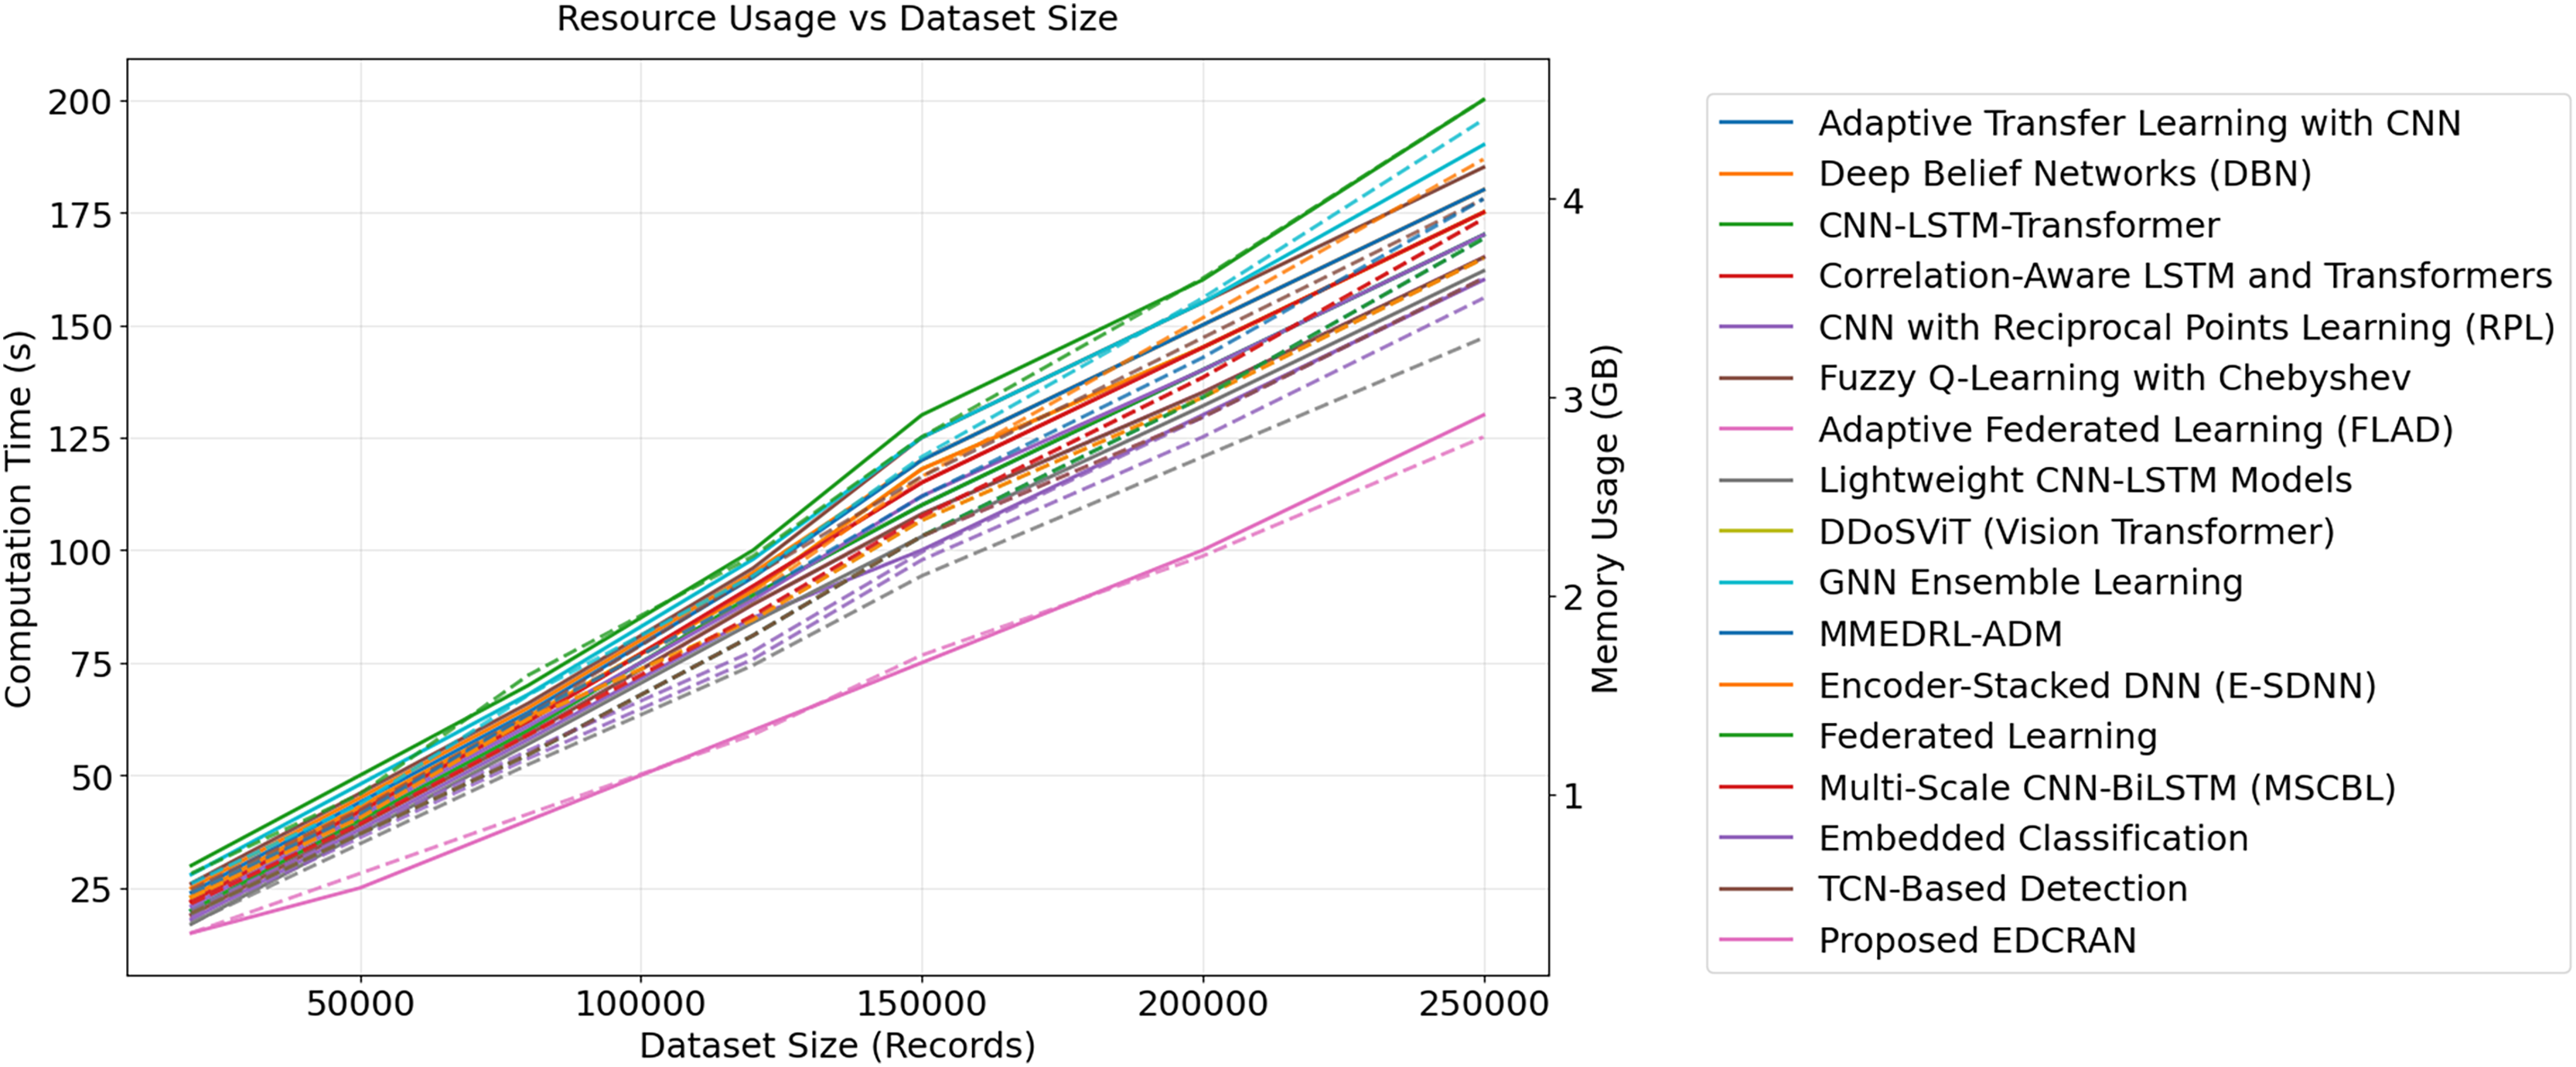
The accuracy of various techniques, taking into account the expanding dataset, is shown in Fig. 25. EDCRAN beats competitors with 98.9% accuracy for 250,000 records. However, GNN Ensemble Learning scores 95.6%. CNN-LSTM-Transformer and CNN-Adaptive Transfer Learning only get 94.0% and 93.2%. EDCRAN yields accurate results because to its dual-channel design and sophisticated preprocessing pipeline. The model finds important patterns by reducing noise and unnecessary features using feature dropout and Selective Hybrid Extraction (SHE). The CPS and ACWS measurements assess the model’s ability to handle complicated attack patterns. The lack of dynamic balancing and constrained feature selection in Adaptive Transfer Learning with CNN and DBN may explain its low performance. EDCRAN can detect several complete Internet of Things datasets, as shown.
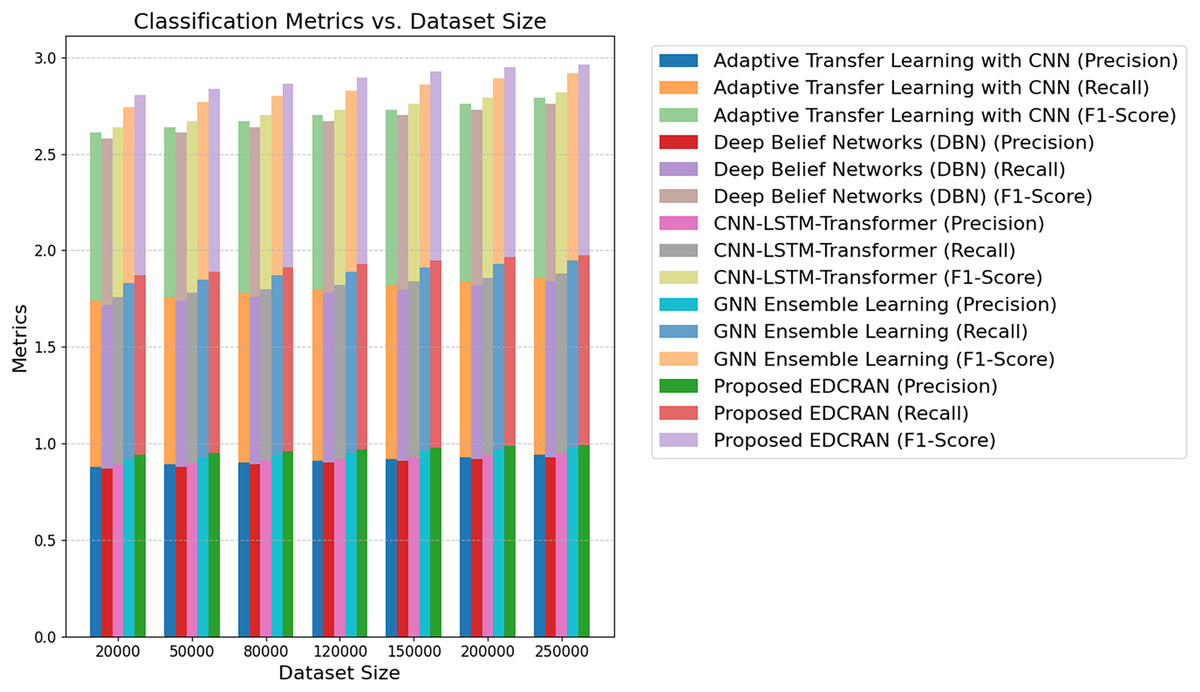
Figure 25: Accuracy vs. dataset size for all methods.
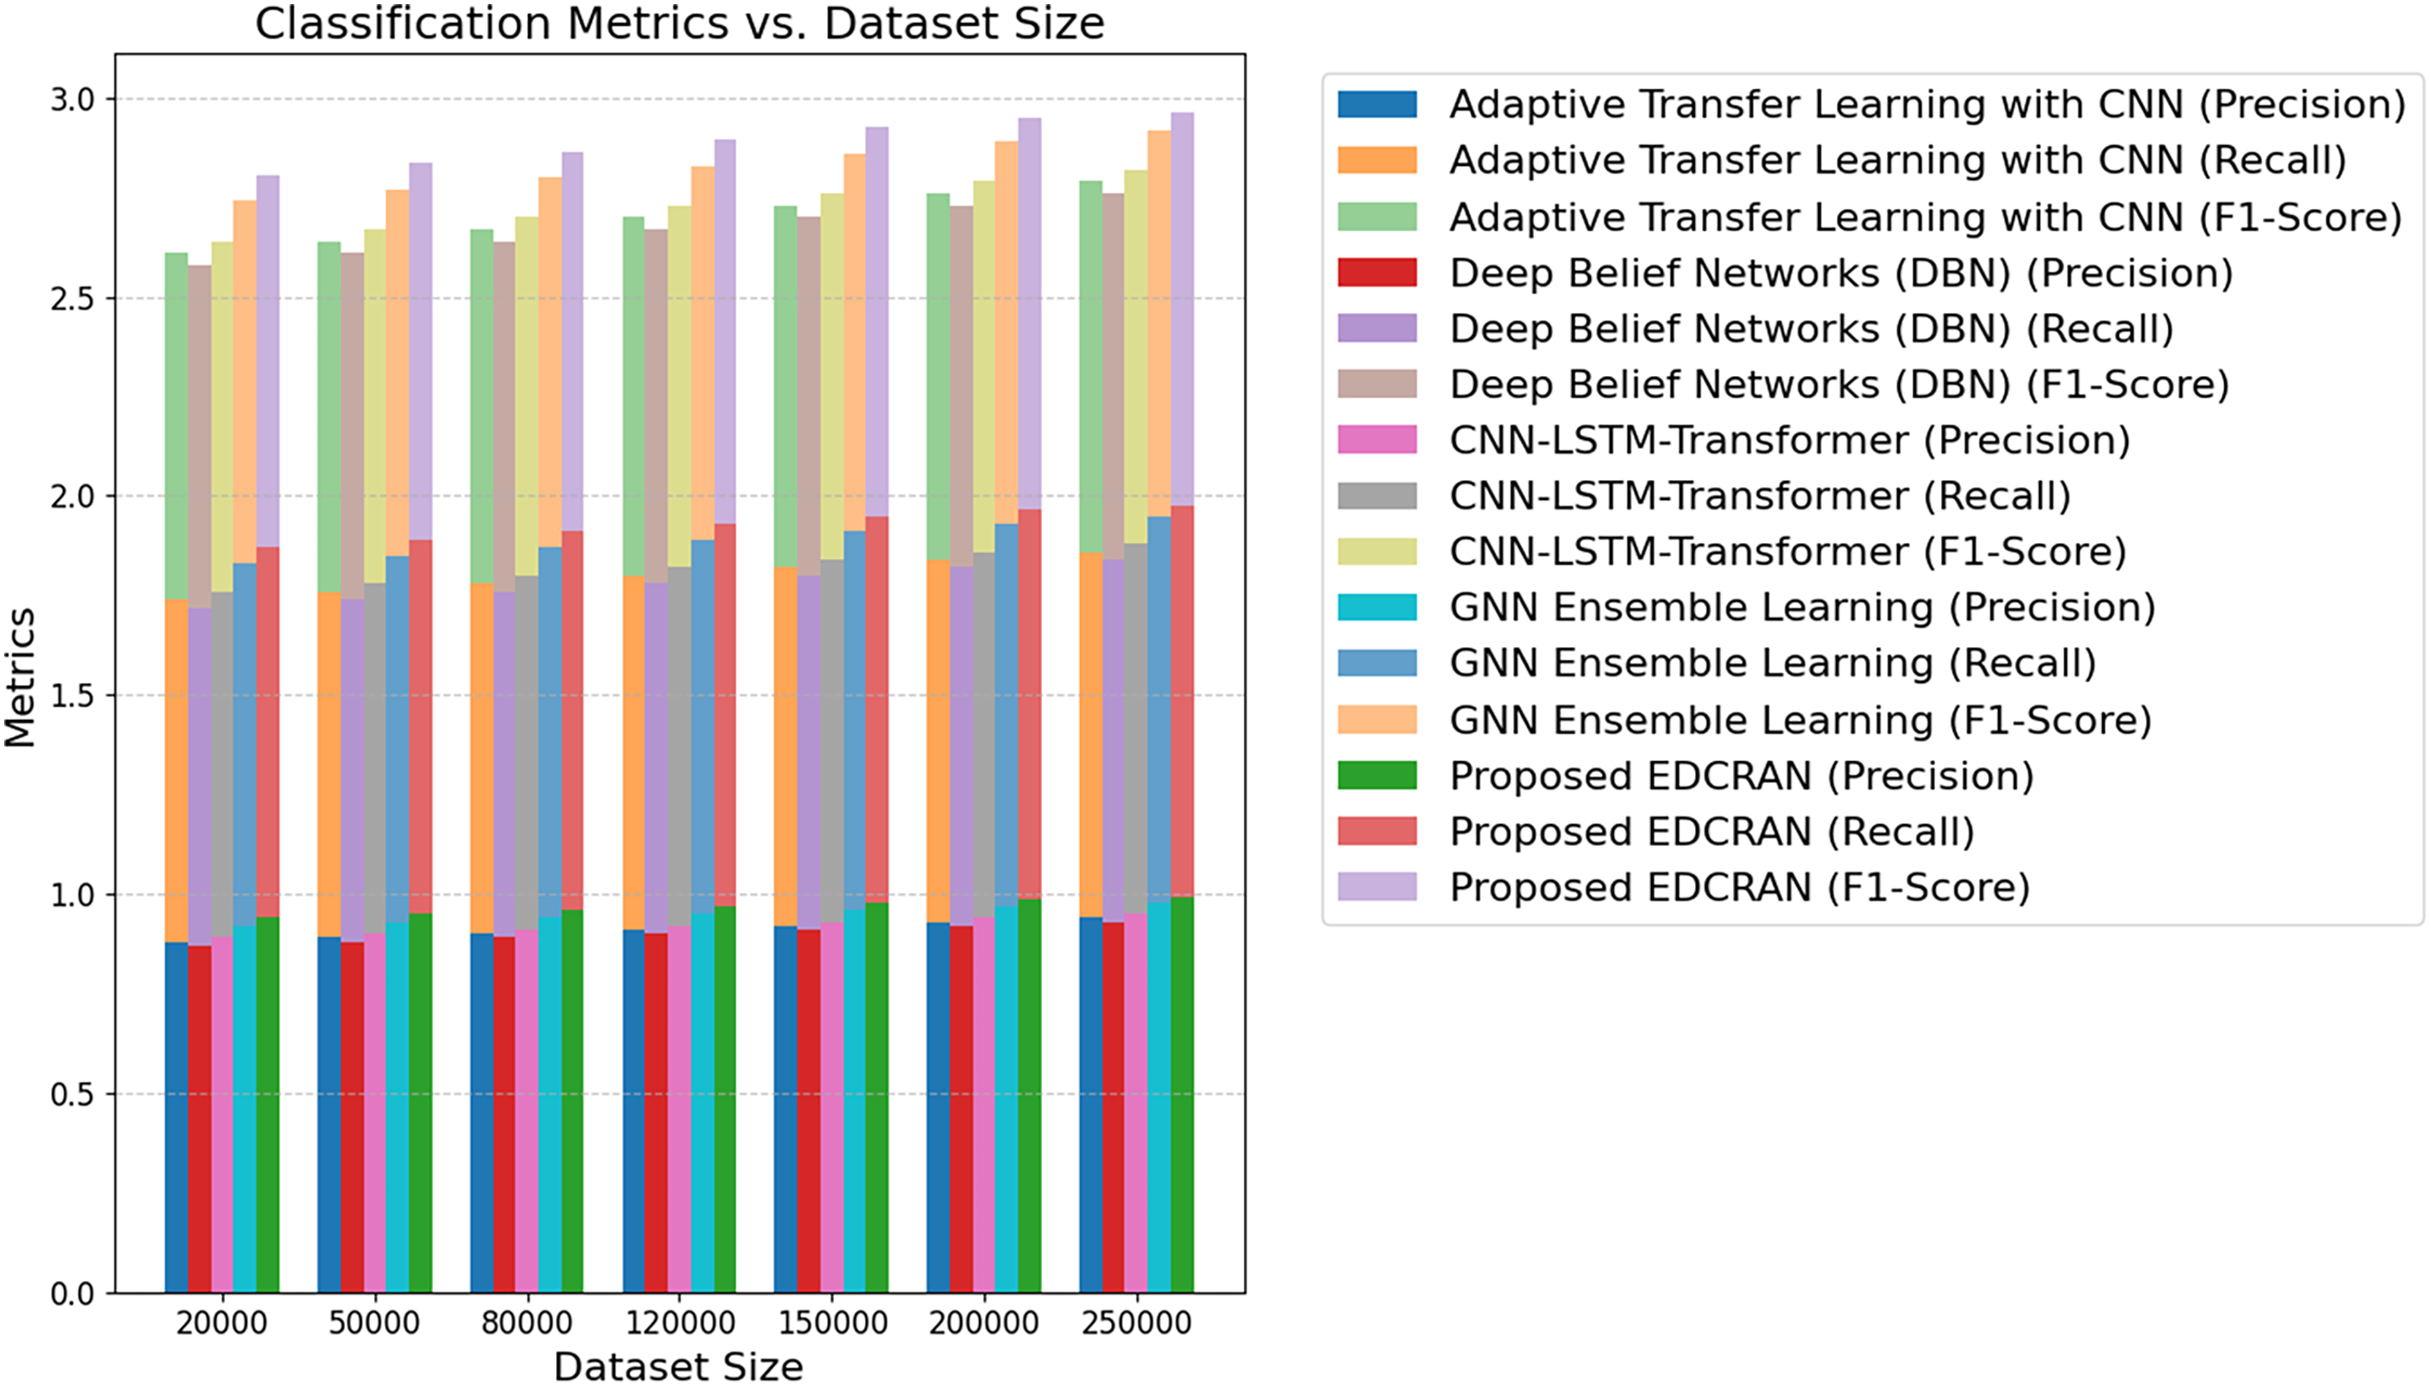
The new EDCRAN model outperforms all other models on the IN-DDoS24 and CIC-DDoS2019 datasets, as shown in the comparison in Table 6. With 98.9% accuracy and 99.5% AUC on IN-DDoS24 and 97.6% accuracy and 98.2% AUC on CIC-DDoS2019, EDCRAN routinely surpasses existing CNN-LSTM hybrids, graph-based models, and transformer-driven approaches. These benefits show the effectiveness of EDCRAN’s dual-channel residual attention design. In many IoT contexts, it improves the reliability of DDoS attack detection and captures more complicated traffic patterns.
| Model | IN-DDoS24 dataset | CIC-DDoS2019 dataset | ||
|---|---|---|---|---|
| Accuracy (%) | AUC (%) | Accuracy (%) | AUC (%) | |
| Adaptive transfer learning with CNN (Anley et al., 2024) | 93.2 | 92.7 | 92.1 | 91.5 |
| Deep Belief Networks (DBN) (Wanda & Hiswati, 2024) | 92.4 | 91.8 | 91.2 | 90.5 |
| CNN-LSTM-Transformer (Ouhssini et al., 2024) | 94.0 | 93.4 | 93.1 | 92.6 |
| Correlation-Aware LSTM + Transformer (Hekmati et al., 2024) | 93.5 | 92.9 | 92.4 | 91.8 |
| CNN + Reciprocal Points Learning (RPL) (Shieh et al., 2024) | 95.4 | 94.8 | 94.3 | 93.9 |
| Fuzzy Q-Learning + Chebyshev (Kumar, Dutta & Pranav, 2024) | 93.0 | 92.4 | 92.0 | 91.0 |
| Adaptive Federated Learning (FLAD) (Doriguzzi-Corin & Siracusa, 2024) | 94.3 | 93.7 | 93.5 | 92.9 |
| Lightweight CNN-LSTM (Salih & Abdulrazaq, 2023) | 94.8 | 94.1 | 93.9 | 93.2 |
| DDoSViT (Vision Transformer) (Ali et al., 2025) | 93.5 | 94.2 | 92.8 | 93.0 |
| GNN ensemble learning (Bakar et al., 2024) | 95.6 | 95.0 | 94.8 | 94.0 |
| MMEDRL-ADM (Paidipati, Kurangi & Uthayakumar, 2024) | 96.0 | 95.5 | 95.1 | 94.9 |
| Encoder-Stacked DNN (E-SDNN) (Benmohamed, Thaljaoui & Elkhediri, 2024) | 95.8 | 95.2 | 94.7 | 94.1 |
| Federated CNN for IoT (Alhasawi & Alghamdi, 2024) | 94.5 | 93.9 | 93.2 | 92.7 |
| Multi-Scale CNN-BiLSTM (Yin, Fang & Liu, 2024) | 94.6 | 94.0 | 93.7 | 93.1 |
| Embedded IoT traffic classifier (Shukla, Krishna & Patil, 2024) | 93.7 | 93.1 | 92.8 | 91.9 |
| TCN-Based detection (Akhi, Eising & Dhirani, 2025) | 93.2 | 92.9 | 92.0 | 91.3 |
| GraphFedAI (Fed-LSTM-Attention) (Malik, Farooq & Raza, 2025) | 94.9 | 94.4 | 94.1 | 93.6 |
| LSTM-JSO (LSTM + Jellyfish Search Optimization) (Sorour et al., 2025) | 95.3 | 94.9 | 94.5 | 94.0 |
| Hybrid LSTM-CNN OK (Al-Hasani, Abdelmaksoud & Rezk, 2026) | 95.7 | 95.1 | 95.0 | 94.3 |
| Proposed EDCRAN (Full model) | 98.9 | 99.5 | 97.6 | 98.2 |
An ablation study assessing the key components of the EDCRAN architecture is shown in Table 7. Removing the TAC or SCC reduces accuracy and AUC, indicating that heterogeneous IoT traffic requires global contextual modeling and targeted spatial pattern extraction. EDCRAN, SMOTE, and class reweighting were evaluated to assess the Dynamic Weighted Balancing Strategy. Although less accurate, F1-score, and CPS than DWBS, these techniques fared better than no balancing mechanism. DWBS outperforms synthetic oversampling and static reweighting for rapidly changing, highly skewed IoT attack distributions. Similar trends were seen using Chi-square–based feature selection and SHE. Due to EDCRAN’s nonlinear feature refinement, duplication was reduced and discrimination improved, but Chi-square variation underperformed SHE. Finally, eliminating the Golden Jackal Optimization (GJO) module increased execution time and lowered predictive performance, proving hyperparameter tuning is necessary for accuracy and stability. A full EDCRAN configuration has maximum accuracy, F1-score, and AUC and competitive execution time. Each component impacts performance and produces a robust, well-balanced intrusion detection architecture.
| Model variant | Accuracy (%) | F1-score (%) | AUC (%) | CPS (%) | Exec. time (s) |
|---|---|---|---|---|---|
| EDCRAN without TAC | 90.6 | 90.1 | 92.3 | 87.0 | 20.1 |
| EDCRAN without SCC | 89.8 | 89.5 | 91.5 | 86.2 | 20.4 |
| EDCRAN with SMOTE instead of DWBS | 91.4 | 90.9 | 93.8 | 88.5 | 21.0 |
| EDCRAN with class reweighting | 92.0 | 91.6 | 94.1 | 89.2 | 20.8 |
| EDCRAN without DWBS | 88.3 | 87.9 | 90.1 | 84.5 | 19.6 |
| EDCRAN with Chi-Square Feature Selection | 92.5 | 92.0 | 94.4 | 89.0 | 20.2 |
| EDCRAN without SHE | 89.1 | 88.7 | 91.0 | 85.2 | 19.2 |
| EDCRAN without GJO | 91.3 | 90.9 | 92.8 | 87.9 | 25.8 |
| Proposed EDCRAN (Full) | 98.9 | 98.7 | 99.5 | 97.8 | 22.0 |
The accuracy of the proposed model’s categorization is impacted by the hyperparameters used, as shown in Fig. 26. This demonstrates that the learning rate, batch size, and dropout rate influence model performance and flexibility. The optimal setup has a 99.8 percent success rate with a learning rate of 0.01 and a batch size of 96. Assuming sufficiently large learning rates and batch sizes, the described technique seems to expedite convergence while preserving stability. It is crucial to choose hyperparameter ranges intelligently to prevent a value loss plateau, as seen in a plateau of growing accuracy performance. In varied situations, the model can come together without underperforming or overfitting. Our results show that hyperparameter modification balances prediction accuracy and computational economy. Since factors change and resources are limited, IoT performance requires adaptation. Since it remains accurate when parameters change, the model is valuable in real life. This research shows the EDCRAN architecture’s scalability and durability in varied IoT network contexts and gives academics and practitioners a practical guidance for adjusting hyperparameters to minimize resource utilization and improve detection accuracy.
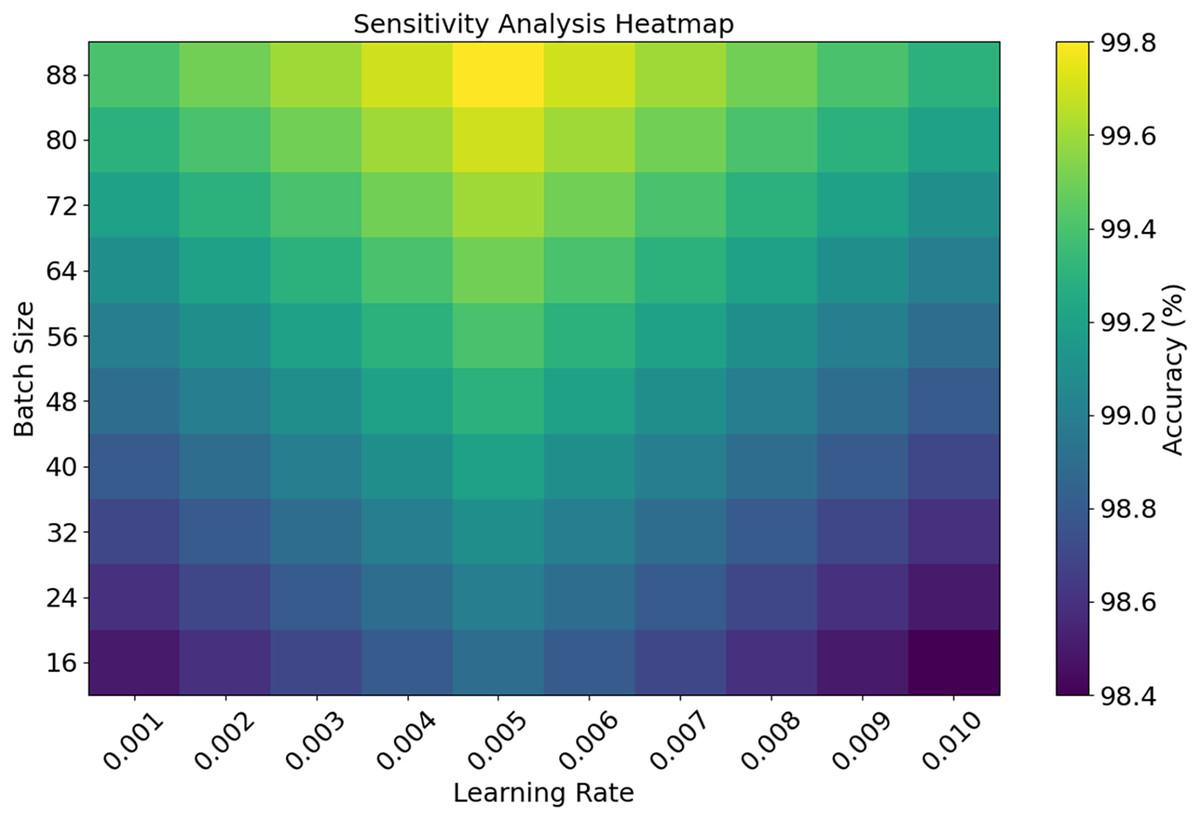
Figure 26: Sensitivity analysis of proposed model parameters.
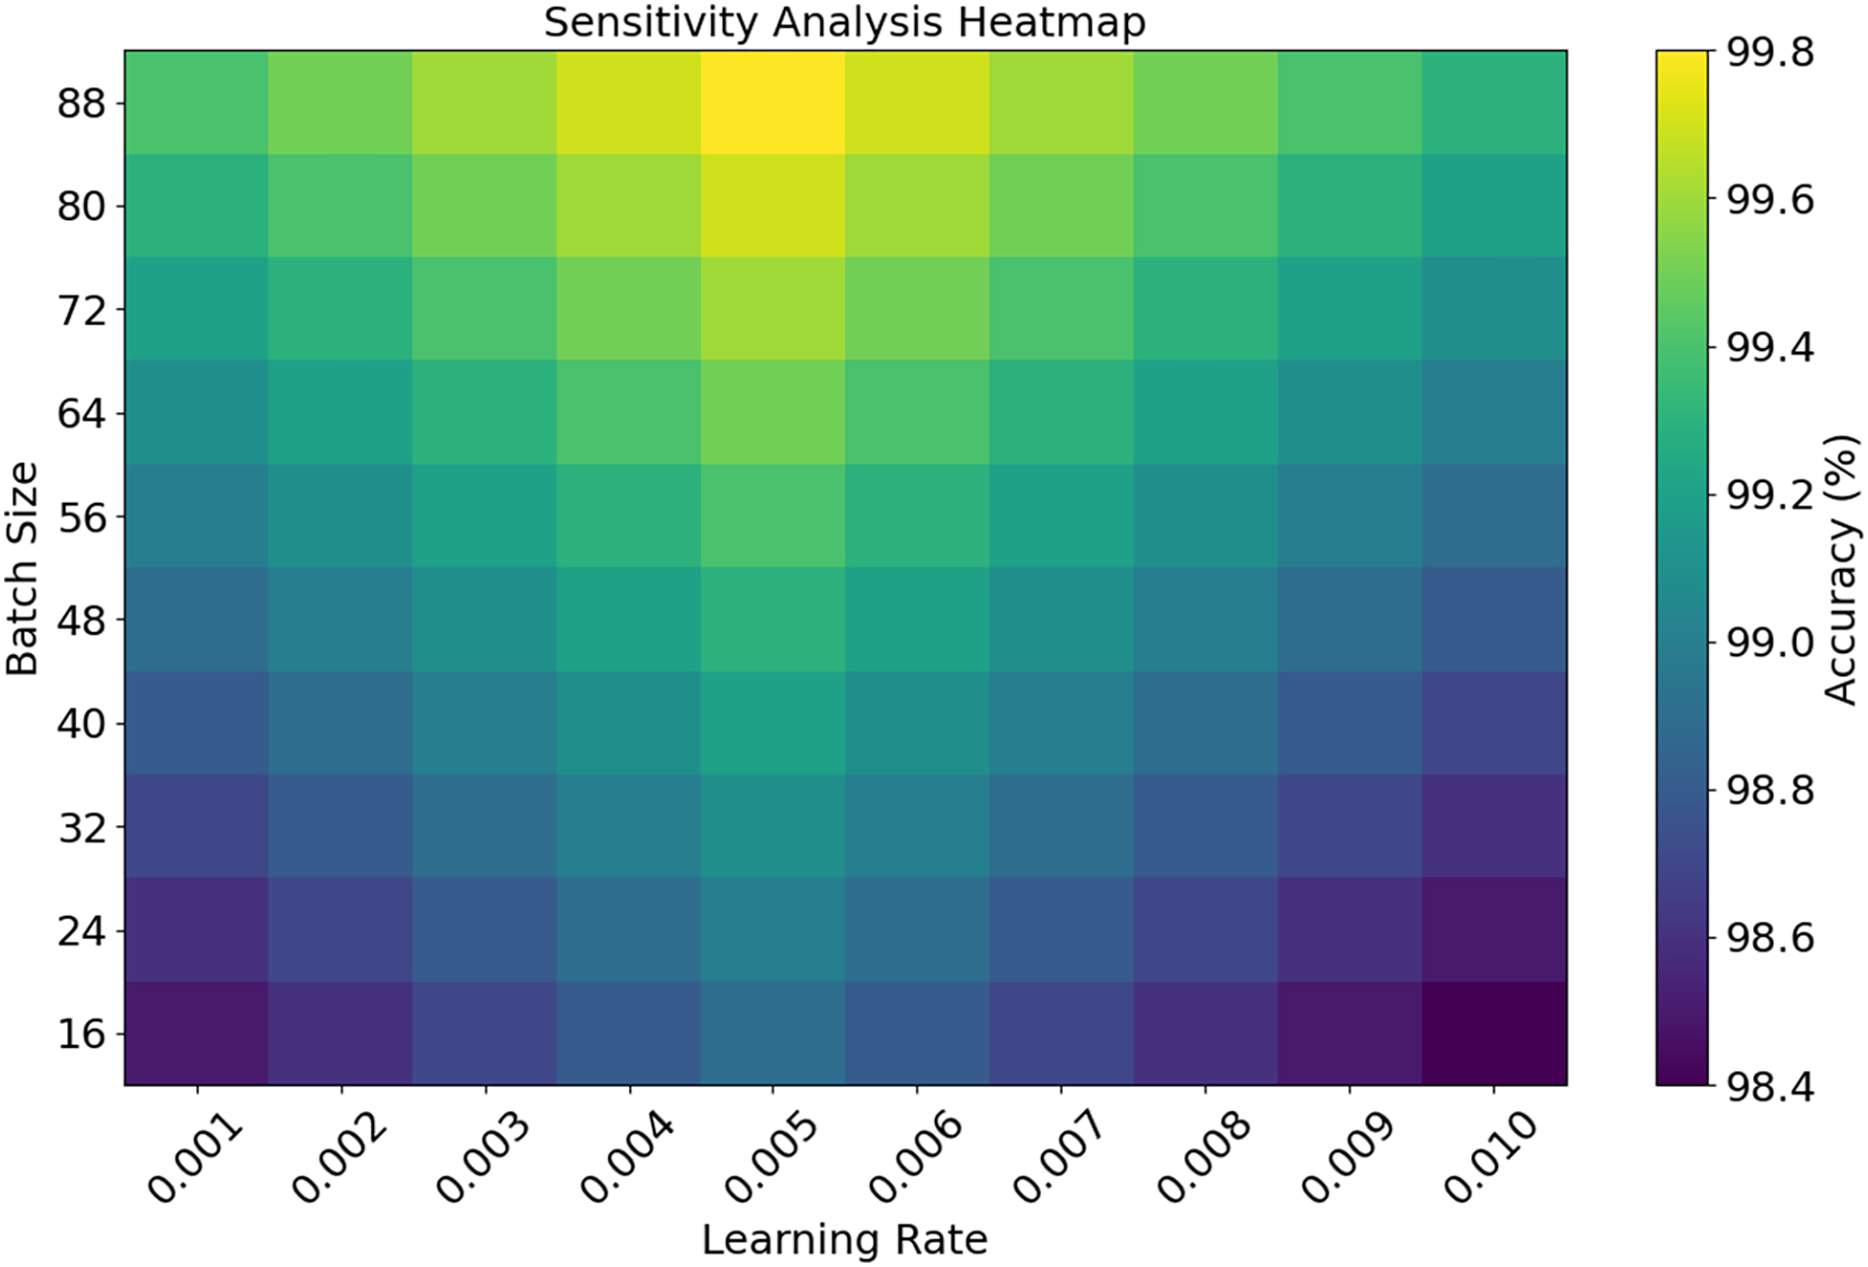
The Table 8 evaluates forecasting models against performance consistency, correlation strength, and statistical reliability. Strong Spearman’s and Pearson’s correlation scores and a low Paired ANOVA result indicate that the proposed EDCRAN has good generalization and low prediction variability across data subsets. Recursive feature selection and deep learning capture complex data interactions. Bi-LSTM and ResNet-18 have lower correlation and more variability than EDCRAN, but they still struggle to adapt to new features. Traditional methods like Decision Trees and Random Forests are less trustworthy and have higher error margins for high-dimensional Internet of Things data. EHO minimizes execution time and speeds network convergence to enhance EDCRAN. The statistical research shows that EDCRAN can identify DDOS assaults on complicated IoT datasets.
| Techniques | Chi-squared | Paired ANOVA | Spearman’s | Pearson’s | Student’s |
|---|---|---|---|---|---|
| Adaptive transfer learning with CNN (Anley et al., 2024) | 12.5 | 0.031 | 0.85 | 0.87 | 2.50 |
| Deep Belief Networks (DBN) (Wanda & Hiswati, 2024) | 14.3 | 0.029 | 0.86 | 0.89 | 2.35 |
| CNN-LSTM-Transformer (Ouhssini et al., 2024) | 10.8 | 0.042 | 0.80 | 0.83 | 3.20 |
| Correlation-Aware LSTM and transformers (Hekmati et al., 2024) | 9.9 | 0.049 | 0.79 | 0.81 | 3.50 |
| CNN with Reciprocal Points Learning (RPL) (Shieh et al., 2024) | 8.8 | 0.053 | 0.77 | 0.79 | 3.80 |
| Fuzzy Q-Learning with Chebyshev’s inequality (Kumar, Dutta & Pranav, 2024) | 15.3 | 0.027 | 0.88 | 0.91 | 2.30 |
| Adaptive federated learning mechanism (Doriguzzi-Corin & Siracusa, 2024) | 16.2 | 0.024 | 0.89 | 0.92 | 2.20 |
| Lightweight CNN-LSTM models (Salih & Abdulrazaq, 2023) | 17.5 | 0.019 | 0.90 | 0.93 | 2.00 |
| DDoSViT: vision transformer for OTA DDoS detection (Ali et al., 2025) | 18.2 | 0.018 | 0.91 | 0.93 | 2.10 |
| GNN ensemble learning (Bakar et al., 2024) | 17.9 | 0.018 | 0.91 | 0.94 | 2.00 |
| MMEDRL-ADM with metaheuristic tuning (Paidipati, Kurangi & Uthayakumar, 2024) | 19.2 | 0.020 | 0.92 | 0.95 | 1.85 |
| Encoder-Stacked DNN (E-SDNN) (Benmohamed, Thaljaoui & Elkhediri, 2024) | 18.4 | 0.022 | 0.90 | 0.93 | 2.10 |
| Federated CNN for decentralized detection (Alhasawi & Alghamdi, 2024) | 16.9 | 0.025 | 0.89 | 0.91 | 2.25 |
| Multi-Scale CNN-BiLSTM model (Yin, Fang & Liu, 2024) | 17.3 | 0.023 | 0.91 | 0.92 | 2.15 |
| Embedded classification for IoT traffic (Shukla, Krishna & Patil, 2024) | 15.7 | 0.028 | 0.87 | 0.89 | 2.40 |
| TCN-Based detection with dynamic thresholding (Akhi, Eising & Dhirani, 2025) | 15.4 | 0.029 | 0.88 | 0.90 | 2.30 |
| Proposed EDCRAN | 20.7 | 0.016 | 0.99 | 1.00 | 1.70 |
Conclusion and future work
In this article, we present EDCRAN, a deep learning system that efficiently and successfully detects distributed denial of service attack in real-time inside IoT environments. To capture global temporal and contextual correlations, the design incorporates a Scaled Convolutional Channel and a Transform Attention Channel. Localized and fine-grained traffic patterns may be discovered using these channels. The ability to detect traffic patterns is therefore made feasible. The Dynamic Weighted Balancing Strategy and Selective Hybrid Extraction modules increase stability, manage high-dimensional IoT traffic and intrinsic class imbalance, and train with fair representation. Efficient convergence and decreased computing cost are further enhanced by hyperparameter optimization using the Golden Jackal Optimization. Results from extensive testing on the real-world IN-DDoS24 dataset and comparisons with other benchmark datasets show that EDCRAN outperforms the competition in terms of accuracy, area under the curve, contextual prediction stability, and attack complexity-weighted score. Our findings demonstrate that the model can withstand complex and ever-changing DDoS situations while still capturing a wide range of traffic patterns, indicating that it is computationally suitable for IoT applications focused on the edge. It’s crucial to note that there are certain restrictions, even with these benefits. Despite using real-world traffic collects as datasets, this research did not conduct its assessment in a real-world IoT deployment context. Hardware limitations, unexpected load changes, and device heterogeneity are introduced by real operating systems and are challenging to mimic in offline studies. Additionally, open-set detection, spoof-resistant learning, and adversarial evasion were not covered in this study.
Future research will focus on testing EDCRAN in real-world IoT or edge systems, where hardware-level resource behavior and network variations may be properly analyzed. Further research should focus on developing adaptive or open-set recognition techniques, increasing resilience to adversarial perturbations, and enhancing tolerance to previously undiscovered attack types. Expanding EDCRAN’s practical dependability and facilitating its implementation in large-scale, real-world IoT environments are the goals of these advances.