
Complex interaction recognition via advanced multilevel feature fusion and deep learning model
- Published
- Accepted
- Received
- Academic Editor
- Xiangjie Kong
- Subject Areas
- Artificial Intelligence, Computer Vision, Optimization Theory and Computation, Visual Analytics, Neural Networks
- Keywords
- Image analysis, Pattern analytics, Image processing, Interaction classification, Deep learning
- Copyright
- © 2026 Alshehri et al.
- Licence
- This is an open access article distributed under the terms of the Creative Commons Attribution License, which permits unrestricted use, distribution, reproduction and adaptation in any medium and for any purpose provided that it is properly attributed. For attribution, the original author(s), title, publication source (PeerJ Computer Science) and either DOI or URL of the article must be cited.
- Cite this article
- 2026. Complex interaction recognition via advanced multilevel feature fusion and deep learning model. PeerJ Computer Science 12:e3514 https://doi.org/10.7717/peerj-cs.3514
Abstract
The recognition of human activities through images represents a fundamental research domain in computer vision and pattern recognition, with practical applications in human–computer interaction, video analysis, and surveillance. This research objective is to develop an enhanced neurocomputing network for humans using Deep Neural Networks (DNNs) for precise image-based behaviour classification. Our proposed DNN-based framework unites several preprocessing and feature extraction methods to accomplish this goal. The system begins with Hue, Saturation, and Value (HSV) colour processing to enhance image visibility, followed by Gaussian filtering for noise reduction. The statistical method performs silhouette extraction, and the feature extraction process utilises Local Intensity Order Pattern (LIOP) and Features from accelerated segment test (FAST) algorithms together. Feature discrimination is enhanced through the application of fuzzy optimisation techniques. The optimised features are processed by a DNN, which classifies human activities. The proposed framework demonstrates high effectiveness through its recognition performance, which achieved 94% accuracy on BIT interaction data and 88.25% accuracy on SBU interaction data. This work presents an advanced human activity recognition system that shows promise for real-world applications, such as surveillance systems, video analytics, and interactive technologies, enabling more precise analysis of human behaviour.
Introduction
Analysing visual data to comprehend human behaviour is one of the significant challenges in computer vision. Recognizing human action or movement is a complicated problem in computer vision and pattern recognition, some related work such as, Liu et al. (2023a) proposed the TokenHPE model, which utilizes Transformer architecture to address challenges in head pose estimation by learning facial and orientation relationships through orientation tokens and a novel multi-loss function (Liu et al., 2023a), and same author proposed TransIFC model, utilizing Transformer architecture along with HSFA and FFA modules to address challenges in fine-grained bird image classification by learning invariant features and long-dependent semantic relationships (Liu et al., 2023b). and also introduced the MMATrans model, which employs facial muscle movement-aware representation learning via visual transformers, incorporating discriminative feature generation and muscle relationship mining modules to improve facial expression recognition (Liu et al., 2024c).
As suggested, the progress of deep learning algorithms and machine learning has been promising to increase the accuracy and efficiency in image-based activity detection surveillance (Yang, Gwak & Jeon, 2017; Gammulle et al., 2023). Such technological advancements have introduced new frontiers of creating solutions in various domains of interest, such as sports analytics (Zheng et al., 2021), emotion recognition (Bian et al., 2024), and safety systems in health care, among others. The real-time action identification supports decision-making as well as environmental safety, while it also leads to intelligence and human–computer interaction (Qi et al., 2024).
The recent breakthroughs in deep learning have resulted in the replacement of traditional 2D convolutional neural network (CNN) and recurrent neural network (RNN) architectures with models that explicitly represent spatial-temporal dependencies. Initial methods based on 3D convolution demonstrated that direct learning of temporal information in video leads to better recognition performance on datasets like HMDB51, UCF101 and Kinetics. Later research integrated CNNs with Graph Convolutional Networks (GCNs) and Long Short-Term Memory (LSTM) networks to learn body-part interactions and temporal dynamics (Bashir et al., 2025). Transformer-based architectures have become more popular in recent years. Shaikh et al. (2024) provide a survey of multimodal human-action recognition and explain how attention mechanisms and feature fusion substitute conventional convolutional backbones (Shaikh et al., 2024). Transformer models like the Long- and Short-term Temporal Difference Vision Transformer (LS-VIT) use both short and long motion cues and perform state-of-the-art on UCF101, HMDB51, and Kinetics-400 (Chen et al., 2024). Belal et al. (2024) demonstrate that combining the features of parameter-optimized GCNs and transformers leads to increased accuracy and F1-scores on benchmarks like HuGaDB and TUG. Collectively, these articles demonstrate a clear trend toward more advanced CNN-based models transitioning to transformer-based models with complex fusion techniques, underscoring the importance of temporal modelng and attention mechanisms in high-performance human activity recognition (Belal et al., 2024).
The designed Human–Human Interaction (HHI) system has shown to identify complicated interactions based on the BIT-Interaction datasets. Although there is still debate in HHI studies, significant breakthroughs have been made. The most important contributions of the suggested system are as follows:
The proposed system utilises advanced methods, including the HSV transform and Gaussian filters, to enhance and extract valuable information from the frames.
A statistical approach is applied to precisely extract silhouettes from the processed frames.
Advanced techniques for feature extraction, like FAST and LIOP, are employed to extract informative features from the obtained silhouettes.
A fuzzy optimization-based approach is employed to discriminate effectively between different features. This approach optimizes the feature discrimination process, which was subsequently identified using the DNN method.
The research article is organized into the following sections: it provides a detailed literature review of studies in the HHI context. Then the focus is on the design and structure of the proposed system. It explains how to prepare the image dataset and the features that can be extracted to train the classifier. Following this, the findings of the experimental analysis and the current method, which encompass the level of precision and overall system performance in identifying different human motions, will be discussed. The research article aims to offer a concise discussion and a conclusion following an analysis of the content.
Related work
Unlike wearable activity and behavior recognition research focusing on sensors and kinematics (Hartmann, Liu & Schultz, 2023), the performance of vision-based activity recognition systems depends on two key factors: the features used in the framework and the incorporated recognition model. These are essential for accurately defining and describing the specific features of each activity. In previous literature, several works have defined different features and models that also highlight variations in the strengths and weaknesses of the model.
Wearable sensors and traditional machine learning based approaches
Köping, Shirahama & Grzegorzek (2018) built a model based on Support Vector Machines on a mobile device for activity recognition. The proposed framework and the application achieved an accuracy of 87.1% by using extracted features. Reliability was improved using linear discriminant analysis (LDA) and kernel principal component analysis (KPCA).
Manzi, Dario & Cavallo (2017) proposes an activity recognition system that employing depth camera skeleton data and various machine learning algorithms. It predicts them based on postures using a multiclass Support Vector Machine (SVM) and X-means algorithm. Another researcher devised an approach that tracked human activity using dynamic texture descriptors, reducing computational complexity. It operates on picture data and benchmarks with state-of-the-art picture retrieval and recognition techniques and employs the advances in computer vision (Xu et al., 2022; Shelke & Aksanli, 2019) method effectively integrates bright spaces by employing low- resolution data that is trained under Naive Bayes, Logistic Regression, Support Vector Machine, Random Forest, Decision Tree, and Artificial Neural Network the study found a 96% accuracy rate on UT-Interaction dataset. Zhang, Chen & Wang (2018) shows how machine learning models can successfully predict social dynamics in group settings, and their integration could assist in developing a more intelligent and adaptive interactive system that enhances communication among individuals. The study of interaction data identified key factors that influence effective collaboration.
Vision-based recognition and deep learning based approaches
Recently, CNNs and RNNs have shown great potential for recognition in humans due to advancements in deep learning some related work such as, Author proposed the limb direction cues (LDCs) aware network (LDCNet) model, which utilizes limb direction cues and differentiated Cauchy labels to suppress uncertainties and prevent overfitting in human pose estimation (Liu et al., 2024b), the EHPE model, incorporating joint direction cues and anisotropic Gaussian coordinate encoding to improve human pose estimation on infrared images (Liu et al., 2024a) and the author proposed the ARHPE model, addressing head pose estimation challenges by introducing asymmetric relation-aware representation learning with soft labels and Lorentz distribution to improve prediction accuracy, particularly in incorrect label scenarios, achieving superior results on public and infrared datasets (Liu et al., 2022). In addition, researchers have introduced various hybrid methods in studies to improve the accuracy of identifying human actions, like combining CNN with HMM. This configuration uses CNN to extract image features or HMM to model activity temporal information (Morales García, Henao Baena & Calvo Salcedo, 2023).
Moreover, deep learning has been key in providing excellent innovative applications for collaborative user experiences in virtual and augmented reality environments. In addition to the depiction of emotions, the photorealism of virtual objects has also been improved to a great level through the synthesis of high-resolution facial images. As an example, Lattas et al. (2020) have shown that generative adversarial networks can be used to recreate the entire facial reflectance and geometry of a single image, and generate avatars with intricate skin textures and light-mesh interactions that are no more difficult to achieve than with a lengthy scanning session. Additionally, deep learning algorithms have played a crucial role in analysing large interaction logs from social media platforms to understand how online interactions impactocial dynamics (Wang et al., 2024). Such capabilities enhance our understanding of HHI and offer practical means to improve the effectiveness of communication tools and social platforms, as well as foster interpersonal relations in both virtual and real-world settings.
Khodabandelou et al. (2023) present a deep learning algorithm based on fuzzy logic. This algorithm predicts users’ daily activities of lower limb exoskeletons by analyzing real-time locomotion data. It estimates gait mode transitions and assesses performance using dynamic data. However, the features utilized for the identification of human motion at the current stage include only a few, which are explained by the position of the skeletal joints (Liu et al., 2019) or motion trajectories, such technologies are usually exact, albeit not fully capable of encompassing all the discriminative data inherent in behavior. As a result of this shortcoming, our proposed algorithm is designed to enhance HAR, which is endowed with full-body texture and geometric attributes. The overall surface features of full-body texture are relatively continuous, and the fine-grain surface features, such as the cloth design and skin graininess, could be beneficial for activity recognition. Other geometric characters include the relationships between body parts, involving the presentation of structural features and body positioning during activities. Table S1 demonstrates that there is still weakness in predicting complex events.
Proposed system
To improve the accuracy and dependability of HHI systems, this research uses the Robust Model, a computational framework, to investigate and identify HHI. The four stages of the designed system include preprocessing methods such as frame enhancement, Contrast Stretching, and noise removal. A standard method for image processing involves combining a Gaussian filter with the Hue, Saturation, and Value (HSV) transformation. The statistical method is used for silhouette extraction. In image processing and visualisation, silhouette extraction is an essential step that finds and represents unique patterns or features in an image for further analysis and recognition. Oriented FAST and Local Intensity Order Pattern (LIOP) are a few of the feature extraction techniques that have been implemented. After fuzzy optimization then, the DNN classifier is used. The suggested HHI system’s architectural flow is depicted in Fig. 1 the system’s numerous components and their linkages are explained.
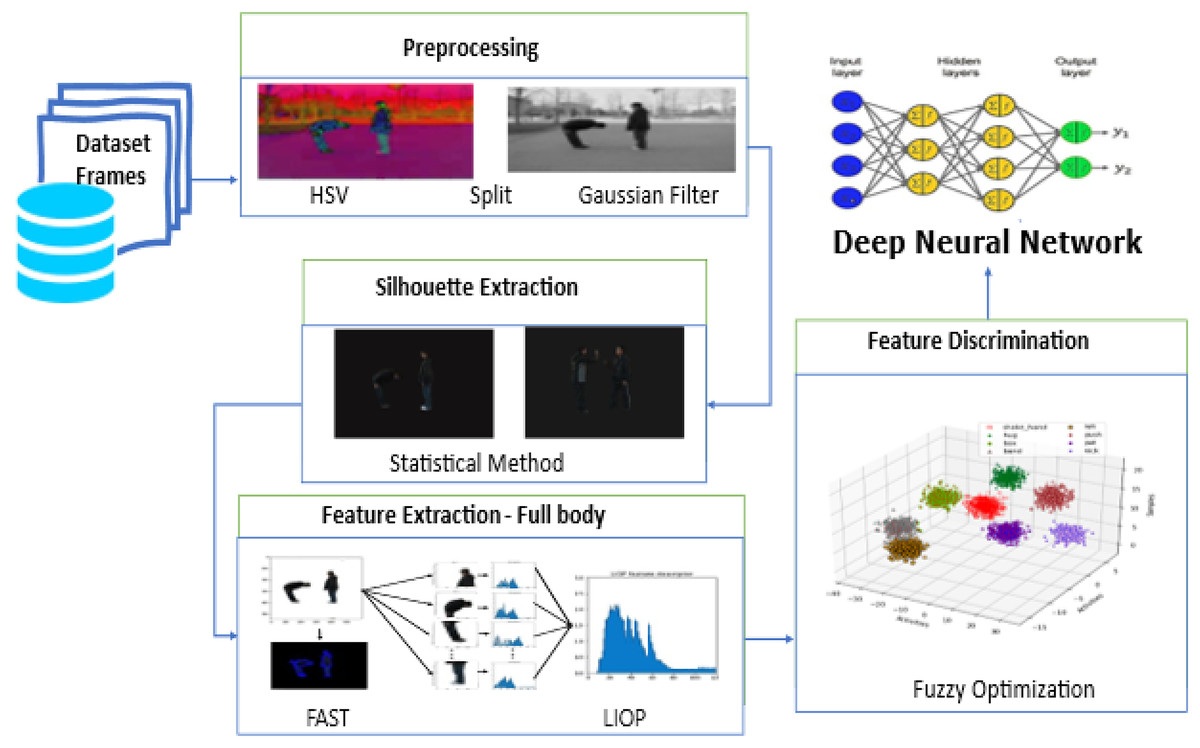
Figure 1: Our proposed HHI system architecture flow includes preprocessing data frames, silhouette and feature extraction, feature discrimination and Classification with DNN.
Preprocessing
Preprocessing plays a vital role in extracting pertinent features as disturbances in the input frames may result in unclear forecasts of human actions. Our study focuses on a specific preprocessing approach involving two main steps: (a) transforming colours to HSV and (b) selecting the best channel and using a Gaussian filter.
-
(A).
HSV
The HSV transformation improves the contrast of the frame. The HSV colour model breaks down the image into hue, saturation, and value components to enhance contrast perception. Enhancing colour selection and accuracy is achieved through this separation (Hassan & Gutub, 2022). The median filter is commonly employed for noise reduction, resulting in a sharper and more precise image by reducing noise and eliminating pixel irregularities.
(1)
Equation (1) Δ, Hue, Saturation, Value in which the RGB to HSV conversion is done, finds the maximum and minimum values of the Red (R), Green (G), and Blue (B) color bands. The interval between the largest and smallest values, namely Delta, gives information about the color intensity range.
(2)
Equation (2) Hue value is based on the maximum channel and considering the differences between the other channels.
(3)
Equation (3) Saturation is computed by considering the max channel and Delta value. Finally, the value component is set to the maximum channel. This transformation provides an alternative color representation defining their hue, saturation, and value/brightness characteristics. Results are displayed in Fig. 2A.
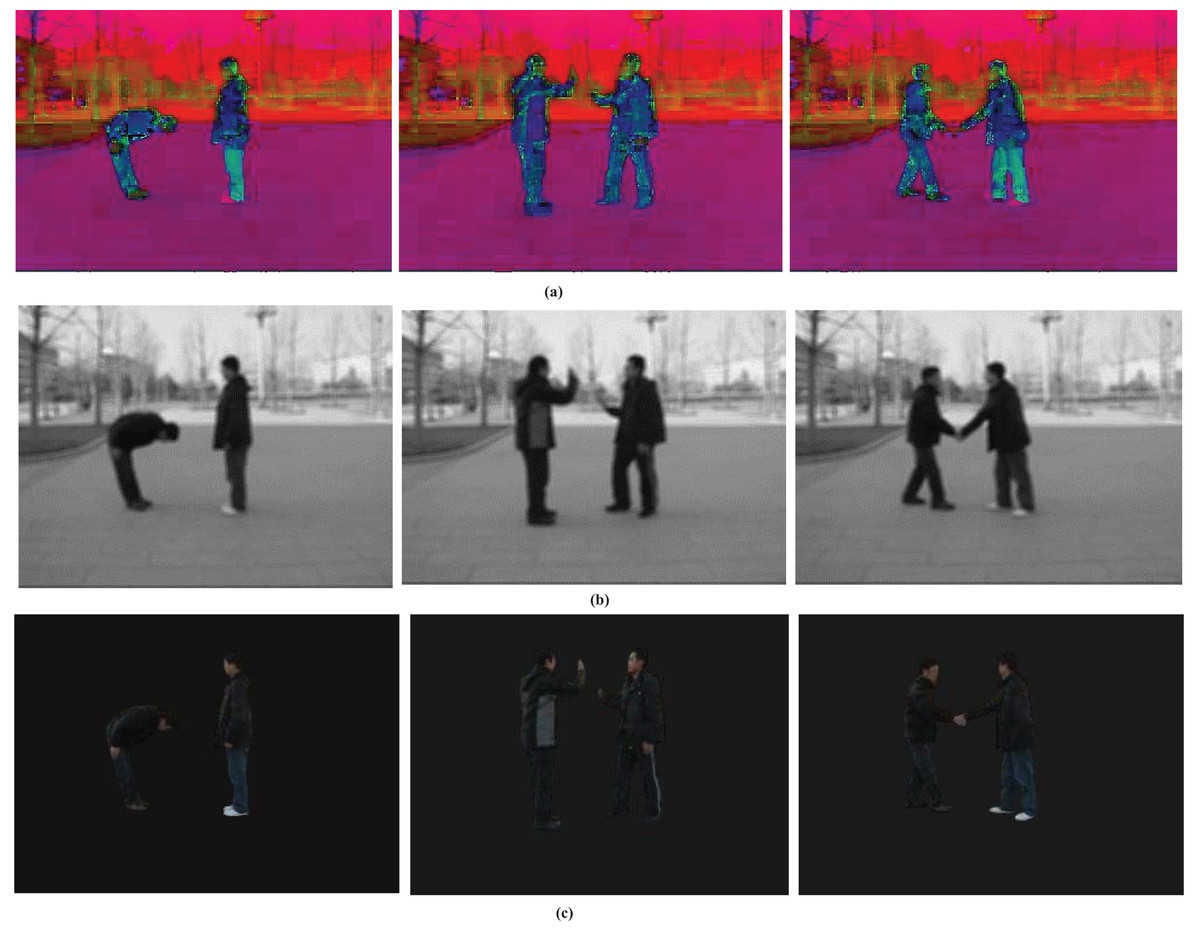
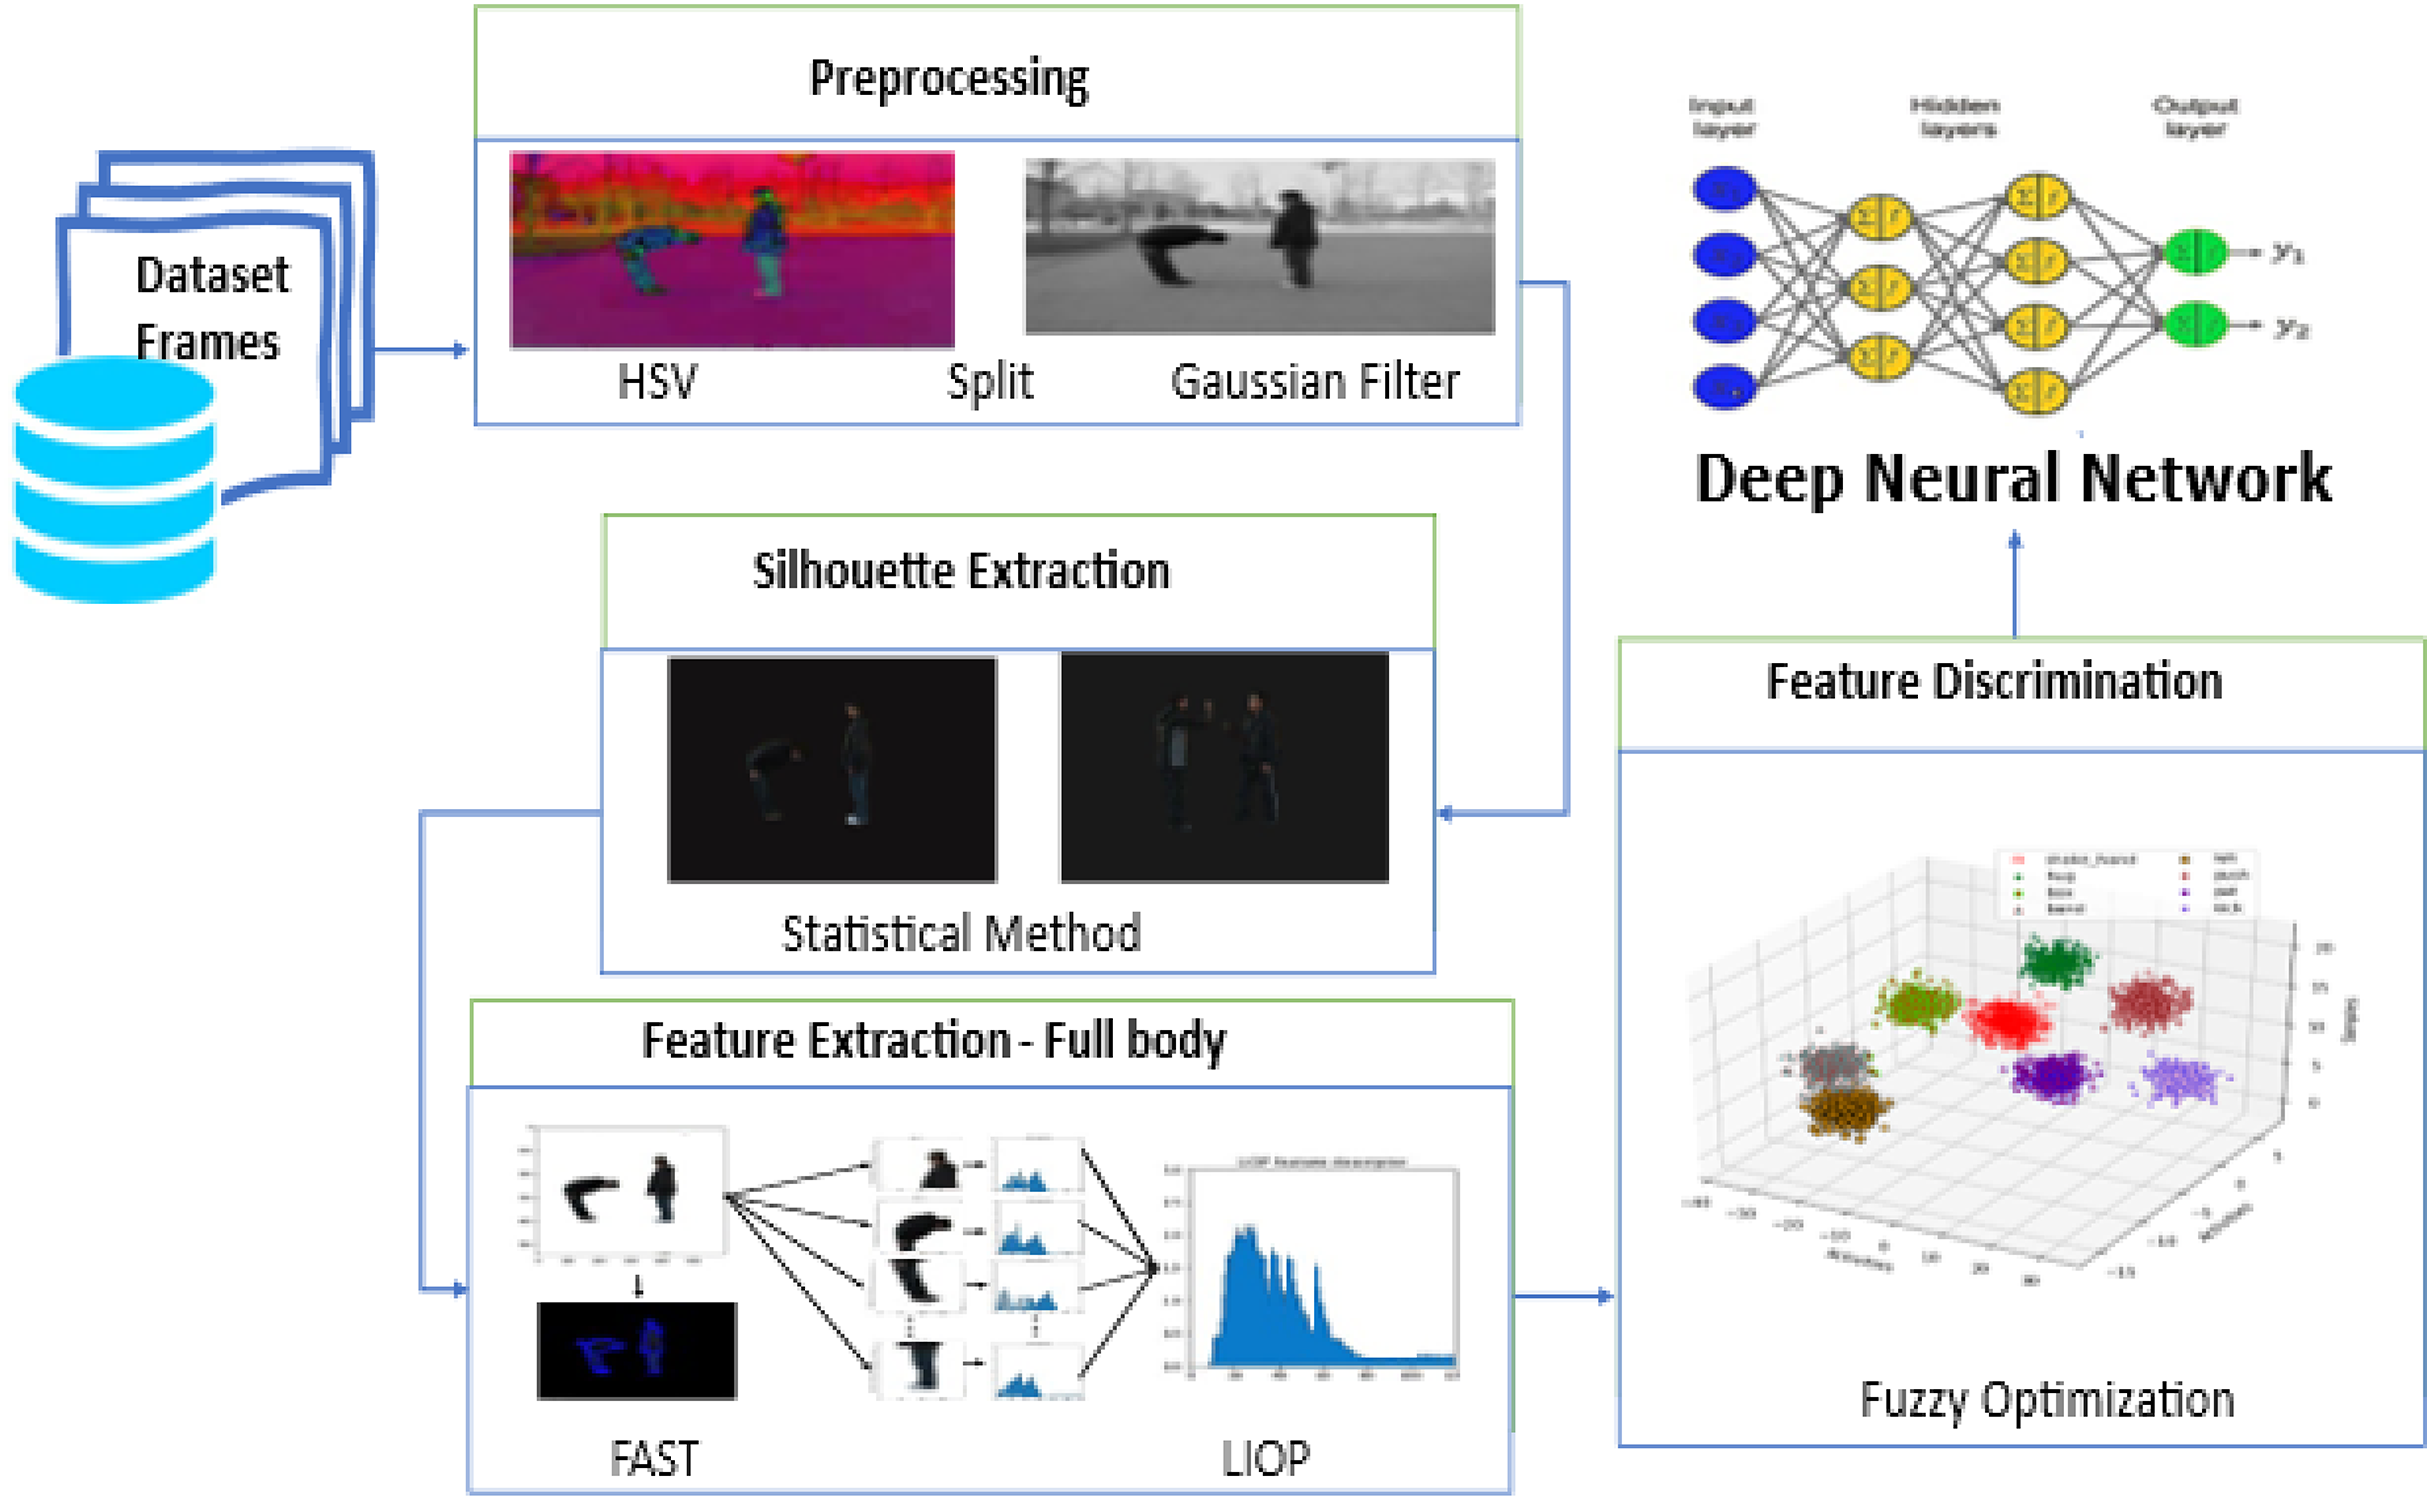
Figure 2: The part (A) obtained after the transformation of the HSV color model, depicts the effects, (B) Gaussian filtering applied to highlighting the improved contrast and reduced noise in the processed image (C) statistical model.
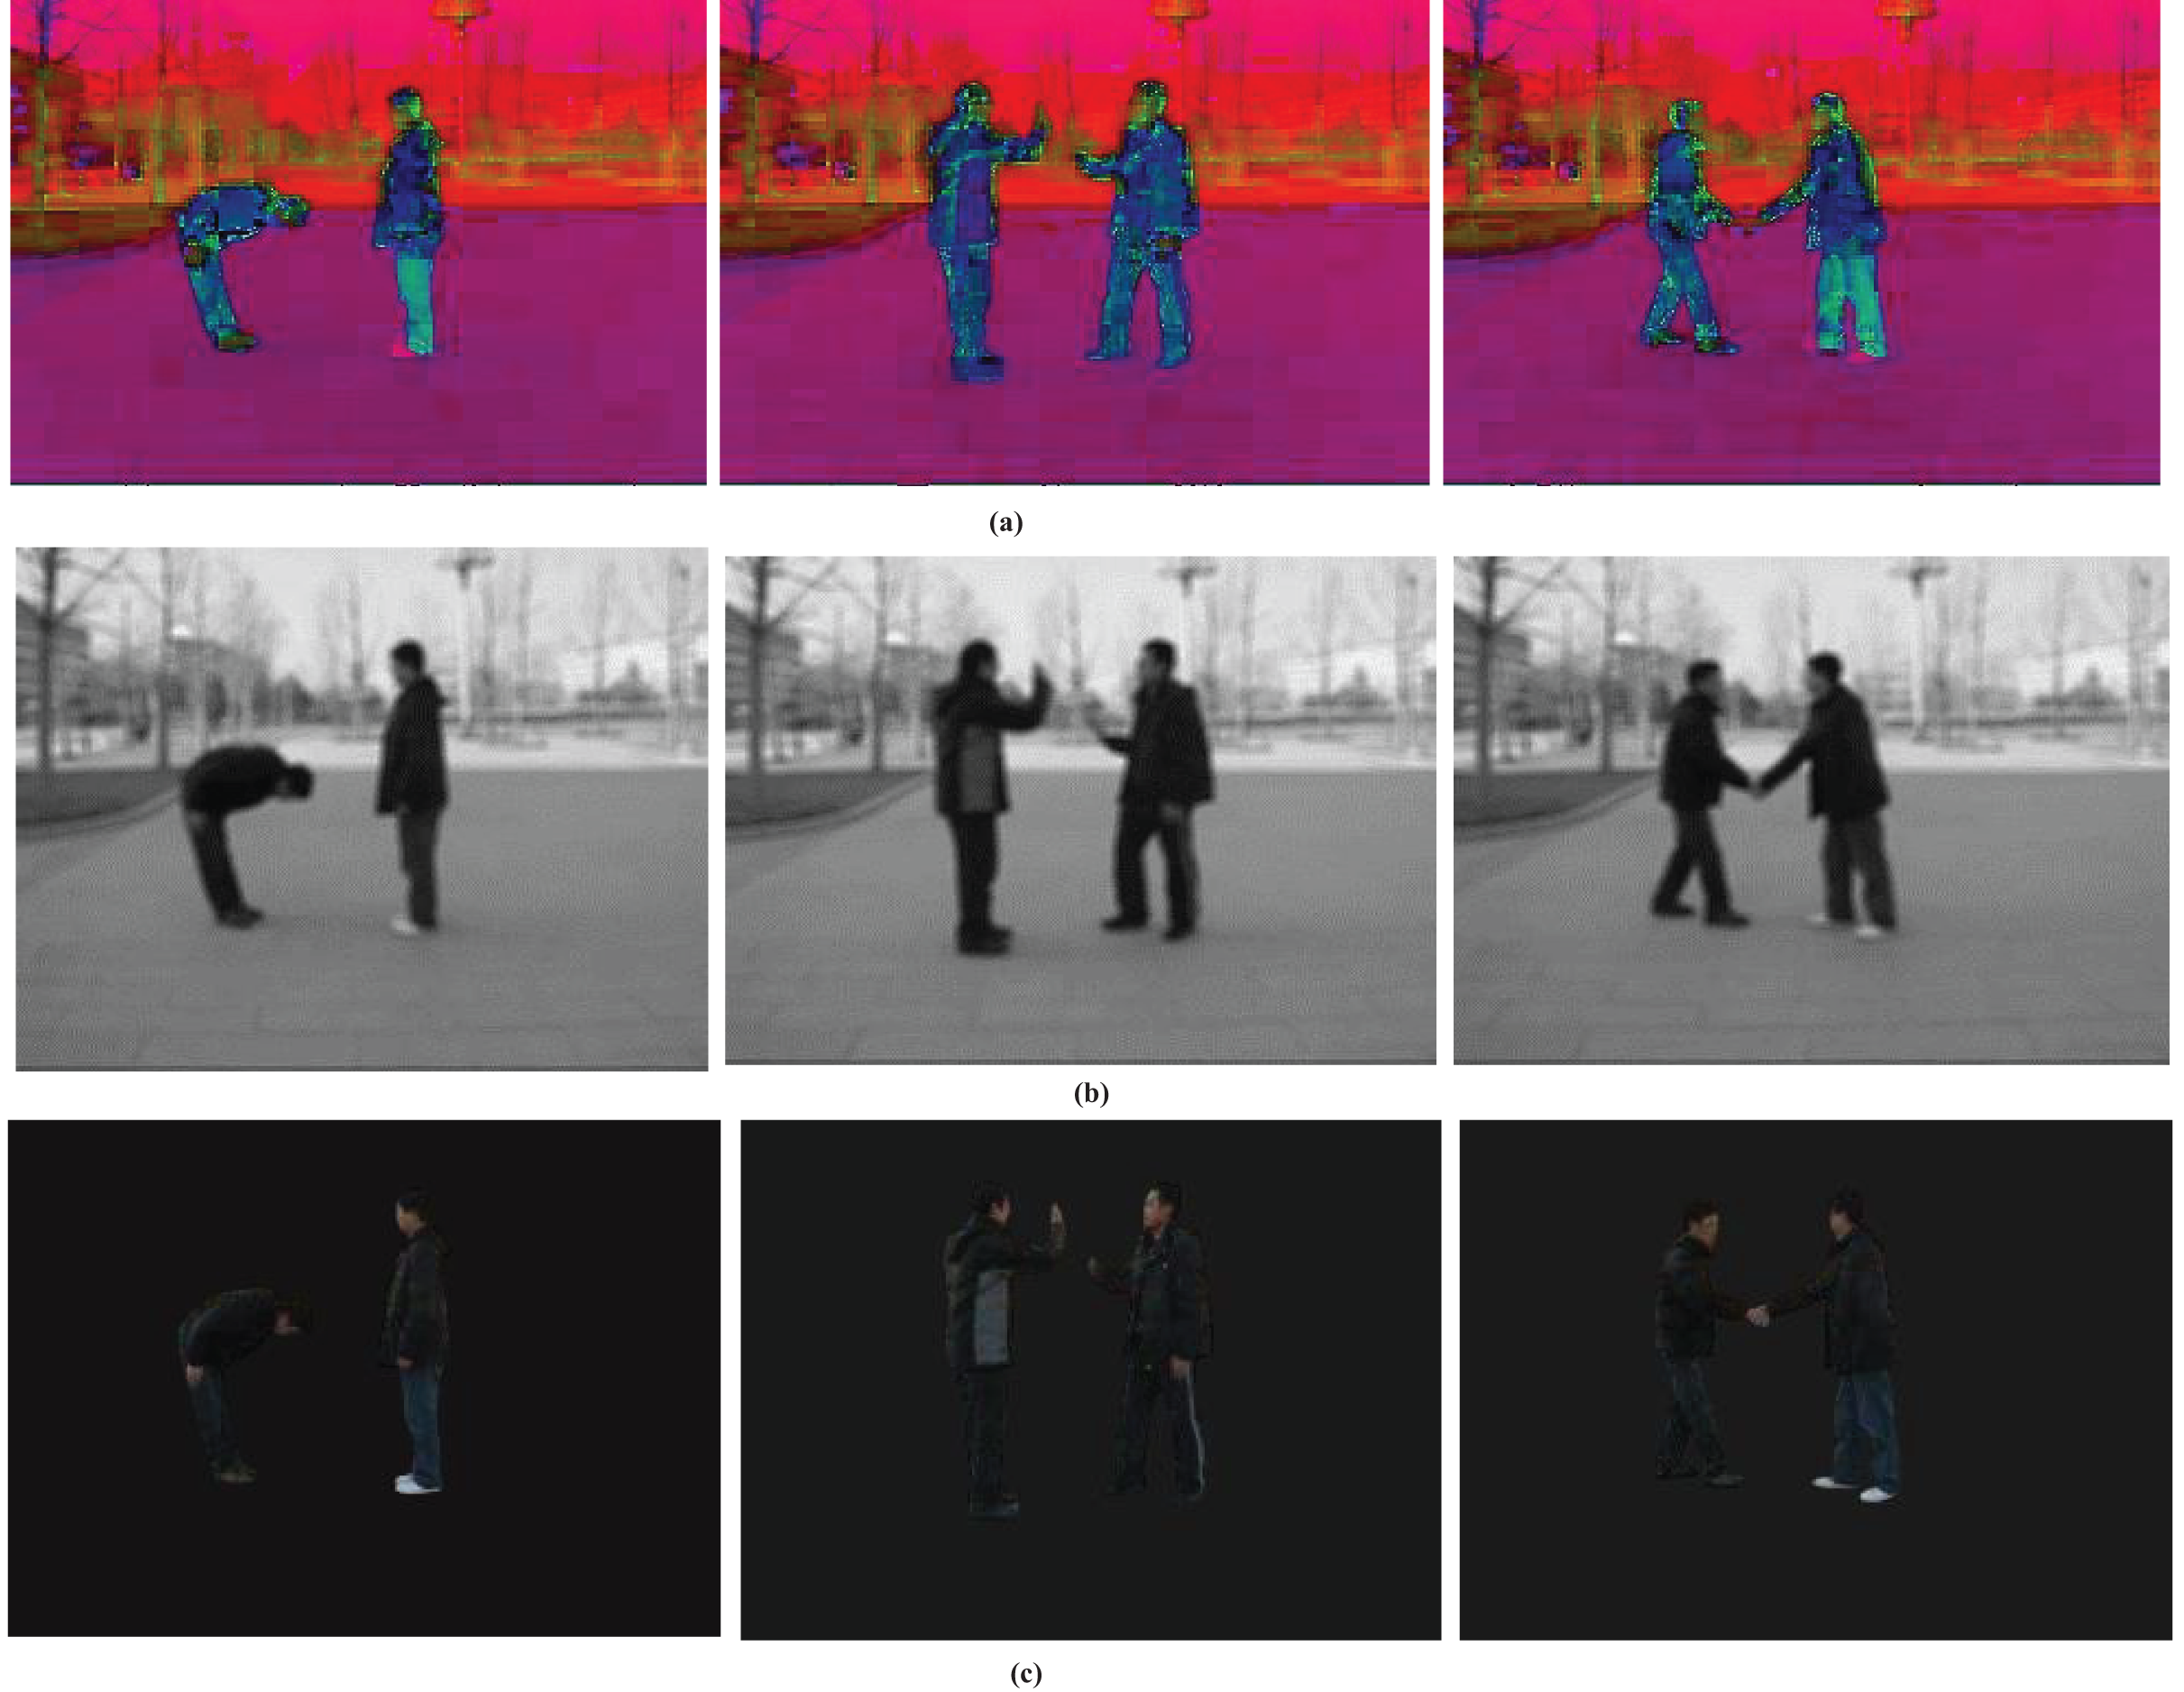
-
(B).
Gaussian filter
Gaussian filter is a frequently used image processing method in computer vision applications for image smoothing or blurring. The Gaussian function is the base, providing a bell-shaped curve for pixel weighting in an image. In our study, we processed the image data using the HSV transform with a Gaussian filter. The following equation can be utilized to represent the Gaussian filter:
(4)
Equation (4) shows the standard deviation of the Gaussian function, e is Euler’s number. The width of the Gaussian function, which is the standard deviation, is the most dominant parameter of the level of smoothing or blurring performed on the image. Figure 2B illustrates the results.
Table 1B shows the Peak Signal-to-Noise Ratio (PSNR) values of the noisy images and those filtered through a Gaussian filter. The PSNR metric compares image quality with a crank-out or perfect image. Image quality and noise is influenced by PSNR where higher PSNR values yield better predicted images. We have carefully analyzed the impact of the Gaussian filter’s standard deviation (σ) on the performance of the system. The parameter sigma determines the level of smoothing in the image during the Gaussian filtering process. To investigate this we tried various values of sigma and noted the impact on recognition accuracy and motion blurring. The results of these experiments are given in Table 1A.
| (a) σ (standard deviation) | Noise reduction (PSNR) | Recognition accuracy (BIT Dataset) | Recognition accuracy (SBU dataset) | Motion blurring observed |
| 1.0 | 24.3 dB | 92.50% | 85.00% | Minimal |
| 1.5 | 26.5 dB | 93.00% | 86.00% | Slight Blur |
| 2.0 | 28.3 dB | 94.00% | 87.00% | Moderate Blur |
| 2.5 | 30.2 dB | 91.00% | 85.50% | High Blur |
| (b) Level of Noise of (σ) | Original frame PSNR (dB) | Filtered frame PSNR (dB) | Improvement (dB) | |
| 10 | 24.3 | 29.5 | 5.2 | |
| 20 | 18.9 | 24.1 | 5.2 | |
| 30 | 18.4 | 23.6 | 5.2 |
Silhouette extraction
Silhouette extraction is the central requirement in the computer vision domain of object recognition, tracking, and segmentation (Kim, Jalal & Mahmood, 2019). The method of converting silhouettes into statistics is fast and accurate as required. Examples include the Gaussian Mixture Model, the Expectation-Maximization Algorithm, K-Means Cluster analysis, Mean Shift, Spectral analysis, and similar models. These fields include the ones that enable the partitioning of images, the recognition and identification of objects, and data processing/Analyses.
Algorithm 1 extracts the silhouette of an object from the image. A background subtractor of the GMM is applied, and the foreground mask is thresholded. When the average surpasses a specific limit, the mask is flipped and utilized to generate a binary image. The outline is presented against a black backdrop, while the initial image is displayed with the outline overlaid, and the results are shown in Fig. 2C.
| Input: Images |
| Output: Original image with silhouette overlay and silhouette image on black background |
| image ← read_input_image(); |
| gImage ← convert_to_gscale(image); |
| gmm ← initialize_gmm_background_subtractor(); |
| while True do |
| Mt ← GMM.apply(gImage); |
| µt←mean(Mt); |
| if µt > T then |
| Bt←threshold(Mt, T, 255, THRESH_BINARY); |
| Btinv ← bitwise_not(Bt); |
| St ← bitwise_and(image, image, mask = Btinv); show_image_on_black_background(St); |
| show_original_image_with_silhouette(image, St); |
| end |
| end |
| Return |
Process of feature extraction
I have used a combination of LIOP and FAST methods to extract features in the data to represent and characterise visuals and features effectively.
-
(A).
Features from accelerated segment test
Typically, feature detection algorithms identify unique points by searching for regions in an image with significant variation or contrast. The FAST algorithm performs by analyzing the pixel intensities in a circular neighborhood surrounding each pixel (Wang et al., 2023). It then computes the contrast between the central pixel’s intensity and the intensities of pixels on a circle with a radius of three around it. When a series of adjacent pixels on the circle have intensities either higher or lower than the central pixel by a particular threshold value, the central pixel is identified as a feature point.
(5)
Equation (5) central pixel being considered has an intensity . The intensity of a pixel in a circle around the central pixel is represented by . A threshold value is used to decide whether a pixel is a corner. If the intensities of pixels around the central pixel are more than t away from the central pixel’s intensity, the corner value is set to 1, otherwise it is 0, indicating a corner.
-
(B).
Local intensity order pattern
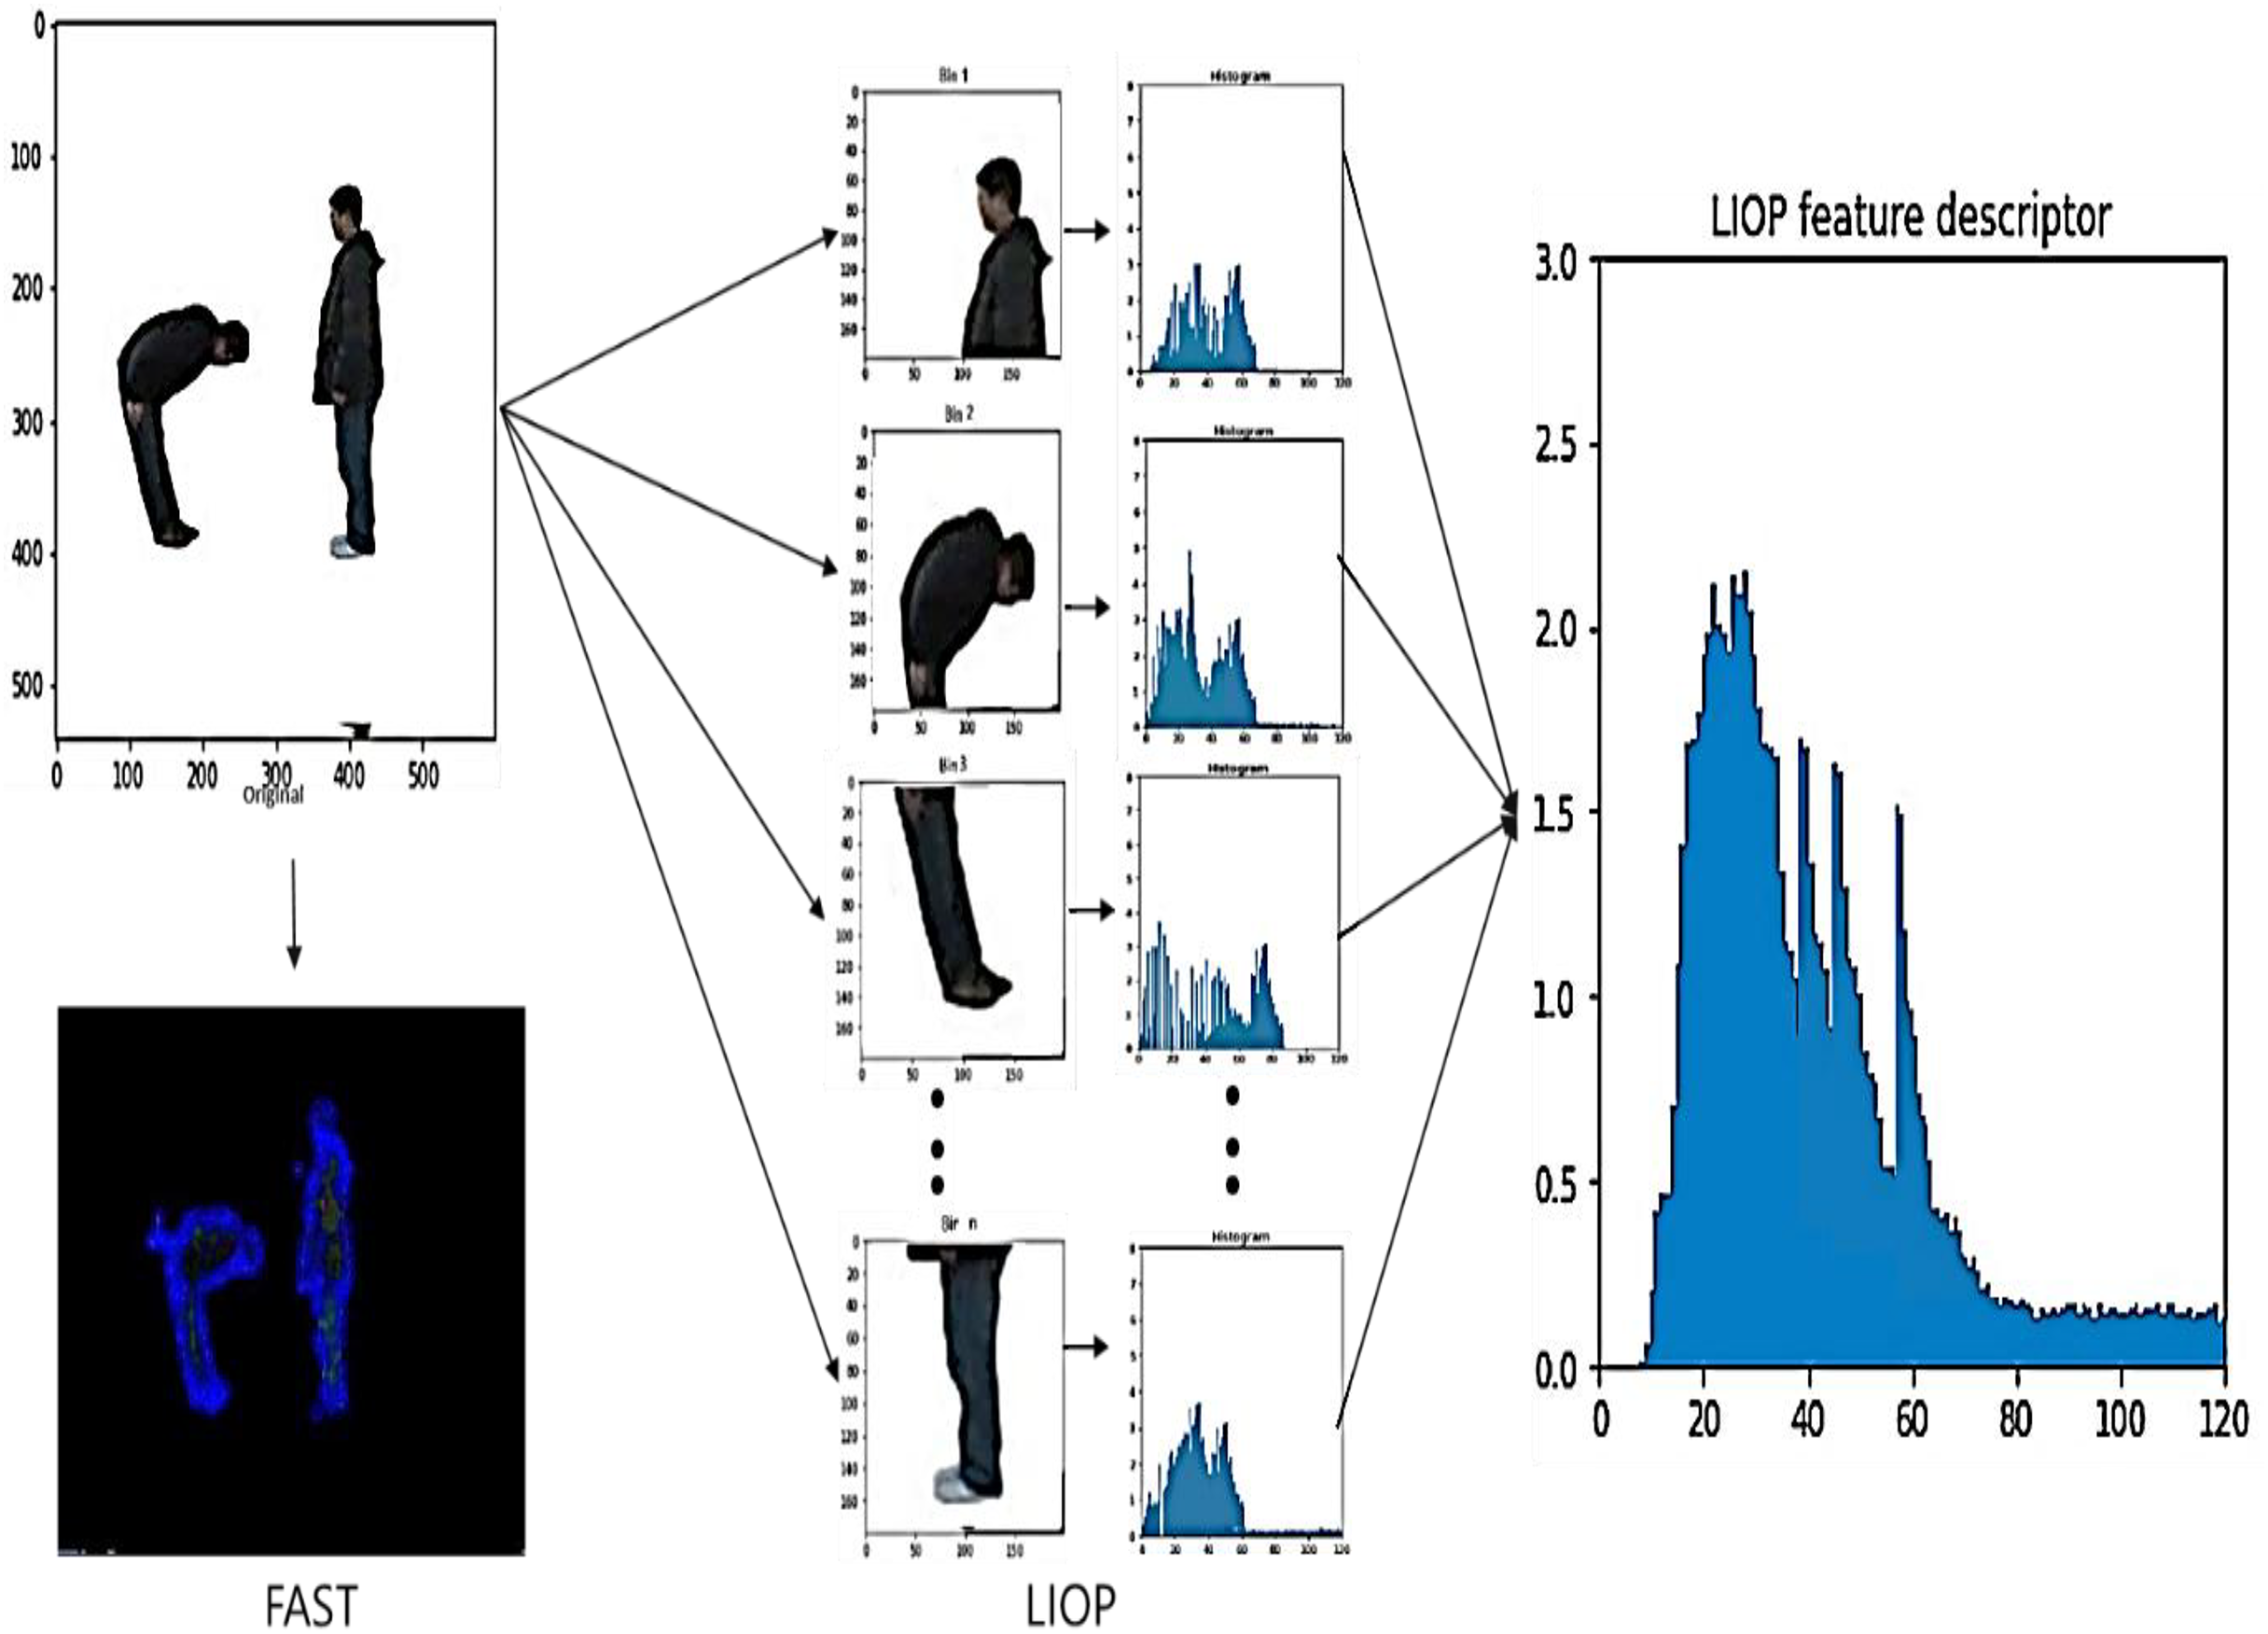
In Algorithm 2 LIOP descriptor is computed for each region by determining the LIOP value for every pixel in the region and combining them. After that, it combines the LIOP descriptors from all regions to get the LIOP feature vector for the whole image (Kalsum et al., 2021) . LIOP results shown in Fig. 3.
| Input: An input image I |
| Output: LIOP descriptors for the input image |
| Step 1: Extract patches of the input image; |
| patches ← extract_patches(I, patch_size); |
| Step 2: Normalize each patch using histogram equalization; |
| patchesnorm ← normalize_patches(patches); |
| Step 3: Divide the normalized image into regions; |
| regions ← divide_regions(patchesnorm, num_regions); |
| Step 4: Compute LIOP descriptors for each region; |
| liop_descs ← empty list; |
| foreach region in regions do |
| liop_desc ← empty list; |
| foreach pixel in region do |
| liop_val ← ∑P I(gi(p) > gc(p))2i−1; |
| liop_desc.append(liop_val); |
| end |
| liop_descs.append(liop_desc); |
| end |
| Step 5: Concatenate the LIOP descriptors for all regions; |
| Return liop_ features ← [LIOPD(Ri)NRi=1; |
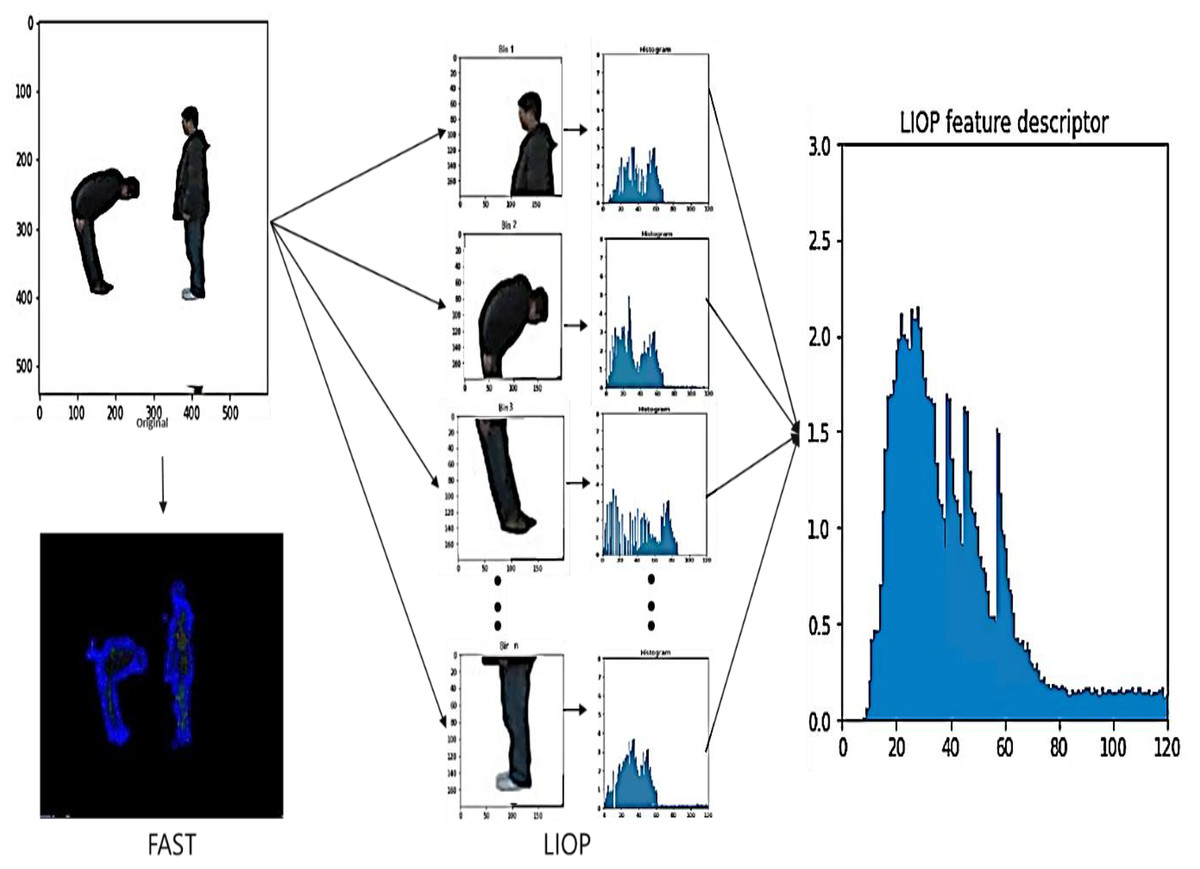
Figure 3: The Features extraction using LIOP results.
A hybrid approach was used to combine features extracted from FAST and LIOP. FAST provides robust feature points, especially corners and edges, which are important for capturing fine-grained details of human actions. Local intensity patterns are captured by LIOP, providing complementary information about the overall spatial layout of the scene. By combining these two techniques, we leverage the strengths of both: precise localization of FAST and rich spatial information of LIOP. This synergy allows us to extract a set of complete features that are insensitive to variations in lighting conditions, noise and occlusions.
Feature discrimination
One of the effective approaches to determining and selecting relevant attributes in complicated datasets is the use of feature discrimination with fuzzy optimization (Peng et al., 2024). This strategy considers temporal dynamics and the way the importance of a feature changes and overlaps with other features using fuzzy logic. This makes the assessment more complex than the standard binary approaches. Fuzzy optimization algorithms consider various parameters to effectively define an optimal feature set to separate classes or improve prediction. These factors are the value, association and the count of a feature. This strategy is quite handy in machine learning and pattern identification tasks. It is important to distinguish between the features that provide useful information and those that do not to build good models and make better decisions. Fuzzy optimization can reveal interesting information from complex data sets, improving the performance and interpretability of a model, as shown in Fig. S1.
(6)
Equation (6) where J is the objective function of the general feature subset quality maximization problem, FS(XI) is an evaluation measure on feature subset XI, and WI is the weight corresponding to each feature subset such that the sum of all weights is equal to 1, making it a legitimate fuzzy optimization problem.
Moreover, we compared fuzzy optimization to autoencoders, which are commonly applied to unsupervised feature extraction and dimensionality reduction. Autoencoders are feature compressors that map input data to a lower-dimensional space and reconstruct the data. Autoencoders are useful in dimensionality reduction, but they do not explicitly permit feature interpretation. Fuzzy optimization, however, offers a transparent process of discriminating features based on relevance, and is more human-interpretable since the decision-making process can be explained in terms of fuzzy rules. Table S2 gives a detailed comparison of fuzzy optimization and autoencoders.
Deep neural network
In our proposed approach, we mainly use DNNs for human activity recognition and architecture. They include a large number of simpler artificial neurons connected in series, each making simple calculations. Deep neural networks (DNNs) have proven to be highly effective in several fields, including but not limited to image processing, computer vision, and activity recognition.
-
(A).
Input layers
Input layers one of the primary layers in a DNN and are mainly a boundary layer that connects the model to the outside environment. It typically takes in the raw input data in image, text, or any other structured or unstructured data pattern. For the input layer, it is recommended that the number of neurons be equal to the dimension of the input vector. Every individual node computes a particular feature or attribute of the input. For example, if we are working on the image classification task, let each neuron be associated with the intensity of a pixel. At the core of operating the net is the essence of the input layer, which transmits the input data forward to the other layers.
The feature vector consists of each X_i representing the input image feature extracted by the Local Intensity Order Pattern (LIOP) and FAST. The initial input to the network is these features.
-
(B).
Hidden layers
They are involved in the process of extracting features from the data and learning high-level abstract features from the input data. Every single hidden layer contains multiple neurons, and the exact number of hidden layers and the number of neurons in each layer depend on the problem that must be solved. The neurons in the hidden layers apply functions that are used to transform the output from a linear form; this is important in helping the model deal with the complexity of the given data.
The input of the DNN is the extracted features from FAST and LIOP. They help learn discriminative representations for human activity recognition by providing useful information of local image details (FAST) and global motion patterns (LIOP). In a neural network, hidden layers represent the input data in a hierarch. In our particular case though, we feed the extracted features from FAST and LIOP directly to the DNN’s input layer. Finally, the DNN’s hidden layers learn to extract higher-level features from input features to classify human activities accurately.
Then, they have the hidden layers, which take the input feature through non-linear transformations to learn hierarchical representations. For each neuron o in a hidden layer, the output h_o is computed as
(7) where wc represent the connect input weight of to neuron o, is the neuron. ReLU, sigmoid, and Tanh activation functions are represented by f, where I represents the number of input features.
-
(C).
Output Layers
The output layer is the last layer of a DNN and posts out the model results or the predicted values. The number of neurons in the output layer depends on the problem that must be solved. For instance, in binary classification, the network might have one neuron that measures the probability of being in the class. At the same time, in the case of multiclass, a number of neurons would represent the probability of being in any of the classes. It is usually determined by the nature of the task and concerns only the neurons in the output layer. For example, the sigmoid or logistic function is typically used for binary classification purposes, while the softmax function is typically used for multiclass classification. In the context of the DNN, this final layer offers the final predicted outcome or result of the network by using the representations learned in the earlier hidden layer. Architecture is shown in Fig. S2.
(8)
In Eq. (8) is the sum og weighted class k, is the connecting weight of the ith hidden neuron to kth output class , is the term of bias for class k , m is the neurons in the last hidden layer and total number of class is represent by k.
The DNN classifier delivers multiple substantial advantages when used. The network conducts complex pattern recognition through activation functions supporting non-linear data relationship modeling. The end-to-end training method optimizes the entire feature extraction and classification system as one entity leading to an integrated precise model. The DNN classifier uses LIOP and FAST image features to identify human activities by predicting activity class probabilities in human activity recognition applications. The approach demonstrates powerful performance in our experiments by successfully applying to established recognition datasets.
Experimental analysis
In this article, we implemented DNN as a classifier to evaluate the effectiveness of the presented approach. The experiment was carried out very carefully, with all the steps executed correctly, and the resulting numerical data was subjected to detailed scrutiny.
Descriptions of dataset
This study has employed a unique set of videos frames, the BIT interaction dataset (Kong, Jia & Fu, 2012). These videos give examples of real people interacting with one another in multiple ways i.e., shaking hands, hugging, kicking, patting, pushing, giving high-fives, being in a band, and boxing. The videos are very sharp with a quality of 640 × 480 pixels. The total dataset is relatively large, consuming approximately 4.4 GB of storage.
Human interactions are also captured in the SBU Interaction dataset (Yun et al., 2012), a set of videos with RGB and RGB-D data. This involves 282 videos taken in indoor and outdoor settings. The videos are organized into eight interaction types: kick, pass object, push, approach, punch, handshake, hug, and depart.
Performance evaluation
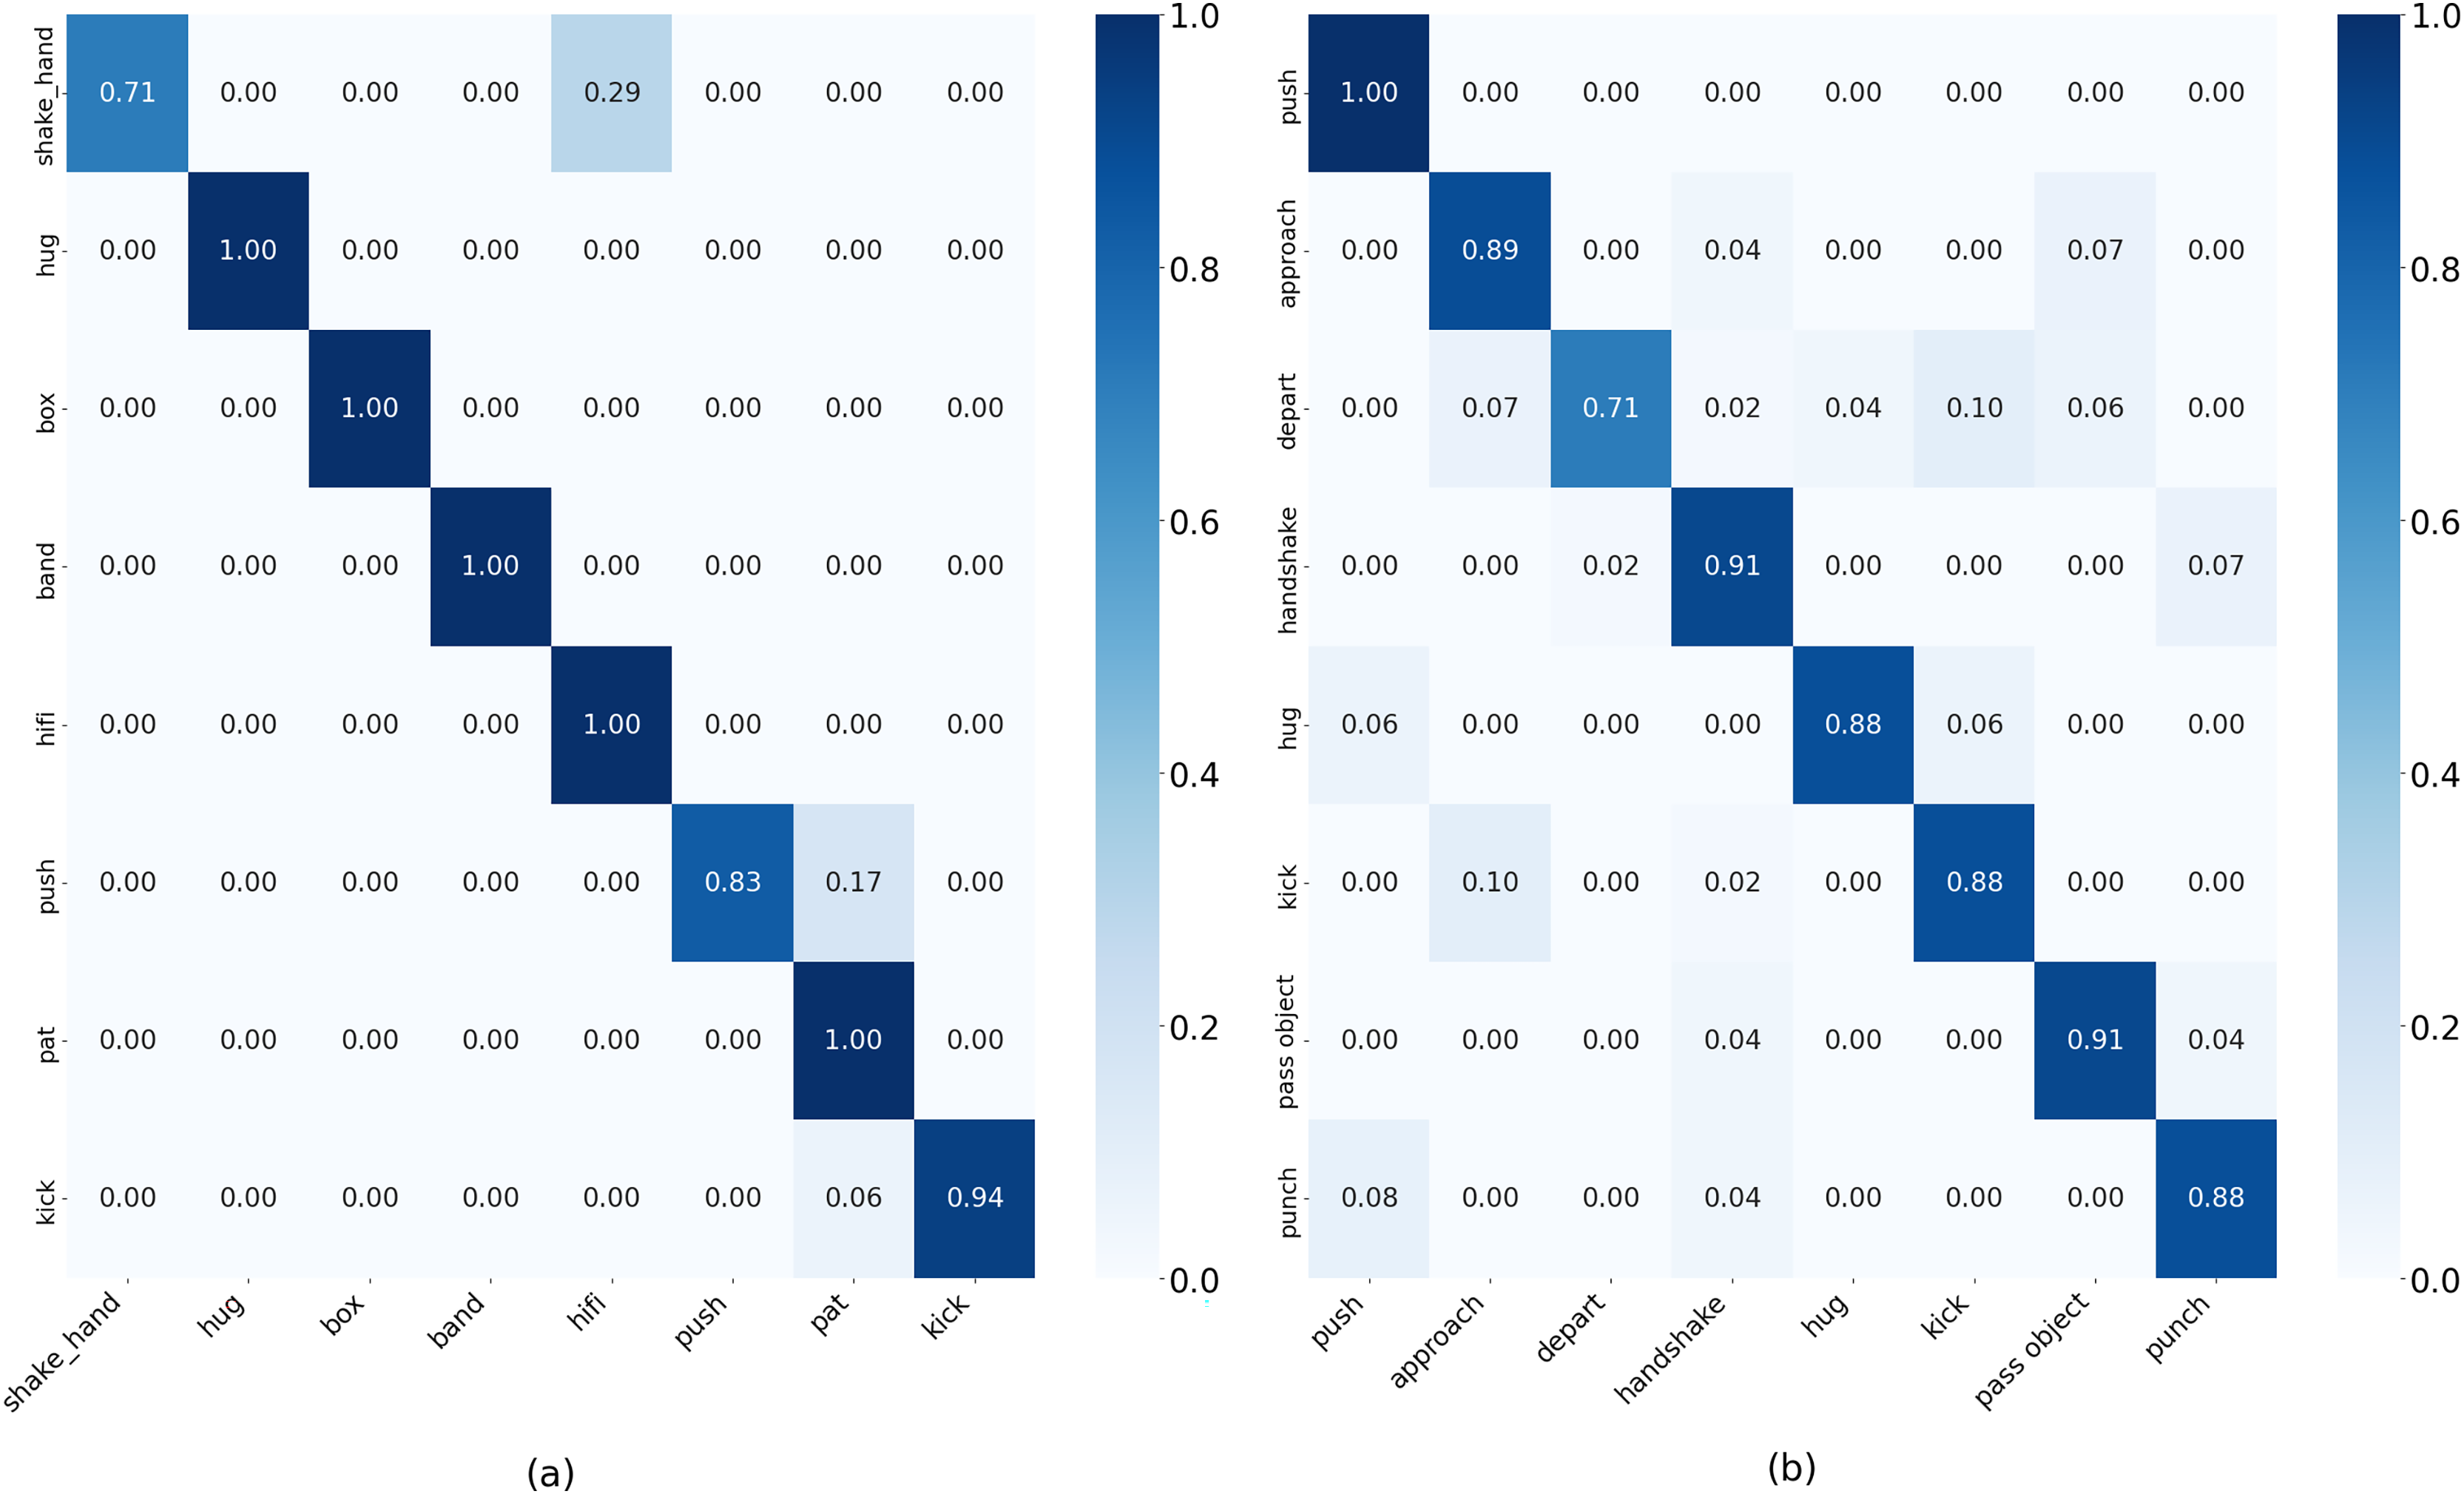
We tested the proposed method on the BIT-Interaction dataset, and it achieved 94% recognition accuracy using DNN. The confusion matrix in Fig. 4 verifies the DNN-validated classification performance. We validated the BIT interaction dataset of 400 videos with the SBU interaction dataset. When needed, multiple frames were extracted to increase the adequate size of the dataset for each video, and was treated as a separate training sample. We also defined the K-fold cross-validation technique, where K is the number of instances in the dataset, and each subject is tested only once. All processing was then run in Python on a Windows 11 with 32 GB of RAM, a Ryzen 7000 series processor, and an AMD Radeon graphics card.
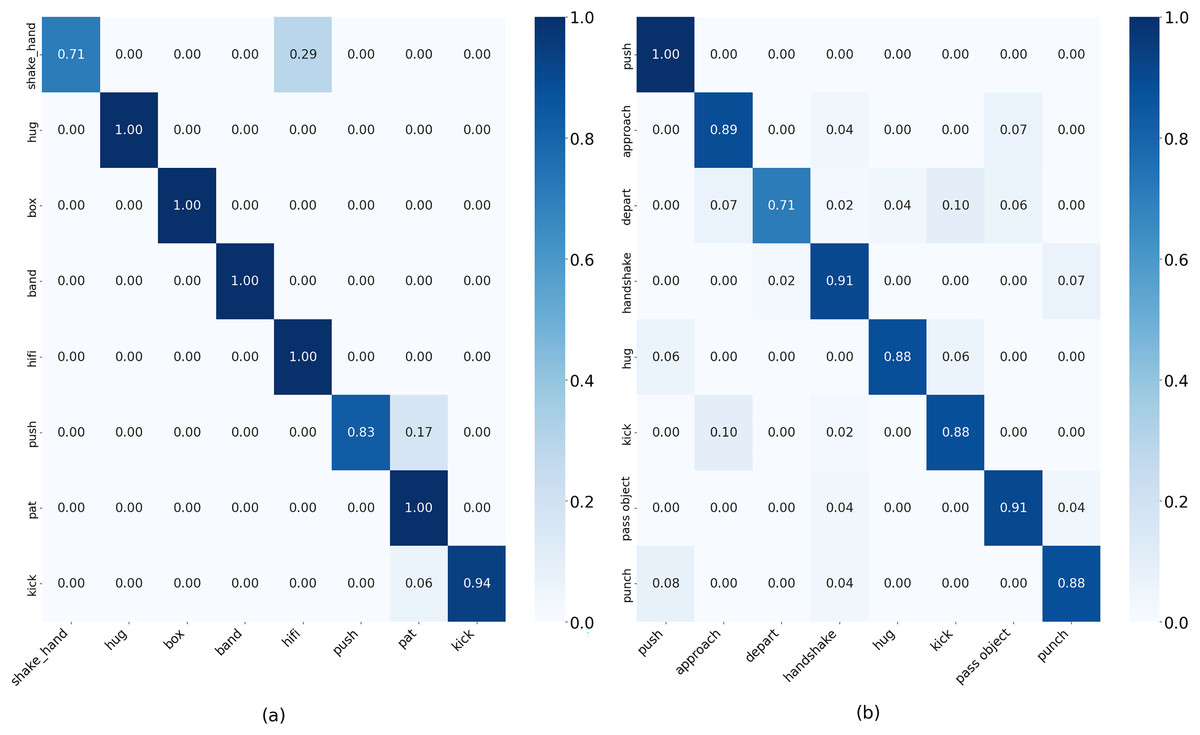
Figure 4: Confusion matrix result on (A) BIT-Interaction dataset. (B) SBU-Interaction dataset.
The performance of our system on the BIT interaction dataset was analyzed, and we achieved an overall accuracy of 94%. The model performs well and has excellent recognition rates for all eight interaction classes with F1-scores ranging from 0.83 to 0.99. For different interactions such as Shake_hands (0.71), hug, box, band, hifi, (1.00), punch (0.83), pat (1.00), and kick (0.94), our method achieved a high recognition rate. Table 2 and Fig. 4 show the results of SBU interaction dataset and the efficacy and resilience of our suggested approach for identifying human action in practical environments. Our system achieved an overall accuracy of 88.25% on the SBU interaction dataset. The model works well and achieves high recognition rates for all eight interaction classes, with f1 scores from 0.76 to 0.91. For various interactions, our method achieved a high recognition rate.
| BIT-Interaction dataset | SBU-Interaction dataset | ||||||
|---|---|---|---|---|---|---|---|
| Classes | Precision | Recall | F1-score | Classes | Precision | Recall | F1-score |
| shake-hand | 1.00 | 0.71 | 0.83 | Push | 0.62 | 1.00 | 0.76 |
| hug | 1.00 | 1.00 | 1.00 | Approach | 0.93 | 0.89 | 0.91 |
| box | 1.00 | 1.00 | 1.00 | Depart | 0.80 | 0.71 | 0.67 |
| band | 1.00 | 1.00 | 1.00 | Handshake | 0.82 | 0.91 | 0.87 |
| hifi | 0.80 | 1.00 | 0.89 | Hug | 1.00 | 0.88 | 0.83 |
| push | 1.00 | 0.80 | 0.91 | Kick | 0.94 | 0.88 | 0.87 |
| pat | 0.75 | 1.00 | 0.86 | Pass object | 0.72 | 0.91 | 0.81 |
| kick | 1.00 | 0.94 | 0.97 | Punch | 0.92 | 0.88 | 0.90 |
Ablation analysis of our proposed system components
We conduct an ablation study in Table 3 to assess our model by systematically removing one component at a time. The accuracy results for the BIT-Interaction and SBU interaction datasets are presented for each row, where each row presents the model with a specific element excluded. Finally, the table shows the importance of each element in achieving high accuracy.
| Experiments | Preprocessing | Silhouette extraction | Feature extraction | Fuzzy optimization | DNN | Sbu-interaction (%) | BIT-interaction (%) |
|---|---|---|---|---|---|---|---|
| Full Model | ✓ | ✓ | ✓ | ✓ | ✓ | 94.0 | 88.25 |
| Without preprocessing | ✗ | ✓ | ✓ | ✓ | ✓ | 87.4 | 85.7 |
| Without silhouette extraction | ✓ | ✗ | ✓ | ✓ | ✓ | 85.9 | 82.5 |
| Without feature extraction (no FAST & no LIOP) | ✓ | ✓ | ✗ | ✓ | ✓ | 88.2 | 84.8 |
| Without fuzzy optimization | ✓ | ✓ | ✓ | ✗ | ✓ | 89.1 | 85.3 |
| Without DNN | ✓ | ✓ | ✓ | ✓ | ✗ | 83.3 | 81.9 |
| Without preprocessing + Feature extraction | ✗ | ✓ | ✗ | ✓ | ✓ | 82.6 | 77.5 |
| Without preprocessing + Silhouette extraction | ✗ | ✗ | ✓ | ✓ | ✓ | 84.5 | 75.9 |
| Without preprocessing + Fuzzy optimization | ✗ | ✓ | ✓ | ✗ | ✓ | 81.3 | 82.7 |
| Without FAST | ✓ | ✓ | ✓ | ✓ | ✓ | 87.1 | 83.7 |
| Without LIOP | ✓ | ✓ | ✓ | ✓ | ✓ | 86.5 | 83.2 |
| PCA instead of fuzzy | ✓ | ✓ | ✓ | ✗ | ✓ | 89.3 | 84.9 |
| Without HSV (only Gaussian) | ✗ | ✓ | ✓ | ✓ | ✓ | 87.2 | 84.7 |
| Without Gaussian (only HSV) | ✗ | ✓ | ✓ | ✓ | ✓ | 85.4 | 86.7 |
Table 3 summarizes the average recognition accuracy when certain modules were removed or replaced. The conversion of RGB frames to HSV enhanced the accuracy by about 2 percentage points since the hue-saturation channels can reduce the effects of illumination changes. The elimination of Gaussian filtering led to a slight decrease (~0.5–1%), which means that noise reduction is useful in recognition but not essential on high-quality video. The exclusion of fuzzy optimization resulted in a less significant decrease (~0.5–1%) on BIT and a more significant decrease (~3%) on SBU, which indicates its significance in complex situations. Replacing fuzzy optimization with principal component analysis (PCA) or mutual information, we obtained only small improvements in accuracy (~1%), which proves that the fuzzy rule-based selection is more discriminative. Lastly, the removal of the FAST or LIOP descriptors separately led to a 3–4% reduction, which proves that the two descriptors are complementary.
We must consider their time complexity to speed up computer vision, machine learning, and deep learning tasks. The system’s inefficient operations are identified and how different techniques affect runtime is examined by computing time complexity. Data preprocessing is especially important in our systems to make our model function more efficiently. We use HSV and analyze its impact on the execution time of preprocessing and on the time complexity of key processes in our model (with and without application of HSV) and demonstrate that applying HSV in preprocessing can dramatically improve efficiency, making many processes S of interest for real time applications such as action recognition. Table 4 details the computational costs of each step of the proposed system.
| Process | Without HSV (time complexity) | With HSV (time complexity) | Execution time without HSV (s) | Execution time with HSV (s) | Reduction in time complexity |
|---|---|---|---|---|---|
| Preprocessing | N/A | O (n) | N/A | 0.1 | Improves efficiency by normalizing colors |
| Human detection | O (n log n) | O (log n) | 4.5 | 1.2 | Notable reduction in search space |
| Silhouette extraction | O (n) | O (log n) | 3 | 0.8 | Optimized edge detection |
| Feature extraction | O (n) | O (log n) | 2.8 | 0.6 | Faster feature computation |
| Fuzzy optimization | O (n2) | O (n log n) | 6.5 | 2.5 | Reduced redundant operations |
| Classification (DNN) | O (n log n) | O (log n) | 10 | 3.5 | Enhanced feature space processing |
We have performed an analysis of the computational overhead added by fuzzy optimization, particularly in terms of training and inference times. The findings, as indicated in Table S3, indicate the time complexity of the major components of the system with and without fuzzy optimization. The fuzzy optimization step adds further complexity, but the overhead is small relative to the accuracy benefits of better feature discrimination.
The additional overhead from fuzzy optimization is moderate compared to other system components, and it does not significantly slow down the real-time performance, as the system can still handle frame processing within 35 ms, which is suitable for surveillance applications.
Our system for identifying human action in complex environments works well and is compared with other state-of-the-art methods in Table 5.
| Dataset | Methods | Accuracy (%) |
|---|---|---|
| CNN (Jalal, Mahmood & Hasan, 2019) | 84.60 | |
| SVM (Kong, Jia & Fu, 2012) | 85.16 | |
| Co-LSTM (Shu et al., 2017) | 92.88 | |
| WHITE STAG (Mahmood, Jalal & Kim, 2020) | 87.5 | |
| Proposed | 94.00 | |
| SBU dataset | Contrast mining (Ji, Ye & Cheng, 2014) | 0.79 |
| Body-pose features with MIL (Yun et al., 2012) | 0.80 | |
| LSTM (Lejmi, Khalifa & Mahjoub, 2020) | 84.62 | |
| CHARM (Li et al., 2015) | 83.90 | |
| Deep LSTM (Zhu et al., 2016) | 86.03 | |
| Proposed | 88.25 |
We compare with the BIT interaction dataset, a reliable benchmark dataset for human activity recognition methods. Several approaches are listed in the table, including CNN, RNN, LSTM, SVM, Co-LSTM, and HMM, and they are tested on the same dataset to ensure they are fair. The performance of these methods varies, with LSTM-based methods achieving a maximum accuracy of 92.88% (Shu et al., 2017) (Co-LSTM) and 87.5% (Mahmood, Jalal & Kim, 2020) (WHITE STAG) and my proposed approach achieving 94.00% accuracy.
LSTMs are familiar with dealing with sequential data, but they are known to have longer training times and are not necessarily complex, as for our classification task, they do very little with temporal dependencies. Previous work, including (Zhang, Chen & Wang, 2018) and (Yoon et al., 2020), demonstrates that, in some classification scenarios, DNNs can outperform LSTMs due to their simple architecture and capability to learn non-linear relationships well. Complex architecture, including multiple gates and memory cells, results in excessive training time and high computational resource demand (Al-Selwi et al., 2023). Furthermore, although they were meant to overcome the vanishing gradient problem, the problem still rears its head in very deep networks or in long sequences (Al-Selwi et al., 2023). LSTMs are quite complex, and, especially when the data is small, have a tendency to overfit, as well as needing careful hyperparameter tuning; therefore, they aren’t as user-friendly. Finally, they may not be as adept at retaining information from very long sequences and are likely to be less effective for non-sequential data tasks, like which simpler models, such as deep neural networks (DNNs), may do better (Wang et al., 2024) . By focusing on these advantages and the particular circumstances of our study, we seek to demonstrate the strengths of our DNN approach clearly and convincingly. We tested our system in difficult situations like occlusion and synthetic noise to determine its robustness in Table S4. The SBU Interaction dataset was altered to create the effect of occlusion by covering some of the human body in the frames. In order to assess the generalization ability of the model, we performed cross-dataset validation by training the system on the BIT Interaction dataset and testing it on the NTU RGB+D dataset, which consists of more complex and varied human interactions. The findings shown in Table S5 indicate how the system generalizes to new and unseen data.
Conclusion and future work
In this research, we introduce a novel approach based on the fusion between fuzzy optimization methods and a DNN classifier for recognizing the human action. It involves preprocessing of features, extraction of silhouette, feature selection, and discrimination and achieves an impressive 94% recognition accuracy on the chosen data set. Finally, the DNN shows it is highly accurate in classifying actions, and the findings demonstrate that fuzzy optimization effectively improves feature selection. Practical applications like surveillance, human computer interaction, and video analysis can be serviced by this method. Future directions can be taken with increased advanced deep learning approaches, CNN’s and RNNs, and testing on a larger and more complex dataset to raise robustness and generalizability.