
Enhancing transparency understanding using machine learning and visual analytics
- Published
- Accepted
- Received
- Academic Editor
- Xiangjie Kong
- Subject Areas
- Human-Computer Interaction, Artificial Intelligence, Data Mining and Machine Learning, Data Science, Visual Analytics
- Keywords
- Natural language processing, Visual analytics, Machine learning
- Copyright
- © 2026 Fadloun et al.
- Licence
- This is an open access article distributed under the terms of the Creative Commons Attribution License, which permits unrestricted use, distribution, reproduction and adaptation in any medium and for any purpose provided that it is properly attributed. For attribution, the original author(s), title, publication source (PeerJ Computer Science) and either DOI or URL of the article must be cited.
- Cite this article
- 2026. Enhancing transparency understanding using machine learning and visual analytics. PeerJ Computer Science 12:e3513 https://doi.org/10.7717/peerj-cs.3513
Abstract
In today’s digital age, users are frequently confronted with lengthy terms and conditions documents associated with various products and services. Such documents often reference multiple entities (such as stakeholders, individuals, and users), with certain entities repeated throughout, underscoring their relative importance within the text. This study proposes a novel approach to facilitate the comprehension of terms and conditions by enhancing the detection and weighting of entities, as well as identifying relationships among them. By leveraging machine learning techniques (particularly natural language processing (NLP)) in conjunction with visual analytics, we aim to improve transparency and accessibility. Furthermore, we present an improved version of TranspVis, a visual analytics system to provide a more intuitive representation of transparency-related information. The proposed approach is evaluated through a combination of case studies and user experiments, offering a comprehensive assessment of its utility in rendering complex legal documents more interpretable. The findings underscore the potential of such tools to support large-scale applications in legal domains, with expert feedback affirming the value and relevance of the proposed solution.
Introduction
The growing dependence on digital services has intensified interactions between users and software systems that process personal and sensitive information. Within this context, terms and conditions of use represent a critical component, as they specify obligations related to security, privacy, and regulatory compliance—collectively known as transparency requirements. However, these documents are typically lengthy and complex, making it difficult for users to understand how their data are managed and shared. For instance, platforms such as Facebook and WhatsApp include extensive legal clauses on data collection, behavioral tracking, and third-party sharing, often written in highly technical language. Similarly, Amazon’s privacy policies describe multiple layers of data processing and consent mechanisms that are challenging for non-expert users to interpret. This lack of clarity frequently undermines trust and hinders users from making informed decisions about whether to accept or reject specific service conditions (Lie et al., 2022).
Transparency studies seek to promote the open exchange of information between system providers and users. To structure these efforts, Hosseini et al. (2016) introduced the Transparency Modeling Language (TranspLan), which organizes transparency requirements into three core components: stakeholders, information elements (data, policy, and process), and their interrelationships. This framework supports compliance, accountability, and user trust by clarifying how transparency is achieved within software systems.
However, applying TranspLan remains challenging for non-expert users, as it requires substantial manual effort and domain expertise. The language includes three complementary components—the Shield Diagram for visualizing information exchanges, the Infolet Specification for describing information elements, and the SitReq Specification for defining stakeholders’ transparency requirements. While these models provide a comprehensive formal structure, their complexity limits usability for broader audiences. For instance, when applied to large-scale privacy policies such as those of Facebook or WhatsApp, modeling each stakeholder and data exchange manually becomes time-consuming and impractical.
The Infolet and SitReq specifications operate in a complementary manner within the TranspLan framework to provide a complete representation of transparency requirements. The Infolet defines the characteristics of a specific information element—its type, description, source, and related stakeholders—while the SitReq specifies how that information element is used or exchanged by each stakeholder, including the nature and obligation level of the relationship.
For example, in the context of Amazon Web Services (AWS), the Infolet describing Personal Information outlines the data content (e.g., name, email, and billing details), its creator (Customer), and its receivers (AWS Account Management Team). The corresponding SitReq entry for the same stakeholder (Customer) specifies that the user must provide this personal information to access AWS services, classifying the requirement as Optional and the transparency type as Data. Together, these two specifications capture both the structure of the information element and the behavioral relationship governing its exchange, thereby supporting a holistic understanding of transparency within the system.
To mitigate these challenges, information visualization (Liu et al., 2014) offers a powerful solution for developing visual representations using established visualization techniques. To this end, TranspVis (Fadloun et al., 2022) was introduced as an information visualization tool that translates abstract transparency constructs into interactive diagrams. It enables users to explore transparency requirement components more intuitively, simplifying interpretation without requiring deep familiarity with the underlying formal models.
Nevertheless, TranspVis still depends on manual data entry, requiring users to read and extract transparency requirements directly from lengthy and complex legal documents. This process is labor-intensive and prone to human error, particularly as terms and conditions continue to expand in size and detail. In the broader context of large-document analysis, visual analytics has proven highly effective in enabling users to navigate, summarize, and interpret extensive textual corpora through interactive visual representations (Liu et al., 2014; Keim et al., 2008; Osman & Zalhan, 2016). Existing tools in document visual analysis focus primarily on topic modeling, entity mapping, and semantic exploration, yet few address transparency-related or regulatory contexts.
Meanwhile, recent advances in machine learning (ML) and natural language processing (NLP) have demonstrated strong capabilities in automating information extraction tasks—such as named entity recognition, relation detection, and document summarization (Khan et al., 2016; Rao et al., 2022). However, the integration of these intelligent techniques with visual analytics for legal and compliance documents remains limited. Bridging this gap, our work aims to combine ML-based NLP with visual analytics to automatically extract, interpret, and visualize transparency components, thereby improving both the accessibility and scalability of transparency modeling.
To this end, recent work by Fadloun et al. (2023) proposed the use of ML techniques to automatically extract information elements from software policies. However, several aspects still require further development, including integration with the TranspVis tool, the ability to toggle between automatic and manual selection modes, and the exploration of additional transparency requirement components.
In this study, we present an extended framework that integrates machine learning–based NLP with visual analytics to facilitate the automatic extraction and visualization of transparency requirement components. The proposed approach builds upon TranspVis by embedding intelligent modules for identifying stakeholders, information elements, and relationships within legal documents, as well as assigning importance weights to both information elements and stakeholders. This integration aims to enhance the understanding of transparency requirements, support compliance analysis, and ultimately foster greater trust in data-intensive systems. The enhanced tool is designed to be accessible to both expert and non-expert users.
The remainder of this article is organized as follows. The next section reviews related work on software transparency, natural language processing, and visual analytics. The subsequent section outlines the requirements identified for enhancing the TranspVis framework. This is followed by a description of the proposed system’s design and implementation, including the development of NLP models for entity and relation extraction. The following section reports on the experimental setup, evaluation metrics, and key findings. Finally, the article concludes by summarizing the main outcomes and suggesting directions for future research.
Background material
Natural language processing
NLP is a field of study that focuses on the interaction between computers and human language. As such, NLP involves the development of algorithms and computational models capable of processing, analyzing, and understanding large volumes of natural language data (Liddy, 2001). NLP is grounded in three fundamental components: Natural Language Understanding (NLU), Knowledge Acquisition and Inferencing (KAI), and Natural Language Generation (NLG). These elements collectively enable machines to comprehend, reason over, and produce human language in meaningful ways. NLU inspects the meaning of the spoken aspect of human language via syntactic, semantic, and pragmatic analyses. KAI then generates responses while addressing the undetermined inference problem in ML and AI, whereas NLG converts those responses into text and generates a nearly human-like answer (Lee, 2023).
The growing availability of large-scale textual data has dramatically increased the importance of NLP, driving its use across numerous applications. Essential language elements—such as named entities, sentiments, relations, and events—play a critical role in understanding meaning and context within text (Lee, 2023; Chowdhary, 2020).
In this work, we focus on named entity recognition (NER) and relationship detection. Various machine learning approaches are used to detect entities and their interrelations (Satheesh et al., 2020; Lin et al., 2022; Garrido-Merchan, Gozalo-Brizuela & Gonzalez-Carvajal, 2023; Habbat, Anoun & Hassouni, 2022; Smagulova & James, 2019; Li, Zhan & Li, 2018). For example, BERT-based models (Garrido-Merchan, Gozalo-Brizuela & Gonzalez-Carvajal, 2023; Devlin et al., 2019; Liu et al., 2019) are widely adopted for entity identification and semantic extraction, while LSTM architectures (Smagulova & James, 2019) have proven effective for relational inference through sequential data processing.
Visual analytics
Visual analytics plays a pivotal role in enabling human understanding of complex data through interactive visual representations (Wong & Thomas, 2004). Researchers have applied these methods across domains such as cybersecurity, data privacy, and social networks, emphasizing the need for interpretability and transparency in data systems.
For instance, Zhang, Zhang & Zhang (2019) developed a visual analytics framework for large-scale network topology analysis to identify system vulnerabilities. Similarly, Wang et al. (2020) introduced GraphProtector, a visual analytics tool that enhances user privacy in social networks using K-anonymity–based anonymization. In the domain of privacy-preserving visualization, Chou, Wang & Ma (2019) integrated data mining and visualization to monitor and enforce anonymization policies.
Despite progress in these domains, policy visualization (particularly for privacy and transparency) remains underexplored. Existing systems such as those by Ghazinour, Majedi & Barker (2009), Ghazinour & Albalawi (2016) and Jutla, Bodorik & Ali (2013) provide foundational approaches, but they often feature static interfaces and limited interactivity, restricting usability for broader audiences.
Transparency requirements
Transparency refers to the open flow of high-quality information among entities in a digital ecosystem. In software systems, this means making decision-making processes, data flows, and stakeholder interactions visible to users and developers alike (Hosseini et al., 2016).
To formalize transparency modeling, Hosseini et al. (2018) introduced the Transparency Modeling Language (TranspLan). This framework integrates key entities—stakeholders, information elements (Data, Process, and Policy), and their relationships (Production, Obligation, Optionality, and Undecidedness)—to offer a holistic view of transparency.
Building on this foundation, several extensions have been proposed:
Cetinkaya & Hosseini (2021) developed TranspLanMeta, a metamodel-based extension that formalizes TranspLan into a machine-readable structure, implemented using the Generic Modeling Environment (GME). – Fadloun et al. (2022) introduced TranspVis, a visualization framework translating transparency constructs into interactive diagrams for improved interpretability. – Fadloun et al. (2023) further enhanced TranspVis by integrating machine learning models (Naïve Bayes, BART, LSTM) for automatic extraction and labeling of transparency-related elements from legal texts.
Building on these advancements, the current version of TranspVis extends automation to include the extraction of stakeholders and relationships among transparency entities through advanced NLP-based models, thus evolving from a manual visualization tool to a hybrid intelligent framework.
As summarized in Table 1, the evolution of transparency modeling frameworks shows a clear progression from formal and manual specification toward intelligent, automated systems. Overall, TranspVis has evolved from a manually driven visualization system into a hybrid intelligent framework that combines machine learning, NLP, and interactive visualization. This evolution enhances scalability, interpretability, and efficiency, transforming TranspVis into a comprehensive tool for transparency analytics capable of supporting both experts and end-users in understanding complex digital policies and systems.
| Study | Approach | Viz Tool | ML Detection | Auto. | Manual | ||
|---|---|---|---|---|---|---|---|
| IE | Stake. | Rel. | |||||
| Hosseini et al. (2018) | TranspLan | No | No | No | No | No | Yes |
| Cetinkaya & Hosseini (2021) | TranspLanMeta | Partial | No | No | No | Partial | Yes |
| Lie et al. (2022) | AppTrans | No | No | No | No | Partial | Yes |
| Fadloun et al. (2022) | TranspVis v1 | Yes | No | No | No | No | Yes |
| Fadloun et al. (2023) | TranspVis v2 | Yes | Yes | No | No | No | Yes |
| This work | TranspVis v3 | Yes | Yes | Yes | Yes | Yes | Yes |
Requirements analysis
A comprehensive set of system requirements was developed through an iterative, expert-informed process. Initial requirements were gathered via semi-structured interviews with domain experts in transparency, law, and computer science. These discussions focused on identifying practical challenges faced during transparency analysis and potential opportunities for automation. The preliminary list was then refined through follow-up review sessions, where experts validated, modified, and prioritized the proposed requirements to ensure they accurately reflected real user needs and could be generalized to similar contexts. The finalized set of requirements is presented below:
R1: Automatic stakeholder extraction. Manually identifying stakeholders can be tedious and error-prone, especially for non-expert users. Incorporating machine learning techniques enables automatic stakeholder extraction, making the system more accessible and efficient for both experts and general users.
R2: Automatic relationship prediction. Determining relationships between stakeholders and information elements is complex and time-consuming when done manually. Integrating machine learning allows automatic detection of these relationships, significantly simplifying the analytical process.
R3: Weight calculation. Different stakeholders and relationships carry varying levels of importance. Introducing a weighting mechanism—based on contextual and frequency-based indicators—helps prioritize key elements, enhancing the depth of transparency analysis.
R4: Expert assistance. To refine and validate automated outputs, TranspVis should allow experts to review, edit, and enrich the underlying database using their domain knowledge, ensuring the continuous improvement of R1–R3 functionalities.
Proposed framework for transparency requirements analysis
As illustrated in Fig. 1, the workflow begins with the terms and conditions documents of software applications as input1 . These documents are first cleaned and pre-processed to convert the unstructured text into a structured format suitable for analysis. The annotated dataset is then used to identify stakeholders mentioned within each line of text. Four different models are subsequently applied to extract entities and stakeholders from the processed text (R1).
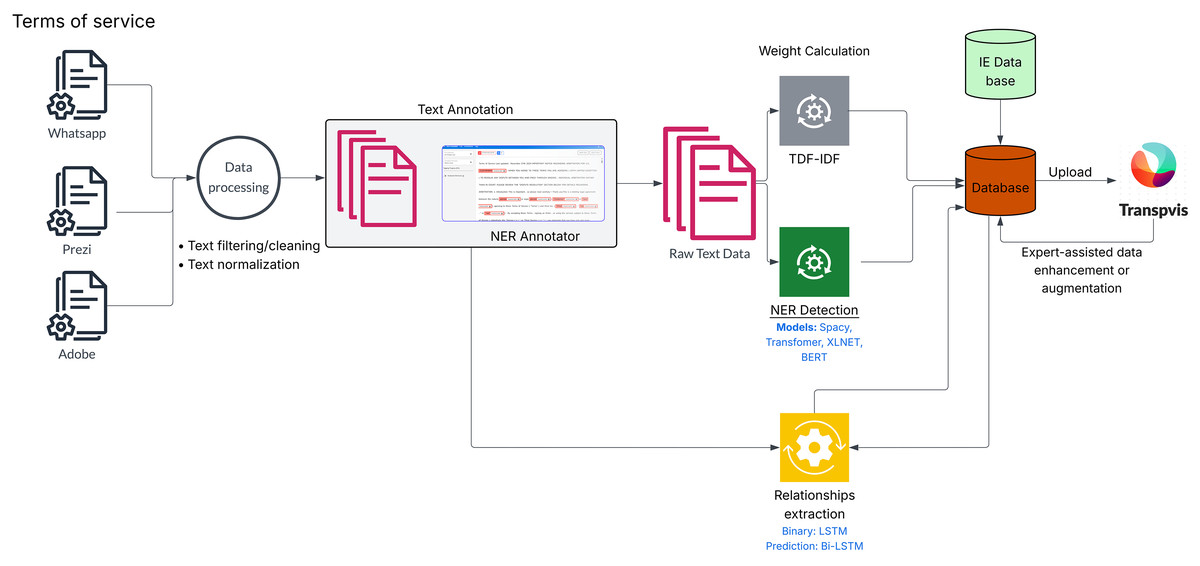
Figure 1: Overview of proposed block diagram for processing and analyzing raw textual data, including preprocessing, named entity recognition, weight extraction, relationship prediction using deep learning models, and expert-assisted data enhancement.
The system then computes importance weights (R3) for the identified entities and integrates both the stakeholders and their corresponding weights into the main database, which is linked to the existing transparency dataset. After generating comprehensive lists of stakeholders and information elements, the relationship model (R2) predicts whether a connection exists between each (stakeholder, information element) pair and classifies the type of relationship identified.
Finally, domain experts can review, refine, and enrich the extracted data based on their specialized knowledge (R4). The entire process is seamlessly synchronized and automatically executed within the TranspVis tool.
Data processing
Data collection: To build the dataset, we collected the terms of use and privacy policies for some software applications. This involves finding the official websites where these documents are published, extracting the necessary text sections, and organizing them in a structured format. The collection process consists of manually accessing each source, identifying the relevant legal documents, and copying their content for subsequent analysis and processing.
Table 2 provides information about the dataset sizes used for the different machine learning models developed in this study. Specifically, it lists the Named Entity Recognition (NER) model, the Binary Relation model, and the Relation Classification model, along with the number of lines used in their respective datasets. As multiple entities may appear within the same paragraph line of the terms and conditions documents, the total number of extracted entity lines reached approximately 2,100. For example, in the sentence “The company may share user data with third-party service providers for analytics purposes”, three distinct entities are identified: company, user, and third-party service providers. These are represented as separate entries within the NER dataset. Based on the detected entities, pairs of lines were then analyzed to identify potential relationships between them (e.g., “company–user” or “company–third-party service providers”). After merging and annotating paragraphs accordingly, the resulting dataset for the Binary Relation model comprised around 526 lines. This model focuses on determining whether a relation exists between two entities (binary classification: relation exists/does not exist). Since the primary objective of this work is entity extraction rather than full relational classification, a smaller subset of approximately 300 lines was used for the Relation Classification model. All the annotated dataset were manually verified by domain experts (transparency and legal experts). The relation classification are also validated by these experts to ensure annotation consistency and to evaluate model performance on a limited, high-quality sample before scaling to larger corpora. Experts emphasized that the precise type of relationship (e.g., Production, Obligation, Optionality, Undecidedness) may not always be reliably inferred by automated models. Consequently, they recommended a binary approach at this stage, since only experts can accurately categorize nuanced legal relationships. This choice allows the system to focus first on robust entity and relation detection, with the potential for multi-class classification in future work. The dataset sizes in Table 2 thus reflect the progressive stages of model development: beginning with entity detection, followed by relation existence classification, and culminating in expert-verified relation-type assessment. While the relation dataset is relatively small, this phase serves as a proof of concept to validate the approach before extending it to larger, more diverse corpora in future studies. The system includes three core models: a NER model that extracts key entities such as user, company, and third-party; a binary relation model that identifies whether relationships exist between these entities; and a relation classification model that categorizes the type of relationship, such as “company owns data of user” being labeled as a production relation.
| Task | Model type | Dataset size |
|---|---|---|
| Named entity recognition (NER) | SpaCy (Briskilal & Subalalitha, 2022), Transformers-based, BERT (Garrido-Merchan, Gozalo-Brizuela & Gonzalez-Carvajal, 2023) and XLNet (Habbat, Anoun & Hassouni, 2022). | 2,100 lines |
| Binary relation detection | TF-IDF with logistic regression) (Vimal & Anupama Kumar, 2020) | 526 lines |
| Relation type classification | Bi-LSTM (Li, Zhan & Li, 2018) and LSTM (Smagulova & James, 2019) | 300 lines |
This progression aligns with the objectives outlined in the abstract: improving the detection and weighting of entities and the identification of relationships among them to enhance comprehension and transparency in lengthy legal documents. It integrates stakeholders (departments, users, or organizations), information elements (Data, Process, and Policy), and the relationships between them (Production, Obligation, Optionality, and Undecidedness) to provide a comprehensive view of transparency within a system.
Data cleaning: To ensure the textual data was suitable for NLP-based entity extraction, we implemented a structured cleaning and preprocessing pipeline. The process began with the removal of noise such as punctuation, redundant commas, and stop words that do not contribute to semantic meaning. Next, the text was normalized (lowercased, standardized encoding, and lemmatized) to achieve consistency across documents. Missing or malformed entries were corrected or discarded. Using SpaCy’s tokenizer, the documents were segmented into sentences and tokens, while paragraphs were split into individual lines to improve the granularity of analysis.
Manual annotation: After cleaning, a manual annotation phase was conducted to create the gold-standard dataset for supervised model training. The objective of this step was to identify and label key stakeholders explicitly or implicitly referenced within terms and conditions documents (For example, the terms of service of WhatsApp (https://www.whatsapp.com/legal/terms-of-service) as a text input). Annotation was carried out using the open-source NER Annotator for SpaCy2 . The annotated corpus was then used to fine-tune SpaCy’s English transformer-based NER model. Fine-tuning involved retraining the model’s classification layer on the domain-specific annotated samples, effectively extending SpaCy’s base dataset with stakeholder-related entities and adapting it to the linguistic characteristics of legal texts. This process allowed the model to accurately recognize and categorize stakeholders and related entities appearing throughout terms and conditions documents.
Stakeholders detection
To ensure robustness and provide domain experts with flexibility, we implemented and evaluated four distinct Named Entity Recognition (NER) models for stakeholder extraction: a fine-tuned spaCy model, a multilingual Transformers model, a BERT-based model, and an XLNet-based model. This multi-model approach allows for comparative analysis and selective adoption based on specific project requirements and performance characteristics.
Model architectures and integration
SpaCy-based NER Model: This model represents our primary, custom-trained solution. We fine-tuned a spaCy model built upon the RoBERTa architecture (Briskilal & Subalalitha, 2022; Satheesh et al., 2020) on a domain-specific dataset. This process involved extensive data collection from software Terms and Conditions (e.g., from Facebook, Google, OpenAI), manual annotation of entities, and configuration of a custom training pipeline using spaCy’s DocBin for efficient data handling. The fine-tuning process, detailed in ‘Participant Demographics’, adapted the model to our specific entity types, enhancing its accuracy for legal and policy-related texts.
Transformers-based NER Model: This model leverages the Hugging Face Transformers library (Lin et al., 2022) to utilize the pre-trained “wikineural-multilingual-ner” model. This model is a fine-tuned multilingual BERT (mBERT) model capable of recognizing named entities in nine languages, providing broad coverage without requiring task-specific training.
BERT-based NER Model: This model utilizes a BERT architecture (Garrido-Merchan, Gozalo-Brizuela & Gonzalez-Carvajal, 2023) pre-trained on large-scale text corpora. Its bidirectional context representations are highly effective for capturing complex linguistic patterns, making it a strong baseline for NER tasks without further fine-tuning on our dataset.
XLNet-based NER model: This model is based on the XLNet architecture (Habbat, Anoun & Hassouni, 2022), which uses a permutation-based language modeling objective. This approach enables the model to consider all permutations of the input sequence, often leading to improved performance on tasks requiring modeling of complex, bidirectional dependencies.
Custom model development: the SpaCy pipeline
The development of our custom spaCy model involved a meticulous, multi-stage process to ensure high-quality entity recognition tailored to the domain of software transparency.
Data curation and annotation: We compiled a corpus from the Terms and Conditions of major software entities including Facebook, WhatsApp, Google, Microsoft, and OpenAI. The raw text was manually annotated using a specialized NER tool, labeling entities according to predefined categories such as PERSON and ORG. For example, organization entities included mentions like Google LLC, Meta Platforms, and Microsoft Corporation, while person entities included examples such as John Smith and Jane Doe. These annotations provided a structured representation of the text for downstream tasks.
Preprocessing and fine-tuning: The annotated corpus underwent rigorous preprocessing, including text normalization, deduplication, and standardization of entity naming conventions (e.g., standardizing “Google LLC” and “Google, Inc.” to “Google”). This refined dataset was converted into spaCy’s binary DocBin format. The model was then fine-tuned using a custom configuration file, optimizing hyperparameters like batch size, learning rate, and dropout over multiple iterative training cycles on a GPU. Error analysis was conducted between cycles to correct misclassifications and incrementally improve the model’s accuracy.
Evaluation: The final dataset was split into training (80%) and testing (20%) subsets. The model’s performance was evaluated on the held-out test set to ensure its ability to generalize to unseen data, solidifying it as a reliable tool for stakeholder extraction in transparency modeling.
Information element extraction model
For the extraction of Information Elements, we employed a solution devised by Fadloun et al. (2023) that integrates classification with text generation. This model processes input paragraphs through a three-stage pipeline:
-
1.
Classification: A binary classifier filters paragraphs to retain only those that discuss concrete information exchanges, distinguishing them from general informational text.
-
2.
Summarization: A text generation model shortens the identified paragraphs into concise summaries, forming the final Information Element.
-
3.
Categorization: Each generated Information Element is classified into one of three categories based on its characteristics: Data, Process, or Policy.
Relationship extraction machine learning
Collaborative feedback from domain experts was instrumental in shaping our modeling approach. Through iterative discussions, we recognized that determining fine-grained relationship types (e.g., ‘obligatory’, ‘optional’) is highly context-dependent and requires nuanced validation. To establish a robust and verifiable foundation, we adopted a phased, hierarchical methodology. This approach prioritizes accurately detecting the existence of a relationship between entities before attempting to classify its specific type. Consequently, we implemented three distinct models:
Binary Relation Model (TF-IDF with Logistic Regression) (Vimal & Anupama Kumar, 2020): This model serves as a foundational filter, designed to perform a binary classification on a (Stakeholder, Information Element) pair. Its sole purpose is to predict whether any form of relation exists.
Multi-class Relation Model 1 (LSTM) (Li, Zhan & Li, 2018): For pairs where a relation is confirmed to exist, this model performs a multi-class classification to predict the specific type of relation using a unidirectional LSTM architecture.
Multi-class Relation Model 2 (Bidirectional LSTM) (Li, Zhan & Li, 2018): This model addresses the same task as Model 1 but leverages a Bidirectional LSTM to capture contextual information from both past and future in the sequence, aiming for improved accuracy.
Detailed implementation:
The Binary Relation Model was designed to determine the existence of a relation between two entities. Its primary purpose is to perform a relation existence check, producing a binary output of 0 (No) or 1 (Yes). The model was trained on a dataset of 526 annotated pairs, with a representative sample presented in Table 3. For the architecture and training process, textual features were vectorized using the TF-IDF method, and a Logistic Regression classifier was employed within a pipeline. To address class imbalance, a RandomUnderSampler was applied during training. The dataset was partitioned into 80% for training and 20% for testing to ensure reliable evaluation.
| ID | Stakeholder | Information element | Relation existence |
|---|---|---|---|
| 0 | Customer | Payment information | 1 |
| 1 | Customer | Accessing personal information | 0 |
Multi-class relation models
The Multi-Class Relation Model was developed to predict the type of relation between entities. Its output corresponds to one of four possible classes: Production, Obligatory, Optional, or Undecided. The model was trained on a curated dataset of 300 confirmed relations, each annotated with its specific relation type, as illustrated in Table 4. Architecture & Training are:
-
1.
LSTM Model: Features an Embedding Layer, a single LSTM layer (64 units), and a Dense output layer with softmax activation.
-
2.
Bidirectional LSTM (Bi-LSTM) Model: Uses an Embedding Layer followed by two Bidirectional LSTM layers (128 and 64 units) to capture bidirectional context, followed by a Dense layer with ReLU, a Dropout layer (rate = 0.5), and a final softmax output layer.
| ID | Stakeholder | Information element | Relation type |
|---|---|---|---|
| 0 | Customer | Payment information | Obligatory |
| 2 | Customer | Cookies | Optional |
| 3 | Customer | Accessing personal information | Undecided |
| 4 | Company | Why collecting account information | Production |
Both models were compiled with the Adam optimizer and the sparse categorical crossentropy loss function.
This hierarchical design (using a fast, traditional model for initial filtering and comparing two deep learning architectures for detailed classification) ensures a scalable and accurate framework for relation extraction.
Keywords weight calculation
In our system, we calculate keyword weights for terms such as “data,” “policy,” “process,” and “stakeholders” using the Term Frequency-Inverse Document Frequency (TF-IDF) method (Qaiser & Ali, 2018). The TF-IDF weight for a term in document is computed as:
(1) where:
(2)
(3)
The TF-IDF model uses several key components. Here, represents the raw count of term in document , while denotes the total number of terms in that document. N is the total number of documents in the corpus, and indicates how many documents contain the term .
Thus, TF-IDF effectively highlights terms that are most representative of each document’s content while downweighting common terms. In our transparency framework analysis, this enables the identification of key terms that reveal relationships and roles among different elements.
Enhanced TranspVis
Visual encoding
As described before, we enhance the TranspVis tool (https://youtu.be/sIxm5pzzbeA) with other features and methods, as shown in Fig. 24 . The components use the same colors, such as green, red, yellow, and blue. A circle surrounds these components, and users can update or rotate the circle using the interaction tools at the top of the main view. By clicking on one of the components, users can explore its details on the right side of the main view. We have added buttons such as “Add Automatically” for each component. Additionally, we have included a description on the right side indicating whether the element was generated by a model or created manually.
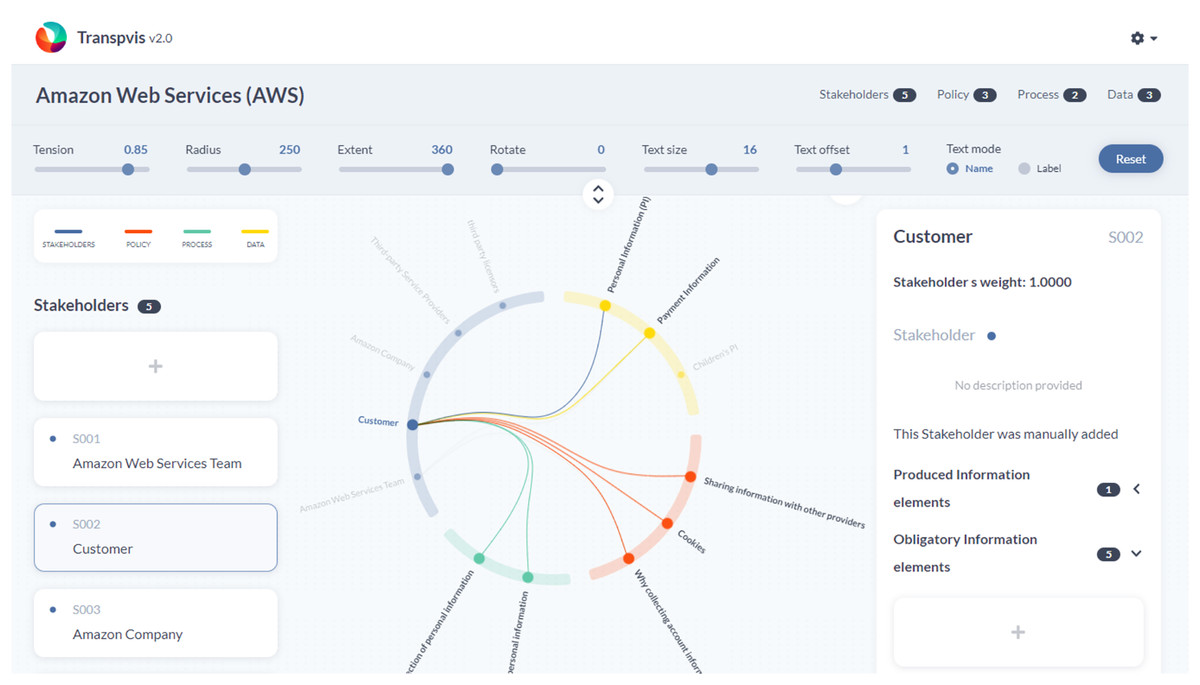
Figure 2: TranspVis visualization of AWS transparency.
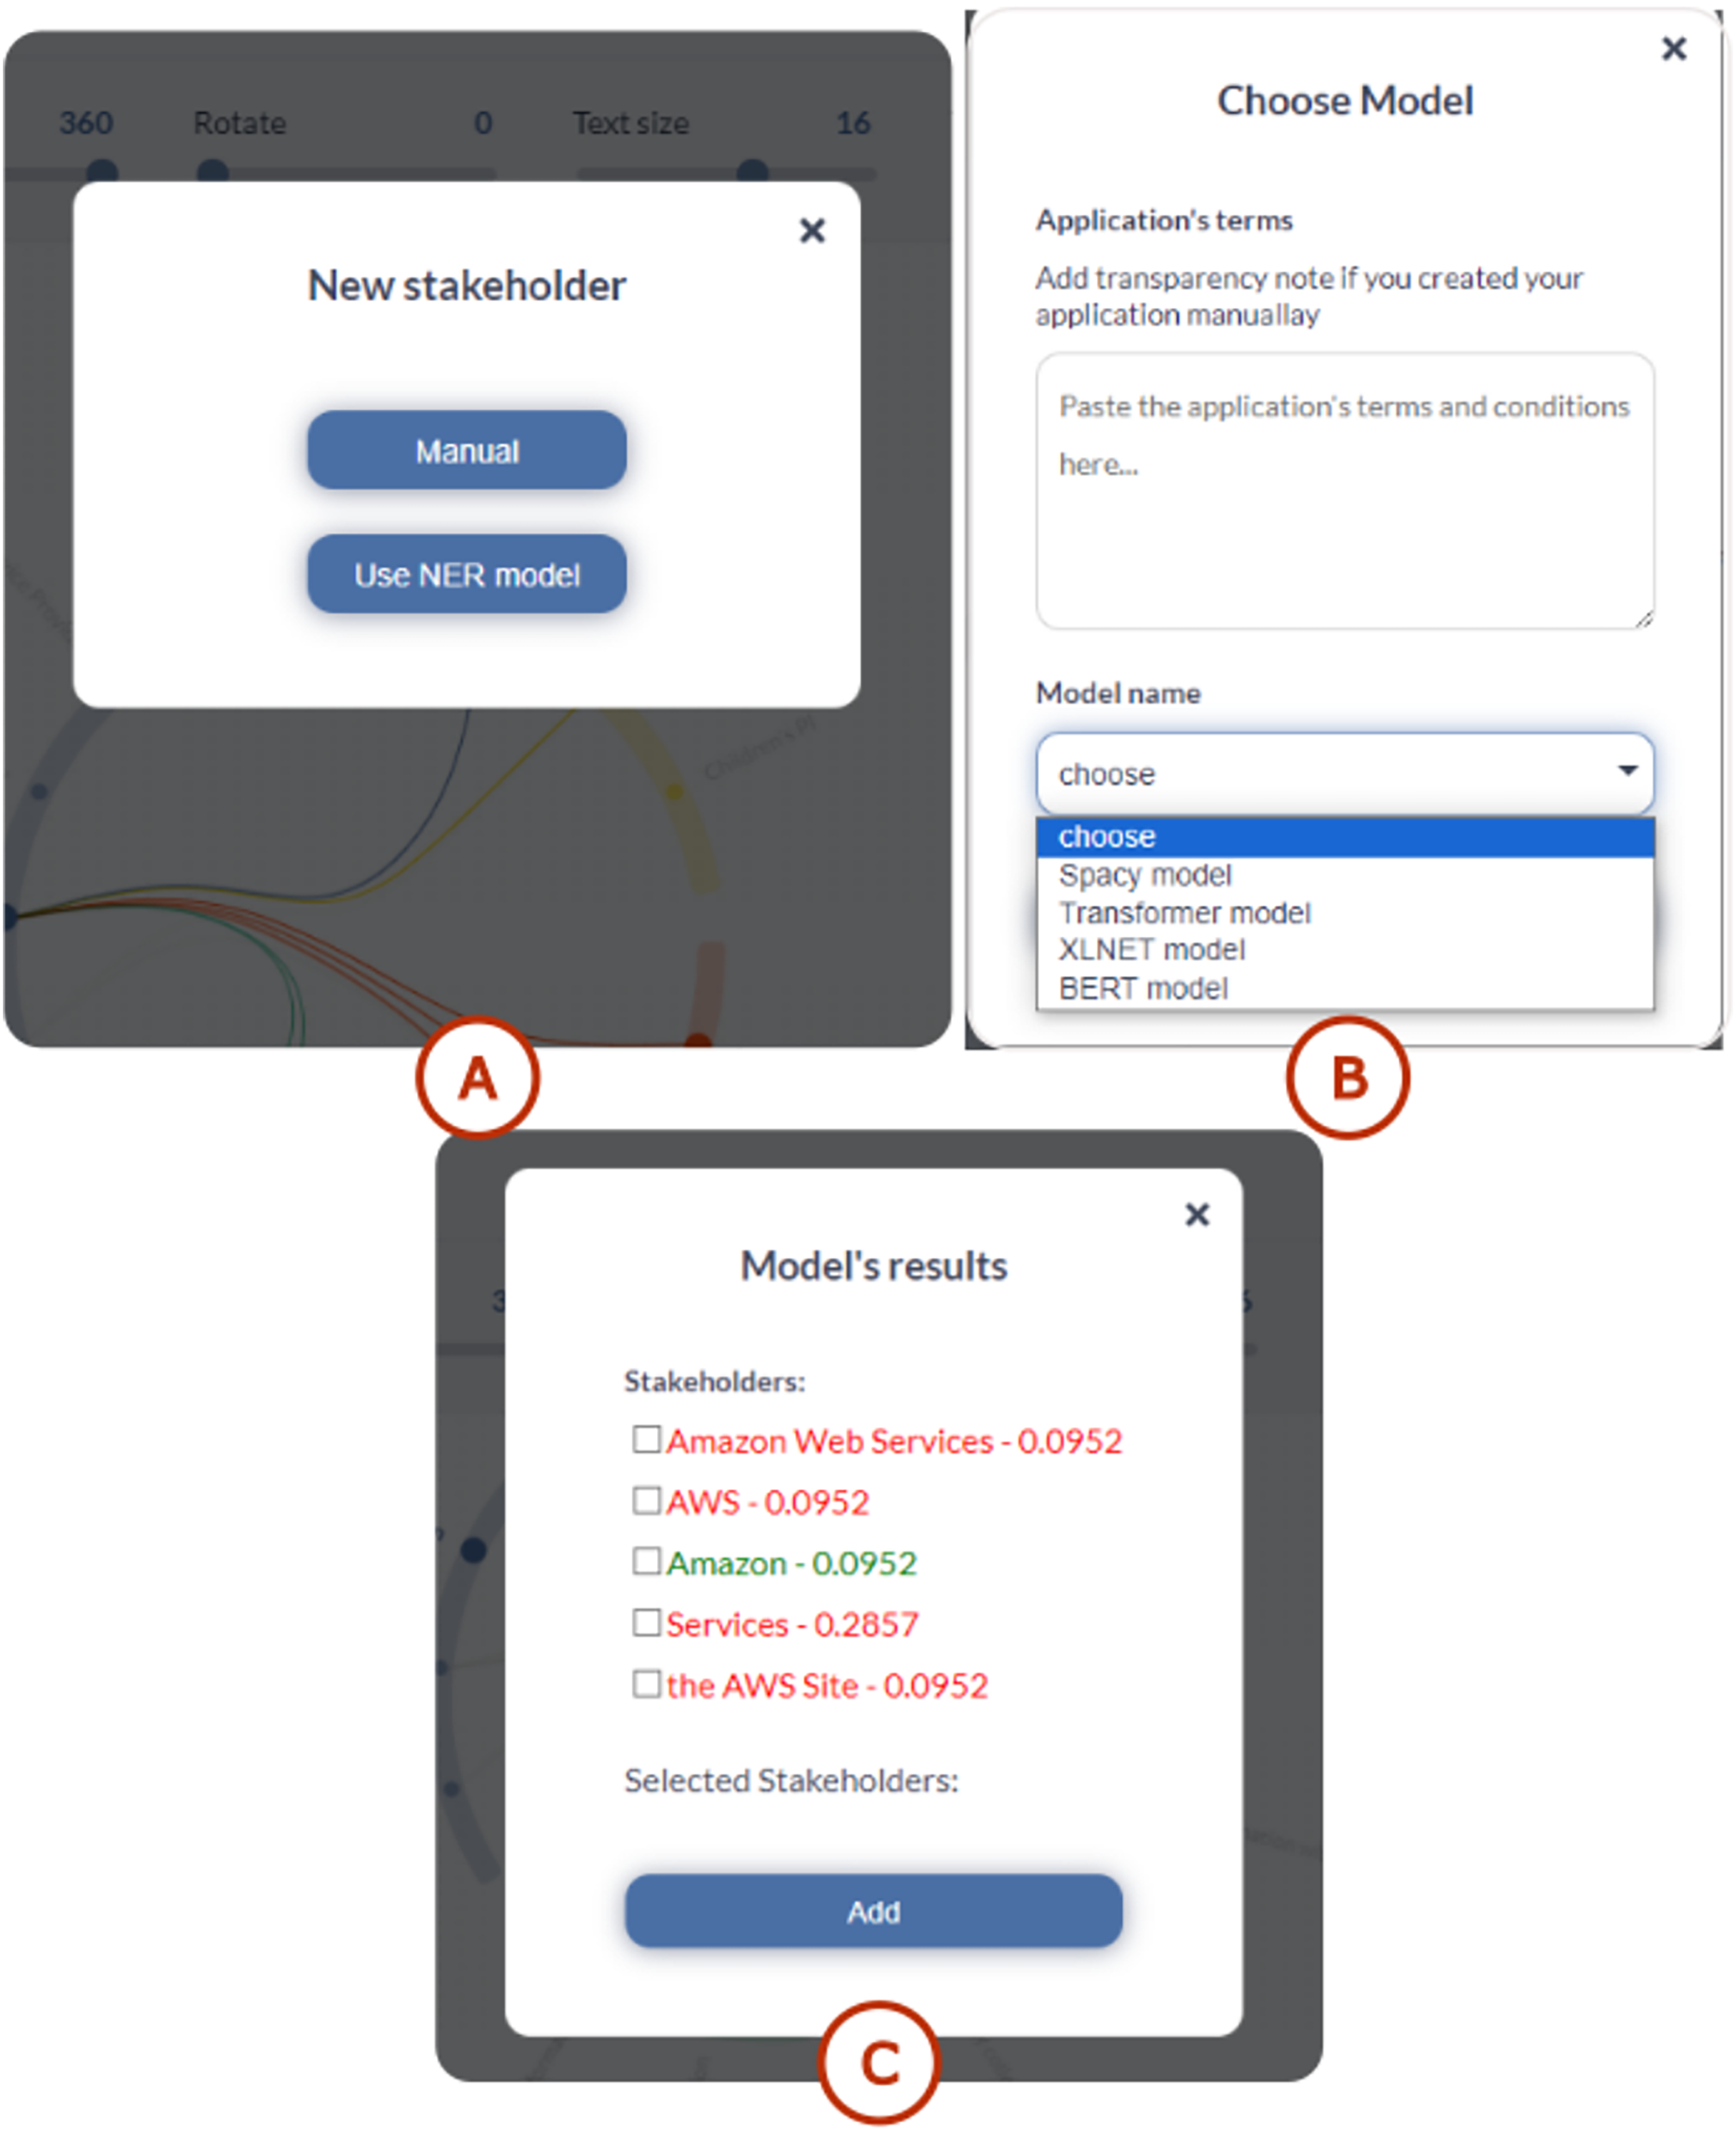
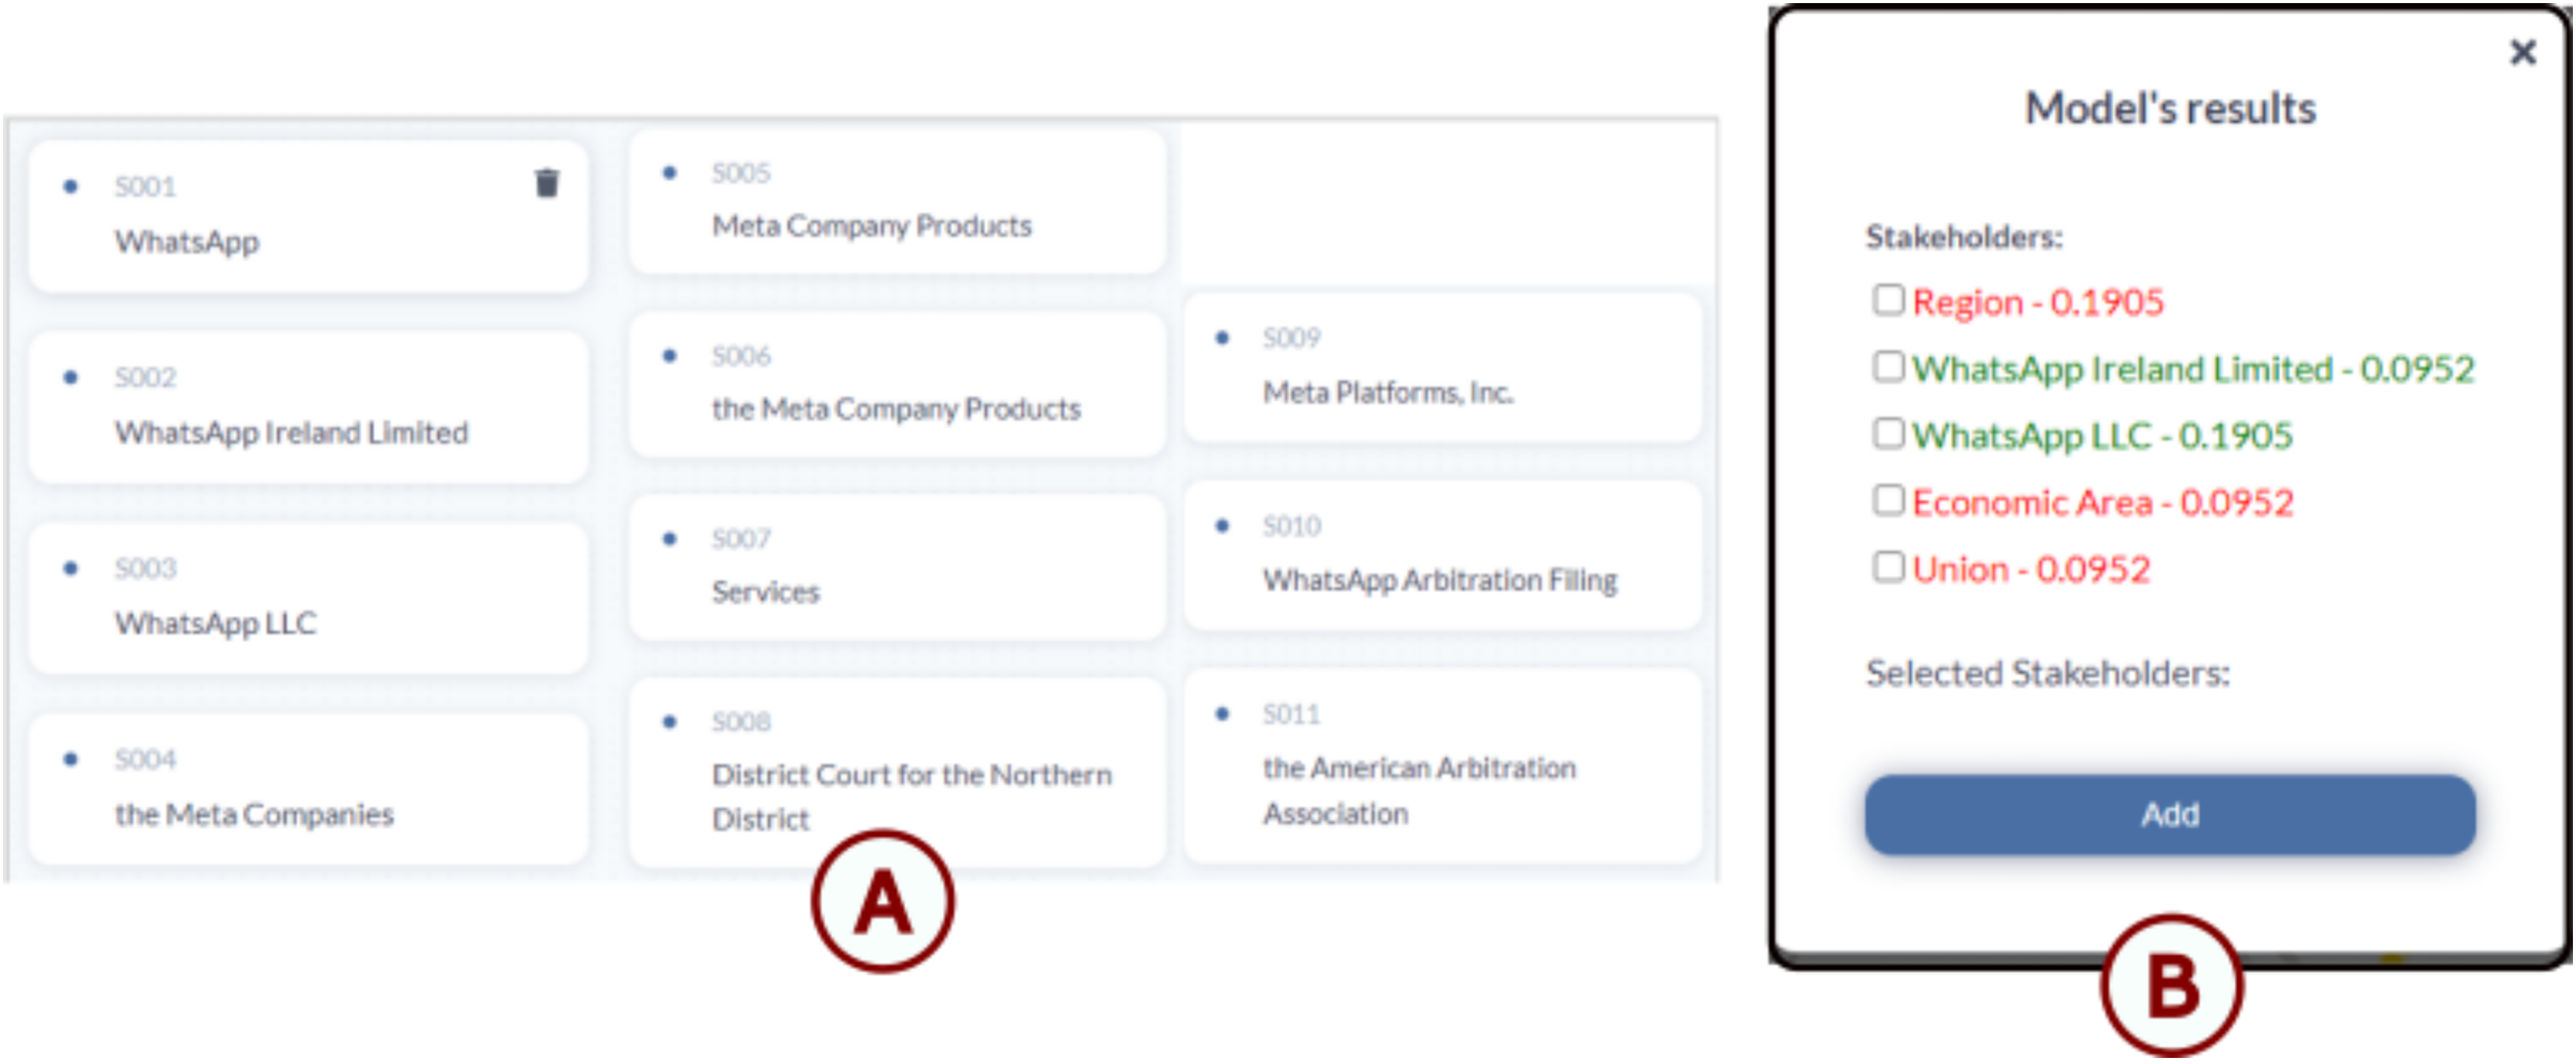
For stakeholder addition (see Fig. 3A), the interface displays a dedicated window for automatic suggestions highlighted in red, showing new components proposed by the selected model (see Fig. 3B). Meanwhile, existing components with modified weights appear in green, allowing users to selectively add them if desired (see Fig. 3C). Components that remain unchanged with identical weights are displayed with low black opacity, indicating that no modifications are required.
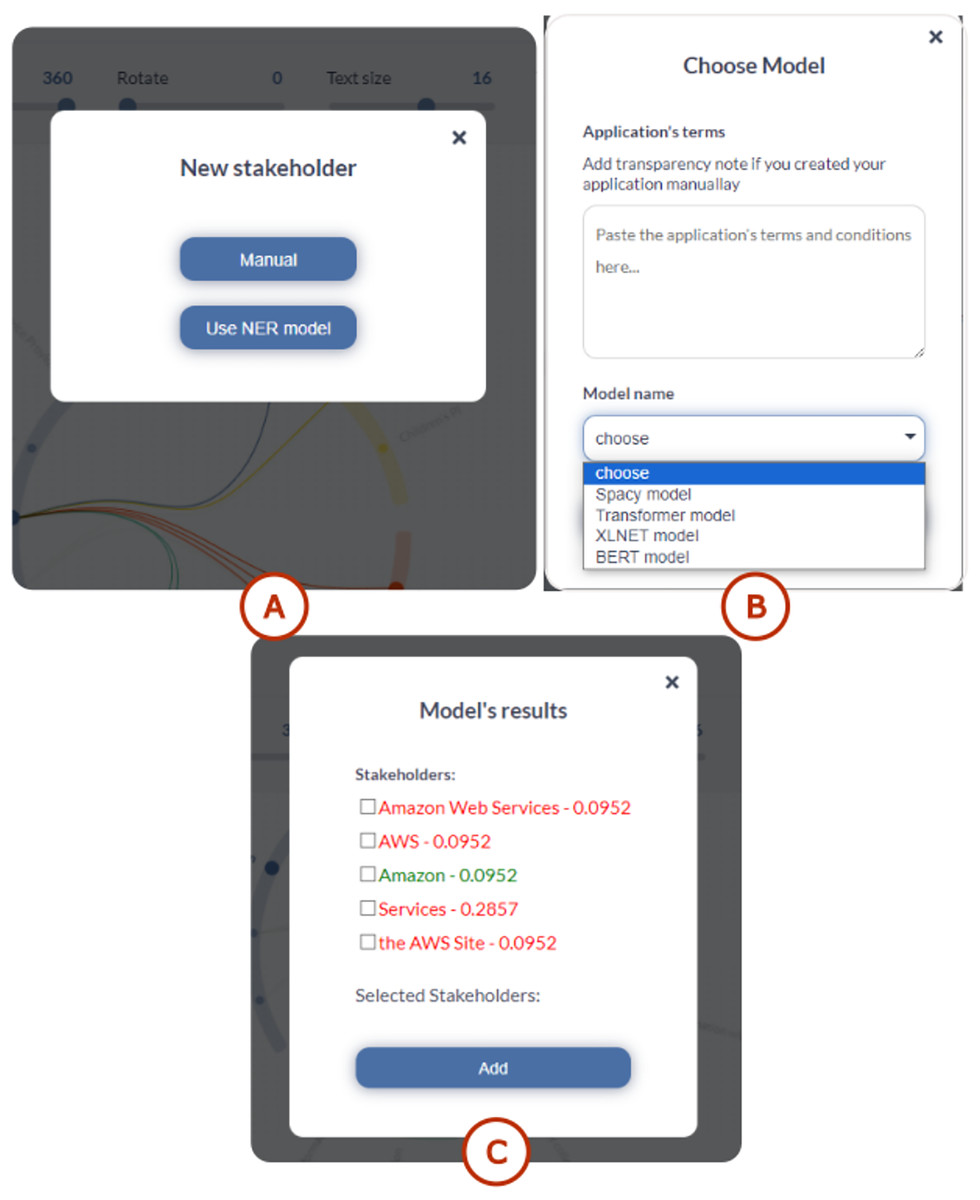
Figure 3: TranspVis: user interface for adding stakeholders.
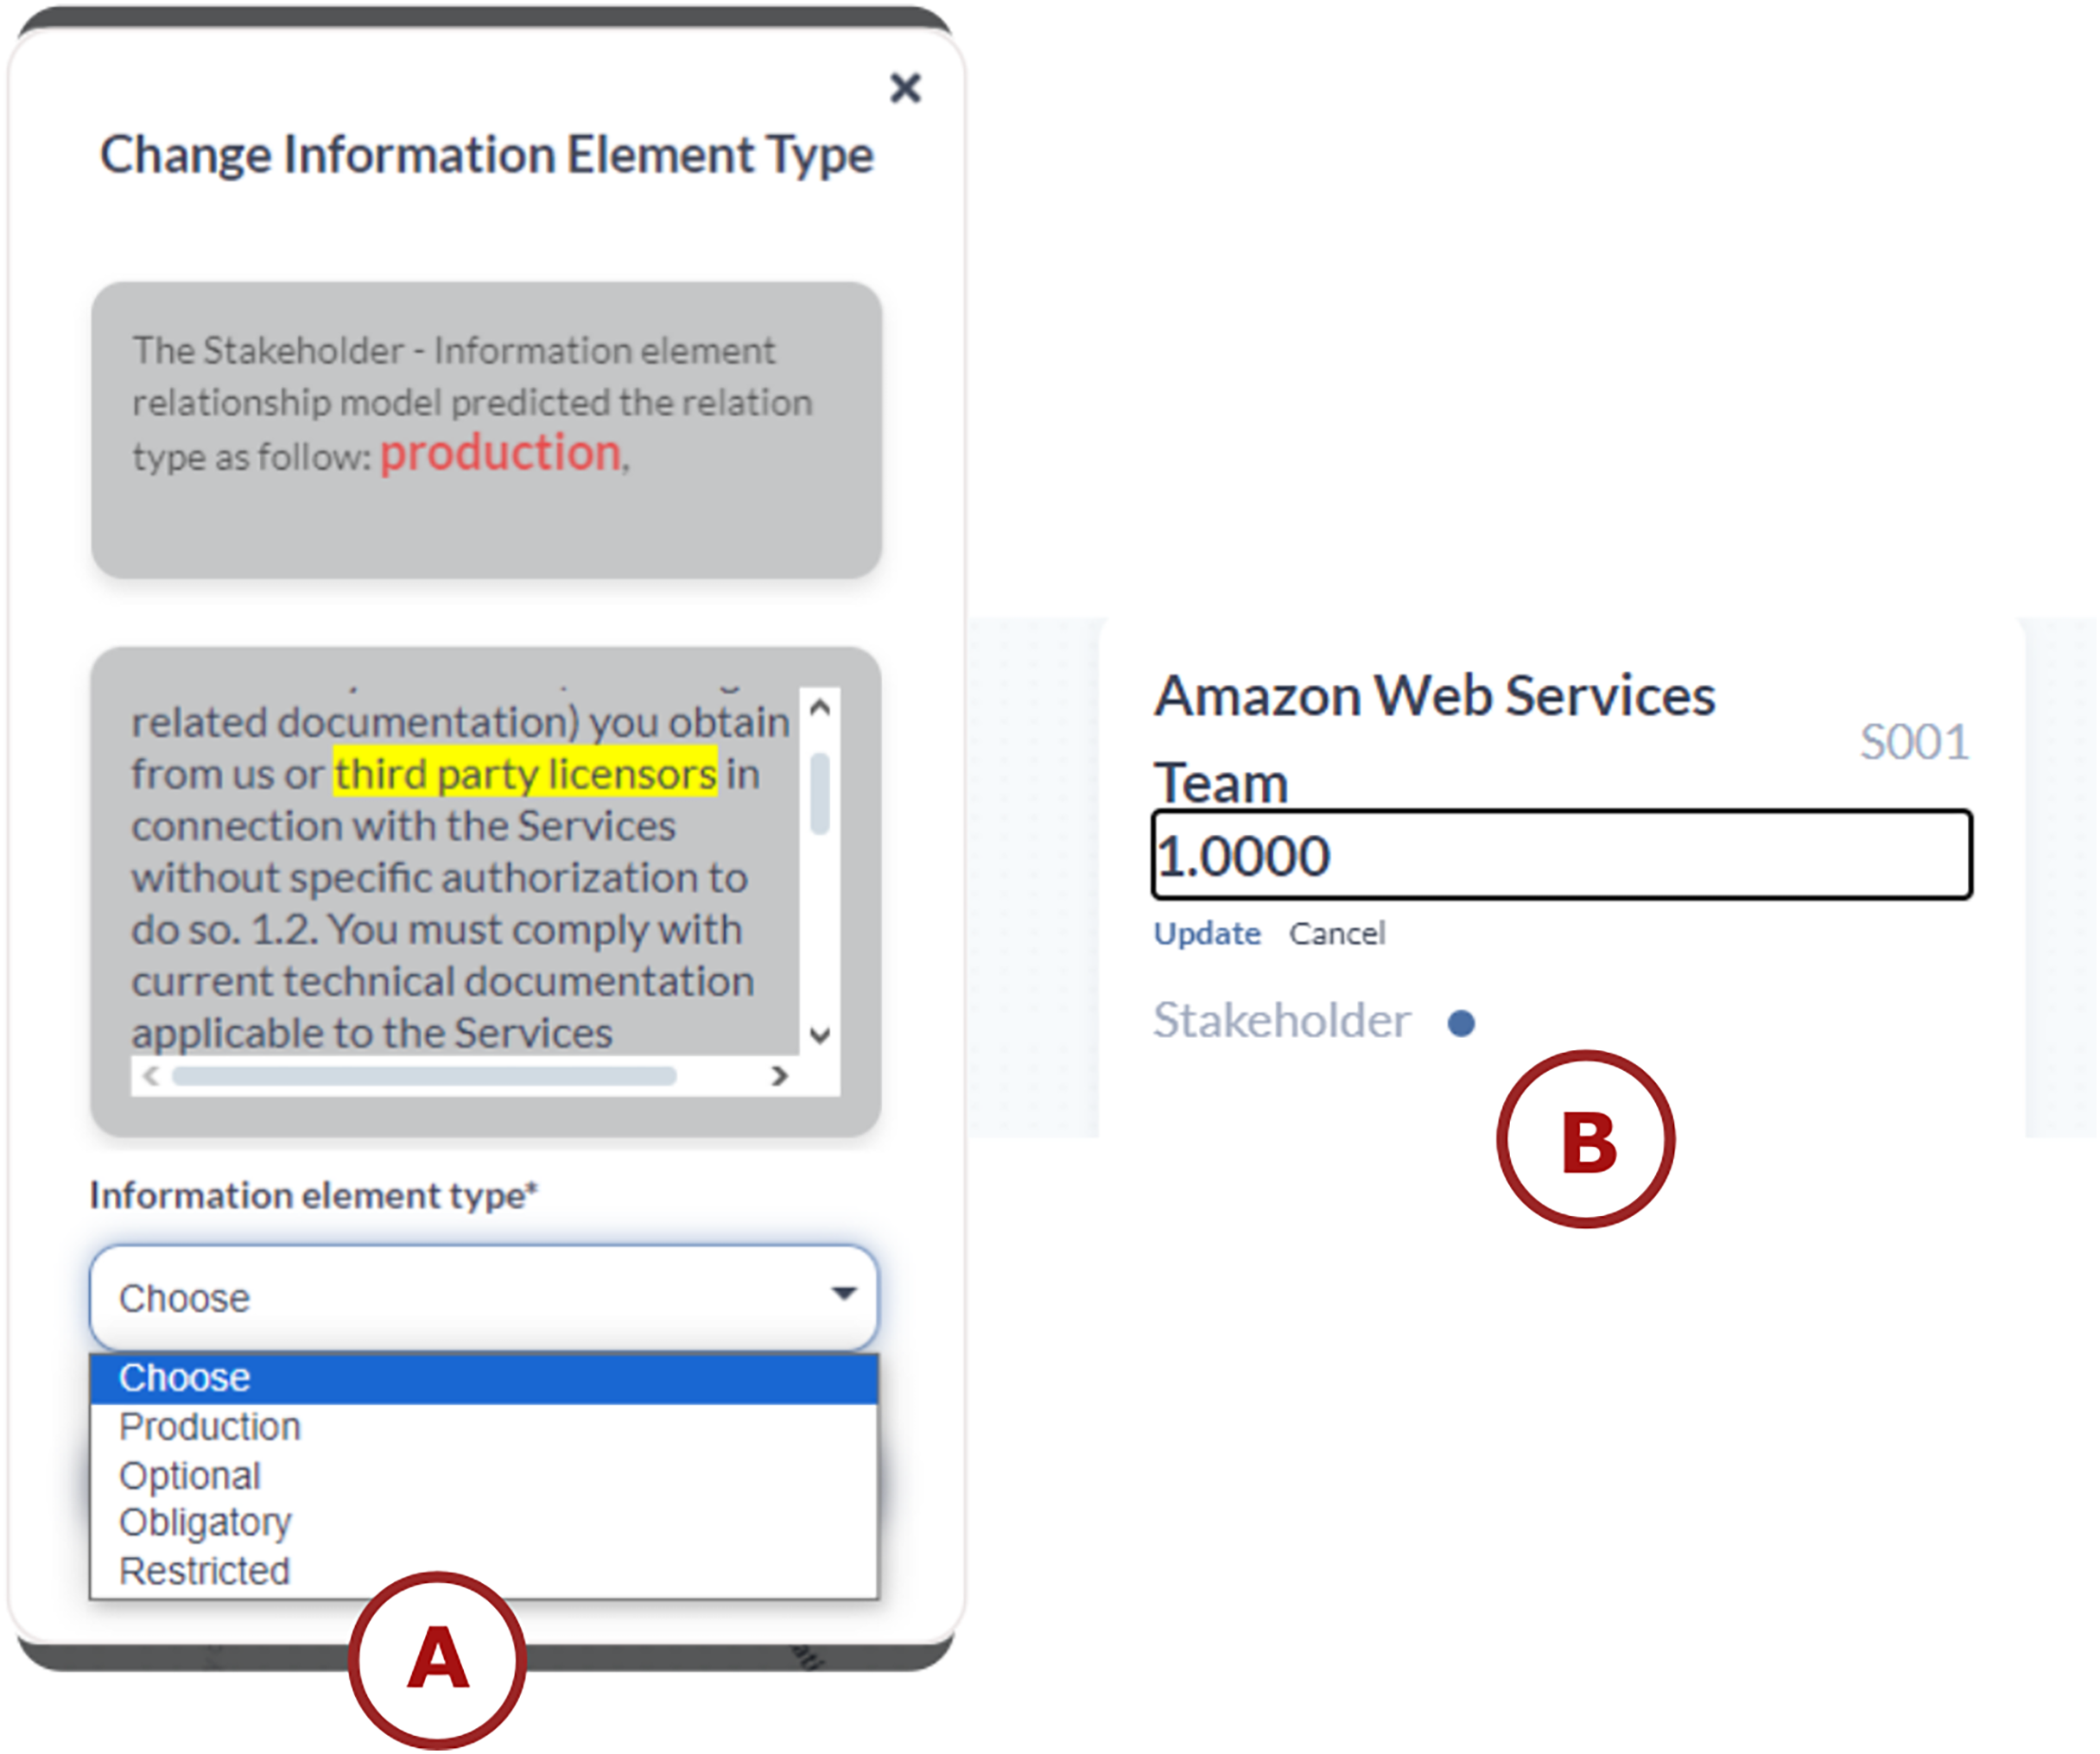
For adding relationships, a window appears when the user selects two components to create a relationship between them. The user has the option to create it manually or automatically. If the user chooses the automatic option, a proposed relationship type appears in red at the top of the window (see the top of Fig. 4A). Additionally, a text description with the selected components is highlighted with a yellow background to give the user an idea of the chosen relationship type (see the middle of Fig. 4A). The user can review the information in this window and select the appropriate relationship type (see the down of Fig. 4A). Experts in transparency have also validated this window’s visual encoding.
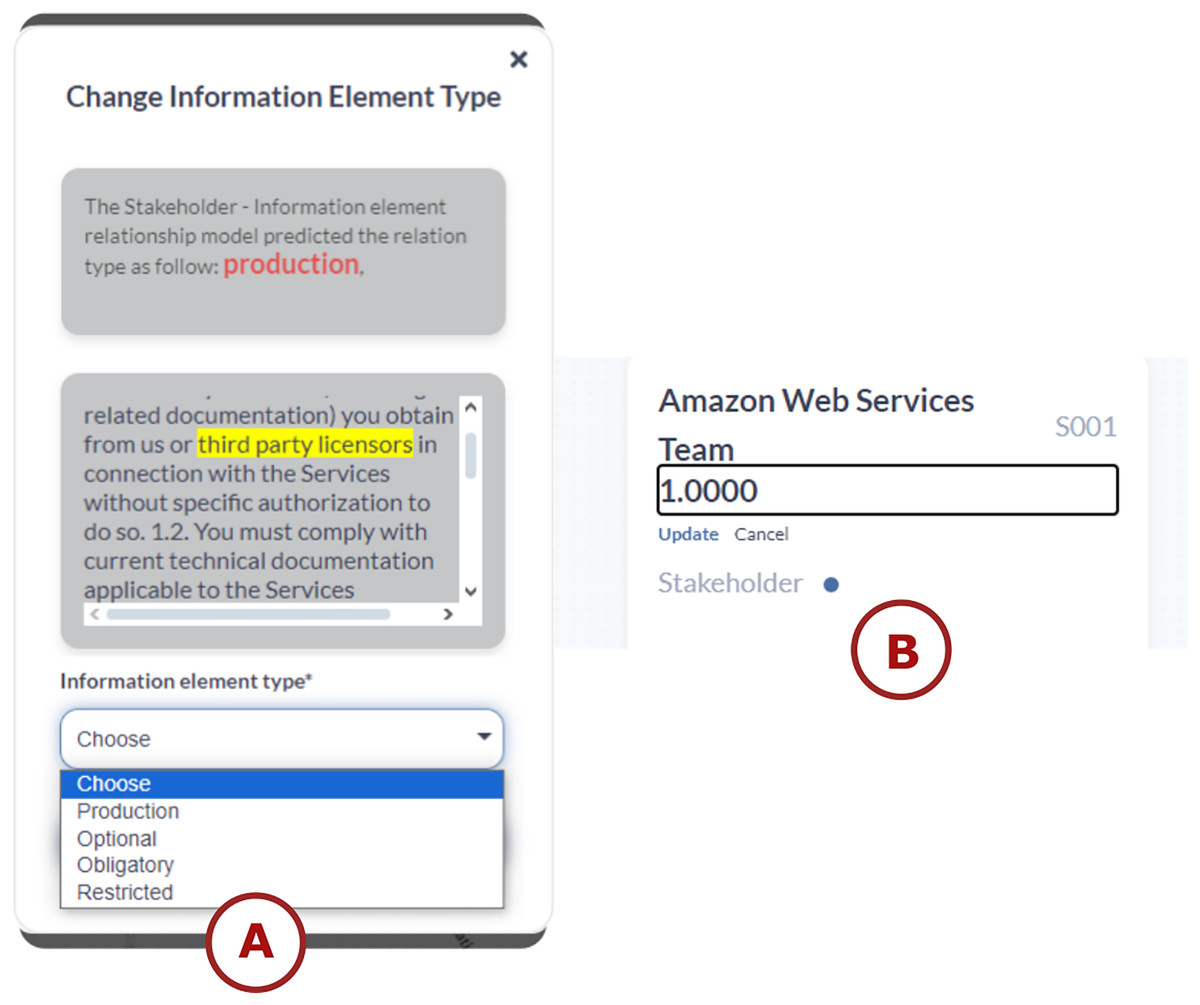
Figure 4: TranspVis interactions: (A) add relationships, (B) update weights for “Team” element.
Furthermore, interactions are added to the description section—if the user clicks on a weight, they can change it manually or use the proposed method (see Fig. 4B).
Evaluation
After building the system and thoroughly detailing the design and implementation phases, the evaluation phase is essential to obtain feedback on the clarity, accuracy, and reliability of the system. First, we evaluate the machine learning models alone then, we briefly discuss the TranspVis visualization.
ML model’s evaluation
This section provides a detailed evaluation of the Machine Learning models used for NER and Relation Extraction tasks.
Evaluation metrics
The performance of our named entity recognition models is evaluated using the following metrics:
-
Precision: The ratio of true positives (TP) to all predicted positives (TP + FP):
(4)
-
Recall: The ratio of true positives (TP) to all actual positives (TP + FN):
(5)
-
F1-score: The harmonic mean of precision and recall:
(6)
-
Accuracy: The ratio of all correct predictions (TP + TN) to total predictions:
(7)
where:
TP = True Positives (correctly identified entities)
FP = False Positives (incorrectly identified entities)
TN = True Negatives (correctly rejected non-entities)
FN = False Negatives (missed actual entities).
NER model’s evaluation
Model comparison and performance analysis:
To evaluate the impact of training data composition on model performance, we conducted two distinct training experiments. The first model was trained exclusively on Facebook’s Terms and Conditions, while the second model was trained on a diverse dataset comprising terms from multiple software platforms, including Anaconda, Flipboard, Feedly, Google, Facebook, Freemind, Bard, and Git.
The performance comparison revealed distinct learning patterns between the two approaches. In the first test, focusing solely on Facebook’s data, the model demonstrated strong initial performance with a starting F1-score of 57.53%, which rapidly improved over training epochs to reach 87.50%. Precision and recall showed consistent parallel improvement, achieving 89.74% and 85.37% respectively, as illustrated in Fig. 5. This rapid convergence suggests efficient learning of platform-specific patterns.
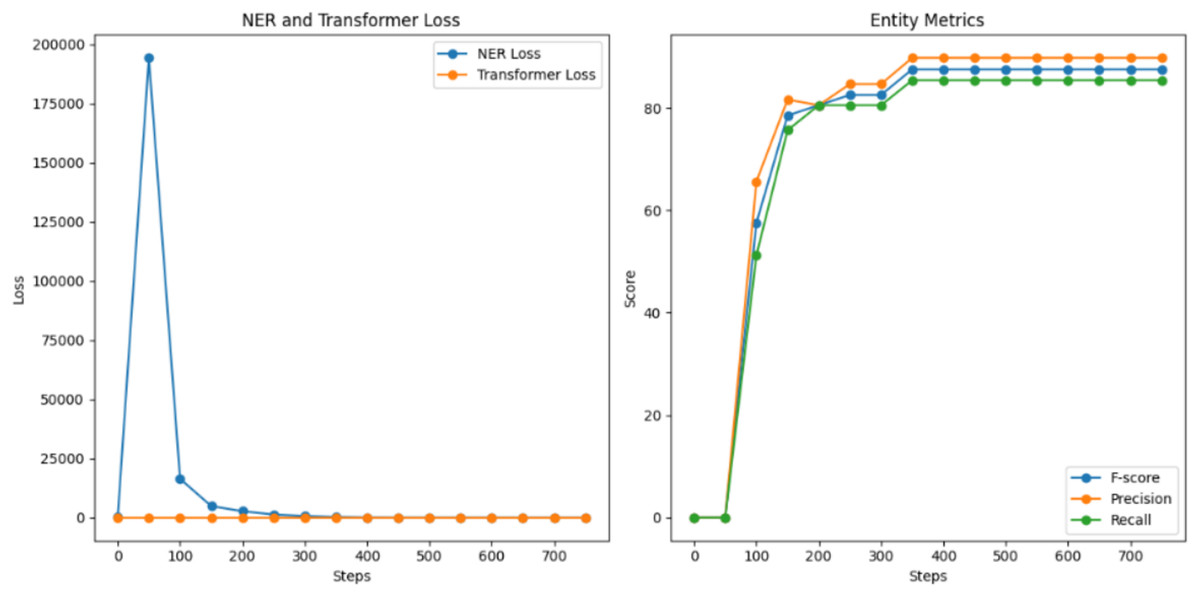
Figure 5: NER model evaluation for the first training.
In contrast, the second test utilizing multi-platform data began with a substantially lower initial F1-score of 39.46%, indicating the greater complexity of learning from diverse sources. However, the model showed steady improvement throughout training, eventually reaching a competitive F1-score of 76.28%. Precision and recall followed similar trajectories, achieving 77.36% and 75.23% respectively, as shown in Fig. 6. While the final performance metrics were lower than the Facebook-specific model, the multi-platform model demonstrated remarkable adaptability across different textual environments.
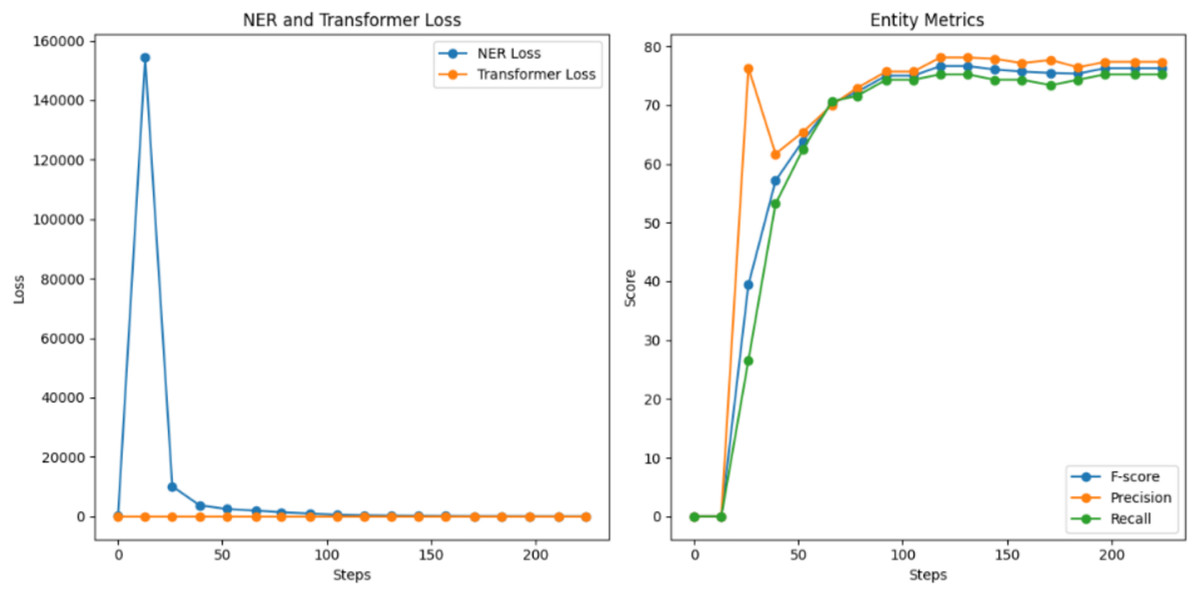
Figure 6: NER model evaluation for the second training.
The performance comparison reveals a fundamental specialization-generalization trade-off in NER systems. The single-platform model achieved higher accuracy through focused pattern recognition, while the multi-platform model gained broader applicability at the cost of lower precision. This suggests a hybrid approach—combining diverse pre-training with domain-specific fine-tuning—would optimally balance these competing objectives for software policy analysis.
NER evaluation:
Table 5 presents the results of the evaluation of NER models:
-
SpaCy: As shown in Table 5, SpaCy achieved a precision of 77.36%, a recall of 75.23%, and an F1-score of 76.28%. While SpaCy is known for its efficiency and speed, these results indicate that it may not be the best choice for tasks requiring the highest levels of accuracy and comprehensiveness. It is important to note that SpaCy was trained on our data and it extracts more than standard stakeholders. SpaCy extracts other stakeholders like the terms: users, businesses, suppliers, and organizations, while others cannot.
Transformers: Transformers significantly outperformed the other models with a precision of 95.40%, a recall of 95.80%, and an F1-score of 95.60%. These exceptional scores highlight the model’s superior ability to accurately and comprehensively process language, making it the top performer in our analysis.
BERT: According to BERT, it demonstrated strong performance with a precision of 86.98%, a recall of 88.33%, and an F1-score of 87.65%. BERT is highly accurate and effective, showing a solid balance between precision and recall, though it falls slightly short of the Transformers model.
XLNet: Finally, we have XLNet. XLNet achieved a precision of 87.51%, a recall of 89.54%, and an F1-score of 88.51%. These scores indicate that XLNet is highly effective and slightly outperforms BERT, especially in recall and F1-score.
| SpaCy | Transformers | BERT | XLNet | |
|---|---|---|---|---|
| Precision | 77.36% | 95.40% | 86.98% | 87.51% |
| Recall | 75.23% | 95.80% | 88.33% | 89.54% |
| F1-score | 76.28% | 95.60% | 87.65% | 88.51% |
Relation model’s evaluation
Table 6 presents the results of the evaluation of relation models:
-
Binary Model: Table 6 presents the performance comparison of Binary, LSTM, and Bi-LSTM models for relation extraction. The Binary model demonstrated superior performance with the highest precision and accuracy among the evaluated approaches. It achieved a precision of 94%, recall of 66%, F1-score of 77%, and accuracy of 67%. These results underscore the Binary model’s exceptional precision and well-balanced performance across metrics. The 94% precision indicates that when the model predicts a positive relation, it is correct 94% of the time. The recall and F1-score reflect a reasonable trade-off between completeness and reliability, while the accuracy confirms its overall prediction correctness.
Figure 7 presents the confusion matrix of the binary relation model, which summarizes the model’s classification performance between positive and negative classes. The matrix reveals the distribution of true and false predictions across both classes, providing insight into model behavior beyond global accuracy metrics. The model performs well in identifying the positive class, achieving an F1-score of 0.77, while its performance for the negative class remains limited, with an F1-score of 0.41. The high precision (0.94) for the positive class indicates that when the model predicts a positive case, it is usually correct. However, the recall (0.66) shows that a significant proportion of actual positive instances are not detected. This highlights a clear trade-off between precision and recall for the positive class.
-
Long Short-Term Memory (LSTM): Next, we have the LSTM model, which is a type of recurrent neural network (RNN). The LSTM achieved a precision of 67%, a recall of 40%, an F1-score of 50%, and an accuracy of 54%. While LSTM is known for handling sequential data effectively, these results suggest that it may struggle with binary classification tasks compared to the other models. The lower recall indicates it misses a significant number of positive instances, and the F1-score and accuracy further reflect its moderate performance.
The multi-class relation model achieved an overall accuracy of 54%, with performance varying notably across the four relationship types. Figure 8A presents the detailed confusion matrix and classification report, illustrating distinct patterns in the model’s behavior. The model showed particularly high precision (1.00) for the “undecided” class but suffered from very low recall (0.25), suggesting it was overly conservative in predicting this category. The “obligatory” class demonstrated moderate precision (0.67) but low recall (0.40), resulting in an F1-score of 0.50. The “optional” and “production” classes exhibited more balanced results, with F1-scores of 0.57 and 0.54, respectively, though both metrics indicate room for improvement.
This performance pattern is likely influenced by class imbalance, as the “undecided” class has only four samples, compared with 25 for “optional” and 22 for “production”. Moreover, the model’s architecture may not fully capture the subtle distinctions between relationship types.
-
Bidirectional LSTM (Bi-LSTM): Finally, we have the Bi-LSTM model, which processes data in both forward and backward directions, providing a more comprehensive understanding. The Bi-LSTM achieved a precision of 83%, a recall of 50%, an F1-score of 62%, and an accuracy of 54%. These results show that Bi-LSTM outperforms the standard LSTM, particularly in precision and F1-score, demonstrating its enhanced ability to capture and process information from both directions. However, its recall and accuracy indicate that there is still room for improvement.
The multi-class relation model achieved a moderate overall accuracy of 0.54. As shown in Fig. 8B, performance varies substantially across classes. The obligatory class attained a precision of 0.83, recall of 0.50, and -score of 0.62. The optional class achieved precision 0.61, recall 0.44, and -score 0.51. The production class demonstrated lower precision 0.44 but higher recall 0.73, yielding an -score of 0.55. The undecided class obtained perfect precision 1.00 but poor recall 0.25, resulting in an -score of 0.40. These results indicate a bias toward majority classes and difficulty recovering minority examples, likely due to class imbalance and limited data diversity. To address these issues, we recommend applying targeted data augmentation and oversampling techniques such as SMOTE (Synthetic Minority Over-sampling Technique) to increase representation of underrepresented classes, while validating performance on a held-out test set to ensure improved recall without introducing noise.
| Binary | LSTM | Bi-LSTM | |
|---|---|---|---|
| Precision | 94% | 67% | 83% |
| Recall | 66% | 40% | 50% |
| F1-score | 77% | 50% | 62% |
| Accuracy | 67% | 54% | 54% |
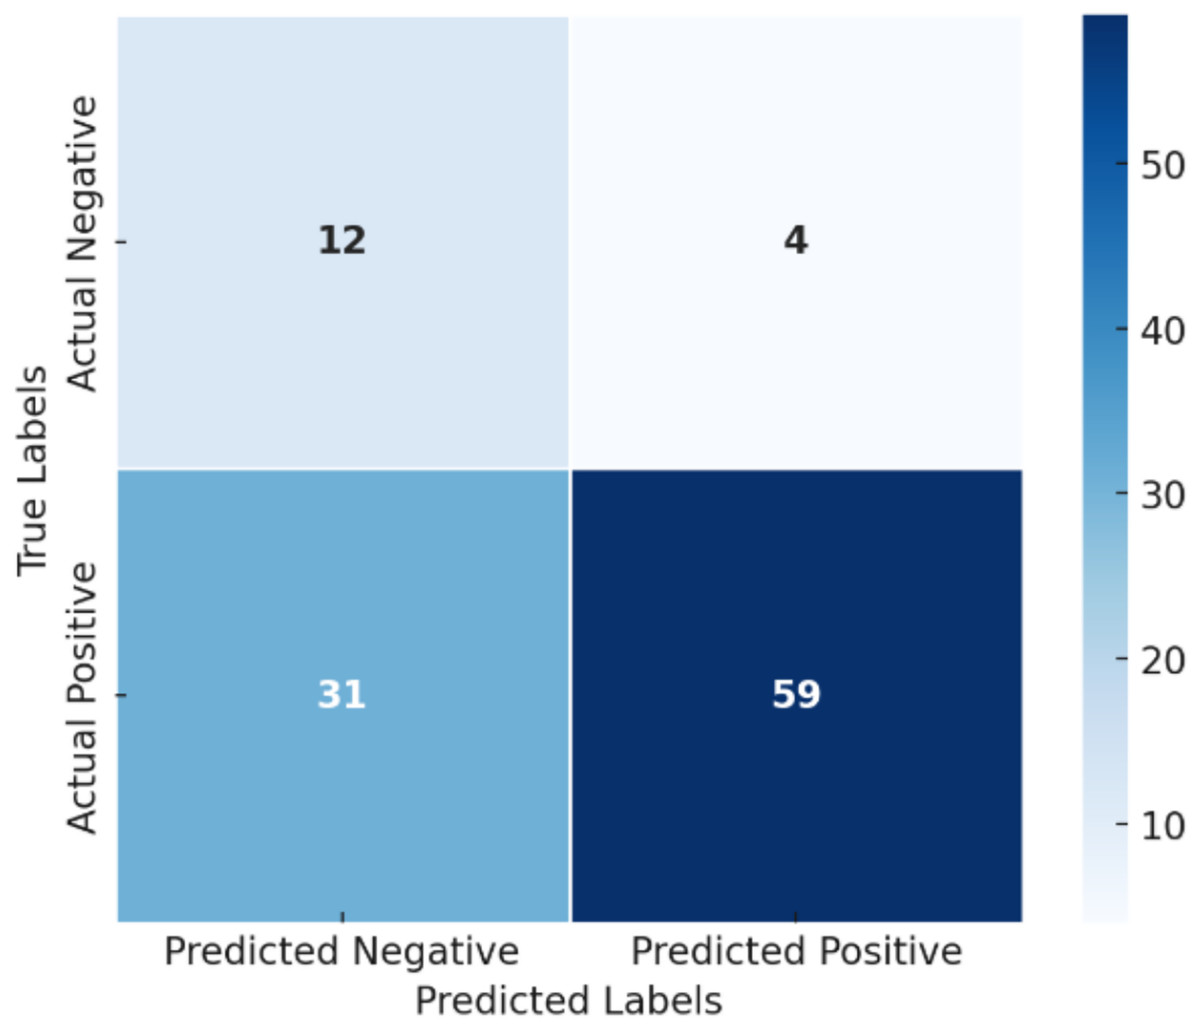
Figure 7: Confusion matrix of the binary relation model.
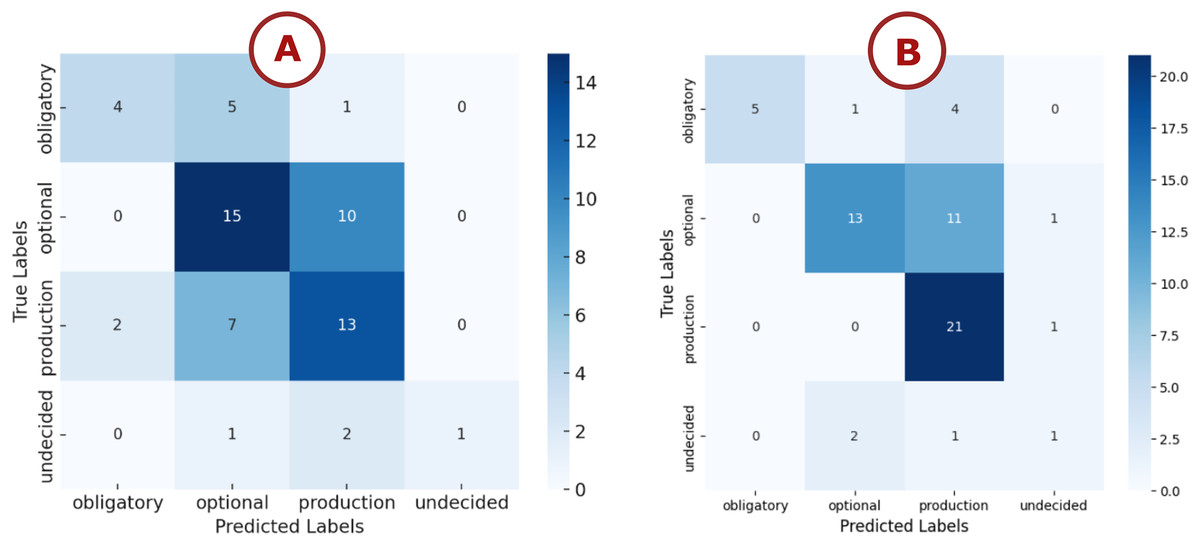
Figure 8: Confusion matrix: (A) LSTM model, (B) Bi-LSTM model.
Model analysis, error interpretation, and scalability discussion
This section complements the quantitative evaluation by analyzing how the NER and Relation Extraction models behaved in practice, including typical error patterns, scalability considerations, and methodological details underlying the results presented earlier.
Model configuration and experimental procedure
All experiments were conducted in Google Colab using a Tesla T4 GPU and 16 GB of RAM. The NER task was evaluated using four models: SpaCy, a generic Transformer model, BERT, and XLNet. Fine-tuning for BERT and XLNet was performed with Adam optimization (learning rate ), batch size 128, gradient accumulation of 3, and early stopping based on validation loss.
For relation extraction, two models were evaluated: a unidirectional LSTM and a bidirectional LSTM. The relation dataset consisted of 301 labeled pairs of stakeholders and information elements, with an 80–20 train–test split. Each model was trained to predict whether a relationship existed and, in the case of the LSTM variants, to classify the relationship into one of five types: Obligatory, Optional, Production, or Undecided.
Error analysis
Named Entity Recognition. The NER models achieved strong quantitative performance; however, qualitative analysis revealed several recurring error types:
False Positives: The models occasionally overgeneralized by labeling generic nouns as organizations. Examples include “application” or “website” being incorrectly tagged as ORG (organization). This typically occurred when the model encountered policy-related terminology resembling company or service names.
False Negatives: Some models failed to recognize multi-token entities such as “Meta Platforms, Inc.”, often due to punctuation issues or limited exposure to such entities during fine-tuning.
These findings suggest that while pretrained models such as BERT and XLNet are effective for recognizing common stakeholder types, they remain sensitive to domain-specific phrasing and inconsistencies in capitalization.
Relation Extraction. For relation extraction models, several characteristic errors were observed:
False Negatives: The Binary and LSTM-based models frequently missed legitimate but rare relationships, such as (developer, API usage information) or (customer, cookies), due to their underrepresentation in the dataset.
False Positives: The models sometimes predicted relations for unrelated pairs such as (partner, anonymized statistics) or (vendor, service logs), primarily because high-frequency co-occurrences biased the classifiers.
The Binary TF–IDF model showed the best balance between precision and interpretability, while Bi-LSTM demonstrated stronger contextual understanding but remained affected by data scarcity.
Scalability discussion
Transformer-based Named Entity Recognition (NER) models such as BERT and XLNet leverage extensive pretraining on large corpora, enabling them to generalize effectively to broader and more diverse text collections with minimal additional fine-tuning. In this study, the NER models demonstrated robust extraction of stakeholder entities with high precision, showing strong adaptability and scalability despite limited annotated data.
Experts note that selecting entity classes is difficult and context-dependent, so it is best to identify the correct class initially rather than adjust classifications afterward.
In contrast, the relation extraction models—particularly the LSTM-based variants—require retraining or augmentation through semi-supervised or weakly supervised labeling to handle larger and more diverse corpora. While the relation extraction dataset contained only 300 annotated examples, the underlying model architectures were designed to scale effectively. Expanding this dataset would help mitigate class imbalance and improve coverage of rare stakeholder–information relationships.
From a computational standpoint, scaling beyond several thousand examples would necessitate GPU batching and efficient sampling strategies to maintain feasible training times. Although the relation extraction models provided strong interpretability, they struggled with underrepresented classes compared to the NER models. Increasing dataset diversity and size—combined with the integration of contextual embeddings and data augmentation—is expected to enhance both performance and generalizability across larger legal text corpora.
Case studies
In this section, we conduct a detailed exploration of two of the most prominent digital platforms—Facebook5 and WhatsApp6 —using their terms and conditions to evaluate the effectiveness of our approaches.
Case study No 1: Facebook
This case study focuses on Facebook, one of the world’s largest and most influential social media platforms. After pasting Facebook’s terms and conditions into the input form, we initiated the prediction process and awaited the results.
Figure 9A illustrates the main visualization interface in TranspVis. The display presents extracted data alongside stakeholder complements, with each element identified by associated IDs. Users can interact with these IDs by clicking on them to visualize the corresponding detailed information.
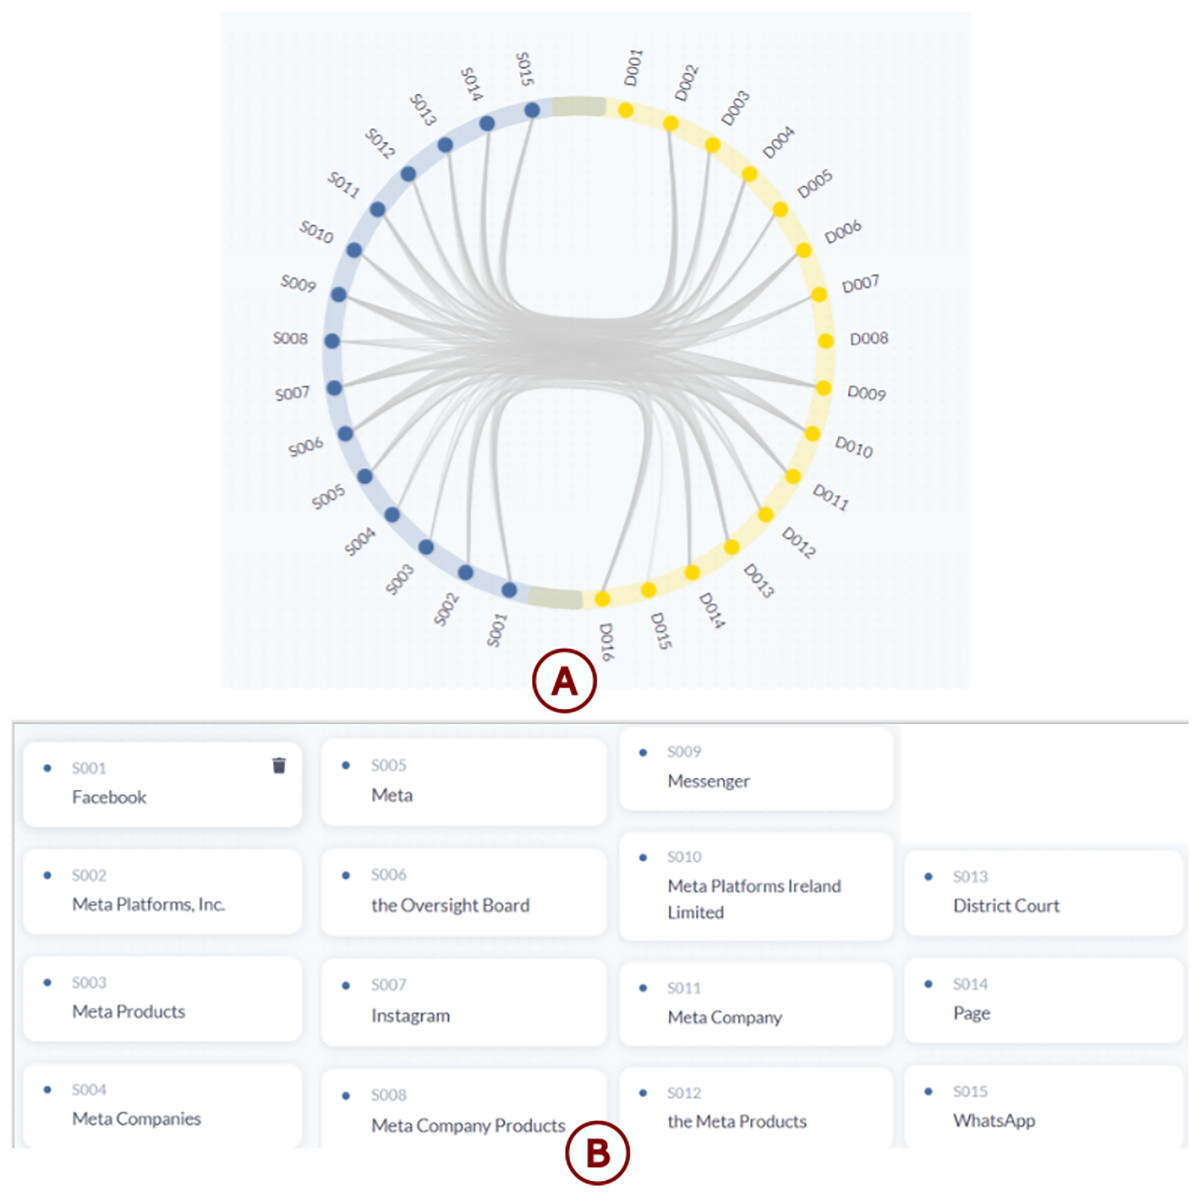
Figure 9: Visualization of BERT model results using TranspVis: (A) Stakeholders (blue) and data entities (yellow) displayed with their associated IDs; (B) stakeholders extracted by the BERT model, linked to their corresponding IDs.
Stakeholders detection: The NER model has extracted 15 different stakeholders represented in Fig. 9B. These stakeholders were added by the BERT model, which is the default model in our application. These stakeholders are standards because the BERT model was trained on commonly named entities.
We also have a choice of exploring and extracting other stakeholders that may not have been extracted by the BERT model by using a different NER model: spaCy, XLNET, or transformer-based models. Figure 10 represents a few results of the spaCy NER model.
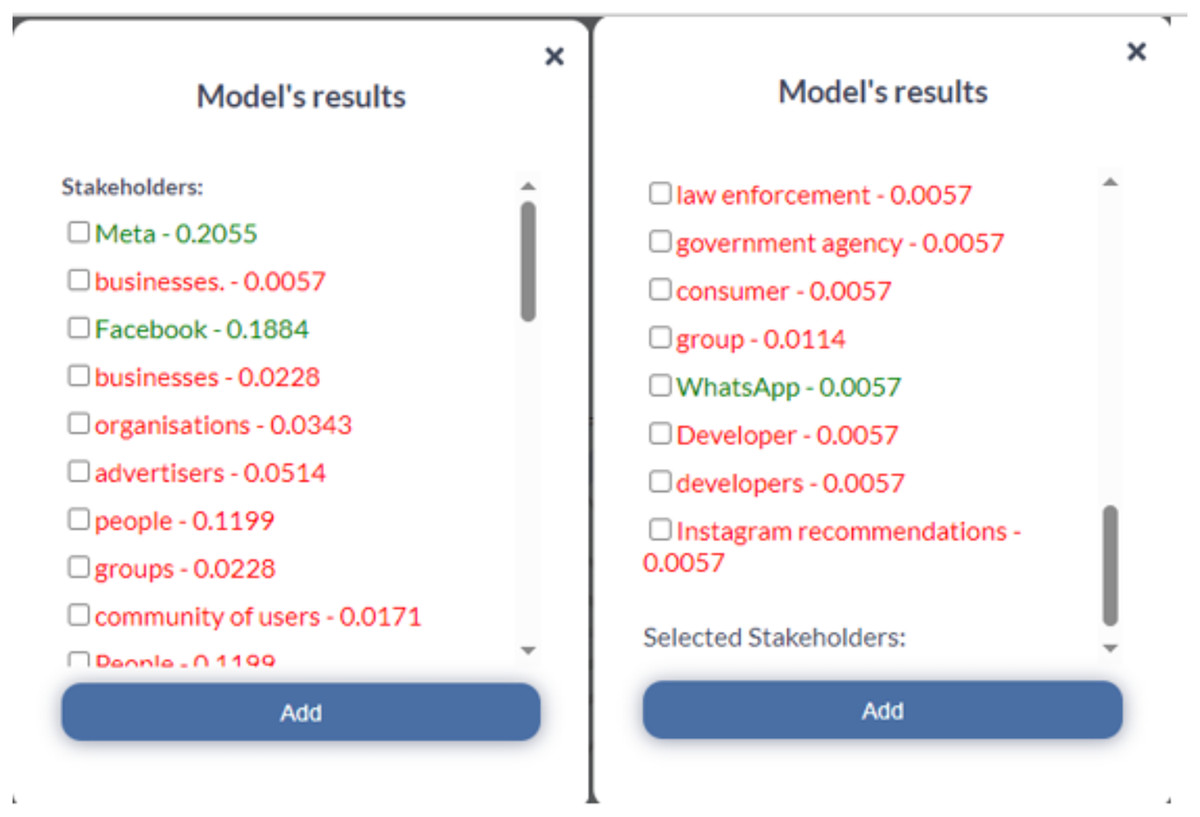
Figure 10: New results from the spaCy NER model: the left interface displays results for Facebook’s terms of service, and the right one for WhatsApp’s Terms of Service.
Red elements represent newly detected stakeholders, while green elements indicate those already existing in the database. The numeric value associated with each entity corresponds to its frequency of occurrence in the text.
We notice that there are many new results (in red), and we can choose the stakeholders that we need and that will help us in our decision-making process. Unlike the other NER models, spaCy was trained on our specific data, which is why it can extract stakeholders’ names like users, businesses, and advertisers. This is the best model for our case studies.
Relations Between Entities: Based on the main visualization circle in Fig. 9A, we notice that the binary model has predicted that there is an existing relation between several stakeholders and information elements. An example of a relation is shown in Fig. 11A.
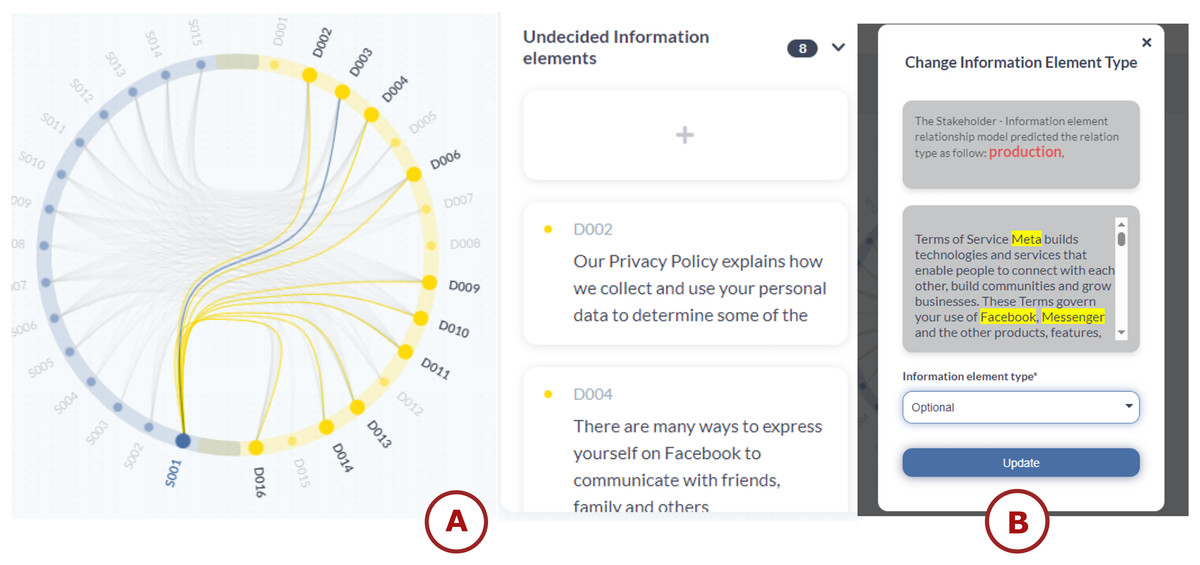
Figure 11: TranspVis: (A) relationships between S001 (Facebook) and D003 (We help you find and connect with people, groups, businesses, organisations and others that). (B) Users can modify the relationship type—either by selecting a new one or accepting the proposed ‘Production’ type.
The text Highlighted elements indicate the stakeholders detected within the selected text.
The application added those relations as “Undecided” because we don’t know their types yet. To change the relation type, we need to click on the relation card and change it. Figure 11B represents how it is processed. Users can check the type relation model for suggestions on relation types. For example, the model might predict that a relation type should be “PRODUCTION” based on its analysis. They can apply their domain expertise to evaluate the model’s suggestion. In this case, we determined that “OPTIONAL” would be more appropriate than the suggested “PRODUCTION” relation type. Users can then select their chosen relation type from the drop-down menu in the interface. For this specific case, they would select “OPTIONAL” to finalize the relation type assignment.
We can do this with all the other relations. This method allows the user to choose the types freely and make their own decision based on the provided text and suggestions.
Case study No 2: WhatsApp
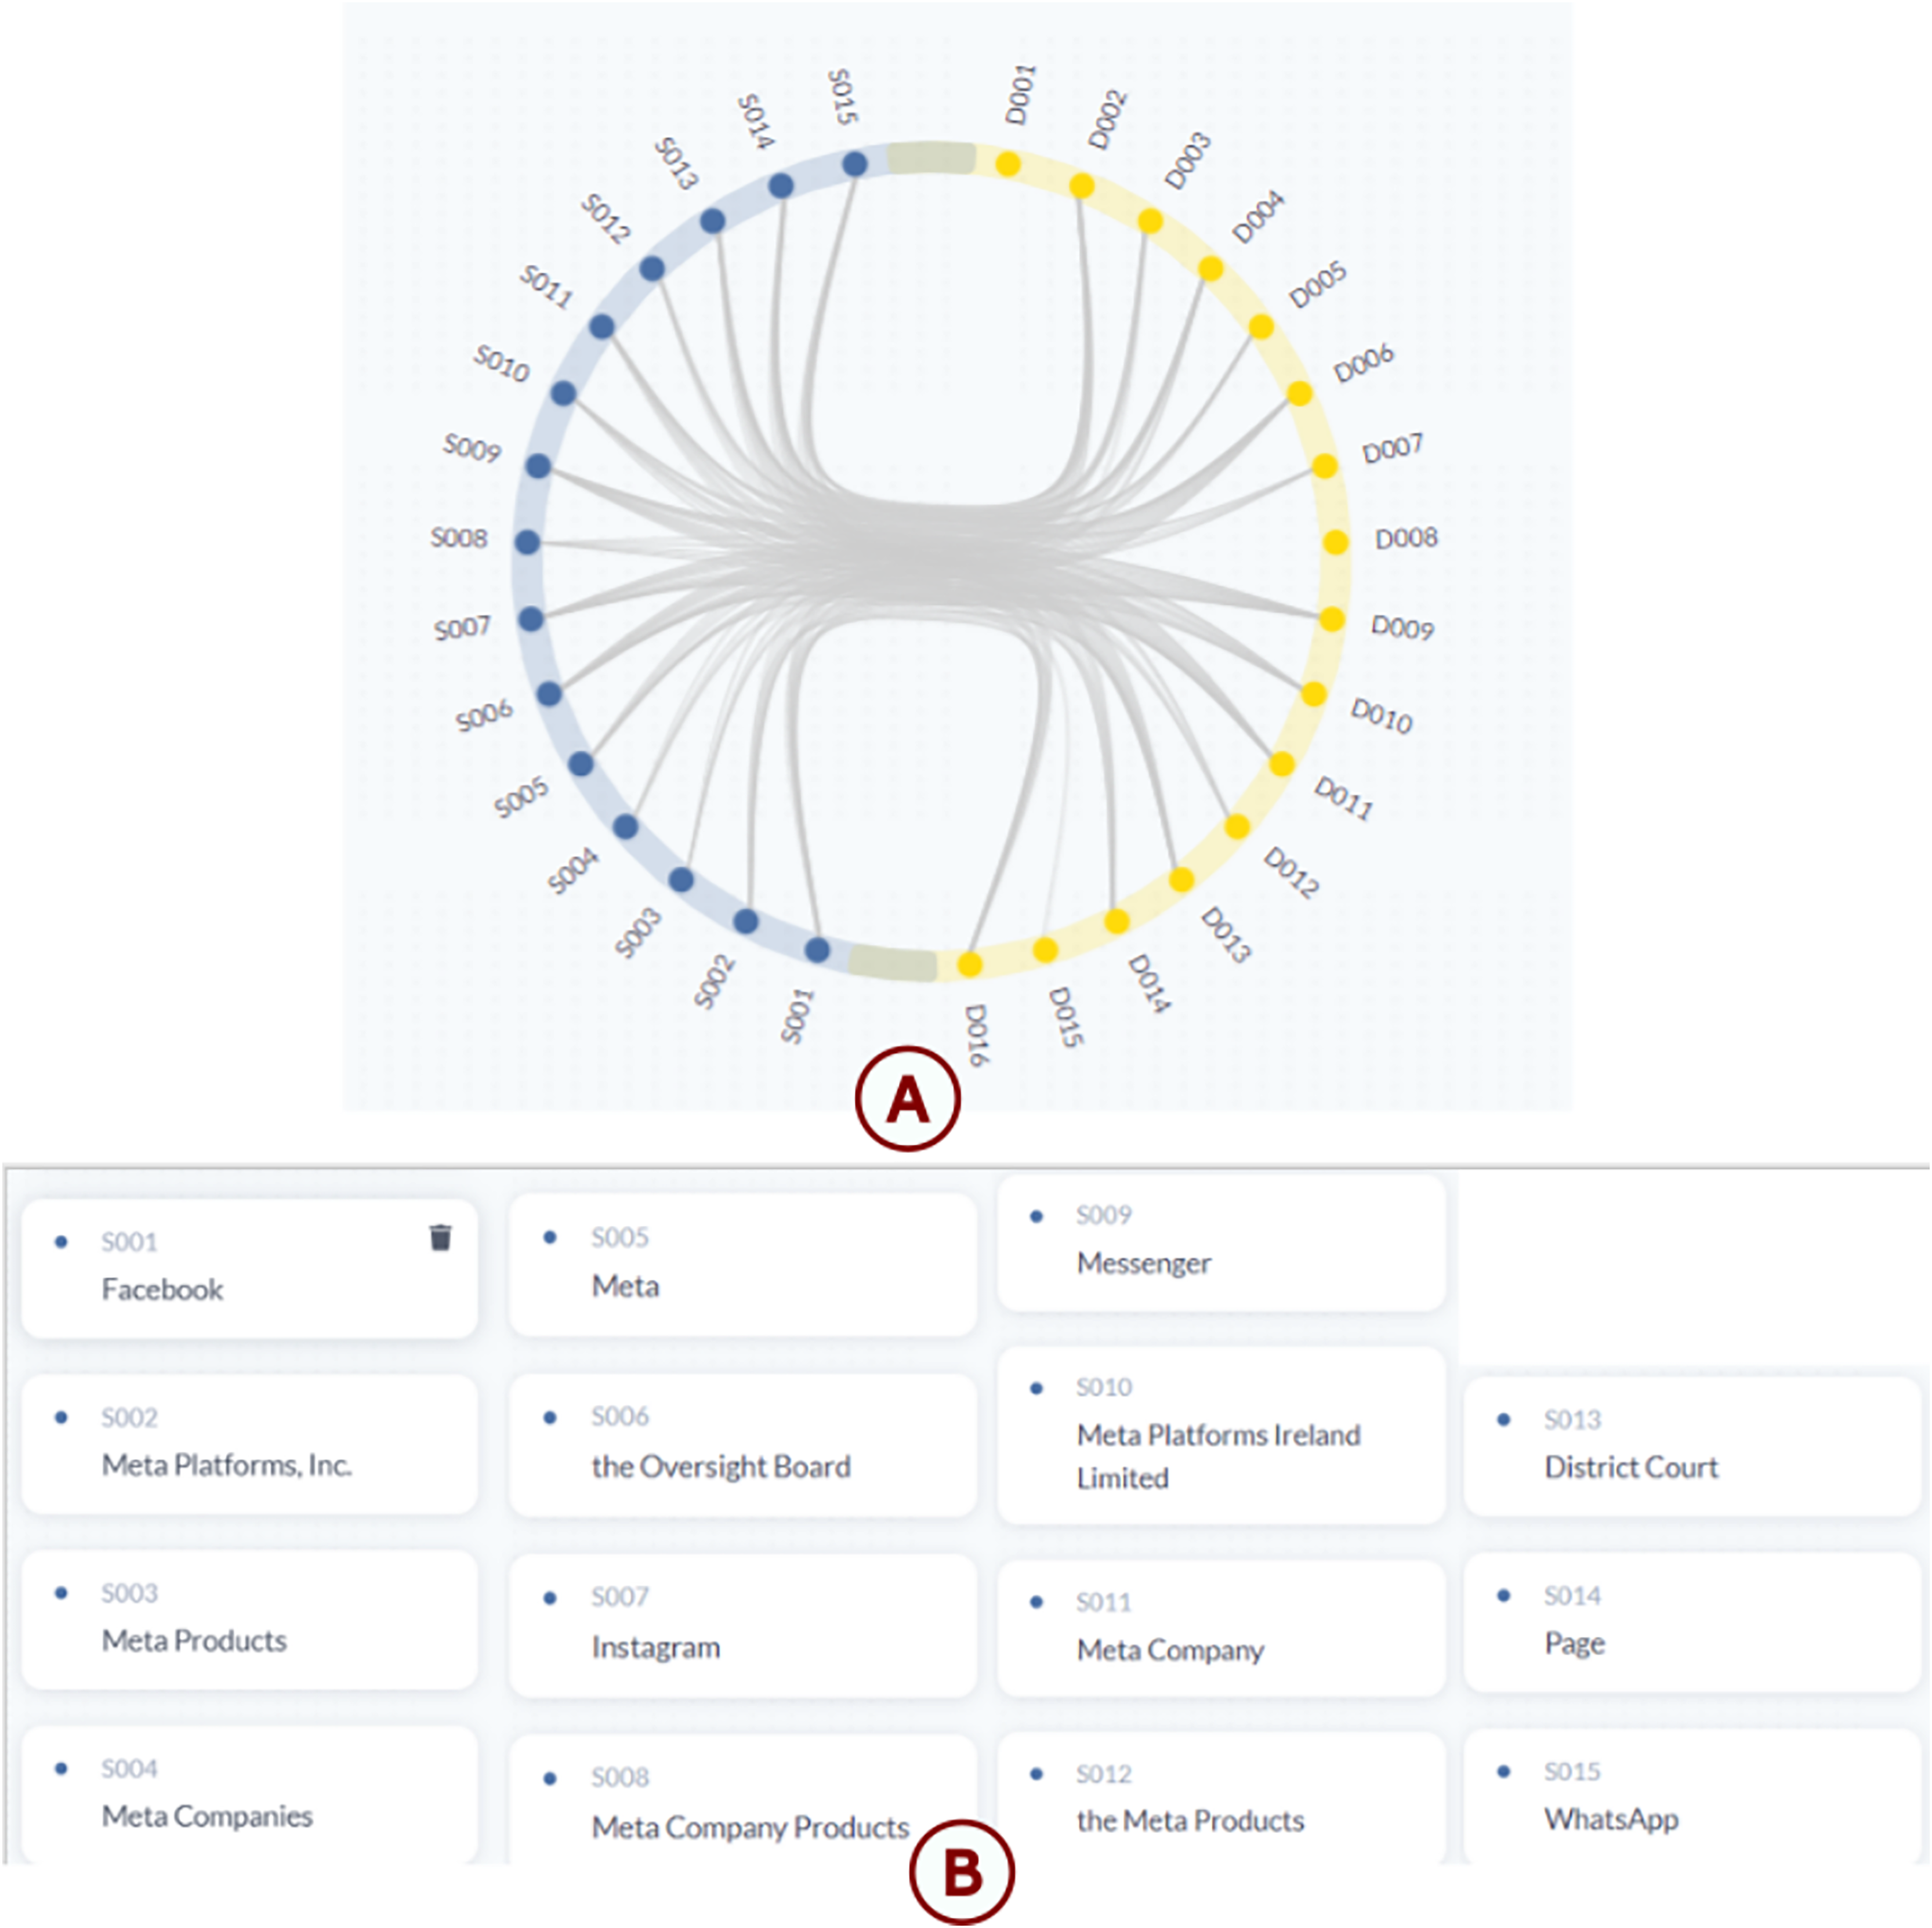
Moving on to our second case study, we shift our focus to WhatsApp, a leading messaging platform known for its widespread adoption and communication functionalities. After pasting the WhatsApp terms and conditions in the form, then waiting for the prediction. Figure 12 represents the main visualization in TranspVis.
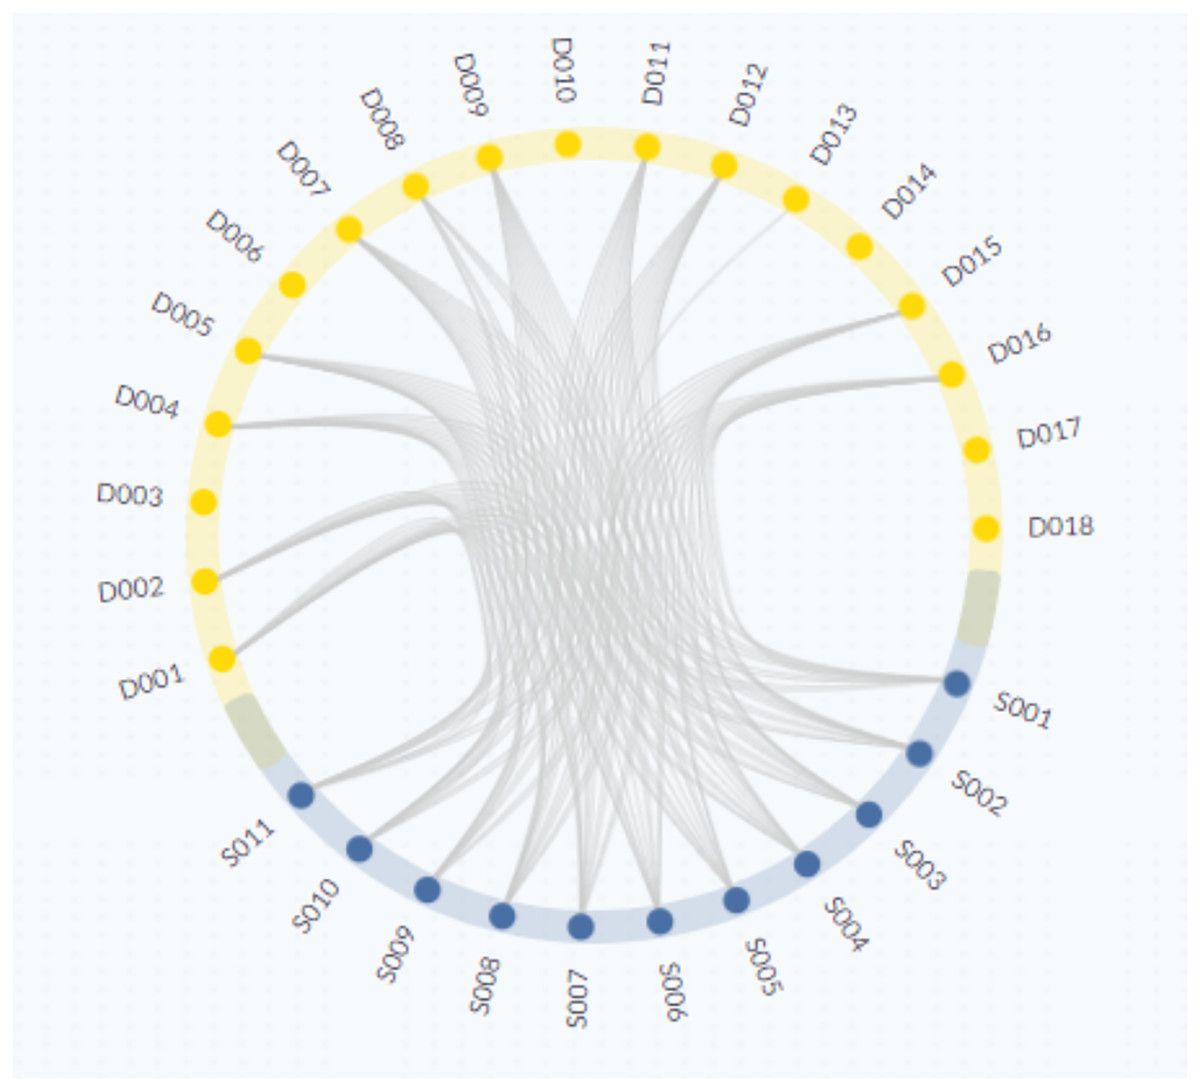
Figure 12: TranspVis results for the WhatsApp application.
Yellow nodes represent information elements of type “Data,” while blue nodes represent stakeholders.
Stakeholder detection: The NER model has extracted 15 different stakeholders represented in Fig. 13A. These stakeholders were added by the BERT model, which is the default model in our application.
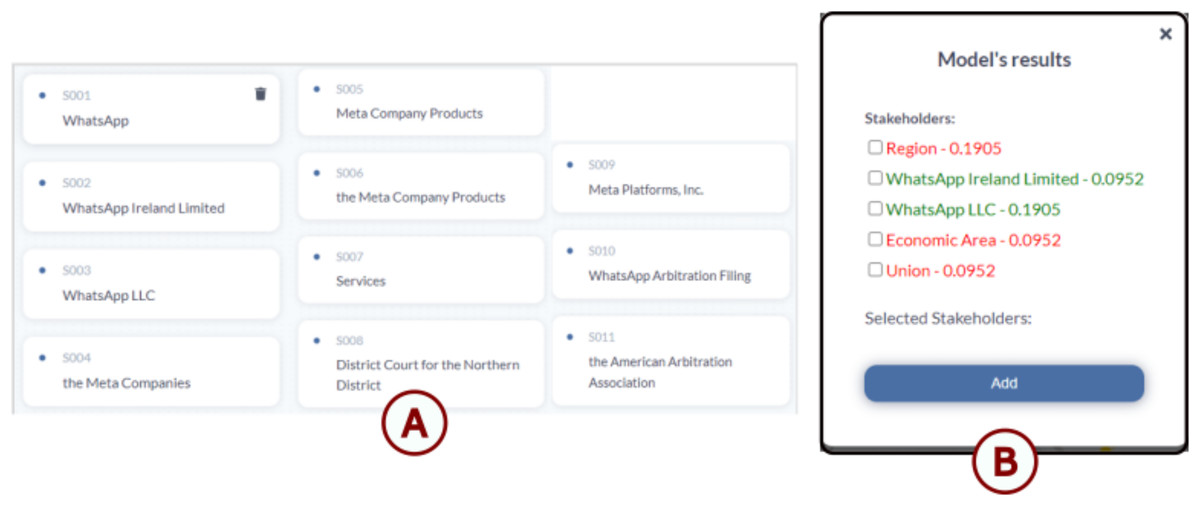
Figure 13: WhatsApp data visualization using TranspVis: (A) list of WhatsApp stakeholders with their corresponding IDs; (B) results from the Transformer models for the WhatsApp application, where green elements represent existing stakeholders and red elements indicate newly suggested ones.
We also have a choice of exploring and extracting other stakeholders that may not have been extracted by the BERT model by using a different NER model: spaCy, XLNET, or transformer-based models. Figure 13B represents a few results of the Transformers NER model.
We notice that this model gave us some new stakeholders, and it is our decision to choose whether we keep them or not.
Relations Between Entities: Based on the main visualization circle in Fig. 12, we notice that the binary model has predicted that there is an existing relation between several stakeholders and information elements. An example of a relation is shown in Fig. 14A.
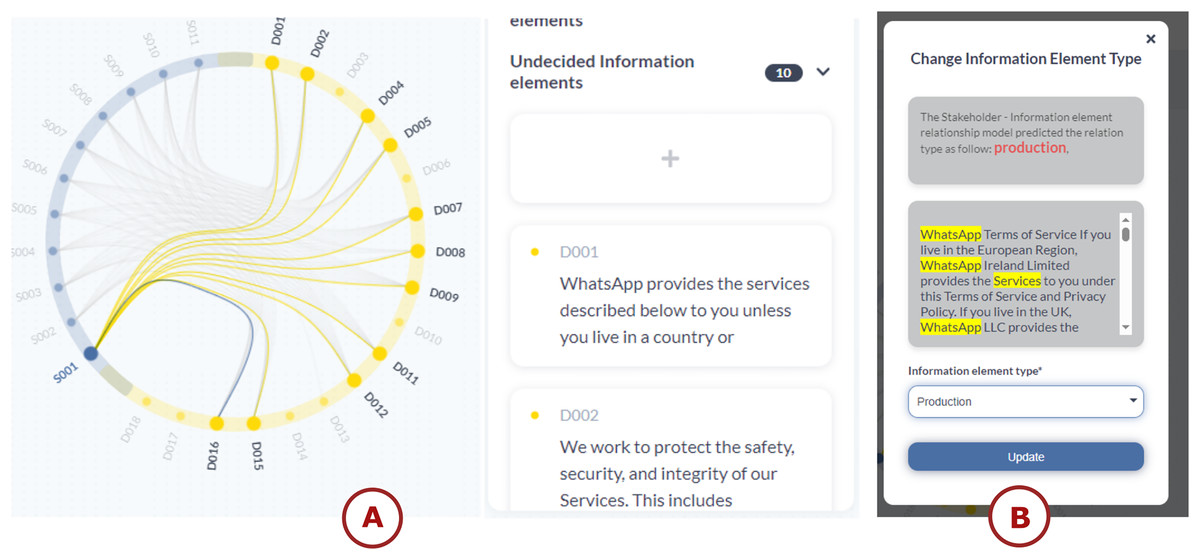
Figure 14: TranspVis: (A) selection of the stakeholder “WhatsApp”. The filter displays only the selected one along with its associated relationships.
The right panel presents the IEs details, (B) updating the relation type to ‘Production’ between the stakeholder ‘WhatsApp’ and IE (chosen one), while displaying the paragraphs in which these stakeholders are cited. The classification model suggests the “Production” relation.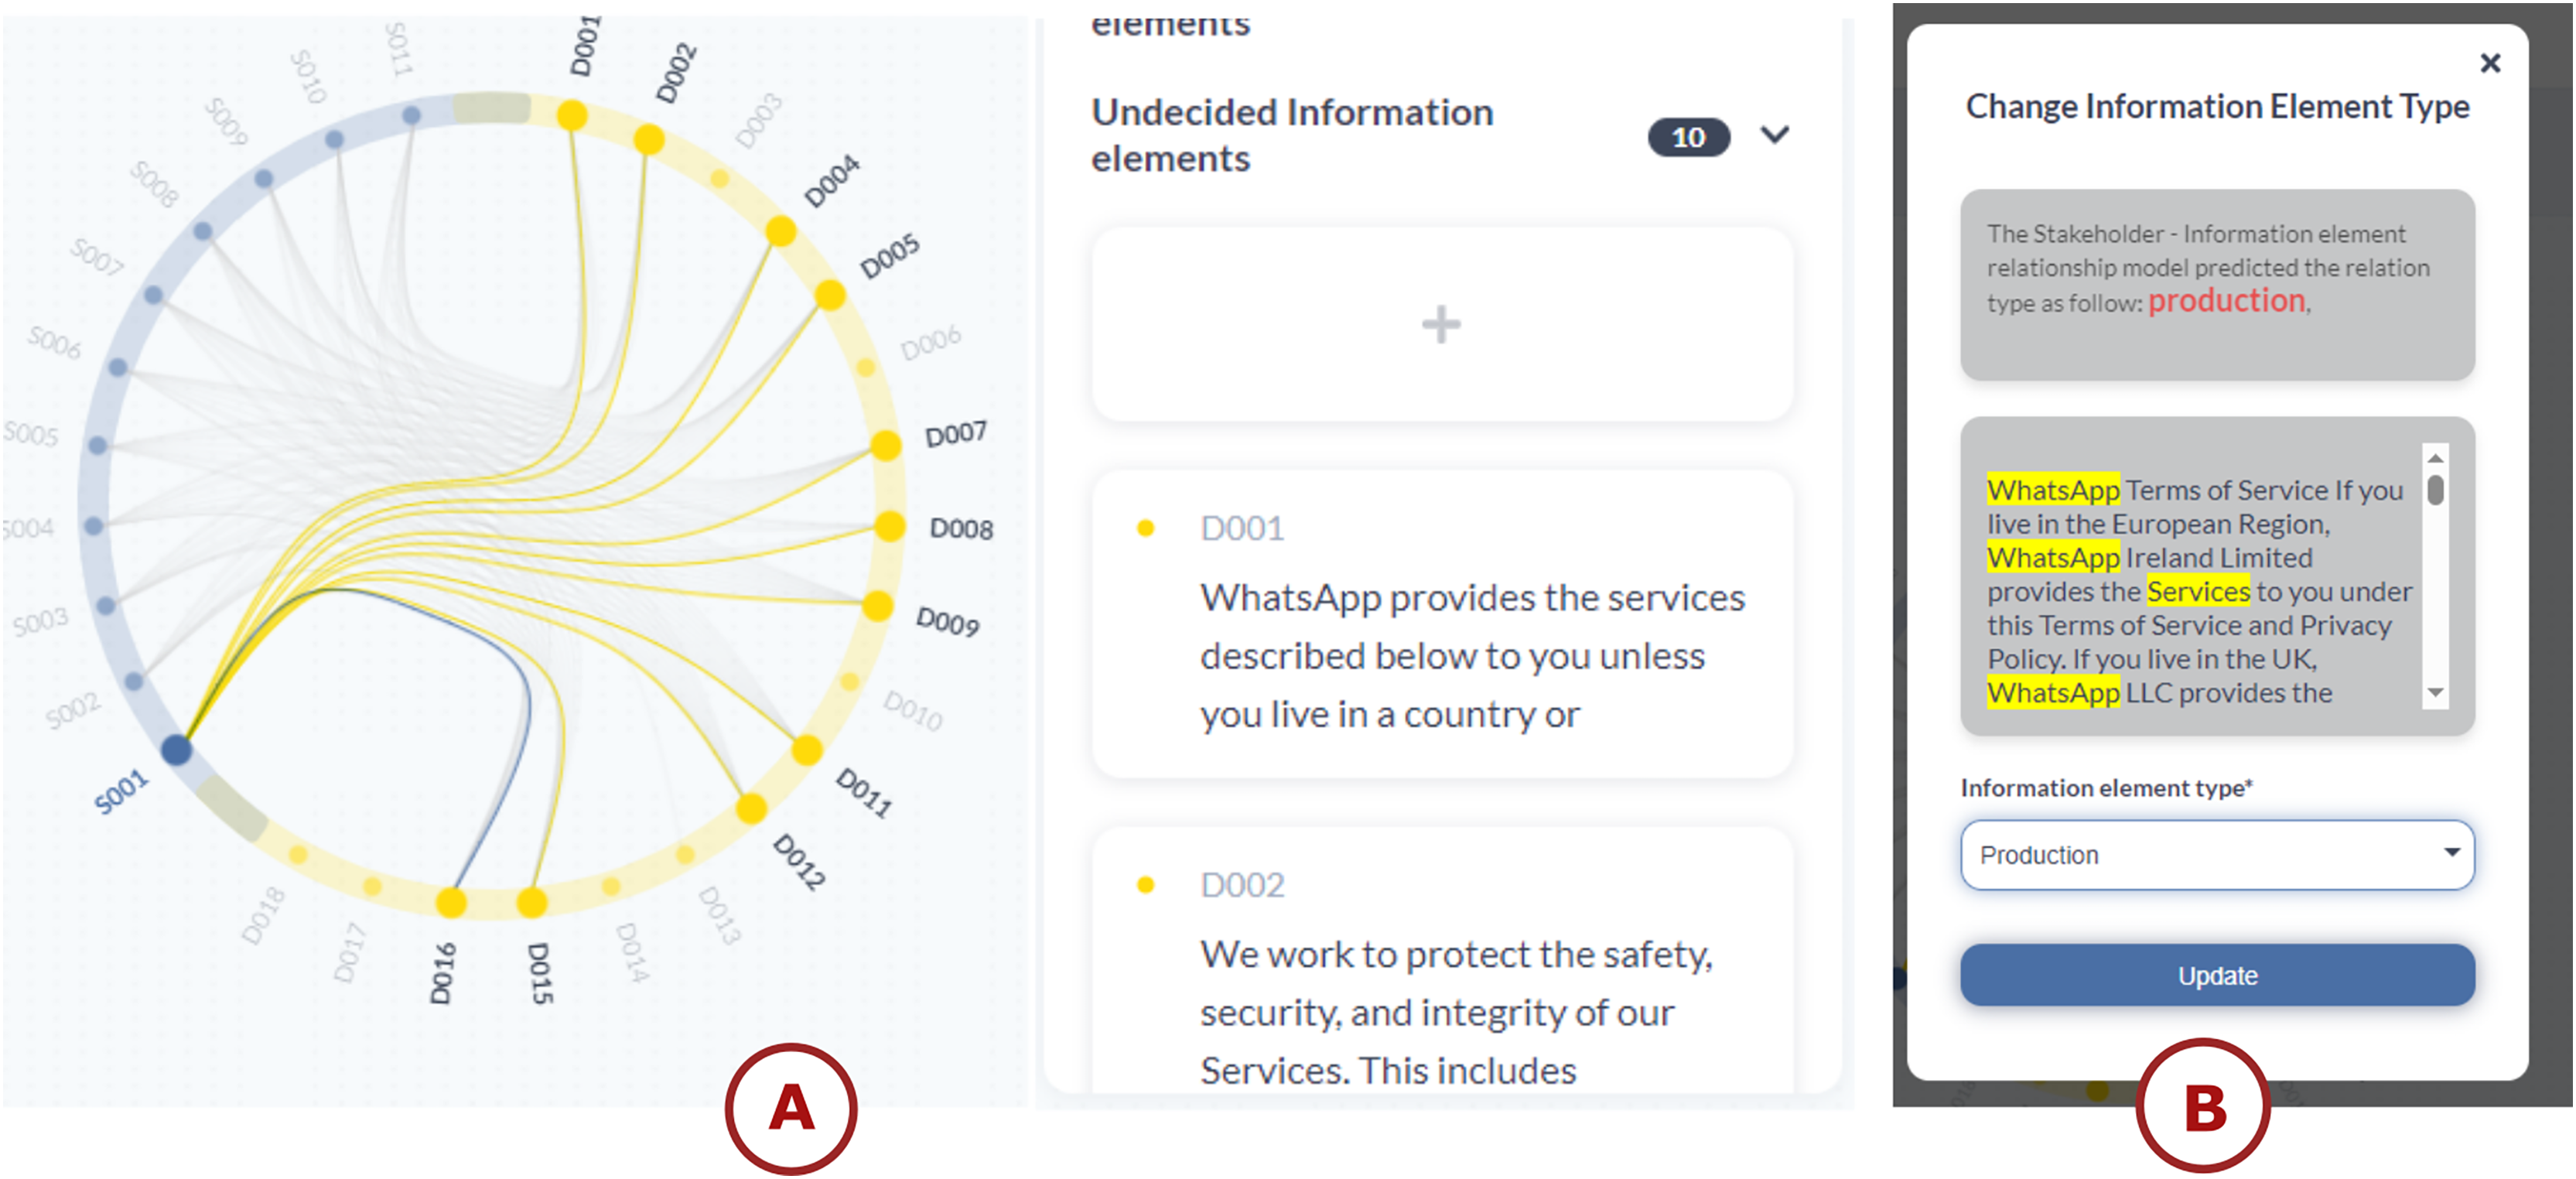
The application added those relations as “Undecided” because we don’t know their types yet. To change the relation type, we need to click on the relation card and change it. Figure 14B represents how it is processed. Users can check the type relation model for suggestions about relationship types. In this case, the model has predicted that “PRODUCTION” would be the appropriate relation type. They can evaluate the model’s suggestion and decide whether to accept it. Here, we have chosen to follow the model’s recommendation of “PRODUCTION”. Users can then select the recommended “PRODUCTION” type from the drop-down menu in the interface. Finally, users can click the “Update” button to confirm and save the new relation type.
We can do this with all the other relations. This method allows the user to choose the types freely and make their own decision based on the provided text and suggestions.
Users study
Assessment approach
This study employs an online evaluation protocol (Qu & Hullman, 2017; Lam et al., 2011) to gather user feedback on the TranspVis application through a structured form, following a user experience (UX) evaluation scenario (Lam et al., 2011).
The protocol consists of four sequential steps:
-
1
Understanding the working environment: Users received instructions for downloading the tool from GitHub (if not already installed), along with guidance on using TranspVis and understanding its context and objectives.
-
2
Data explanation and visualizations: Participants were provided with an instructional video demonstrating TranspVis functionality and workflow.
-
3
Specifying evaluation constraints: A structured questionnaire with multiple sections was created to facilitate comprehensive evaluation.
-
4
Presentation: The evaluation was conducted online using Google Forms7 .
Participant demographics
The evaluation involved 18 participants representing three primary groups: (1) undergraduate and master’s students (aged 18–24) from information systems and computer science programs; (2) transparency and legal experts, including the authors and their colleagues; and (3) university professors specializing in digital ethics and policy.
Participants were recruited through academic mailing lists and professional networks to ensure representation from both technical and legal domains. The study employed a mixed-format approach: some experts accessed TranspVis directly from the GitHub repository in their professional environments and demonstrated its functionalities to colleagues, while students and other participants completed evaluations in supervised settings.
To ensure consistent understanding, all participants watched a short instructional video summarizing TranspVis’s key features before beginning evaluation tasks.
Evaluation tasks and metrics
Participants performed structured tasks designed to assess newly integrated TranspVis features, particularly entity detection, stakeholder weighting, and visual relationship exploration. The tasks required participants to:
-
1.
Load a terms and conditions document into the system;
-
2.
Identify and highlight key stakeholders detected by the model;
-
3.
Explore visual relationships among entities using the transparency graph;
-
4.
Interpret stakeholder weighting scores displayed in the interface.
After task completion, participants rated the clarity, usefulness, and intuitiveness of each functionality using a 5-point Likert scale (1 = very poor, 5 = excellent). The questionnaire also captured participants’ frequency of using applications that require terms and conditions review, with the following distribution:
Always: 27.8%
Frequently: 38.9%
Occasionally: 16.7%
Rarely: 16.7%
Evaluation results
The Table 7 below summarizes the form’s questions about various aspects of the “TranspVis” application that were evaluated by a scale [1…5]:
| Q3.1 | Based on the watched video, how would you rate your overall experience with “TranspVis”? |
| Q3.2 | Based on the watched video, how easy was it to use “TranspVis”? |
| Q4.1 | How would you rate the usefulness of adding a new application? |
| Q4.2 | How would you rate the simplicity of adding a new application? |
| Q4.3 | How would you rate the simplicity of deleting an application? |
| Q4.4 | How would you rate the usefulness of adding a new stakeholder/Information element? |
| Q4.5 | How would you rate the simplicity of adding a new stakeholder/Information element? |
| Q4.6 | How would you rate the simplicity of updating stakeholder/Information element weight/name/description? |
| Q4.7 | How would you rate the usefulness of updating the relation type? |
| Q4.8 | How would you rate the simplicity of updating the relation type? |
| Q5.1 | How would you rate the design of the home page? |
| Q5.2 | Was the information presented clearly and intuitively? |
| Q6.1 | How effective was the transparency visualization in helping you understand the terms and conditions? |
| Q6.2 | How would you rate the speed and responsiveness of the application? |
The previous table’s results are visualized in the following bar chart (See Fig. 15).
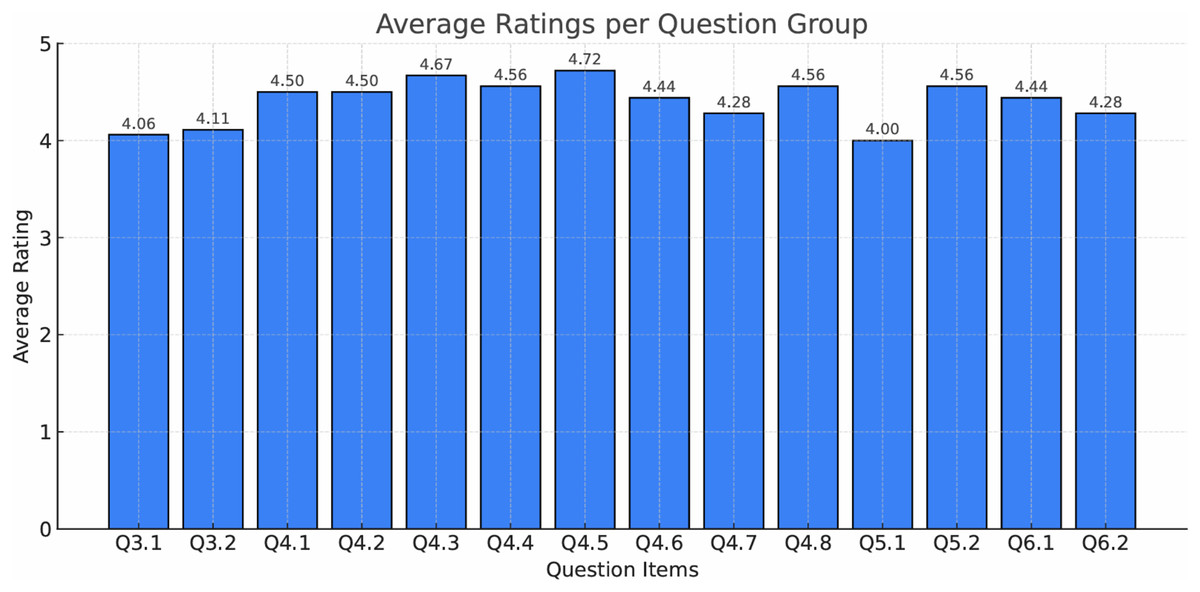
Figure 15: Average user ratings for each question group in the evaluation survey.
The blue bar chart summarizes participants’ responses across multiple usability and satisfaction criteria (Q3–Q6).
Users generally perceive TranspVis positively across various aspects such as functionalities, features, and overall satisfaction. The app receives high ratings for specific functionalities and features indicating strong performance. However, there are also areas identified for potential improvements.
Synthesis
The use of multiple ML models enhances decision-making by leveraging diverse model strengths for more accurate and nuanced insights. This approach offers several benefits:
Customization and flexibility: Users can choose models best suited for their data, such as legal texts or medical records. Different tasks can be addressed by switching models based on specific needs.
User empowerment and control: Users can experiment with models to find the most relevant and accurate results. Users gain insights into model workings, strengths, and limitations.
Enhanced trust and confidence: Users trust the system more when they can select suitable models. Offering multiple models demystifies the system’s operations.
Adaptability to evolving needs: Users can switch models as their needs change, without overhauling the system. User feedback helps refine models, improving decision-making over time.
Improved decision quality: Running data through different models allows users to identify consistent and reliable insights. Users can make more nuanced decisions by understanding model interpretations.
Experts feedback
Expert feedback emphasized the importance of balancing manual and automated approaches in the extraction of transparency information. In earlier versions of TranspVis, both manual and automatic evaluations were conducted, allowing experts to identify the strengths and limitations of each approach. Based on their observations, the automation process was further developed and integrated into the current version of the tool.
During the user study, experts evaluated this enhanced automation process and confirmed its effectiveness in improving the clarity and consistency of extracted information, as well as the overall visualization of transparency data. They also recognized its practical potential and recommended exploring collaborations with small and medium-sized enterprises for real-world deployment.
Regarding the machine learning components, experts noted that while the Binary Relation model achieves high precision, its relatively lower recall may lead to missing certain relevant relationships. This limitation, previously identified in earlier TranspVis evaluations, remains a key area for refinement. Additional training data and fine-tuning are expected to further improve recall and ensure broader coverage when processing complex legal documents.
Conclusion
In conclusion, this research highlights the critical importance of transparency in software applications, with a particular focus on the often-overlooked analysis of terms and conditions. The study demonstrates the effective use of natural language processing and machine learning techniques to model and extract key transparency requirements from unstructured legal text, including stakeholders, information elements, and their interrelationships. A major contribution is the enhanced TranspVis tool, which introduces a unified framework that combines automated information extraction, relationship detection, and the assignment of importance weights to entities—providing a more nuanced understanding of transparency structures.
By integrating intelligent algorithms with interactive visualization techniques, TranspVis offers an innovative and interpretable approach to exploring, analyzing, and communicating complex transparency information in an accessible manner.
Future work will focus on three main directions: (1) expanding the relationship identification corpus to recognize a broader range of semantic connections between transparency elements, supported by expert input and large language model (LLM)—based contextual reasoning; (2) enhancing validation through the participation of a more diverse set of domain experts to improve accuracy and robustness; and (3) advancing visualization capabilities with richer visual encodings, dynamic weighting, and enhanced interactivity to support deeper exploration and comparative transparency analysis.