
Predicting student dropout in Saudi Universities using machine learning and explainable AI
- Published
- Accepted
- Received
- Academic Editor
- Chaman Verma
- Subject Areas
- Artificial Intelligence, Computer Education, Data Mining and Machine Learning
- Keywords
- Student dropout, Saudi Arabia, Machine learning, Explainable AI, LEAF
- Copyright
- © 2026 Albugami et al.
- Licence
- This is an open access article distributed under the terms of the Creative Commons Attribution License, which permits unrestricted use, distribution, reproduction and adaptation in any medium and for any purpose provided that it is properly attributed. For attribution, the original author(s), title, publication source (PeerJ Computer Science) and either DOI or URL of the article must be cited.
- Cite this article
- 2026. Predicting student dropout in Saudi Universities using machine learning and explainable AI. PeerJ Computer Science 12:e3490 https://doi.org/10.7717/peerj-cs.3490
Abstract
One of the major challenges of academic institutions is the student dropout rate. It negatively impacts students, universities, and society by precluding student success, wasting time and financial resources, and reducing graduation rates. Previous studies have used machine learning (ML), deep learning (DL), and explainable artificial intelligence (XAI) techniques to predict dropout. However, most of these studies focused primarily on academic factors and were often limited to a single educational institution. Although national reports indicate that 40% to 50% of university students in Saudi Arabia do not complete their programs, few studies have examined dropout at various universities in the country or considered a broader set of factors. Therefore, this research aims to develop predictive models for academic dropout in Saudi universities using ML and DL techniques, taking into account various academic, personal, social, and cultural factors. Data were collected from 4,560 students and then processed and analyzed using twelve feature selection-based learning models. Shapley Additive Explanations (SHAP) and Local Interpretable Model-agnostic Explanations (LIME) were used as XAI models to identify the most influential features, including GPA, academic year, employment status, family/friends support, and prior major knowledge. The results indicate that the K-Nearest Neighbors (KNN)-based Recursive Feature Elimination (RFE) model achieves the best performance, with an accuracy of 97.6%. Additionally, the Local Explanation Evaluation Framework (LEAF) showed that LIME outperformed SHAP on all four metrics: fidelity, local concordance, prescriptivity, and stability. These findings provide insights into the key factors influencing student dropout at Saudi universities and support the development of early intervention strategies.
Introduction
Student dropout is one of the most prominent issues facing academic institutions. It refers to students who discontinue their studies before completing the degree requirements (Tinto, 1994). This issue negatively impacts student success and leads to many consequences, such as loss of resources, time, and opportunities for both students and universities (Tayebi, Gomez & Delgado, 2021).
Statistics show that up to 32.9% of undergraduate students in the United States do not complete their degree program (Hanson, 2024). In South Africa, up to 60% of university students drop out during their first year of study (Bizcommunity, 2024). In Australia, 25.4% of students who began their bachelor’s studies in 2017 had dropped out by 2022, which represents the highest dropout rate recorded since 2005 (Hare, 2024). In Spain, university dropout rates are 16.7% for males and 9.7% for females, which is the second highest among EU countries after Romania (Ibez-Cubillas et al., 2023). These statistics indicate high dropout rates worldwide and underscore the need for a deeper investigation into the contributing factors.
Researchers have increasingly turned to advanced methods to better understand and predict dropout rates. Prior studies have used machine learning (ML) (Kemper, Vorhoff & Wigger, 2020; Prenkaj et al., 2021; Albreiki, Zaki & Alashwal, 2021), deep learning (DL) (Melo et al., 2022; Mbunge et al., 2022; Delen, Davazdahemami & Dezfouli, 2023), explainable artificial intelligence (XAI) (Villar & Andrade, 2024; Baranyi, Nagy & Molontay, 2020; Alwarthan, Aslam & Khan, 2022), and exploratory statistical analysis techniques (Ashour, 2020; Gupta et al., 2020; Garcia-Zanabria et al., 2022) to examine student dropout. While the methodologies and scopes of these studies vary, they are often limited to a single university or department, which reduces generalizability to broader student populations. In addition, most prior research has focused primarily on academic factors such as grade point average (GPA), attendance, and student participation (Tayebi, Gomez & Delgado, 2021; Uliyan et al., 2021). These factors alone cannot fully explain the complexity of the dropout problem. However, social and cultural factors may have a greater influence on students’ decisions to drop out than academic performance alone (Ashour, 2020; Singh & Alhamad, 2022).
Recent data from the World Bank show a clear gap between higher education enrollment rates and graduation rates in Saudi Arabia. The gross enrollment ratio (GER) peaked in 2019 at 79.6% and stabilized at 74% by 2020–2022 (The Global Economy, 2023). In contrast, the gross graduation ratio (GGR) remained low, reaching 43.1% in 2020 and 49.9% in 2021 and then declining again to 42.3% in 2022 (World Bank Group, 2023). Notably, it appears that 40% to 50% of students enrolled in higher education do not complete their programs. This percentage indicates the degree of student retention challenges in Saudi universities and highlights the importance of reducing student dropout rates. However, few studies have addressed the phenomenon of student dropout at various Saudi universities or examined a wide range of contributing factors.
Previous studies primarily examined academic factors or focused on limited institutional contexts. Conversely, this study provides a more comprehensive analysis by integrating personal, academic, and sociocultural dimensions of student dropout across 30 public and several private Saudi universities. It also introduces a new dataset specifically developed for this research. Furthermore, it applies a methodological framework that combines multiple machine learning algorithms with explainable AI techniques (SHAP, LIME, and LEAF) to ensure both high predictive performance and interpretability. This integration allows for a deeper understanding of the underlying reasons for student dropout.
To achieve these objectives, the research addresses the following research questions (RQs).
RQ1: What are the possible factors contributing to the student dropout rate in Saudi universities?
RQ2: How well do machine learning models perform when considering the proposed factors, and which model achieves the highest accuracy?
RQ3: How well do XAI techniques perform in providing the most contributing factors based on the obtained results?
The remainder of this article is organized as follows: ‘Related Work’ reviews related work on student dropout prediction. ‘Methodology’ describes the dataset and methodology. ‘Experimental Results’ presents the experimental results. ‘Discussion’ provides a comprehensive discussion of the findings. ‘Practical Implications’ outlines the practical implications of the study and ‘Conclusion’ concludes the article and outlines future research directions.
Related work
This section presents an overview of existing research on student dropout prediction. It explores the factors broadly influencing student dropout, machine learning and deep learning models, the use of explainable AI in student dropout, and student dropout specifically in Saudi Arabia. For a more comprehensive analysis of recent studies, readers are referred to our previously published work: “From Data to Decision: Machine Learning and Explainable AI in Student Dropout Prediction” (Albugami, Almagrabi & Wali, 2024).
Factors influencing student dropout
Understanding the factors influencing student dropout is essential for developing effective intervention strategies. Age, gender, employment status, and marital status are among the key demographic factors influencing student dropout. Several studies have shown that younger students and males are generally more likely to dropout, particularly during the early academic years, often due to financial or personal responsibilities (Mnyawami, Maziku & Mushi, 2022; Gonzalez-Nucamendi et al., 2023; Cocorad et al., 2021; Kabashi, Shabani & Caka, 2022; Ashour, 2020). Employment has also been linked to higher dropout rates for both genders, as balancing work and study responsibilities can increase academic pressure and disengagement (Sandoval-Palis et al., 2020). Moreover, family-related obligations, such as marriage and childcare, have been identified as additional factors contributing to dropout among female students (Ashour, 2020).
Academic performance is one of the critical factors influencing student dropout (Singh & Alhulail, 2022; Kim et al., 2023; Costa et al., 2020). Early difficulties, low GPA, academic dissatisfaction, and poor grades in core courses are consistently linked to higher dropout risk (Murshed, 2021). However, several studies emphasize that academic difficulties alone cannot fully explain student dropout, as dropout often results from the combined influence of academic, personal, and social factors (Yair, Rotem & Shustak, 2020).
Social and cultural factors may significantly influence student dropout. In some cultures, high parental pressure toward specific career paths and early marriage may conflict with students’ personal goals, leading to academic difficulties, psychological problems, and dropout (Ashour, 2020; Alaoui, Sigamoney & Dogra, 2021). In the UAE, where cultural norms are similar to those of Saudi Arabia, family pressure and early marriage are the key factors affecting the dropout rate for both genders (Ashour, 2020). Language barriers may also play a role, especially when the language of instruction differs from the student’s native language (Orong et al., 2020). These findings highlight the need for further investigation of these sociocultural factors within Saudi Arabia.
Machine learning and deep learning in student dropout
Recent studies have extensively applied machine learning and deep learning models to predict student dropout. For instance, Hoca & Dimililer (2025) presented a predictive framework using several algorithms such as Support Vector Machines (SVMs), K-Nearest Neighbors (KNNs), Logistic Regression (LR), Gaussian Naive Bayes (GNB), Artificial Neural Networks (ANNs), Random Forest (RF), Decision Tree (DT), CatBoost (CBs), and Classification And Regression Trees (CARTs). Among them, CatBoost achieved the highest accuracy of 83%. Similarly, Revathy, Kamalakkannan & Kavitha (2022) applied various machine learning models to predict student dropout. The achieved accuracies were 94% for SVM and linear discriminant analysis (LDA), 95% for LR, and 97.6% for KNN.
In another study, Hassan, Muse & Nadarajah (2024) utilized data from the 2022 National Education Accessibility Survey to evaluate multiple models, including DT, RF, SVM, GNB, KNN, and LR, where the Random Forest model achieved the highest accuracy of 95%. Furthermore, Aini et al. (2025) applied several machine learning algorithms, including DT (C4.5), Naive Bayes, SVM, and KNN, to predict student dropout using university academic data. The C4.5 and SVM models achieved the highest accuracy of 94.44%, whereas KNN and Naive Bayes achieved approximately 93%.
A systematic review by Andrade-Girn et al. (2023) showed that model performance primarily depends on the type and quality of input data. Ensemble and tree-based algorithms such as RF, Gradient Boosted Tree, LightGBM, and XGBoost achieved the highest predictive accuracy (94–99%). Deep learning models (e.g., Multi-Layer Perceptron (MLP), Convolutional Neural Network (CNN)) also demonstrated competitive accuracy (88–97%) but required larger datasets and longer training times. Traditional models (e.g., LR, SVM) performed well on smaller datasets but were outperformed by ensemble methods.
Several studies have consistently shown the effectiveness of boosting algorithms and ensemble models over traditional ML models. For instance, Villar & Andrade (2024) reported that LightGBM and CatBoost achieved AUC values exceeding 90%, outperforming other models. Similarly, Fernandez-Garcia et al. (2021) found that Gradient Boosting was the best model at enrollment, whereas SVM achieved a recall of 91.5% in the fourth semester. Wang & He (2025) also evaluated multiple machine learning algorithms to predict undergraduate dropout among domestic and international students. Among the tested models, LightGBM achieved the highest performance for domestic students with an accuracy of 90.14%, while CatBoost produced the best results for international students with an accuracy of 90.04%. Other models such as XGBoost, Random Forest, and Gradient Boosting also showed comparable performance, each exceeding 89% accuracy.
Ensemble models that combine ML and DL also achieved high accuracy. Niyogisubizo et al. (2022) proposed a stacking model of RF, XGBoost, GB, and FNN, achieving an accuracy of 92.18%. Deep learning models, particularly the MLP, have also shown high performance. Delen, Davazdahemami & Dezfouli (2023) utilized an MLP to predict freshman student dropout with an accuracy of 88.4%. Similarly, Melo et al. (2022) reported a higher accuracy of 97% using MLP in predicting student dropout.
Explainable artificial intelligence in student dropout
The terms “interpretable” and “explainable” are used interchangeably in the field of XAI. Research by Burkart & Huber (2021) describes the difference between the two terms, as interpretability is used to describe the model’s internal workings, whereas explainability is used to explain the model results and identify which features affect the prediction. In this research, explainability techniques are used to explain the model’s results.
Among the widely used XAI techniques, SHAP has shown consistent performance in both global and local interpretability. Villar & Andrade (2024) used SHAP with CatBoost and LightGBM to visualize the top contributing features in dropout prediction. Similarly, Baranyi, Nagy & Molontay (2020) combined SHAP with permutation importance, identifying 12 key predictors based on both methods. Delen, Davazdahemami & Dezfouli (2023) also used SHAP to explain feature importance at both the global and individual levels.
Alwarthan, Aslam & Khan (2022) used LIME, a commonly used method, to identify the most influential features at the instance level. They also used a global surrogate model to explain the behavior of black-box models using interpretable algorithms. Melo et al. (2022) compared SHAP, LIME, and Shapley values using an XAI index to score each method’s overall performance. The results showed that SHAP achieved the highest score at 78%, whereas LIME scored 57% and Shapley values 35%.
Recent studies have emphasized the importance of evaluating explanation quality. For instance, Hoffman et al. (2023) proposed manual evaluation criteria, including checklists and user-rating scales for explainability. They introduced measures of explanation quality such as explanation goodness & satisfaction, user curiosity, user trust, and user and XAI performance. While such subjective approaches provide valuable insights, they depend heavily on user perception. To address this limitation, Amparore, Perotti & Bajardi (2021) proposed the Local Explanation evAluation Framework (LEAF),which offers a more systematic way to evaluate XAI methods such as SHAP and LIME. The framework evaluates explanations by measuring different metrics, including fidelity, local concordance, prescriptivity, and stability. Compared to earlier subjective evaluations, LEAF enables a consistent and objective comparison between explanation methods.
Student dropout in Saudi Arabia
Various studies have been conducted to predict student dropout from universities in Saudi Arabia. For example, Alwarthan, Aslam & Khan (2022) predicted at-risk students in the preparatory year at Imam Abdulrahman bin Faisal University using Synthetic Minority Over-sampling Technique (SMOTE) and feature selection methods such as Recursive Feature Elimination (RFE) and a Genetic Algorithm (GA). They used ANN, SVM, and RF models, which achieved accuracies of up to 99.6%. To enhance explainability, SHAP, LIME, and a global surrogate model were also applied. Similarly, Al-Sulami, Al-Masre & Al-Malki (2023) focused on predicting final grades and identifying at-risk students in an English foundation course at King Abdulaziz University. The study used vRNN, LSTM, and GRU models, with GRU achieving the best accuracy of 93.65% in the first course and 98.9% in the second. In addition, Uliyan et al. (2021) analyzed first- and second-year retention rates of preparatory students and graduation rates of Computer Science and Engineering students at the University of Ha’il. The dataset included grades, assessment results, participation, and attendance records from 35,000 students. They applied Bidirectional LSTM (BLSTM) and Conditional Random Fields (CRFs), achieving an accuracy of 90%. Similarly, Said et al. (2024) used data from a Saudi university that included 2,444 records of Information Systems and Computer Science students to predict both final grades and dropouts. They tested several models, including KNN, SVM, DT, LR, RF, GNB, MLP, and Extra trees (ET), achieving accuracies ranging from 59.7% to 80.8%. The ensemble Majority Voting (MV) model achieved the highest accuracy of 92.7%. Although these studies demonstrate the growing use of machine learning for student dropout prediction in Saudi universities, most of them are limited to single-institution datasets and focus on specific academic programs. The current research addresses this gap by creating a more diverse dataset covering multiple universities and academic programs.
Methodology
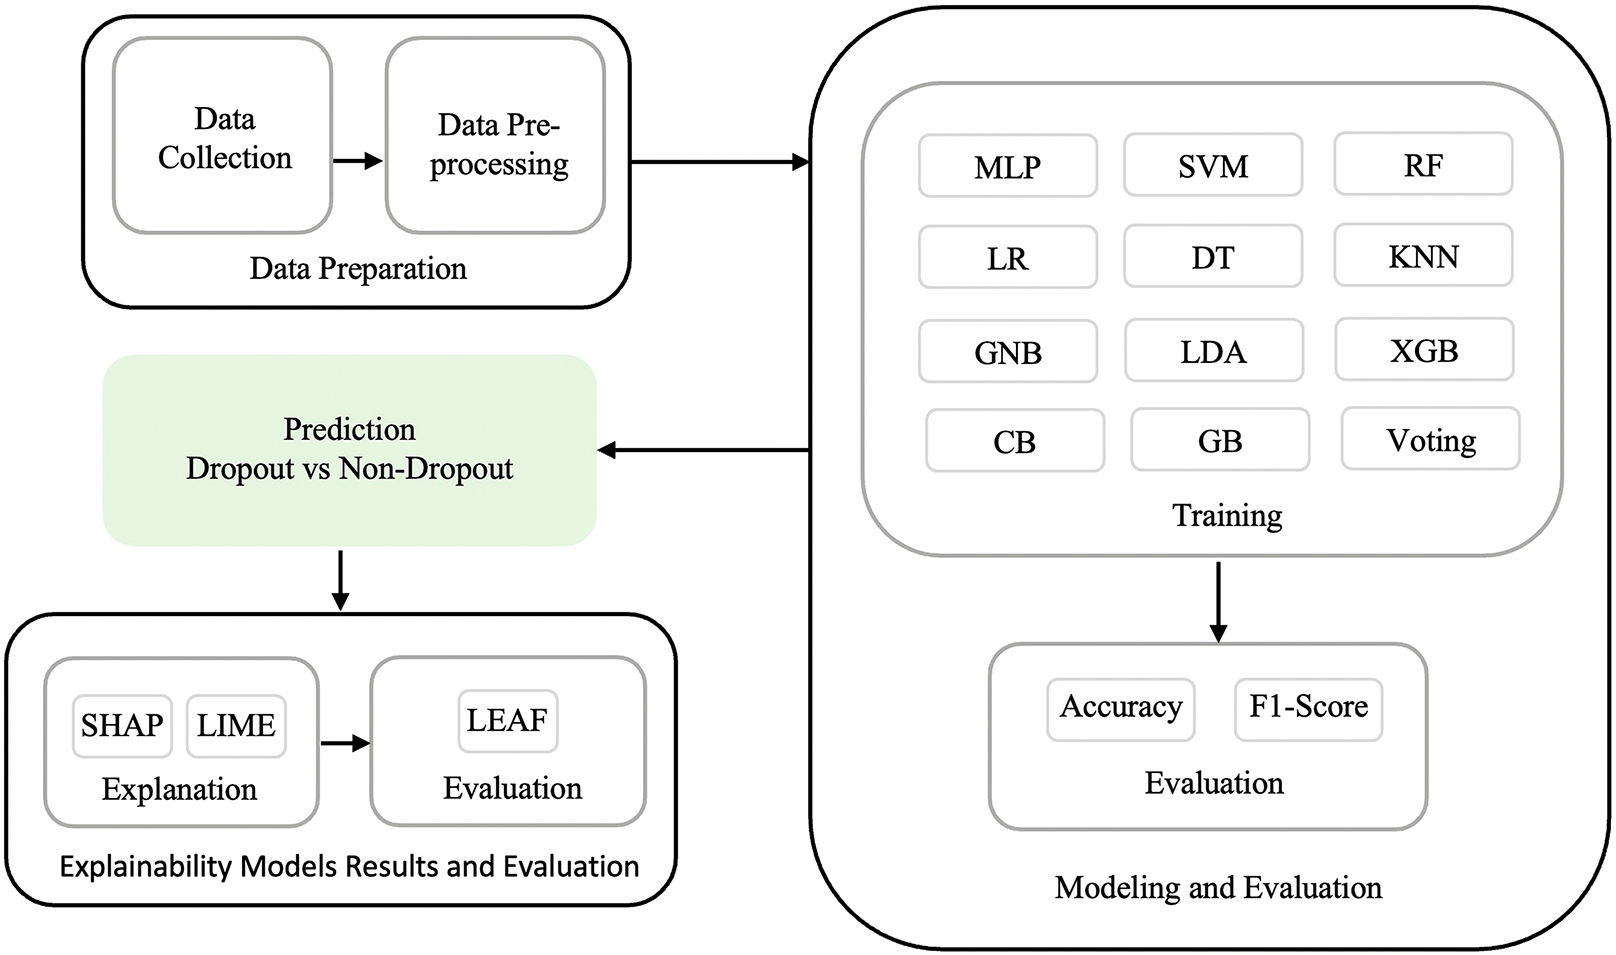
This research addresses a binary classification problem that aims to predict whether a student is likely to drop out or persist in their studies, using machine learning and explainable AI techniques. It relies on a structured methodology to achieve the research objectives and answer the research questions. As shown in (Fig. 1), the methodology consists of three phases: (1) data preparation, (2) modeling and evaluation, and (3) explainability model results and evaluation.
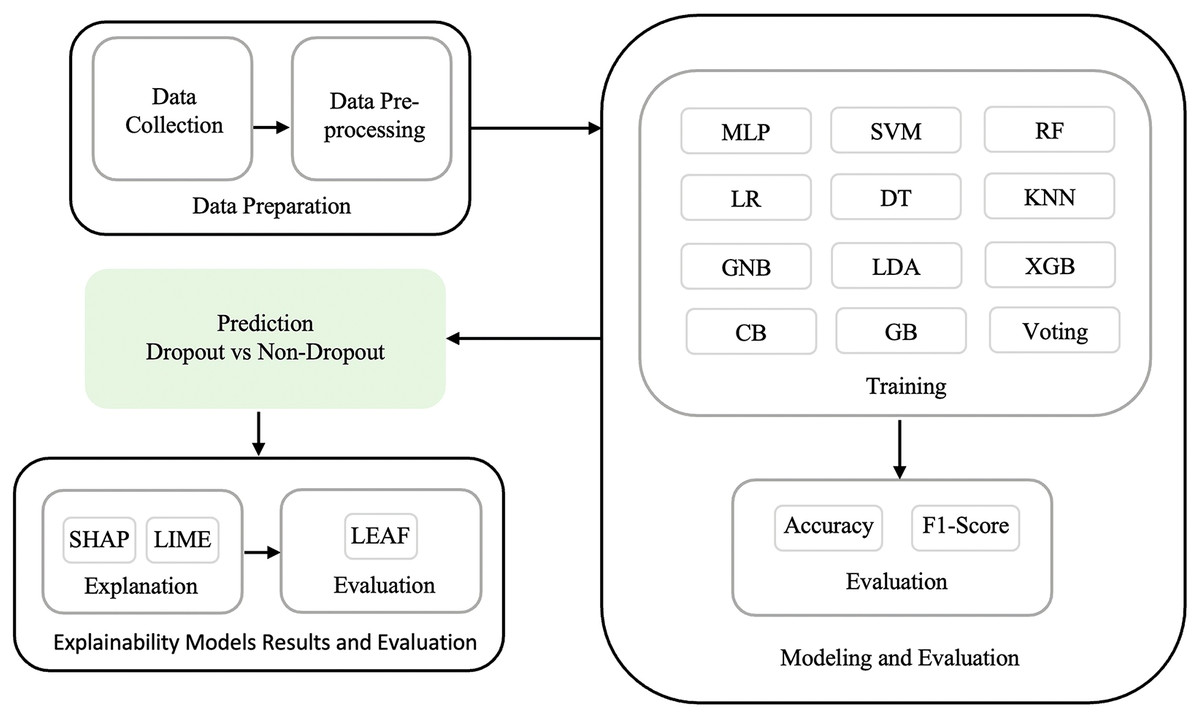
Figure 1: Research methodology showing data preparation, ML modelling and evaluation, and explainability model results and evaluation phases.
Data preparation
This phase involves data collection and preprocessing to prepare the dataset for modeling. Data were collected through an online questionnaire distributed to students from various Saudi universities, including both dropouts and non-dropouts. The questionnaire was designed based on prior studies and refined through a pilot study to ensure its clarity and relevance. In addition, the questionnaire was distributed through multiple social media platforms, including Twitter, WhatsApp, and Telegram, and was also shared by various universities through their official student portals to enhance the diversity of responses. In total, responses were obtained from 30 public and several private universities across Saudi Arabia.
A non-probability convenience sampling approach was used since participation was voluntary and there was no centralized sampling frame for Saudi university students. This approach is commonly used when probability sampling is impractical in multi-institution contexts. Potential selection bias is acknowledged and mitigated by distributing the questionnaire broadly across universities (Ahmed, 2024).
Sample adequacy was evaluated using the events-per-variable (EPV) criterion, which measures the ratio between the number of dropout cases and the number of model factors. The dataset included 1,016 dropout cases and 25 factors, resulting in an EPV of 40.6. This value exceeds the minimum adequacy threshold ( 10 EPV) for reliable and stable predictive modeling. A higher EPV value also supports model stability and reduces the risk of overfitting by ensuring that each factor is informed by a sufficient number of outcome events (Pavlou et al., 2024).
Ethical approval for the study was granted by the Department of Information Systems at King Abdulaziz University. The research involved only academic and institutional data and did not include any private information of participants. In addition, informed consent was obtained from participants at the beginning of the survey. Participants were informed that completing the questionnaire indicated their voluntary agreement to participate. They were also notified that their anonymized responses would be used solely for research purposes.
Data preprocessing is an essential step in data analysis that transforms raw data into a structured format (Pandey, Patnaik & Gupta, 2020). In this step, duplicate data were removed, categorical variables were encoded, and class imbalance was addressed using the Synthetic Minority Over-sampling Technique combined with Edited Nearest Neighbors (SMOTE-ENN). The SMOTE-ENN hybrid method improves data quality by first generating synthetic samples for the minority class and then applying ENN to remove noisy or misclassified instances (Batista, Prati & Monard, 2004). Compared to standalone oversampling methods (e.g., SMOTE, ADASYN, Borderline-SMOTE, SMOTE-Tomek), the hybrid SMOTE-ENN provides more reliable results by combining synthetic oversampling with noise reduction, effectively reducing class overlap and improving model performance (Husain et al., 2025; Mduma, 2023; Cuevas-Chvez et al., 2024).
Modeling and evaluation
This phase includes feature selection and training and evaluating ML models to predict student dropout.
Feature selection
Maintaining all features in the dataset can lead to overfitting and degrade model performance. To address these issues, the F statistic (ANOVA F test), chi-square test, Recursive Feature Elimination (RFE), and Mutual Information (MI) were used to identify and retain only the most relevant features.
First, the F statistic evaluates the relationship between each feature and the target variable. It compares between-group variability (i.e., how much the feature values differ across target variable classes) and within-group variability (i.e., how much the feature values differ within each class) (Kennedy & Wang, 2025). It is calculated as shown in Eq. (1):
(1)
A higher F statistic indicates a stronger relationship between the feature and the target variable.
Second, the chi-square test evaluates the relationship between categorical features and the target class. It compares the observed frequency of each category with the expected frequency if there is no association between the feature and the target (Mahawar & Rattan, 2024). It is calculated as shown in Eq. (2):
(2) where O is the observed frequency and where E is the expected frequency. A higher chi-square score indicates a stronger dependency between the feature and the target.
Third, RFE trains a model (i.e., in this research, a random forest was used) and iteratively adds or removes features based on model performance (Dominguez-Gmez et al., 2025).
Finally, MI measures the amount of shared information between each feature and the target class. Features with higher MI scores provide more information about the target class (Dominguez-Gmez et al., 2025).
ML model training and evaluation
This research applied twelve supervised machine learning algorithms to represent diverse learning strategies. These algorithms represent six main categories including linear models (LR, LDA), probabilistic models (GNB), instance-based learning (KNN), tree-based methods (DT, RF), kernel-based methods (SVM), ensemble and boosting models (GB, XGB, CB, Voting), and a neural network model (MLP). Each category provides a distinct learning perspective. For instance, linear models are simple and interpretable, tree-based and ensemble methods handle nonlinear relationships effectively, and neural networks capture complex feature interactions.
-
Logistic Regression: A statistical model that predicts the probability of a class label based on input variables (Cox, 1958).
-
Linear Discriminant Analysis: Model class separation by maximizing the ratio of the variance between classes to the variance within classes (Fisher, 1936).
-
Gaussian Naive Bayes: A variant of the Naive Bayes algorithm that models the likelihood of the features using a Gaussian distribution (Murphy, 2012).
-
K-Nearest Neighbors: An instance-based learning algorithm that predicts new data based on the majority class of their k nearest neighbors in the training set (Cover & Hart, 1967).
-
Decision Tree: A rule-based model that recursively divides the input data into subsets based on feature values (Quinlan, 1986).
-
Random Forest: An ensemble learning method that trains multiple decision trees and combines their outputs (Breiman, 2001).
-
Support Vector Machine: Identifies the optimal hyperplane that maximizes the margin between different classes (Cortes & Vapnik, 1995).
-
Multi-layer Perceptron: A feedforward neural network model that maps input data to output predictions through multiple layers (Rumelhart, Hinton & Williams, 1986).
-
Gradient Boosting: An ensemble model that constructs models iteratively, with each model trained to correct the residual errors of the previous model (Friedman, 2001).
-
XGBoost: An optimized gradient boosting model designed to improve generalizability, computational efficiency, and accuracy (Chen & Guestrin, 2016).
-
CatBoost: A boosting algorithm designed to handle categorical features and reduce overfitting (Prokhorenkova et al., 2018).
-
Voting Classifier: An ensemble model that combines the predictions of multiple classifiers and produces the class that receives the majority vote. In this research, the voting classifier was trained using CB, XGB, GB, and KNN, as these models achieved the highest performance individually.
The performance of the classification models was evaluated using accuracy and F1-score. Accuracy is defined as the proportion of correctly classified instances among the total number of instances. The F1-score combines precision and recall into a single metric by calculating their harmonic mean.
Explainability models and evaluation
To enhance the explainability of the machine learning predictions, this research applied SHAP and LIME. These techniques were applied to explain individual predictions and identify the most influential features of student dropout.
SHAP is a method proposed by Lundberg & Lee (2017) to explain individual predictions and describe how a model’s predictions are influenced by each feature. It is based on the Shapley value, an approach from cooperative game theory that measures the contribution of each player to the result.
LIME was introduced by Ribeiro, Singh & Guestrin (2016) to explain individual predictions by perturbing the input data and training an interpretable surrogate model to approximate the behavior of the black-box model.
In addition, the LEAF framework was used to evaluate the quality of the SHAP and LIME explanations through four metrics: fidelity, local concordance, prescriptivity, and stability (Amparore, Perotti & Bajardi, 2021).
Experimental results
This section presents the experimental results of the study. It begins with an overview of the data collection and preprocessing steps. The performance of various machine learning models is then evaluated using various feature selection methods. Finally, the best-performing model is selected for explanation using SHAP and LIME to better understand the key factors behind the predictions.
Data collection
The data collection began with a pilot study to ensure the clarity and relevance of the questionnaire. Based on the feedback, the final version was distributed to students from various universities to collect data for the research. Data were collected between July 2024 and January 2025.
Pilot study
The initial step of this research involved conducting a pilot study in which the questionnaire was distributed to a small group of 54 Saudi students. The aim was to gather feedback on the clarity, structure, and relevance of the questions. Additionally, we aimed to gain insights into potential factors influencing student dropout from the perspective of students who had dropped out. The factors selected in the questionnaire were chosen based on their importance in previous studies.
The questionnaire began with personal information (age, gender, employment status, and marital status) and then academic information (university name, faculty name, program type, academic year, GPA, number of failed courses, academic warnings, satisfaction with university and teaching methods, and studying difficulty). Additionally, the questionnaire included sociocultural information such as the impact of cultural expectations, language barriers, moving to another city for study, living expenses, and health issues.
Finally, a required open-ended question was added to collect students opinions on the factors contributing to the dropout of universities. This pilot study allowed for the refinement of certain questions and the incorporation of additional factors based on participant feedback. The added factors include commitments, major pre-knowledge, psychological issues, family/employer pressure, peer influence, and family/friends support.
Final questionnaire
The final version of the questionnaire included the refined questions and the additional factors identified during the pilot study. The questionnaire was distributed through multiple social media platforms, including Twitter, WhatsApp, and Telegram, and shared by several universities through their official student portals to enhance the diversity of responses. In total, 4,560 responses with 25 factors were collected from students across 30 public and several private Saudi universities. Among them, 1,016 (22.3%) were dropouts and 3,544 (77.7%) were non-dropouts. The sample included 61.4% females and 38.6% males, with most participants aged between 18 and 25 years. Bachelor’s students represented the majority (75.8%), followed by diploma (16.6%), master’s (5.9%), and PhD students (1.6%). Participants represented a wide range of faculties and universities across Saudi Arabia.
Table 1 summarizes each dimension with its factors, description, and measurement scale. Each factor was selected after a thorough exploration of previous studies and the opinions of the participants to ensure its importance in predicting student dropout.
| Dimension | Factors | Description | Measurement scale |
|---|---|---|---|
| Personal | Dropout | Whether the participant has dropped out before | Nominal (Binary) |
| Age | The participants’ ages in range | Ordinal (Discrete) | |
| Gender | The participants’ gender | Nominal | |
| Employment status | The participants’ employment status | Nominal | |
| Marital status | The participants’ marital status | Nominal | |
| Academic | Academic year | The year of dropout or current academic year | Ordinal |
| University name | The participants’ university name | Nominal | |
| Faculty name | The participants’ faculty name | Nominal | |
| Program type | The participants’ program type | Nominal | |
| GPA | The participants’ cumulative GPA, which reflects their overall academic performance | Ordinal | |
| Failed courses | The total number of courses the participant has failed if any | Ordinal (Discrete) | |
| Academic warnings | Whether the participants received any academic warnings | Nominal (Binary) | |
| English language | Whether the participants studied in English language | Nominal (Binary) | |
| Studying difficulty | Whether the participants found their major difficult | Nominal (Binary) | |
| University satisfaction | Whether the participants satisfied with their university environment and teaching method | Nominal (Binary) | |
| Major pre-knowledge | Whether participants have conducted prior research on their major before selecting it | Nominal (Binary) | |
| Sociocultural | Cultural expectations | Whether the cultural expectations and preferences affect the participants’ academic journey | Nominal (Binary) |
| Family/Employer pressure | Whether the participants were pressured by their family, employer, or others to study a particular major or obtain a particular qualification | Nominal (Binary) | |
| Peer influence | Whether the participants were influenced by their friends or peers when choosing their major | Nominal (Binary) | |
| Family support | Whether the participants received adequate support from their family and friends | Nominal (Binary) | |
| Language barrier | Whether the participants experienced language barriers and if it affected their academic performance | Nominal (Binary) | |
| City moving | Whether the participants moved to another city to study | Nominal (Binary) | |
| Living expenses | Whether the participant faces difficulties in covering living expenses | Nominal (Binary) | |
| Commitments | Whether the participants have many commitments and they struggle to balance them with their studies | Nominal (Binary) | |
| Health issue | Whether the participants faced any health issues | Nominal (Binary) | |
| Psychological issues | Whether the participants faced any psychological issues | Nominal (Binary) |
Data preprocessing
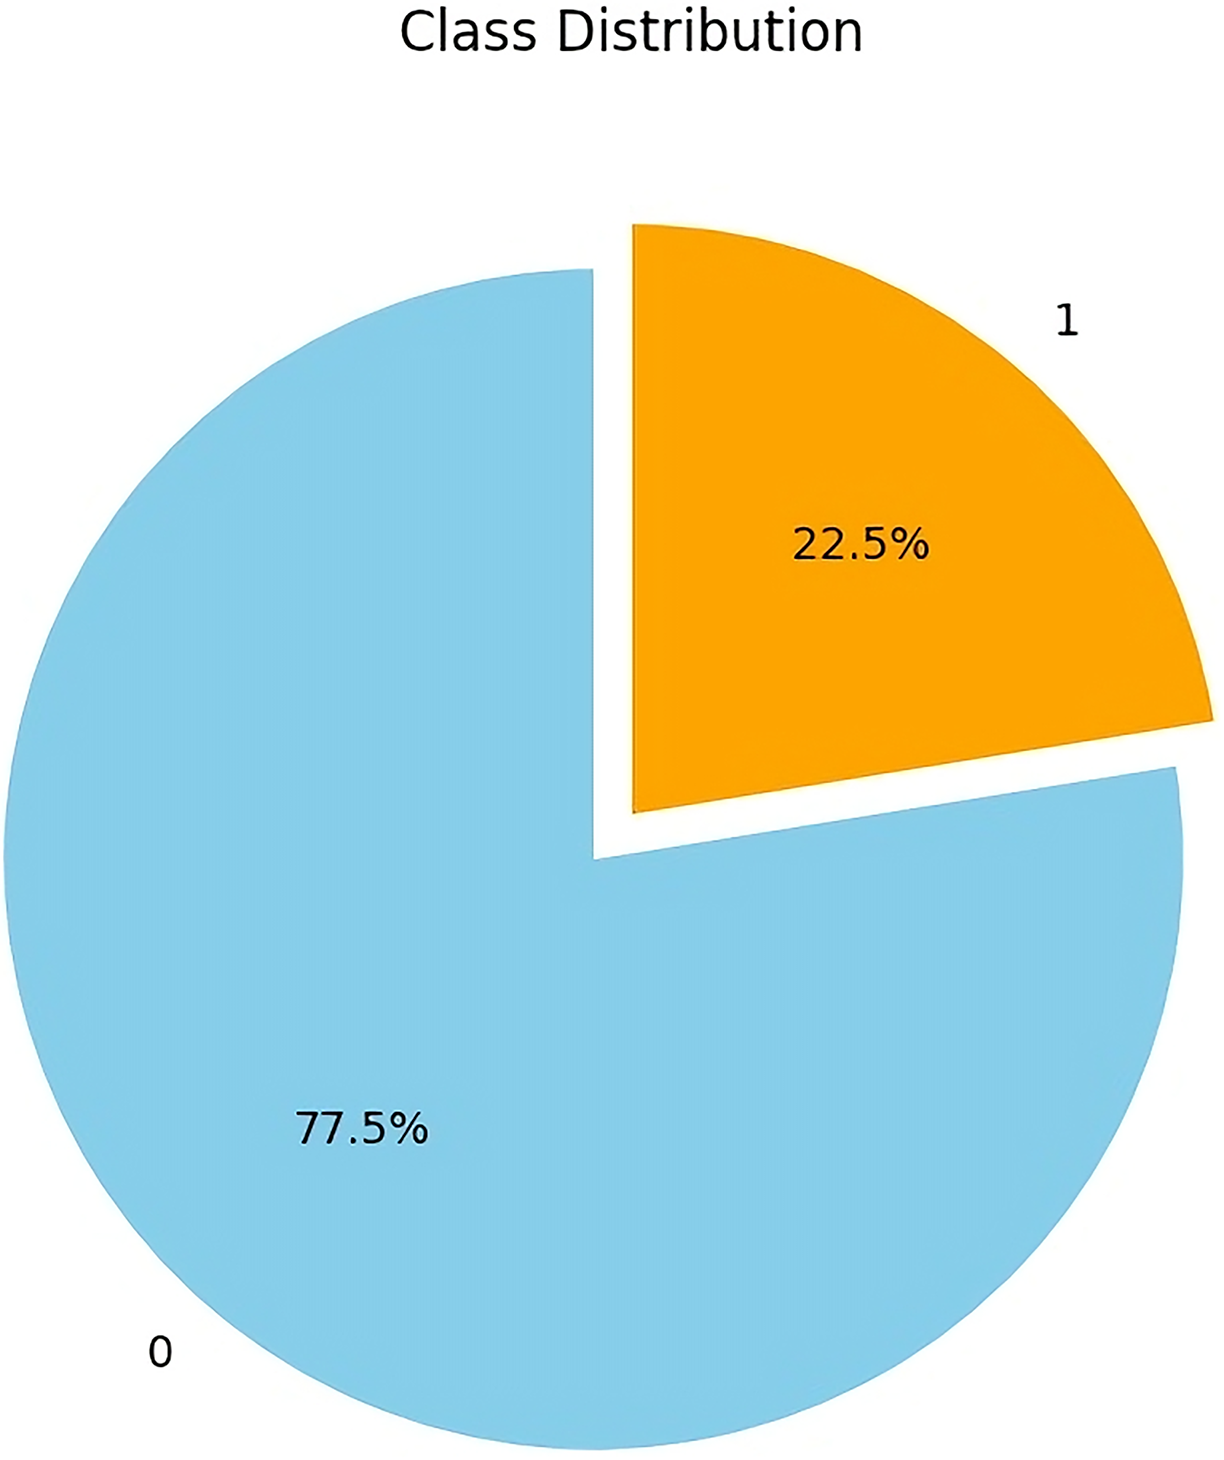
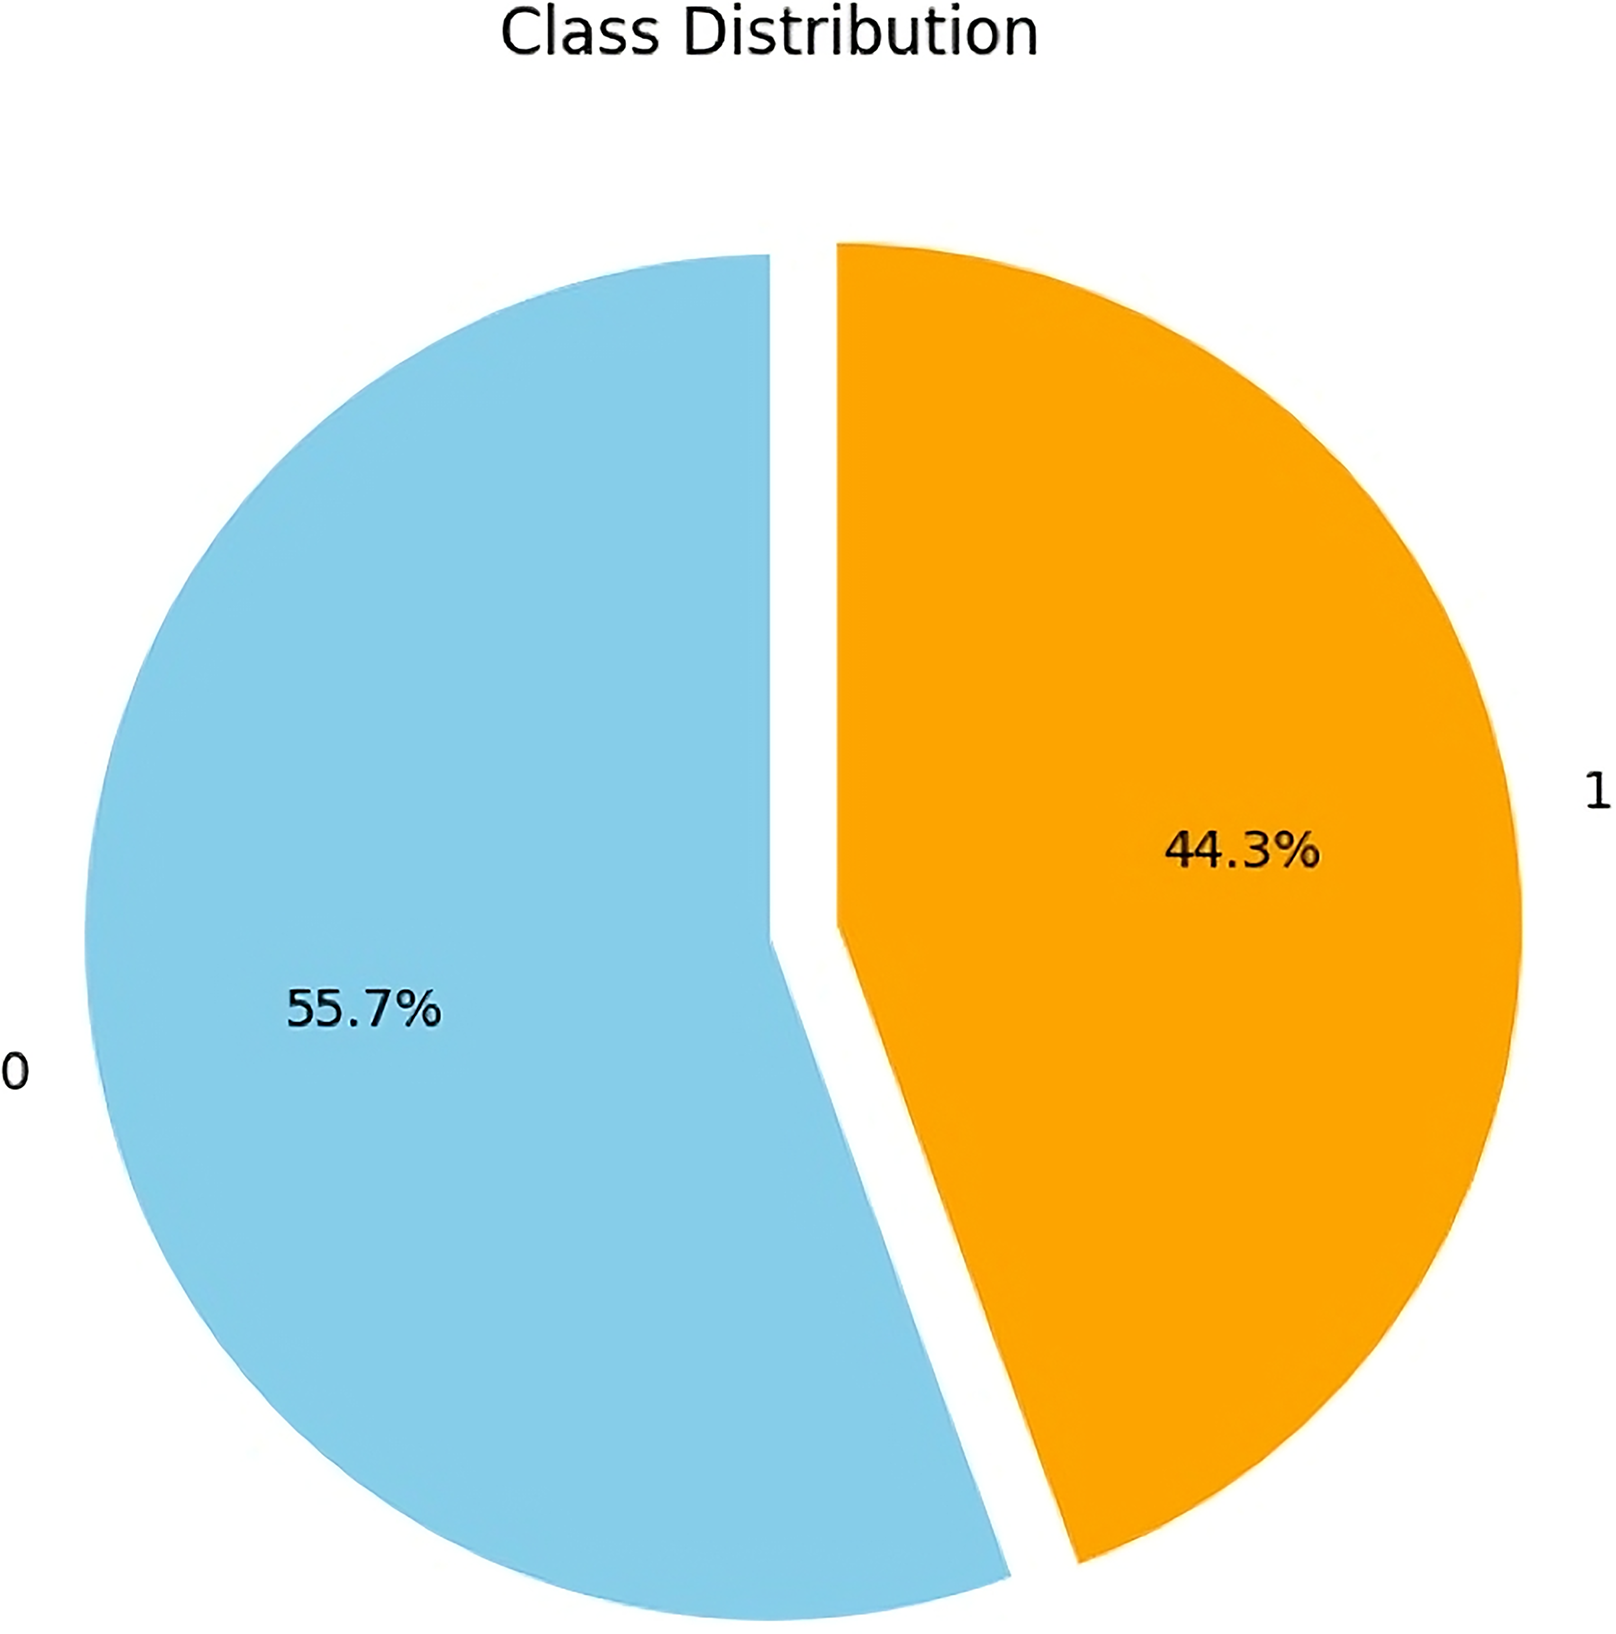
The data preprocessing steps resulted in the removal of 39 duplicate records and the mapping of categorical features (e.g., gender, age, employment status) to their corresponding numerical values. In addition, as shown in (Fig. 2), the non-dropout class contains 77.5% of the dataset, while the dropout class contains only 22.5%, which represents a highly imbalanced class distribution that can negatively affect the performance of the ML model. To address this imbalance, the SMOTE-ENN was implemented with a sampling strategy of 0.7, which balances the minority (dropout) class to 70% of the majority (non-dropout) class. Default neighborhood parameters were used ( = 5 for SMOTE and = 3 for ENN) following standard configurations in the imbalanced-learn library. Using SMOTE-ENN resulted in a more balanced dataset, as shown in (Fig. 3), with similar sample sizes for both classes (Class 0: 55.7%, Class 1: 44.3%).
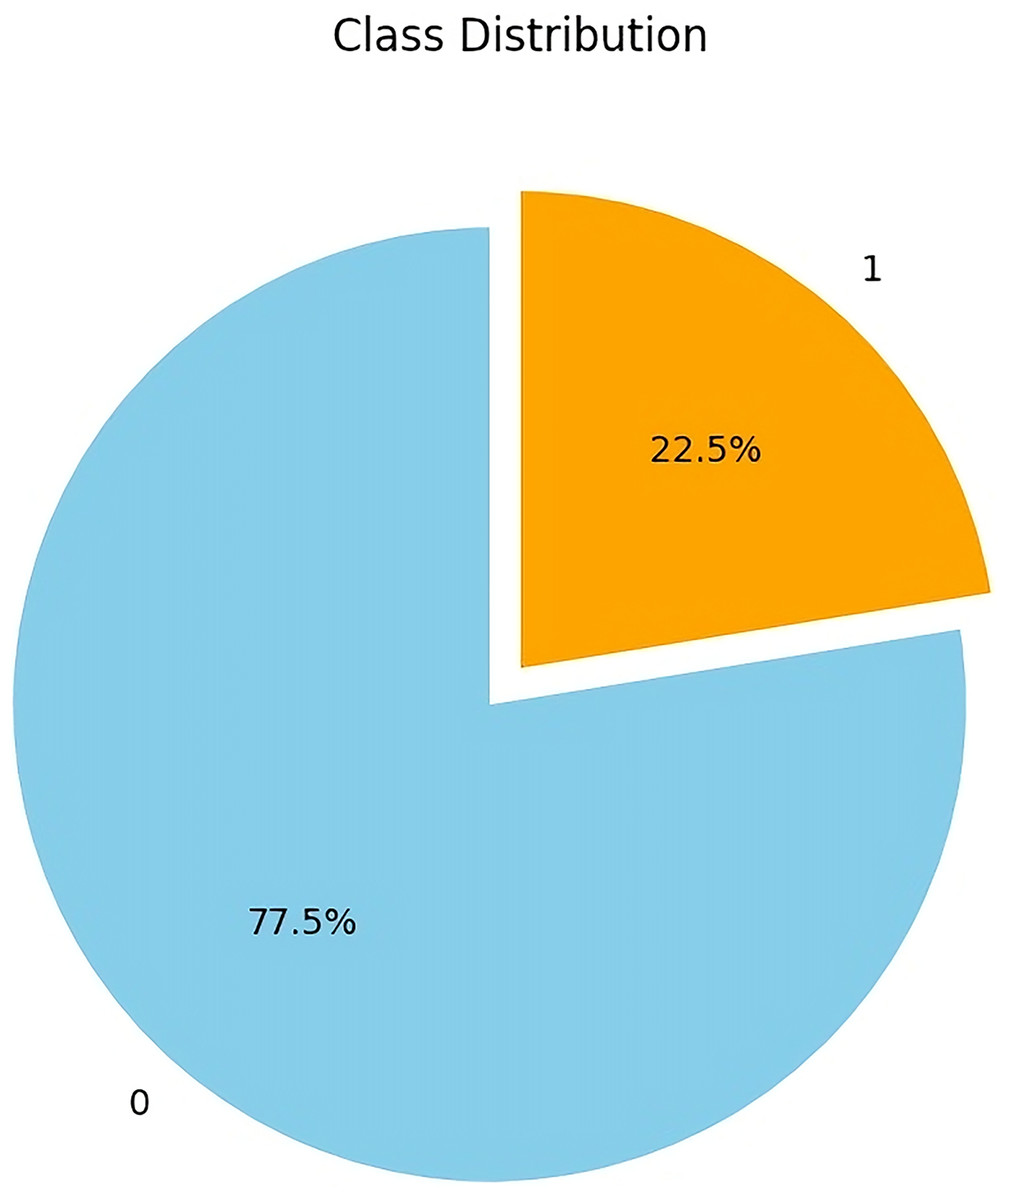
Figure 2: Imbalanced class distribution of dropout (orange) vs. non-dropout (blue) students before applying SMOTE-ENN.
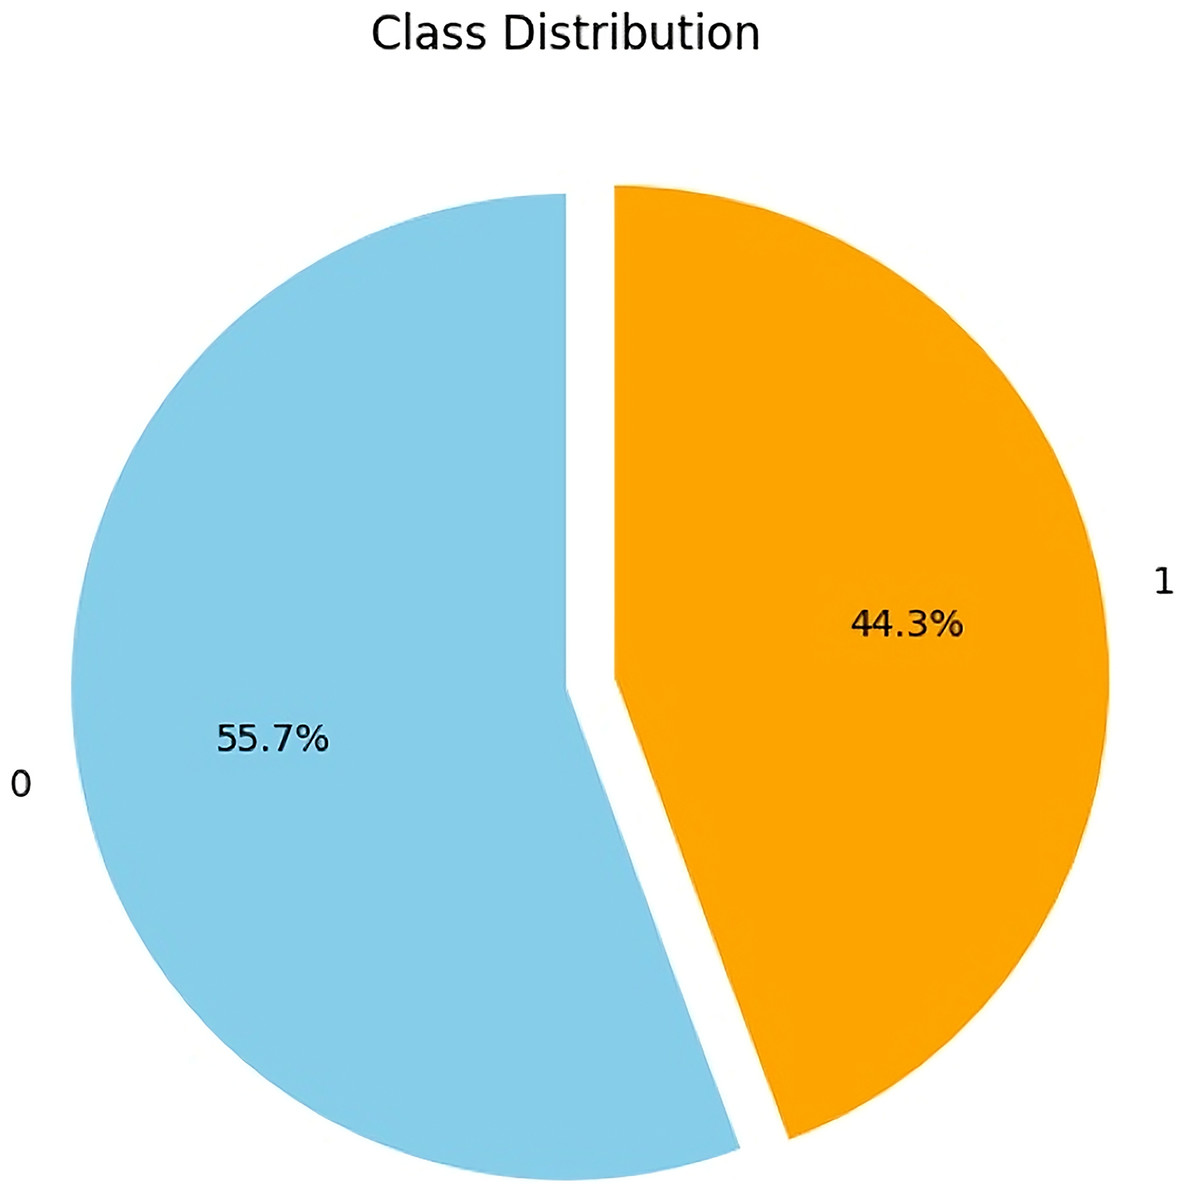
Figure 3: Balanced class distribution of dropout (orange) vs. non-dropout (blue) students after applying SMOTE-ENN.
Feature selection
Four feature selection methods, including F-statistic, Chi-square, RFE, and MI, were applied to generate five feature subsets consisting of 22, 19, 16, 13, and 10 features. The feature subsets were generated systematically by ranking features according to their importance scores within each selection technique and iteratively removing the three lowest-ranked features at each step. This process continued until only 10 features remained, as performance began to decline with further reduction.
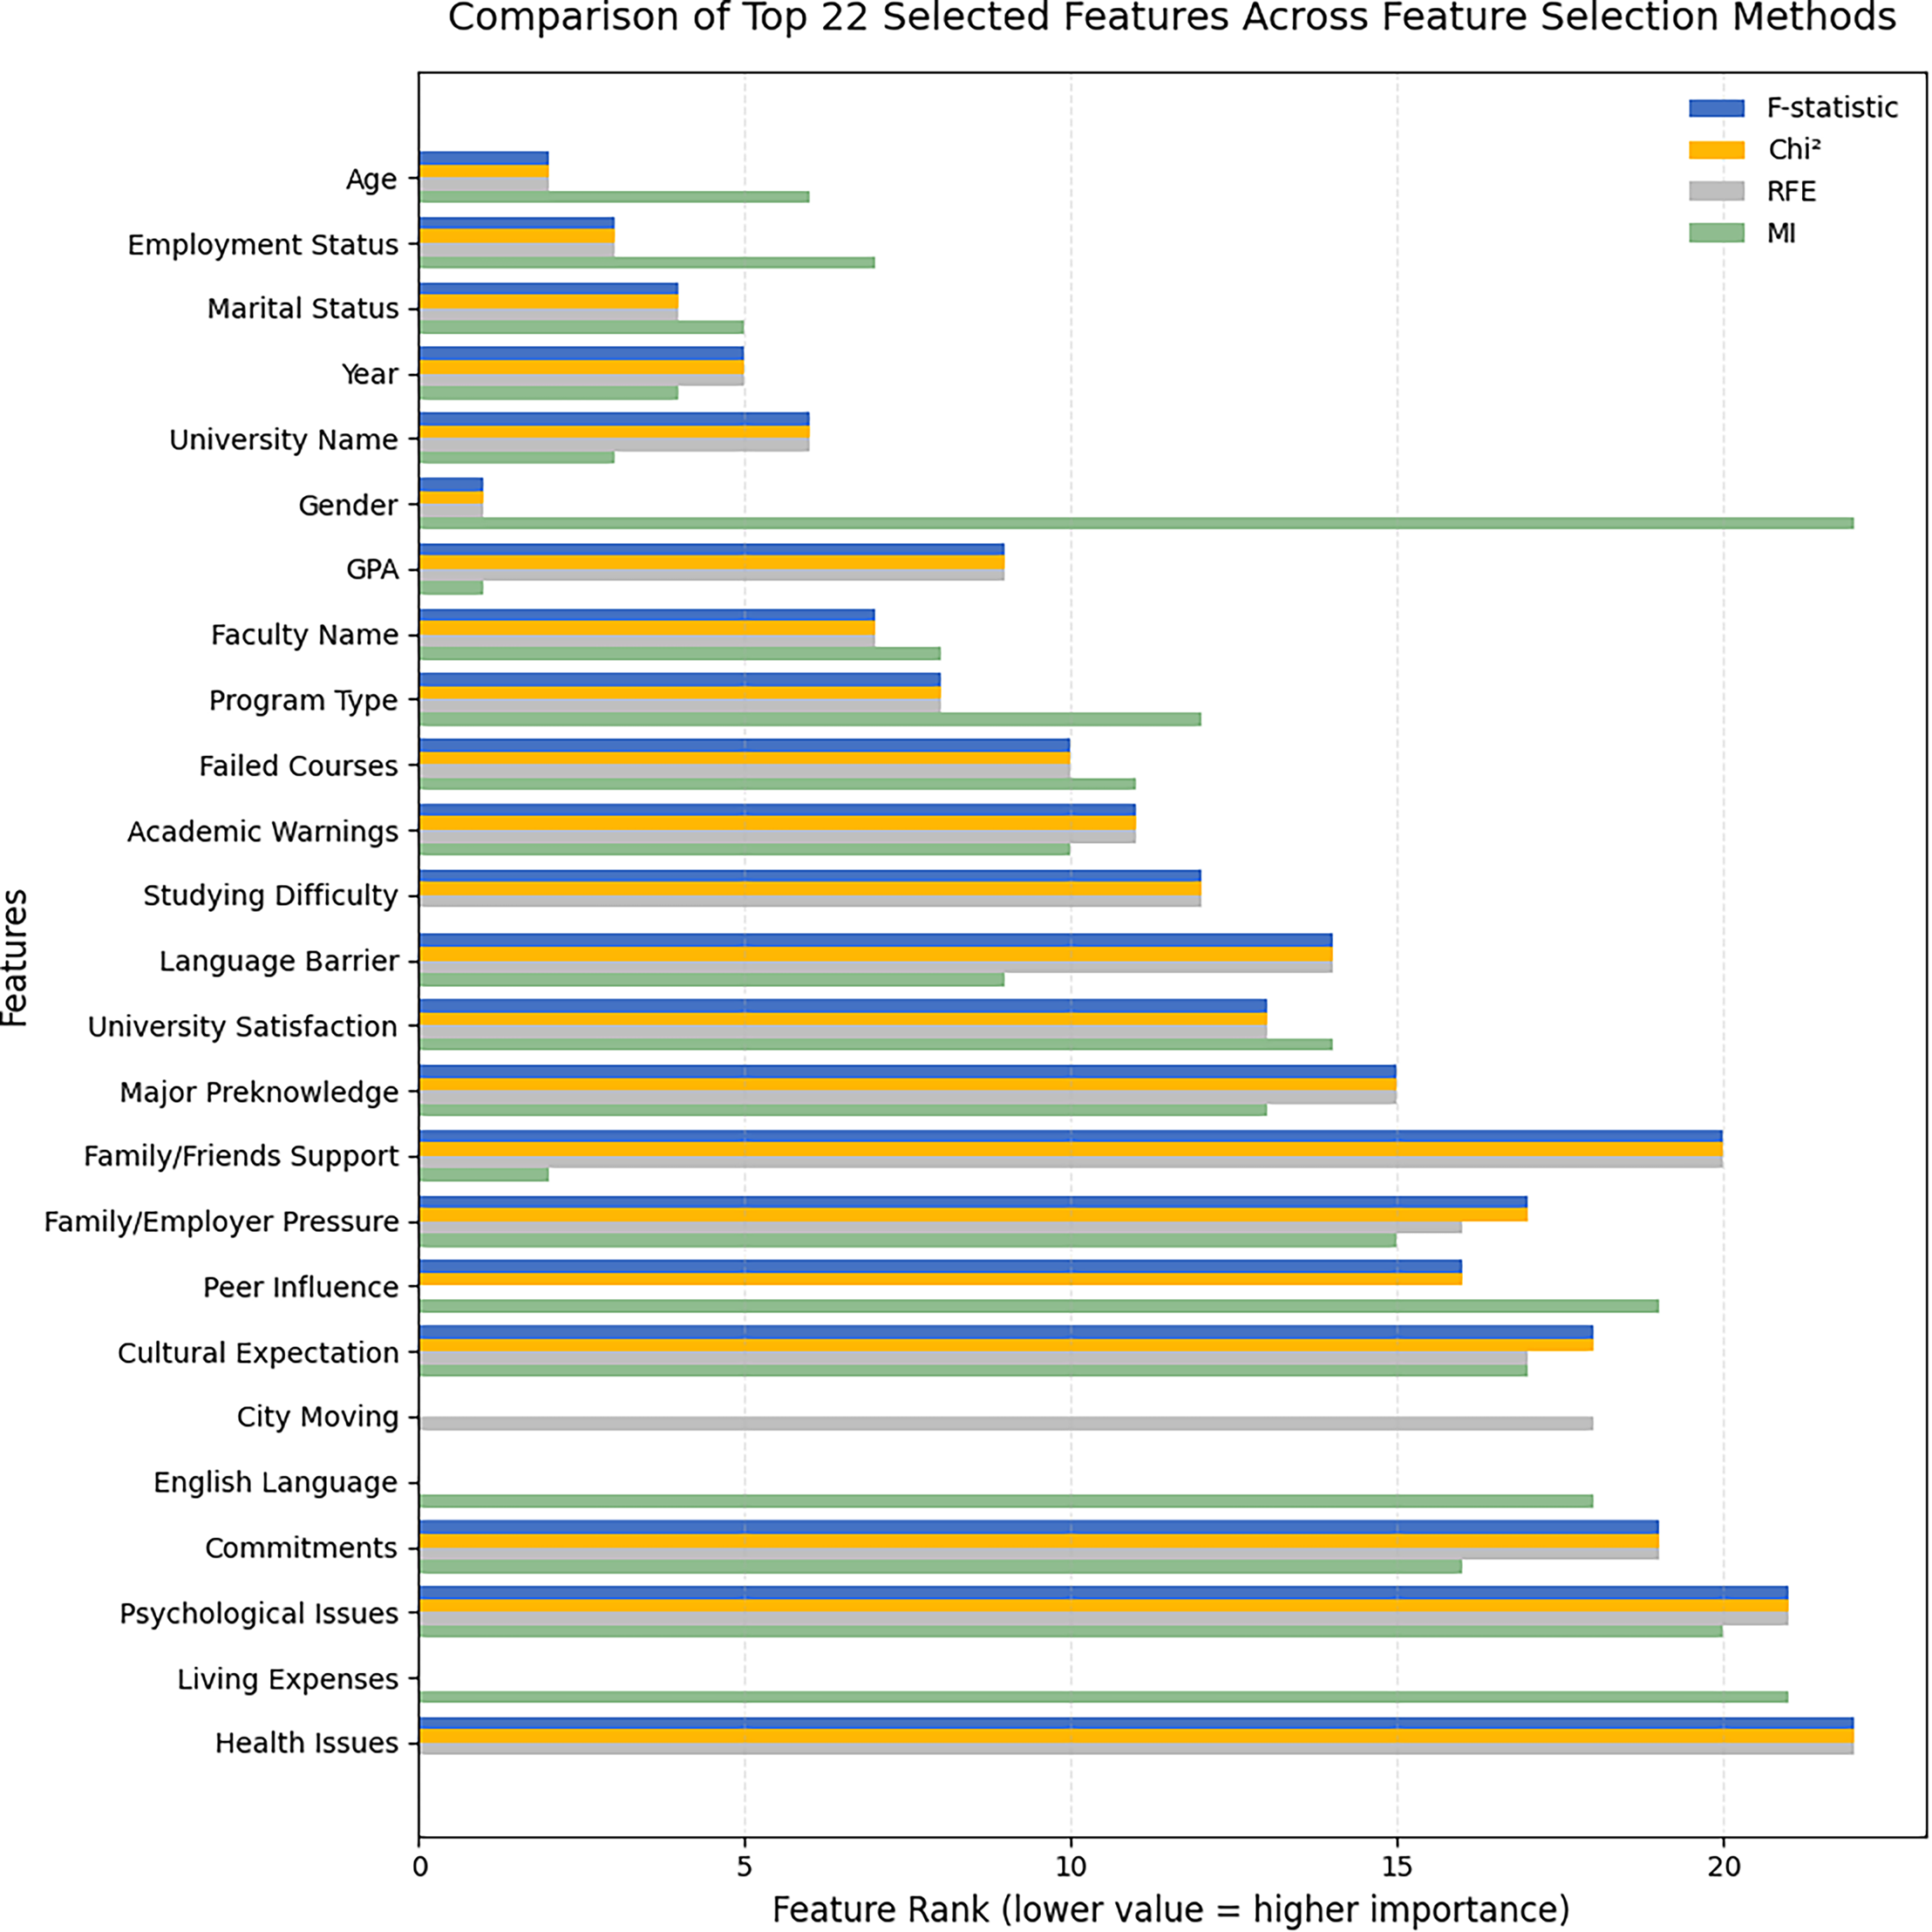
Figure 4 presents the comparison of the top 22 selected features across the four feature selection methods. This 22-feature subset represents the first and most comprehensive configuration before the reduction to smaller subsets. It was used to examine the relationships between the features and to compare how each selection method ranked them according to its statistical criterion.
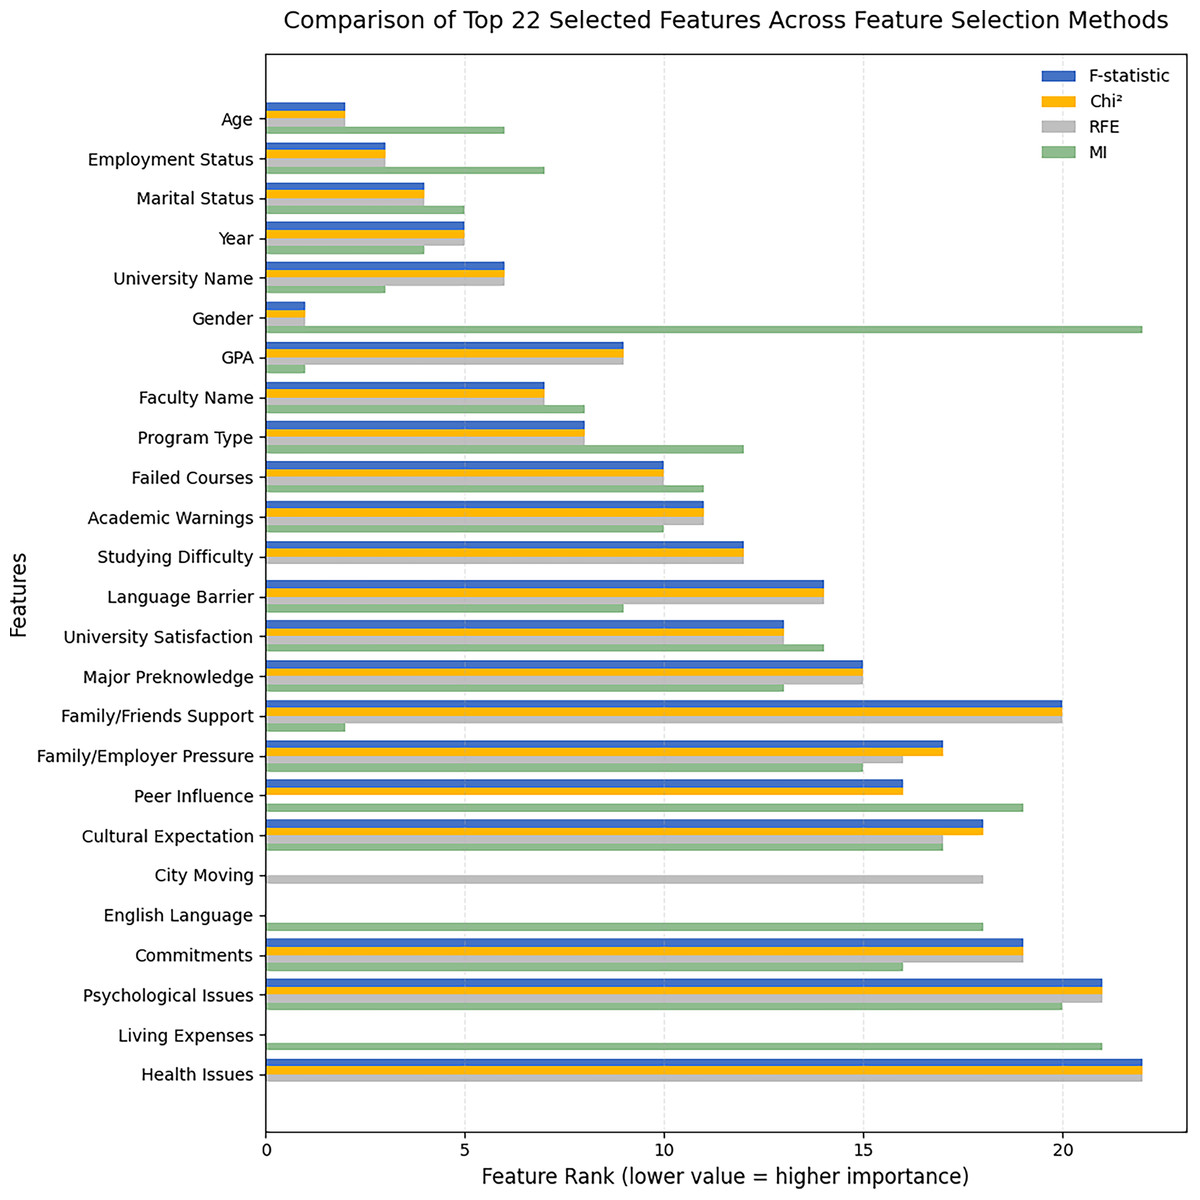
Figure 4: Comparison of top 22 selected features across feature-selection methods (F-statistic, Chi-square, RFE, MI).
The results show that Age, Employment Status, and Marital Status consistently obtained the highest importance across all methods. Year and University Name also maintained high and stable rankings across the techniques. However, GPA showed a different pattern compared with the other factors. It had moderate ranks under the F-statistic, Chi-square, and RFE methods, but became the most influential under MI. This result indicates that the relationship between GPA and dropout is non-linear, where students with lower GPAs are more likely to dropout. Similarly, Family/Friends Support showed a clear non-linear pattern. It ranked among the lowest under the F-statistic, Chi-square, and RFE methods, but became the second most influential factor under MI. In contrast, Gender showed an opposite pattern. It was ranked first under the linear-based methods but dropped to the lowest position under MI, which suggests that its predictive influence is primarily linear. It is also worth noting that three features were excluded from each feature selection method. The F-statistic and Chi-square methods did not identify City Moving, Living Expenses, and English Language as important factors. The RFE method did not identify Living Expenses, English Language, and Peer Influence. In contrast, the MI method did not identify City Moving, Health Issues, and Studying Difficulty among the influential factors. These variations reflect the methodological differences between linear and non-linear approaches, as each method captures distinct aspects of the data distribution and feature relationships.
ML model training and evaluation
Each algorithm was trained using empirically optimized parameters to ensure stable performance. Default settings from the scikit-learn library were applied unless otherwise specified. For instance, the KNN model used and the RF used estimators with a maximum depth of . For the Gradient Boosting and XGBoost algorithms, a learning rate of was selected to achieve a balance between training stability and predictive performance. Using a smaller learning rate helps the model learn more gradually, reducing the risk of overfitting while maintaining high accuracy across iterations. All models were trained with a fixed random state ( ) to ensure reproducibility.
In addition, models were evaluated using an 80/20 train–test split to ensure a consistent comparison across the twelve algorithms and feature subsets. As shown in (Tables 2–9), each model was evaluated across the four feature selection techniques: F-statistic, chi-square, RFE, and MI. For each technique, the models were trained using the full set of features as well as subsets of 22, 19, 16, 13, and 10 features.
| Model | All | 22 | 19 | 16 | 13 | 10 |
|---|---|---|---|---|---|---|
| LDA | 86.7 | 86.7 | 84.9 | 86.2 | 84.6 | 83.1 |
| GNB | 84.3 | 84.3 | 83.1 | 84.0 | 83.3 | 81.4 |
| KNN | 97.5 | 96.2 | 94.3 | 96.1 | 93.8 | 84.2 |
| DT | 89.8 | 90.1 | 87.7 | 89.3 | 87.7 | 84.5 |
| CB | 96.1 | 95.2 | 94.5 | 95.0 | 93.9 | 85.1 |
| XGB | 95.3 | 95.0 | 94.0 | 94.7 | 93.6 | 84.9 |
| LR | 86.7 | 86.6 | 85.2 | 86.4 | 84.5 | 83.5 |
| RF | 92.5 | 92.9 | 91.7 | 93.0 | 91.1 | 84.3 |
| SVM | 87.7 | 87.2 | 85.2 | 87.3 | 87.1 | 83.5 |
| MLP | 91.3 | 92.5 | 91.1 | 91.9 | 91.1 | 85.5 |
| GB | 94.7 | 94.3 | 93.5 | 94.5 | 93.0 | 84.6 |
| Voting | 96.8 | 96.1 | 95.2 | 96.2 | 94.1 | 85.2 |
| Model | All | 22 | 19 | 16 | 13 | 10 |
|---|---|---|---|---|---|---|
| LDA | 86.6 | 86.7 | 84.7 | 86.2 | 84.5 | 83.0 |
| GNB | 84.3 | 84.3 | 83.1 | 84.0 | 83.3 | 81.4 |
| KNN | 97.5 | 96.2 | 94.4 | 96.1 | 93.8 | 84.2 |
| DT | 89.8 | 90.1 | 87.7 | 89.3 | 87.7 | 84.3 |
| CB | 96.1 | 95.2 | 94.4 | 95.0 | 93.9 | 85.0 |
| XGB | 95.3 | 95.0 | 94.0 | 94.7 | 93.6 | 84.9 |
| LR | 86.7 | 86.6 | 85.1 | 86.3 | 84.4 | 83.5 |
| RF | 92.5 | 92.8 | 91.6 | 92.9 | 91.1 | 84.3 |
| SVM | 87.5 | 87.1 | 85.0 | 87.1 | 86.9 | 83.5 |
| MLP | 91.4 | 92.5 | 91.1 | 91.8 | 91.0 | 85.5 |
| GB | 94.7 | 94.3 | 93.5 | 94.5 | 93.0 | 84.6 |
| Voting | 96.8 | 96.1 | 95.2 | 96.2 | 94.0 | 85.1 |
| Model | All | 22 | 19 | 16 | 13 | 10 |
|---|---|---|---|---|---|---|
| LDA | 86.7 | 86.7 | 86.4 | 86.2 | 83.9 | 84.2 |
| GNB | 84.3 | 84.3 | 84.3 | 84.0 | 83.8 | 81.7 |
| KNN | 97.5 | 96.2 | 95.6 | 96.1 | 95.2 | 92.1 |
| DT | 89.8 | 90.1 | 89.1 | 89.3 | 88.6 | 87.2 |
| CB | 96.1 | 95.2 | 95.3 | 95.0 | 94.4 | 92.6 |
| XGB | 95.3 | 95.0 | 94.4 | 94.7 | 94.1 | 91.4 |
| LR | 86.7 | 86.6 | 86.2 | 86.4 | 84.3 | 84.9 |
| RF | 92.5 | 92.9 | 93.1 | 93.0 | 92.1 | 90.3 |
| SVM | 87.7 | 87.2 | 86.9 | 87.3 | 86.6 | 84.6 |
| MLP | 91.3 | 93.2 | 92.1 | 92.0 | 90.8 | 87.5 |
| GB | 94.7 | 94.3 | 94.3 | 94.5 | 93.9 | 92.1 |
| Voting | 96.8 | 96.1 | 95.9 | 96.2 | 95.7 | 93.8 |
| Model | All | 22 | 19 | 16 | 13 | 10 |
|---|---|---|---|---|---|---|
| LDA | 86.6 | 86.7 | 86.4 | 86.2 | 83.8 | 84.1 |
| GNB | 84.3 | 84.3 | 84.3 | 84.0 | 83.7 | 81.7 |
| KNN | 97.5 | 96.2 | 95.6 | 96.1 | 95.2 | 92.0 |
| DT | 89.8 | 90.1 | 89.1 | 89.3 | 88.6 | 87.2 |
| CB | 96.1 | 95.2 | 95.3 | 95.0 | 94.4 | 92.6 |
| XGB | 95.3 | 95.0 | 94.4 | 94.7 | 94.0 | 91.4 |
| LR | 86.7 | 86.6 | 86.2 | 86.3 | 84.3 | 84.9 |
| RF | 92.5 | 92.8 | 93.1 | 92.9 | 92.0 | 90.3 |
| SVM | 87.5 | 87.1 | 86.8 | 87.1 | 86.4 | 84.3 |
| MLP | 91.4 | 93.2 | 92.0 | 92.0 | 90.8 | 87.5 |
| GB | 94.7 | 94.3 | 94.3 | 94.5 | 93.9 | 92.0 |
| Voting | 96.8 | 96.1 | 95.9 | 96.2 | 95.7 | 93.8 |
| Model | All | 22 | 19 | 16 | 13 | 10 |
|---|---|---|---|---|---|---|
| LDA | 86.7 | 86.9 | 86.7 | 86.9 | 84.7 | 82.9 |
| GNB | 84.3 | 84.6 | 85.3 | 85.5 | 84.8 | 84.2 |
| KNN | 97.5 | 97.6 | 97.2 | 96.8 | 95.6 | 94.6 |
| DT | 89.8 | 89.8 | 89.8 | 89.4 | 88.7 | 90.1 |
| CB | 96.1 | 95.6 | 95.8 | 95.5 | 95.1 | 94.3 |
| XGB | 95.3 | 95.1 | 95.7 | 95.0 | 94.5 | 93.9 |
| LR | 86.7 | 86.8 | 87.1 | 86.5 | 84.9 | 83.4 |
| RF | 92.5 | 92.9 | 93.0 | 92.7 | 92.1 | 91.3 |
| SVM | 87.7 | 87.9 | 87.8 | 88.1 | 87.3 | 86.4 |
| MLP | 91.3 | 92.4 | 92.2 | 92.7 | 90.8 | 88.6 |
| GB | 94.7 | 95.2 | 95.1 | 95.1 | 93.7 | 93.9 |
| Voting | 96.8 | 96.5 | 96.5 | 96.3 | 95.7 | 94.9 |
| Model | All | 22 | 19 | 16 | 13 | 10 |
|---|---|---|---|---|---|---|
| LDA | 86.6 | 86.9 | 86.7 | 86.9 | 84.6 | 82.9 |
| GNB | 84.3 | 84.5 | 85.3 | 85.5 | 84.8 | 84.2 |
| KNN | 97.5 | 97.6 | 97.2 | 96.8 | 95.6 | 94.6 |
| DT | 89.8 | 89.8 | 89.8 | 89.5 | 88.7 | 90.0 |
| CB | 96.1 | 95.6 | 95.8 | 95.5 | 95.1 | 94.3 |
| XGB | 95.3 | 95.1 | 95.7 | 95.0 | 94.5 | 93.9 |
| LR | 86.7 | 86.8 | 87.0 | 86.4 | 84.9 | 83.4 |
| RF | 92.5 | 92.8 | 92.9 | 92.7 | 92.1 | 91.3 |
| SVM | 87.5 | 87.7 | 87.6 | 88.0 | 87.1 | 86.2 |
| MLP | 91.4 | 92.4 | 92.2 | 92.7 | 90.8 | 88.6 |
| GB | 94.7 | 95.2 | 95.1 | 95.1 | 93.7 | 93.9 |
| Voting | 96.8 | 96.5 | 96.5 | 96.3 | 95.7 | 94.9 |
| Model | All | 22 | 19 | 16 | 13 | 10 |
|---|---|---|---|---|---|---|
| LDA | 86.7 | 86.9 | 86.5 | 86.4 | 83.9 | 82.7 |
| GNB | 84.3 | 84.9 | 85.3 | 85.1 | 83.8 | 84.1 |
| KNN | 97.5 | 97.5 | 97.2 | 96.9 | 95.5 | 94.1 |
| DT | 89.8 | 89.1 | 89.0 | 89.4 | 88.6 | 89.3 |
| CB | 96.1 | 95.6 | 95.9 | 95.8 | 94.5 | 94.2 |
| XGB | 95.3 | 95.2 | 95.1 | 94.7 | 93.8 | 93.6 |
| LR | 86.7 | 86.8 | 86.7 | 86.1 | 84.3 | 83.3 |
| RF | 92.5 | 92.4 | 92.7 | 92.4 | 91.8 | 91.1 |
| SVM | 87.7 | 87.7 | 87.7 | 87.2 | 86.6 | 85.2 |
| MLP | 91.3 | 92.1 | 92.3 | 90.8 | 90.5 | 89.0 |
| GB | 94.7 | 94.4 | 95.2 | 95.2 | 93.6 | 93.3 |
| Voting | 96.8 | 96.5 | 96.2 | 96.4 | 95.0 | 94.6 |
| Model | All | 22 | 19 | 16 | 13 | 10 |
|---|---|---|---|---|---|---|
| LDA | 86.6 | 86.9 | 86.4 | 86.3 | 83.8 | 82.7 |
| GNB | 84.3 | 84.9 | 85.3 | 85.0 | 83.7 | 84.1 |
| KNN | 97.5 | 97.5 | 97.2 | 96.9 | 95.5 | 94.1 |
| DT | 89.8 | 89.1 | 88.9 | 89.4 | 88.6 | 89.3 |
| CB | 96.1 | 95.6 | 95.9 | 95.8 | 94.5 | 94.2 |
| XGB | 95.3 | 95.2 | 95.1 | 94.7 | 93.8 | 93.5 |
| LR | 86.7 | 86.8 | 86.7 | 86.1 | 84.3 | 83.3 |
| RF | 92.5 | 92.4 | 92.7 | 92.4 | 91.8 | 91.1 |
| SVM | 87.5 | 87.5 | 87.5 | 87.0 | 86.4 | 85.1 |
| MLP | 91.4 | 92.0 | 92.2 | 90.9 | 90.5 | 88.9 |
| GB | 94.7 | 94.4 | 95.2 | 95.2 | 93.6 | 93.3 |
| Voting | 96.8 | 96.5 | 96.2 | 96.4 | 95.0 | 94.6 |
Tables 2 and 3 present the accuracy and F1-score results of various machine learning models using the F-statistic feature selection. Overall, KNN achieved the highest performance in both metrics, with an accuracy and F1-score of 97.5% when using all features. The voting classifier and CB also achieved strong performance. In contrast, models such as LDA, GNB, and LR had lower accuracies and F1-scores, especially when the number of features was reduced.
Tables 4 and 5 summarize the results using the chi-square feature selection technique. Similar to the F statistic results, the KNN and ensemble models maintained strong performance across different feature sets. However, model performance decreases as the number of selected features decreases.
Tables 6 and 7 present the results of RFE. This technique also showed strong performance in the KNN and ensemble models. The accuracy and F1-score of most models remained stable when using 16–22 features but started to decline as the number of features was reduced.
Tables 8 and 9 summarize the results obtained using MI. While there were some differences in model performance, the overall trend remained consistent with that of the other feature selection techniques.
However, KNN was the best performing model, achieving an accuracy and F1-score of 97.6% with the 22 features selected through RFE, as shown in (Tables 6 and 7). The corresponding Wilson Confidence Interval (95% CI) was [96.3–98.4%], indicating stable and reliable performance. To better understand why the RFE configuration achieved the best results, the relative importance of the selected factors was examined. The RFE results showed that factors such as gender, age, employment status, marital status, academic year, GPA, failed courses, and academic warnings were among the top contributing features. Factors such as studying difficulty, university satisfaction, language barrier, major preknowledge, and family/employer pressure showed moderate contributions. In contrast, factors such as cultural expectation, city moving, commitments, family/friends support, psychological issues, and health issues had weaker contributions. Additionally, peer influence and living expenses were excluded entirely by the RFE algorithm. Accordingly, KNN was selected as the primary model for the explanation phase.
Explainability model results and evaluation
In this phase, the KNN model was selected due to its superior performance when using the 22 features identified through RFE. The explanation process focused on analyzing individual students to explore how the model reached its prediction in different situations. Several student cases were selected and analyzed using SHAP and LIME. In each case, the model predicted that the student would/would not drop out with high confidence, assigning a prediction probability of 1.00 in both the SHAP and LIME explanations. The average dropout and non-dropout were subsequently calculated using SHAP and LIME to identify the most influential factors for each class. A SHAP summary plot was also presented to provide an overview of feature importance across all the students. In addition, the LEAF framework was used to evaluate the quality of these explanations through four metrics: fidelity, local concordance, prescriptivity, and stability.
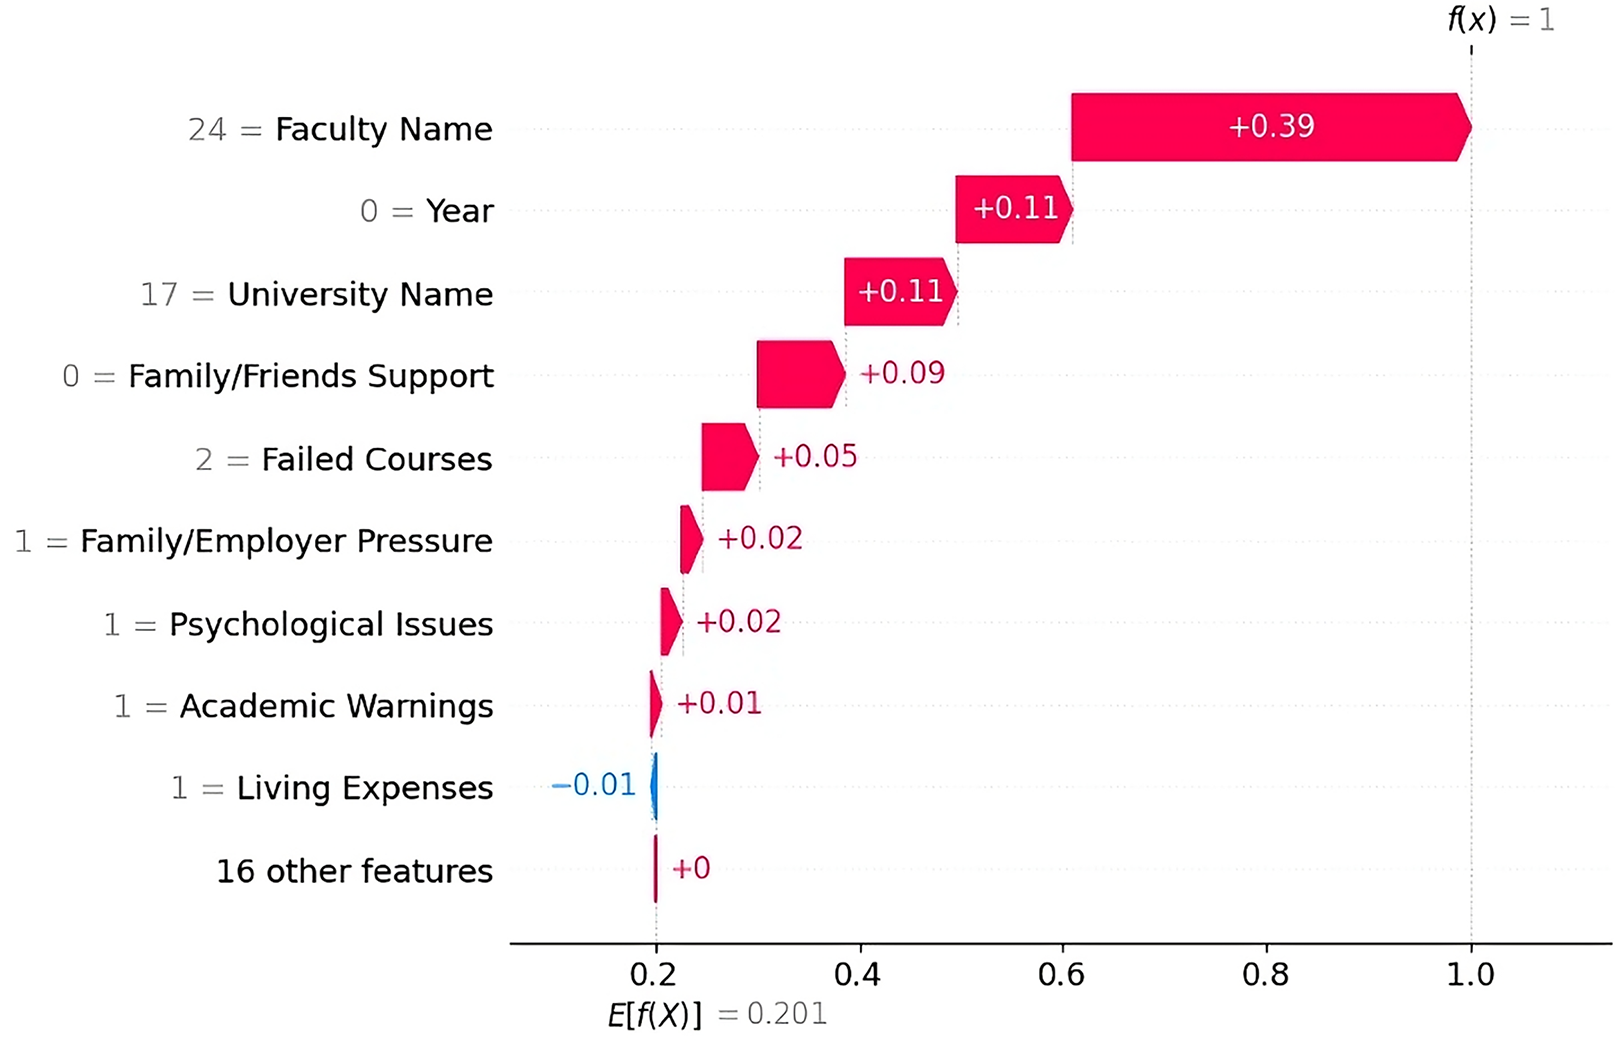
Dropout Case 1 The SHAP waterfall plot (Fig. 5) shows that the most influential factor in the prediction was the faculty name “Preparatory Year”, which alone contributed toward the prediction. This finding indicates that the preparatory year was strongly associated with higher dropout rates in the dataset. This finding is consistent with those of previous studies, which reported that most students tend to drop out during their first year. Other key factors include the university name “PNU” ( ) and the academic year “First Year” ( ), both of which contribute positively to the prediction. The students lack of family/friend support, the presence of two failed courses, and family/employer pressure also played roles in student dropout.
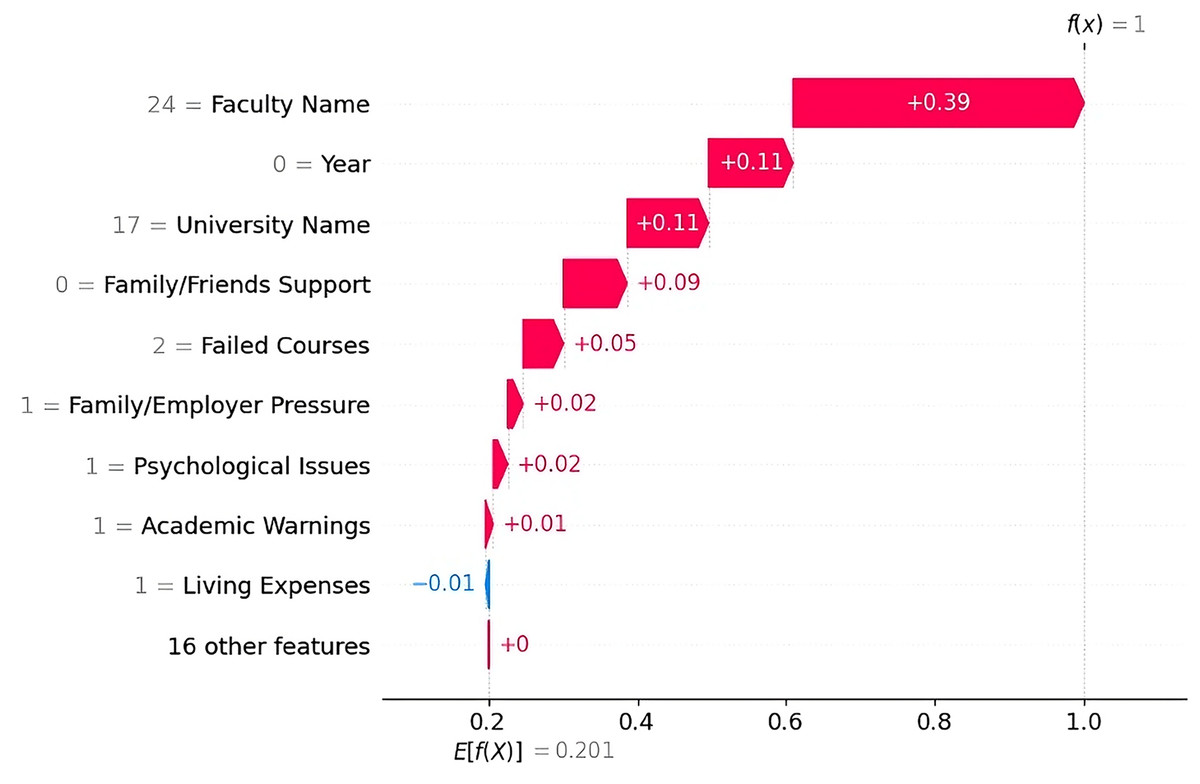
Figure 5: SHAP waterfall explanation for the features influencing the dropout prediction (Case 1).
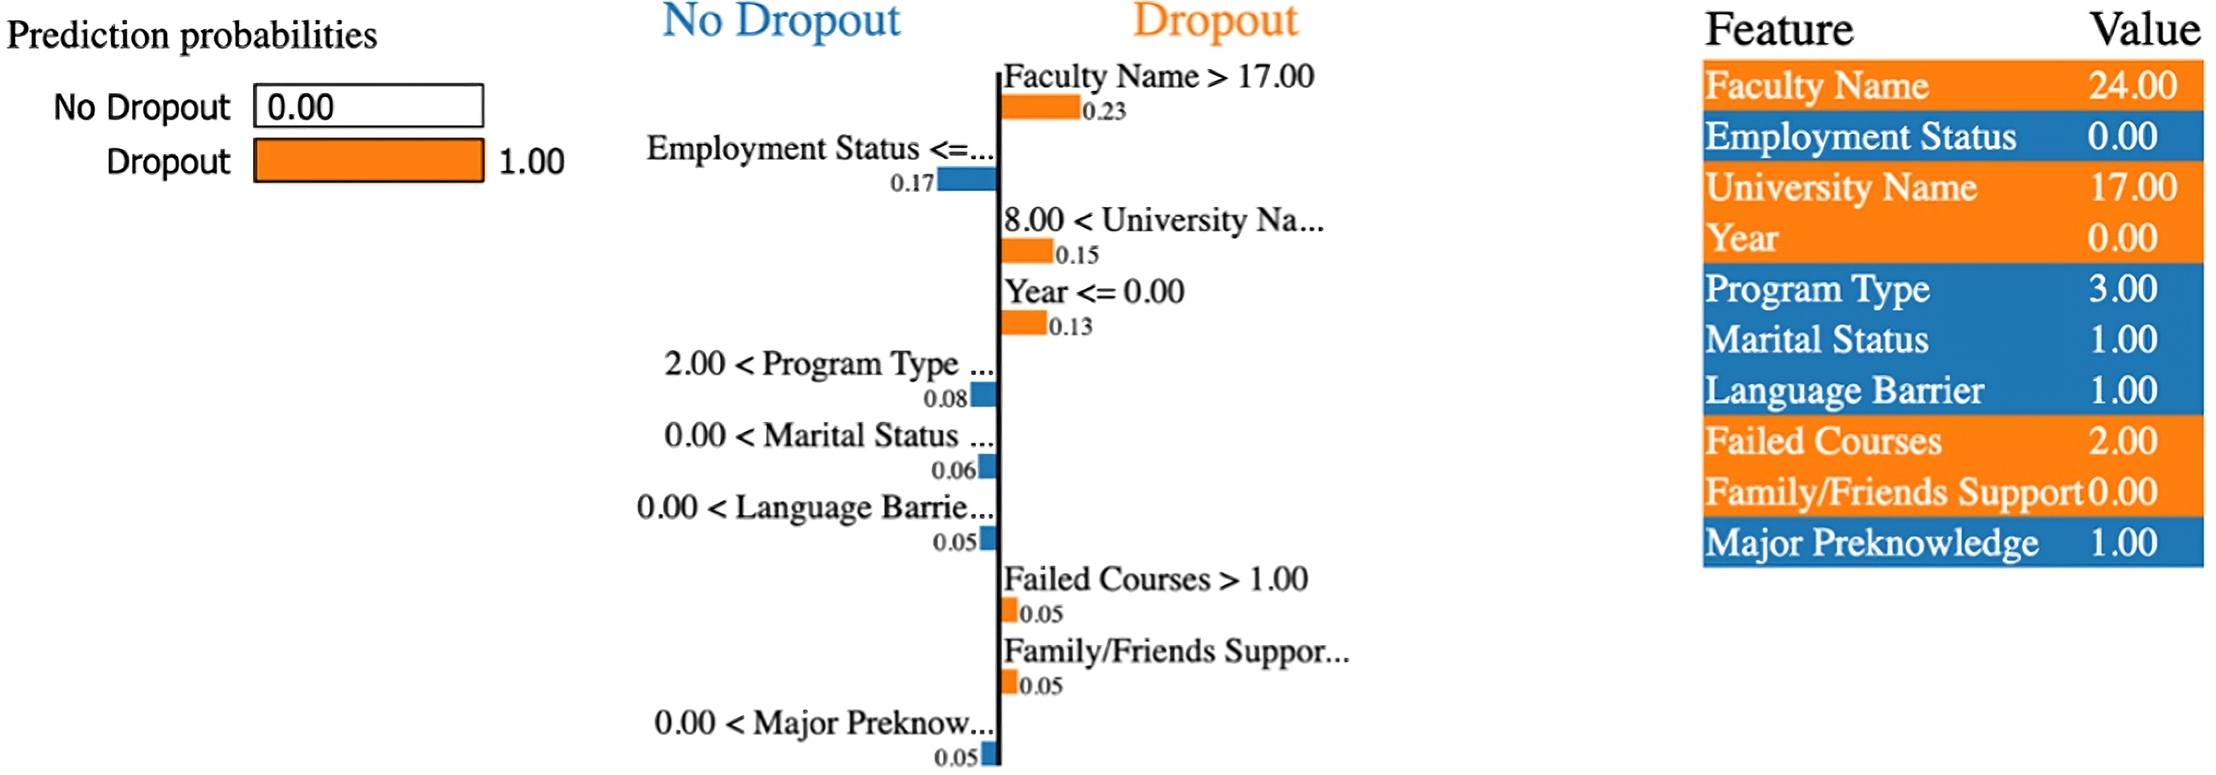
The LIME explanation (Fig. 6) supports this result by highlighting similar factors. It shows that the faculty and university name (preparatory year in PNU), a lower academic year, and a higher number of failed courses (more than 1) strongly lead to a dropout prediction. Despite the students having some positive indicators, such as prior knowledge of their major and no language barrier, these indicators were outweighed by stronger dropout factors.
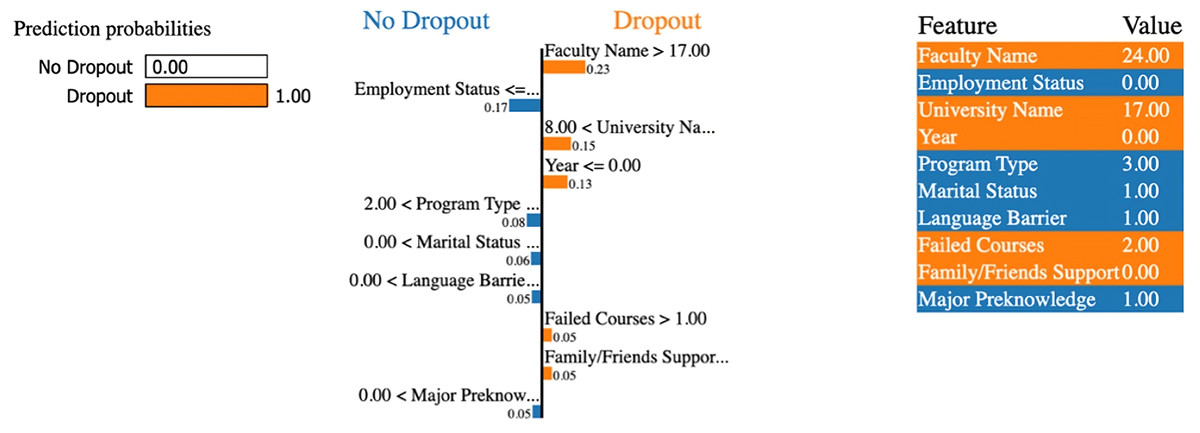
Figure 6: LIME explanation for the features influencing the dropout prediction (Case 1).
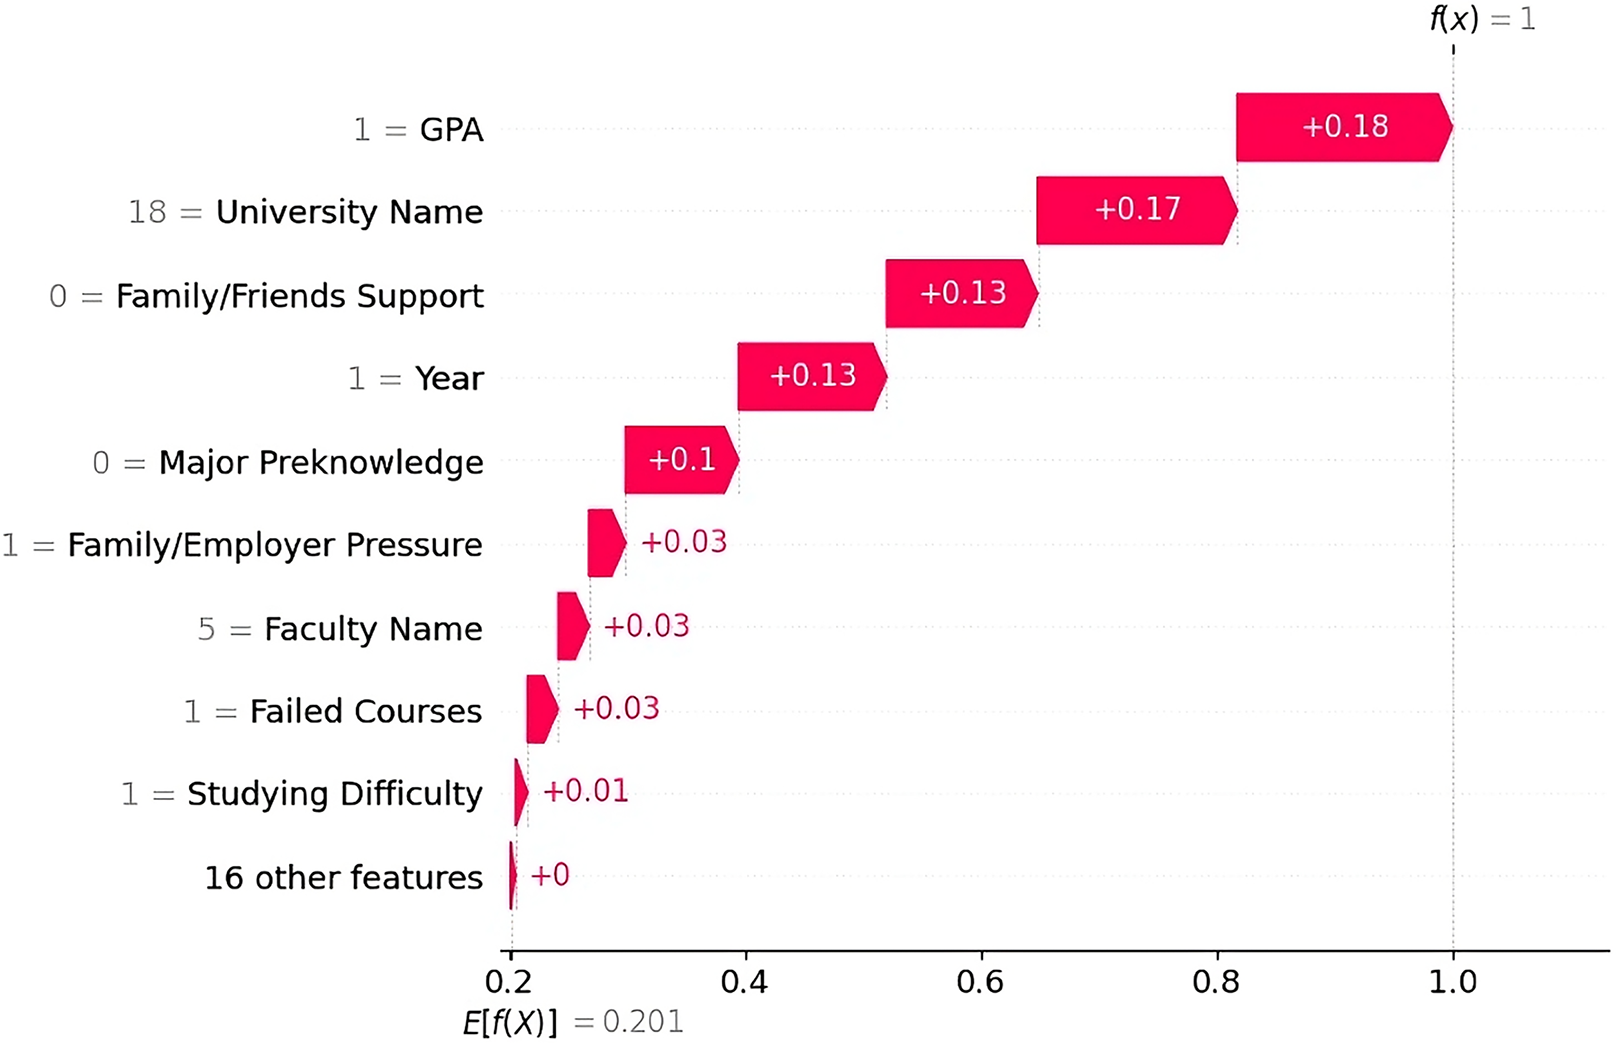
Dropout Case 2 The SHAP waterfall plot (Fig. 7) shows that the greatest contributing factor was the GPA “Good”, which added ( ) to the output. Other major contributors were the university “KKU” ( ), the academic year “Second Year” ( ), lack of support from family/friends ( ), and lack of prior major knowledge ( ). Together, these features led to a dropout prediction. Additional factors included family/employer pressure, the faculty name “College of Art & Design,” and the presence of failed courses, each adding a small but consistent contribution ( ).
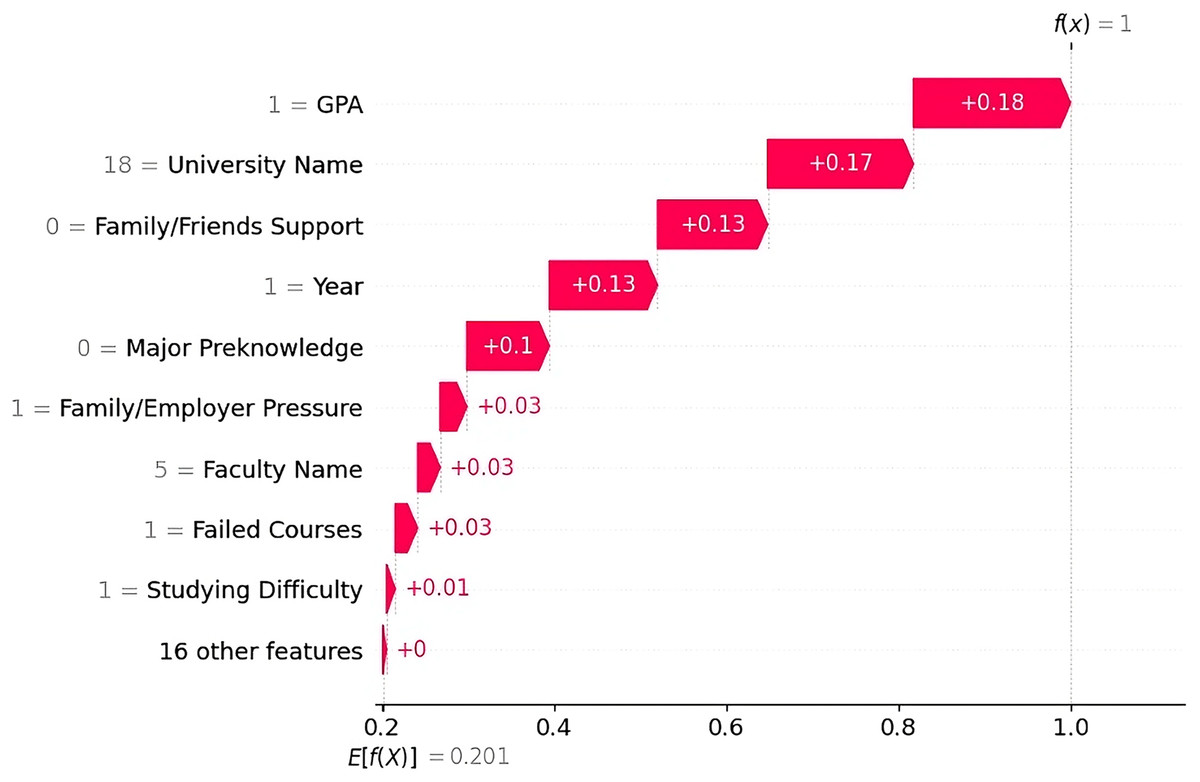
Figure 7: SHAP waterfall explanation for the features influencing the dropout prediction (Case 2).
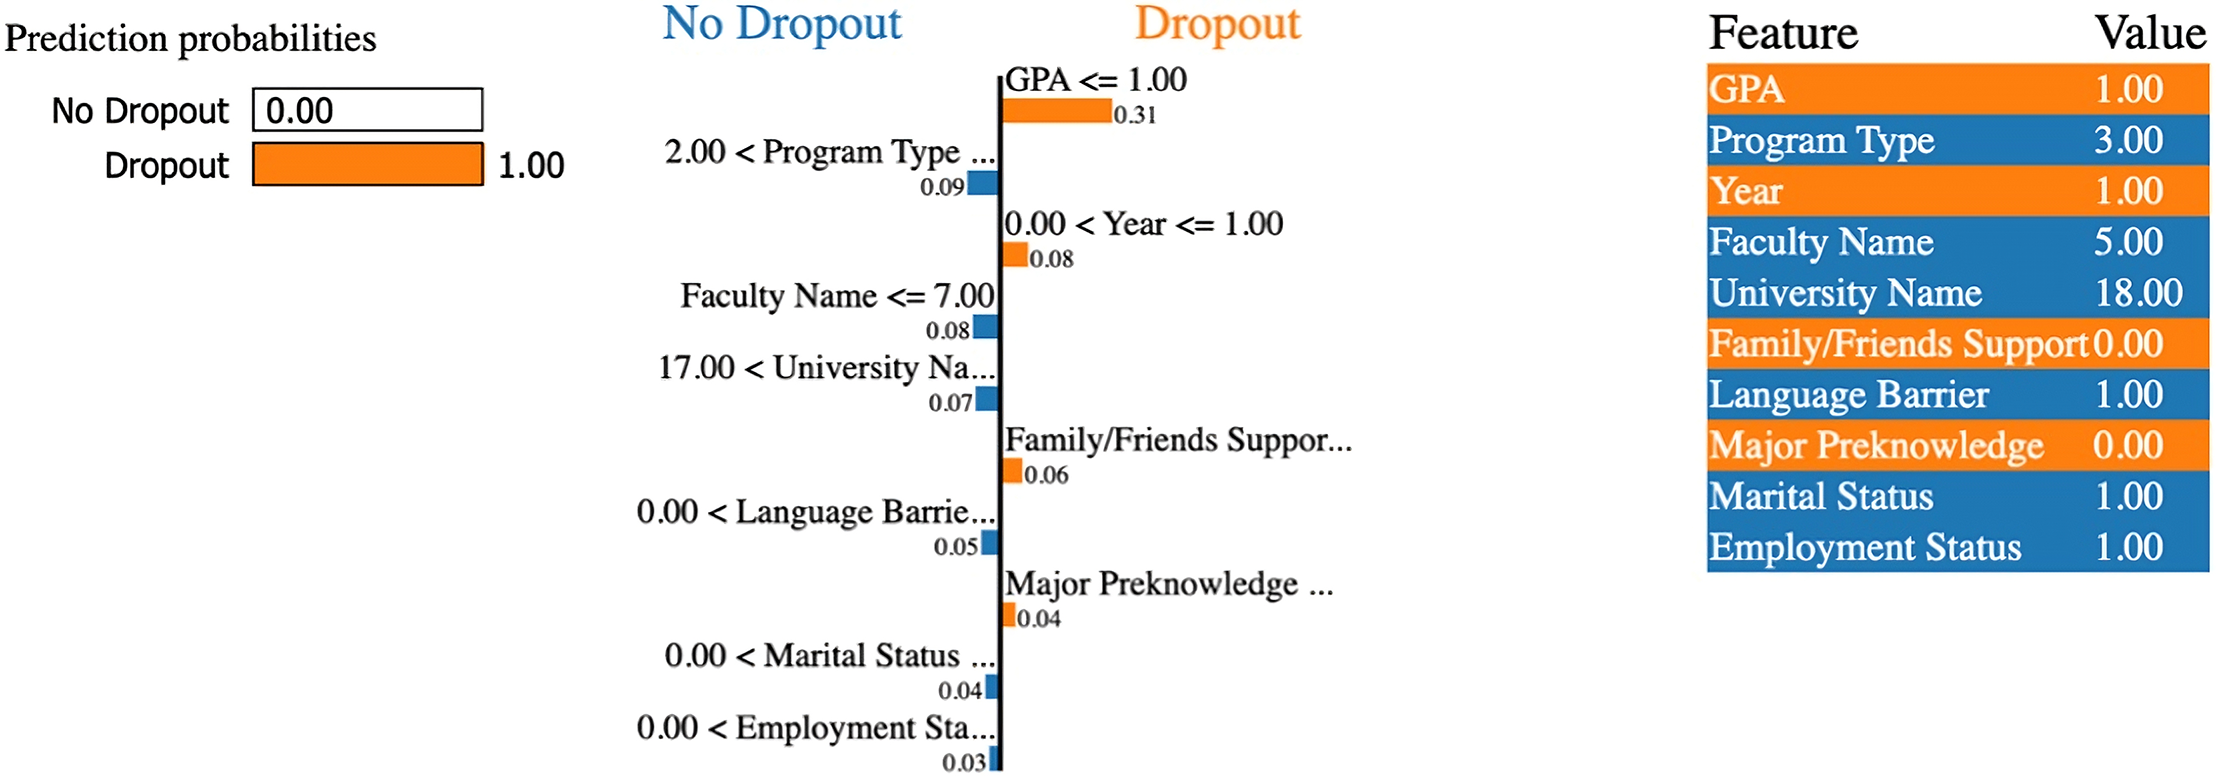
The LIME explanation (Fig. 8) supports this result by highlighting the same top factors. This finding shows that the dropout decision was driven by factors such as low GPA, lower academic year, no prior major knowledge, and lack of support from family/friends. However, the student had a few factors that reduced dropout risk, such as being unemployed, having no language barriers, and being single, but these positive factors were outweighed by more influential dropout factors.
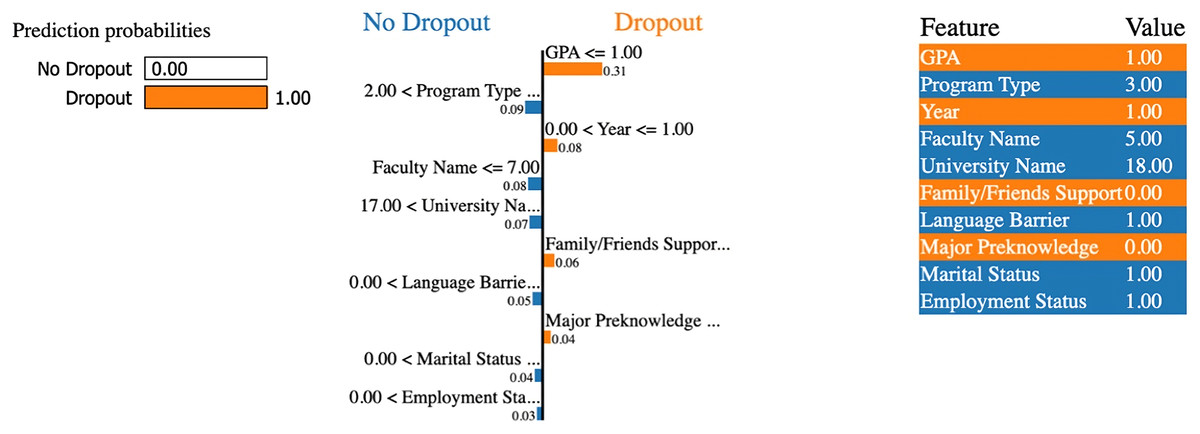
Figure 8: LIME explanation for the features influencing the dropout prediction (Case 2).
Non-Dropout Case 1 The SHAP plot (Fig. 9) shows that the most influential factor reducing the likelihood of dropout was the faculty name “College of CS and IT”, which contributed ( ) to the prediction. This suggests that students in this faculty are less likely to drop out based on patterns in the dataset. Another strong factor was the student’s GPA, “Excellent” ( ). This finding is consistent with previous research showing that higher academic performance is strongly associated with lower dropout rates. Other features, such as the academic year “Above Third Year” ( ), employment status “Unemployed” ( ), and the university name “KSU” ( ), also contributed to a lower dropout risk. A few features contributed slightly to dropout, such as the student’s age ( ), language barrier ( ), and marital status ( ), but their influence was outweighed by stronger academic and social factors.
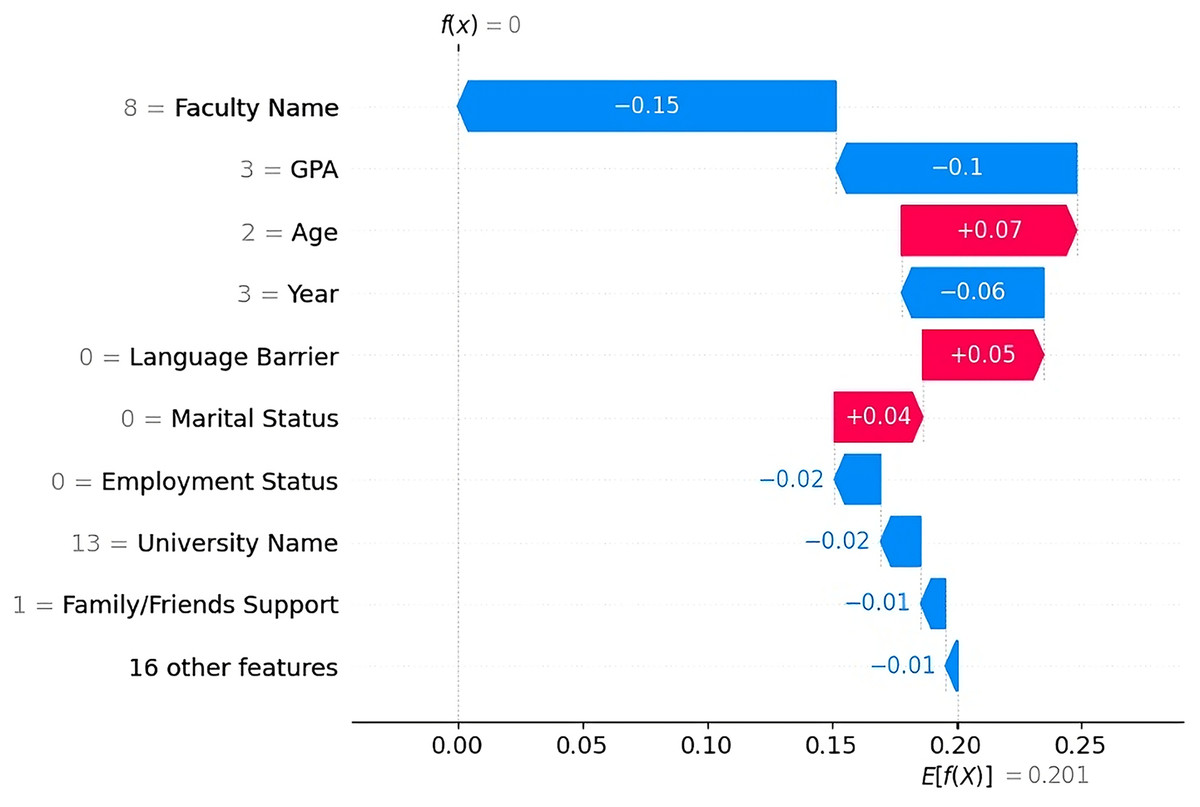
Figure 9: SHAP waterfall explanation for the features influencing the non-dropout prediction (Case 1).
The LIME explanation (Fig. 10) confirms this result, highlighting that a high GPA between 2.0 and 3.0, an advanced academic year, and strong support from family/friends support are among the top factors reducing dropout risk.
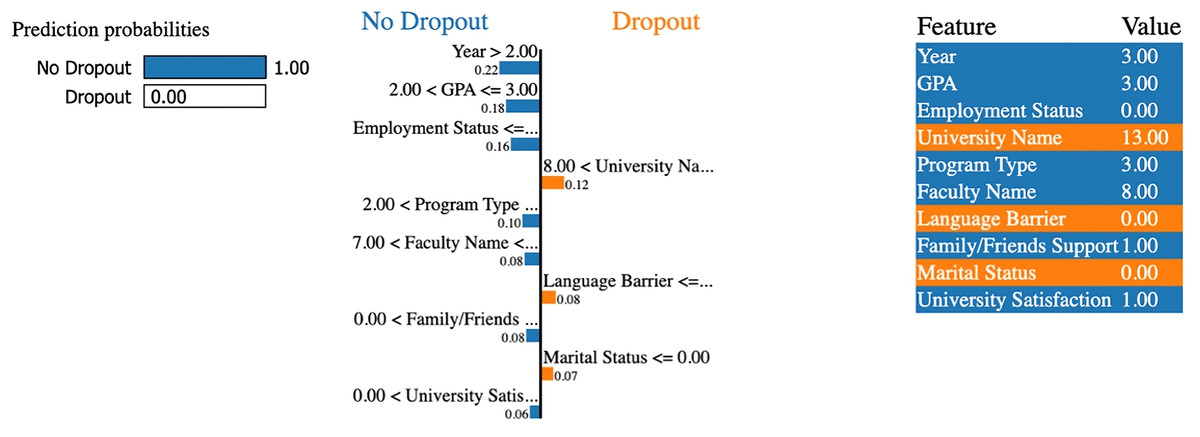
Figure 10: LIME explanation for the features influencing the non-dropout prediction (Case 1).
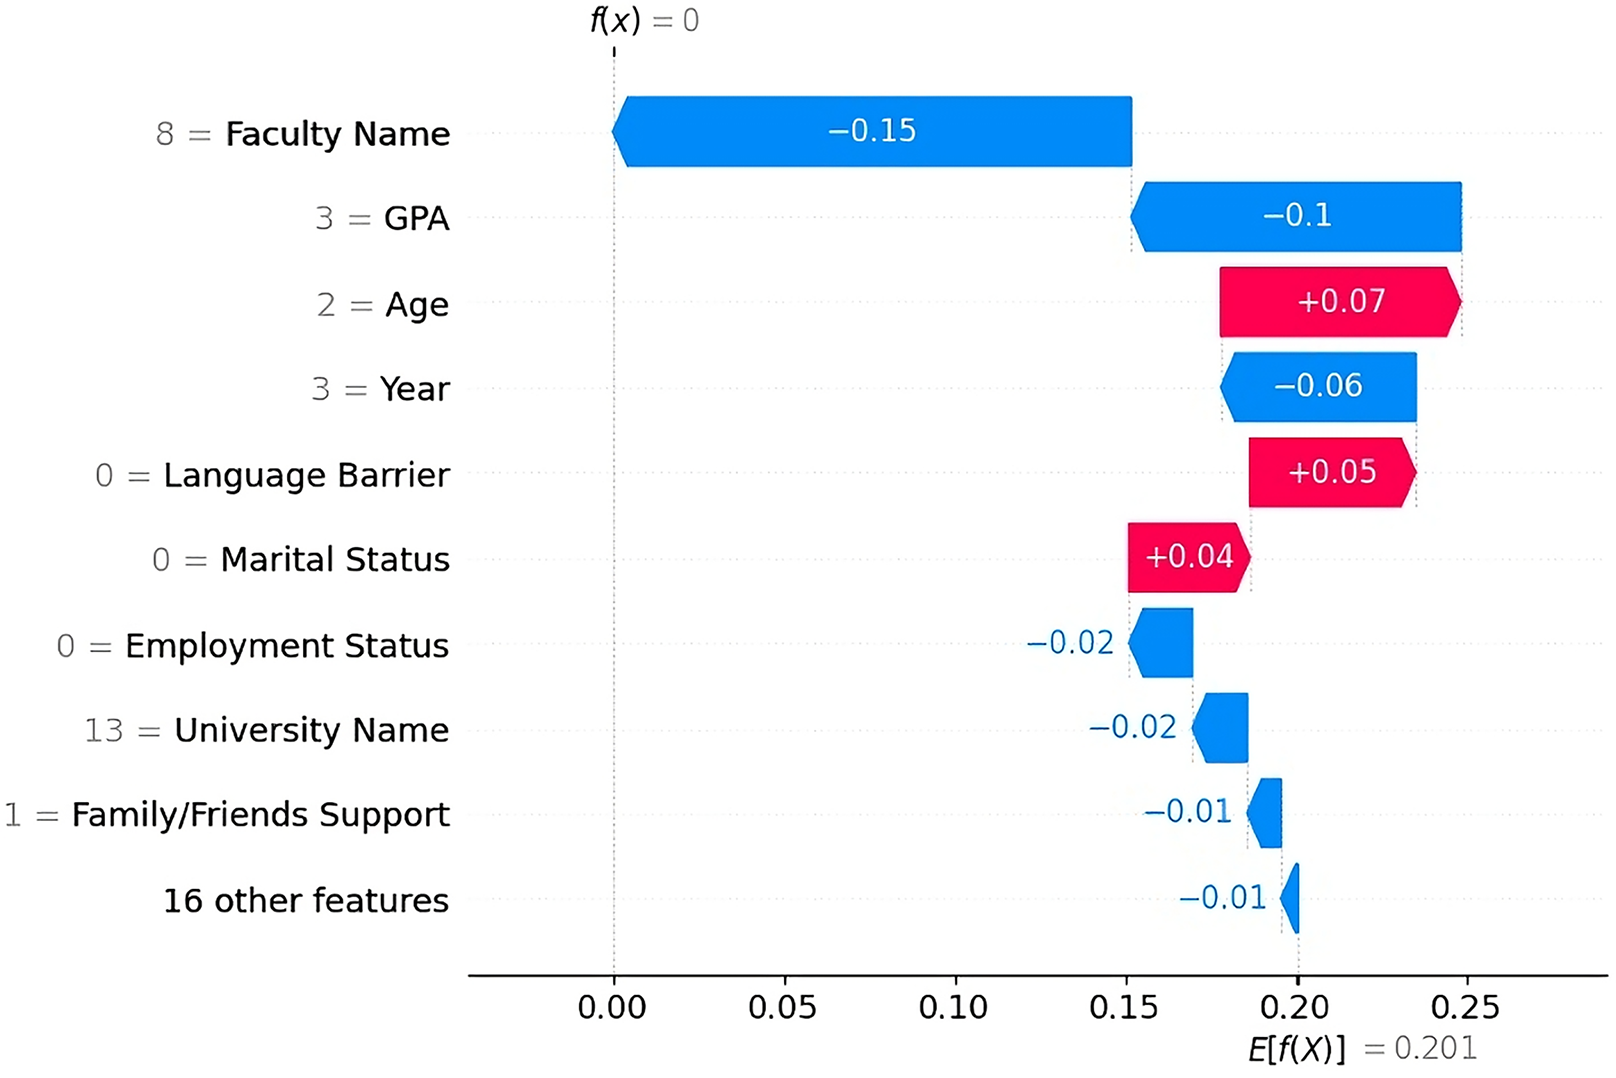
Non-Dropout Case 2 According to the SHAP plot (Fig. 11), the strongest factor influencing the prediction was the student’s GPA, which contributed ( ) to the non-dropout prediction. Other features that reduce the likelihood of dropout include the faculty name “College of Architecture & Planning” ( ), the university name “YIC” ( ), and the academic year “Above Third Year” ( ). Minor contributions also came from the presence of support from family/friends and the student’s employment status, i.e., “unemployed.”
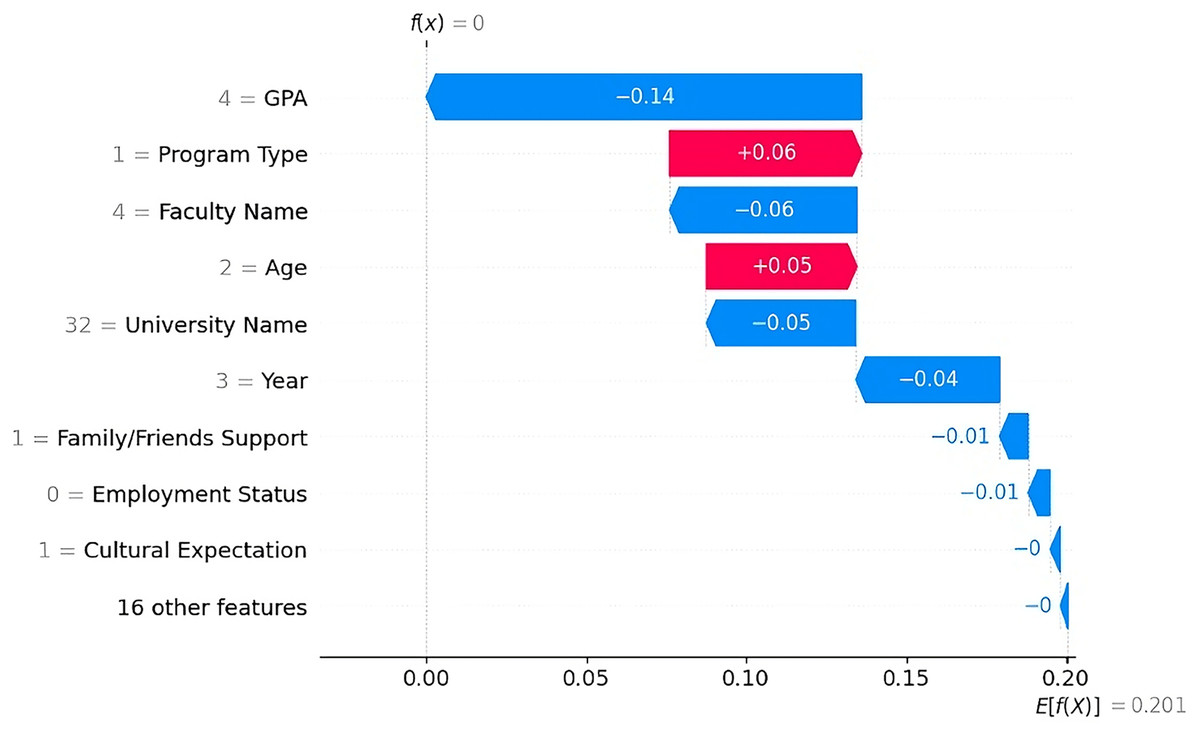
Figure 11: SHAP waterfall explanation for the features influencing the non-dropout prediction (Case 2).
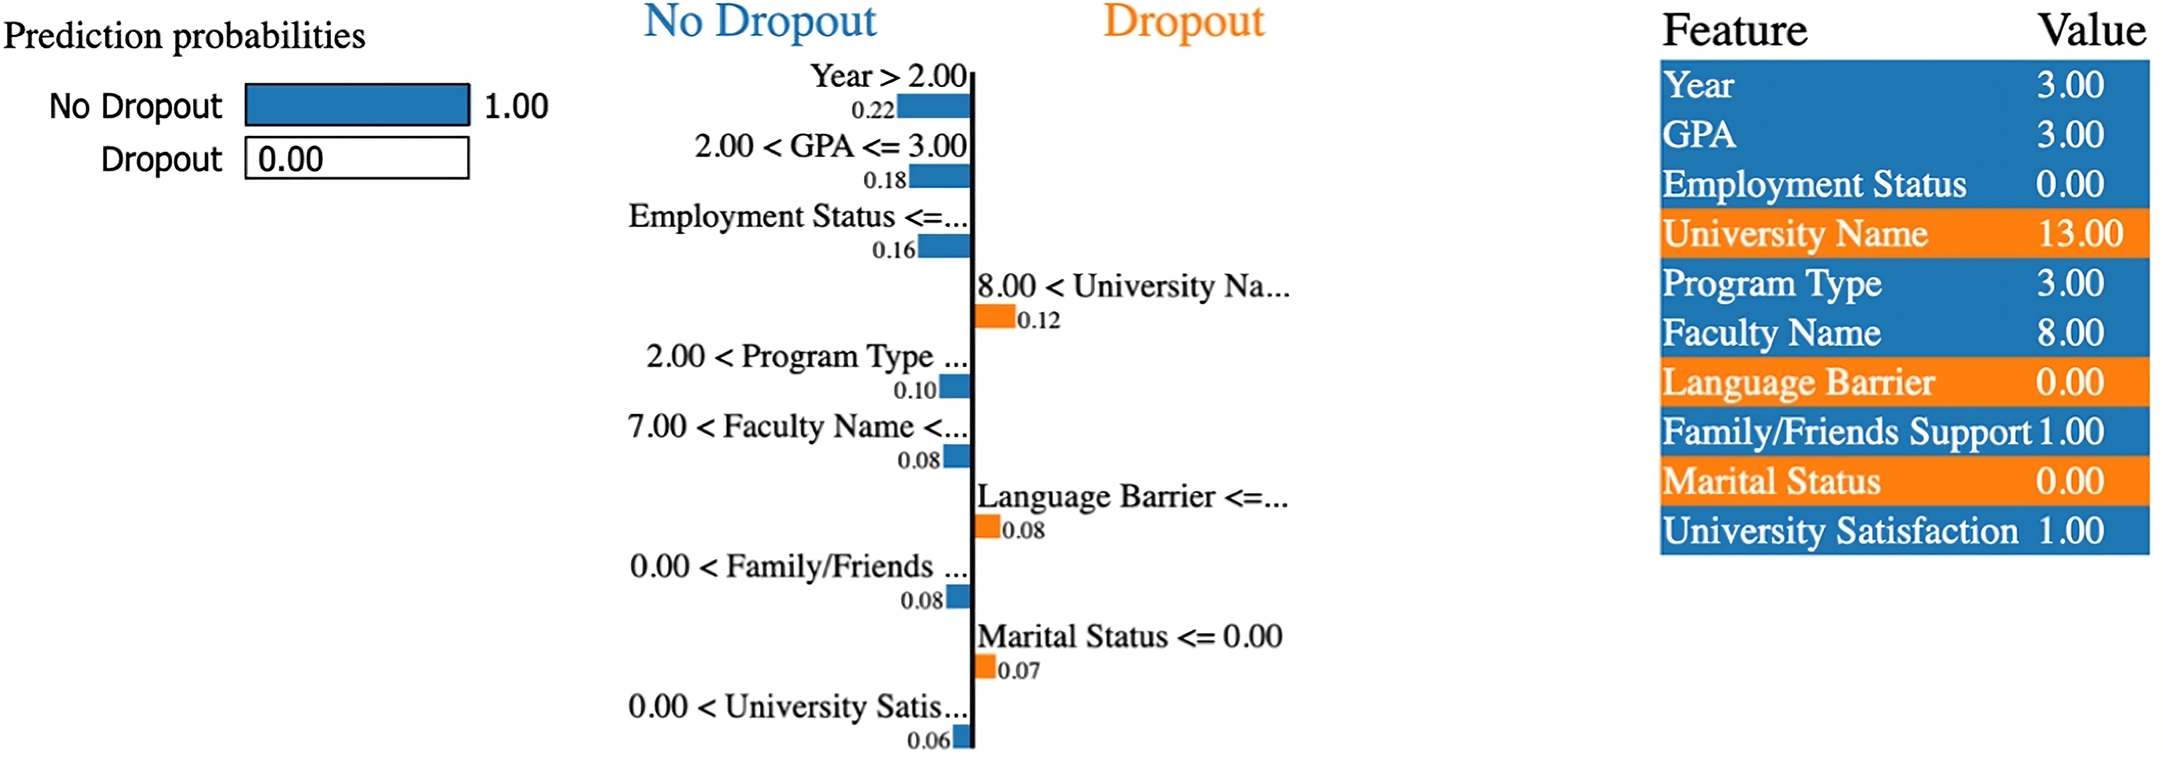
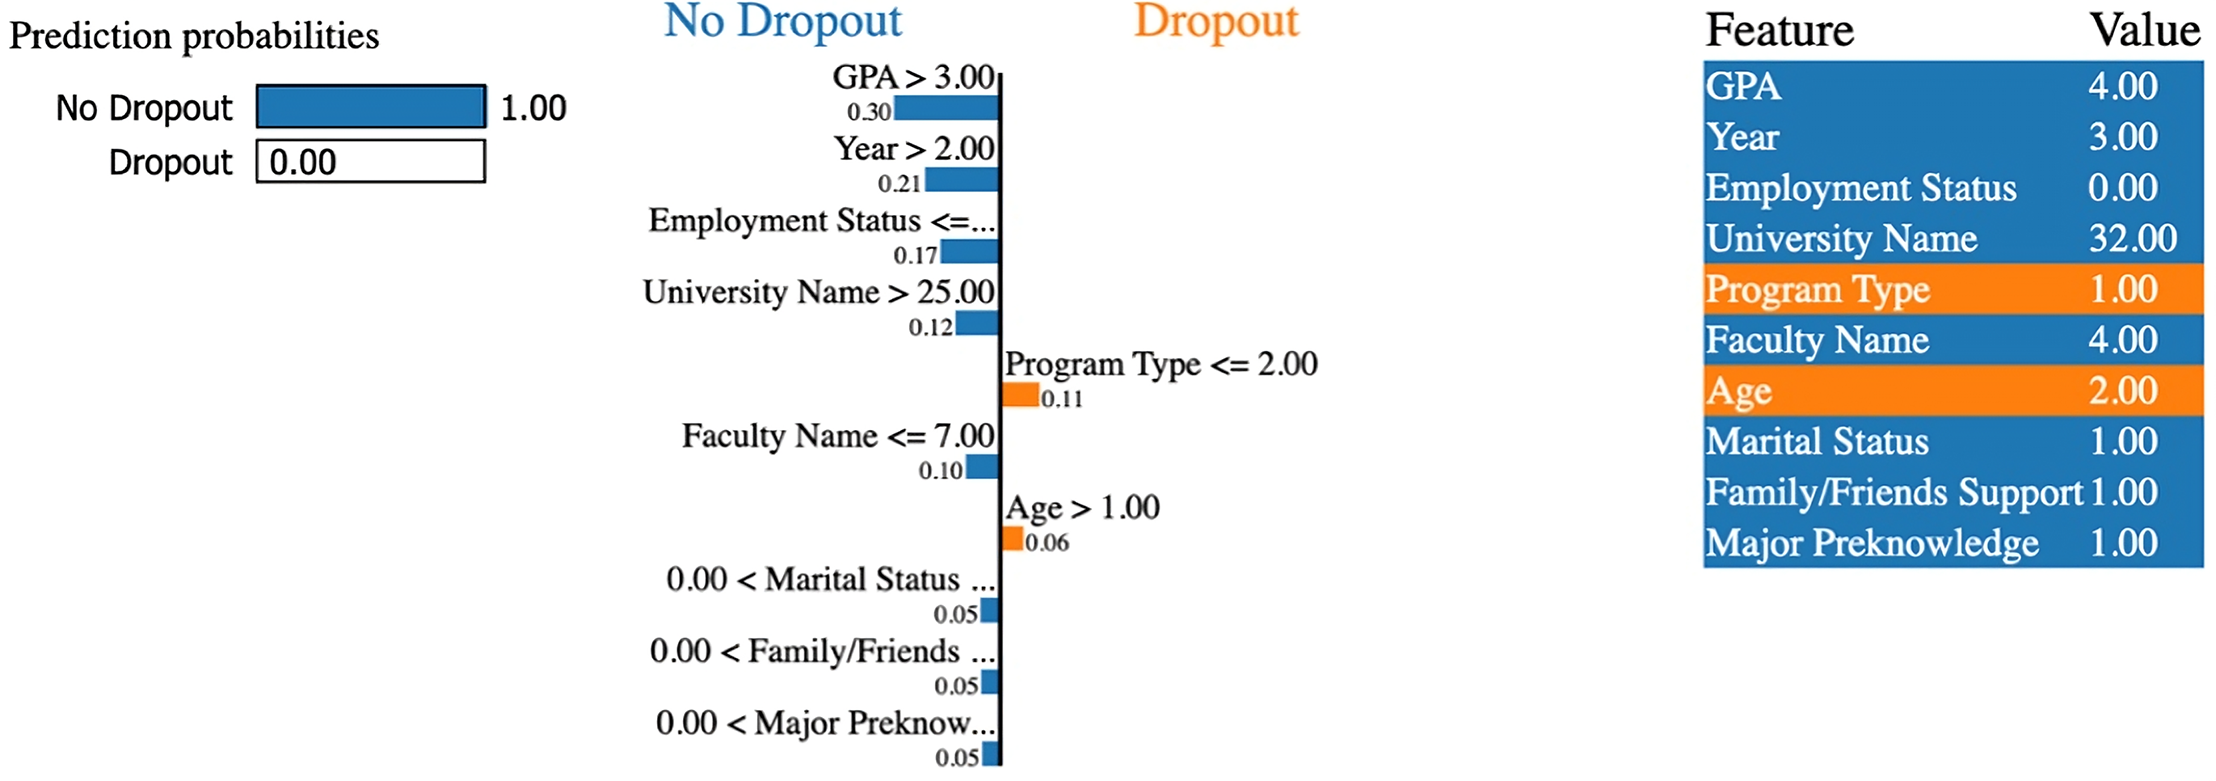
The LIME plot (Fig. 12) supports these findings. It highlights a GPA above 3.0, advanced year level, unemployment, and the student’s university and faculty name as top contributors toward the non-dropout prediction. Additional features, such as marital status, the presence of family/friends support, and prior major knowledge, support the prediction.
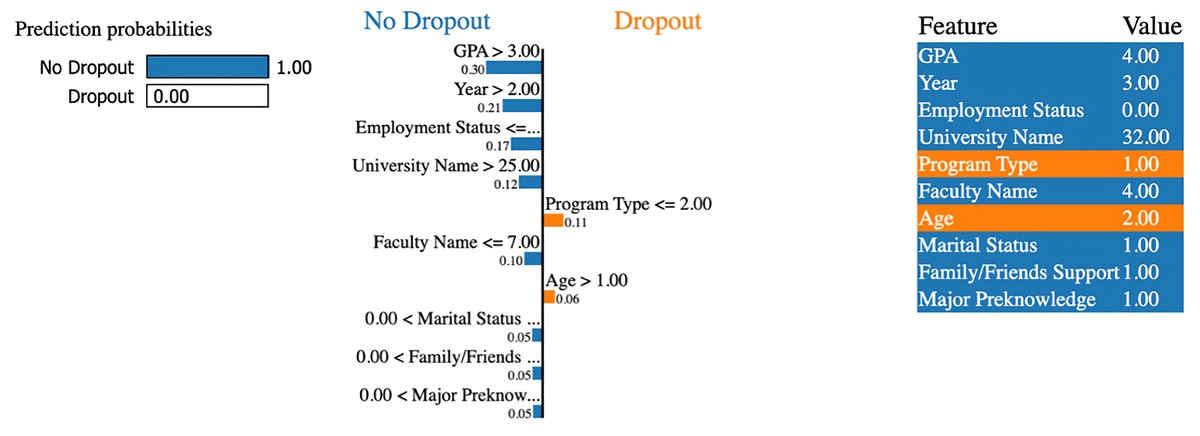
Figure 12: LIME explanation for the features influencing the non-dropout prediction (Case 2).
Average dropout using SHAP and LIME
Both SHAP and LIME were applied to explain the model’s dropout predictions and identify the most influential factors. While both methods revealed similar factors, some differences appeared in their feature rankings. According to LIME (Table 10), GPA, major pre-knowledge, family/friends support, faculty name, and university name were identified as dropout influential factors. These findings indicate that students with lower academic performance, no prior knowledge of their major, and weak social support are more likely to drop out. In addition, the student’s faculty and university were also found to influence the prediction.
| Feature name | LIME value |
|---|---|
| GPA | 0.0652 |
| Major pre-knowledge | 0.0397 |
| Family/Friends support | 0.0272 |
| Faculty name | 0.0223 |
| University name | 0.0140 |
| Year | 0.0110 |
| Commitments | 0.0091 |
| Language barrier | 0.0082 |
| Family/Employer pressure | 0.0059 |
| University satisfaction | 0.0056 |
On the other hand, the SHAP results (Table 11) ranked academic year, university name, program type, family/friends support, and major pre-knowledge as dropout influential factors. This suggests that students in their early academic year, enrolled in specific universities or programs, and those with limited social support or no prior knowledge of their major are at higher risk of dropping out.
| Feature name | SHAP value |
|---|---|
| Year | 0.0305 |
| University name | 0.0268 |
| Program type | 0.0111 |
| Family/Friends support | 0.0111 |
| Major pre-knowledge | 0.0093 |
| Family/Employer pressure | 0.0078 |
| Academic warnings | 0.0058 |
| Psychological issues | 0.0054 |
| Marital status | 0.0046 |
| Cultural expectation | 0.0044 |
Average non-dropout using SHAP and LIME
For non-dropout students, both LIME and SHAP showed that only five features had a positive contribution to student persistence. According to LIME (Table 12), employment status, GPA, health issues, cultural expectations, and psychological issues had the highest positive influence on student retention. These findings indicate that students who are unemployed, maintain higher GPAs, and are less affected by health problems, cultural pressures, or psychological challenges are more likely to remain enrolled.
| Feature name | LIME value |
|---|---|
| Employment status | 0.0090 |
| GPA | 0.0051 |
| Health issues | 0.0016 |
| Cultural expectation | 0.0009 |
| Psychological issues | 0.0005 |
While the SHAP results (Table 13) highlighted GPA, study difficulty, failed courses, academic year, and employment status as the key factors of persistence. This suggests that students who perform well academically, experience fewer study difficulties and failed courses, advance further in their academic years, and are unemployed are less likely to drop out.
| Feature name | SHAP value |
|---|---|
| GPA | 0.0052 |
| Studying difficulty | 0.0010 |
| Failed courses | 0.0008 |
| Year | 0.0006 |
| Employment status | 0.0003 |
Although some variation exists between SHAP and LIME feature rankings, these differences are due to their methodological nature. Despite these differences, both techniques identified similar dropout factors, including major pre-knowledge, family/friends support, university name, academic year, and family/employer pressure. Likewise, for non-dropout predictions, both methods identified employment status and GPA among the key factors.
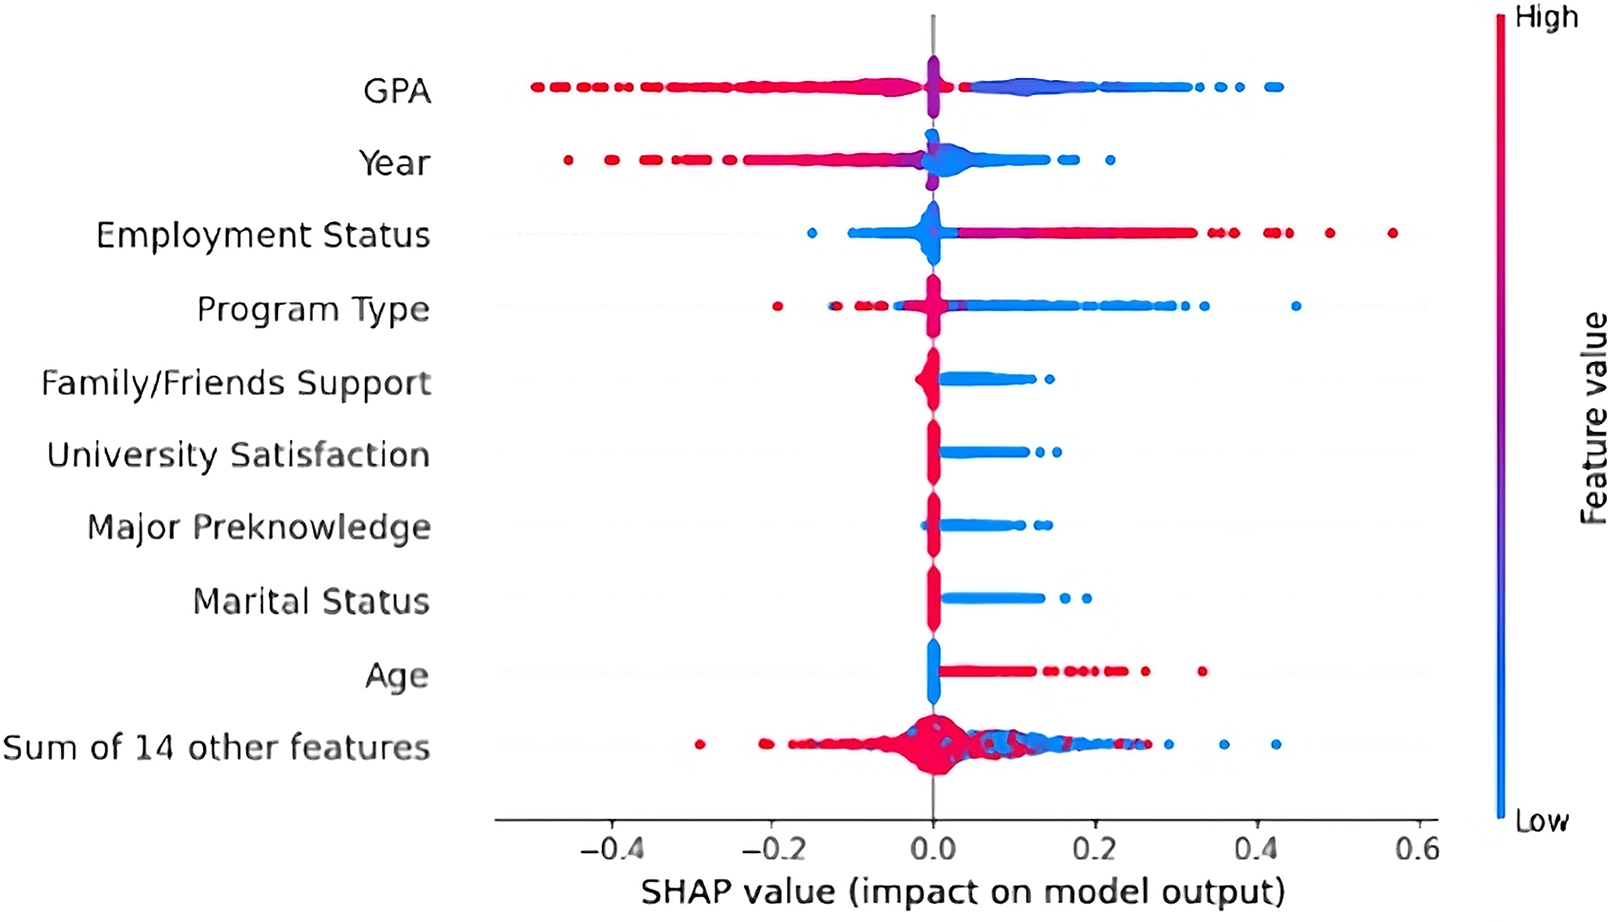
SHAP summary
The SHAP summary plot (Fig. 13) presents the average impact of each feature on the model’s dropout predictions. GPA was the most influential factor, where lower GPA values (in blue) were strongly associated with higher dropout likelihood. This finding aligns with previous research indicating that academic performance plays a key role in predicting student dropout.
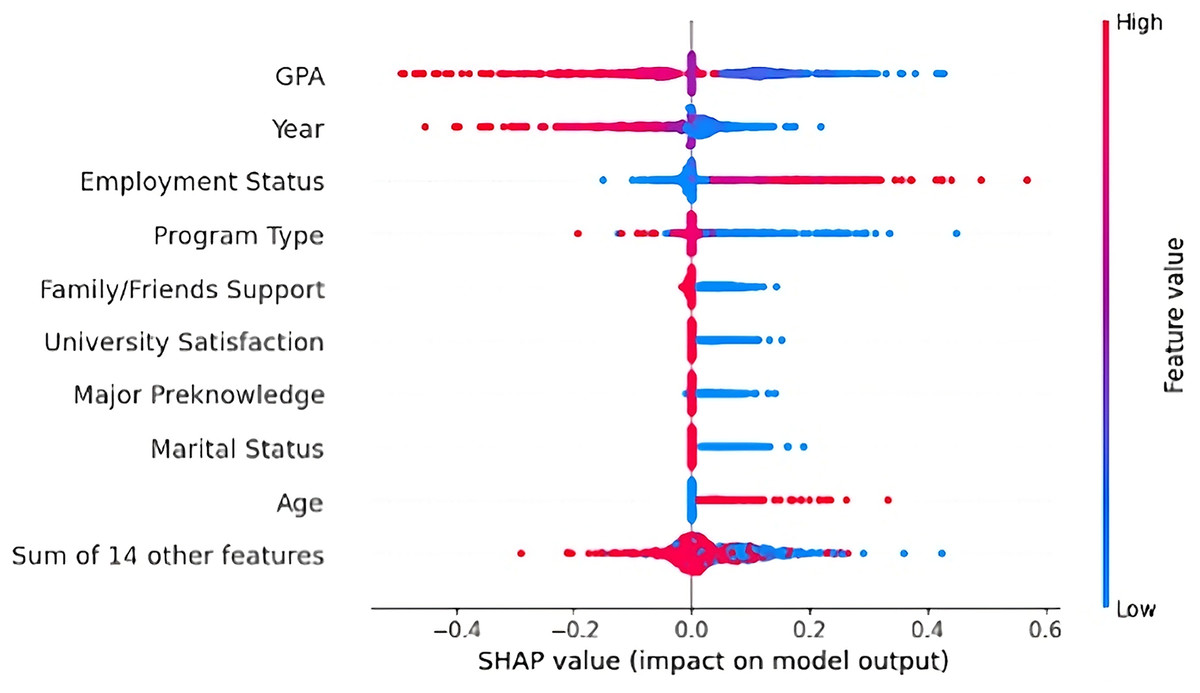
Figure 13: SHAP summary plot ranking features by importance and showing their overall impact on dropout predictions.
The academic year also had a strong influence as students in earlier years were more likely to drop out. Thus, students are most vulnerable at the beginning of their academic journey to drop out. As shown by the red points, being employed (part-time, full-time, or owning a business) was linked to a greater likelihood of dropping out. Similarly, lower-level program types (e.g., diplomas or bachelor’s degree programs) were associated with a higher dropout probability. Other contributing factors included lack of family/friends support, dissatisfaction with the university, no prior major knowledge, and being married. Interestingly, older students also showed an increased likelihood of dropping out, suggesting that age-related responsibilities may influence student dropout. Overall, the distribution of SHAP values supports the conclusion that personal, academic, and sociocultural factors jointly affect student dropout.
LEAF evaluation
LEAF was applied to both SHAP and LIME to assess the quality of the model explanations. Table 14 summarizes the definitions of each LEAF metric: Fidelity, Local Concordance, Prescriptivity, and Stability.
| Metric | Description |
|---|---|
| Fidelity | The extent to which the explanation matches the model’s actual prediction. |
| Local concordance | How well the explanation matches the model’s confidence in its prediction. |
| Prescriptivity | The extent to which the explanation offers actionable insight. |
| Stability | The consistency of the explanation when small changes are made to the input data. |
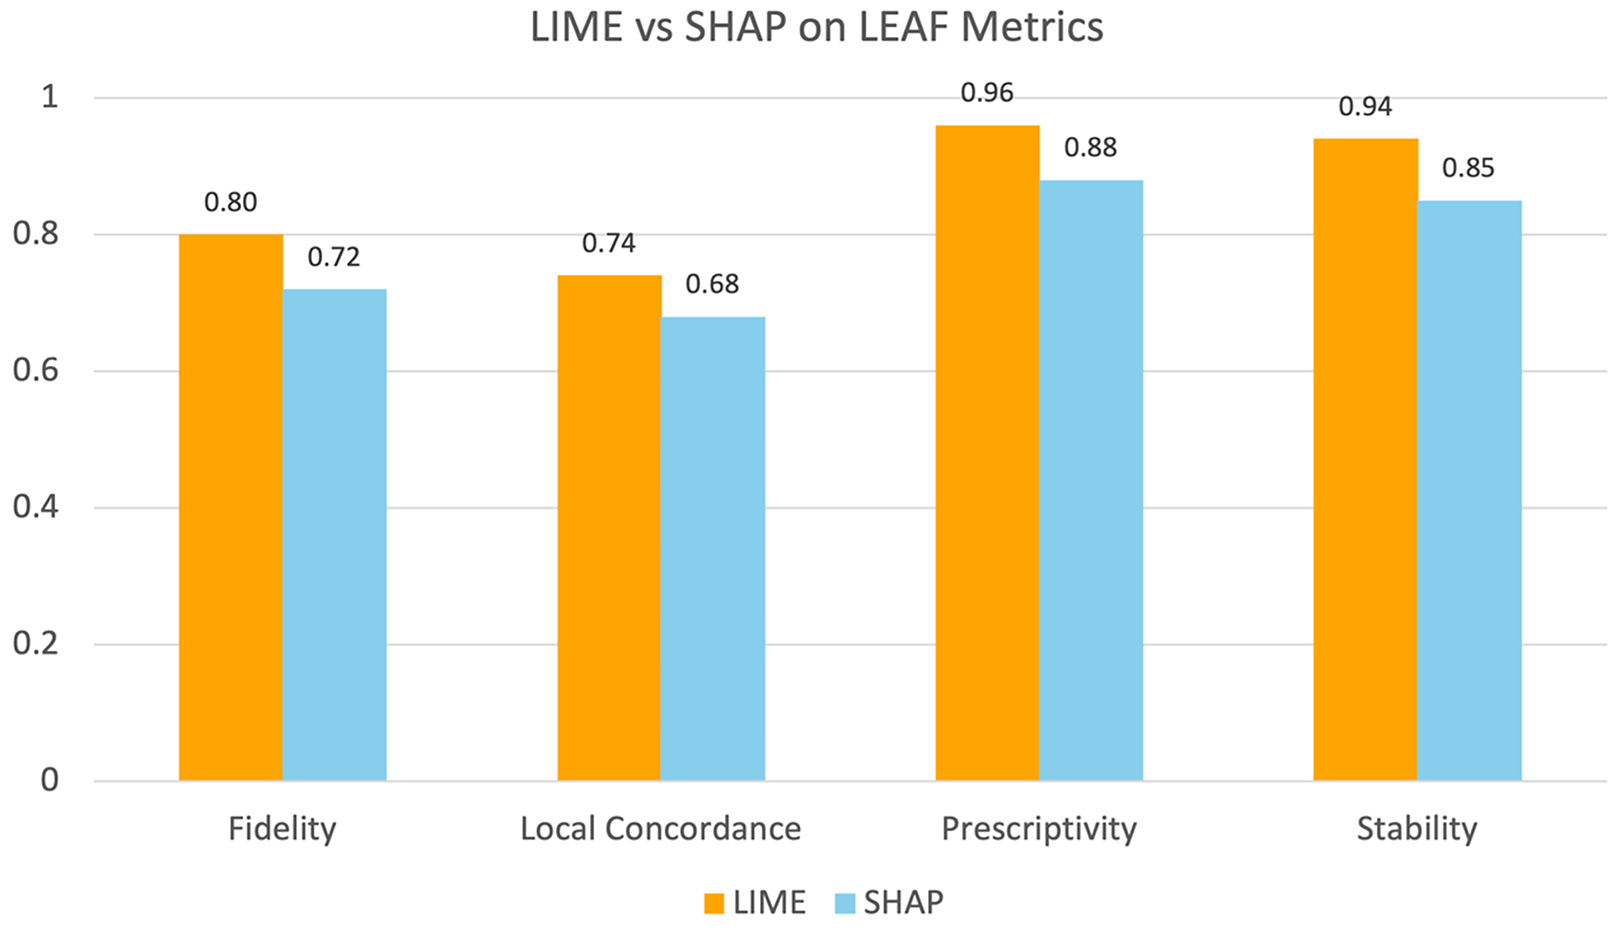
As shown in (Table 15), LIME outperforms SHAP across all four metrics. In terms of fidelity, the LIME explanations matched the actual predictions, with a score of 0.80, compared with 0.72 for SHAP. Similarly, local concordance was higher for LIME (0.74) than for SHAP (0.68). For prescriptivity, LIME achieved a score of 0.96, whereas SHAP scored 0.88. Finally, in terms of stability, LIME again scored higher (0.94) than SHAP did (0.85). In addition, the differences across all metrics were statistically significant ( ). These results demonstrate that LIME produces more reliable and actionable explanations than SHAP for the student dropout prediction model.
| Metric | LIME | SHAP | p-value |
|---|---|---|---|
| Fidelity | 0.80 | 0.72 | 0.037 |
| Local concordance | 0.74 | 0.68 | 0.041 |
| Prescriptivity | 0.96 | 0.88 | 0.028 |
| Stability | 0.94 | 0.85 | 0.018 |
Figure 14 provides a visual comparison between LIME and SHAP based on the four LEAF evaluation metrics. This illustrates that LIME achieved higher scores than SHAP did for all the metrics. This finding supports the results shown in (Table 15) and confirms that LIME is consistently more effective.
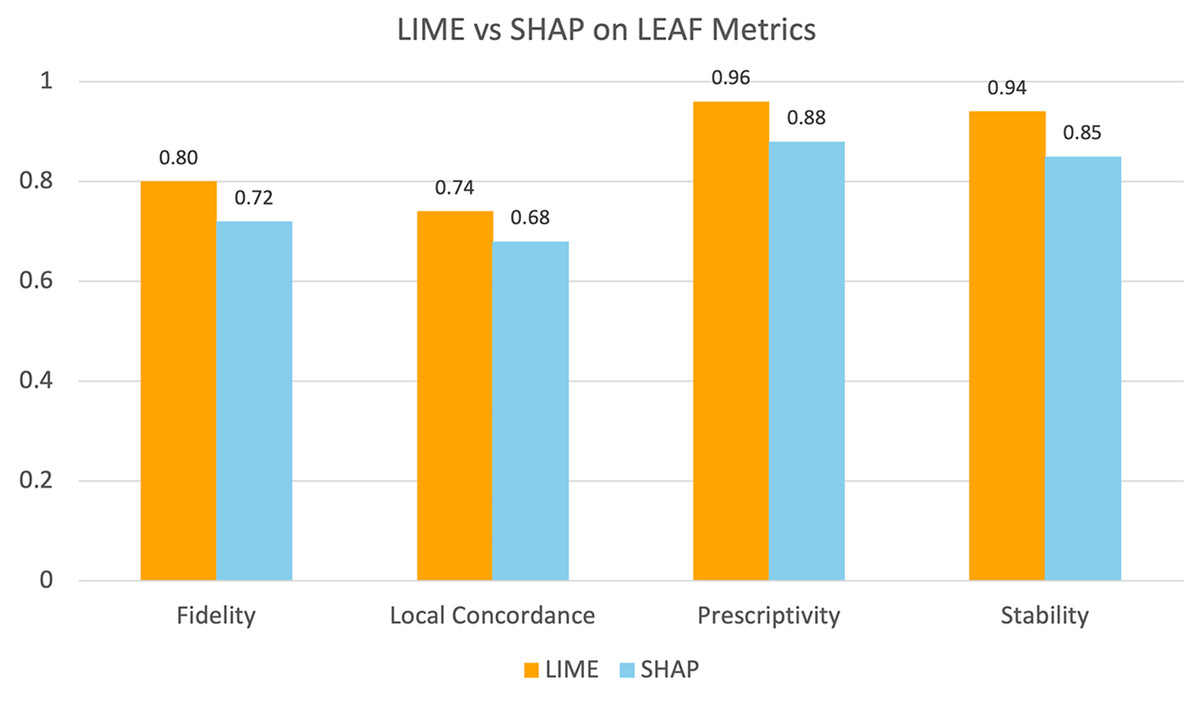
Figure 14: Comparison of LIME and SHAP performance based on LEAF evaluation metrics.
Discussion
This section addresses the three research questions that guide this study.
RQ1: What are the possible factors contributing to student dropout in Saudi universities?
Our findings provide several important insights into the factors influencing student dropout in Saudi universities. GPA consistently emerged as an influential factor, this aligns with previous literature reporting GPA as an important factor influencing student retention and success (Tayebi, Gomez & Delgado, 2021; Uliyan et al., 2021). Students in their early academic years were also found to be more at risk of dropping out, aligning with previous studies that emphasize the vulnerability of students during the initial stages of their academic journeys (Delen, Davazdahemami & Dezfouli, 2023; Singh & Alhulail, 2022; Niyogisubizo et al., 2022). Moreover, the influence of employment status identified in this study agrees with the observations of both (Sandoval-Palis et al., 2020) and (Kim et al., 2023), suggesting that balancing work and study responsibilities increases dropout risk. However, the inclusion of sociocultural variables, such as family/support and major pre-knowledge, extends prior findings by demonstrating that non-academic factors are equally important predictors of persistence in the Saudi universities. On the other hand, non-dropout cases were influenced by higher GPAs, unemployment, advanced academic year, and strong support from family/friends.
RQ2: How well do machine learning models perform when the proposed factors are considered, and which model achieves the highest accuracy?
In terms of model performance, KNN consistently achieved the highest accuracy and F1-score, reaching 97.6% with the 22-feature subset selected through RFE. The corresponding 95% confidence interval [96.3–98.4%] confirms the stability and reliability of this result. These findings align with previous research indicating that instance-based learning algorithms, such as KNN, perform effectively in educational prediction task (Mnyawami, Maziku & Mushi, 2022; Revathy, Kamalakkannan & Kavitha, 2022). The strong performance of KNN with RFE also highlights that the proposed feature subset captures meaningful dropout patterns, reinforcing the importance of incorporating both academic and non-academic dimensions in predictive modeling.
RQ3: How well do XAI techniques perform in providing the most contributing factors based on the obtained results?
Moreover, SHAP and LIME enhanced the understanding of model predictions. The LEAF evaluation showed that LIME outperformed SHAP across all metrics, including fidelity, local concordance, prescriptivity, and stability. LIME also demonstrated faster computation, with an average time of 0.62 s per record, compared to 1.86 s for SHAP when executed in the Google Colab environment (AMD EPYC 7B12 CPU, 12 GB RAM). This aligns with the findings of Salih et al. (2024), who similarly reported that LIME requires lower computational time than SHAP in explainability analyses. These results indicate that LIME outperforms SHAP in both explanation quality and computational efficiency.
Finally, the findings highlight that dropout is influenced by an interaction of academic, personal, and sociocultural factors. The integration of machine learning with XAI provides a powerful framework for understanding and addressing this issue. Universities can use these insights to offer targeted support for at-risk students based on key dropout factors, implement early warning systems, and make decisions that consider both academic and sociocultural student needs.
Practical implications
The findings of this study have several important practical implications for higher education institutions, policymakers, and educators in Saudi Arabia and similar academic contexts. Addressing student dropout requires a comprehensive and preventive approach that begins before enrolment and continues throughout the student’s academic journey. At the pre-enrolment stage, universities can introduce academic orientation programs to help students make informed choices about their academic majors. This ensures better alignment between personal interests, abilities, and program requirements. Such early guidance can reduce the likelihood of mismatched expectations, which often contribute to later dropout. Once students are enrolled, the predictive framework proposed in this study can be integrated into university information systems to enable early identification of at-risk students. The models used here can support the creation of data-driven early warning systems. These systems allow advisors and faculty to provide timely interventions such as academic counseling, mentoring, or personalized support sessions that help students overcome academic challenges. Furthermore, universities should invest in professional development programs that strengthen lecturers’ teaching skills. Ensuring that instruction remains engaging, inclusive, and responsive to diverse learning needs. Equally important is providing access to psychological and social support resources, such as counseling centers, to help students cope with academic stress. Such efforts can create a more supportive academic environment that promotes student persistence and success.
Conclusion
This study used a machine learning-based framework to predict student dropout in Saudi universities. The study combined academic, personal, and sociocultural factors to ensure a comprehensive understanding of student dropout. Among all the models tested, KNN-based RFE achieved the highest accuracy and F1-score of 97.6% with a corresponding 95% confidence interval of [96.3–98.4%]. SHAP and LIME were applied to explain the KNN model’s predictions. The results revealed that GPA, academic year, employment status, family/friends support, and major pre-knowledge were the most important factors in predicting dropout. Furthermore, the LEAF framework was used to evaluate the XAI model quality. LIME’s explanations performed better in all the LEAF metrics. These findings highlight that dropout is a complex issue influenced by various factors and cannot be explained by academic factors alone.
However, this research has three main limitations. First, although the dataset was diverse and covered 30 public and several private universities across Saudi Arabia, a larger dataset could provide broader coverage. The current dataset size was sufficient for traditional machine learning algorithms and the MLP model. However, more complex deep learning or transformer-based architectures typically require larger datasets to be effectively trained. Second, the data were collected through online questionnaires distributed via social media and university channels, which may introduce potential bias due to the non-probability convenience sampling approach. Third, the findings are specific to the context of Saudi universities, and their generalizability to other regions may be limited due to differences in educational systems and sociocultural factors. However, the analytical framework developed in this study can be adapted for use in other higher education systems, where region-specific factors may be examined to identify predictors that reflect local academic and sociocultural conditions.
Future work
Future research directions for this research include expanding the dataset by collecting a larger sample from different universities. This would enable the application of more complex deep learning and transformer-based architectures to capture more nonlinear dropout patterns. The design could also be extended by incorporating repeated k-fold cross-validation and statistical testing (e.g., Friedman or Wilcoxon) to further enhance performance comparisons across multiple runs. In addition, researchers in other regions with similar academic structures, sociocultural characteristics, or dropout risk factors are encouraged to replicate this study using the same set of factors. Such cross-context validation would help determine whether these factors remain strong factors of student dropout in different educational contexts. Finally, collaborating with academic institutions can help translate these findings into practical interventions, such as early warning systems or targeted support programs. These efforts may enhance student retention and contribute to achieving educational goals.
Supplemental Information
Predicting Student Dropout Questionnaire.
At the beginning of the questionnaire, participants were informed that by proceeding with the questionnaire, they agreed to take part in the study, and that their anonymized responses would be used exclusively for research purposes.