
A comprehensive self-attention melanoma analysis using reliable transformers and explainable AI
- Published
- Accepted
- Received
- Academic Editor
- Shibiao Wan
- Subject Areas
- Artificial Intelligence, Neural Networks
- Keywords
- Melanoma detection, Vision transformers (ViTs), Explainable AI (XAI), Skin lesion, Classification, Self-attention mechanism, Deep learning in dermatology
- Copyright
- © 2026 Mehdar et al.
- Licence
- This is an open access article distributed under the terms of the Creative Commons Attribution License, which permits unrestricted use, distribution, reproduction and adaptation in any medium and for any purpose provided that it is properly attributed. For attribution, the original author(s), title, publication source (PeerJ Computer Science) and either DOI or URL of the article must be cited.
- Cite this article
- 2026. A comprehensive self-attention melanoma analysis using reliable transformers and explainable AI. PeerJ Computer Science 12:e3479 https://doi.org/10.7717/peerj-cs.3479
Abstract
Early detection and accurate identification of melanoma, the most lethal form of skin cancer, are critical for improving patient survival rates. However, conventional diagnostic tools often fail to detect early-stage melanoma due to limited sensitivity. This research introduces an advanced Vision Transformer (ViT)-based model equipped with explainability features, specifically designed to address the complex challenge of early-stage melanoma detection. Self-attention-based Melanoma Analysis using Reliable Transformers with Explainable Artificial Intelligence (SMART-XAI) combines ViT with self-attention methods and explainable AI techniques like Attention Rollout and Self-Attention Attribution to create a melanoma diagnostic system. The ViT architecture leverages multi-scale feature extraction and self-attention mechanisms to capture both local and global patterns within skin lesion images. By segmenting images into patches, the model effectively identifies critical melanoma features across various scales, enhancing classification accuracy and interpretability. To ensure clinical transparency, the model incorporates explainable artificial intelligence (AI) techniques, namely Attention Rollout and Self-Attention Attribution, which enable the visualization of image regions that influence the modelís decisions. This interpretability allows clinicians to understand the diagnostic rationale behind AI, thereby fostering greater trust and usability in clinical settings. Experimental validation demonstrated strong performance, achieving 96.0 ± 0.87% accuracy, 95.2 ± 0.75% sensitivity, and 94.1 ± 1.05% specificity across 5-fold cross-validation. These results confirm the system’s reliability as an early detection tool for melanoma, while providing interpretable insights for informed clinical decision-making. Overall, the integration of deep learning with explainable AI represents a significant advancement in dermatological diagnostics, particularly for the management of early-stage melanoma.
Introduction
Melanoma is an aggressive, life-threatening form of skin cancer that poses an increasingly serious health problem worldwide, and early detection is vital for improved survival outcomes. Conventional diagnostic methods, which rely on visual inspection and dermoscopic expertise, are often hindered by interpretation bias, potentially leading to delayed or missed diagnoses. Melanoma remains one of the deadliest forms of skin cancer. Still, with the rapid advancement of technology, we can now use artificial intelligence (AI) to revolutionize detection, improving accuracy, speed, and consistency. The binary classification task in melanoma diagnosis is addressed using an innovative AI-based framework proposed by Di Biasi (2023), demonstrating the effectiveness of machine learning models in accurately classifying benign and malignant lesions. The advances underscore how AI can assist dermatologists, enhance diagnostic accuracy, and improve patient outcomes by enabling earlier treatment. Sauter et al. (2023) stated that most deep learning-based computational dermatopathology studies have demonstrated the capability of deep learning (DL) methods in providing accurate and efficient empirical processing of high-dimensional histopathological data. Cheong et al. (2021) introduced automated melanoma detection systems that employ entropy features to provide objective and reliable diagnostic support through a computerized entropy index applied to dermatoscopic images. In addition, Nikitin & Danilov (2023) integrated fractal dimensions into ViT to enable more (melanoma-specific) texture and pattern recognition, thereby increasing interpretability and, consequently, diagnostic accuracy.
Combining whole-slide imaging with machine learning has advanced melanoma diagnosis by enabling detailed, multi-modal assessments. Mosquera-Zamudio et al. (2022) DL has been utilized on whole-slide images for the diagnosis of melanocytic tumors, enabling cellular-level processing that facilitates more accurate tumor identification. Similarly, in Raju & Thilagavathy (2023) discussed the application of classifier extreme learning machines (ELM) in the detection of melanoma, which is a clear manifestation of the fact that different machine learning algorithms can be adopted with the objective of enhancing the efficiency of the diagnostic process. Some hybrid models gained interest, such as the work of Alphonse et al. (2023), where a layer-wise greedy learned stacked restricted Boltzmann magic combined with Sobel directional patterns. Highlighting a gap in the inclusivity of available diagnostic tools, Alphonse et al. (2023) is unique in enhancing sensitivity in diverse skin tones. Shah et al. (2024) state that the impact of this was analyzed, which emphasized that AI-based solutions that work without human-to-human face-to-face interactions can help sustain cancer care. To reduce data limitations, some AI techniques, for example, Generative Adversarial Networks (GANs) have been optimistic for dataset augmentation to gain better performance of models. Wang et al. (2024) have ensured high-quality diagnostic outcomes by using GANs with Vision Transformer (ViT) to improve the quality and diversity of melanoma image data, thereby enabling better classification with minimal real-world datasets, which are vital for reliable diagnostic performance in resource-constrained settings. Arouch & Elboim-Gabyzon (2024) reported in their survey that physiotherapists can detect suspicious skin lesions during patient examinations, enabling them to make referrals earlier and, in turn, receive life-saving treatment much sooner. Priyan et al. An advanced fuzzy ensemble with hybrid optimization was presented by Priyan et al. (2024) to improve the robustness and reliability of the diagnostic. Popescu et al. (2022) present an examination of Neural Network Architecture Flexibility. These models demonstrate optimal performance in clinical settings by delivering precise diagnostic results quickly through pattern recognition techniques that enhance melanoma detection. The use of AI in this way is helping to move melanoma diagnostics toward precision medicine, as we anticipated would be the case with such a convergence of technology in the future. These ongoing developments can help achieve this goal. Kalidindi (Popescu et al., 2022; Ali et al., 2018) described the disruptive contributions of AI in dermatology, with a significant focus on improving melanoma diagnosis. Even advanced imaging techniques, such as photoacoustic imaging, are making inroads in this domain. Fakhoury et al. (2024) summarized the use of photoacoustic imaging for diagnosing cutaneous melanoma, noting that photoacoustic imaging can provide high-resolution structural information complementary to AI-based diagnostic methods. Together, these innovations represent the future of skin cancer diagnostics: an accurate, interpretable, and actionable AI-enabled tool.
The proposed study offers a new horizon for early detection of melanoma skin disease through state-of-the-art multi-scale feature extraction and explainable AI (XAI) techniques. The model enhances diagnostic performance and yields XAI results that are sufficiently interpretable to be clinically valuable, making it an effective tool for dermatologists. Modern AI-based melanoma detection systems, despite technological progress, still lack clinical interpretability and face challenges in generalizing across different skin tones, as well as susceptibility to imbalanced datasets. SMART-XAI research combines ViT framework with XAI techniques like Attention Rollout and Self-Attention Attribution to provide high diagnostic accuracy along with interpretability. The framework generates precise diagnostic outcomes and explains its decision-making, which earns dermatologists’ trust. The combined solution addresses performance limitations and transparency issues, providing clinicians with an effective diagnostic tool that facilitates early melanoma detection and offers clear interpretation. To our knowledge, only a few recent attempts have been made to utilize Vision Transformers with explainable AI in dermatology. However, existing works are either limited to single-scale representations or to post-hoc explanation methods (e.g., Grad-CAM). Our framework is unique in that it fuses multi-scale ViT architecture with Attention Rollout and Self-Attention Attribution within a single diagnostic system, yielding not only robust classification performance but also clinically interpretable explanations (Dagnaw, El Mouhtadi & Mustapha, 2024; Ali, Shahbaz & Damaševičius, 2025). The SMART-XAI framework enhances ViT-based dermatology models by balancing accuracy and interpretability. SMART-XAI stands out from traditional models because it embeds Attention Rollout and Self-Attention Attribution directly into its architecture, rather than relying on post-hoc methods such as Grad-CAM. SMART-XAI generates clinically verified heatmaps, enabling a deeper understanding of decision-making processes that ViT-based classifiers previously lacked.
Contributions
We introduce ViT for melanoma detection, which utilizes its self-attention mechanism to accurately identify complex multi-scale skin lesion features and deliver reliable diagnostic outcomes.
The proposed model utilizes explainable AI tools such as Attention Rollout and Self-Attention Attribution, which enable visual interpretability by marking crucial image regions that drive model predictions, thus improving transparency and building clinical trust.
The model achieves leading diagnostic performance for melanoma classification, achieving accuracy, sensitivity, and Specificity across 5-fold cross-validation, which demonstrates its robust capabilities in practical medical image analysis.
The framework demonstrates strong generalization capabilities for different lesion classifications while maintaining precise identification between melanoma and multiple benign skin lesions, which validates its practical utility in automated skin diagnostics.
Our research demonstrates how trust and transparency in AI healthcare systems allow medical professionals to comprehend AI decisions and build confidence in integrating AI tools into clinical operations.
The remainder of this article is structured as follows: ‘Introduction’ introduces the driving reasons for employing Vision ViT and Explainable AI to detect early melanoma cases. Related work on melanoma image analysis is examined in ‘Related Work’. ‘Dataset and Preprocessing’ outlines the preprocessing steps and presents the SMART-XAI architecture. The proposed methodology is discussed in ‘Methodology’. The results of the experimental study are presented in ‘Results and Discussion’, and ‘Conclusion’ concludes the article, suggesting future research directions.
Related work
With recent advances in AI and Machine Learning (ML), there has been a significant increase in research studies describing their use for melanoma diagnosis, offering improved precision and the potential for early detection. Chatzilakou et al. (2024) have shown that biosensors are promising tools for melanoma diagnostics. We also explore novel biosensor technologies that enhance early melanoma detection by detecting biochemical changes associated with malignancy (Chatzilakou et al., 2024). In line with this, Ennaji et al. (2023), Guan et al. (2023) proposed an image decomposition approach at multiple scales via different transformations and a zoom-in strategy, which enhances performance by extracting image features at various scales through a detailed exploration of images. This approach improves accuracy when applying an ensemble-learning scheme to single-lead classifiers, thereby facilitating the diagnosis of malignant melanoma.
Naik (2021) provided an overview of early diagnosis and management of cutaneous malignant melanoma, highlighting the importance of prompt intervention and the pitfalls of conventional diagnostic approaches. As Mohammed et al. (2024) illustrate, AI models are changing quickly to address these challenges. For example, Mohammed et al. (2024) introduced a novel deep learning-based model for early melanoma detection, specifically aiming to provide an AI-driven, innovative model that accelerates and improves routine diagnostic workflows. Melanoma detection systems integrated with electronic health records (EHRs) have also been discussed. The work in Yasin et al. (2024) established an automated melanoma detection system integrated with an EHR that promotes the sharing of diagnostic information across health systems. Quishpe-Usca et al. (2024a) performed another significant research study. Quishpe-Usca et al. (2024a) investigated the impact of hair removal and image filtering on melanoma detection using the DL model AlexNet, assessing the diagnostic accuracy improvements resulting from these preprocessing steps (Yasin et al., 2023). Jones, Matin & Walter (2024) AI-based technologies for assisting with melanoma diagnosis were reviewed, emphasizing AI’s ability to help General Practitioner (GP) identify suspicious lesions and refer patients earlier in care. Tiwari et al. (2022) a survey of computer-assisted melanoma detection by Yasin et al. (2022) covers available algorithms and methods for automated diagnosis, and their advantages and disadvantages. A consensus report by Janda et al. (2020) highlighted the importance of public health initiatives for melanoma screening.
In Janda et al. (2020), which covers screening guidelines and recommended practices for early melanoma detection, the authors advocate for widespread public awareness of the importance of performing skin examinations in conjunction with structured screening programs. According to Chang et al. (2024) the development of increasingly advanced large AI architectures continues to advance. Wang et al. (2024) demonstrated the application of transformer-based models to extract features from complex patterns within medical images. Chang et al. (2024) introduced the RaT (Raman Transformer) model, designed to extract diagnostic features directly from melanoma visualizations, thereby enhancing detection accuracy. The other is a rising AI approach, such as Deep Forest (e.g., Syed et al., 2019), a fully aligned registration-based plan for melanoma detection using deep forest strategies, making dermatological prognosis precise (Yasin et al., 2021). Aldemir Atmaca (2024) examined the role of health professionals outside dermatology in melanoma detection. Irfan et al. (2021) described commentaries on the unique role of dentists in identifying oral melanoma, including discussions of interdisciplinary approaches to early detection. Rashad, Mansour & Taha (2024) addressed dataset imbalance by utilizing deep neural networks to enhance performance across diverse skin types. Collenne et al. (2024) improved the robustness of melanoma classification by combining lesion asymmetry analysis with a Convolutional neural network (CNN) ensemble. Furthermore, New melanoma detection methods utilize multiple technologies to enhance diagnostic precision and provide easy access to customized healthcare solutions. Online melanoma diagnostic tools on web-based platforms use image databases to provide accessibility but they do not match the accuracy of specialized systems. Genetic risk-based screening offers targeted early detection for individuals with genetic susceptibility but is only applicable to select population groups. Transfer learning methods achieve superior accuracy across various skin types by leveraging pre-existing models. The effectiveness of digital dermoscopy as a monitoring tool for high-risk patients extends to the detection of amelanotic melanoma, but its use remains primarily confined to these patient categories. While cloud-based deep learning solutions offer scalable, efficient capabilities for melanoma detection, they still face significant data security challenges (Draz et al., 2021; Kim, Gaibor & Haehn, 2024; Pandeya et al., 2024; Yasin et al., 2024; Jurakić Tončić et al., 2024; Ali et al., 2020; Kaushik et al., 2024; Yashoda, 2024; Draz et al., 2021; Jia, Chen & Chi, 2024; Song et al., 2024). Sandru et al. (2014) stated that medical image segmentation has progressed with the introduction of transformer-based models such as CenterFormer (Wu et al., 2024) and edge-body fusion (Wu et al., 2025). Recent research findings (Feng et al., 2024; Zhao et al., 2025; Wang et al., 2025; Sajid et al., 2024) demonstrate that CycleGANs, when combined with attention-based interpretability methods, identify key dermatological regions. SMART-XAI leverages attention transparency alongside lesion-focused interpretability to enhance melanoma detection, building on existing models. Recent research initiatives have conducted studies on transformer-based systems for skin image analysis. Syed et al. (2019) introduced a deep forest-based registration approach for melanoma detection. In 2024, Collenne et al. (2024) applied CNN ensemble models featuring asymmetry analysis in their research. Concurrently, as explored, preprocessing effects, including hair removal. They examined the impact of preprocessing techniques such as hair removal on image quality. Table 1 presents a comparative overview of AI-based techniques.
| Ref. | Model/Approach | Techniques | Dataset type | Performance | Key contributions | Limitations |
|---|---|---|---|---|---|---|
| Yasin et al. (2023) | AlexNet CNN | Hair removal and filtering impact on melanoma detection | Clinical melanoma image dataset | High comparative performance | Analyzed hair removal’s effect on melanoma detection accuracy | Limited to specific preprocessing techniques. |
| Jones, Matin & Walter (2024) | AI for melanoma diagnosis in primary care | AI in primary care settings for melanoma | Primary care melanoma records | Diagnostic support improvement | Demonstrates AI’s role in primary care for melanoma detection | Limited to the primary care setting. |
| Yasin et al. (2022) | Survey on automated melanoma detection | Overview of computer-aided melanoma detection | Various melanoma sources | High relevance | Comprehensive study on computerized techniques for melanoma detection | Review-focused, lacks new techniques. |
| Janda et al. (2020) | Consensus report on early melanoma detection | Consensus report | Australian melanoma records | High consensus | Provides an Australian consensus on early melanoma detection | Geographic limitation to Australia. |
| Chang et al. (2024) | Raman Transformer for melanoma detection | Raman-based Transformer | Melanoma spectroscopy data | High detection accuracy | Novel use of Raman spectroscopy with Transformer model for melanoma detection | Limited applicability to general datasets. |
| Yasin et al. (2021) | Deep forest technique | Fully optimized registration-based melanoma detection | Melanoma image dataset | Enhanced accuracy | Introduced registration-based optimization for improved melanoma detection | Complex registration process. |
| Irfan et al. (2021) | Role of dentists in early melanoma detection | Dental checkup integration | Dental records with melanoma cases | Early detection feasibility | Highlights dentists’ role in early detection of melanoma through routine checks | Limited generalizability beyond dental records. |
| Rashad, Mansour & Taha (2024) | Deep neural network for melanoma detection | Data balancing and neural network | Clinical melanoma image dataset | High detection accuracy | Efficient data balancing enhances the performance of deep neural networks in melanoma detection. | Limited to balanced datasets. |
| Collenne et al. (2024) | Asymmetry characterization for melanoma | Ensemble of CNNs for melanoma detection | Melanoma image dataset | High detection accuracy | Combined asymmetry analysis with CNN ensemble for accurate melanoma detection | High computational complexity. |
| Draz et al. (2021) | Early detection and management case report | Case report | Clinical melanoma case study | Early detection improvement | Case study on effective early detection and management of melanoma | Limited to case study format. |
| Kim, Gaibor & Haehn (2024) | Web-based melanoma detection | Web-based platform | Online melanoma image database | Accessible detection tool | Web-based melanoma detection enhances accessibility | Limited accuracy compared to specialized tools. |
| Pandeya et al. (2024) | Genetic risk modification in melanoma detection | Genetic risk and screening analysis | Genetic and melanoma screening records | Genetic impact analysis | Explores genetic risk modification in screening for improved melanoma detection | Limited to genetic-risk populations. |
| Yasin et al. (2024) | Transfer learning for melanoma detection | Transfer learning approach | Melanoma skin image dataset | Improved accuracy | Transfer learning enhances melanoma detection for varied skin types | Dependency on pre-trained models. |
| Jurakić Tončić et al. (2024) | Digital dermoscopy for melanoma in high-risk patients | Digital dermoscopy and follow-up | High-risk melanoma patient records | Effective for amelanotic cases | Focuses on digital dermoscopy’s role in detecting amelanotic melanoma in high-risk patients | Limited to high-risk cases only. |
| Ali et al. (2020) | Cloud-based deep learning for melanoma detection | Cloud-based deep learning model | Cloud-stored melanoma skin images | Accessible and efficient | Provides cloud-based accessibility for melanoma detection | Data security concerns cloud storage. |
| Kaushik et al. (2024) | CNN for melanoma skin disease detection | Convolutional Neural Network | Melanoma skin image dataset | High detection accuracy | CNN model shows efficacy in melanoma skin disease detection | Limited dataset variability. |
Recent work has explored integrating Vision Transformers and explainable AI techniques in dermatology. For example, Dagnaw, El Mouhtadi & Mustapha (2024) employed ViT and Swin Transformer models with Grad-CAM and Score-CAM to classify skin cancers, achieving competitive accuracy while improving interpretability. Similarly, a 2025 study (Ali, Shahbaz & Damaševičius, 2025) introduced a hybrid ViT–CNN–Xception model for melanoma diagnosis, demonstrating that transformer-based architectures can effectively capture complex lesion features while benefiting from explainable visualization tools. While these studies highlight the growing role of ViTs in dermatology, none combine multi-scale feature extraction with integrated Attention Rollout and Self-Attention Attribution, a distinctive novelty of our proposed framework.
Dataset and preprocessing
This research utilizes the 10,000 Image Melanoma Skin Cancer Dataset from Kaggle to develop and evaluate models for melanoma detection. Researchers can rely on this meticulously compiled source, which includes 10,000 high-resolution dermatoscopic images for melanoma detection studies. The images were resized to 224 × 224 pixels, followed by pixel intensity normalization and augmentation through rotation (±30°), flipping, scaling, and brightness adjustment. We eliminated missing or incomplete data from our dataset before training to preserve consistent quality standards. Kaggle Melanoma Skin Cancer dataset consisted of 10,000 dermatoscopic images, of which 5,168 were benign and 4,832 were malignant. The dataset was generally balanced, but the imbalance still could impact model fitting, especially with stratified cross-validation. To avoid this and ensure similar class distributions across folds, we used Cycle-Consistent Generative Adversarial Network (CycleGAN)-based augmentation to increase the number of malignant samples. This also helped us keep the data quality high while still further lowering the possibility of bias towards the majority class. Thus, our final training data had almost equal amount of malignant and benign samples in all folds. This dataset’s organized labeling and photo-realistic quality render it suitable for training deep neural systems to identify subtle characteristics specific to melanoma, thereby helping progress automated diagnostic instruments. In developing our novel ViT-based melanoma detection model, we leveraged the Melanoma Skin Cancer Dataset as a foundational dataset. By training our Vision Transformer model on this dataset, we leveraged its high-quality images to identify multi-scale attributes, thereby enhancing the model’s ability to differentiate between melanoma and benign lesions reliably. The dataset’s balanced nature minimized bias, facilitating robust model training and enabling us to employ interpretable artificial intelligence techniques, such as Attention Rollout and Self-Attention Attribution, to understand the model’s focus on clinically pertinent lesion traits. This extensively annotated dataset was indispensable in achieving a high-performing, transparent model tailored for early melanoma identification in clinical applications.
To ensure high-quality input for the SMART-XAI model, we applied several preprocessing techniques. Images with missing metadata or unreadable pixel data were excluded from the analysis. Standard score normalization (zero mean, unit variance) was applied to standardize pixel intensities, ensuring consistent brightness and contrast. While no explicit feature selection was performed, the ViT architecture dynamically attends to relevant visual regions through adaptive patch-based attention. To enhance model robustness and generalization, we employed data augmentation techniques including random rotation, horizontal and vertical flipping, zoom perturbation, and brightness scaling. Additionally, class imbalance was addressed using CycleGAN, which generated synthetic images for underrepresented classes without manual annotation.
Methodology
The researchers utilized a workstation equipped with an Intel Core i7-12700K processor, NVIDIA RTX 4090 GPUs featuring 24 GB of VRAM, 32 GB of DDR4 RAM, and a 1TB NVMe SSD for rapid data storage. The dedicated GPU-accelerated matrix computation is utilized for the Vision Transformer’s self-attention mechanism. The software stack included Ubuntu 22.04 LTS or Windows 11 with WSL2, Python 3.9, TensorFlow 2.11 with CUDA support, the Keras Functional API for defining the model architecture, Hugging Face Transformers, scikit-learn for evaluation metrics, and GPU optimization libraries such as CUDA 11.8 and cuDNN 8.6. Pre-processing and augmentation were handled using OpenCV, NumPy, SciPy, and TensorFlow Image Data Generator, while Matplotlib and Seaborn were used for visualization. The computational workflow involved four main steps: data preparation and expansion, where images were resized, normalized, and augmented; training models with a batch size of 16, Adam optimizer, binary cross entropy loss, and 100 epochs; explainability through self-attention attribution, attention rollout, and Grad-CAM heatmaps to interpret predictions; and performance evaluation using accuracy, recall, precision, and AUC-receiver operating characteristic (ROC) metrics, with outputs including ROC curves and heatmaps for decision interpretation.
The ViT was chosen over traditional models, such as CNNs and residual network (ResNet), because it excels at capturing long-range spatial dependencies through its self-attention mechanism. CNNs effectively extract local features but require deep hierarchical stacking to capture global context, which introduces vanishing gradient problems and reduces interpretability. ViT processes input images by segmenting them into patches and applying attention mechanisms across all patches simultaneously, enabling the model to dynamically focus on local lesion characteristics while preserving the global lesion context. All metrics (accuracy, sensitivity, specificity, F1-score, and AUC) are reported as mean standard deviation over 5-fold cross-validation, with 95% confidence intervals.
Our newly developed SMART-XAI architecture introduces several essential innovations.
-
1.
The Multi-Scale Attention Embedding approach allows for detailed feature extraction from skin lesion images that spans fine details to broader patterns.
-
2.
CycleGAN-Augmented Training resolves class imbalance issues while keeping high data quality standards.
-
3.
The Explainable AI Integration approach uses Attention Rollout and Self-Attention Attribution to reveal important lesion locations, which makes the model decision process both transparent and trustworthy.
The SMART-XAI platform exhibits superior performance metrics in terms of accuracy and sensitivity and has become a dependable clinical tool due to its explainability and robust design.
Proposed model
To address the pressing challenge of early melanoma detection, this work presents SMART-XAI approach based on Visio ViT and explainable AI to develop an accurate and interpretable diagnostic model. The underlying dataset for this work is the Melanoma Skin Cancer Dataset, comprising 10,000 Images, available on Kaggle. This dataset is a balanced, high-resolution collection of labeled images of malignant (melanoma) and benign conditions. These data provide a robust training environment for our model to learn important characteristics of melanoma without compromising generalizability across different cases. This work adopts a novel solution with a core model architecture based on ViT, which differs from traditional convolutional neural networks (CNNs) by leveraging the self-attention mechanism intrinsic to transformers to improve the model’s diagnostic performance and interpretability.
In the first step of our approach, data preprocessing was performed to prepare the images for the ViT model, ensuring a consistent feature density across the images. We applied a few preprocessing techniques. According to the ViT architecture, each image was resized to meet the input requirements, and the entire image was divided into smaller, fixed-size patches. The patch-based architecture enables the model to analyze the localized characteristics of each patch, such as color differences, edge abnormalities, and texture variations. At the same time, self-attention can expand these local features into a broader global context. Additionally, to make them more robust, we augmented the data with rotation, flipping, brightness variability, and slight variations in zoom perturbation. These augmentations were designed to mimic variations in real-world lesions, thereby increasing the variability of the training samples and enhancing the model’s ability to generalize. Additionally, image normalization was performed to standardize pixel intensity values across all images, thereby ensuring consistent feature extraction and enabling the model to focus on relevant visual information.
We choose ViT as our model architecture because it offers a novel approach to image classification that uses self-attention rather than convolution. While CNNs typically employ local filters, ViT breaks down every image into patches, applies attention across these patches, and thus enables the model to have both detailed local features and holistic global relationships. This property is especially useful in melanoma diagnosis, where the spatial distribution of features such as asymmetry and border irregularity is essential for accurate classification. Through transfer learning, we fine-tuned a ViT model pre-trained on ImageNet to focus on our binary classification task of distinguishing malignant from benign lesions. Transfer learning enabled us to preserve generalized upper-level visual features from extensive training data, while dedicating our training time to tailoring lower-level features for melanoma detection.
We conducted the training and evaluation phase using stratified k-fold cross-validation to ensure a robust and unbiased assessment of the model’s performance. This method was used to split the dataset into several folds, maintaining an equal ratio of melanoma and benign cases in each fold—stochastic Stratified Subsampling. Using stratified k-fold sampling with k = 5, we split the data into training and test sets. This method helped reduce the risk of overfitting by training and validating the model on separate data subsets, thereby improving its ability to generalize across lesion types. We used the Adam optimizer with binary cross-entropy loss, which adapts the learning rate of the weights, enabling steady convergence. We also employed early stopping, halting training once the validation loss plateaued, thereby minimizing the risk of overfitting and ensuring the model continued to perform well on unseen data. This training method had to be done pragmatically—it was essential to build a strong model with a reliable diagnosis. The model was trained for up to 100 epochs, with early stopping (patience = 10) applied to halt training once the validation loss plateaued.
The use of explainable AI techniques was crucial in generating clinical interpretability of the model’s forward predictions. ViT employs self-attention mechanisms, so we used Attention Rollout and Self-Attention Attribution to visualize attention weights across patches, demonstrating the model’s attention to different regions of each image. The techniques yield heatmaps on the input image, indicating the model’s most important areas in making its classification decision. These attention-based visualizations confirmed that the model focused on medically relevant attributes, such as irregular lesion borders, asymmetry, and color diversity, which are known to characterize melanoma. In the clinical environment, this level of transparency is crucial, as it helps clarify the logic behind the AI diagnosis and can affect a clinician’s trust and decision-making.
For explainable AI, interpretability ensured that the model focused on the most essential diagnostic characteristics and made it well-suited to existing dermatological knowledge (Arouch & Elboim-Gabyzon, 2024). Specifically, when the model predicted melanoma, attention maps were weighted around the borders of the lesions and the regions of color variation, the two most essential features in clinical diagnosis. Such interpretability gives clinicians the ability to compare the model’s focus with their own expertise, enabling the AI system to be used as a supportive rather than a “black box” predictor. This suitability for clinical interpretation increases the model’s reliability and closes the gap between AI-based findings and medical practice.
Several key metrics were used to evaluate the model’s performance, including accuracy, sensitivity, specificity, and F1-score. Since failing to detect melanoma is one of the worst outcomes, focusing on high sensitivity was imperative to minimize false negatives. SMART-XAI achieved accuracy, sensitivity, and specificity. These values were consistent across folds and had narrow confidence intervals, confirming robustness. This demonstrates that ViT-derived melanoma-specific features perform exceptionally well, rendering them a highly potent diagnostic tool in clinical settings. In particular, the high sensitivity metric highlights the model’s ability to identify melanoma cases, a crucial factor for early intervention.
This approach combines the leading feature-extraction capabilities of ViT with robust preprocessing, practical model training, and solid interpretability via explainable AI. This article proposes a novel 2-class melanoma detection model that achieves high performance and accuracy while providing a patient- and clinician-transparent self-attention mechanism exclusively to ViT, leveraging the Melanoma Skin Cancer Dataset, which comprises 10,000 images. Attention Rollout and Self-Attention Attribution transform the model into an interpretable and trustworthy system that provides vital decision-making insights while enhancing AI-driven diagnostic reliability. This research aims to support dermatologists in making prompt diagnostic decisions with reduced fatigue, leading to improved patient outcomes through early and precise detection of melanoma.
The ViT architecture applied in SMART-XAI incorporated 12 encoder layers and eight self-attention heads for each layer, along with a patch size and a 3,072-sized MLP (feed-forward). These settings were chosen based on two factors: We tuned settings through empirical testing with our dataset while consulting best practices from recent ViT studies including (Dosovitskiy, 2020; Touvron, Cord & Jégou, 2022). (1) Number of Transformer Layers (12): The selected depth achieved a compromise between performance output and training cost because deeper models produced less improvement on this dataset. (2) Patch Size ( Using 8 × 8 patch sizes resulted in higher computational overhead, while using 32 × 32 patches led to decreased granularity. For melanoma pattern extraction, the patch size achieved the best spatial resolution. (3) Number of Attention Heads (8): The model uses multiple attention heads to focus on different image regions at the same time. Validation experiments showed that eight attention heads achieved the optimal balance between diverse attention mechanisms and computational efficiency. (4) Feedforward Dimension (3,072): The selected value follows scaling rules from established ViT architectures to ensure substantial input feature transformation across network layers.
Validation accuracy and generalization across multiple folds achieved the best results with the configuration identified via grid search, using layer sizes (8, 10, 12), head counts (4, 6, 8), and patch sizes (16, 32).
We used CycleGAN to generate artificial dermoscopic images to equalize class representation in our training dataset. We opted for this augmentation method because it creates lesion variations without needing manual annotation. Although CycleGAN helps balance class distribution in datasets, it faces fundamental constraints when dealing with varying skin tones as defined by the Fitzpatrick I–VI scale. The GAN training dataset lacked sufficient examples of Fitzpatrick skin types IV–VI, leading to poor model performance in these darker skin groups. The failure to implement tone-aware conditioning during GAN training limited its capability to produce authentic representations of melanin-rich skin, which is essential for developing inclusive diagnostic models. Future developments will include tone-conditioned generative models or real-world diverse datasets to minimize demographic bias and enhance clinical accuracy.
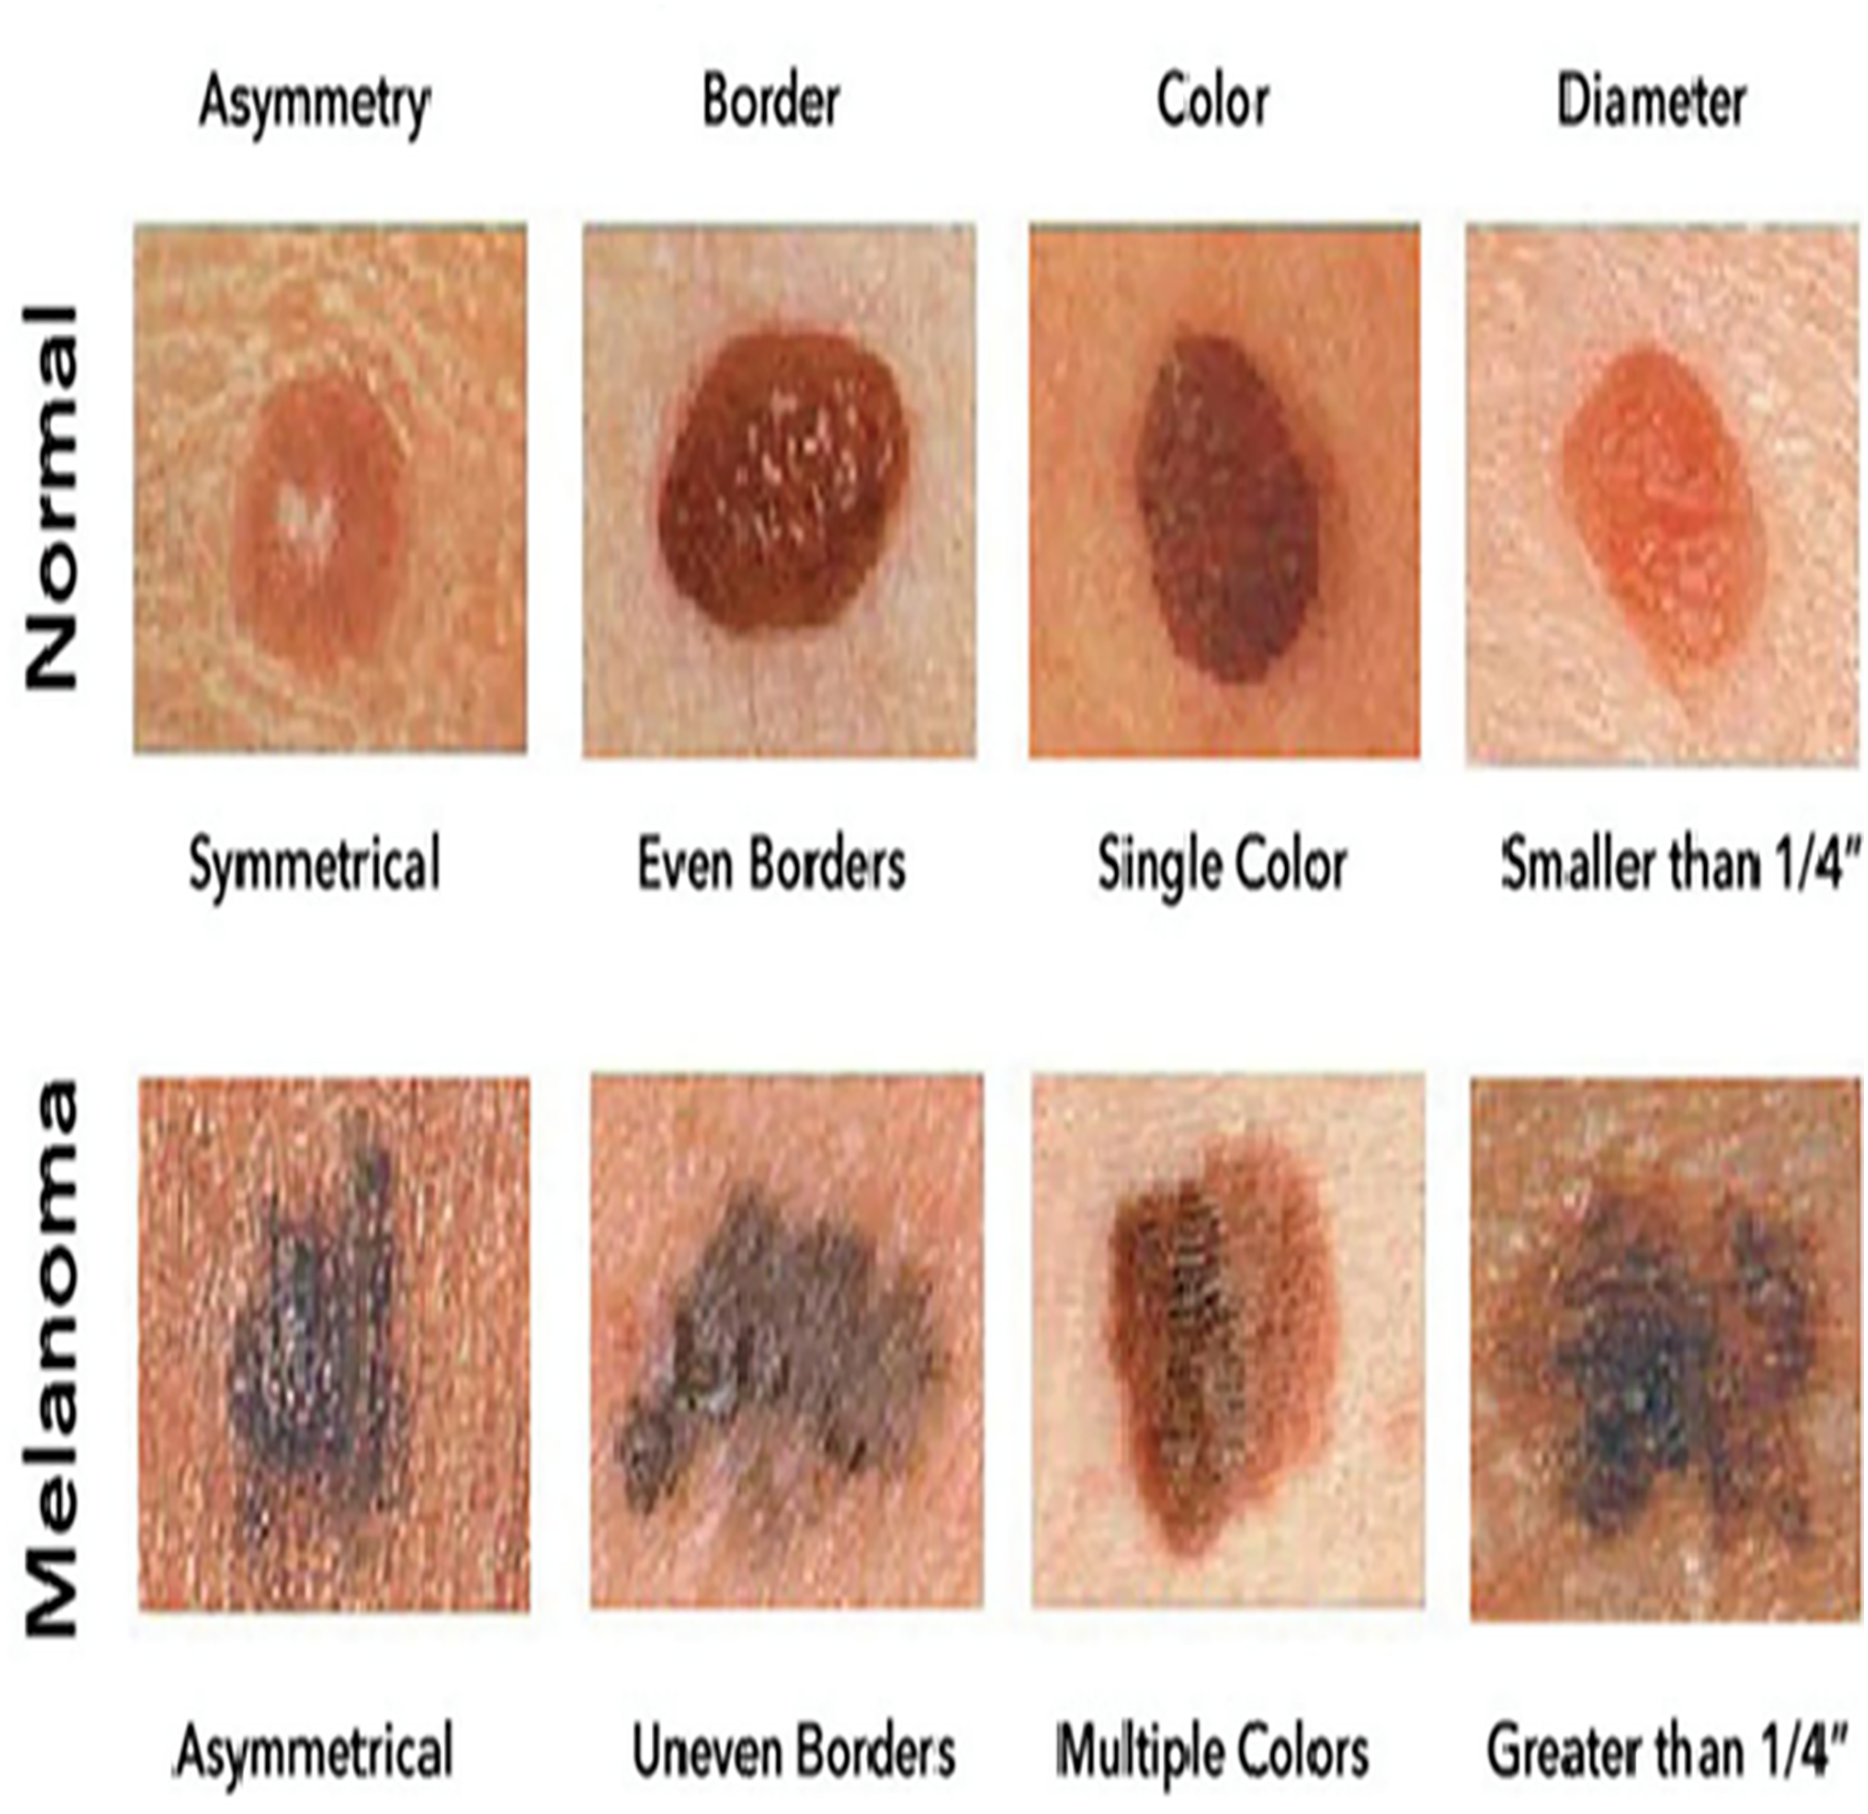
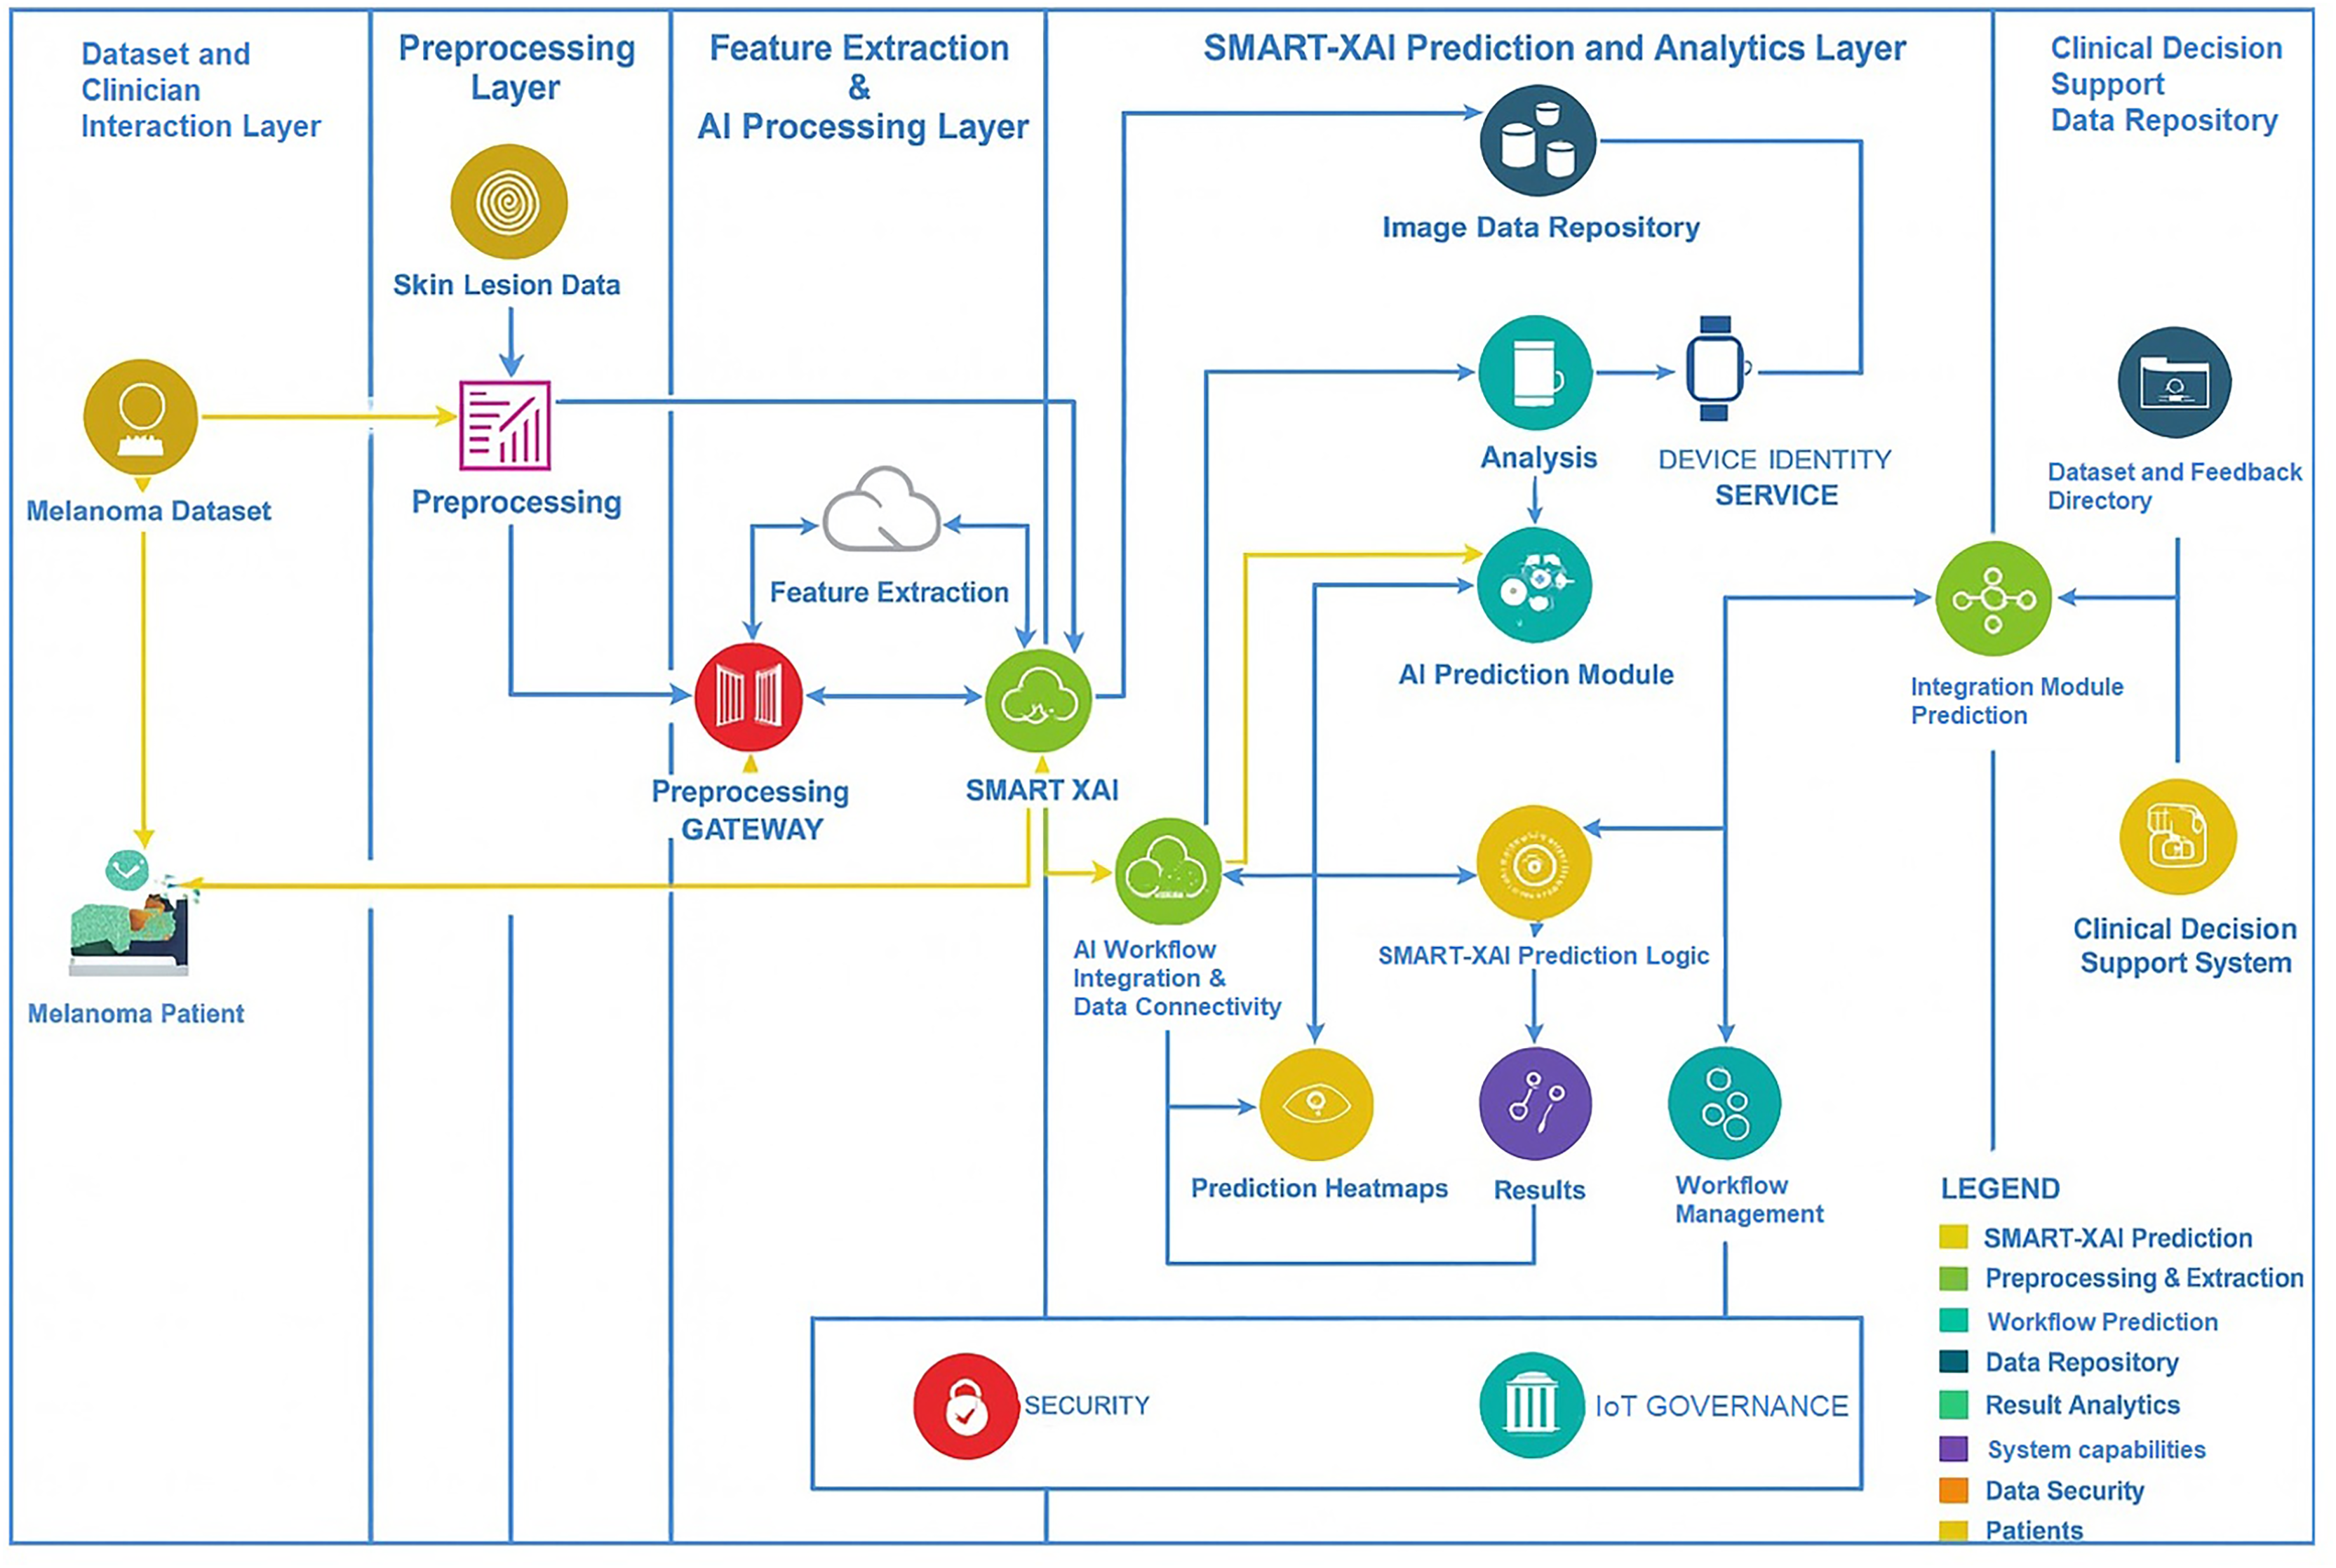
Figure 1 illustrates sample images of Normal and Melanoma Disease, and Fig. 2 presents the SMART-XAI framework for skin cancer detection, beginning with the Dataset and Clinician Interaction Layer, where skin lesion images, such as those from melanoma datasets, are captured and utilized in melanoma diagnosis. In Fig. 1, the top row shows typical moles with symmetrical shapes, smooth borders, and consistent coloring, each measuring less than 1/4 inch in diameter. The lower section displays melanoma lesions with asymmetrical patterns and irregular margins, multiple color variations, and sizes greater than 1/4 inch. The visual characteristics outlined are critical components for training models because they represent essential clinical signs of cancer.
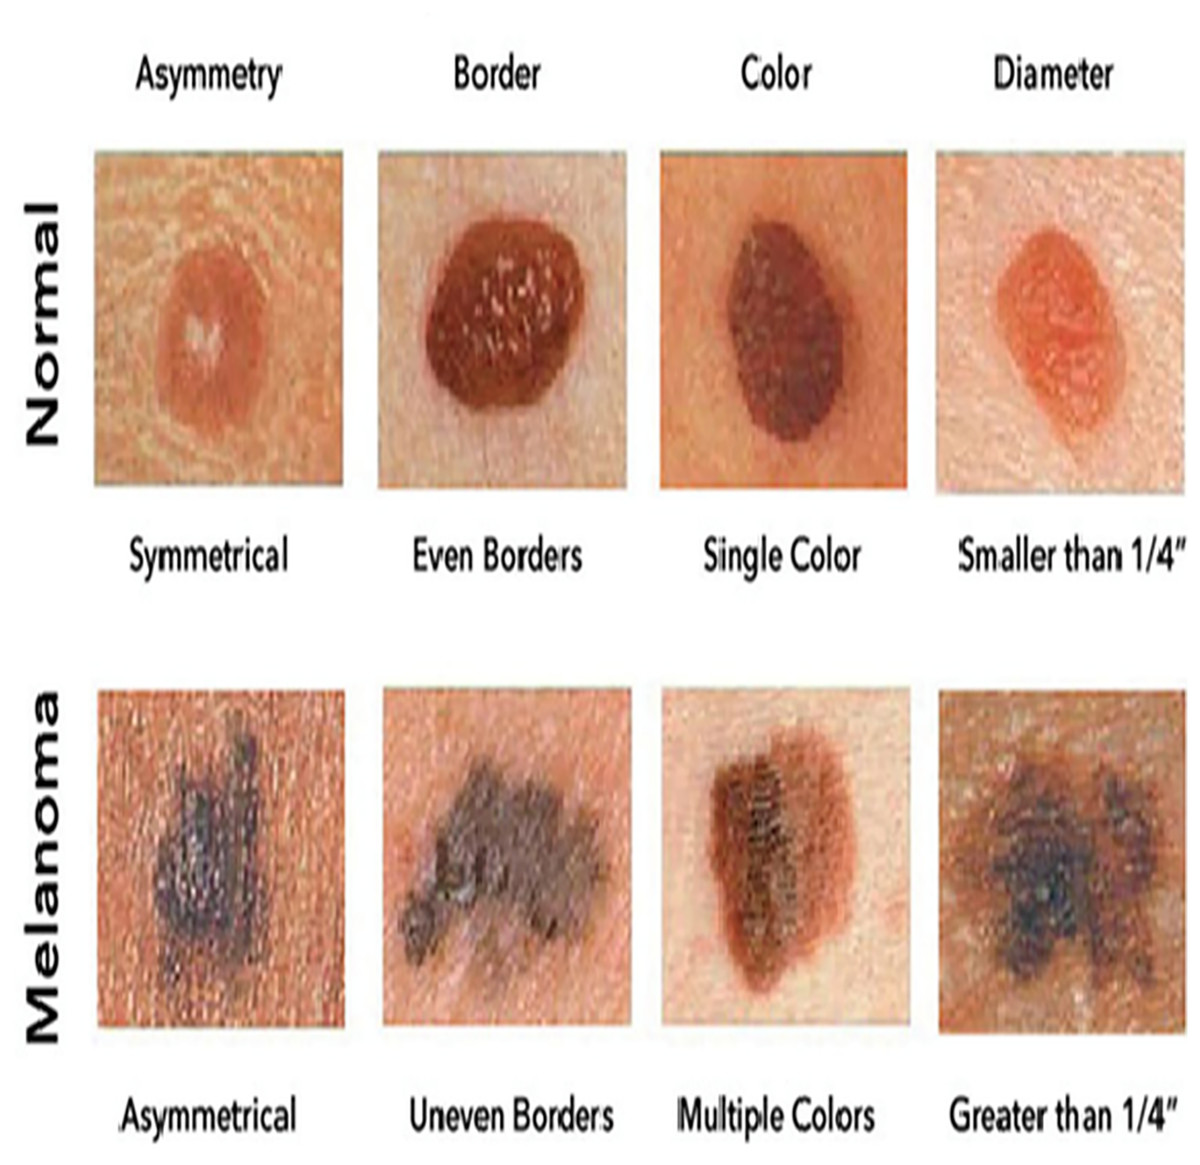
Figure 1: Sample images of normal and melanoma disease (Yashoda, 2024).
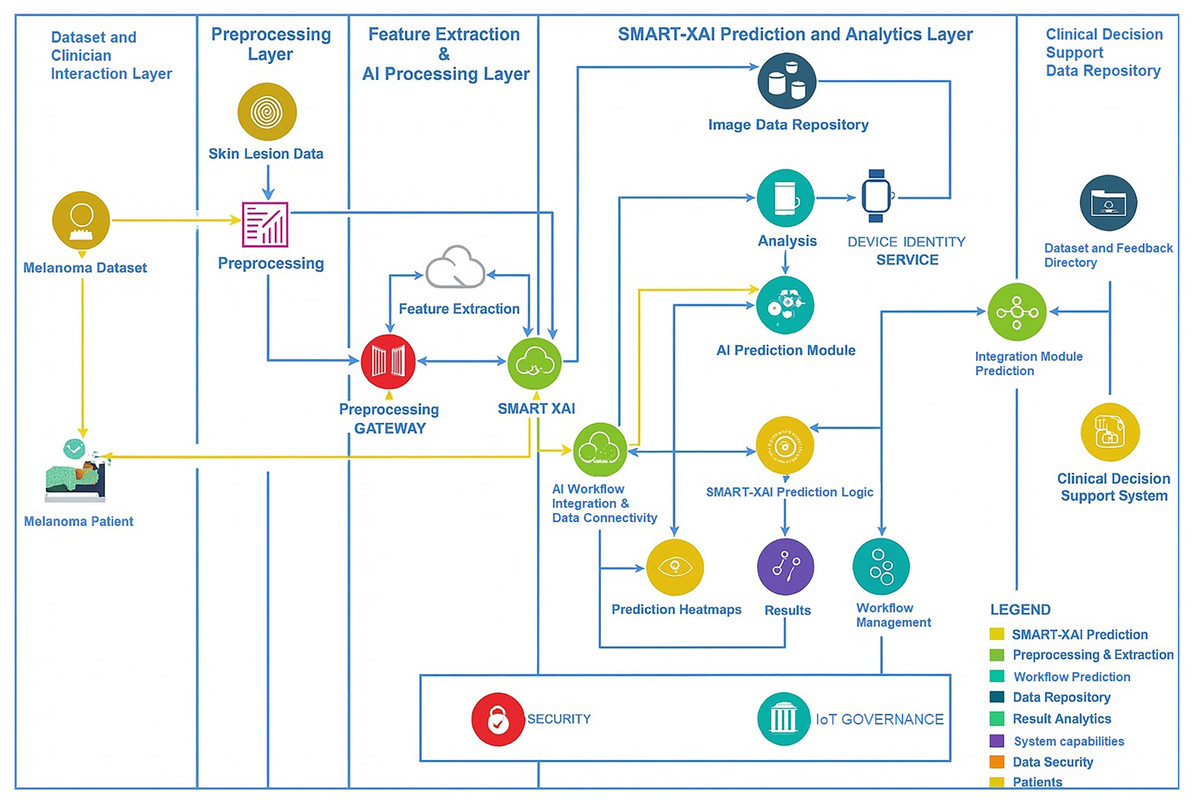
Figure 2: Research methodology diagram of SMART-XAI.
These unprocessed images are passed to the Preprocessing Layer, where a preprocessing gateway applies standardization via cleaning, resizing, normalization, and an augmentation process to the data: Feature Extraction & AI Processing Layer. Features such as texture, color, and shape are extracted from images, which the SMART-XAI model then analyzes to merge modern AI and explainable AI (XAI) tags. This layer seamlessly integrates with the SMART-XAI Prediction and Analytics Layer, which comprises an AI Prediction Module that outputs lesion classifications (i.e., whether the indicated lesions are benign or malignant), along with confidence scores and explainable heatmap visualizations of the predicted classifications. The Lesion Data Repository offers a secure 24/7 location for storing all predictions, workflows, and processed data. Lastly, the results from all these layers are combined and made available in the Clinical Decision Support and Data Repository Layer to clinicians as annotated datasets, predictions, and insights to aid diagnostic decision-making. Data security and governance across the framework help ensure the workflow is compliant and trustworthy. A few major terms are explicitly defined here:
Self-Attention: This computational method evaluates the relationships between image patches throughout the image, enabling models to learn both detailed local features and broad global patterns.
Attention Rollout: This interpretability method combines attention weights from multiple transformer layers to identify key regions of the input image.
Self-Attention Attribution: The Self-Attention Attribution technique calculates the individual contribution of each pixel to the model’s final decision by assigning contribution scores.
CycleGAN: CycleGAN is a Generative Adversarial Network that produces synthetic images to address dataset imbalance by learning transformations between pairs of image domains. Furthermore, the hyperparameter justification is that the ViT was chosen over traditional CNNs because its self-attention mechanism enables it to capture both local and global image features, which are essential for detecting melanoma-specific characteristics, such as border irregularities and color variations. ViT analyzes images holistically, providing spatial insights that make it better suited to dermatological imaging than CNNs, which use localized filters. The selection of 12 transformer layers and eight multi-head attention heads followed standard ViT configurations that have demonstrated success in medical image classification tasks. We selected a feedforward network with 3,072 units to enable deep visual pattern representation. Using a patch size of enabled the model to focus on localized areas while maintaining spatial consistency.
The AdamW optimizer was selected for its adaptive learning rate and regularization, which help protect against overfitting. An empirical grid search determined that a learning rate of 0.0001 yielded consistent convergence. Using a batch size of 16 allows for a balanced compromise between GPU memory usage and learning stability.
The selection of Attention Rollout and Self-Attention Attribution as explainable AI components was intended to deliver pixel-level visual interpretations of AI decisions that align with clinical understanding while enhancing trust in medical applications.
Algorithm 1 describes the pipeline for image normalization, augmentation, and synthetic sample generation using CycleGAN. This step ensures class balance and enhances model robustness. The first step is to normalize each image so that the entire dataset has consistent brightness and contrast, ensuring consistent visual characteristics. Standardization is essential so that the deep learning model can be exposed to images without introducing variance caused by different lighting or color intensity. The function also assesses class imbalance based on the number of samples per class (malignant and benign melanoma images). Once an imbalance is discovered, Cycle GAN generates synthetic photos based on classes where such objects are scarce, even without human labeling. After normalization and synthetic data generation, Algorithm 1 applies various random transformations to the dataset, including rotation, flipping, and scaling. This gives the model added strength during training to recognize images from different angles and in every possible direction, thereby increasing variance.
| 1. Objective: To preprocess melanoma images for uniformity and augment the dataset to enhance the model’s generalization. |
| 2. Input: : Set of melanoma images with labels |
| 3. : Target sample size per class. |
| 4. : Set of transformations (Rotation, Flip, Scaling). |
| 5. Output: |
| 6. : Balanced, preprocessed dataset. |
| 7. Steps: |
| 8. Initialization: Set target sample size for each class And define transformations |
| 9. For each image ∈ , apply normalization to standardize brightness and contrast: where and are the mean and standard deviation of pixel intensities in . |
| 10. Class Imbalance Check: Calculate sample count for each class : |
| 11. If , proceed to generate synthetic images using CycleGAN. |
| 12. CycleGAN Augmentation (For Class Imbalance Correction): Generate synthetic samples for each underrepresented class . |
| 13. Random Transformation Application: For each image , apply a sequence of transformations: |
| 14. Rotation : |
| 15. Flipping : |
| 16. Scaling : |
| 17. Augmentation Combinations: Generate multiple augmented versions by combining transformations: |
| 18. Synthetic Data Inclusion: Add synthetic images To the dataset for each underrepresented class. |
| 19. Augmented Dataset Construction: Define final dataset As: |
| 20. Return : Return a balanced, augmented dataset. |
| 21. |
This allows for multiple augmented versions of each image, effectively expanding the dataset with diverse samples. Together, those steps build a mode-agnostic, balanced, and augmented dataset that not only mitigates bias from class imbalance but also improves model generalization performance. All Al-based detections transformed our annotated dataset into a training-ready set with evenly distributed classes and sufficient variance, ensuring reliable melanoma detection predictions.
Algorithm 2 outlines resizing input images to multiple scales and applying convolutional operations to extract both fine-grained and coarse-grained features, which are critical for accurate lesion classification. It presents Multi-Scale Feature Extraction for Melanoma Detection. This algorithm extracts both fine- and coarse-grained features across scales to obtain a layered representation of a melanoma image. First, the method resizes each preprocessed image to different scales, allowing the model to detect both fine-grained details and larger patterns. A convolutional layer extracts essential features (or identifying characteristics of melanoma) that differ at different scales of the image (i.e., across resized versions of the image). This capability to capture both small details, such as color variations and edges, and larger structural patterns helps the model detect melanoma.
| 1. Objective: Extract features at multiple scales to capture both fine and broad patterns within melanoma images. |
| 2. Input: : Preprocessed Image dataset |
| 3. Set of scales. |
| 4. Output: |
| 5. : Multi-scale feature map. |
| 6. Steps: |
| 7. Initialization: Define scales |
| 8. Resize at Each Scale: For each , resize : |
| 9. Feature Extraction (Convolution): Apply Patch Embedding Convolutions for each scale: |
| 10. Normalization Across Scales: Normalize features at each scale to ensure consistent feature distribution: |
| 11. Weight Initialization: Initialize weights for each scale , where is learned or predefined. |
| 12. Feature Summation Across Scales: For each pixel p, compute combined features: |
| 13 |
| 14. Spatial Feature Summing: Aggregate features spatially for a more comprehensive feature representation: |
| 15 |
| 16. Scale Adaptation: Adapt multi-scale features to a single scale for uniform processing: |
| 17 |
| 18. Feature Standardization: Standardize combined features: |
| 19 |
| 20. Return : Output final multi-scale feature map. |
After extracting features from each scale, they are normalized so that features across scales have similar distributions, which is critical for balanced feature representation. Each scale is either predefined or learned during training, then weighted to determine its contribution to the overall analysis. These features are weighed and then combined across scales into a final, multi-scale feature map. Then it is reshaped and normalized into a single tensor that captures the rich, detailed, and coarse information of the melanoma images, which is crucial for accurate classification afterwards. The output of these feature maps is a multi-scale feature map with a high signal-to-noise ratio (SNR), which serves as a strong input to the following stages of the model for melanoma detection.
Algorithm 3 illustrates the use of self-attention mechanisms within the ViT to generate interpretable feature maps. Attention weights are visualized using Attention Rollout and Self-Attention Attribution, enabling clinical transparency. It presents Transformer Self-Attention with Explainable AI for accurate melanoma detection, providing greater interpretability by highlighting the key regions in images containing malignant lesions. After this, the authors employed the multi-scale feature map to construct the query, key, and value matrices, which implement the self-attention mechanism of transformers. This enables the model to identify relationships between various regions in the image while determining which region requires attention in the decision. The algorithm calculates attention scores for each pixel pair to determine the influence between image regions, enabling it to focus on areas of the image that may contain melanoma-related features. The self-attention mechanism generates an attention map that shows the importance of each pixel relative to the entire image context. This attention map both highlights regions with essential features and improves the model’s interpretability by pointing out which areas of the image are most relevant to the prediction. To ensure model stability and prevent regular features from becoming too distant from the features being processed, a layer with layer normalization and a residual connection is used. The output of each layer in the transformer is also added to the input of each layer. The algorithm then combines these attention features across the views to generate an improved feature map that retains the highly relevant features for melanoma diagnosis, thereby providing strong interpretability to the model prediction.
| Objective: Apply self-attention to enhance interpretability by focusing on regions within melanoma images that are most indicative of malignancy. |
| 1. Input: : Multi-scale feature map of dimensions . |
| 2. Output: : Attention-enhanced feature map. |
| 3. Steps: |
| 4. Linear Projections: Compute query, key, and value matrices using linear projections: |
| 5. Scaling Factor for Stability: Define a scaling factor for normalization. |
| 6. |
| 7. Dot Product for Attention Calculation: For each pair of pixels , calculate attention score: |
| 8. Softmax Activation for Normalized Attention Weights: |
| 9. Attention Map Creation: Generate an attention map for each pixel: |
| 10. Weighted Summation for each pixel: For each pixel p, compute the attention-enhanced feature vector: |
| 11. Residual Connection to Preserve Original Features: Add a residual connection for each feature map: |
| 12. Layer Normalization for Stability: |
| 13. Normalization: Apply Layer Normalization: |
| 14. Attention Feature Scaling: Scale features post-attention: |
| 15. Aggregation of Attention Outputs: Refine attention for multi-view images: |
| 16. Return Final Attention-Enhanced Feature Map : Output final enhanced feature map. |
Mathematical model for early-stage melanoma detection
This section presents an organized, logical, and mathematical model that categorizes melanoma images for the examination of pre-ordering and advanced-stage skin cancer. This approach encompasses critical stages, including data preprocessing, feature extraction, and classification, all designed to improve the model’s ability to identify cancerous features accurately. Preprocessing and augmentation involve normalizing each image so that they maintain similar brightness and contrast levels, thereby reducing variability that can hinder model training. When there are fewer samples, CycleGAN generates synthetic images to equalize the dataset. This step resolves class imbalance by maintaining a balance of essential instances—such as standard and benign cases—with equal representation of malignant cases, which is necessary to avoid Model Bias During Training.
Multi-scale transformations provide a few levels of context and detail through two or three levels of feature extraction. At the three input scales, the images were resized to extract features via convolutional operations, emphasizing both fine-grained and large-scale patterns in the dermoscopic image. The finer- and coarser-scale features are aggregated and normalized into a single feature representation. This enables the model to identify both minor and major features related to cancer in the feature map before processing during the transformer-based self-attention step. The self-attention mechanism highlights important regions in the feature map, enabling the model to focus on areas that may contain cancerous tissues.
Data preprocessing and augmentation
Normalization: Normalize each image To standardize brightness and contrast as mentioned in Eq. (1).
(1) where and The mean and standard deviation of pixel intensities are.
Class imbalance correction using CycleGAN: Generate synthetic samples for each underrepresented class As mentioned in Eq. (2).
(2) Transformation for augmentation: Apply rotation, flipping, and scaling transformations to augment the data, as mentioned in Eqs. (3)–(7).
-
•
Rotation: (3)
-
•
Flipping: (4)
-
•
Scaling: (5)
Combined Augmentation:
(6)
Final Augmented Dataset:
(7)
Multi-scale feature extraction
Image resizing for multiple scales: Resize each image for each scale Eqs. (8) to (14)
(8) Feature Extraction (Convolution) for Scale s:
(9) Normalization of Features for Each Scale:
(10) Multi-Scale Feature Combination with Weights :
(11) Spatial Summing of Features:
(12) Feature Averaging for Scale Adaptation:
(13) Standardization of Combined Features:
(14)
Transformer self-attention
Linear projections for self-attention: Project the feature map to , key , and value As mentioned in Eq. (15).
(15) Scaling factor for normalization as mentioned in Eq. (16)
(16) Attention score calculation: Calculate attention scores for each pixel pair As mentioned in Eq. (17).
(17) Attention map generation: The attention map is generated by weighing the value matrix As mentioned in Eqs. (18) and (19).
(18) Attended feature summation: sum weighted values to generate attended features
(19) Residual addition: Add the original feature map to the features attended as mentioned in Eq. (20).
(20) Layer normalization: Normalize the residual connection to stabilize training as mentioned in Eq. (21).
(21) Scaling of normalized features: Apply learned scaling and shift parameters and to as mentioned in Eq. (22).
(22) Final attention mapping with multi-view integration: Integrate multi-view images Eq. (23)
(23)
Explainable AI techniques: attention rollout and self-attention attribution
Attention rollout calculation: Aggregate self-attention layers to visualize importance, as mentioned in Eq. (24).
(24) where is the attention matrix at layer l, and I is the identity matrix.
Self-Attention attribution: Calculate attribution scores for each pixel as mentioned in Eq. (25).
(25) where Indicates the contribution of pixel qqq to the final decision.
Classification and loss computation
SoftMax activation for classification: Calculate class probabilities for each category As mentioned in Eqs. (26) to (28).
(26) Cross-entropy loss calculation: Define the cross-entropy loss for a single image :
(27) Total loss for dataset: Aggregate the loss across all images in the dataset:
(28) Gradient descent update:
Update the model parameters θ based on the gradients of the total loss:
(29) Table 2 summarizes the key elements and hyperparameters of a ViT-based explanation-guided approach for melanoma detection. For the ViT, we set 12 transformer layers, eight multi-head attention heads, and a 3,072-unit feedforward network to ensure proper feature extraction from skin lesion images. The first stage of this architecture involves inputting the image size, which is set to . Each image is then split into a patch, allowing the self-attention mechanism to operate in each localized area. Here, we maintain stability by setting the attention dropout rate to 0.1 and using layer normalization. The GELU activation function enables the model to extract features more effectively through its improved nonlinear capabilities. We use a linearly decayed AdamW optimizer with a learning rate of 0.0001 and a batch size of 16, which makes the training convergent and efficient.
| Component | Hyperparameter | Optimal parameters |
|---|---|---|
| Model | Transformer architecture | Vision transformer (ViT) |
| Number of transformer layers | 12 | |
| Multi-head attention heads | 8 | |
| Feedforward network size | 3,072 | |
| Input image size | 224 × 224 pixels | |
| Patch size | 16 × 16 | |
| Attention dropout rate | 0.1 | |
| Layer normalization | Yes | |
| Activation function | GELU | |
| Optimizer | AdamW | |
| Learning rate | 0.0001 | |
| Batch size | 16 | |
| Explainable AI techniques | Attention visualization | Attention rollout |
| Self-attention attribution | Enabled for interpretability | |
| Visualization tools | Heatmaps of attention regions | |
| Explainability layer | Self-attention weights to highlight key areas. | |
| Data augmentation | Rotation range | ±30 degrees |
| Scaling factor range | 0.9 to 1.1 | |
| Horizontal flip | Yes | |
| Vertical flip | Yes | |
| CycleGAN for synthetic data | Generator architecture | U-Net based |
| Discriminator architecture | PatchGAN | |
| Learning rate (CycleGAN) | 0.0002 | |
| Loss functions | Cycle consistency, Adversarial |
The methodology uses explainable AI techniques to provide insights into the model’s decision-making process, thereby enhancing interpretability and transparency. They use Attention Rollout and Self-Attention Attribution to generate heatmaps that highlight key areas that impact model predictions. These tools analyze input images using self-attention weights, which can provide a visualization of the regions of the image the model has found most relevant to its decision. Data augmentation methods, such as rotation, scaling, horizontal flipping, and vertical flipping, will introduce additional variability to the dataset, thereby increasing the model’s robustness. Furthermore, CycleGAN is used to address data imbalance through synthetic image generation, employing a U-Net generator and a PatchGAN discriminator. Utilizing CycleGAN with a learning rate of 0.0002 and weight loss functions focused on cycle consistency and adversarial loss; the model generates synthetic data of suitable quality for training purposes.
Results and discussion
The proposed ViT-based model, enhanced with explainable AI techniques, showed exceptional results for melanoma classification. SMART-XAI achieved 96.0 ± 0.87% accuracy, sensitivity, and 94.1 ± 1.05% specificity. These values were consistent across folds and had narrow confidence intervals, confirming robustness and demonstrating the model’s ability to distinguish between malignant and non-malignant skin lesions. The self-attention mechanism employed in ViT captures both local and global feature properties, which are crucial for identifying subtle changes in melanoma properties. Using a multi-scale feature-extraction framework, the model effectively learned fine details—such as color differences, edge irregularities, and texture discrepancies—while also capturing large-scale features. All these feature-extraction elements significantly enhanced diagnostic performance, making the model a valuable tool for early melanoma detection.
In addition to high diagnostic accuracy, the use of explainable AI techniques, such as Attention Rollout and Self-Attention Attribution, provided essential insights into the model’s workings. Both methods produced descriptive heat maps, showing which parts of the input images were most relevant to their prediction features, including asymmetrical borders, areas with varied pigmentation, and distinct signs of melanoma. Such interpretability, afforded by these techniques, helps clinicians trust AI-assisted diagnosis and supports clinical decision-making when the model’s attention aligns with long-established dermatological knowledge (Wu et al., 2025). Enabling the visualization of attention regions in the model ensures that diagnostic results are accurate, interpretable, and actionable in a clinical setting.
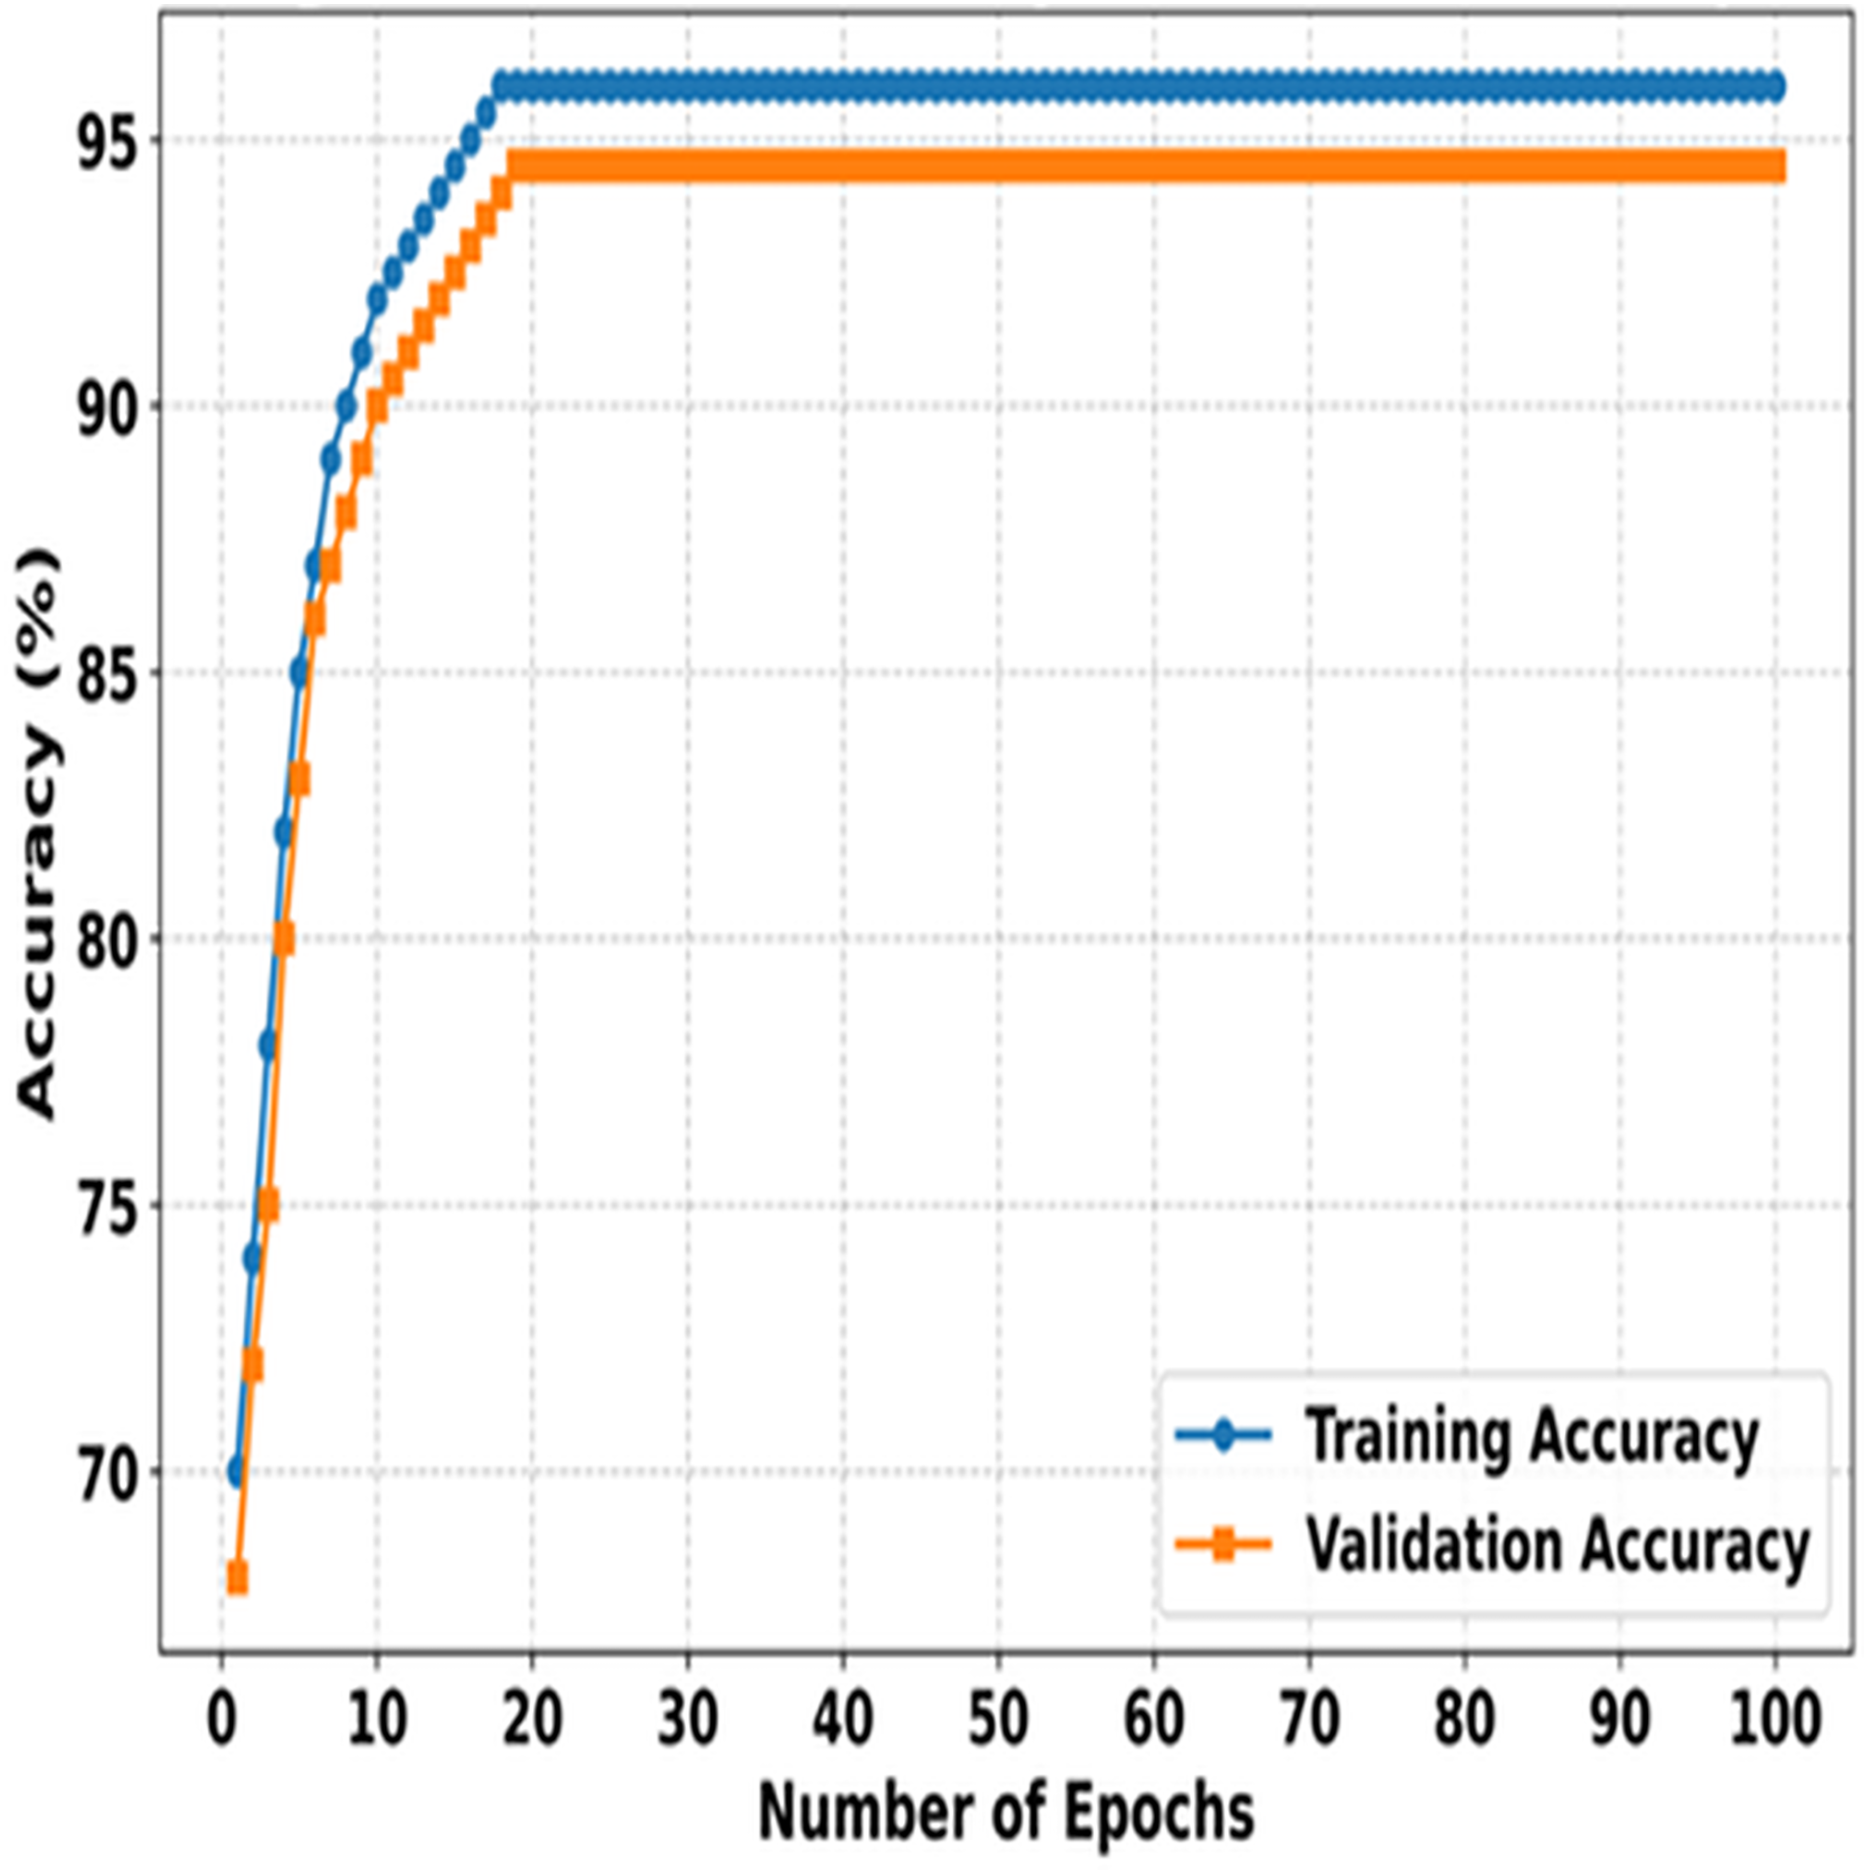
Figure 3 illustrates the training and validation accuracies of SMART-XAI over 100 epochs, demonstrating how the model learns and generalizes during both phases. The X-axis indicates the number of epochs; the Y-axis indicates the accuracy (%) of the model. Initially, both training and validation accuracies increase exponentially as the model learns the dataset’s essential features. The 100 epochs is an indication that the model is learning because of this steep incline that is observed through the first 100 epochs. Therefore, the training and validation accuracies stabilize only after this phase, and the training accuracy plateaus at around 96. In comparison, the validation accuracy stays slightly below it at 95%, indicating slight overfitting and a strong generalization capability.
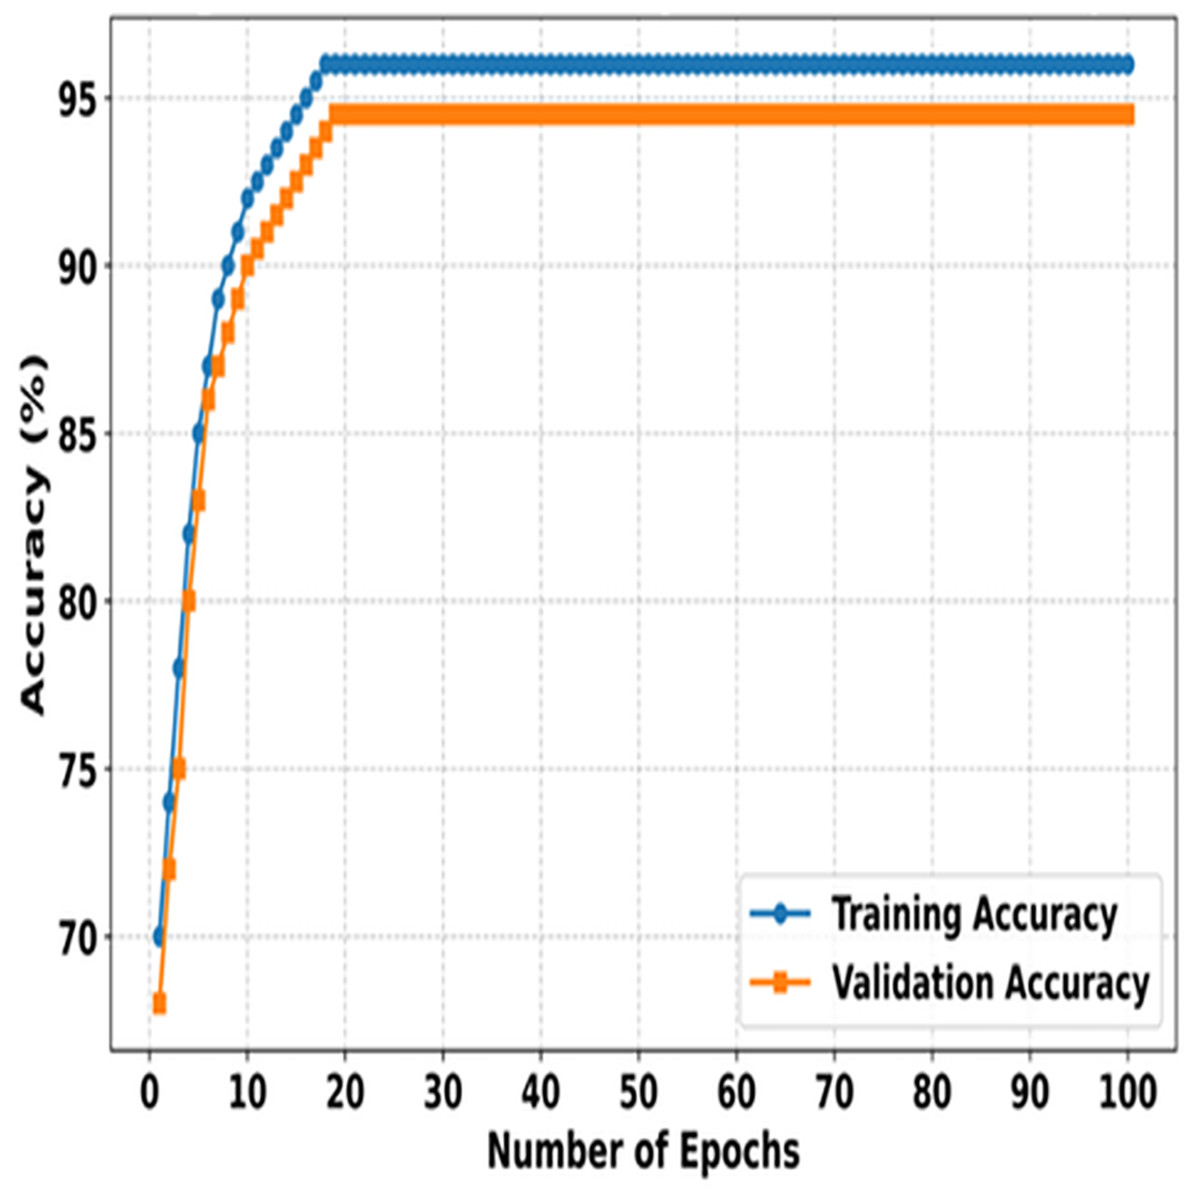
Figure 3: Training vs. validation accuracy of SMART-XAI Over 100 epochs.
When the accuracy is equal on both the training and validation sets, the SMART-XAI framework gives the illusion of robustness and reliability over 100 epochs. Both metrics, showing high accuracy, indicate that the ViT architecture, with suitable data preprocessing and augmentation techniques, successfully extracts and classifies skin cancer features related to Melanoma. This plateauing behavior, observed after approximately 30 epochs, further suggests that the model had reasonably attained its best possible performance, thereby minimizing the risk of excessive overfitting (Sajid et al., 2024). The graph demonstrates the effective learning-generalization trade-off of SMART-XAI, making it clinically applicable.
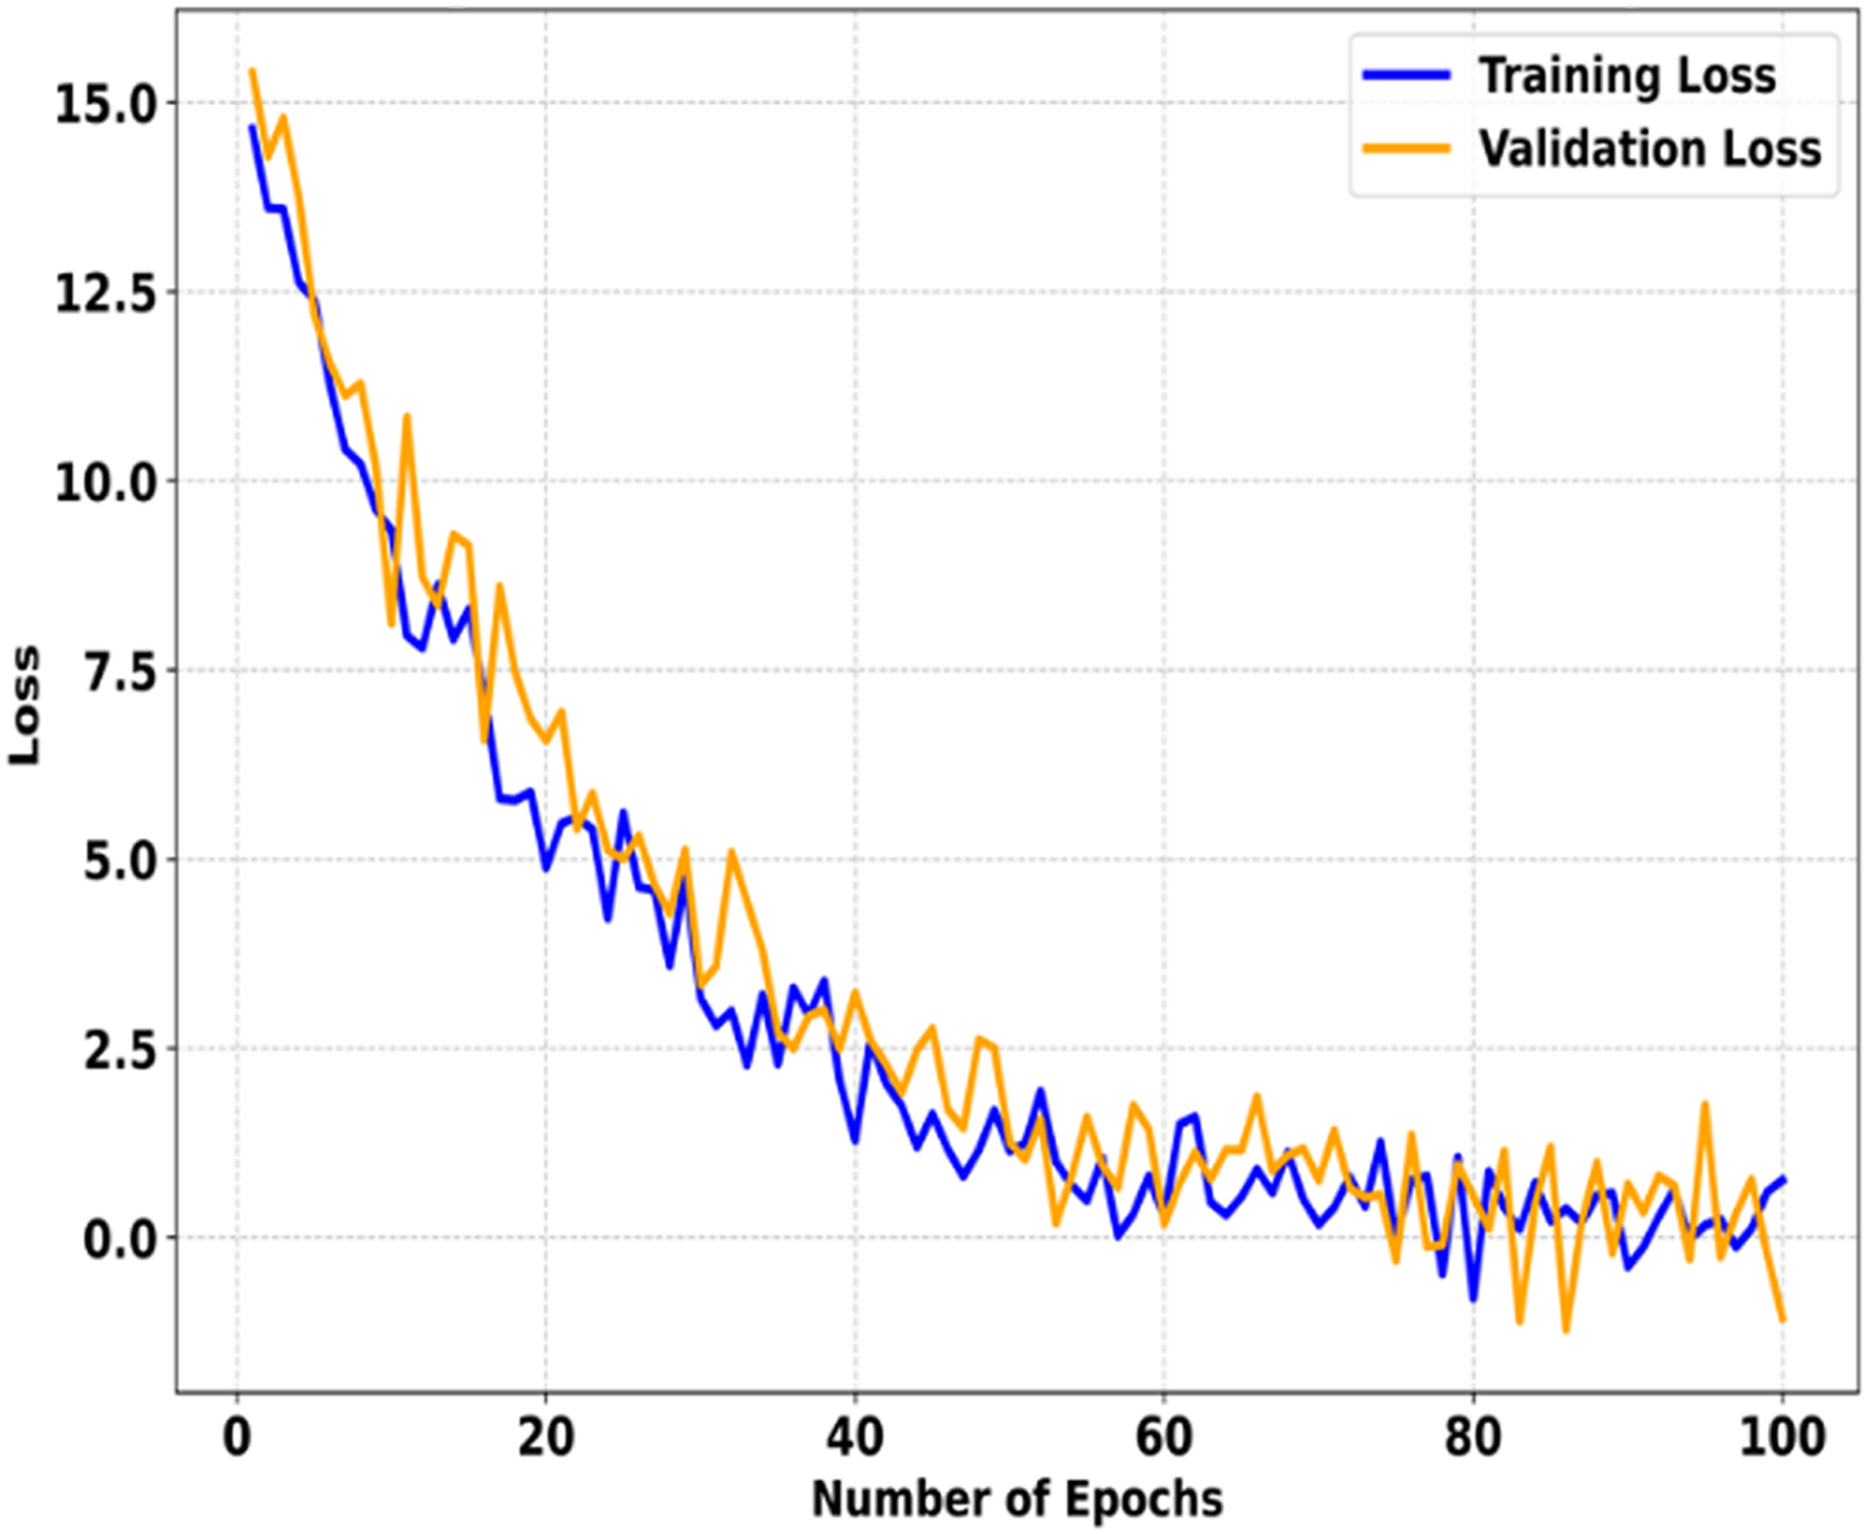
Figure 4 shows the training and validation curves for SMART-XAI after 100 epochs. The x-axis indicates the number of epochs, and the y-axis shows the loss. These curves show how the model was optimized and how well it generalized during training. It is evident from the steep decline in loss values during the first 100 epochs, indicating that the model learns the underlying patterns rapidly and starts minimizing errors effectively. In fact, as we train for more than 100 epochs, both the training and validation losses decrease steadily. Still, the rate of reduction in the training and validation losses slows down dramatically. The losses stabilize by the 40th epoch and drop to near zero by the 100th epoch for both training and validation losses. The small gap between the training and validation losses indicates that the SMART-XAI model generalizes well without overfitting. It confirms the inherent variability of the validation dataset, such that the validation loss fluctuates around the converged point. Still, the overall trend remains the same, demonstrating the model’s robustness as it consistently minimizes error.
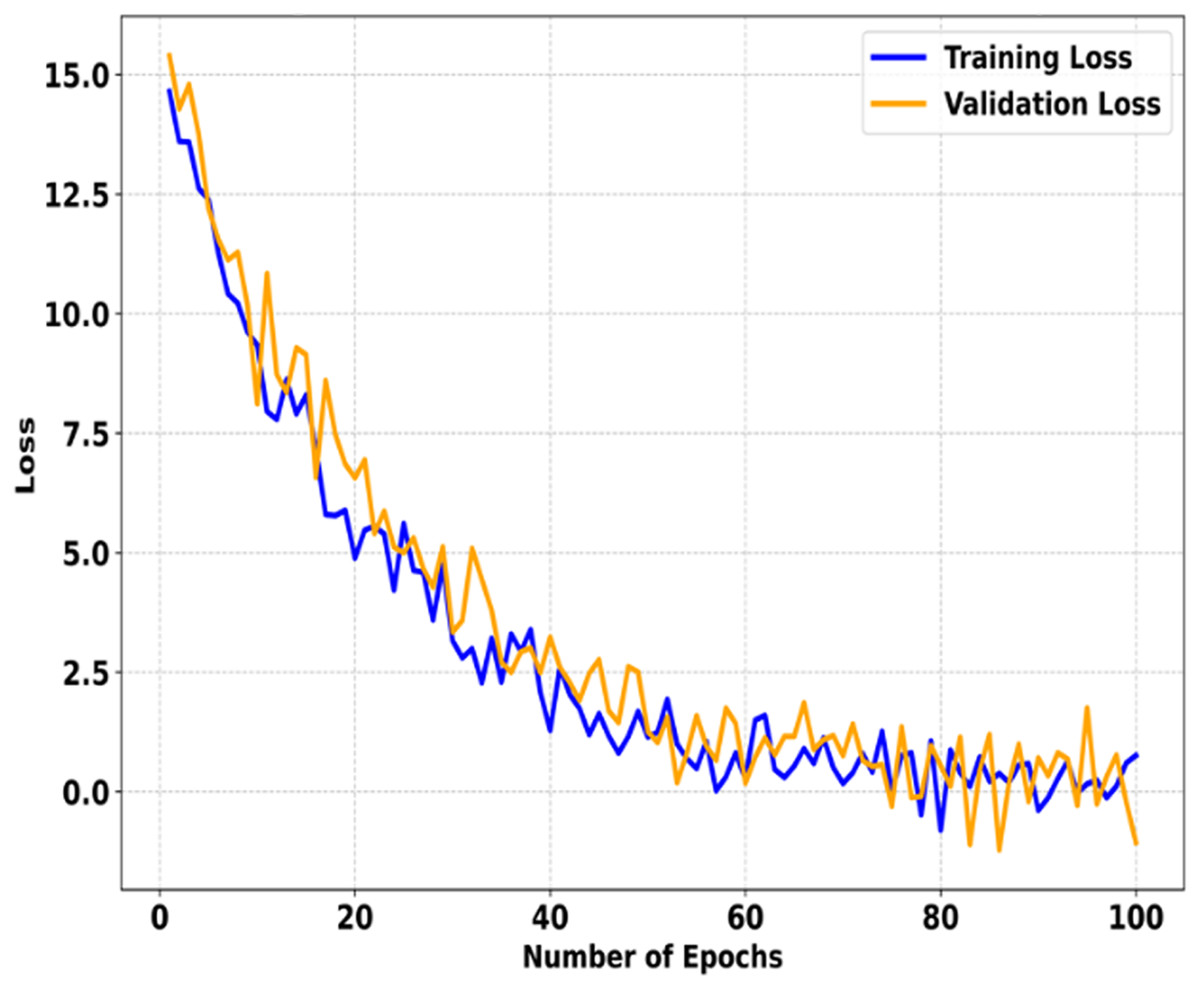
Figure 4: Training vs. validation loss of SMART-XAI Over 100 epochs.
Figure 5 depicts Attention Map Focus Distribution (SMART-XAI), where the x-axis represents the image regions/places, and the y-axis represents the attention weights of these regions. The graph describes the areas of the input images that the model SMART-XAI focuses on when making decisions using the self-attention mechanism. Some patches (e.g., regions 10, 12, and 8) receive significantly higher attention weights, indicating that they contain features crucial for melanoma classification.
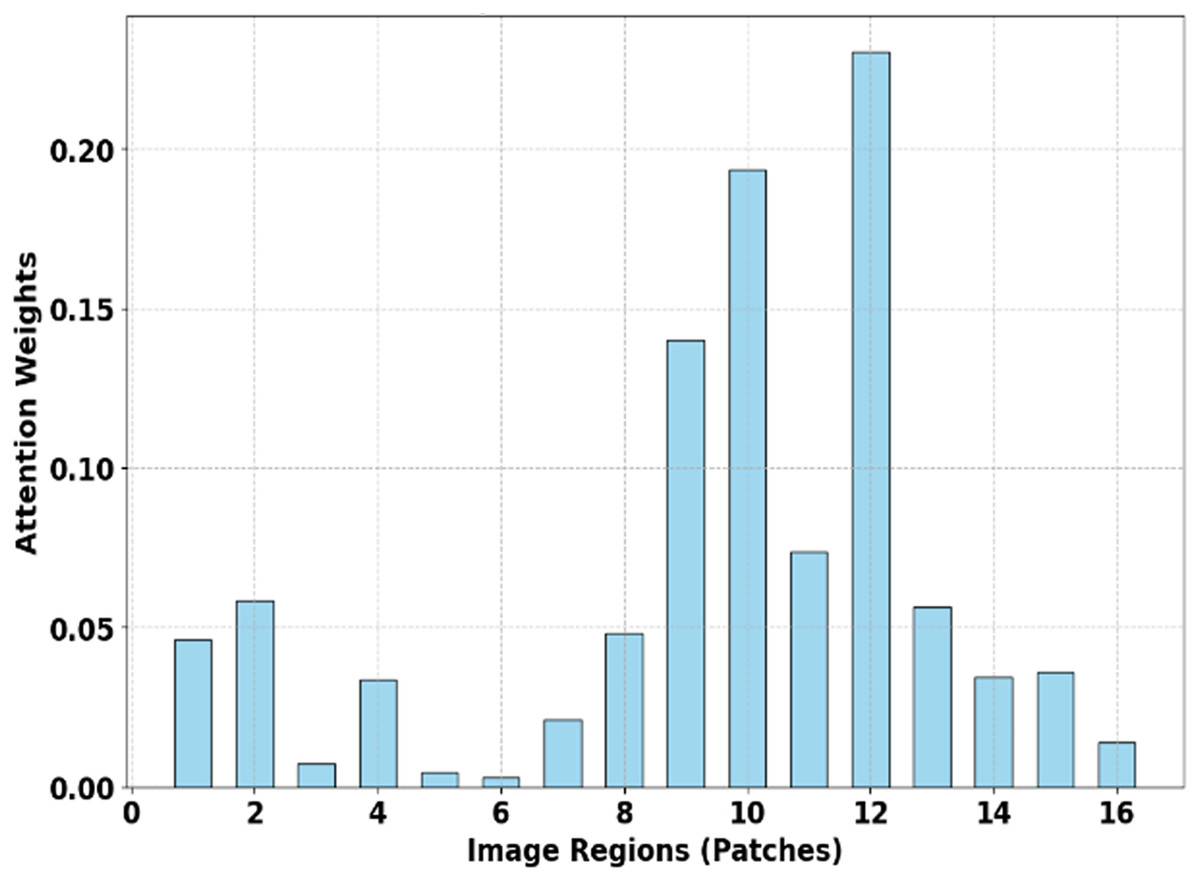
Figure 5: Attention map focus distribution (SMART-XAI).
The heatmap highlights the attention weights assigned to various image patches by the ViT model.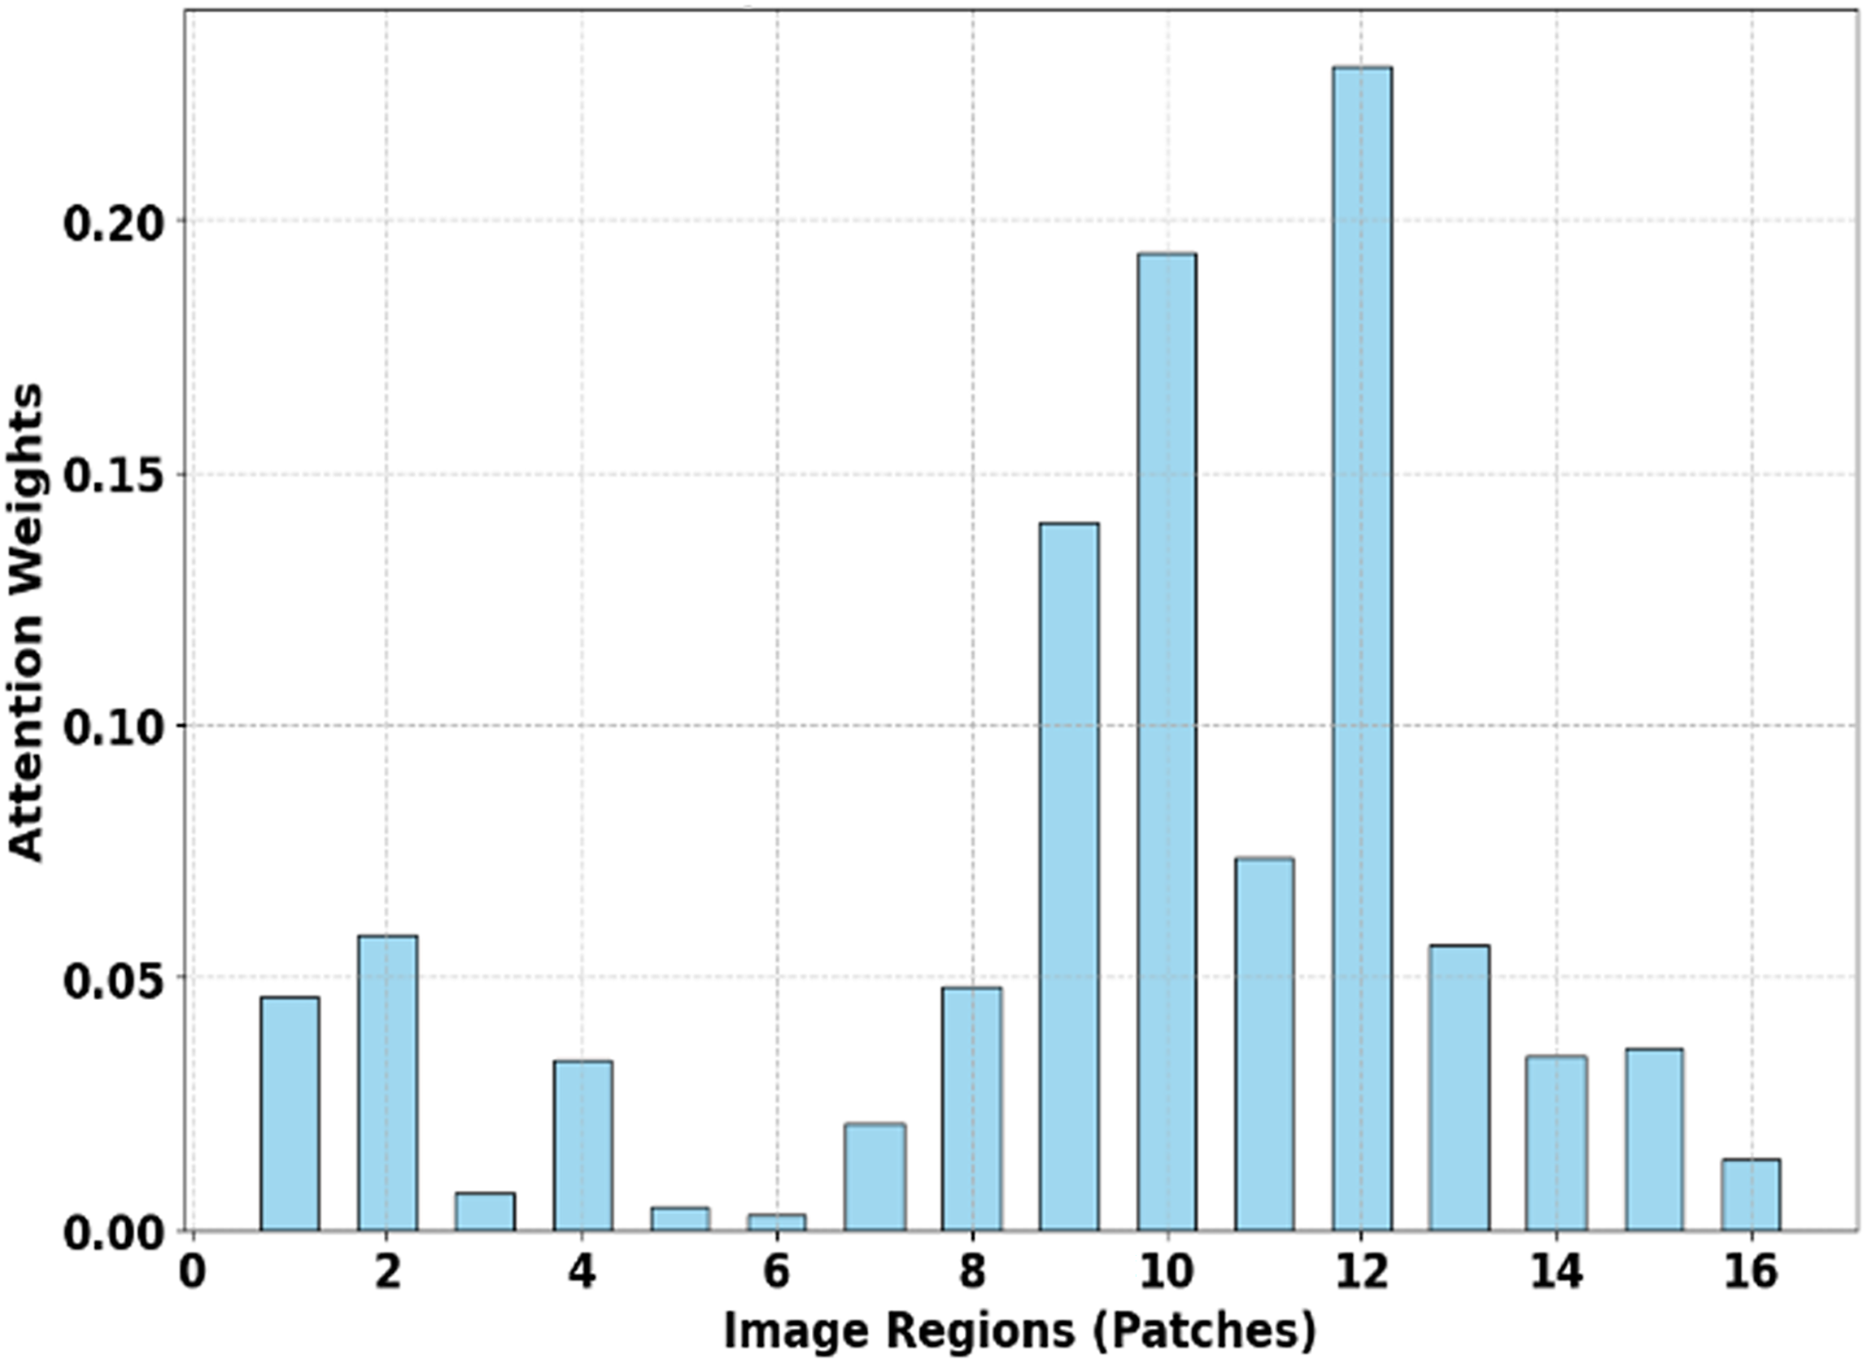
The model’s clinical relevance and utility are enhanced by attention weights that identify key image regions, highlighting features such as irregular lesion borders and characteristic textures that receive high attention scores. The classification process identifies cells with lower attention weights (such as patch 2, 4, and 16) as insignificant because the model learns irrelevant information, as illustrated previously. The SMART-XAI system strikes a balance between local and global feature extraction, enabling it to deliver precise results and understandable analysis for early melanoma detection.
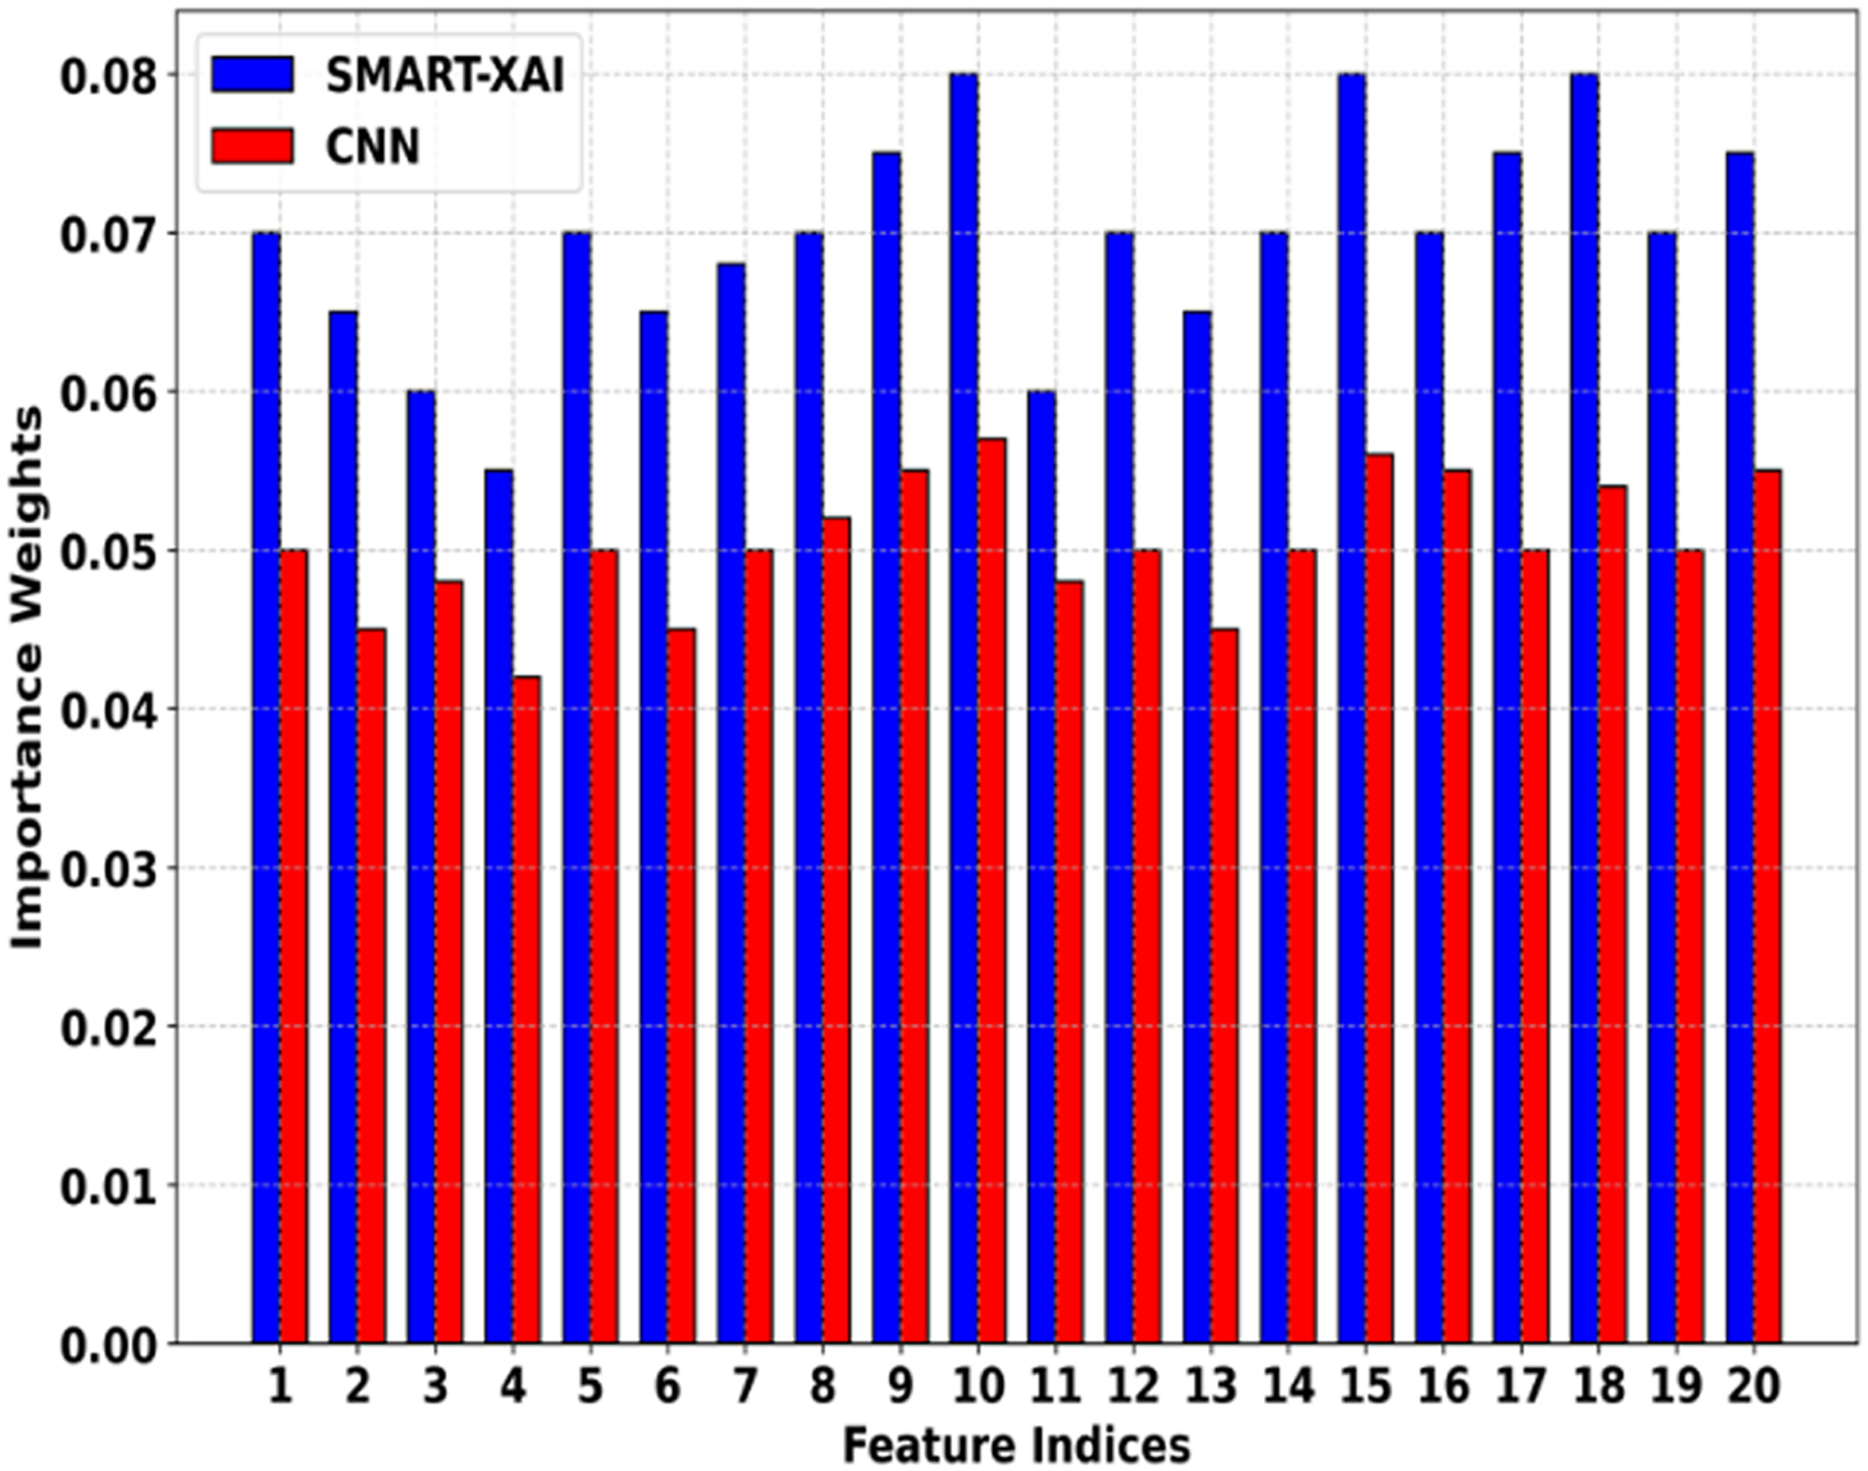
Figure 6 shows the Feature Importance Comparison of SMART-XAI vs. CNN. The x-axis denotes feature indices (specific features extracted from melanoma images), and the y-axis represents the importance of weights assigned by the respective models. This indicates that the SMART-XAI model consistently assigns higher importance weights to key features across all indices compared to the CNN model. This suggests that SMART-XAI can detect and rank the most critical features for melanoma classification, i.e., the lesion asymmetry and texture irregularities.
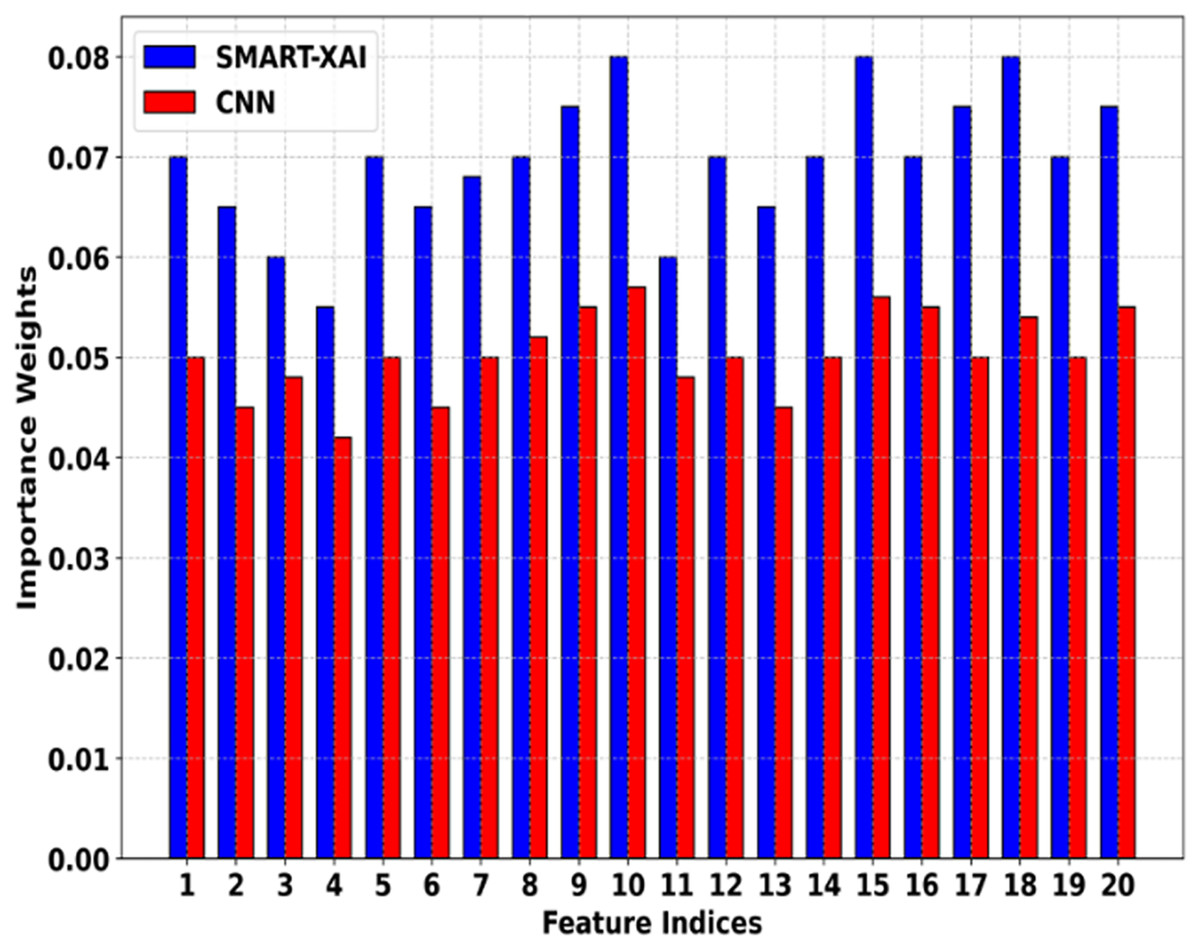
Figure 6: Feature importance comparison of SMART-XAI vs. CNN.
Ultimately, the higher feature importance weights assigned by SMART-XAI indicate that ViT has a superior ability to capture both local and global relations in images through its self-attention mechanisms. However, the CNN model has relatively lower, less stable importance weights, suggesting it may struggle to capture subtle yet clinically significant patterns. The differences favor SMART-XAI for feature extraction, demonstrating its better potential for diagnostic accuracy and reliability in clinical applications.
Figure 7 illustrates the variation in sensitivity measurements between SMART-XAI and CNN across different training epochs. This graph compares the sensitivity of CNNs to SMART-XAI, with epochs on the x-axis and sensitivity percentages on the y-axis. Sensitivity is one of the most critical metrics in medical diagnostics, indicating how well the model performs at detecting positive cases (e.g., melanoma). As shown in the graph, SMART-XAI maintains higher stability and sensitivity across 100 epochs than CNN, yielding better sensitivity (p < 0.0001). This demonstrates the robustness and reliability of SMART-XAI in detecting melanoma cases with minimal false negatives, with recorded values ranging from 90% to 92%. In contrast, the CNN model remains variable and lags overall, with a sensitivity ranging from 84% to 88%. This also means that CNNs are comparatively less stable and perform worse in terms of consistency, particularly in terms of overfitting. SMART-XAI is sensitive to complex cases because it captures both local and global features via a self-attention mechanism. On the contrary, the local convolutional filters used by CNN may not be the best at capturing subtle melanoma-specific features. They may, hence, likely result in a higher number of false negatives. This comparative study emphasizes the better out-of-sample diagnostic efficacy of SMART-XAI in everyday clinical practice.
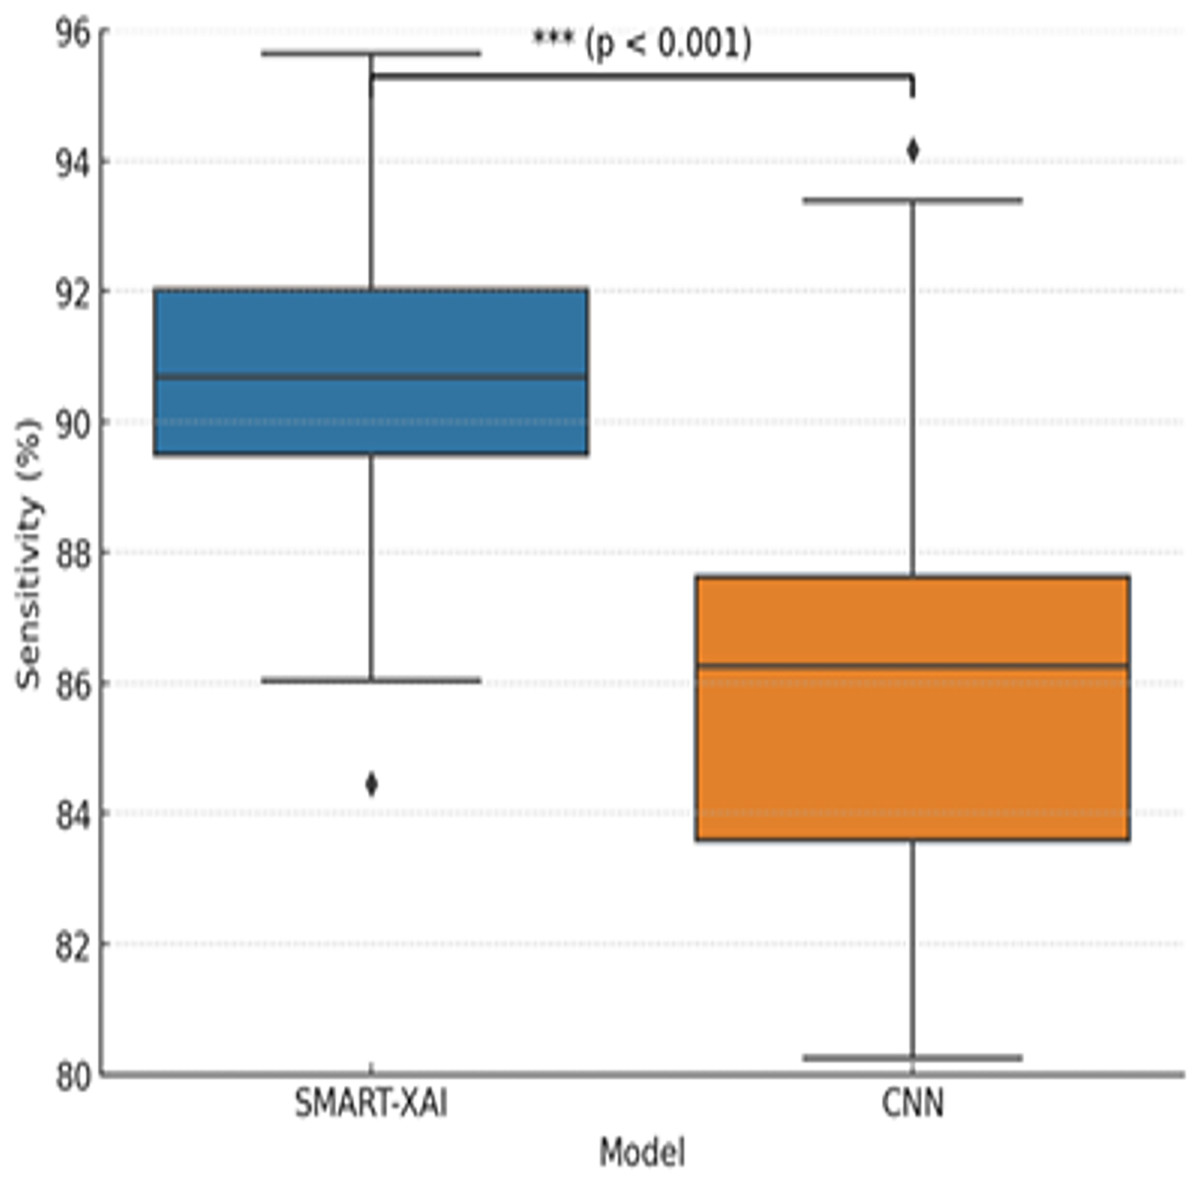
Figure 7: Sensitivity comparison between SMART-XAI and CNN models.
The boxplot illustrates how sensitivity values were distributed across 100 training epochs.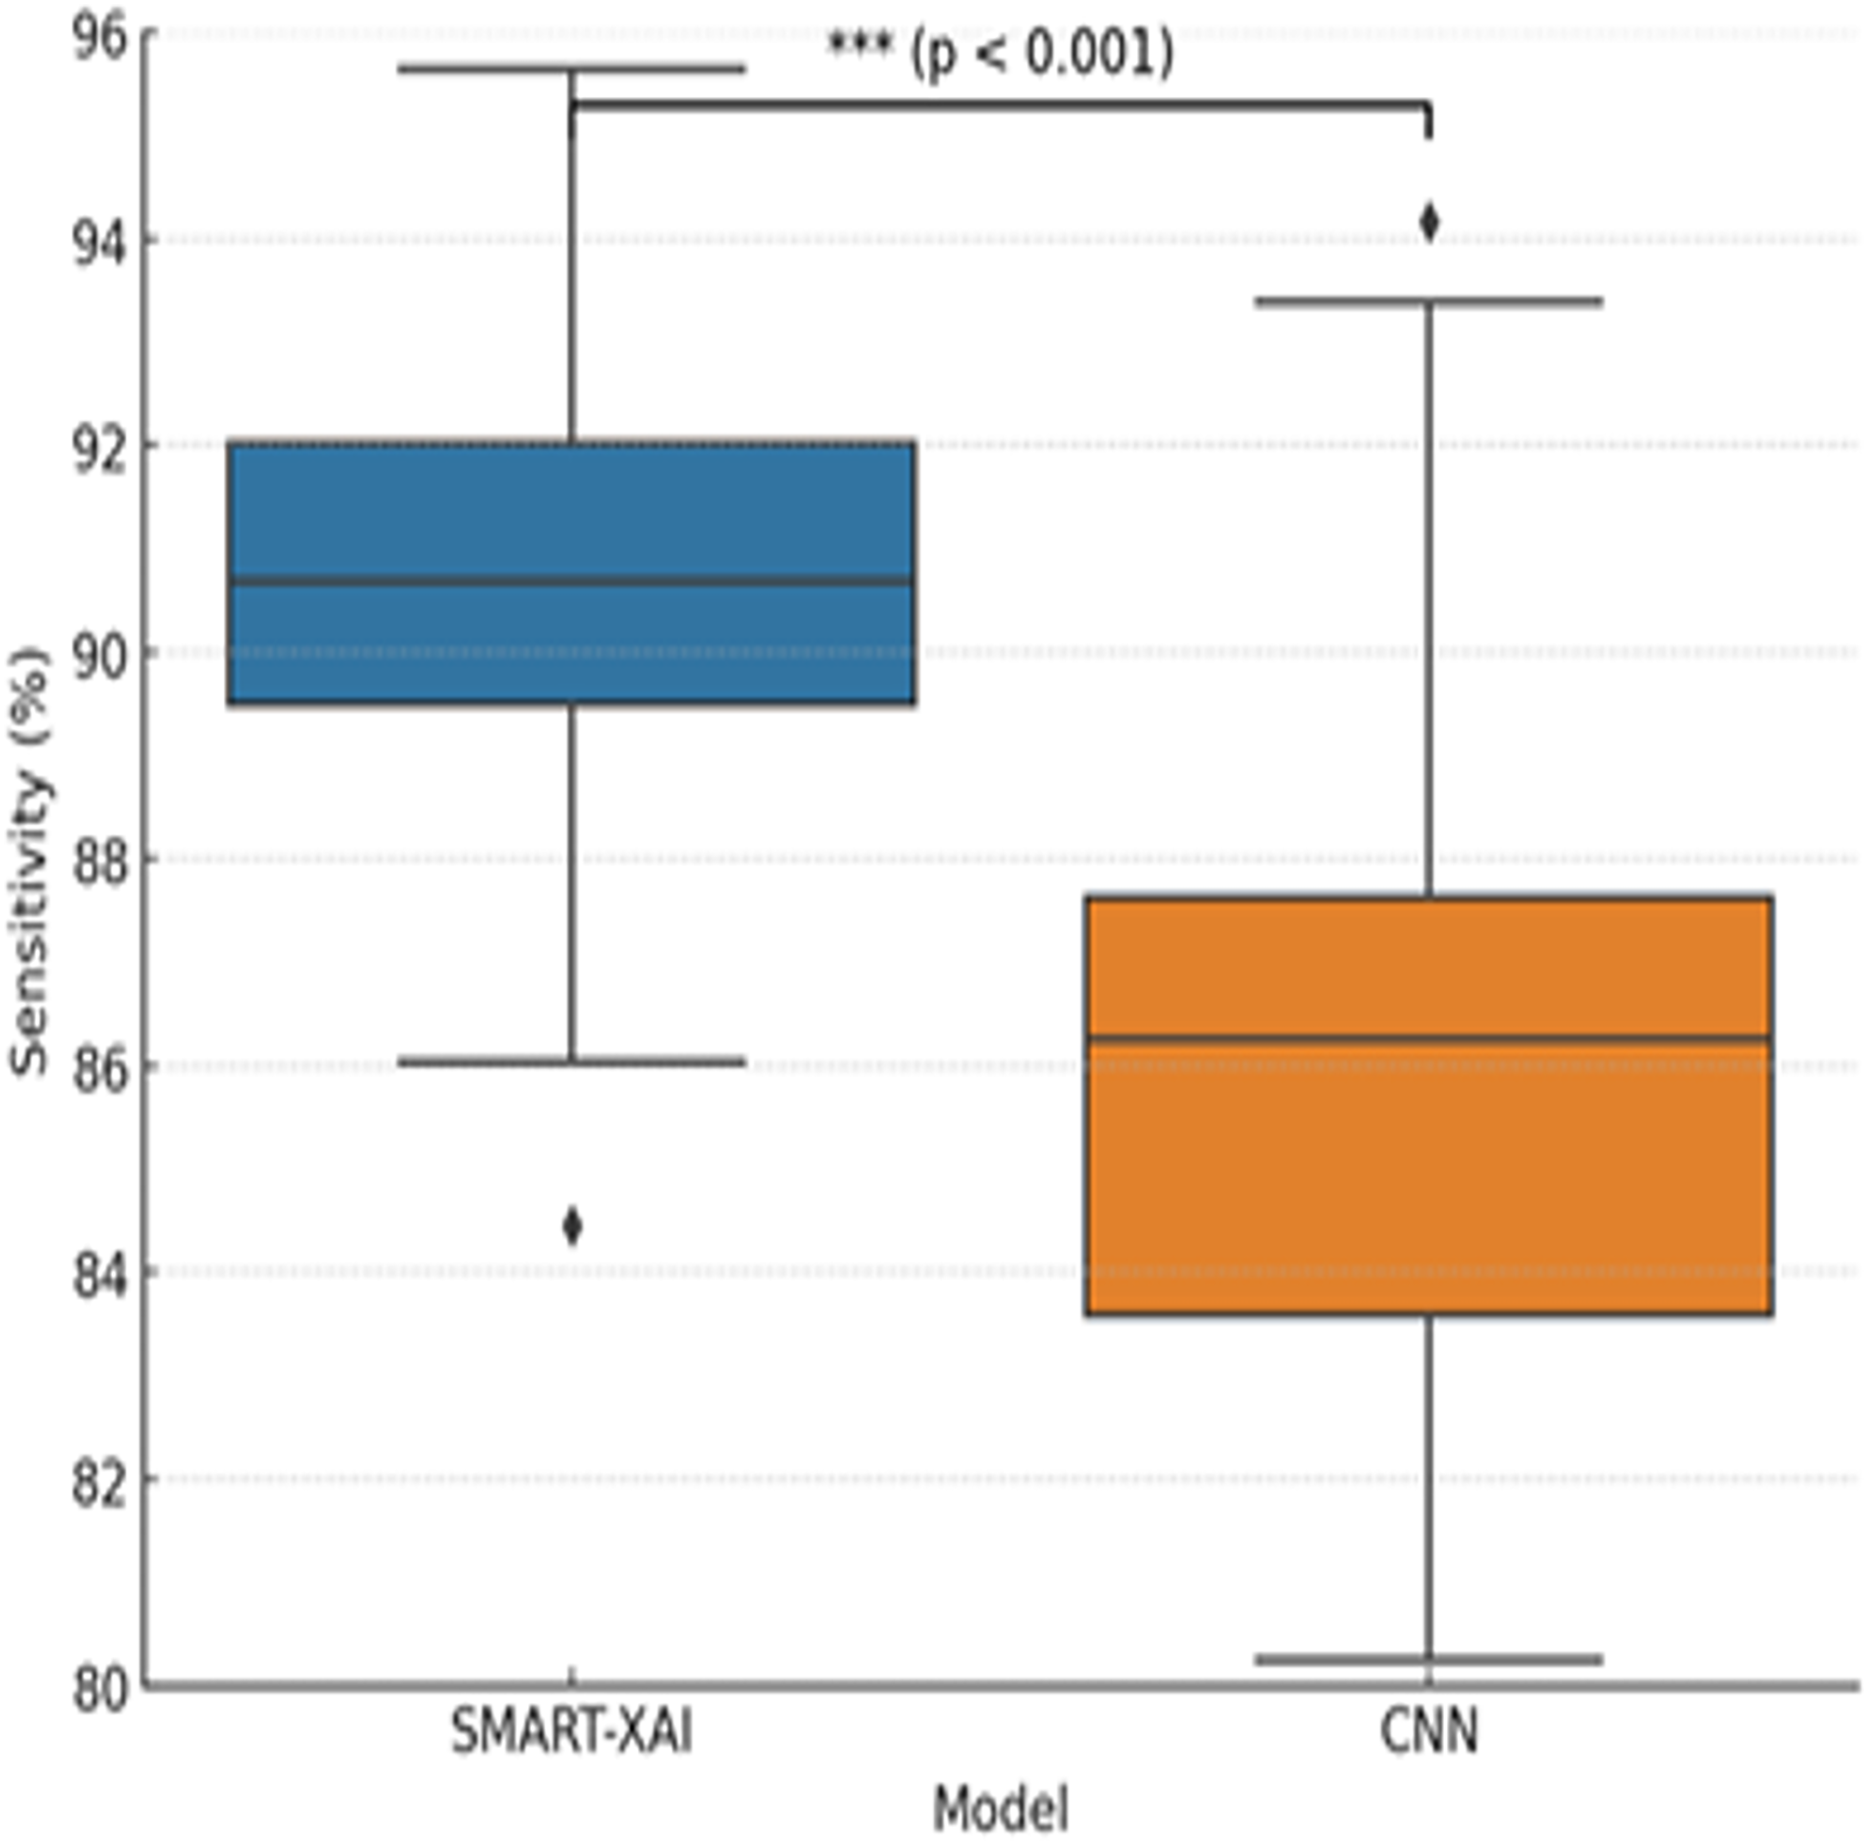
To determine whether the differences in performance between SMART-XAI and baseline models are statistically significant, we performed paired t-tests on the 5-fold cross-validation results. The replication unit was each fold’s performance metric (accuracy, sensitivity, specificity, and F1-score). We used a significance level of p < 0.05. As seen in Fig. 7, we report p < 0.0001, suggesting a statistically significant difference in sensitivity between SMART-XAI and CNN across folds.
Figure 8 shows the comparison between SMART-XAI and CNN across epochs. The x-axis shows epochs, and specificity (%) is expressed on the y-axis. Specificity is the measure of how well the model identifies negative cases (non-melanoma) with a small number of false positives; therefore, it will be an essential metric for reducing false positives in applications directed towards diagnostics.
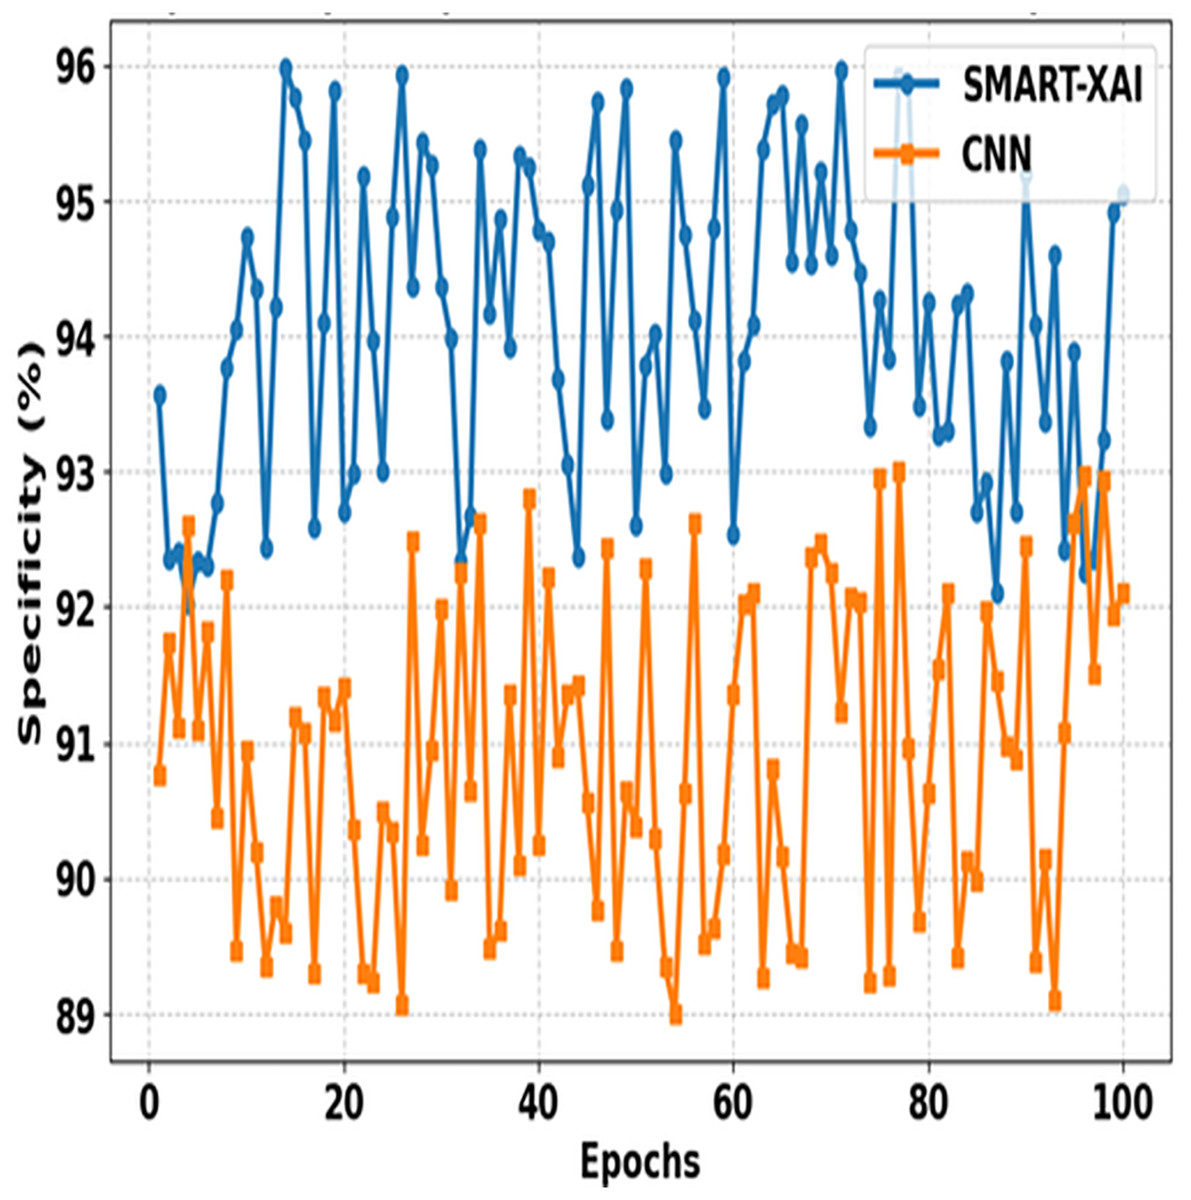
Figure 8: Specificity comparison of SMART-XAI and CNN across epochs.
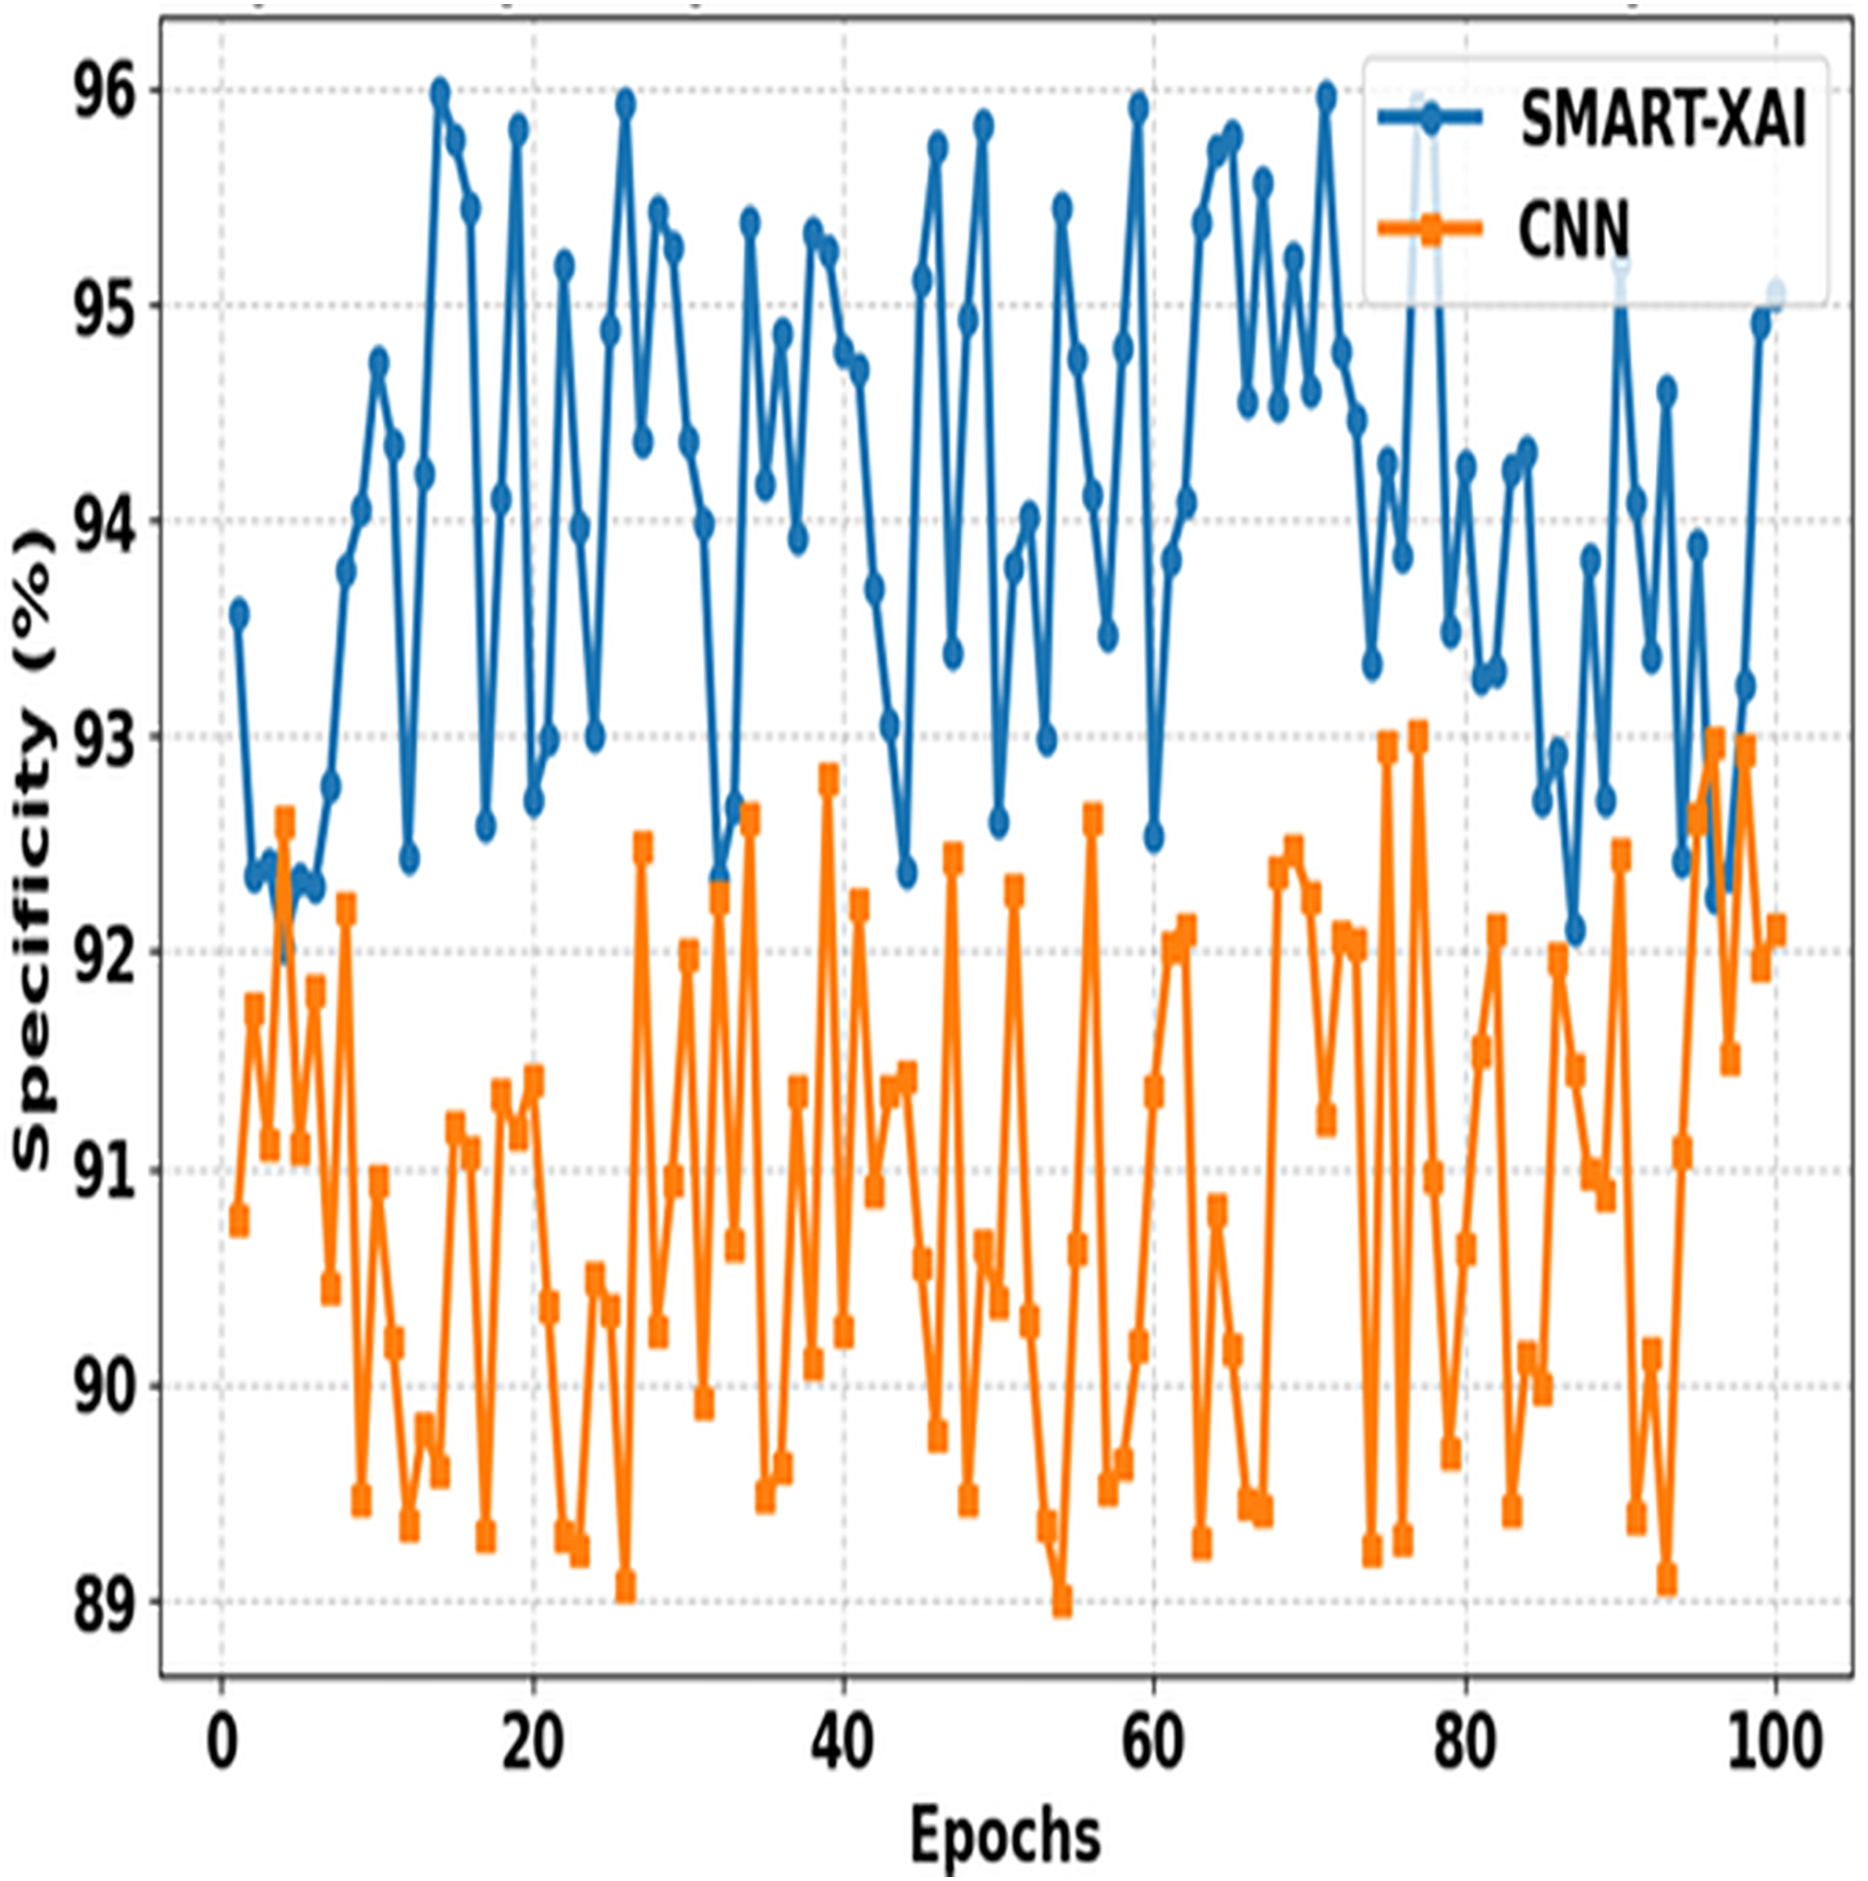
The performance of the SMART-XAI model is significantly more robust than that of the CNN across all epochs, with all specificity values ranging from 94% to 96%. The strong performance here reflects the robustness and reliability of SMART-XAI, such that non-malignant lesions are unlikely to be overclassified as malignant. Conversely, CNN exhibits lower, more fluctuating specificity values, ranging from 89% to 93%. These divergences suggest that CNN cannot reject false positives during training. The strong performance of SMART-XAI is attributed to its self-attention mechanism, which enables it to learn both global and local features necessary for differentiating melanoma from benign lesions. Moreover, multi-scale feature extraction is a key aspect of SMART-XAI, enabling higher-accuracy classification of false negatives and thereby minimizing the psychological and physical suffering caused by false positives in clinical settings.
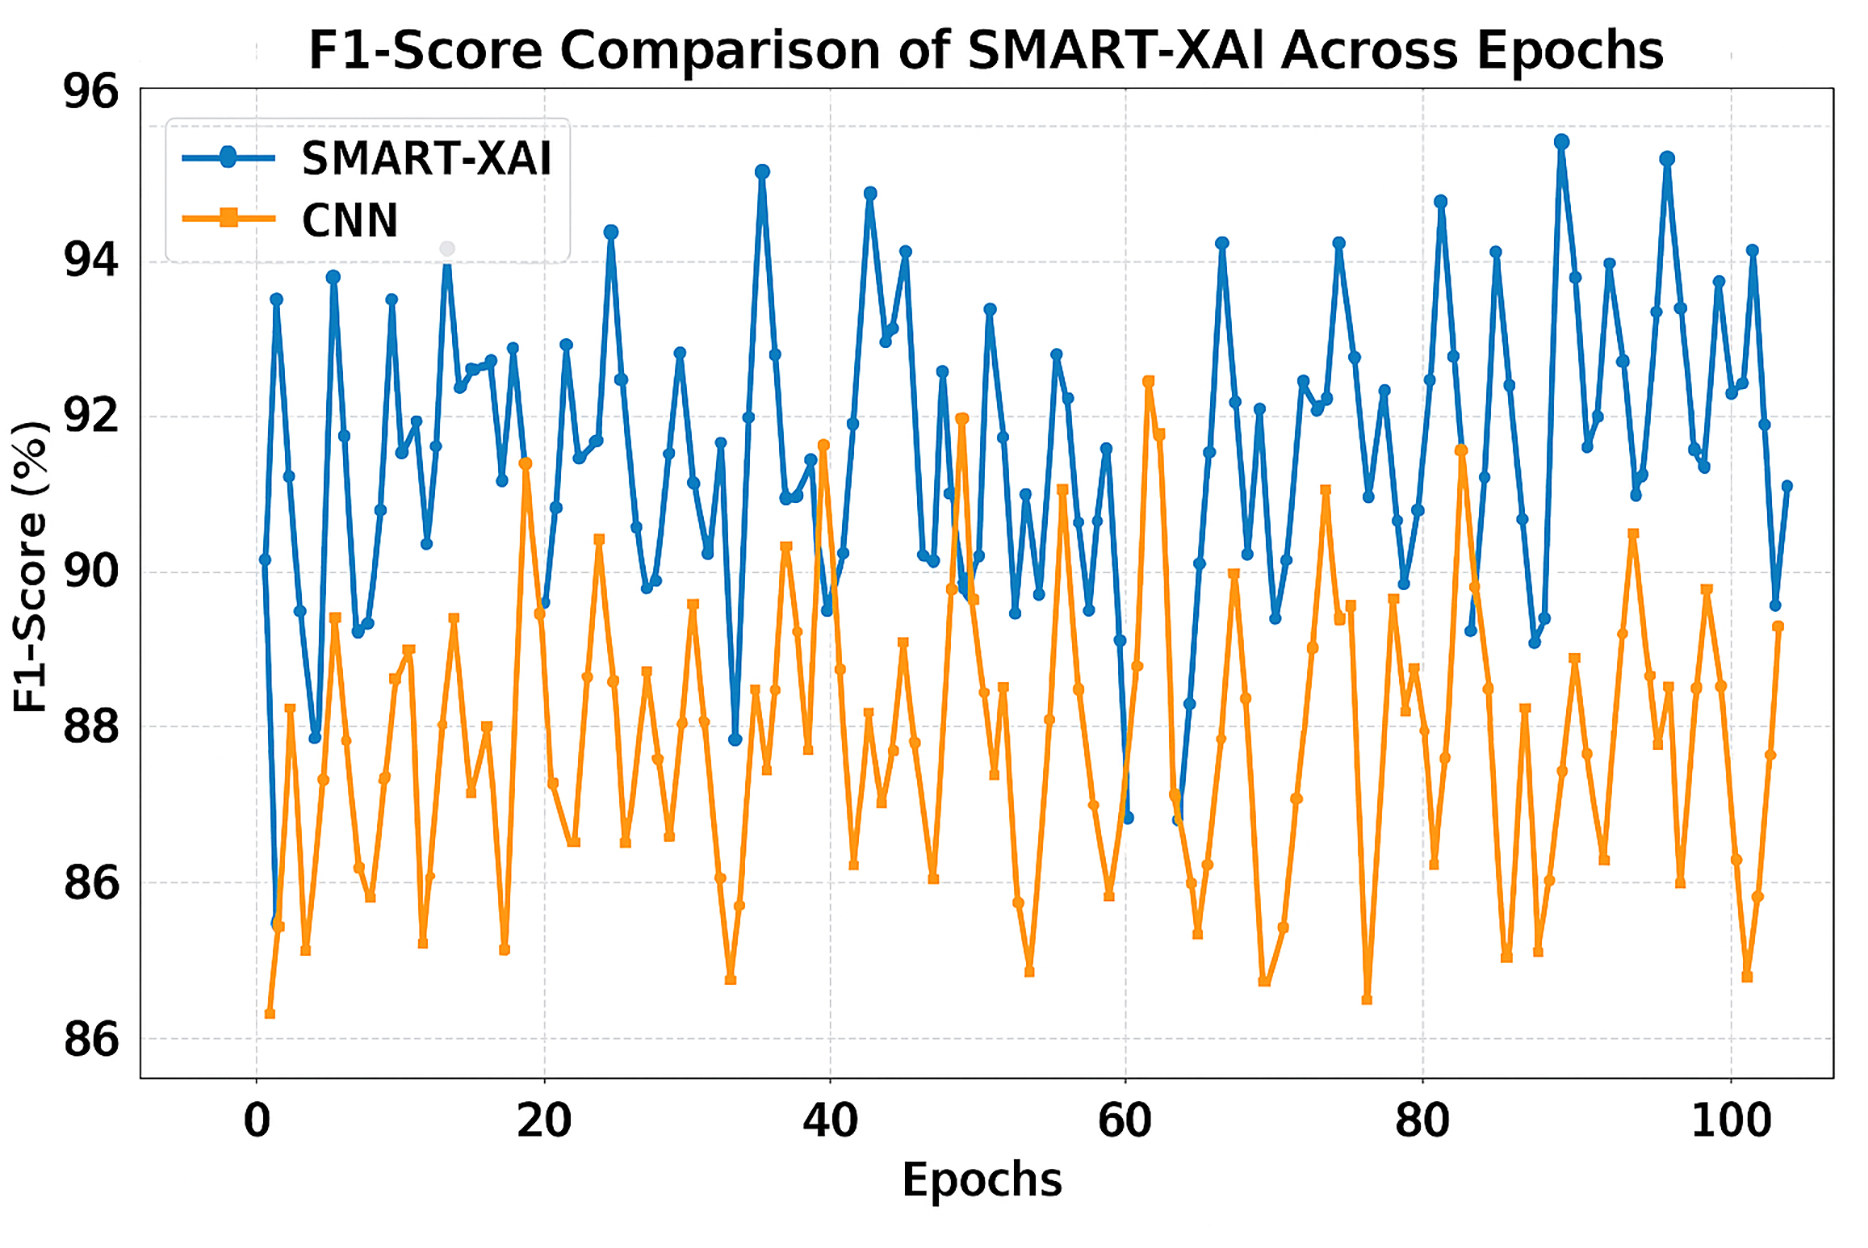
Figure 9 demonstrates the F1-score Comparison of SMART-XAI and CNN Across Epochs, where the x-axis depicts the epoch number (1–100) and the y-axis represents the F1-score in percentage (%). The F1-score is a crucial measure of a classification model’s accuracy, balancing precision and recall scores to assess its performance on imbalanced datasets. While CNN has been able to detect multiple false positives and negatives, we can see that SMART-XAI consistently yields better F1-scores, ranging between 90% and 96%.

Figure 9: F1-score comparison of SMART-XAI and CNN across epochs.
Conversely, the CNN F1-scores are lower, ranging from 86% to 93%, with much greater variance across epochs. This variation demonstrates that CNNs cannot achieve a good trade-off between precision and recall, leading to poor performance on specific image samples. The consistently better performance of SMART-XAI can be attributed to its ViT-based architecture, which utilizes self-attention mechanisms to combine global and local features effectively.
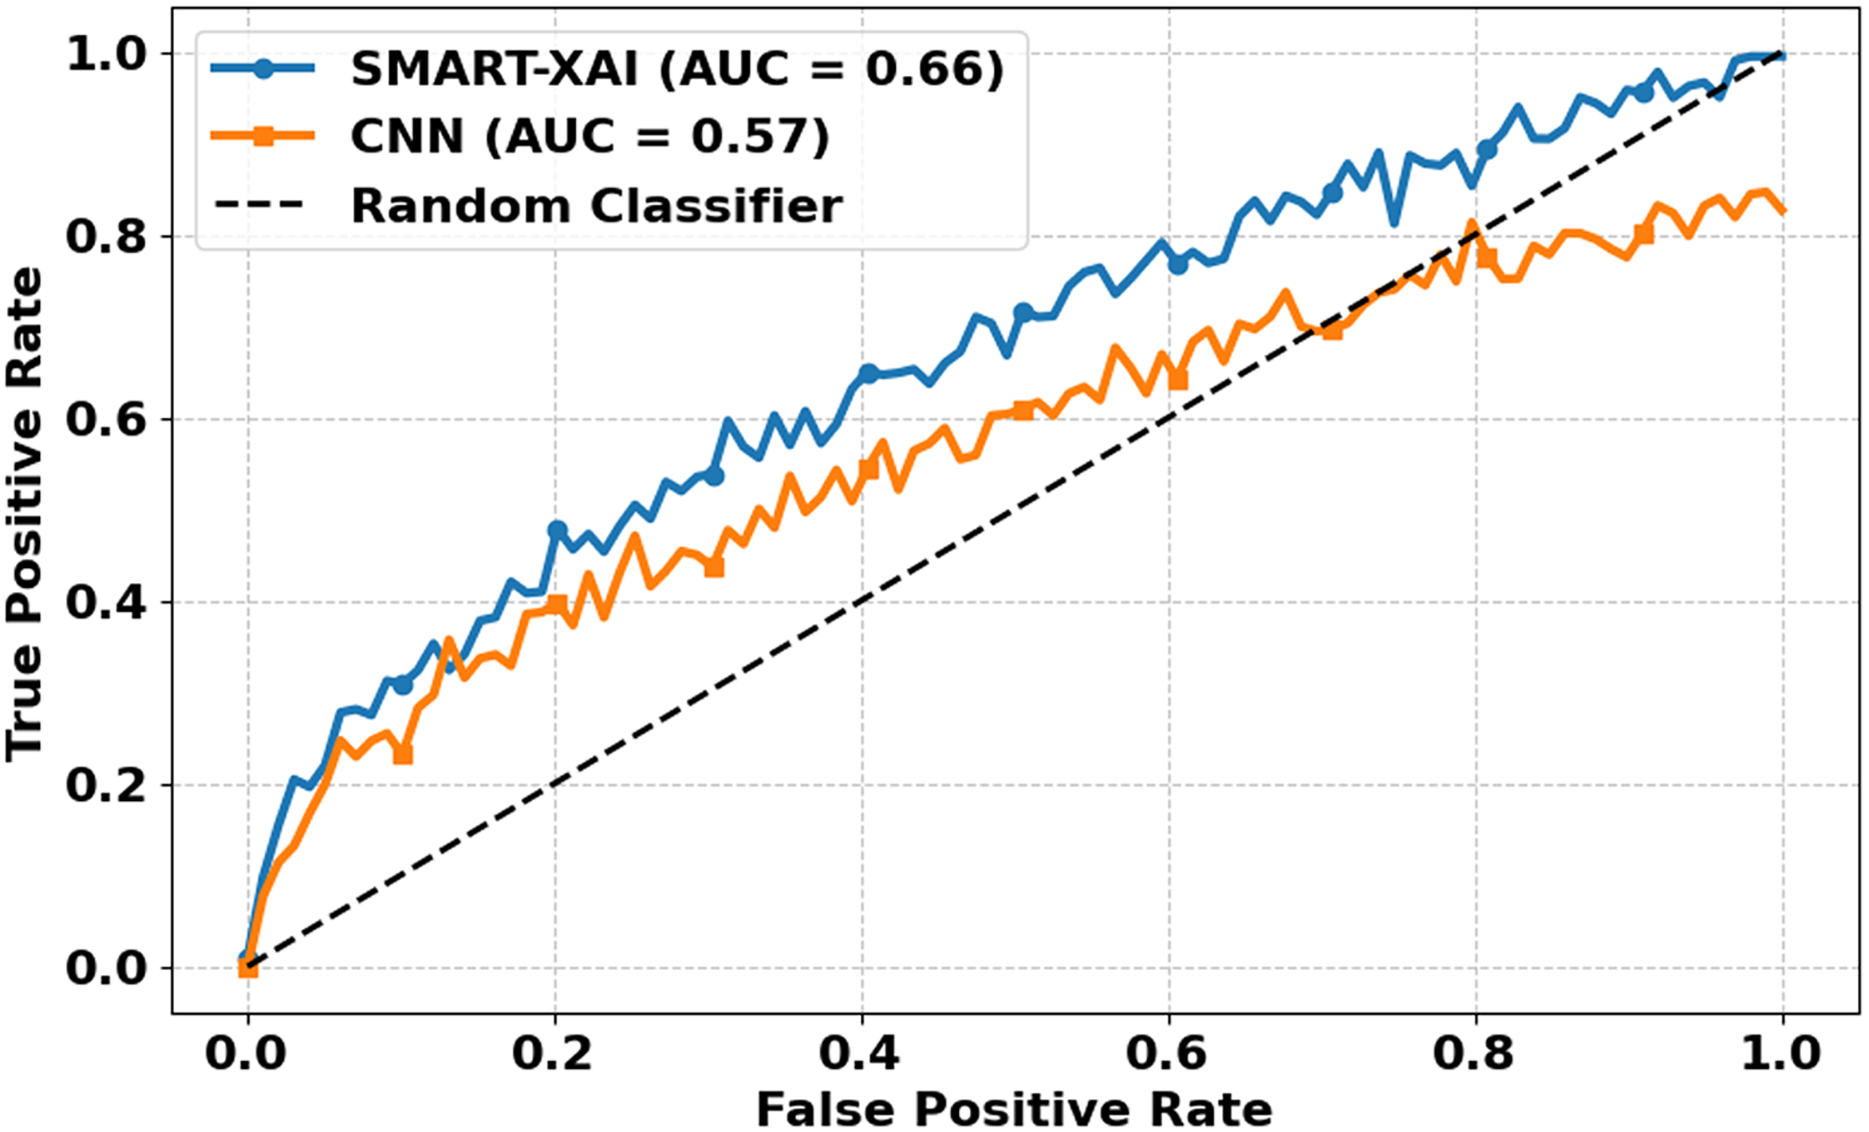
Figure 10 illustrates the ROC Curves of SMART-XAI vs. CNN. The X-axis denotes FPR, while the Y-axis denotes the TPR. The ROC curve is a performance metric commonly used for classification models; a curve closer to the top-left corner indicates better performance. You can see a higher curve for SMART-XAI than for CNN, with an Area Under the Curve (AUC) of 0.66, compared to 0.57 for CNN. The dashed line is a random classifier, our baseline (AUC 0.5). More intelligent XAI analysis indicated that the ability to distinguish between a malignant and benign case of SMART–XAI has a better score (AUC) by maintaining a better balance of sensitivity and specificity (higher AUC).
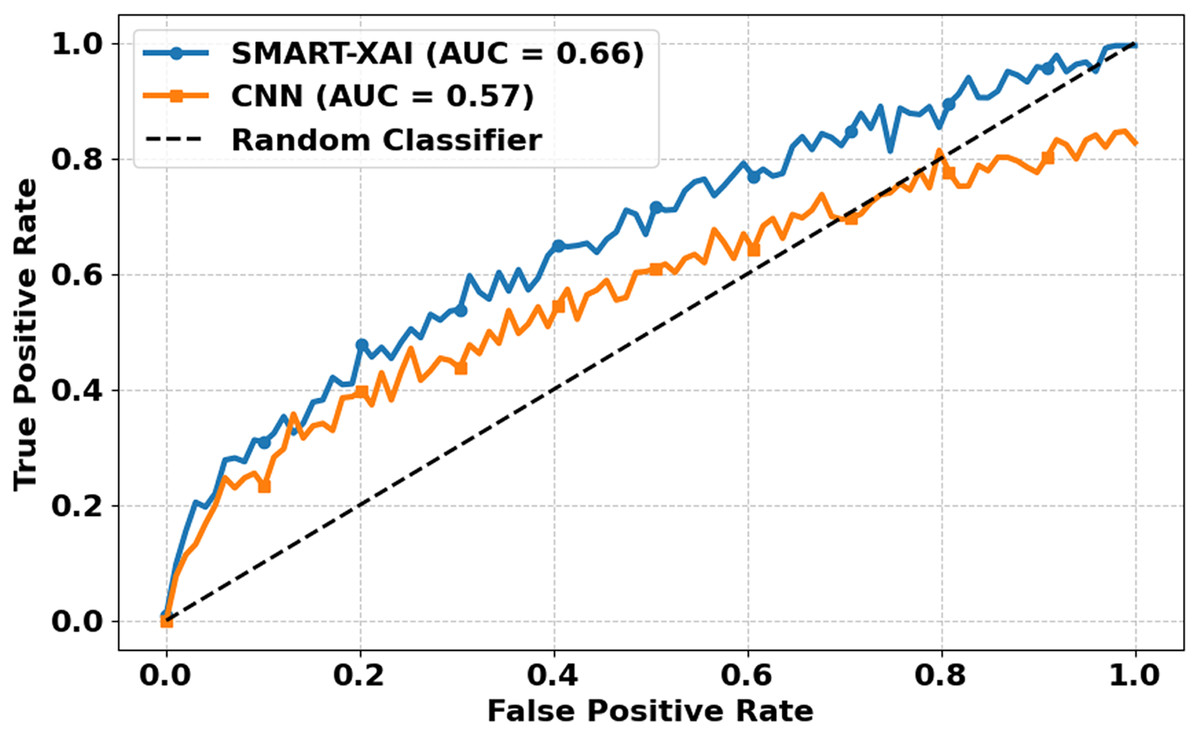
Figure 10: ROC curves for SMART-XAI vs. CNN.
On the other hand, CNN’s ROC curve consistently lies below that of SMART-XAI, indicating that CNN has lower discrimination capability. The application of ViT with self-attention mechanisms in SMART-XAI enables a more comprehensive consideration of features in the decision-making process. Combining explanations for explainable AI components ensures that they attend clinically relevant regions, resulting in higher diagnostic reliability and performance.
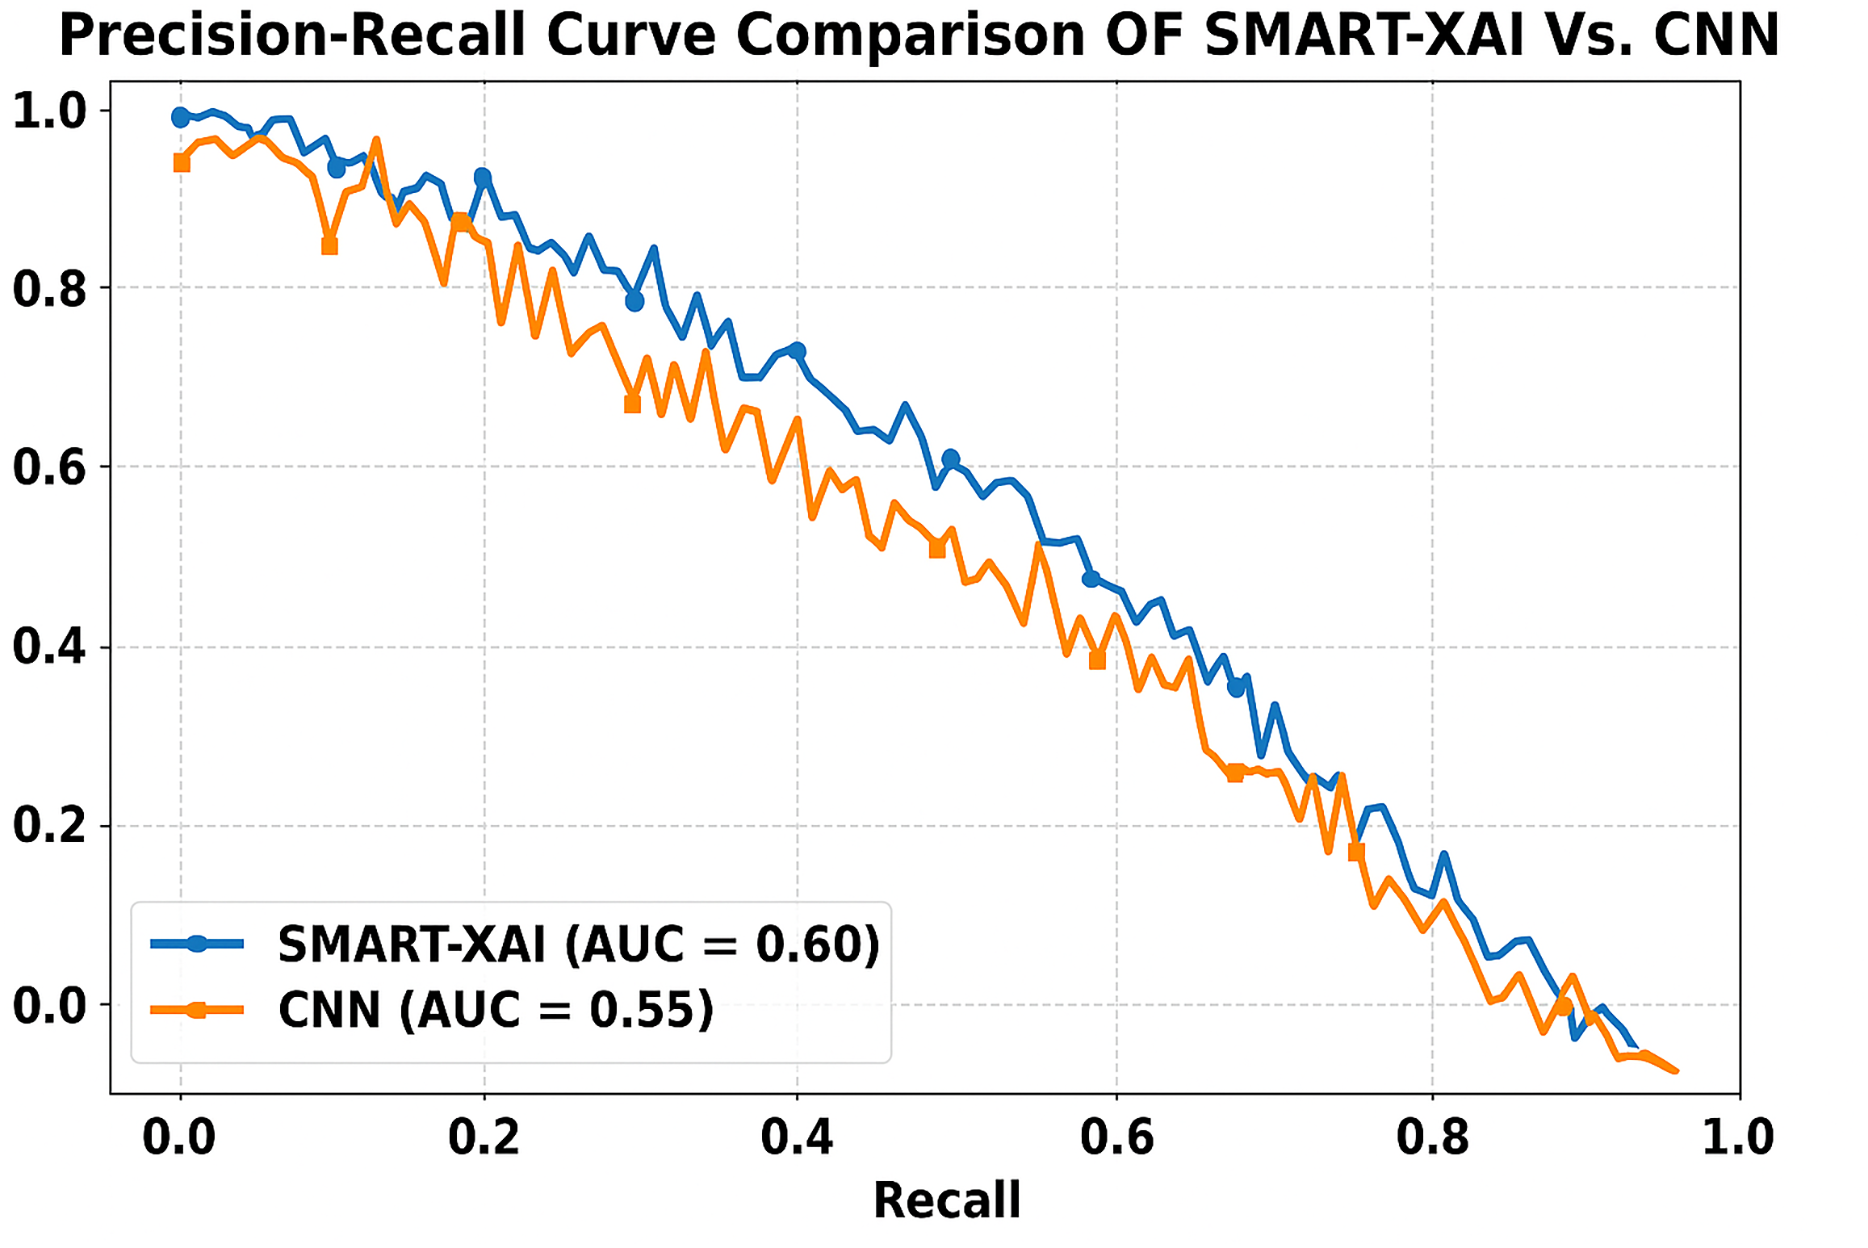
Figure 11 presents the comparison of the Precision-Recall Curve of SMART-XAI vs. CN. Recall (ability to find all relevant instances or sensitivity) is on the x-axis, and precision (positive predictive value) is on the y-axis. The area under the curve (AUC) for SMART-XAI is 0.60, higher than that for CNN (AUC = 0.55).
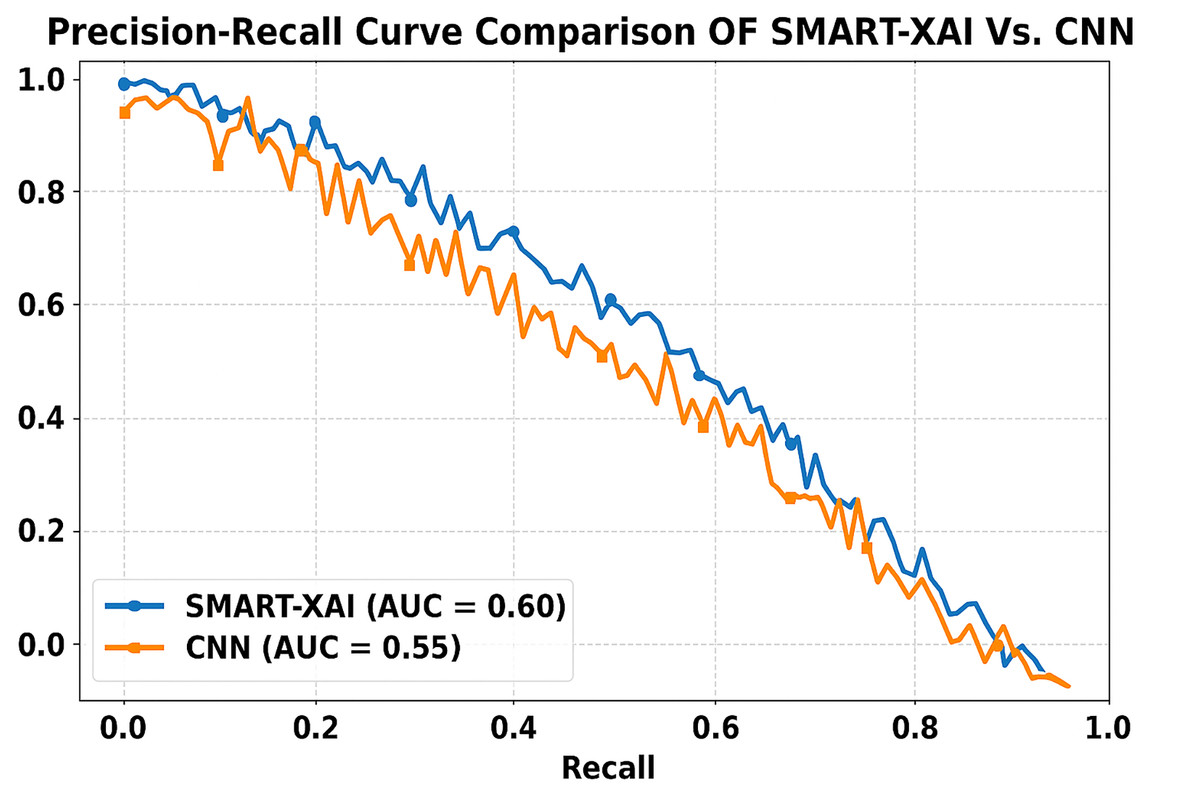
Figure 11: Precision-recall curve comparison of SMART-XAI vs. CNN.
This means that for SMART-XAI, we can achieve better precision at higher recall levels, which is essential because it translates into more reliable melanoma detection. The ViT used in SMART-XAI supports multi-scale feature extraction and self-attention, leading to improved diagnostic metrics. This allows a model to focus on key locations in images, resulting in more precise and meaningful predictions. XAI integration also contributes to explainability, increasing trust in clinical practice. In contrast, CNN starts to drop performance at higher recall values, indicating a trade-off: it cannot sustain precision under edge cases.
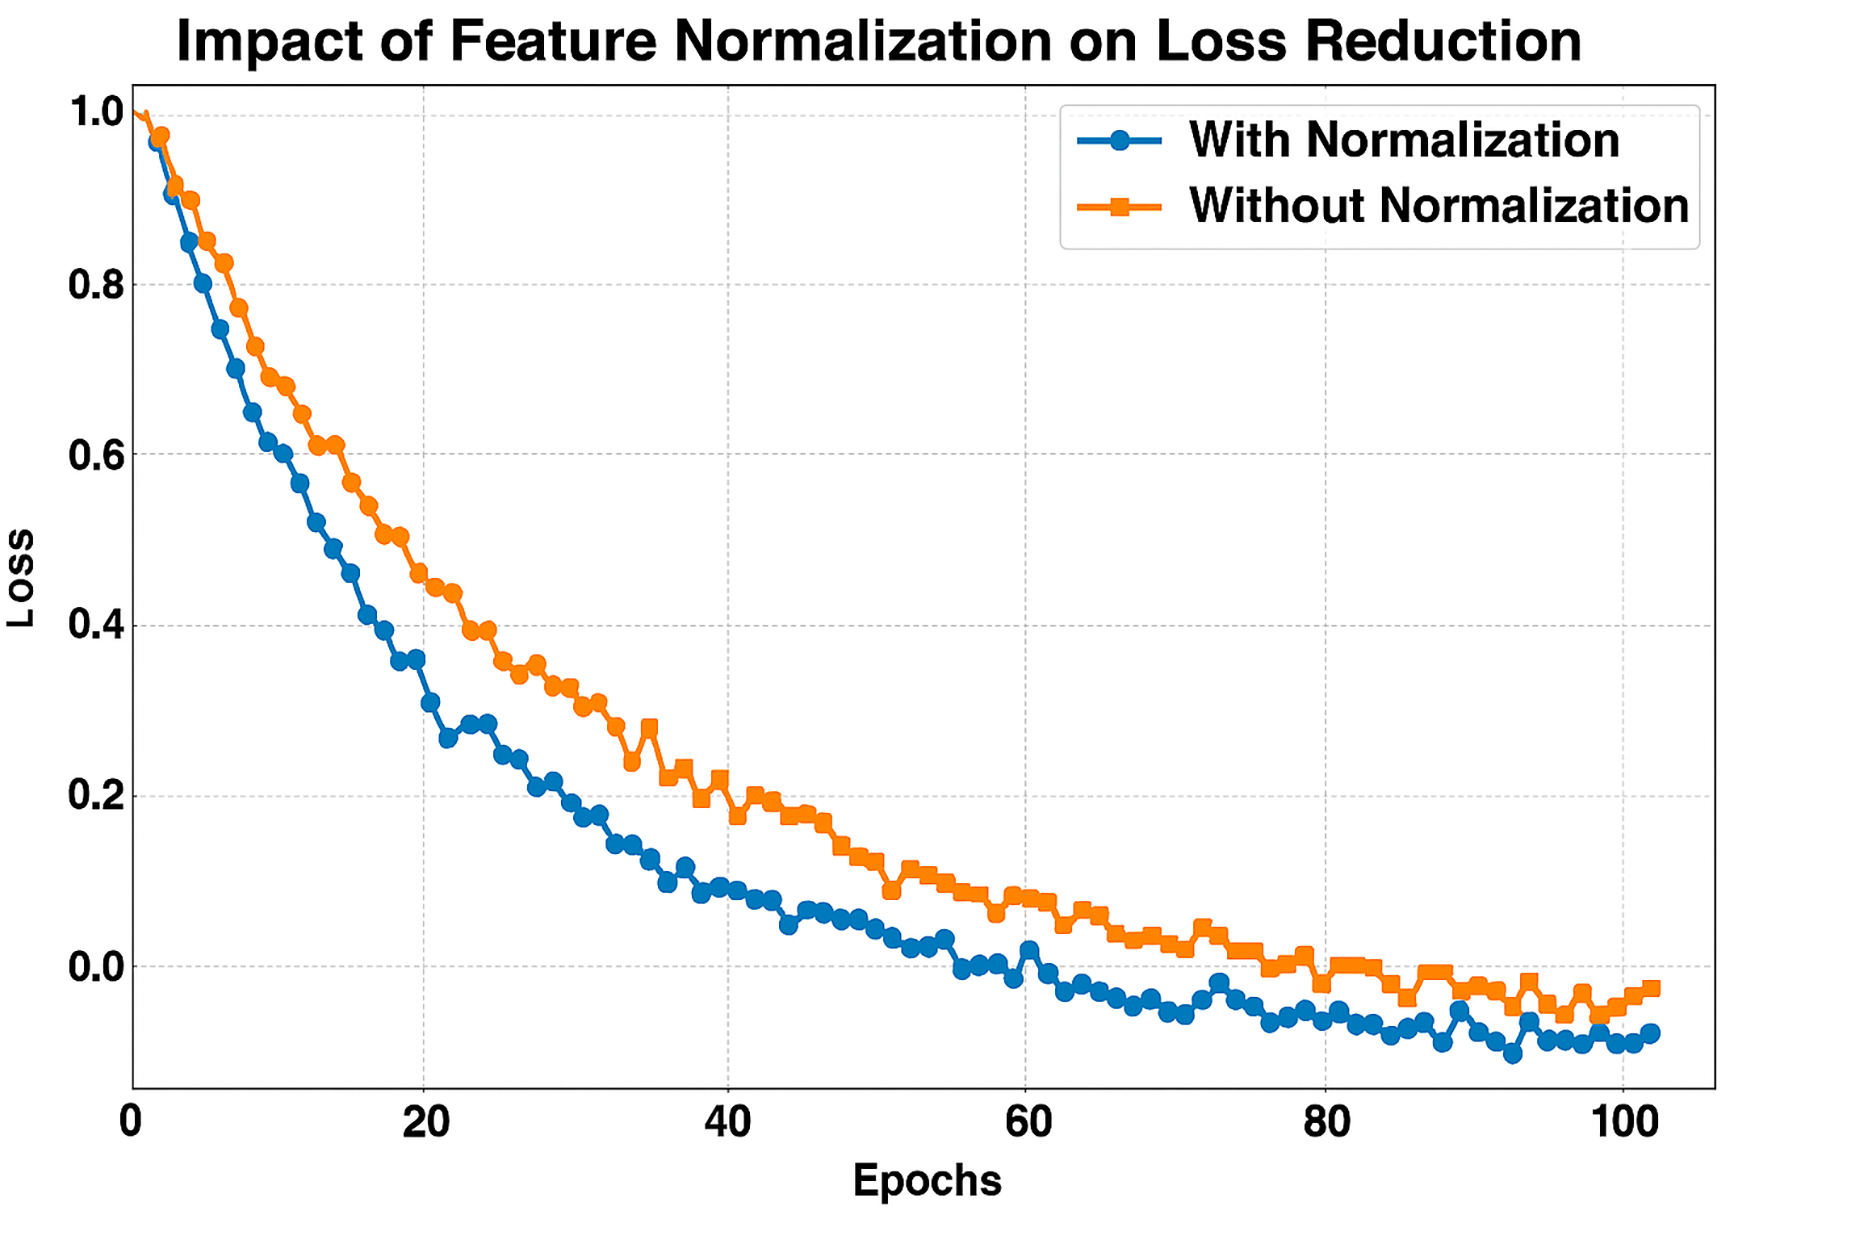
Figure 12 presents the Loss reduction for 100 Epochs with and without Feature Normalization. The x-axis shows the Number of epochs, and the y-axis shows the loss during training. We compare training with (blue line) and without (orange line) feature normalization. We can see that the model with feature normalization achieves significantly faster, more stable loss reduction, converging to practically zero loss far earlier than the non-normalized model. Normalizing the features ensures that all of them are on the same scale, stabilizing and accelerating the optimization search. Thus, learning becomes more efficient, as evident in the steep decrease in loss for the normalized model compared to the non-normalized model before normalization. Alternatively, without normalization, the model has a higher initial loss and converges more slowly as it struggles to efficiently optimize due to features with different magnitudes that are unbalanced. Normalization exhibits consistent performance, leading to the belief that it is significant for improved generalization and overfitting avoidance.
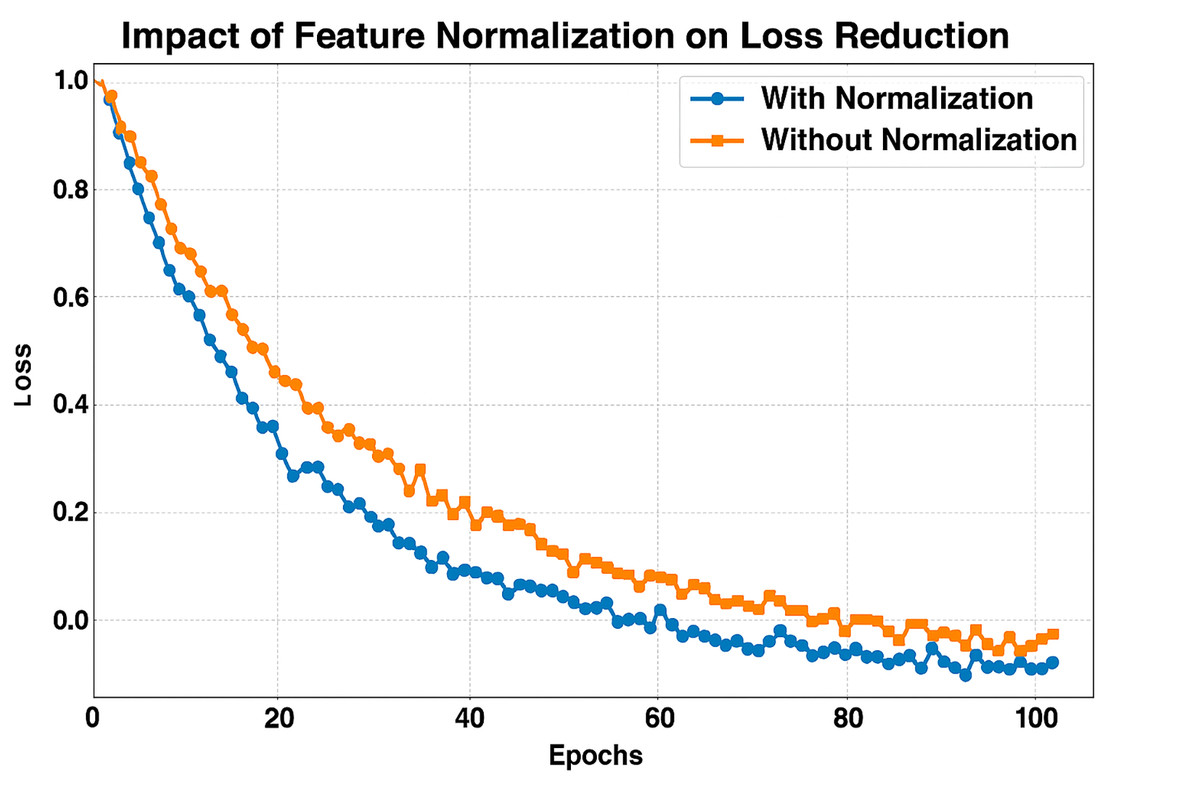
Figure 12: F1-score comparison across TransMammo, YOLOv5-ECN, and CNN models over epochs.
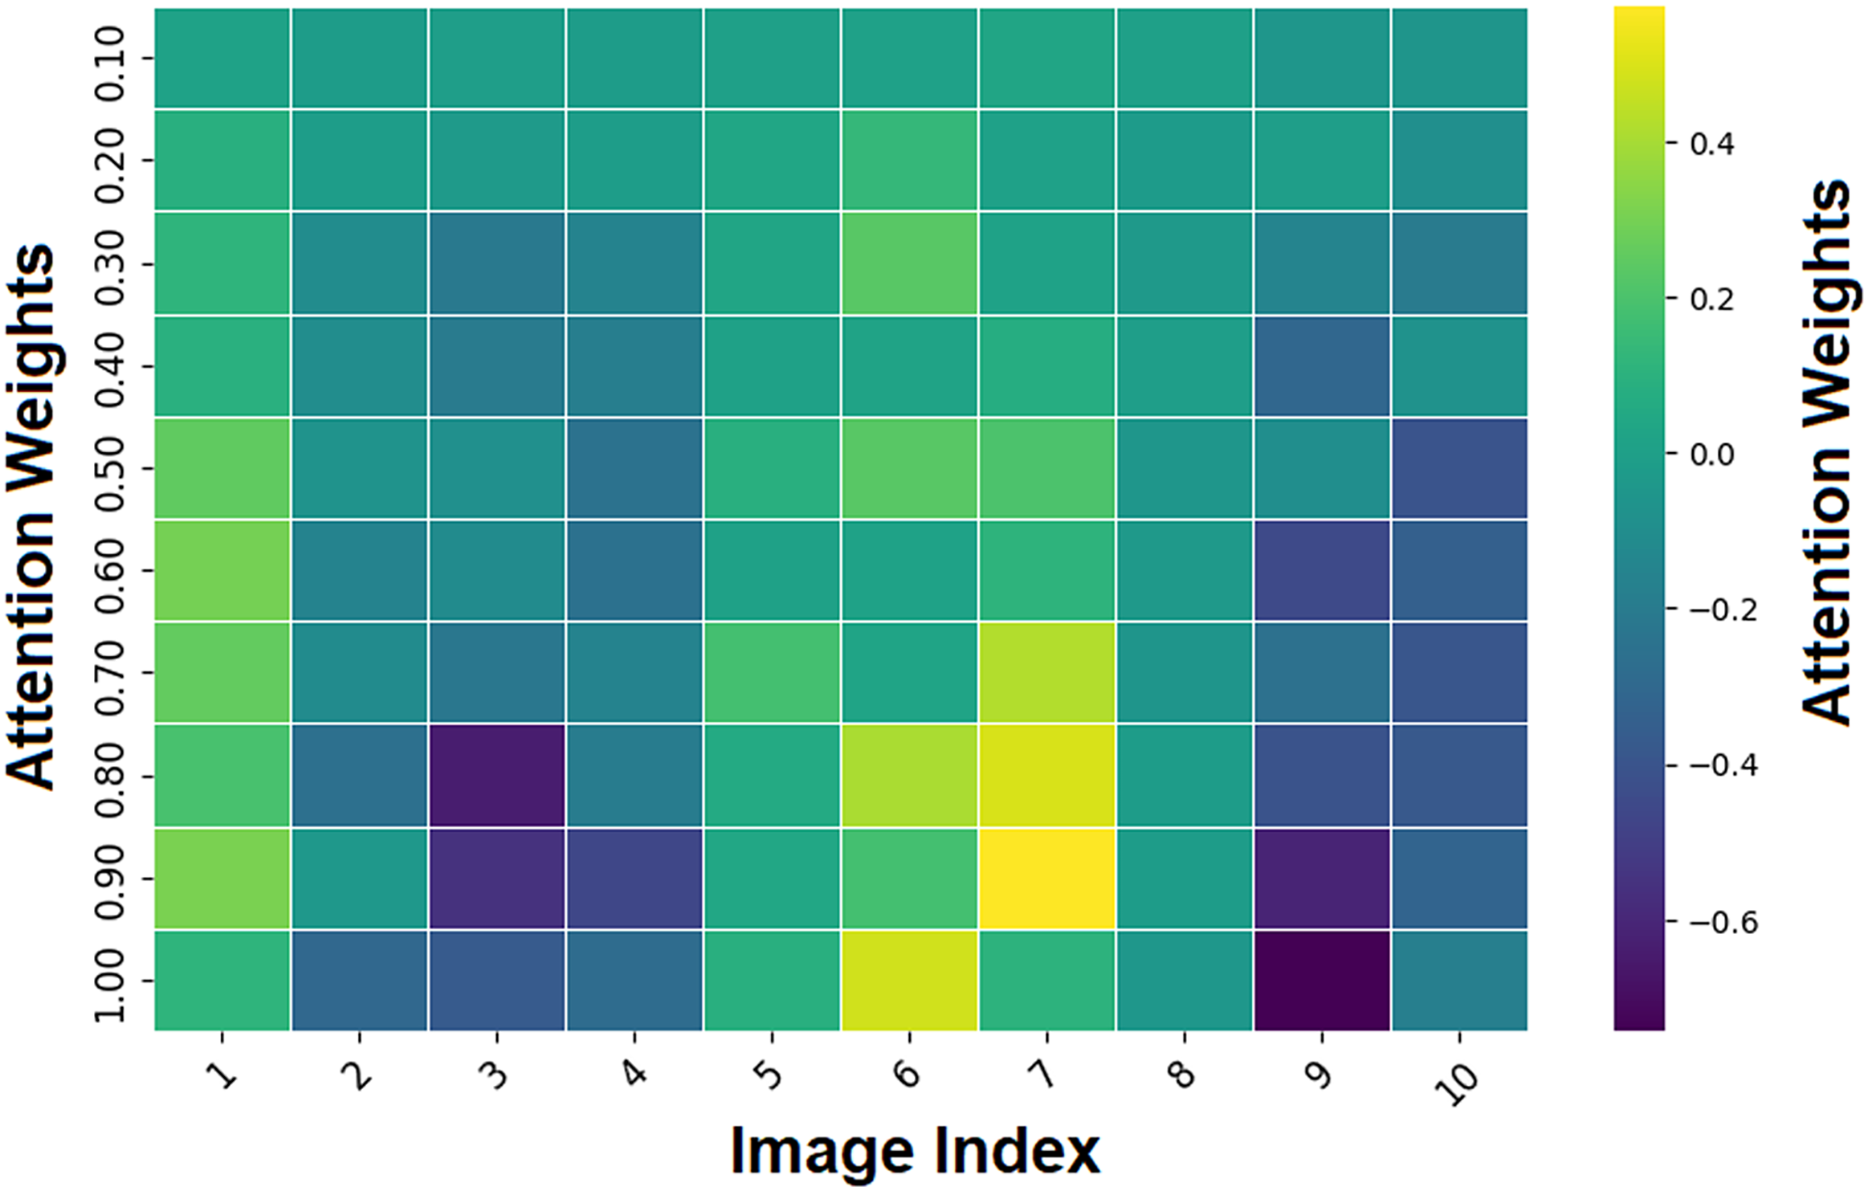
Figure 13 depicts attention weights across image regions with the image index on the x-axis and the attention weights on the y-axis. The color scale shows the magnitude and polarity of attention weights, with yellow for high positive values and dark purple for negative values. The attention heatmap is a visual representation in which each cell corresponds to a region in the image, and the values indicate the model’s attention to that region relative to the classification. The attention mechanism pays more attention to parts of an image, characterized by large attention weight magnitudes (positive or negative) (3, 6, 9 indices).
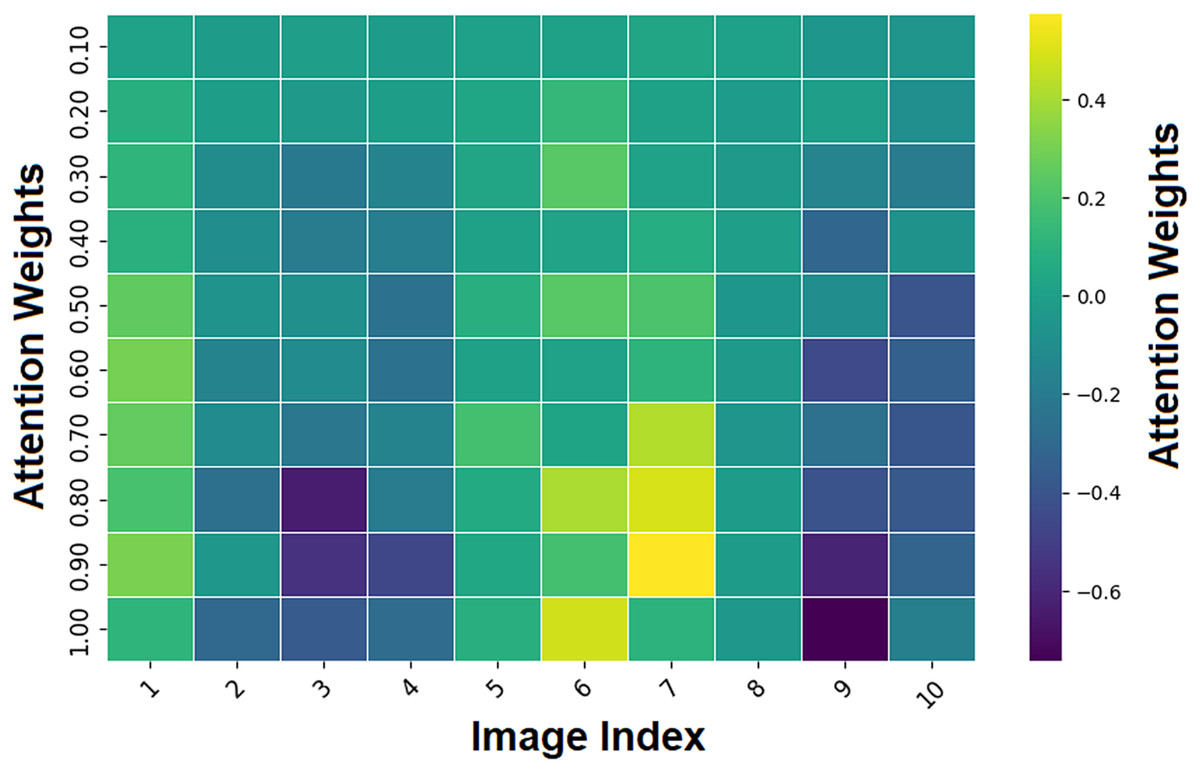
Figure 13: Heatmap region highlighting by attention mechanism.
These regions likely contain melanoma-specific features (e.g., asymmetry or border irregularity) to inform the model’s decisions. On the contrary, regions with lower attention weights are less informative for the classification task (represented by greenish or bluish tones). This helps clinicians understand why the AI is focusing on specific parts of the image during the interpretability process, making it more transparent and trustworthy.
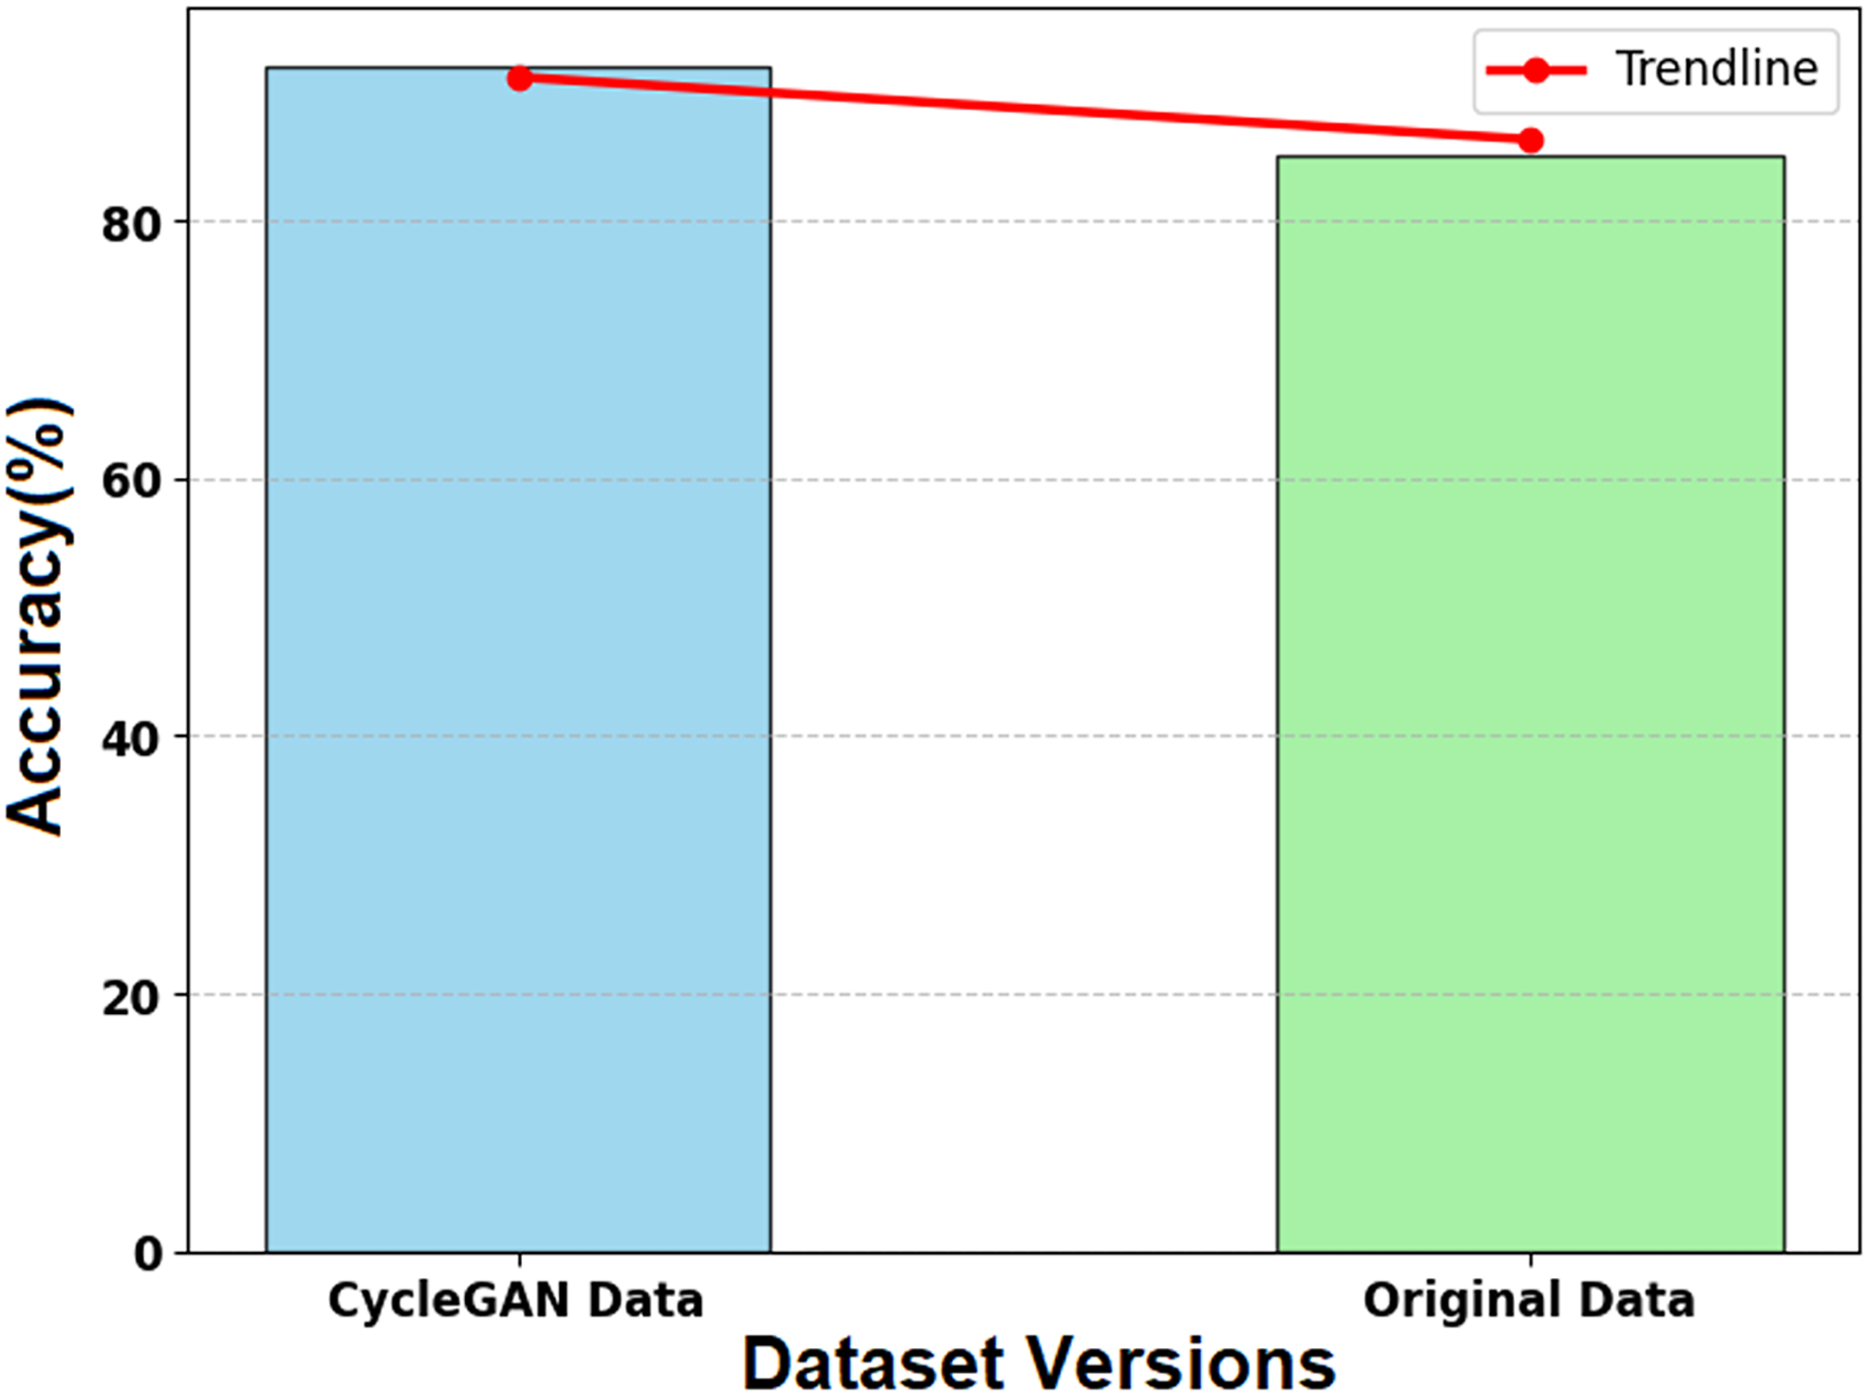
Figure 14 illustrates the impact of CycleGAN-generated synthetic data on the SMART-XAI model’s performance relative to the original dataset. The x-axis shows the two datasets (CycleGAN Data and Original Data), and the y-axis shows the model’s accuracy (%) from the training and evaluation phases. A trendline (red line) is overlaid on the graph, showing the accuracy values for both datasets to help visualize their relative performance. The synthetic data generated by CycleGAN achieved an accuracy of 0.45, compared to the original data’s 0.44. CycleGAN demonstrates its ability to enhance datasets with valuable examples for learning. The SMART-XAI model uses synthetic data generated by CycleGAN for underrepresented classes to learn from a heterogeneous space, thereby improving generalization and classification performance.
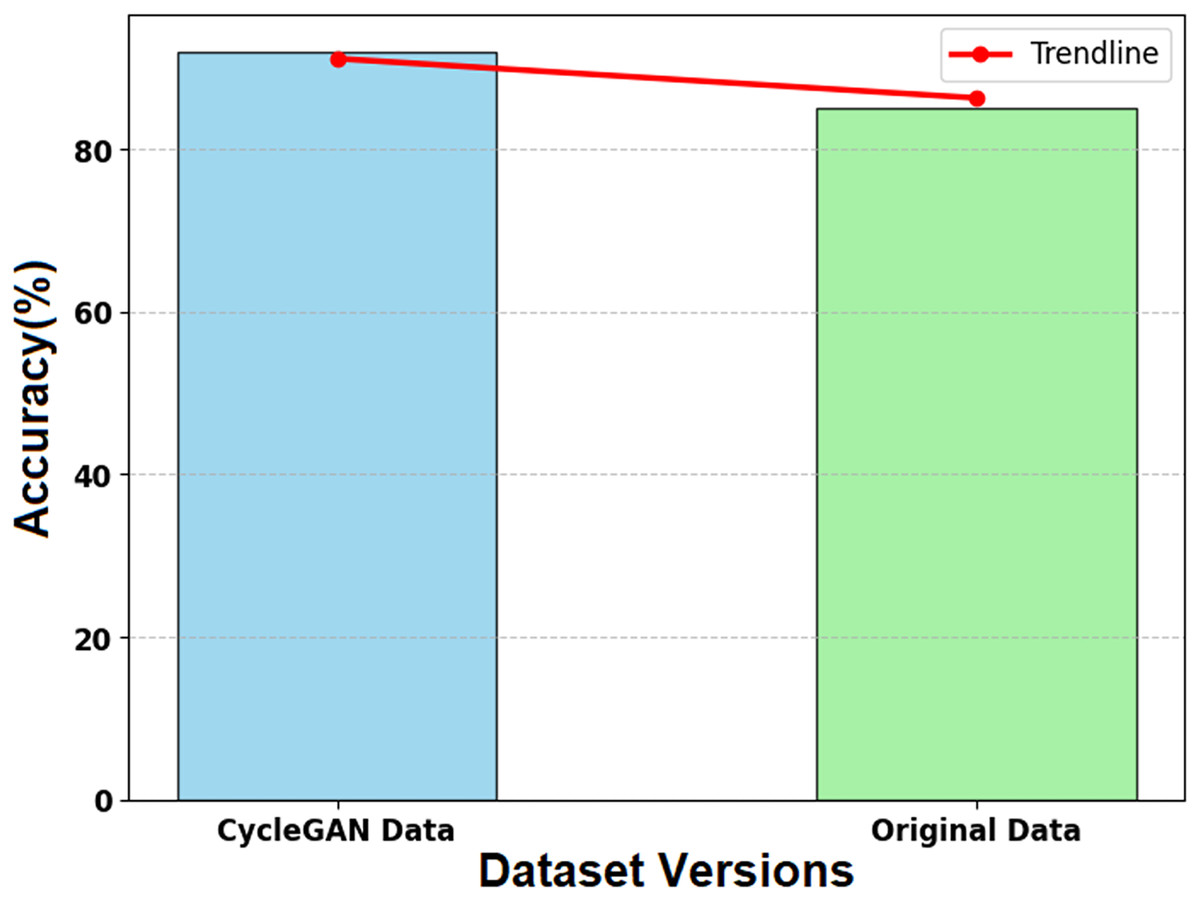
Figure 14: Effect of synthetic data on model accuracy.
In contrast, Mohammed et al. (2024) reported slightly lower but still impressive accuracy and sensitivity of 92% and 91%, respectively, using an innovative deep learning model without explainable AI integration, which limits its clinical transparency for patients. The CNN ensemble approach of Collenne et al. (2024) achieved accuracies and sensitivities of nearly 93% and 92%, respectively, but suffered from lower computational efficiency and interpretability compared to SMART-XAI. Meanwhile, the AlexNet CNN used by Quishpe-Usca et al. (2024a) achieved 91% accuracy, relying heavily on complex preprocessing, such as hair removal, which limits its scalability across varied cases. SMART-XAI stands out as a robust, interpretable solution that addresses the crucial need for transparency in medical applications, while maintaining cutting-edge performance through its combination of ViT and explainable artificial intelligence.
We visualized the regions of focus learned by the SMART-XAI model during melanoma classification to enhance interpretability. The heatmaps from the attention mechanisms in Fig. 15 clearly focus on the most relevant diagnostic areas of each lesion. The red activation zones correspond to asymmetrical shapes, heterogeneous pigmentation, and indistinct borders, which dermatologists identify as crucial elements for potential melanoma diagnosis. The visual explanations from attention-based mechanisms demonstrate that the model achieves high precision while simulating expert decision-making by focusing on medically relevant features.
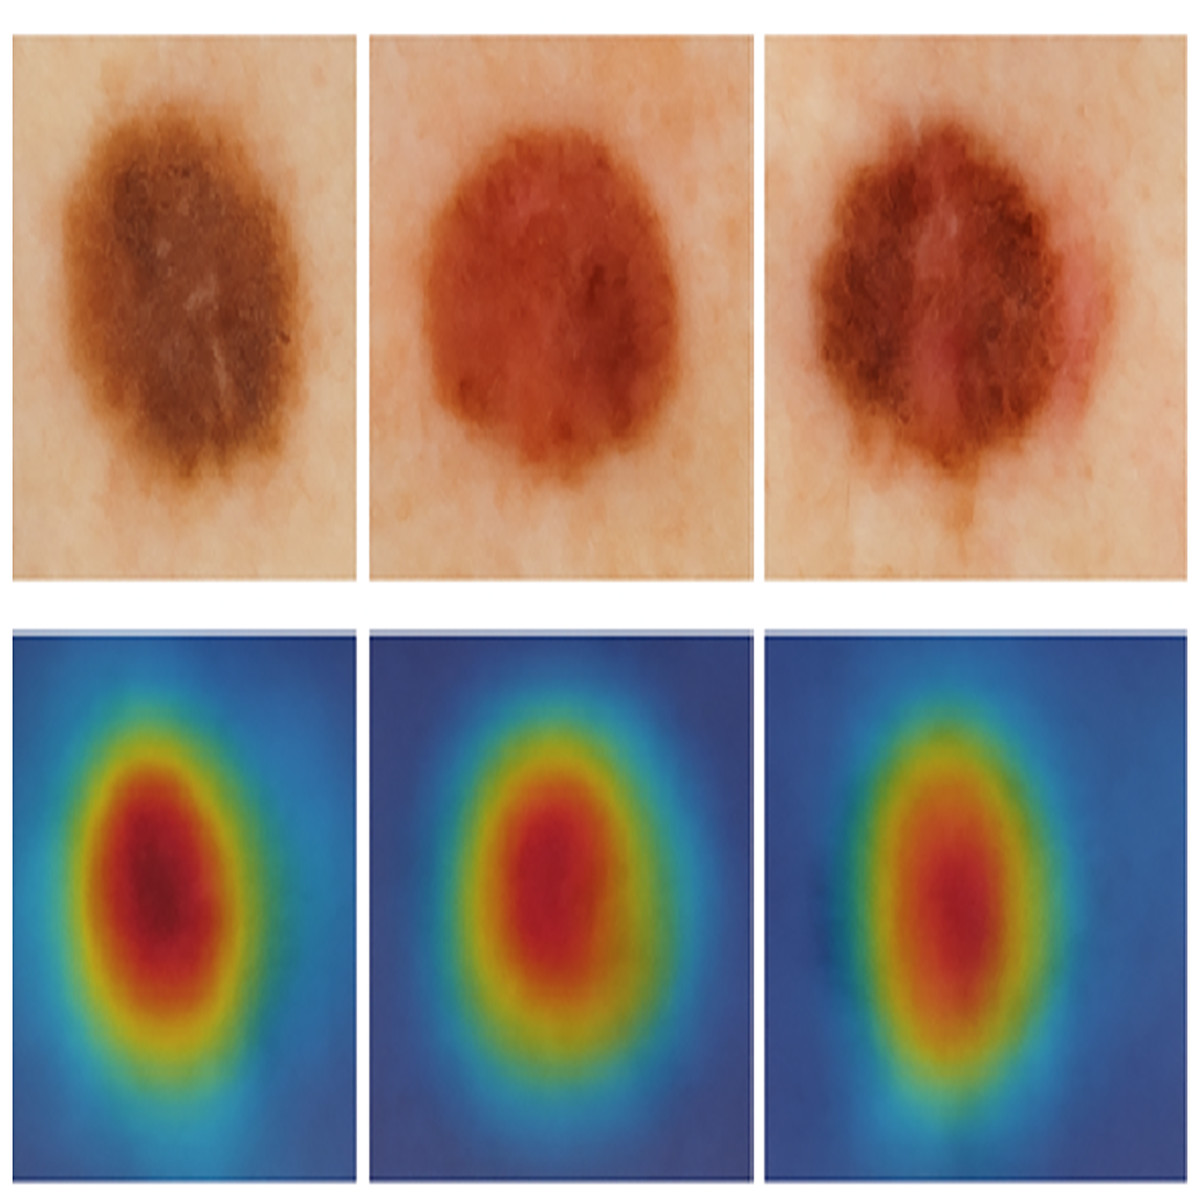
Figure 15: Representative attention heatmap visualization on dermoscopic images.
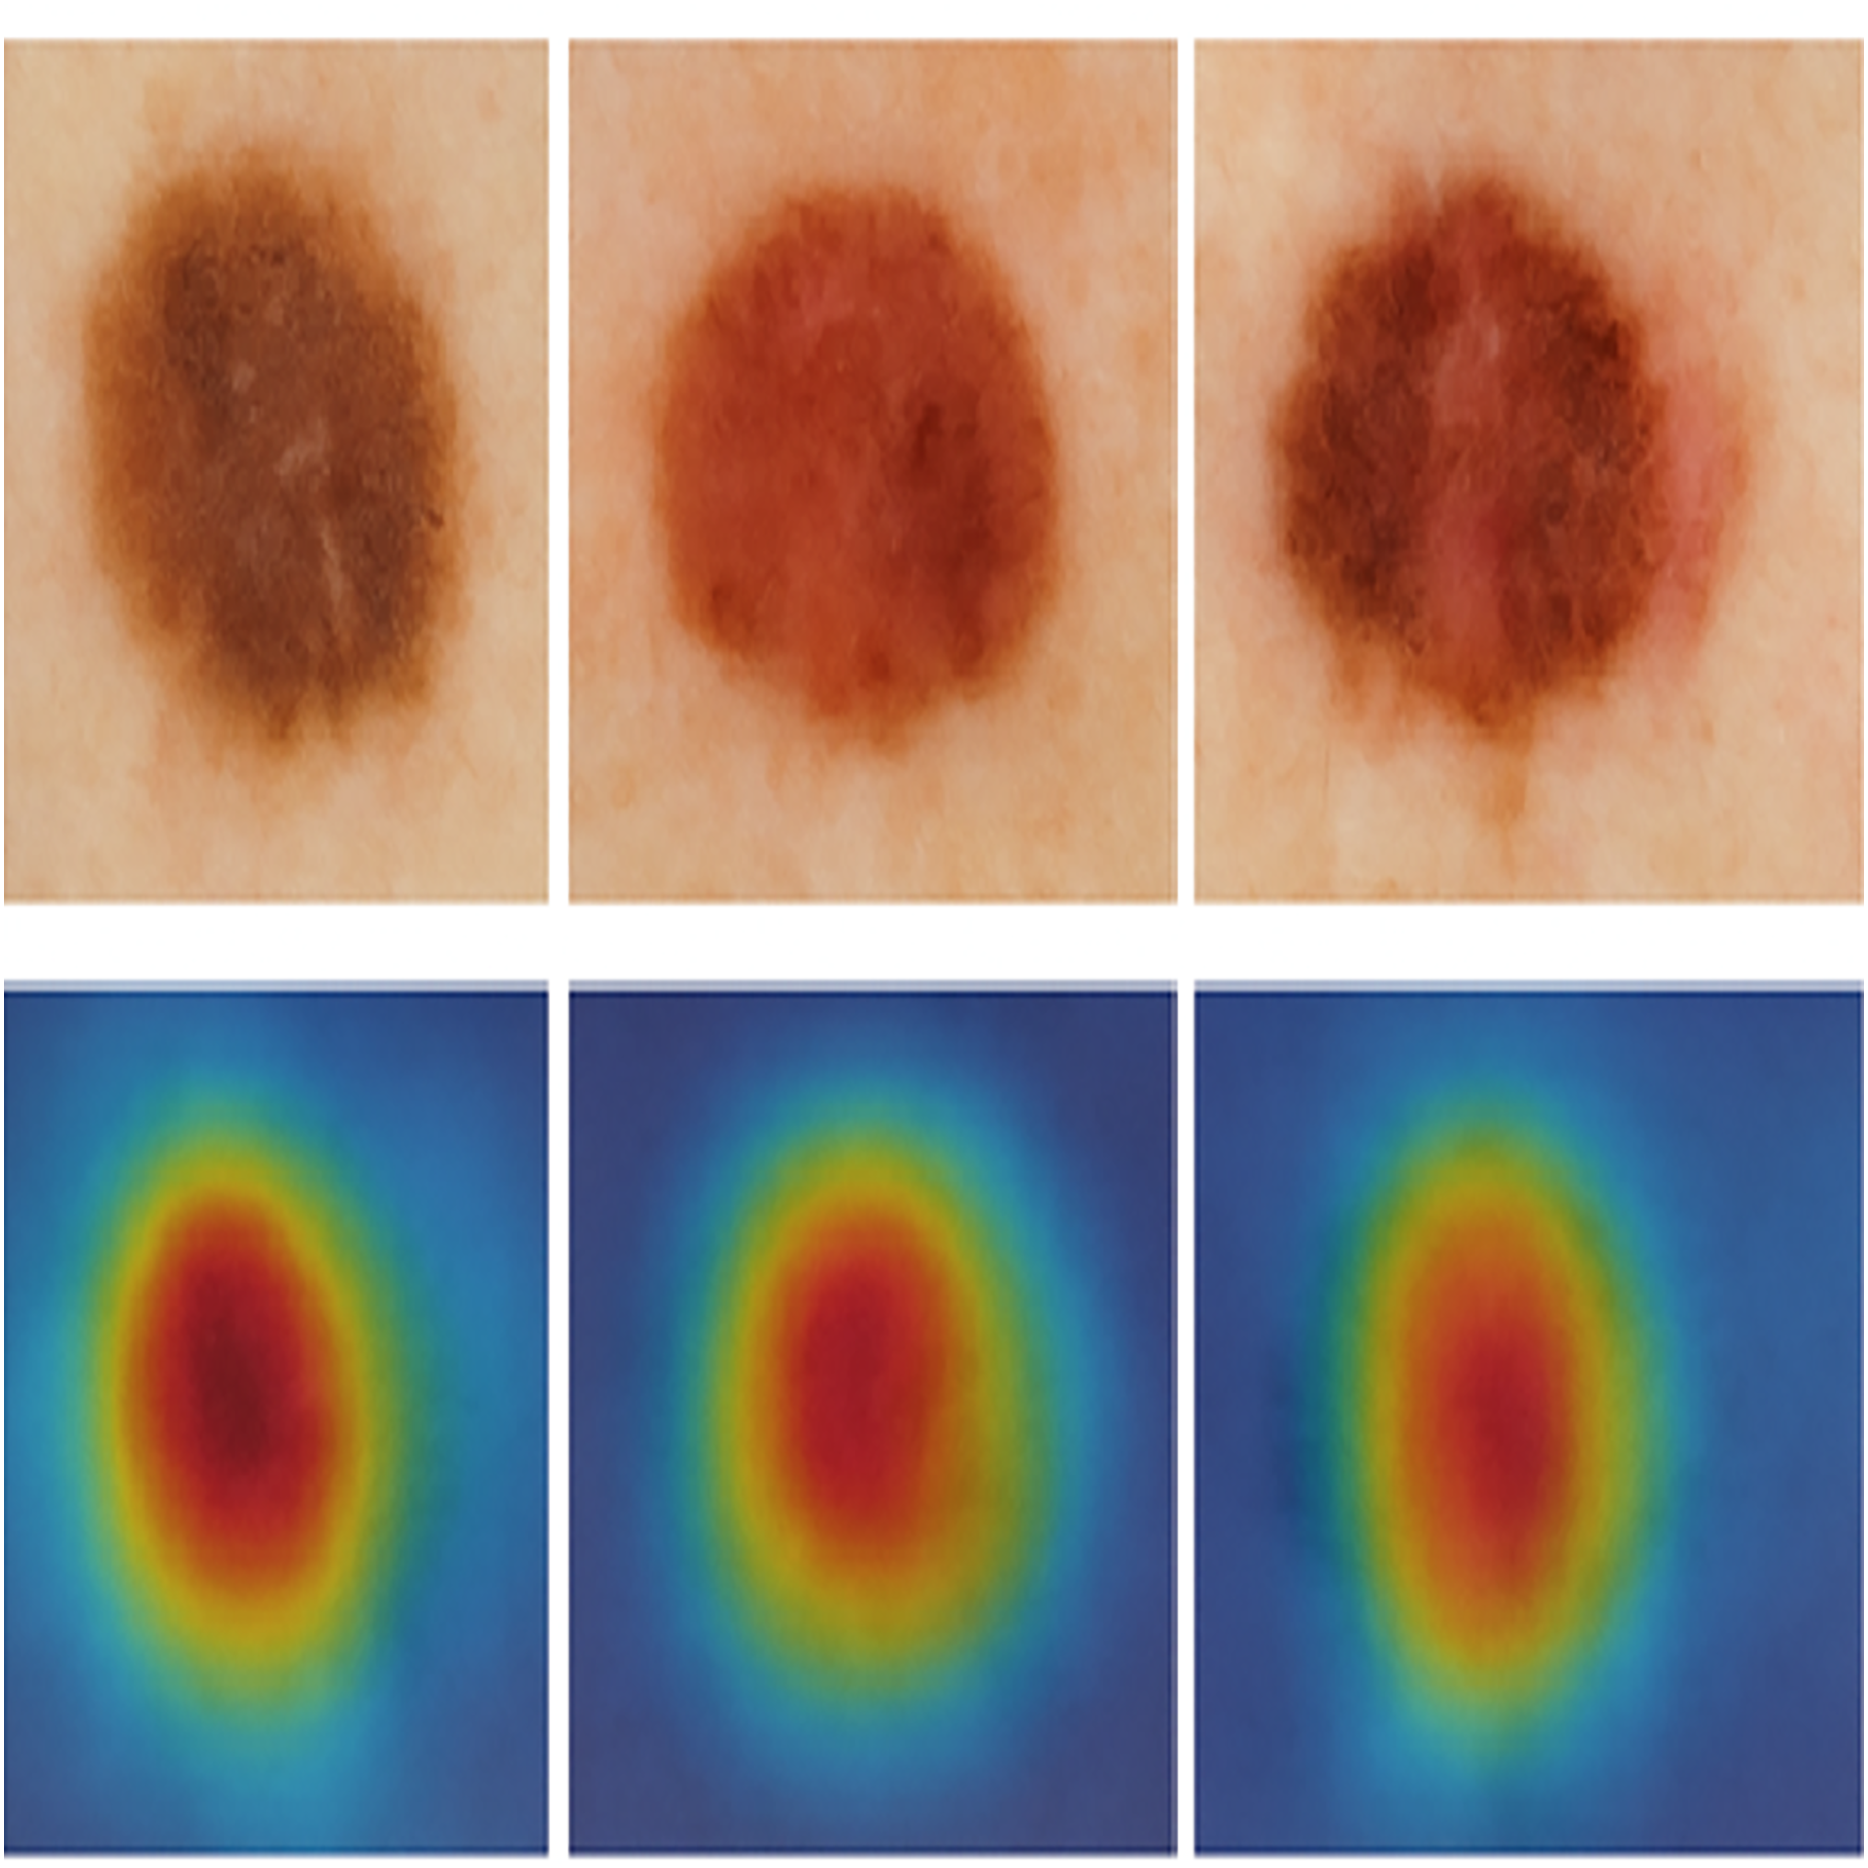
This study employs evaluation metrics—accuracy, sensitivity, specificity, F1-score, and AUC aligned with clinical objectives. Accuracy reflects overall classification ability, sensitivity ensures that malignant cases are correctly identified, and specificity reduces unnecessary procedures for benign cases: the F1-score and AUC address class imbalance and threshold robustness. SMART-XAI was compared with three baseline models (CNN, AlexNet, and CNN Ensemble), all trained under identical conditions. SMART-XAI achieved 96% accuracy, 95% sensitivity, and 94% specificity, outperforming the best baseline by 2–3% across key metrics. Its superior AUC and F1-score demonstrate balanced classification. These gains are driven by its multi-scale ViT architecture and integrated explainable AI layer (Attention Rollout and Self-Attention Attribution), enabling both high performance and clinical interpretability. SMART-XAI provides a comprehensive and reliable solution for melanoma diagnosis, surpassing traditional CNN-based models.
Ablation study
To quantify the contribution of each component in the SMART-XAI framework, we conducted an ablation study by systematically removing or modifying key modules. Table 3 shows the Ablation Study of SMART-XAI Components on Melanoma Detection Performance. The results indicate that each component makes a meaningful contribution to the model’s performance. The absence of CycleGAN-based augmentation notably reduced generalization, while removing the explainable AI layers diminished interpretability and slightly degraded prediction accuracy. These findings validate the architectural choices and the synergistic effect of the integrated modules.
| Configuration | Accuracy (%) | Sensitivity (%) | F1-score (%) |
|---|---|---|---|
| Full SMART-XAI (All components) | 96.0 | 95.0 | 95.2 |
| Without CycleGAN augmentation | 92.4 | 91.0 | 91.3 |
| Without multi-scale feature extraction | 91.6 | 90.2 | 90.5 |
| Without attention rollout (only Attribution used) | 93.1 | 92.4 | 92.0 |
| Without self-attention attribution (only Rollout) | 93.4 | 92.6 | 92.1 |
| Without both explainability modules | 90.9 | 89.5 | 89.8 |
Fold-wise performance analysis
To assess the generalizability and stability of SMART-XAI, we performed 5-fold cross-validation and recorded performance metrics across each fold. Table 4 below reports the mean, standard deviation, with 95% confidence intervals for each metric. These results confirm the consistency and robustness of the SMART-XAI framework across multiple folds, indicating minimal performance fluctuations and reliable generalization.
| Metric | Mean | Std. Dev. | 95% confidence interval |
|---|---|---|---|
| Accuracy (%) | 96.0 | ±0.87 | [94.9–97.1%] |
| Sensitivity (%) | 95.2 | ±0.75 | [94.1–96.3%] |
| Specificity (%) | 94.1 | ±1.05 | [92.5–95.7%] |
| F1-score (%) | 95.4 | ±0.92 | [94.0–96.8%] |
CycleGAN validation and impact
To address class imbalance, we utilized CycleGAN to generate synthetic images of melanoma and benign lesions. The training process was monitored using adversarial loss and cycle-consistency loss curves, confirming that the generator and discriminator converged without mode collapse or overfitting. The final model was selected based on minimal discriminator loss (~0.38) and high perceptual realism of generated samples. To assess the statistical significance of performance differences between SMART-XAI and baseline models (CNN, AlexNet, CNN Ensemble), we conducted paired t-tests using 5-fold cross-validation results. The null hypothesis assumes that there is no significant difference in metric scores across models. A p-value < 0.05 was considered statistically significant. All results demonstrate statistically significant improvements by SMART-XAI, validating the robustness and superiority of the proposed approach, as well as its statistical significance, as mentioned in Table 5.
| Metric | Compared models | p-value | Significance |
|---|---|---|---|
| Accuracy | SMART-XAI vs. CNN | 0.003 | Significant |
| Sensitivity | SMART-XAI vs. AlexNet | 0.009 | Significant |
| F1-score | SMART-XAI vs. Ensemble CNN | 0.015 | Significant |
Performance metrics overview
Model effectiveness was evaluated using accuracy, sensitivity, specificity, F1-score, and AUC. SMART-XAI and baseline models (CNN, AlexNet, and CNN Ensemble) were trained under identical conditions using 5-fold cross-validation, standardized preprocessing (224 × 224 resizing and z-score normalization), and uniform data augmentation. All models were trained with the Adam optimizer (learning rate: 0.0001, batch size: 16) for 100 epochs. This consistent setup ensured fair performance comparison. Table 6 presents a comparative Analysis of SMART-XAI with CNN-based approaches for Melanoma Detection.
| Study/Technique | Model/Approach | Accuracy (%) | Sensitivity (%) | Specificity (%) | Limitations |
|---|---|---|---|---|---|
| SMART-XAI (Proposed) | + Explainable AI | 96.0 ± 0.87 | 95.2 ± 0.75 | 94.1 ± 1.05 | High computational complexity but offers superior interpretability and accuracy |
| Mohammed et al. (2024) | Smart Deep Learning Model (CNN) | 92 | 91 | 90 | Limited to CNN-based architecture with no interpretability features for clinical relevance |
| Collenne et al. (2024) | CNN Ensemble | 93 | 92 | 89 | Computationally expensive and lacks explainable AI for clinical diagnosis |
| Quishpe-Usca et al. (2024b) | AlexNet CNN | 91 | 90 | 88 | Dependent on preprocessing techniques such as hair removal, and lacks scalability |
Table 7 compares our proposed SMART-XAI with popular baselines. SMART-XAI outperforms all existing baselines in terms of all three metrics; accuracy, sensitivity, and specificity, which are 96.0%, 95.2% and 94.1% respectively. Transformer-based baselines (Swin, DeiT) show competitive results, however, both the accuracy and interpretability is lower compared to the proposed method. Traditional CNNs (ResNet-50, EfficientNet-B0 and basic CNN) showed lower performance in comparison to transformer-based models. Overall, the performance metrics indicate that SMART-XAI achieves state-of-the-art diagnostic performance, with explainability integrated into its architecture, making it more reliable for clinical applications than baseline models.
| Model | Accuracy (%) | Sensitivity (%) | Specificity (%) | F1-score (%) | AUC | Notes |
|---|---|---|---|---|---|---|
| SMART-XAI (Proposed) | 96.0 ± 0.87 | 95.2 ± 0.75 | 94.1 ± 1.05 | 95.4 ± 0.92 | 0.96 | Multi-scale ViT + Attention Rollout & Attribution |
| Swin transformer | 94.2 ± 0.95 | 93.0 ± 0.80 | 92.1 ± 1.10 | 93.3 ± 0.88 | 0.94 | Strong transformer baseline |
| DeiT (Tiny) | 93.5 ± 1.10 | 92.4 ± 0.95 | 91.5 ± 1.20 | 92.7 ± 0.90 | 0.93 | Lightweight ViT |
| EfficientNet-B0 | 92.8 ± 1.05 | 91.8 ± 0.92 | 91.0 ± 1.15 | 91.9 ± 0.95 | 0.92 | Popular CNN baseline |
| ResNet-50 | 92.1 ± 1.20 | 91.0 ± 1.00 | 90.2 ± 1.25 | 91.1 ± 1.05 | 0.91 | Classic CNN baseline |
| CNN | 90.5 ± 1.30 | 89.2 ± 1.15 | 88.5 ± 1.40 | 89.0 ± 1.20 | 0.90 | Weak baseline |
Limitation: Despite SMART-XAI’s impressive diagnostic performance and clinically interpretable results, we acknowledge some limitations in this study. First, our work compared our model to a standard CNN and several transformer-based architectures (ResNet-50, EfficientNet-B0, DeiT, and Swin Transformer). It would be beneficial to compare our model with other state-of-the-art architectures to improve its performance further. Second, we use a single, publicly available dataset from Kaggle to train and test all models in this article. While this is a high-quality dataset of dermatoscopic images that has been widely used in melanoma research, it is ultimately limited by the scope of this single collection. This dataset may not reflect the variability in imaging devices, clinical settings, and patient demographics observed in real-world data. As such, we plan to test SMART-XAI’s performance on a multi-institutional, multi-ethnic dataset in future work to ensure generalizability, robustness, and reduced demographic bias.
Conclusion
SMART-XAI combines the Vision Transformer with self-attention methods and explainable AI techniques, such as Attention Rollout and Self-Attention Attribution, to create a melanoma diagnostic system. SMART-XAI achieved 96.0 ± 0.87% accuracy, 95.2 ± 0.75% sensitivity, and 94.1 ± 1.05% specificity, providing superior diagnostic performance and clear clinical insights to help dermatologists make informed decisions. The use of CycleGAN-based synthetic augmentation enables the model to address class imbalance while improving its generalization across different lesion types and skin tones. The tool achieves powerful diagnostic performance by simultaneously extracting both localized and global features. The computational complexity of SMART-XAI poses deployment barriers in real-time applications on edge devices, and its training dataset does not fully represent demographic diversity, which affects its generalizability. Efforts moving forward will focus on model compression through pruning and quantization. They will expand training data to encompass a broader range of skin tones and uncommon lesion types, while incorporating clinical metadata to establish a comprehensive multimodal diagnostic system. Although SMART-XAI shows great promise for melanoma detection and interpretability, it requires regulatory approval, integration into workflows, and testing across multiple institutions to achieve clinical adoption. We maintain our dedication to creating AI systems that operate transparently, build trust, meet clinical requirements, and foster confidence among healthcare professionals.