
A hierarchical multi-scale neural network framework for schistocyte detection in blood smears
- Published
- Accepted
- Received
- Academic Editor
- Nicole Nogoy
- Subject Areas
- Computational Biology, Artificial Intelligence, Computer Vision, Neural Networks
- Keywords
- Cell detection, Schistocytes, Medical dataset, MCS-Net, Multi-scale fusion
- Copyright
- © 2026 Luo et al.
- Licence
- This is an open access article distributed under the terms of the Creative Commons Attribution License, which permits using, remixing, and building upon the work non-commercially, as long as it is properly attributed. For attribution, the original author(s), title, publication source (PeerJ Computer Science) and either DOI or URL of the article must be cited.
- Cite this article
- 2026. A hierarchical multi-scale neural network framework for schistocyte detection in blood smears. PeerJ Computer Science 12:e3475 https://doi.org/10.7717/peerj-cs.3475
Abstract
Peripheral blood smear morphological analysis remains fundamental in hematological disease diagnosis. However, existing publicly available medical datasets lack annotations for schistocytes—pivotal biomarkers integral for disease diagnosis, severity stratification, and monitoring therapeutic responsiveness. To address this gap, we constructed the first standardized blood smear dataset containing six cell types: erythrocytes, platelets, granulocytes, lymphocytes, monocytes, and schistocytes. This dataset comprises 6,150 high-resolution, pathologist-validated images with data augmentation, establishing a benchmark for complex morphological cell detection. To overcome multi-scale detection challenges (ranging from 2 to 50 μm), we propose a hierarchical multi-scale neural network framework (MCS-Net) integrating three innovations: (1) A multi-scale convolution and attention fusion module to extract local details and global semantic features; (2) A Cross-Scale Dynamic interaction detection head to mitigate high-level feature suppression of micro-targets while maintaining adequate receptive fields for large targets, enabling adaptive feature fusion in dense cell clusters; (3) A single-head self-attention mechanism to optimize leukocyte nuclear-cytoplasmic correlations, complemented by normalized Wasserstein distance for robust micro-target localization. Experiments demonstrate our framework achieves a mean average precision at 0.5 intersection-over-union (mean Average Precision (mAP)@0.5) of 0.958 ± 0.0022 on our internal dataset, surpassing the baseline by 3.9 ± 0.39%, with schistocyte detection precision reaching 90.1 ± 0.39%. The lightweight combination of the Cross-Scale Dynamic interaction detection head and normalized Wasserstein distance maintains a [email protected] of 0.946 at 102 frames per second, providing an efficient solution for real-time medical imaging analysis. This work advances early screening tools for critical conditions such as Disseminated Intravascular Coagulation and Microangiopathic Hemolytic Anemia (DIC/MAHA) and drives algorithmic innovation in blood cell subtype detection.
Introduction
The peripheral blood smear (PBS) remains an indispensable diagnostic tool in hematology due to its cost-effectiveness, accessibility, and capacity for detailed morphological analysis. Unlike automated hematology analyzers, PBS directly visualizes cellular abnormalities, such as dysplastic changes, parasitic inclusions (e.g., Plasmodium spp. in malaria), and neoplastic cells (e.g., blasts in acute leukemias), enabling rapid diagnosis of conditions ranging from thrombotic microangiopathies (schistocytes) to sickle cell disease (sickle cells) (Trampuz et al., 2003; Gallego, Ibáñez & Simó, 2016; Qiao et al., 2021). Its utility extends to resource-limited settings, where advanced technologies are unavailable, and it complements automated systems by resolving artifacts like pseudothrombocytopenia or detecting low-level parasitemia (sensitivity: 10–50 trophozoites/μL) (Van Ommen & Peters, 2012; Kapil, Sareen & Gupta, 2020). PBS also stratifies disease severity, such as quantifying deformed red blood cells (RBCs) in sickle cell anemia for therapeutic stratification or distinguishing acute myeloid leukemia (AML) from acute lymphoblastic leukemia (ALL) to guide urgent interventions (Adewoyin & Nwogoh, 2014; Park et al., 2024). Morphological features, including RBC size (microcytic/macrocytic) and hemoglobinization patterns, refine diagnostic categories in anemias, while schistocyte enumeration aids in thrombotic microangiopathy grading (More & Sugandhi, 2021; Cheng et al., 2024).
Despite its advantages, PBS has limitations, including inter-observer variability and time-intensive manual analysis, particularly in high-volume settings (Billett & Reyes Gil, 2023). While automated systems improve efficiency, they lack sensitivity for subtle dysplastic or neoplastic changes, necessitating expert review (Liu et al., 2021). Nevertheless, PBS plays a critical role in therapeutic monitoring, such as tracking parasitemia clearance in malaria, assessing chemotherapy-induced cytopenias, or validating thrombotic microangiopathy treatment efficacy through schistocyte reduction (Nateghi et al., 2019). Emerging technologies, including AI-driven image analysis (e.g., convolutional neural networks), promise to enhance reproducibility and reduce diagnostic delays by standardizing RBC and leukocyte morphology assessments (Shahzad et al., 2022; Foy et al., 2023). Future integration of PBS with point-of-care platforms and improved training protocols may further optimize its diagnostic utility, particularly in underserved regions, ensuring its continued relevance in precision hematology.
With the integration of artificial intelligence into medical image analysis, deep learning has emerged as a pivotal driver in advancing peripheral blood smear (PBS) cell detection (Litjens et al., 2017). The synergistic innovation of convolutional neural networks (CNNs) and object detection algorithms has fundamentally transformed the paradigm of PBS analysis (LeCun, Bengio & Hinton, 2015; Redmon et al., 2016). By detecting morphological features of erythrocytes, leukocytes, and platelets in blood smears, this technology enables direct insights into pathological alterations within the hematopoietic system. Both erythrocytes and leukocytes encompass diverse subtypes and abnormal morphological variants, with subtle distinctions critically informing disease diagnosis. For instance, erythrocytes may undergo shape alterations due to mechanical injury or intrinsic defects during circulation, culminating in fragmentation into irregular schistocytes. Leukocytes are categorized into granulocytes (neutrophils, eosinophils, basophils) and agranulocytes (lymphocytes, monocytes) based on cytoplasmic granularity. A marked elevation in granulocyte counts may indicate bacterial infections (e.g., pneumonia, appendicitis) (Solberg & Hellum, 1972), while decreased levels often suggest viral infections or aplastic anemia. However, current mainstream medical datasets adopt coarse-grained classifications limited to erythrocytes, leukocytes, and platelets, neglecting annotations for subtype-specific and pathological morphologies (e.g., schistocytes, neutrophils). This oversight critically restricts deep learning models from capturing clinically relevant morphological nuances essential for diagnostic accuracy (Matek et al., 2019).
In recent years, the field of blood cell detection has witnessed significant progress, with numerous deep learning-based models proposed to enhance detection accuracy and efficiency. For instance, BCRT-DETR (Chen & Wang, 2025) enables end-to-end real-time detection of multiple cell types through its dynamic alignment integrated backbone network and preserved Transformer blocks. SSW-YOLO (Sun et al., 2025b) employs Spatial-to-Depth Convolution (SPD-Conv) and Swin Transformer to optimize the detection of micro-scale cells. BC-YOLO (Yurdakul & Taşdemir, 2025) utilizes an MBConv-ECA module for lightweight design. FBDM-YOLOv8s (Sun et al., 2025a) and MCDAF-Net (Zheng et al., 2025) primarily focus on leukocyte detection: the former enhances precision through FasterNet and Bi-Level Routing Attention, while the latter improves the robustness and classification of leukocyte detection via a Multi-scale Awareness Module (AMSM) and a Cross-Deformable Convolution Module (CDCM). Although these studies have advanced the automation of blood analysis, they commonly exhibit the following limitations: (1) coarse-grained dataset annotations that overlook critical pathological cells (e.g., schistocytes); (2) insufficient capability in detecting micro-scale targets (2–50 μm) and handling morphological complexity; and (3) a suboptimal balance between real-time performance and accuracy, failing to meet high-throughput clinical requirements.
Therefore, the contributions of this study to address the current limitations in PBS cell detection are as follows:
-
(1)
Construction of the SBSD Dataset: We establish the first PBS dataset annotated with schistocytes, comprising 6,150 data-augmented cell images validated by expert pathologists. The dataset includes six cell categories: erythrocytes, granulocytes, lymphocytes, platelets, monocytes, and schistocytes, providing a standardized benchmark for detecting morphologically complex cells.
-
(2)
Multi-Scale Conv Attention Module (MSCA): A novel neural network module integrating multi-scale convolution and attention mechanisms is proposed, specifically optimized for PBS analysis. By leveraging parallel multi-branch dilated convolutions (e.g., 3 × 3 kernels with dilation rates of 1, 2, and 3), the MSCA extracts multi-scale morphological features and synergistically combines local fine-grained cellular details with global contextual features.
-
(3)
Cross-Scale Dynamic Interaction Detection Head (CSD): A Cross-Scale Dynamic interaction detection head is designed to enhance edge feature extraction and hierarchical feature interactions. This mechanism improves the discriminative power for multi-scale targets (e.g., distinguishing small fragmented erythrocytes from large-nucleated leukocytes in dense cell clusters), thereby boosting detection accuracy and robustness in crowded PBS environments.
-
(4)
Single-Head Self-Attention (SHA) and Normalized Wasserstein Distance Loss (NWD): The single-head self-attention mechanism optimizes small-target localization, while the normalized Wasserstein distance loss function addresses dense cell separation challenges by minimizing distributional discrepancies between predicted and ground-truth bounding boxes.
-
(5)
Superior Performance of MCS-Net: Our proposed MCS-Net model achieves state-of-the-art performance on the SBSD dataset, demonstrating marked improvement in mean average precision compared to baseline detection models. This advancement effectively resolves the morphological complexity and data scarcity issues in schistocyte detection, offering a reliable tool for early screening of disseminated intravascular coagulation (DIC) and hemolytic anemias.
Materials and Methods
Current research on cell detection
Existing blood smear datasets generally suffer from coarse-grained annotations. The widely used BCCD dataset, as a common benchmark, only annotates three categories: erythrocytes, leukocytes, and platelets, lacking differentiation between pathological cells (e.g., schistocytes) and leukocyte subtypes (e.g., neutrophils). Gavas & Olpadkar (2021) investigated deep convolutional neural network (CNN)-based classification for peripheral blood cells using the PBC dataset, which contains 12 leukocyte categories but remains insufficient for erythrocyte fragment detection requirements. This limitation leads to insufficient sensitivity of existing models (e.g., YOLOv5-TRBC) in DIC diagnostic scenarios. Furthermore He (2024), medical datasets exhibit significant scale diversity challenges: platelet diameters (2–3 μm) are less than 1/10 of leukocytes, while current multi-scale processing methods (e.g., ASPP) lack optimization for this characteristic (Chen et al., 2017).
Deep learning-based peripheral blood smear analysis has achieved phased progress. Wang et al. (2024) proposed YOLOv10, focusing on real-time detection and edge device deployment optimization, but its static feature pyramid struggles to adapt to scale differences between platelets and leukocytes. Two-stage models like Faster R-CNN enhance localization accuracy through region proposals (Ren et al., 2017), yet computational costs hinder clinical deployment. Recent studies have begun incorporating medical prior knowledge: Zhang et al. (2014) designed a leukocyte segmentation method using color space conversion and K-means clustering, but it insufficiently models the morphological diversity of schistocytes. These methods collectively fail to address the co-existing challenges of micro-target localization and morphological complexity in pathological cell detection.
Micro-target detection remains a core challenge in blood smear analysis. Wang et al. (2022) proposed NWD to mitigate Intersection over Union (IoU)’s sensitivity to positional deviations through Gaussian modeling, but its fixed parameter c demonstrates poor adaptability in blood cell scenarios. TPH-YOLO employs multi-head prediction to enhance small-target recall in drone imagery (Zhu et al., 2021), yet redundant computations hinder real-time diagnostic requirements. In medical imaging, Pan et al. (2018) demonstrated that multi-scale fully convolutional networks achieve high-accuracy cell density map regression, but show insufficient segmentation precision for extremely dense cells (e.g., hematopoietic stem cell colonies). These studies highlight the urgent need for a lightweight dynamic architecture to achieve precise decoupling of multi-scale features in dense blood cell analysis.
The recently proposed ASF-YOLO (Kang et al., 2024a), while demonstrating proficiency in cell instance segmentation through its Scale Sequence Fusion (SSFF) and Triple Feature Encoding (TFE) modules—which focus on information channels and spatial relationships for small objects—exhibits a core design oriented toward general cell morphology. Consequently, its sensitivity and specificity for highly irregular and fragmented pathological cells (e.g., schistocytes) in blood smears remain questionable. Meanwhile, IHA-YOLO (Sheikh et al., 2025) incorporates an inter-head self-attention mechanism to enhance global representation learning, achieving high average precision and inference speed on public datasets. However, its attention mechanism demonstrates limited generalization capability in complex hematological backgrounds, and the model continues to exhibit errors in separating dense cell clusters and localizing targets with ambiguous boundaries, thereby restricting its utility in clinical precision diagnostics. Furthermore, both MCDAF-Net and FBDM-YOLOv8s predominantly focus on leukocyte detection, showing significantly insufficient attention to critical pathological morphologies such as erythrocyte fragments and schistocytes. In summary, existing deep learning methods exhibit strong processing capabilities and broad development potential in the field of blood cell detection and classification. Despite these significant advancements, their practical implementation effectiveness and result reliability continue to face substantial challenges.
In summary, these shortcomings highlight the urgent need for the collaborative optimization of multi-scale feature extraction, pathological specificity, and computational efficiency.
This research work
Research gaps methods
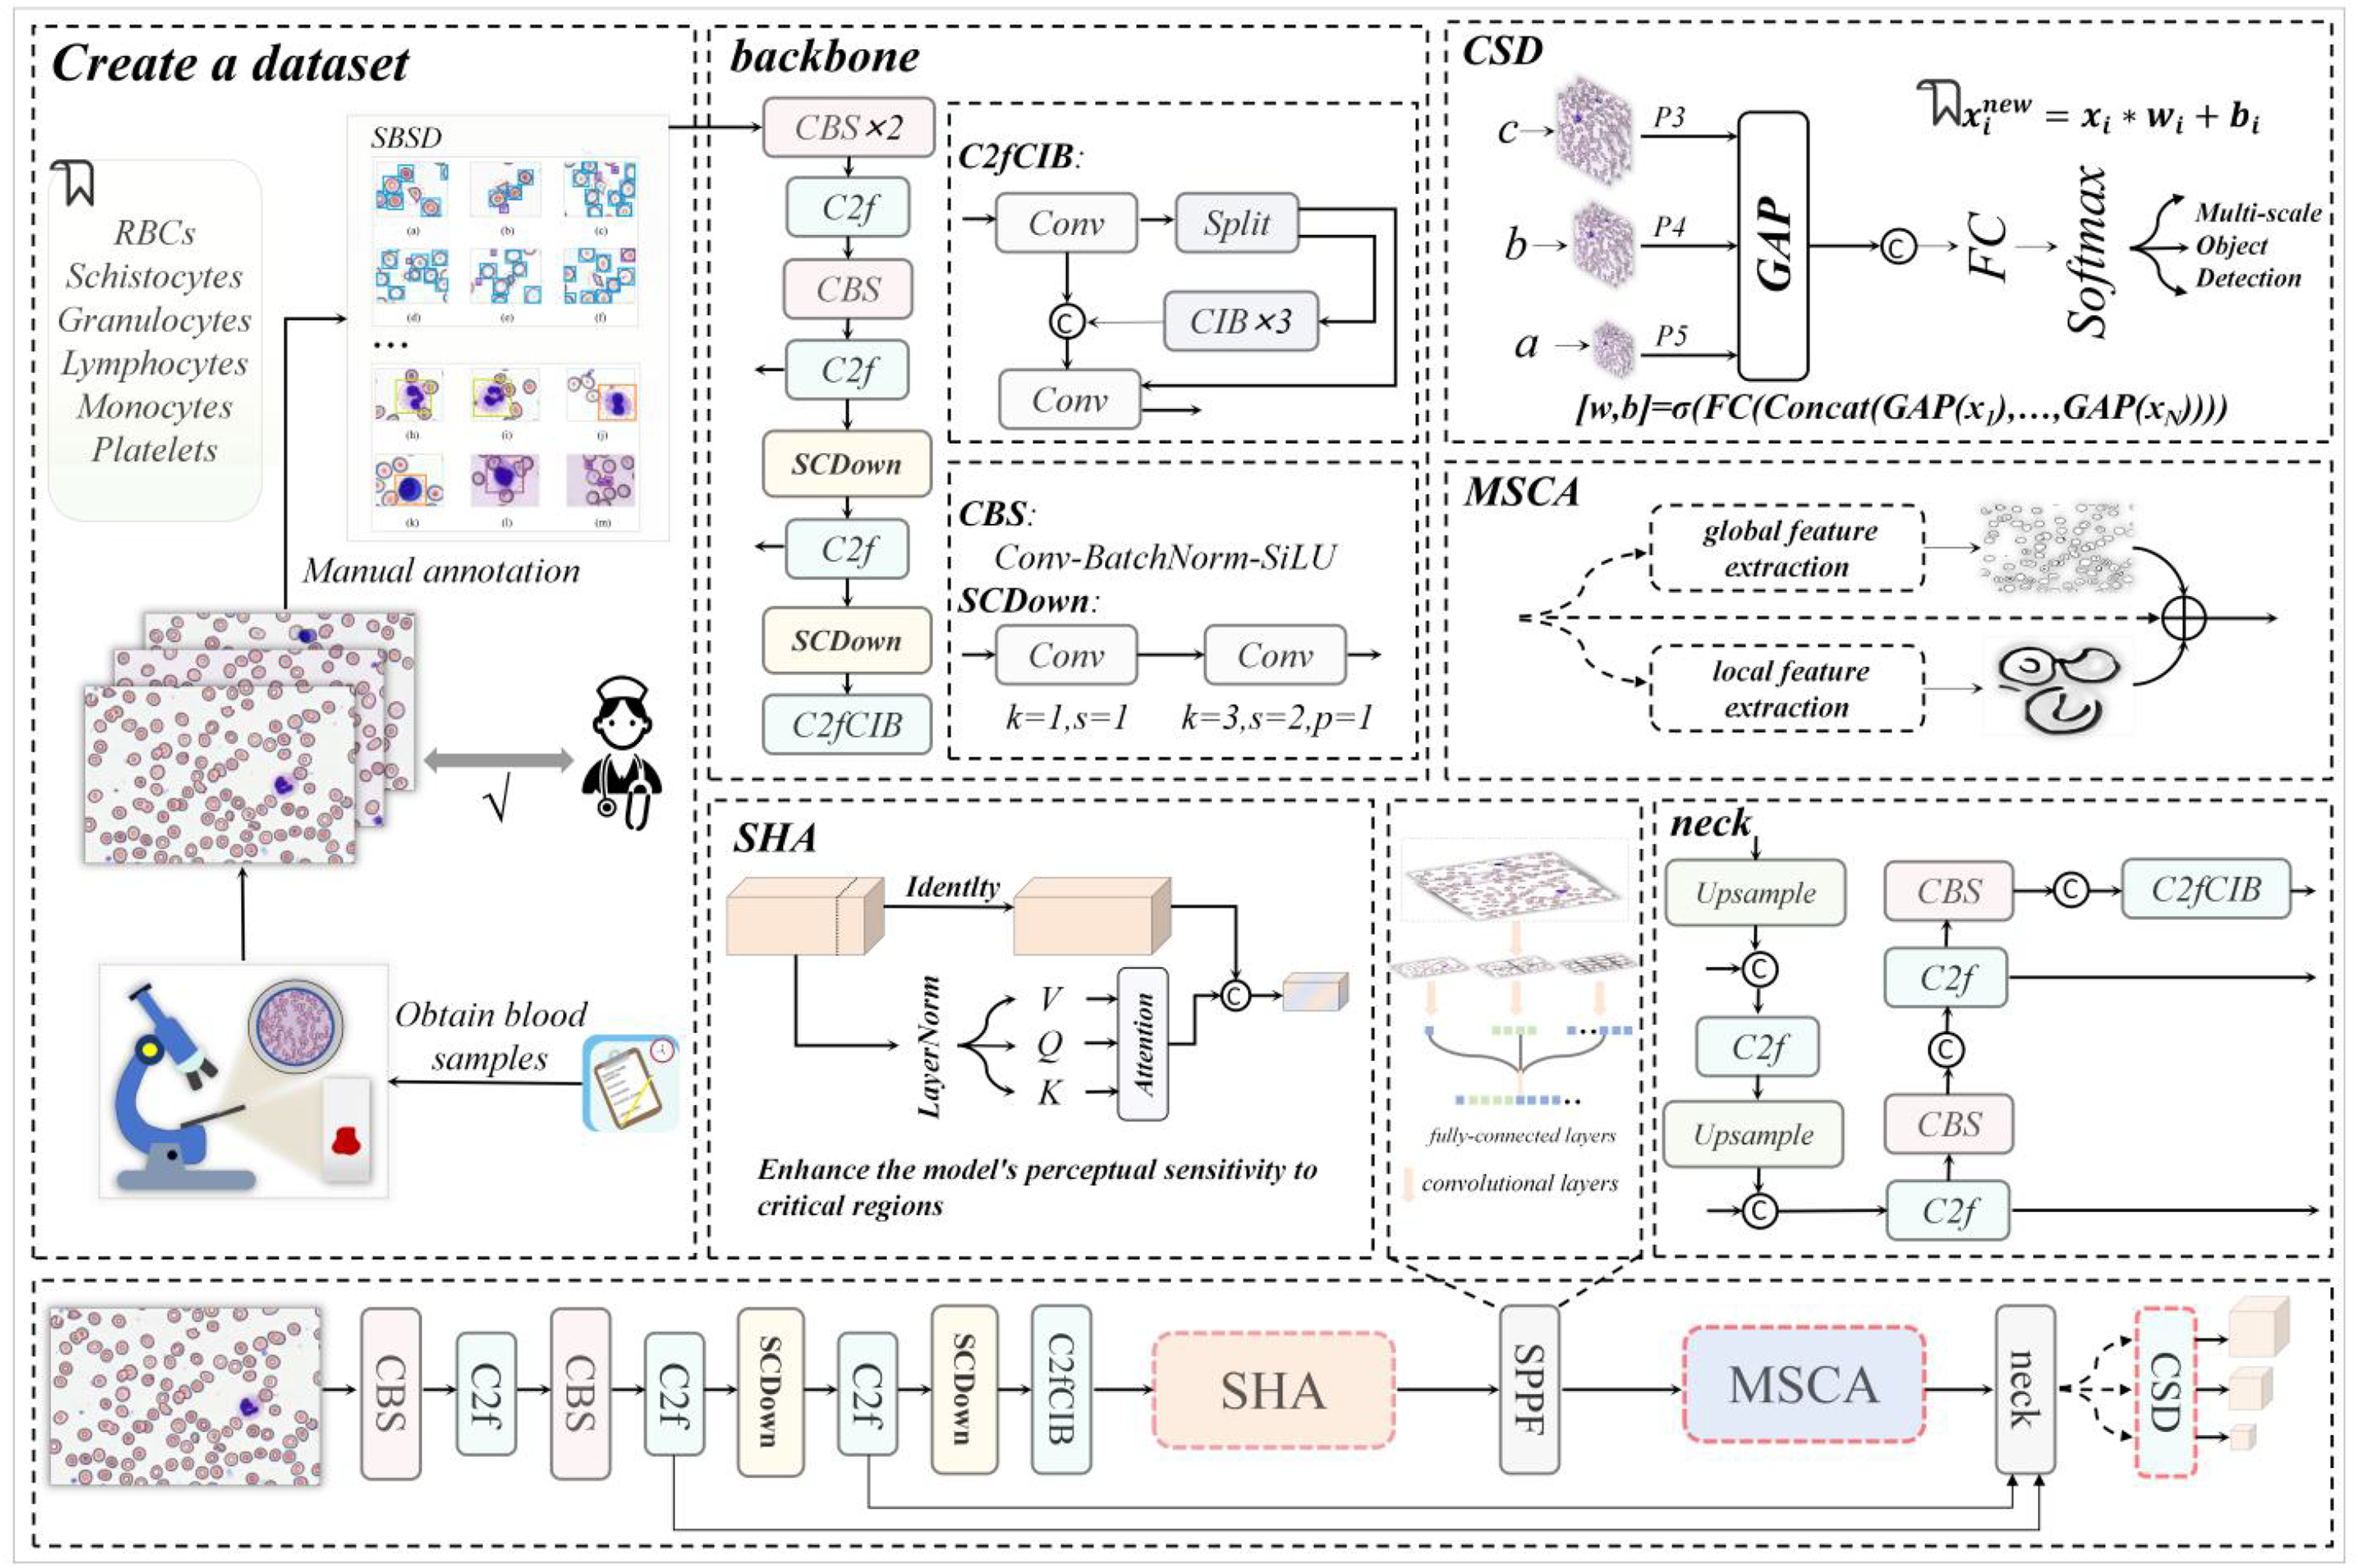
This research work is designed to directly address the pervasive limitations in current blood cell detection literature, which include: (1) coarse-grained dataset annotations that overlook critical pathological cells (e.g., schistocytes); (2) inadequate handling of micro-scale targets (2–50 μm) and morphological complexity; and (3) suboptimal trade-offs between real-time performance and accuracy. As illustrated in Fig. 1, our workflow begins with a collaboration with medical institutions to collect high-quality blood smear images, followed by the construction of the first comprehensive dataset (SBSD) containing six cell categories—erythrocytes, platelets, granulocytes, lymphocytes, monocytes, and schistocytes—through manual annotation and pathological expert verification. This dataset directly fills the annotation gap by providing fine-grained labels for pathological cells, enabling robust model training.
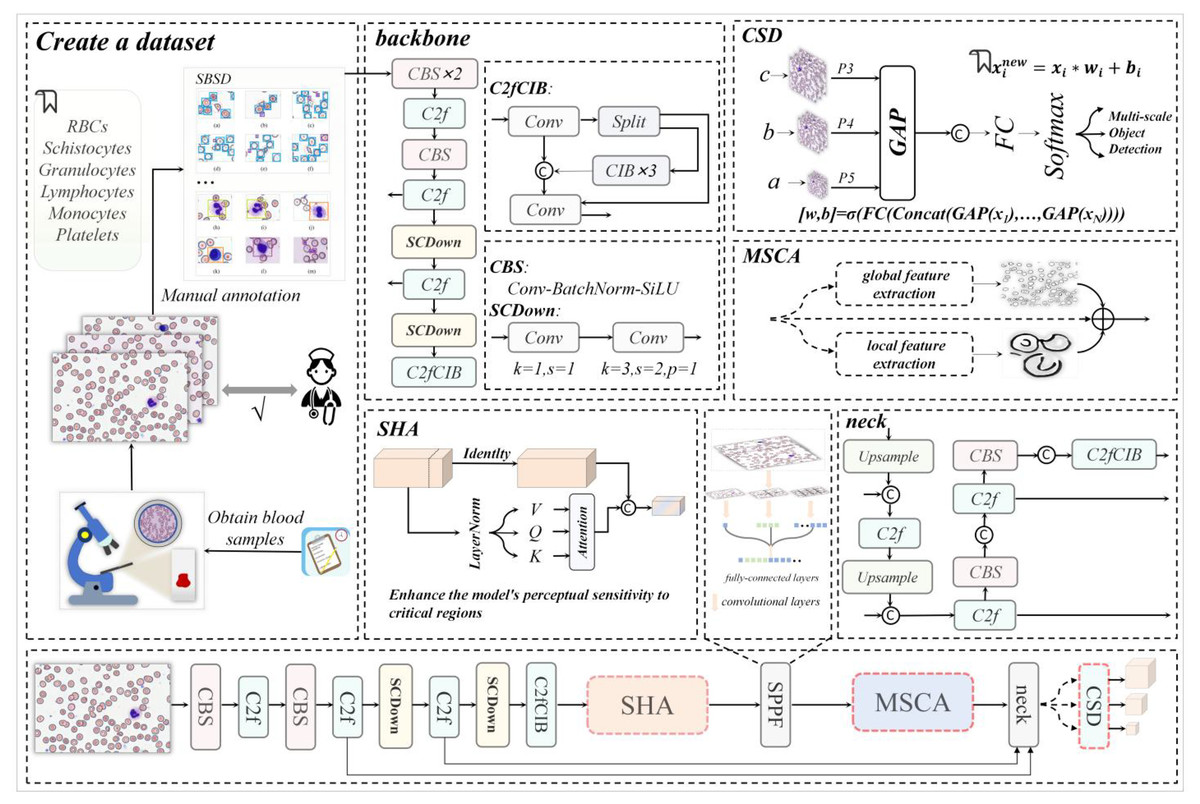
Figure 1: The architecture diagram of this research work, where backbone and neck represent the backbone network and neck network of YOLOv10m respectively.
The dataset construction process leverages the backbone network of MCS-Net, enhanced by a single-head self-attention (SHA) mechanism (Yun & Ro, 2024) to strengthen local feature capture, addressing the lack of detail in existing models for irregular cell morphologies. Image data processed through the feature pyramid network is then fed into our novel Multi-Scale Conv Attention (MSCA) module, which models local details and global contextual dependencies through multi-branch dilated convolutions and attention fusion. This achieves effective feature fusion for multi-scale targets, directly mitigating the literature’s deficiency in handling size disparities (e.g., platelets at 2–3 μm vs. leukocytes at 15–20 μm). Finally, through optimization of MCS-Net’s neck network and the Cross-Scale Dynamic (CSD) detection head, coupled with the introduction of normalized Wasserstein distance (NWD) loss, we significantly improve micro-target detection performance and localization accuracy. This integrated approach ensures a balance between accuracy and computational efficiency, overcoming the real-time limitations of prior works.
Overall architecture
As illustrated in Fig. 1, our MCS-Net workflow consists of four main stages:
-
(1)
Data Acquisition and Annotation: We collaborated with medical institutions to collect high-quality blood smear images. The SBSD dataset was constructed through manual annotation by pathologists, ensuring fine-grained labels for six cell types. This stage addresses annotation gaps by including pathological cells like schistocytes.
-
(2)
Backbone Network with Single-Head Self-Attention (SHA): The backbone network is enhanced with an SHA mechanism to strengthen local feature capture for irregular morphologies. This step improves detail extraction, often lacking in existing models.
-
(3)
Multi-Scale Feature Processing with MSCA Module: Feature maps from the backbone are processed through a feature pyramid network (FPN) and fed into our MSCA module. This module uses parallel dilated convolutional branches (e.g., dilation rates 1, 2, 3) to capture multi-scale features, followed by attention fusion to combine local and global contexts. This design mitigates size disparity issues by adaptively handling targets from 2 to 50 μm.
-
(4)
Detection and Optimization with CSD Head and NWD Loss: The neck network is optimized with a CSD detection head that dynamically fuses features across scales. The NWD loss function is introduced to enhance localization accuracy for micro-targets (e.g., platelets and schistocytes), reducing errors in dense clusters. This ensures high accuracy without sacrificing real-time performance.
Figure 1 visually summarizes this workflow, highlighting the integration of SHA, MSCA, CSD, and NWD components. This architecture is specifically designed to overcome the limitations of prior works by providing a unified solution for multi-scale, pathological cell detection.
Dataset construction
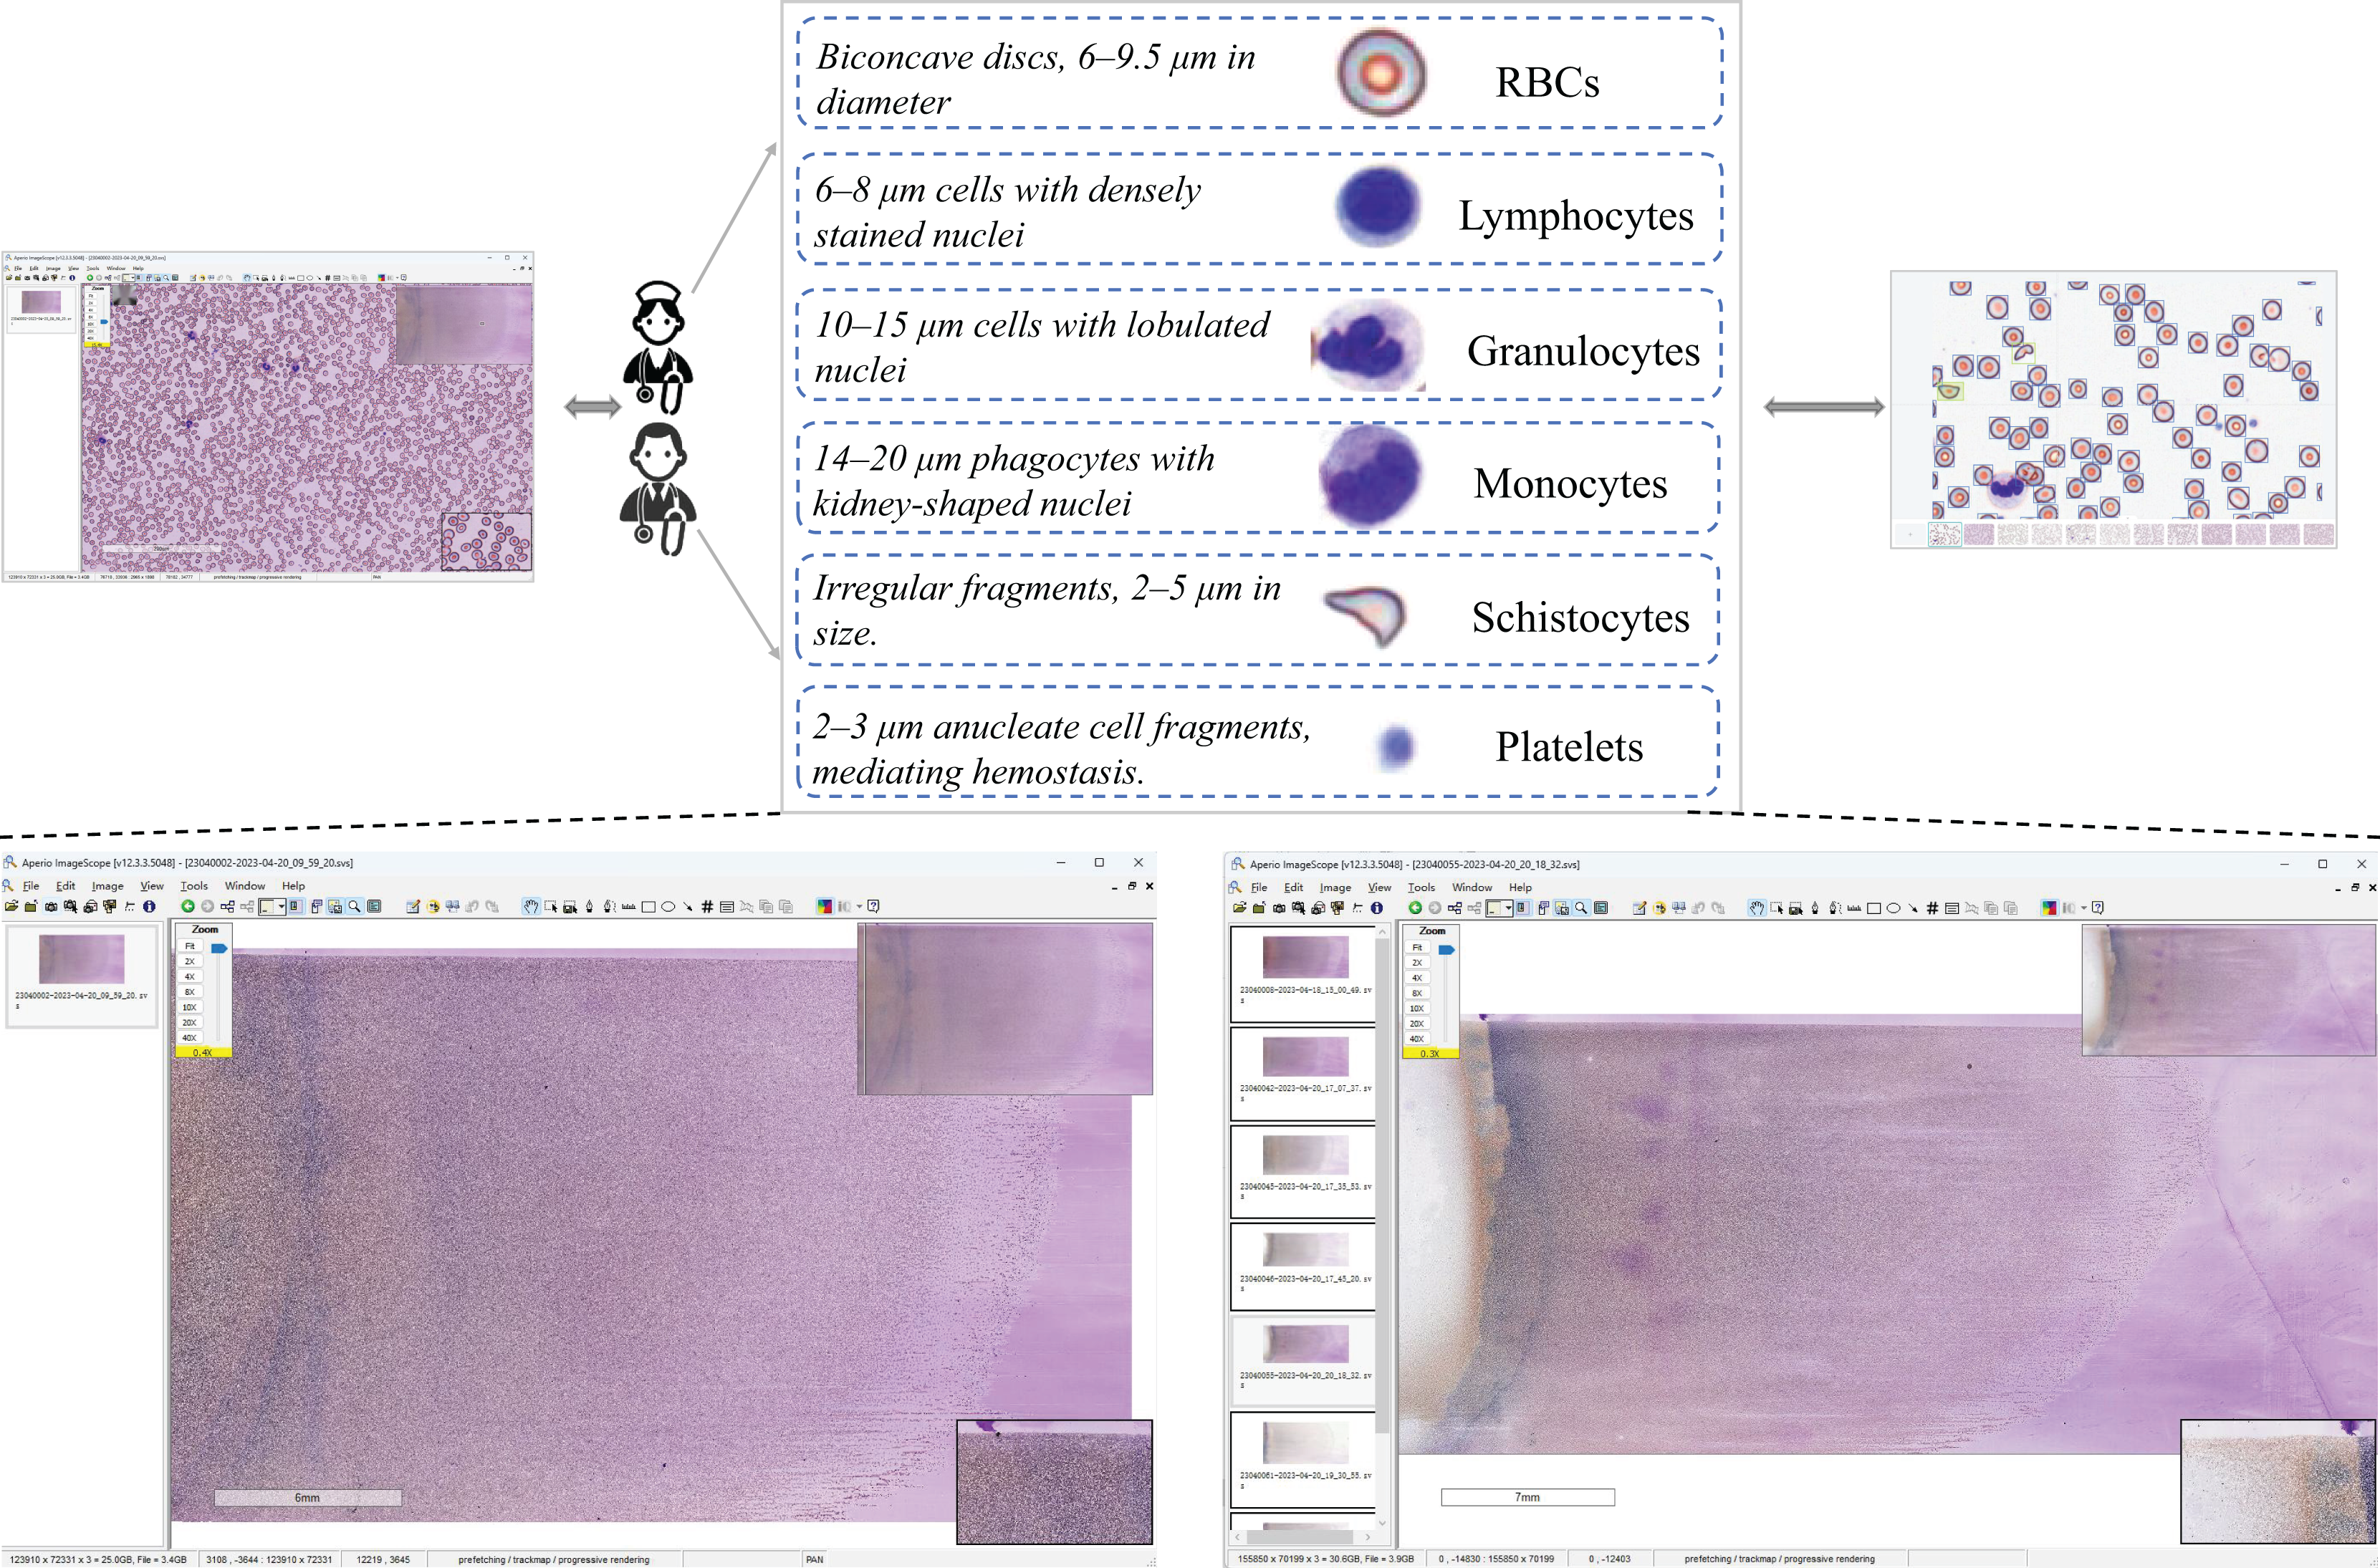
The dataset construction workflow is illustrated in Fig. 2. Data Acquisition: Blood samples were collected through hospital partnerships. Raw pathological images were acquired in SVS format, a standard for high-resolution whole-slide imaging. Expert Validation & Annotation: The images underwent rigorous validation by board-certified pathologists, followed by manual annotation to curate a precision-labeled dataset. Dataset Availability: Chen, R. (2025). Blood Smear Cell Dataset (SBSD) [Data set]. Zenodo. https://doi.org/10.5281/zenodo.15676241.
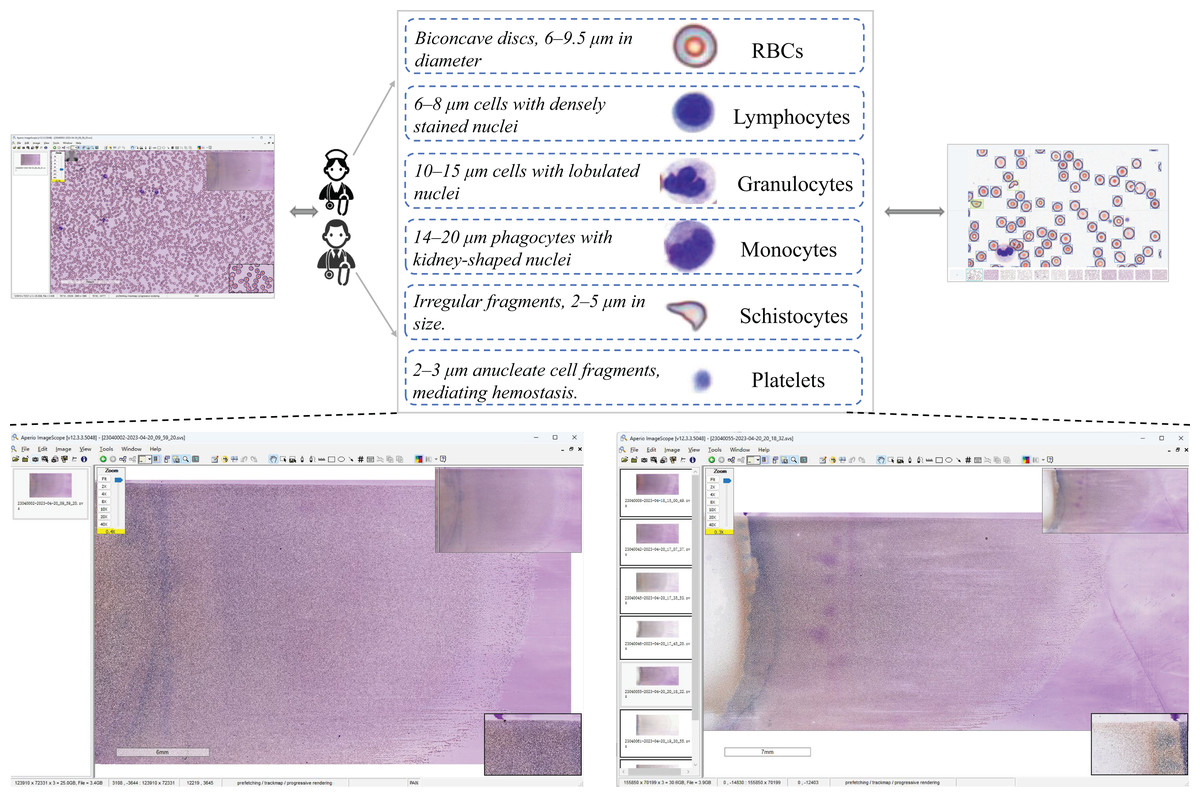
Figure 2: Dataset construction workflow.
Ethics: ‘Sun Yat-sen Memorial Hospital of Sun Yat-sen University has granted ethical approval for this study to be conducted at its facility (Ethical Approval No.: SYSKY-2025-542-01).’
The SBSD medical dataset constructed in this study comprises six cell categories: erythrocytes, platelets, granulocytes, lymphocytes, monocytes, and schistocytes. A known limitation is the aggregation of granulocyte subtypes (e.g., neutrophils, eosinophils) into a single category. This design choice was made to focus annotation efforts on the core challenge of schistocyte identification and to mitigate the subjectivity and high expertise required for granulocyte subclassification. Erythrocytes exhibit a biconcave discoid shape (6–9.5 μm in diameter) with central pallor as a normal characteristic. Granulocytes are categorized into neutrophils (Bain, 2022), eosinophils, and basophils, with neutrophils distinguished by lobulated nuclei (2–5 lobes) and cytoplasmic granules. Lymphocytes are primarily characterized by small size (6–8 μm) (Abbas, Lichtman & Baker, 2005), dense nuclei, and atypical morphological variations. Monocytes, the largest cells (14–20 μm in diameter) (Goasguen et al., 2009), feature reniform or horseshoe-shaped nuclei. Platelets display a biconvex discoid or elliptical morphology (Chamberlain et al., 1988), approximately 2–3 μm in diameter (about one-third the size of erythrocytes). Schistocytes include various forms such as helmet-shaped cells, angular fragments, or crescent-shaped debris (Zini et al., 2012), with detailed morphological descriptions provided in Table 1.
| Category | Morphological features | Pathogenetic mechanism |
|---|---|---|
| Helmet cell | Unilateral concave deformation resembling a crescent or “bite” mark, with partial membrane preservation. | Microvascular fibrin network-induced erythrocyte fragmentation. |
| Triangular fragment | Acute-angled triangular shape with sharp edges and reduced size | High shear stress-induced erythrocyte rupture |
| Microspherocyte | Spherical morphology with loss of central pallor and reduced membrane deformability. | Oxidative membrane damage or hereditary cytoskeletal defects |
| Dacryocyte | Teardrop-shaped fragment with tapered and blunt ends, exhibiting membrane irregularities. | Erythrocyte deformation during passage through fibrotic bone marrow sinusoids or splenic cords. |
| Irregular fragment | Extreme pleomorphism (serrated, lobulated) with evident membrane disruption. | Severe mechanical trauma |
| Acanthocyte | Multiple short, evenly distributed spicules without central pallor. | Membrane lipid abnormalities |
Schistocytes encompass various morphological subtypes, including helmet cells, triangular fragments, microspherocytes, dacryocytes, and irregular fragments. Their characteristic features are illustrated in Fig. 3.
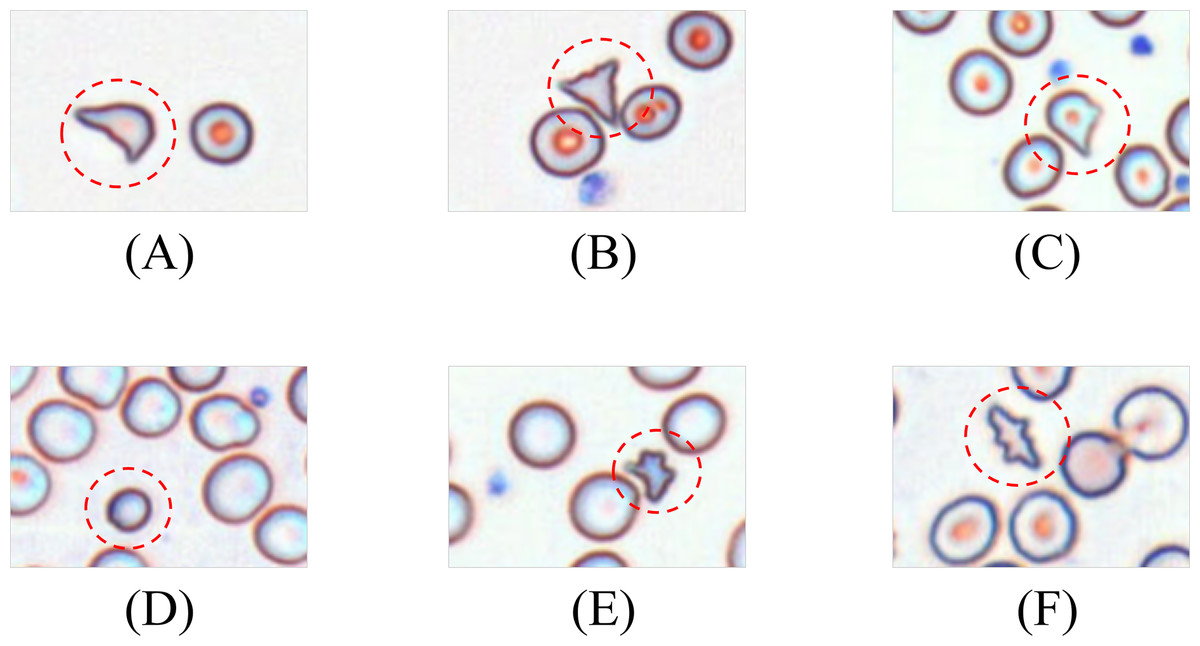
Figure 3: Morphology of leukocytes and platelets.
(A) Helmet/crescent-shaped cells. (B) Triangular fragments. (C) Teardrop-shaped cells. (D) Micros pherocyte. (E) Irregular fragments. (F) Acanthocytes.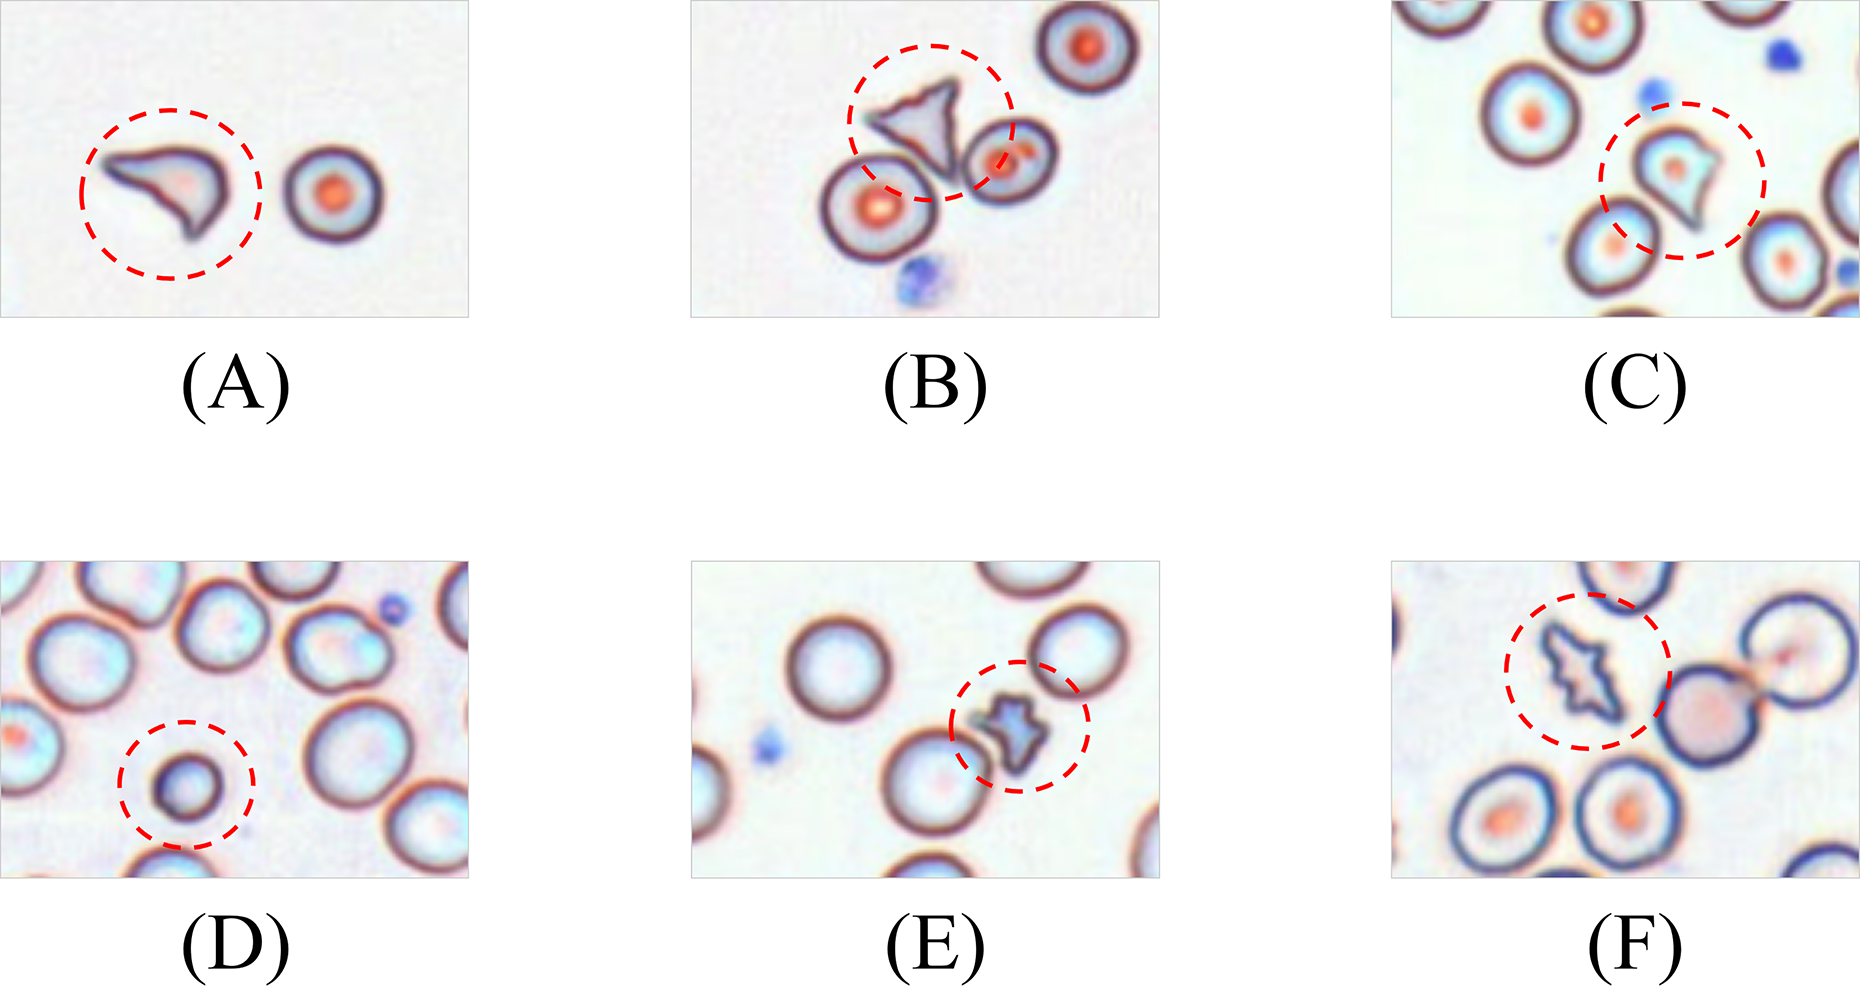
Leukocytes are classified into granulocytes and agranulocytes (lymphocytes, monocytes) based on cytoplasmic granularity, with representative morphologies shown in Fig. 4.
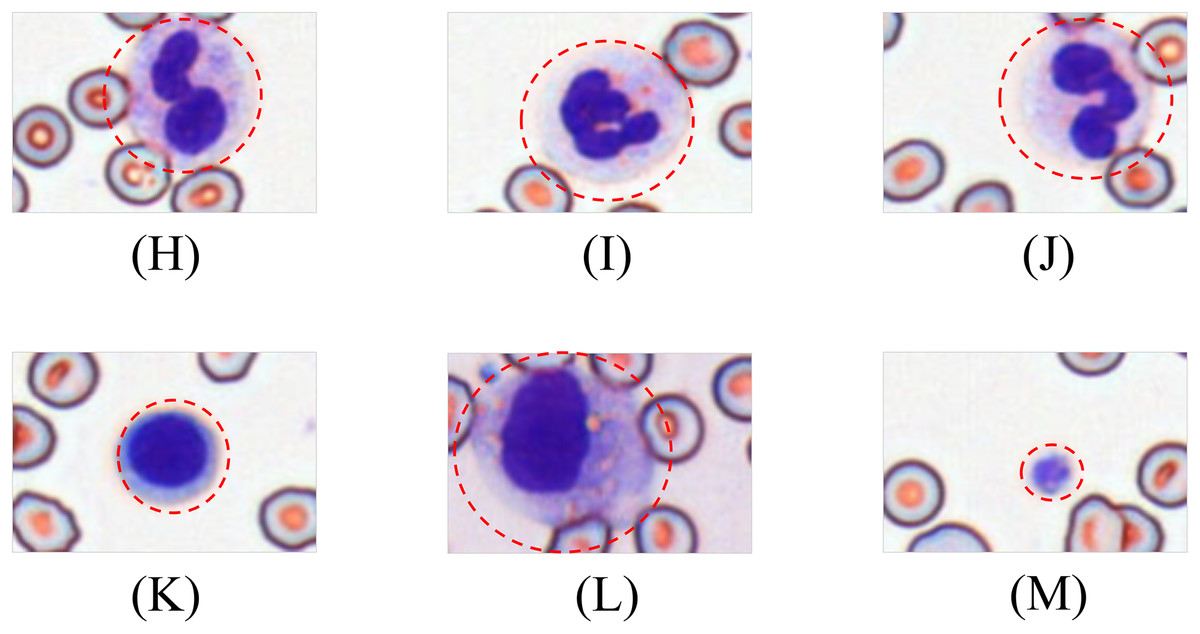
Figure 4: Morphological diversity of schistocytes.
(H, I, J) Granulocytes. (K) Lymphocyte. (L) Monocyte. (M) Platelets.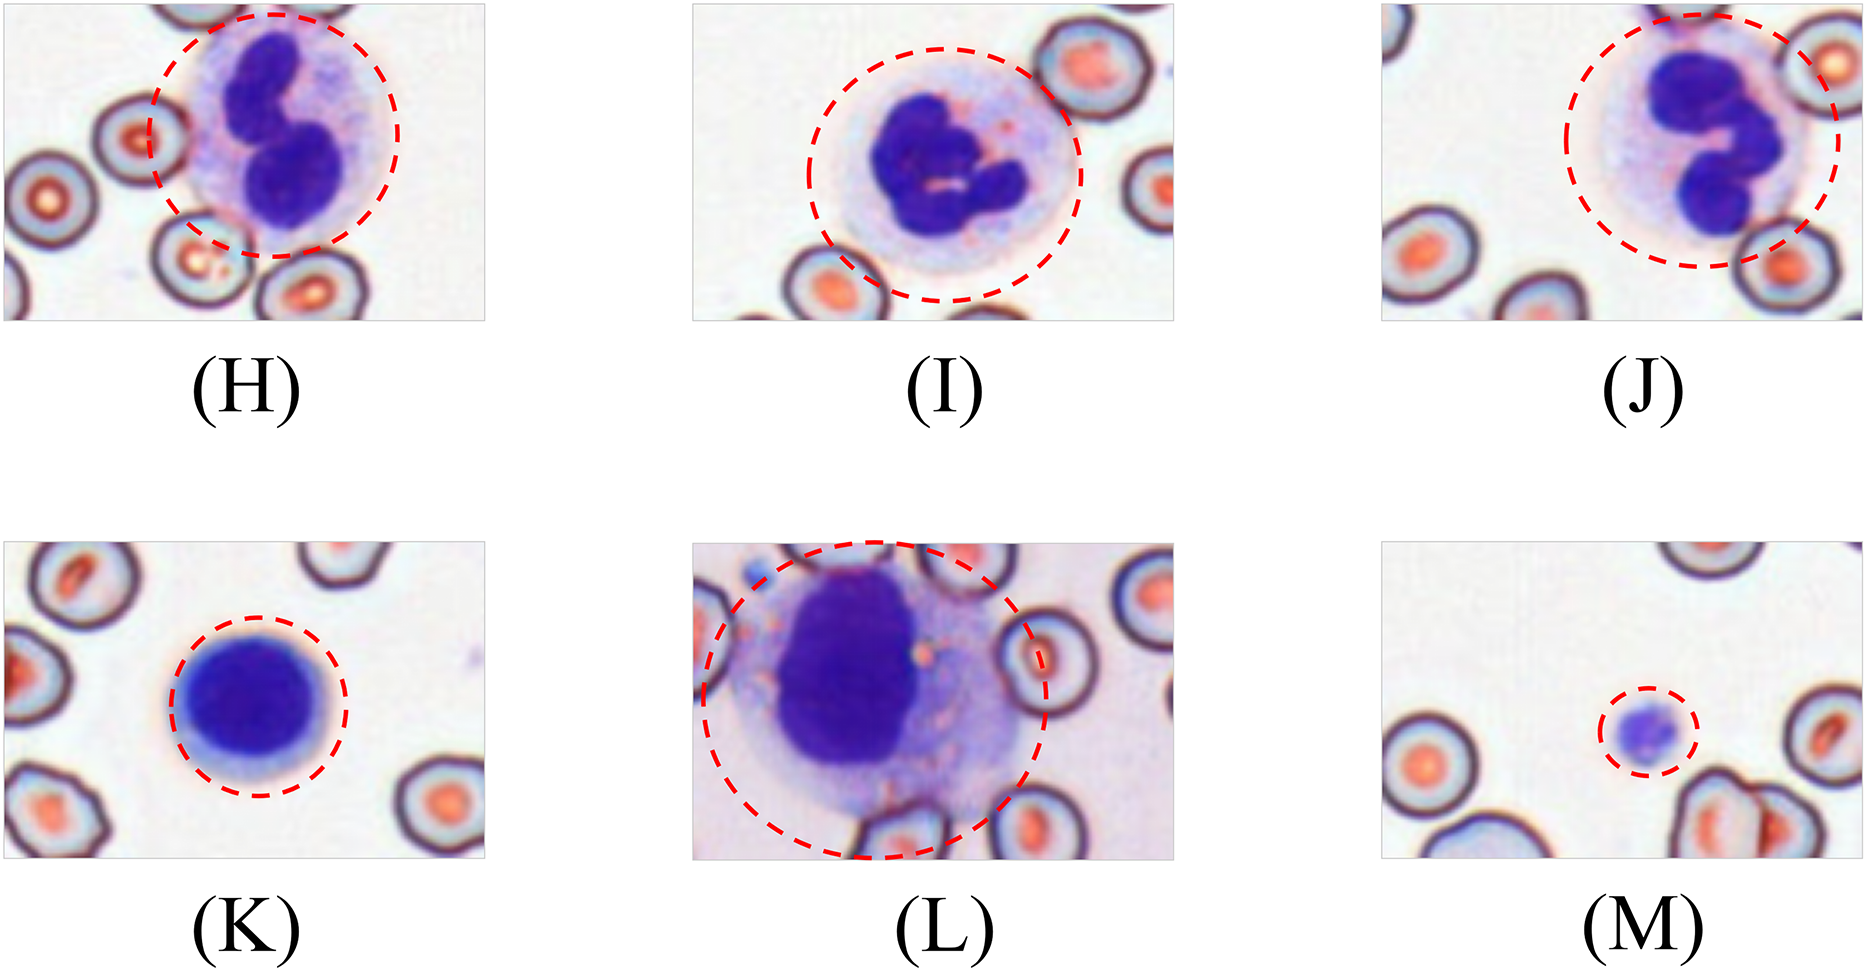
Dataset morphological characteristics
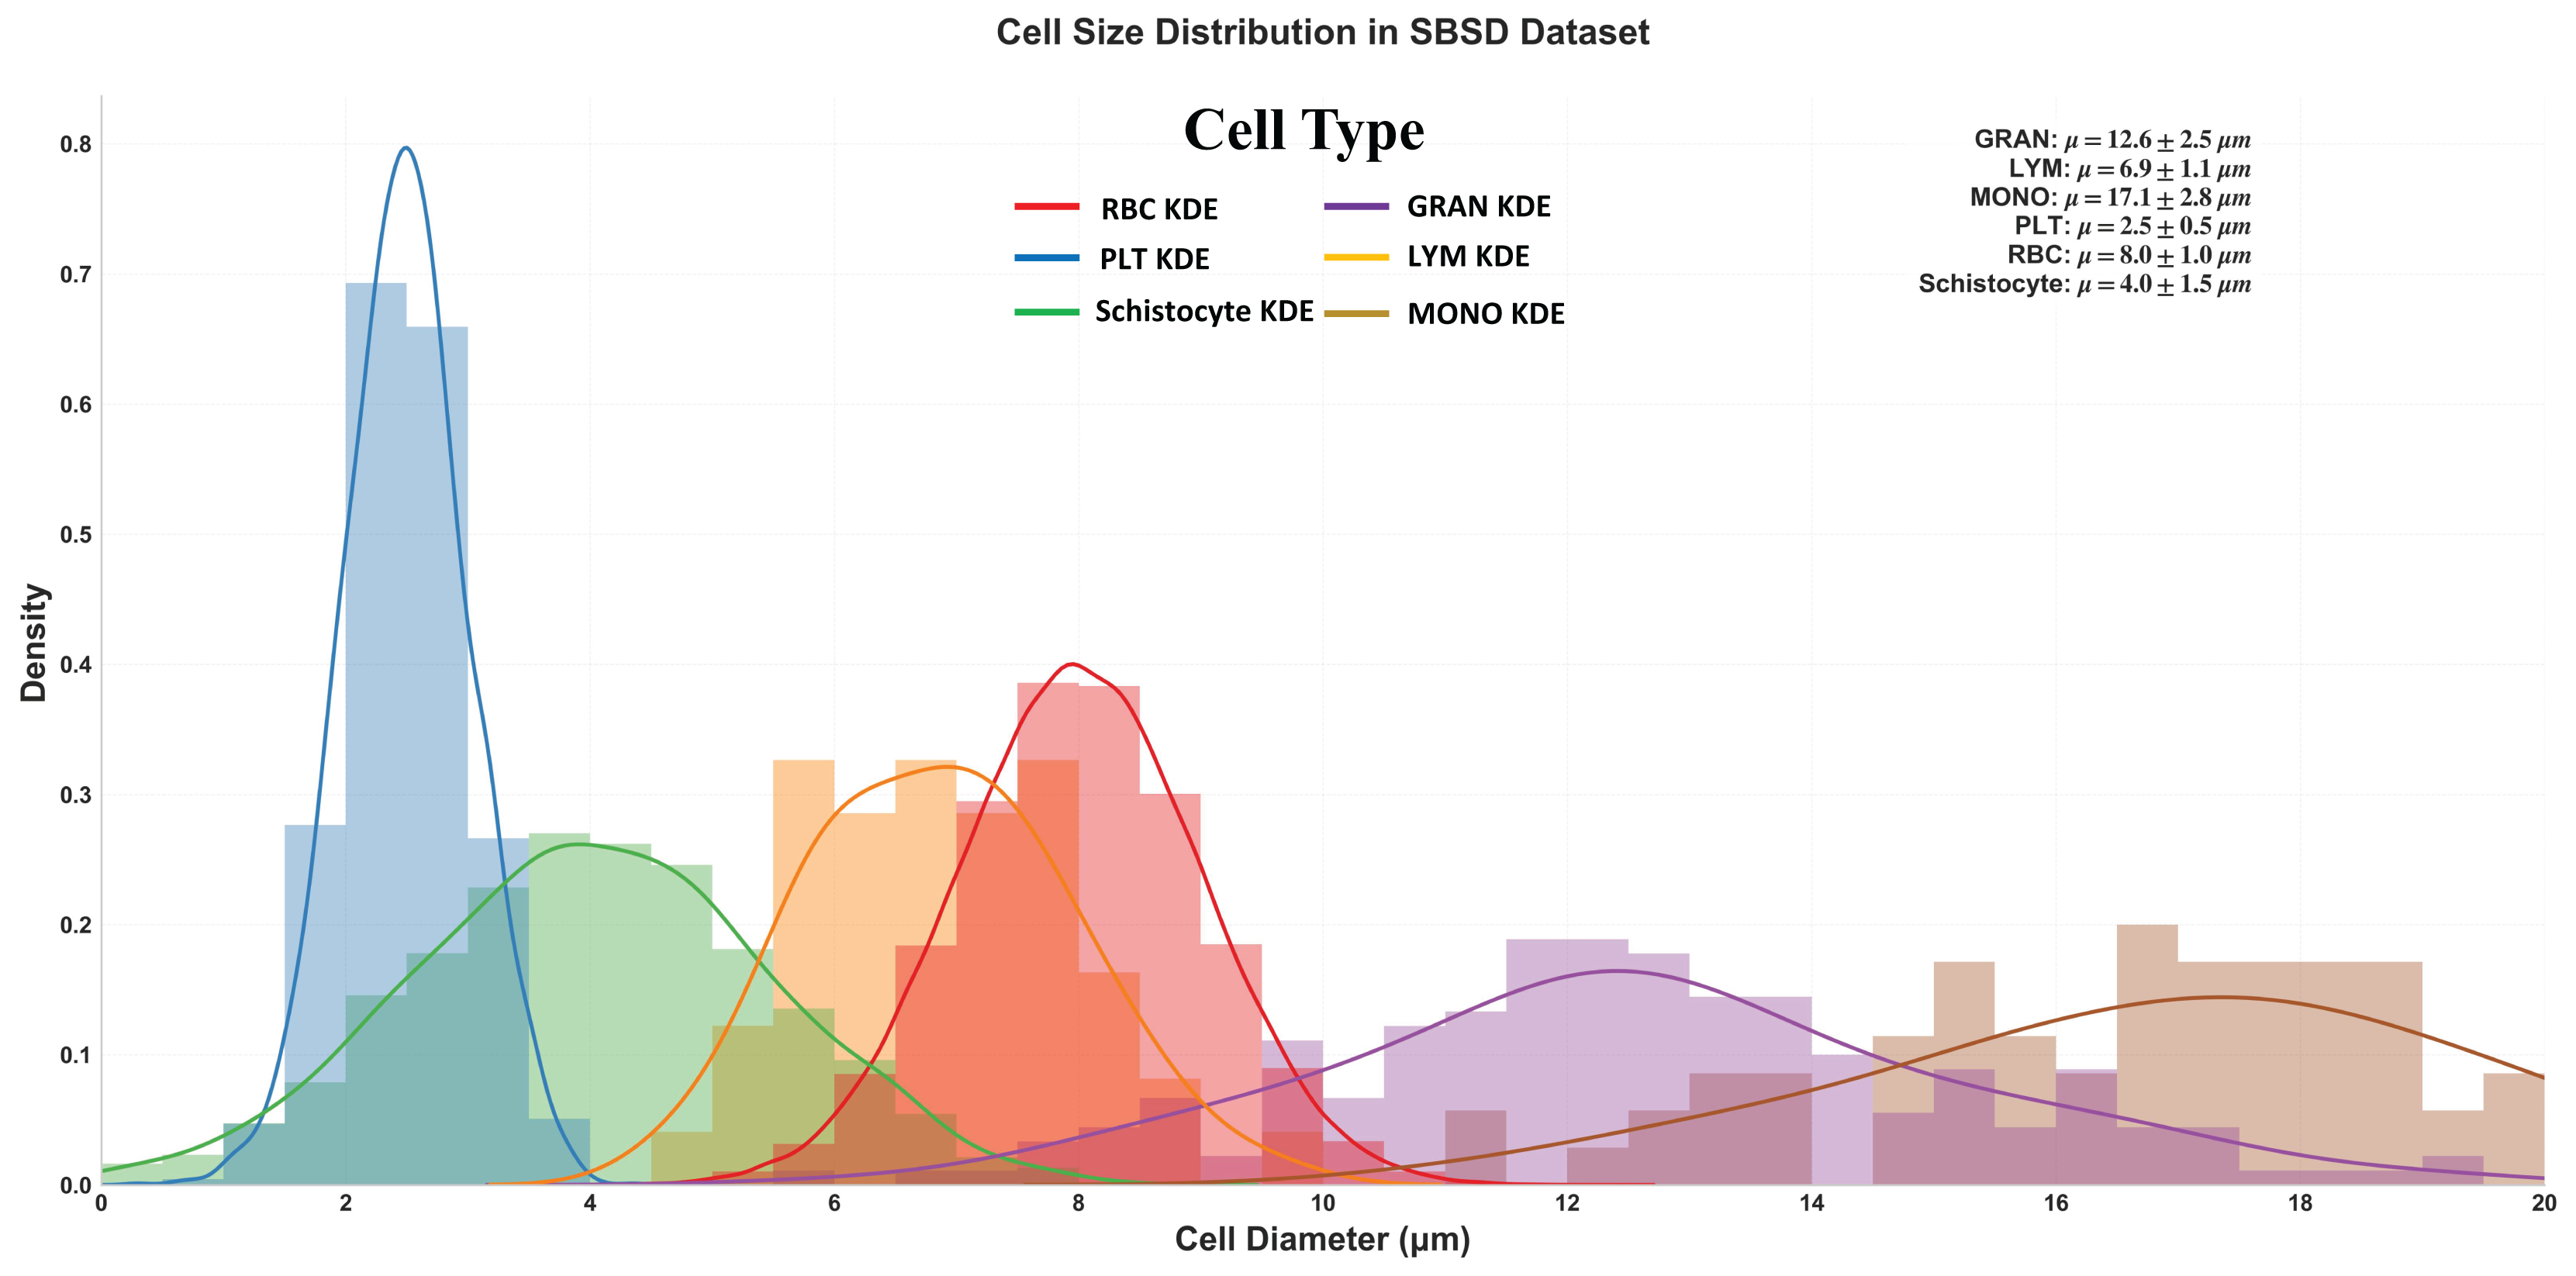
Figure 5 delineates the diameter distribution of six cell types in the SBSD dataset using kernel density estimation (KDE) curves, providing critical insights into morphological characteristics essential for algorithm design and clinical validation.

Figure 5: Size distribution of six cell types in SBSD, quantified by kernel density estimation.
RBCs: Peak at 8.0 μm (μ = 8.0 ± 1.0 μm), aligning with physiological biconcave disc morphology. The narrow standard deviation (σ = 1.0 μm) reflects uniformity, justifying RBCs as a stable reference for size calibration; PLT: Sharp peak at 2.5 μm (μ = 2.5 ± 0.5 μm), consistent with their anucleate fragment nature. The minimal spread (σ = 0.5 μm) highlights their distinct size separation from other categories; granulocytes (GRAN): Largest mean diameter (μ = 17.1 ± 2.8 μm), attributable to lobulated nuclei and cytoplasmic granularity. The broad KDE curve (spanning 12–22 μm) underscores size heterogeneity across subtypes (neutrophils, eosinophils, basophils); Schistocytes: Overlap with PLTs and monocytes (MONOs) at 4.0 μm (μ = 4.0 ± 1.5 μm). Their KDE curve (green) exhibits a bimodal distribution (peaks at 3.5 and 5.5 μm), suggesting two subpopulations: small fragments (mechanical shear-induced) and larger irregular remnants (intrinsic defects).
Schistocyte-PLT Ambiguity: Both schistocytes (4.0 ± 1.5 μm) and PLTs (2.5 ± 0.5 μm) occupy the 2–6 μm range, with 24% overlap in KDE densities. This explains baseline model misclassifications and validates the need for NWD-based localization to distinguish subtle shape differences; Lymphocyte-Monocyte Differentiation: Lymphocytes (LYM: μ = 12.6 ± 2.5 μm) and monocytes (MONO: μ = 17.1 ± 2.8 μm) show partial overlap (14–16 μm) (Sabattini et al., 2010), likely due to transitional forms in pathological states (e.g., activated lymphocytes); Multi-Scale Detection Necessity: The dataset spans 2.5 μm (PLTs) to 17.1 μm (GRANs), demanding hierarchical feature fusion (MSCA module) to capture both micron-level fragments and large cells; Schistocyte/MONO size variability (σ = 1.5 μm) NWD to mitigate IoU’s sensitivity to minor positional shifts; Schistocyte Quantification: The 4.0 ± 1.5 μm distribution matches ICSH diagnostic criteria for thrombotic microangiopathy (≥1% schistocytes with 2–5 μm size), confirming SBSD’s utility in DIC/MAHA screening (Iba et al., 2019).
Cellular abundance in SBSD dataset
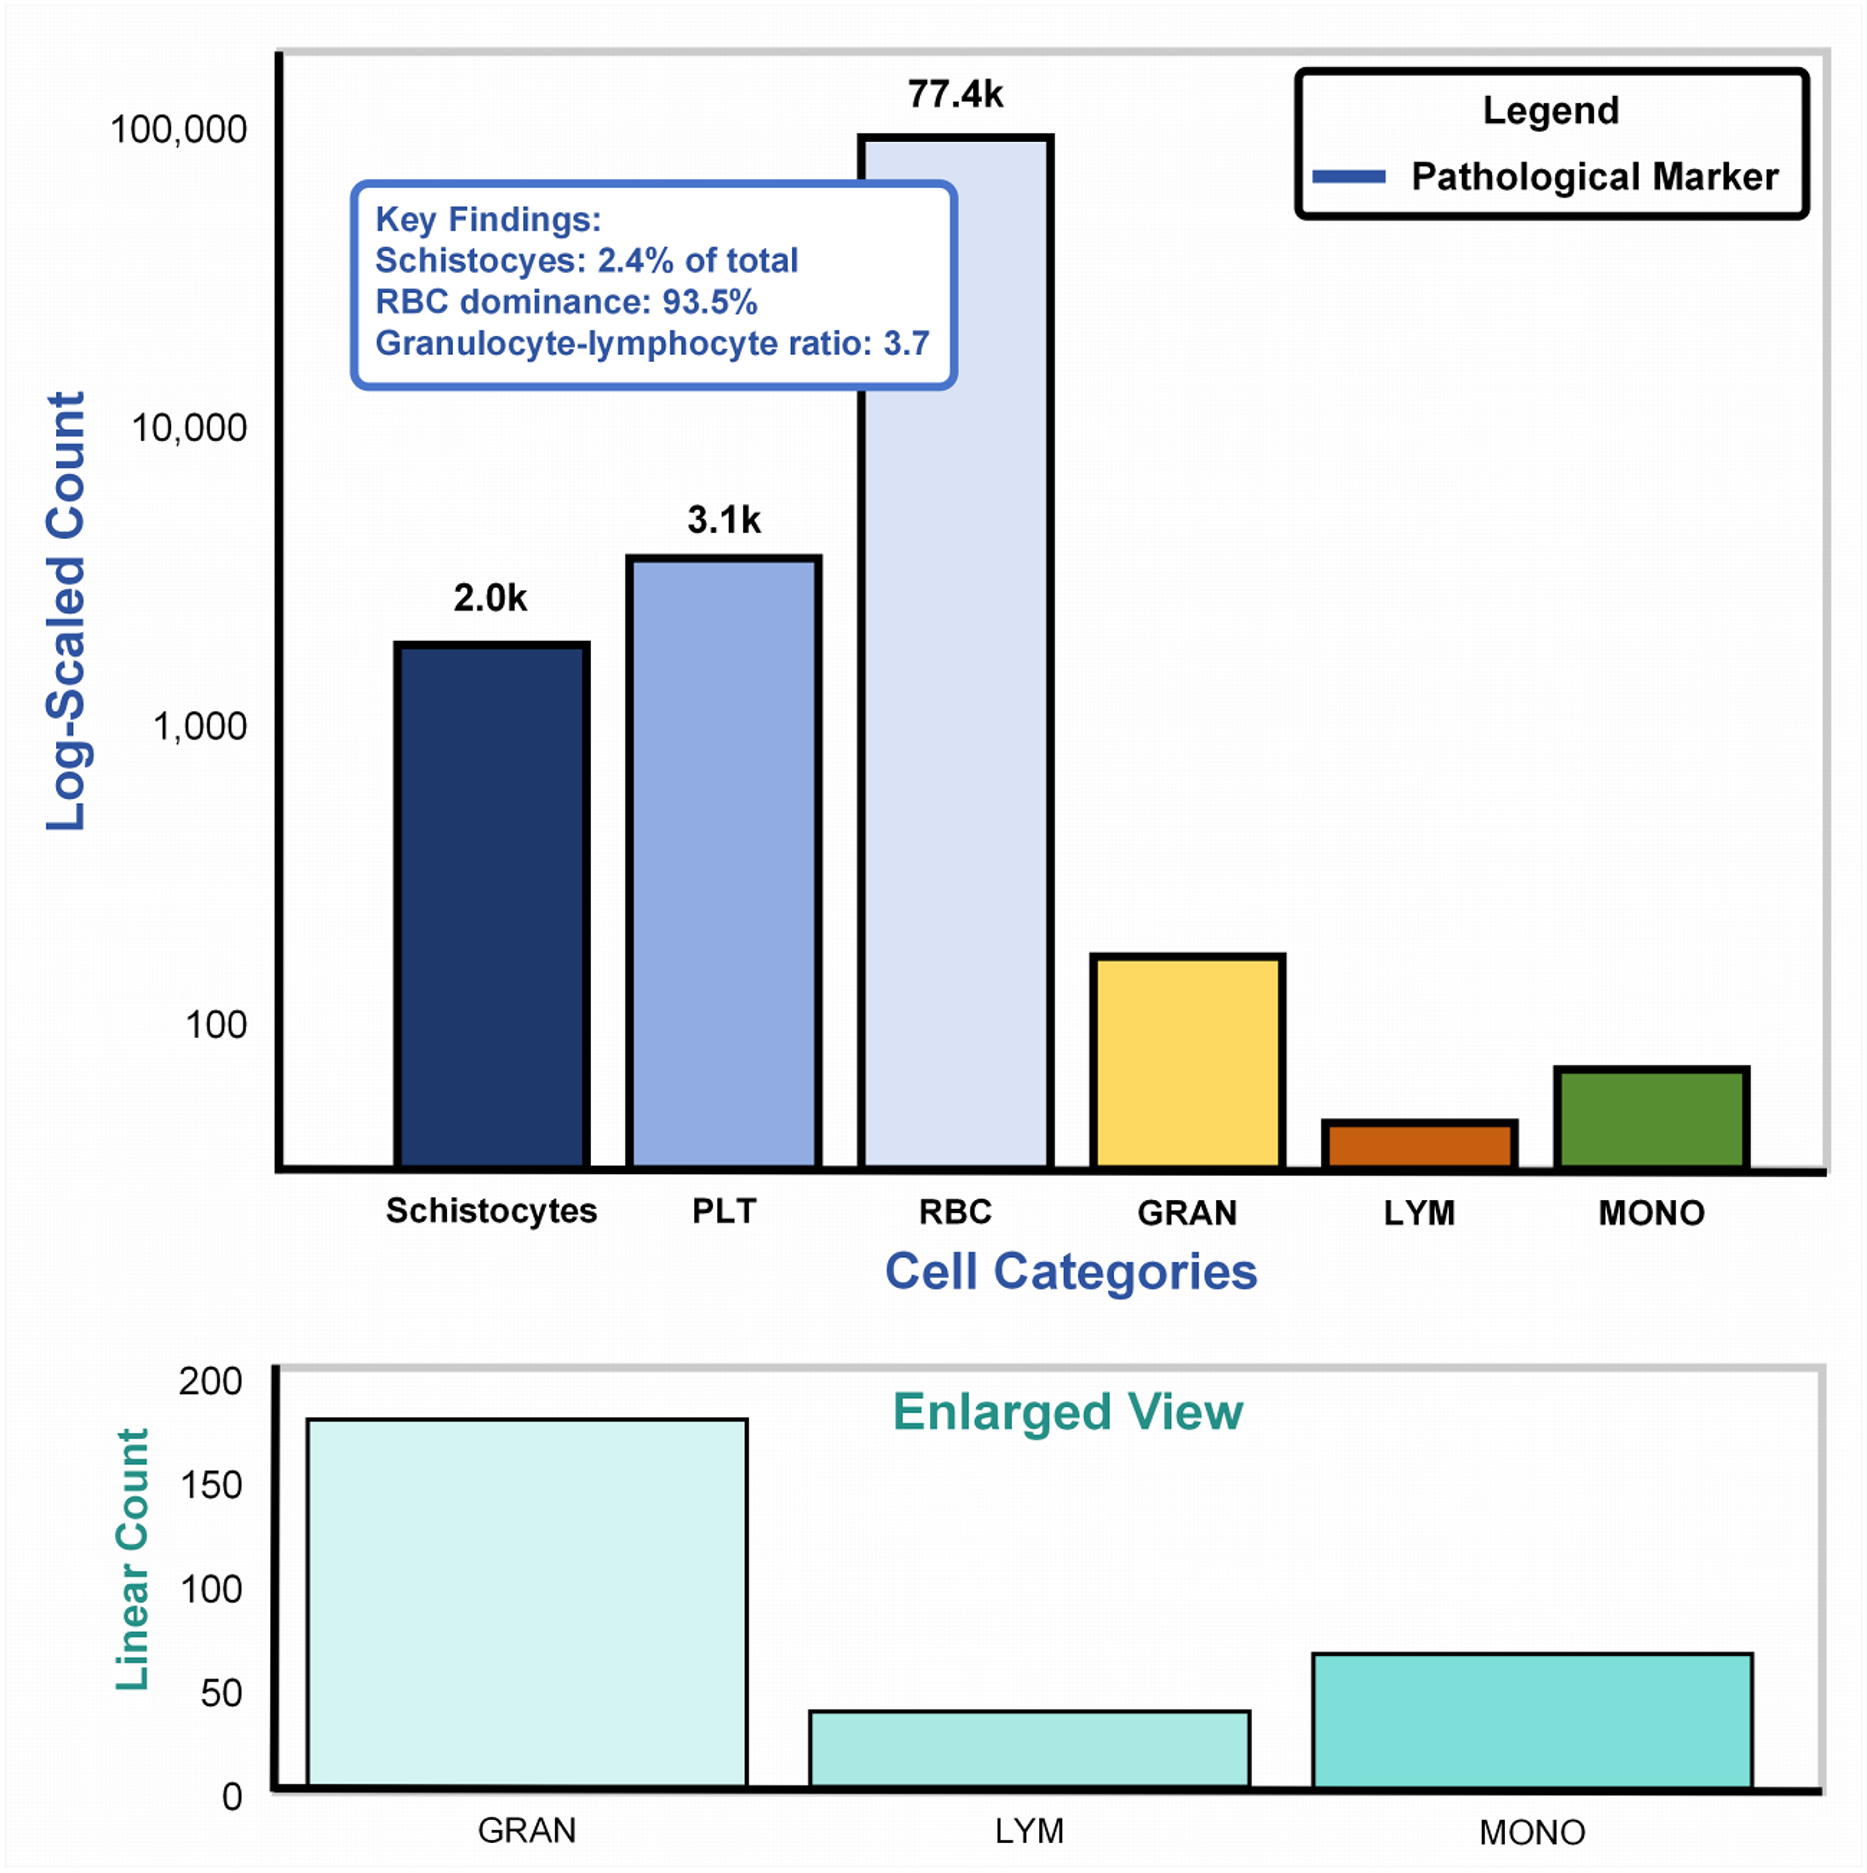
Figure 6A: Main plot (logarithmic scale): The bar chart illustrates cell counts spanning four orders of magnitude (102–105), dominated by erythrocytes (RBCs: 77.4k, 93.5%). Pathological markers, highlighted in blue, reveal schistocytes (2.0k, 2.4%), exceeding the diagnostic threshold (≥1%) for thrombotic microangiopathy per ICSH guidelines (Zini & De Cristofaro, 2019). The granulocyte-lymphocyte ratio (GLR = 3.7, GRAN: 3.1k vs. LYM: 2.0k) aligns with bacterial infection profiles (normal GLR: 1.5–3.0) (Naess et al., 2017), validating the dataset’s inclusion of infection-related samples. Figure 6B: Enlarged linear-scale plot: Resolves low-abundance populations, including granulocytes (3.1k ± 15%) and monocytes (200) (Huang, Cai & Su, 2019), critical for detecting rare pathological events (e.g., monocyte activation in sepsis). Error bars on granulocytes reflect biological variability across infection subtypes.
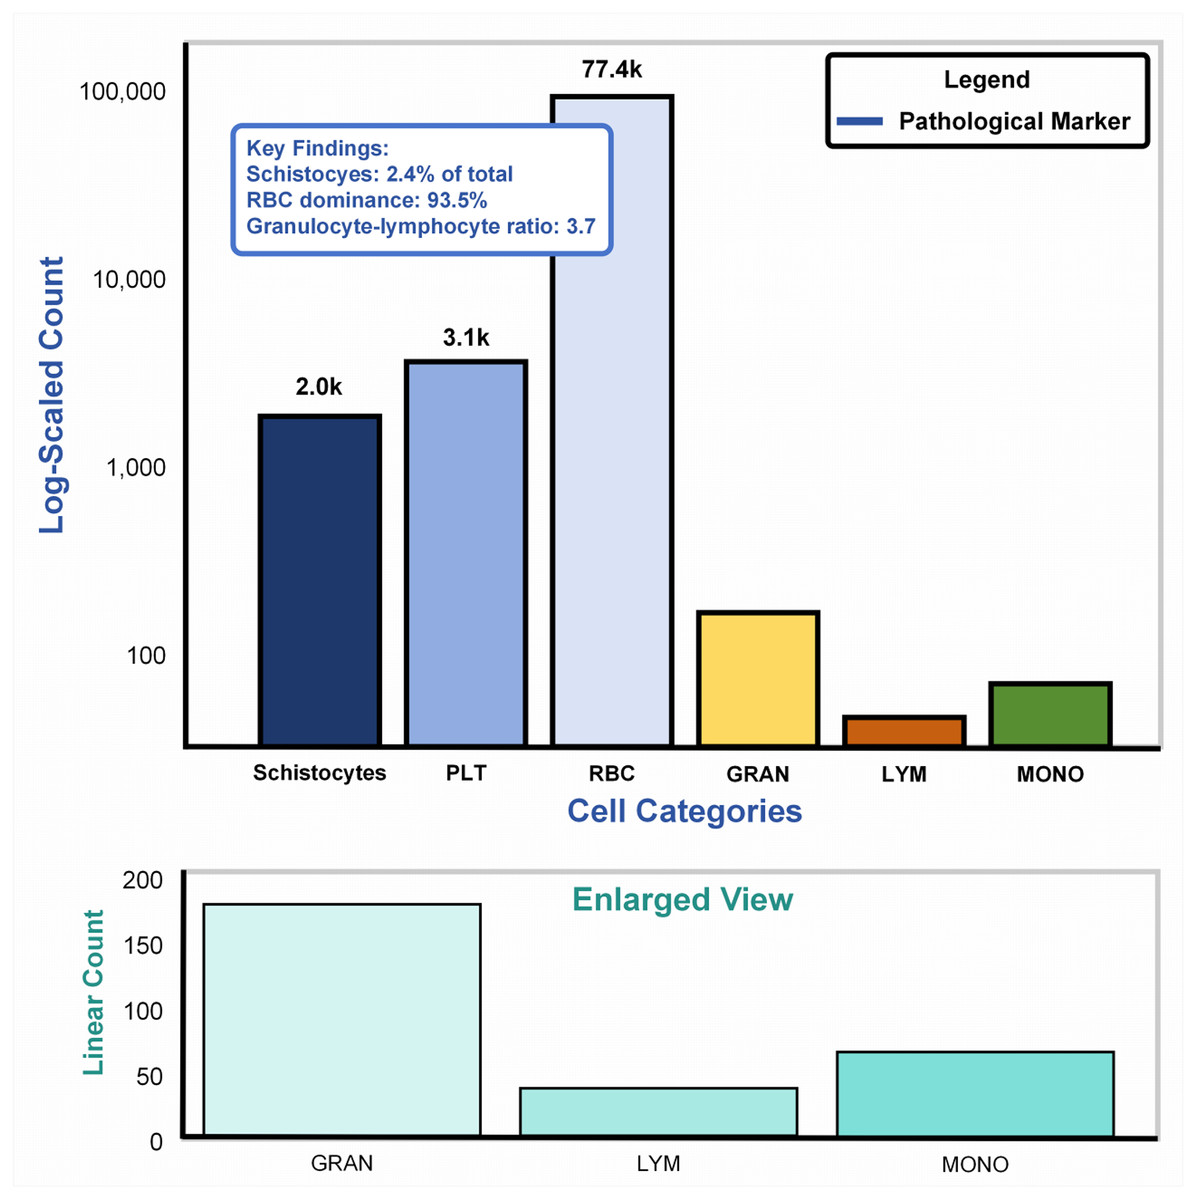
Figure 6: Cellular abundance in the SBSD dataset, visualized through a dual-scale bar plot.
Through its morphological diversity annotations and cellular abundance distribution design, the SBSD dataset not only reflects the physiological-pathological continuum of blood components but also provides multi-scale, high-complexity detection scenarios for algorithmic development. Its construction directly addresses clinical demands, such as determining diagnostic thresholds for schistocytes in disseminated intravascular coagulation (DIC). It establishes a validation foundation for innovative modules (MSCA, CSD, NWD) in the MCS-Net model, thereby advancing blood cell detection from coarse-grained classification to pathological subtype recognition.
Multi-scale convolution and attention
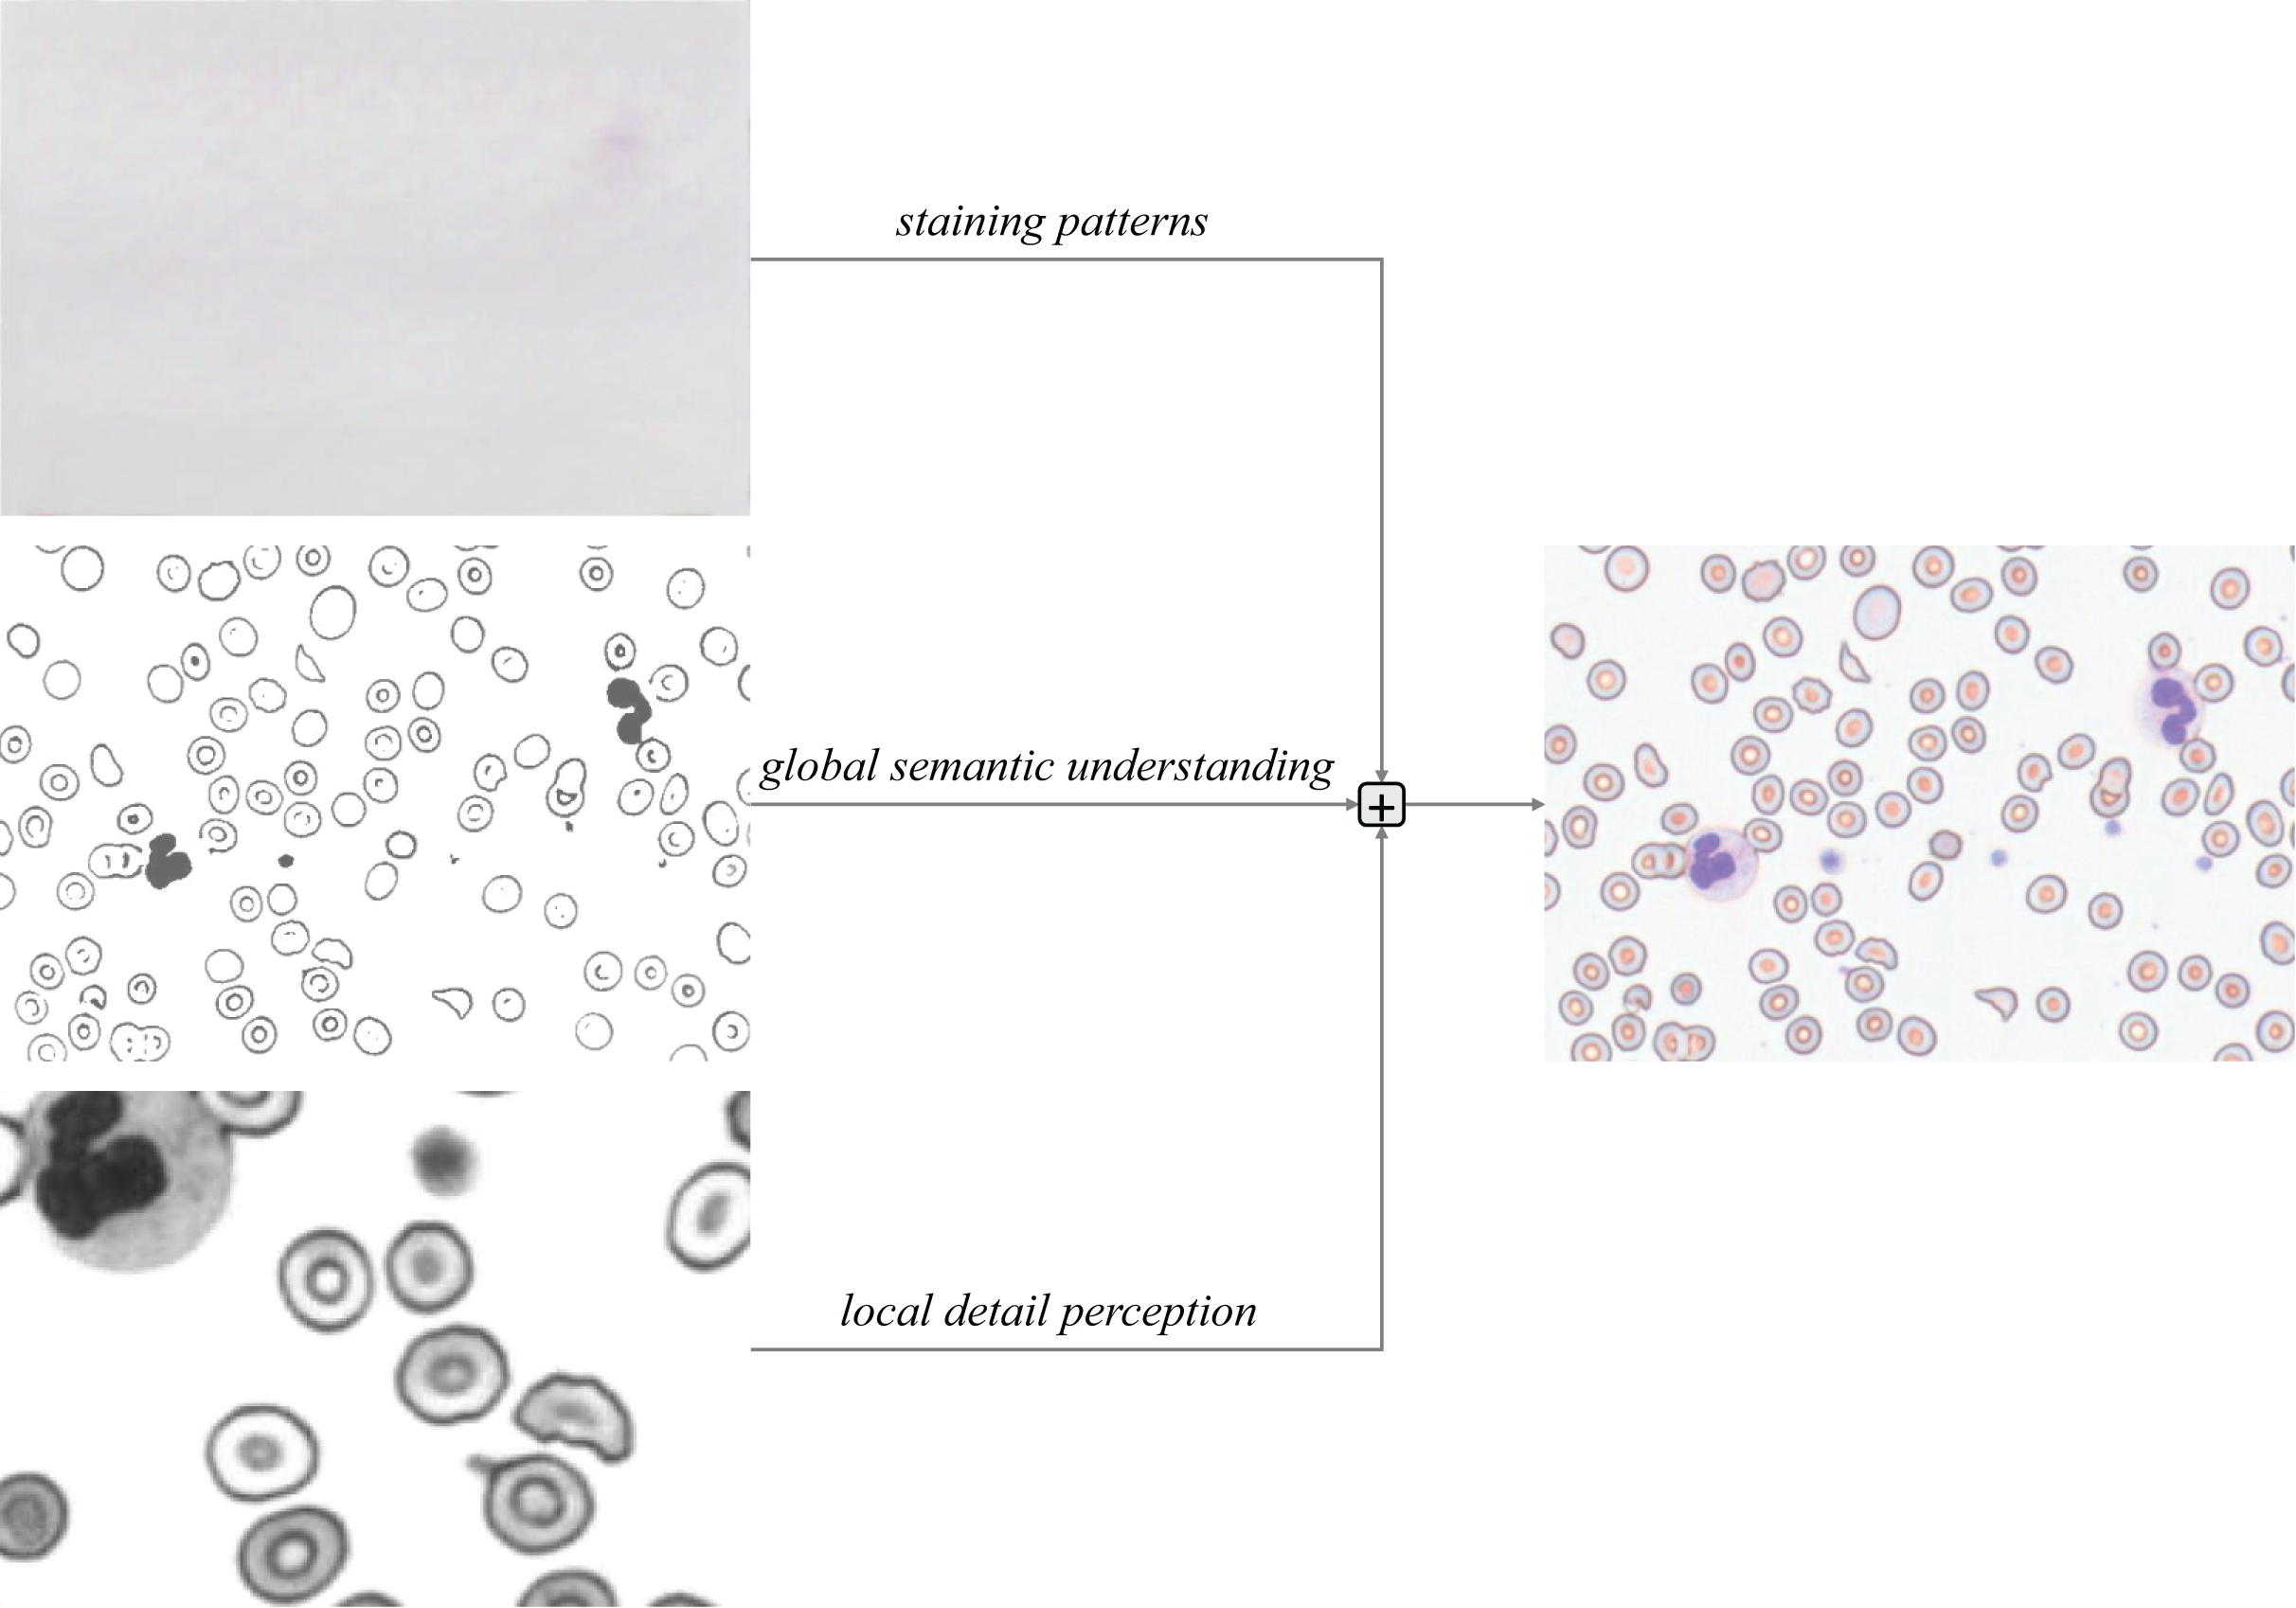
The MSCA module serves as the core innovative component of this study. Through a multi-branch collaborative architecture, it achieves deep integration of local detail perception and global semantic understanding, as illustrated in Fig. 7. Its primary functionalities are manifested in three critical dimensions:
-
(1)
Multi-Focal Feature Extraction: To address the detection requirements for blood cell subtypes (2–50 μm) and pathological morphologies (e.g., serrated edges of schistocytes), MSCA employs multi-branch dilated convolution groups (equivalent kernel sizes: 3 × 3, 5 × 5, 7 × 7) to simulate pathologists’ multi-focal observation strategies (Yu & Koltun, 2016).
-
(2)
Complementary Feature Enhancement: Global Attention Branch: An improved depthwise separable attention mechanism establishes long-range dependencies across visual fields, automatically enhancing local focus in dense cell regions (e.g., platelet aggregates). Local Convolution Branch: Channel rearrangement (RS) strengthens cross-channel interactions (Zhang et al., 2017), decoupling morphological features from staining characteristics through channel-wise convolution.
-
(3)
Triple Residual Feature Pyramid: Three residual connections preserve critical information during backpropagation (He et al., 2016): Original Residual: Retains staining patterns (e.g., basophilic regions in Wright-Giemsa staining). Local Residual: Enhances membrane edge gradients (e.g., acute-angled edges of schistocytes). Global Residual: Maintains topological relationships in cellular clusters. This design prioritizes residual feature learning, accelerating training convergence.
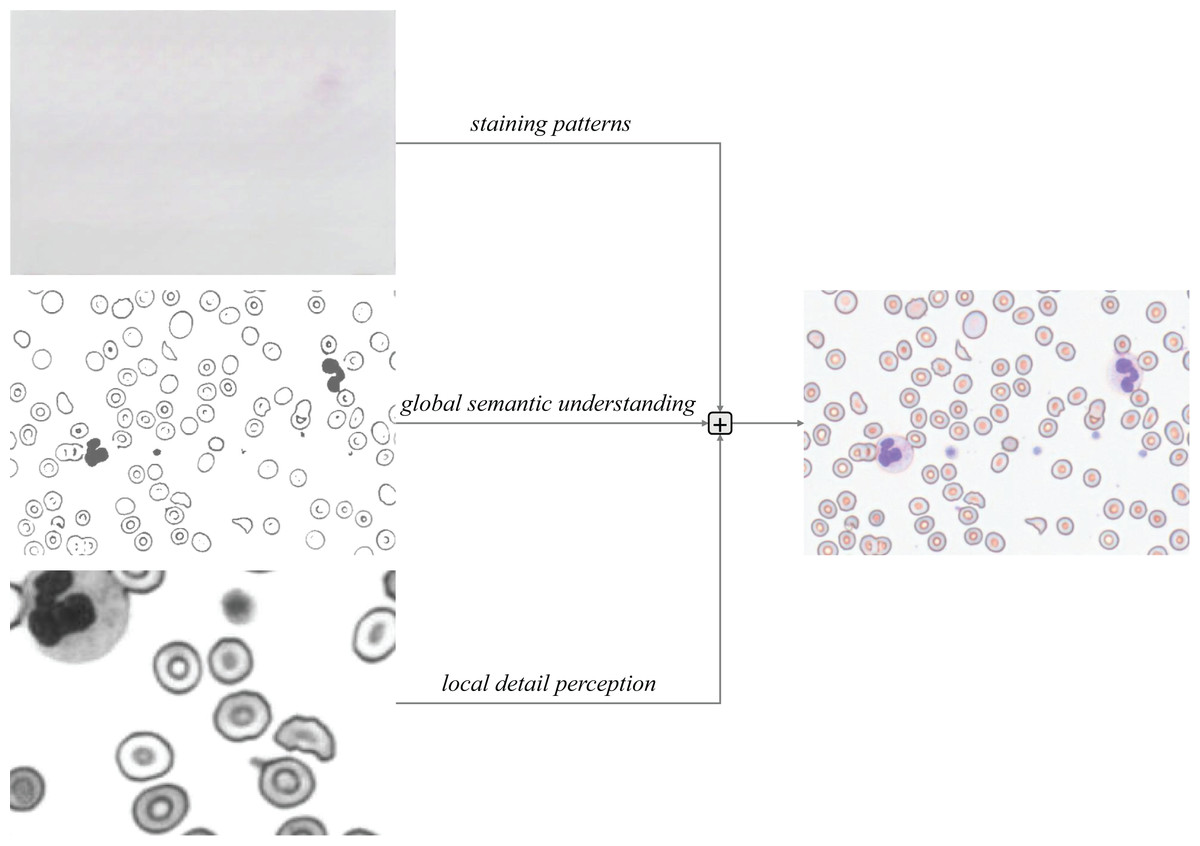
Figure 7: Triple-branched residual design.
The Multi-Scale Conv Attention structure is shown in Fig. 8, The input image is processed through three distinct branches: a global self-attention branch, a local feature extraction branch, and an original residual branch, each designed to fulfill a unique functional role.
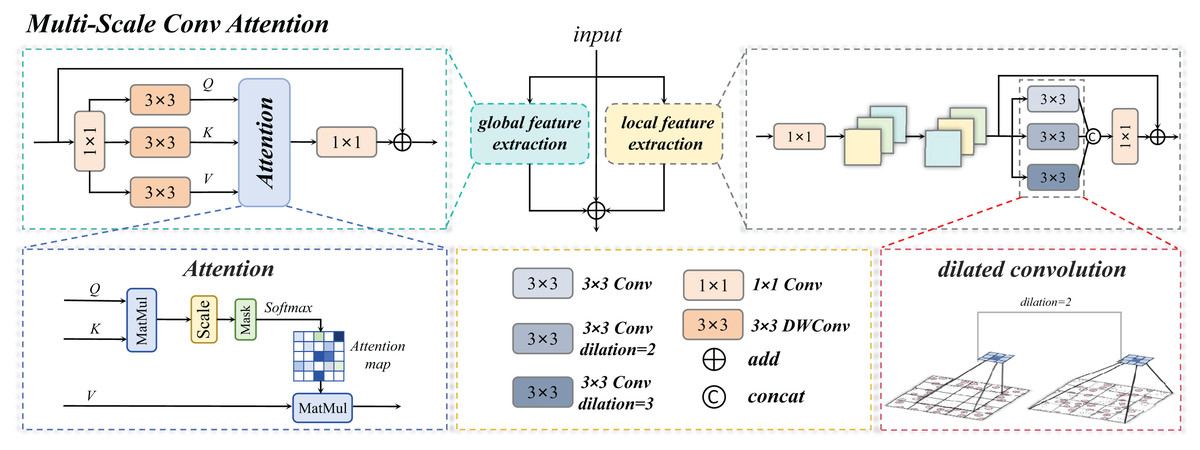
Figure 8: Multi-scale convolution and attention fusion module.
Multi-scale conv attention global branch
The global self-attention branch serves as the core component for capturing global dependency relationships within the input features. Its architecture integrates the classical self-attention mechanism, where the input feature map is first passed through depthwise separable convolutional layers to generate three sets of vectors: Q, K, and V. Global correlations are computed via normalized dot product operations, and a learnable temperature parameter is introduced to modulate the sharpness of the attention distribution, as formulated in Eq. (1):
(1)
Here, denotes the dimensionality of the key vectors, which scales the dot product values to prevent gradient explosion, and is a learnable parameter that dynamically optimizes the attention weight distribution.
The value vectors are aggregated through a weighted summation based on the attention weights, yielding a globally contextualized feature representation as formalized in Eq. (2):
(2)
Here, denotes a 1 × 1 convolutional layer, and represents the dimensionally reduced input features. This weighted summation enables the model to prioritize spatially correlated regions relevant to the current cellular context (e.g., schistocytes) and adjacent pathological zones (e.g., platelet aggregation areas).
Multi-scale conv attention local branch
The primary objective of the local feature extraction branch is to capture fine-grained spatial details within input features through multi-scale convolutional operations. In designing this branch, we integrate strategies for multi-scale feature extraction and cross-channel interaction enhancement. Specifically, parallel convolutional kernels with varying receptive fields—such as standard 3 × 3 kernels, kernels with a dilation rate of 2, and kernels with a dilation rate of 3—are applied to mimic the multi-focal switching behavior employed by pathologists when examining cellular morphology. At each stage of feature processing, cross-channel information interaction is further enhanced through channel dimension adjustment and reordering.
The input to the local branch is first processed through a 1 × 1 convolutional layer, , followed by RS (channel dimension adjustment and rearrangement operations).
Subsequently, the local branch performs multi-scale feature extraction and fusion via parallel convolutional kernels, including standard convolution, dilated convolution with a rate of 2, and dilated convolution with a rate of 3. The convolutional formulations for each branch are specified in Eqs. (3) and (4):
(3)
(4)
The final local output is further augmented via a residual connection to , as formalized in Eq. (5):
(5)
Three-branch fusion
As illustrated in the architectural diagram, the MSCA employs residual connections to preserve low-level details from the original input features. This mechanism, when integrated with the local and global branches, achieves complementary information integration, effectively mitigating information degradation during deep network training. Specifically, the local branch enhances edge-texture features (e.g., serrated cell membrane edges), while the global branch models long-range dependencies (e.g., spatial co-occurrence relationships between platelets and schistocytes). Additionally, the original residual structure retains chromatic information from staining patterns. The final output is formulated as Eq. (6):
(6)
Here, denotes the global features output by the global attention branch, represents the local features generated by the local convolutional branch, and corresponds to the input feature map (original features).
Cross-scale interaction detection head
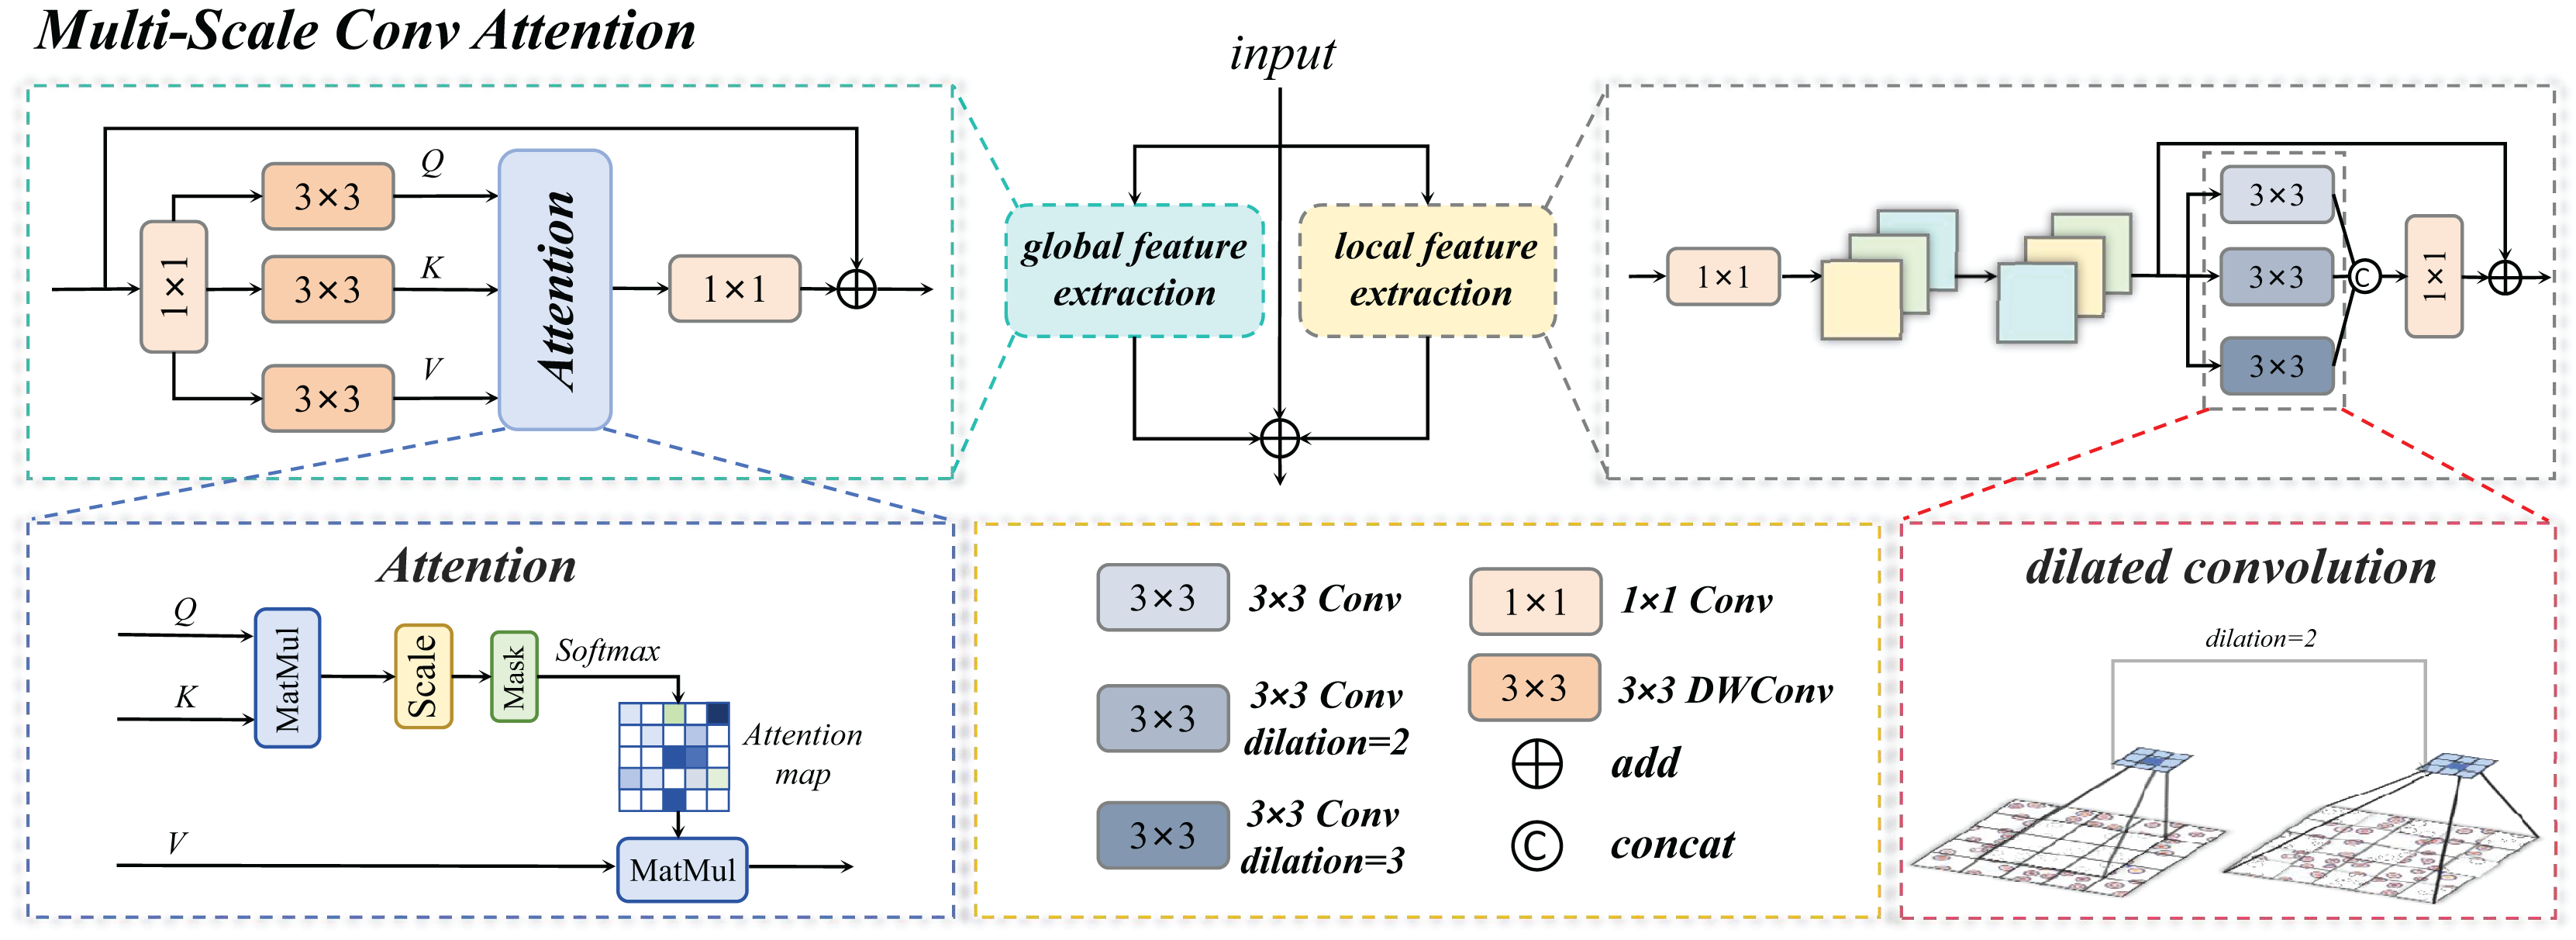
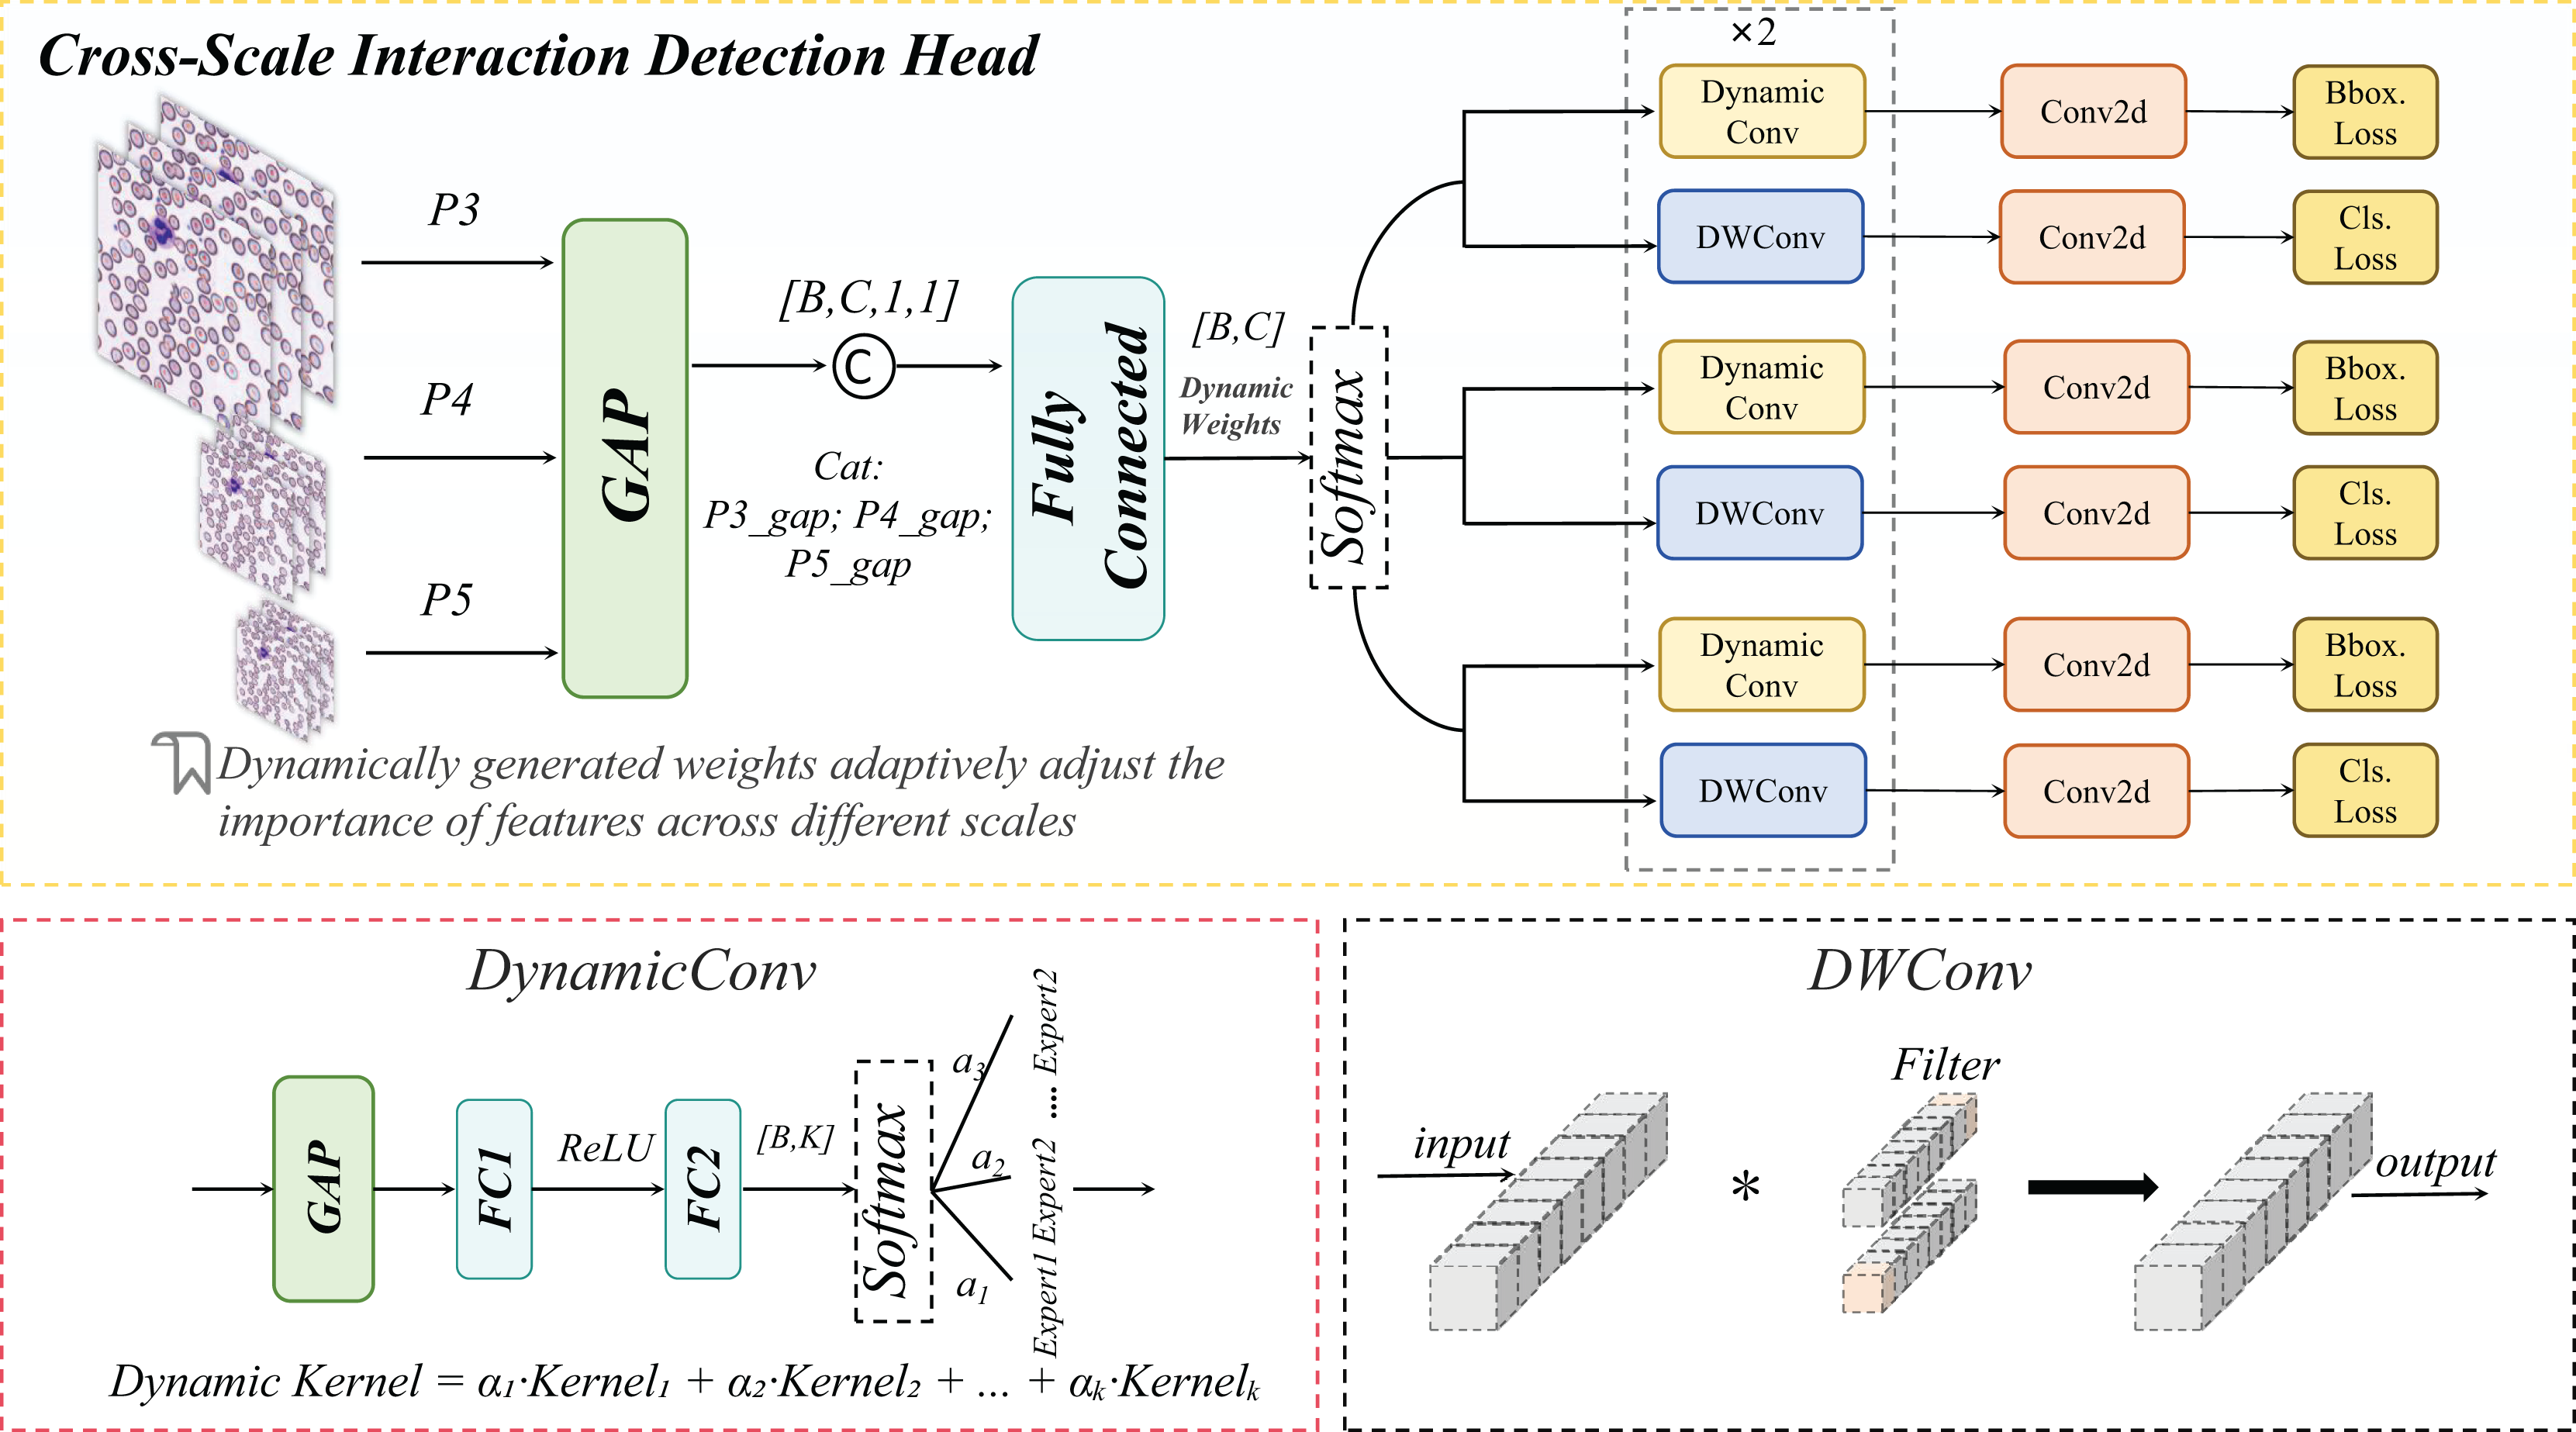
In peripheral blood smear (PBS) image analysis, significant size disparities exist among erythrocytes (~8 μm), leukocytes (~15 μm), and platelets (~2 μm). Furthermore, schistocytes often exhibit irregular morphologies (2–5 μm), closely resembling platelets or erythrocyte debris, posing substantial challenges for cell detection. Conventional feature pyramid networks (FPNs) employ static weighting to fuse multi-scale features (Lin et al., 2017). However, in PBS scenarios, high-level features tend to dominate platelet detection while suppressing low-frequency texture information critical for schistocyte identification. Simultaneously, the limited receptive fields of low-level features fail to adequately capture extended regions of leukocyte pseudopodia. To address these limitations, we propose a CSD module. This module introduces a dynamic weight generation mechanism to adaptively fuse cross-scale features, thereby mitigating the suppression of micro-scale targets by high-level features and enhancing the detection algorithm’s capability to identify small cells (e.g., platelets, schistocytes). The schematic architecture of the CSD module is detailed in Fig. 9.
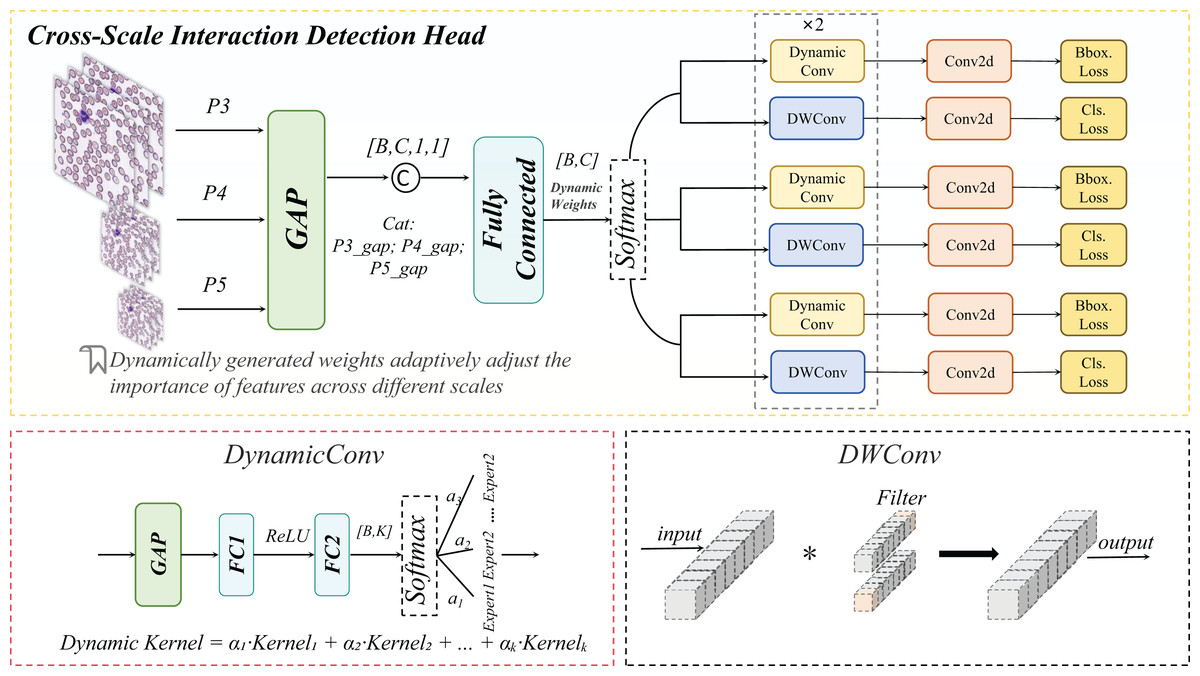
Figure 9: Cross-scale interaction detection head structural diagram.
Cross-scale interaction
A list of multi-scale feature maps is input, where denotes the feature map at the i scale. Subsequently, channel-wise descriptors are generated via Global Average Pooling (GAP) (Lin, Chen & Yan, 2013), as formulated in Eq. (7):
(7)
This operation compresses each scale-specific feature into a channel-wise descriptor , preserving contextual information across scales.
The descriptors from all scales are concatenated and fed into a fully connected (FC) network, as formalized in Eq. (8):
(8)
The concatenated descriptors are fed into the FC network, which generates dynamic parameters through dimensionality reduction and nonlinear transformation, as formalized in Eq. (9):
(9) where the dynamic parameter vector is partitioned into two components: (weight parameters) and (bias parameters).
The formulation for generating weights and bias parameters is formalized in Eq. (10):
(10) where the Softmax function ensures to normalize the weight distribution, while the Tanh activation constrains the bias parameters b within [−1, 1] to prevent feature shift caused by numerical instability.
Finally, weighted summation and bias adjustment are applied to the features at each scale, as formalized in Eq. (11):
(11) where denotes element-wise multiplication. This operation enhances critical scales (e.g., the P3 layer for schistocyte detection) through channel-wise dynamic scaling, while the bias term preserves the original staining characteristics.
DynamicHead
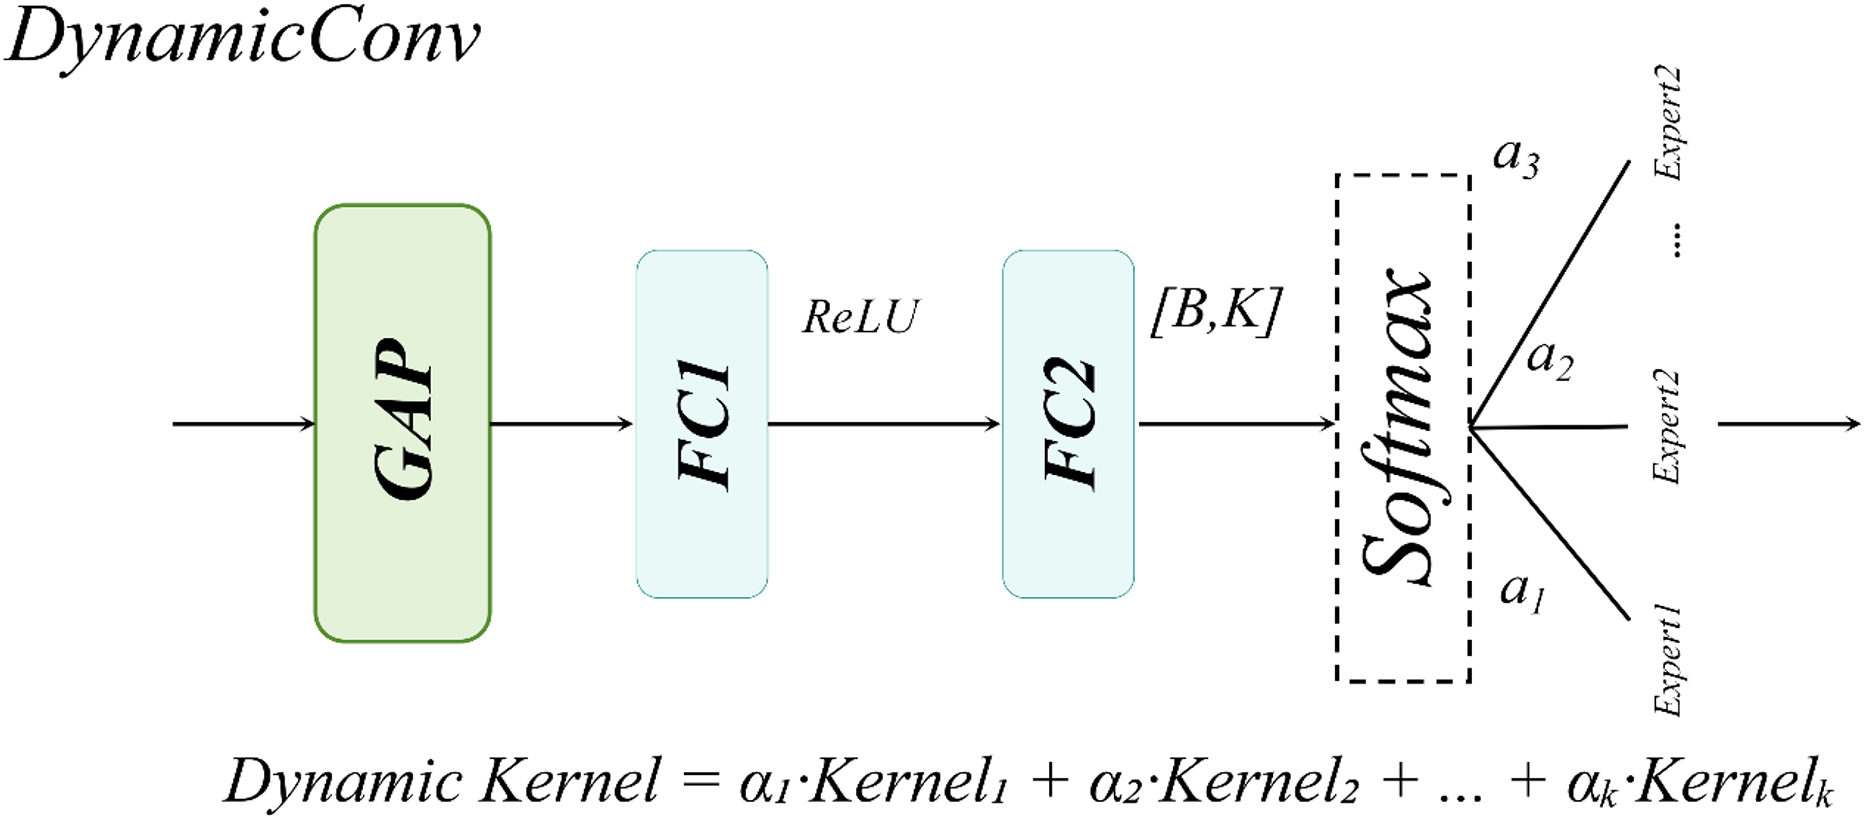
The DynamicHead module introduces DynamicConv, which innovatively decouples the expansion of the parameter space (i.e., increasing the number of expert kernels, K) from computational costs. By integrating a multi-expert mechanism with dynamic routing principles, it achieves an optimal balance between enhanced model capacity and inference speed (Han et al., 2023). As illustrated in Fig. 10 to address lightweight requirements, the classification branch combines Depthwise Separable Convolution with DynamicConv (Howard et al., 2017), further minimizing computational overhead.
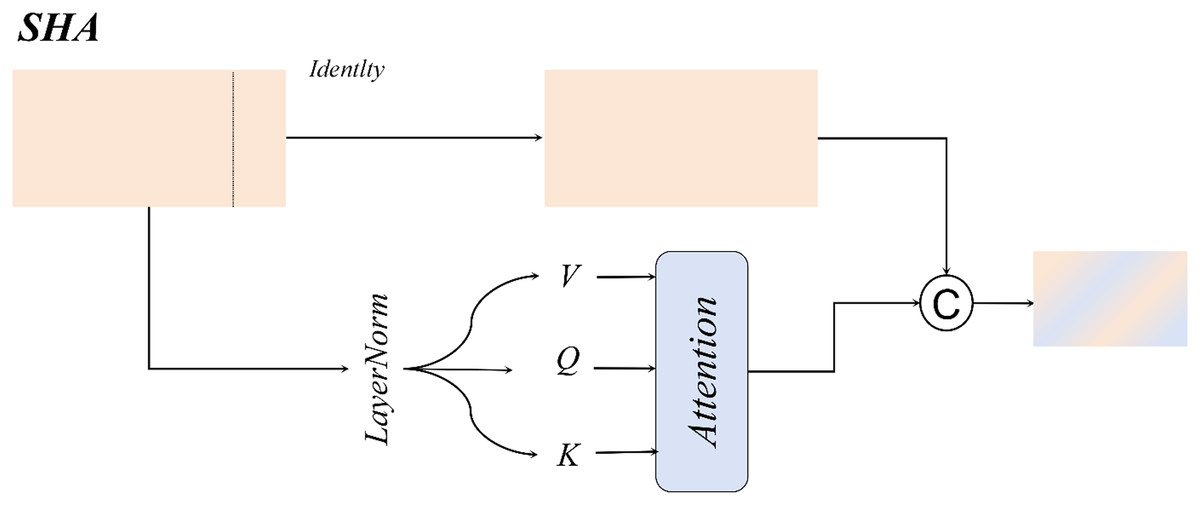
Figure 10: Dynamic convolution structural diagram.
The dynamic convolution kernel is generated through a linear combination of multiple expert convolution kernels, as formalized in Eq. (12):
(12)
Here, a linear transformation is applied to map the input channel dimension to the number of experts, and the sigmoid activation function ensures non-sparse weight allocation.
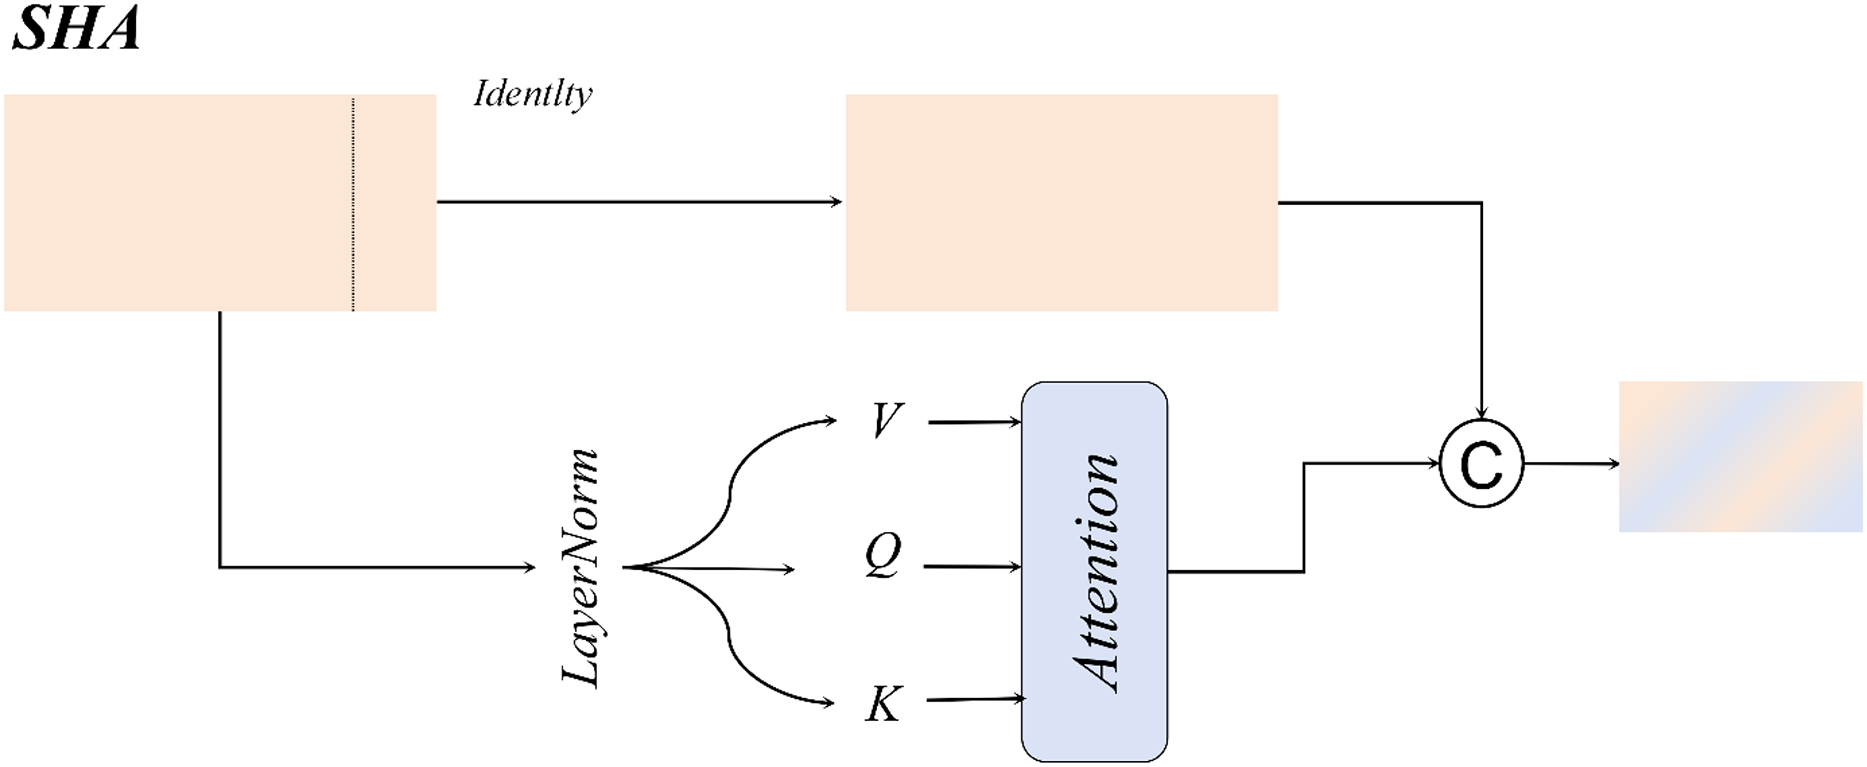
Single-head self-attention
For large-sized white blood cells (WBCs) in the dataset, the single-head self-attention mechanism enhances the contextual correlation between nuclei and cytoplasm through a spatial-aware matrix, as illustrated in Fig. 11.
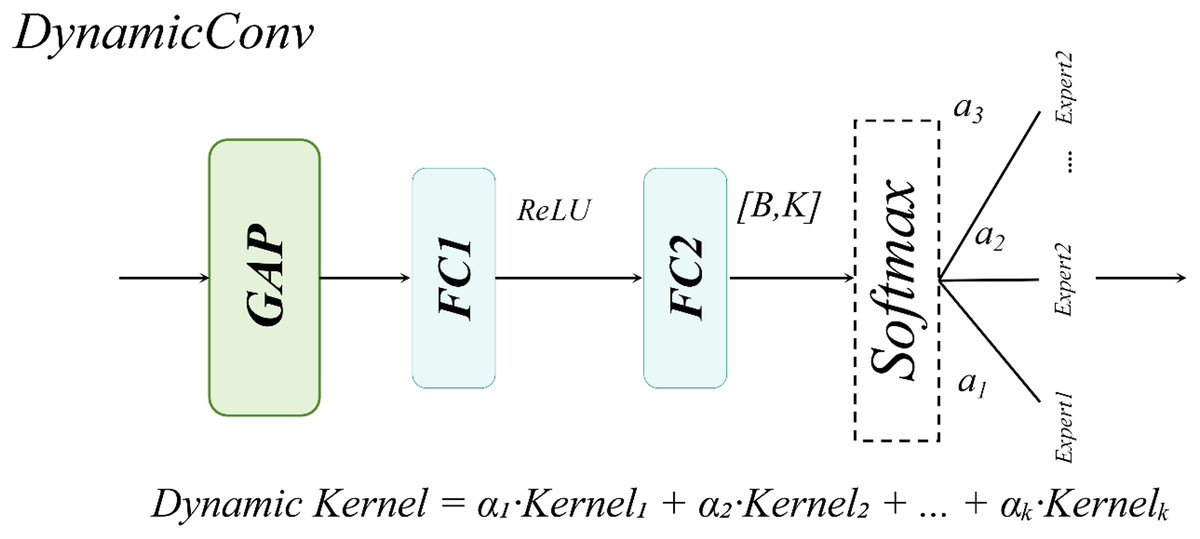
Figure 11: Single-head self-attention structural diagram.
For WBCs with diameters ranging from 20 to 50 μm, the single-head design leverages cross-subblock correlation computation to dynamically fuse nuclear texture features with cell membrane boundaries, as formalized in Eq. (13):
(13)
Compared to multi-head attention mechanisms, the single-head attention mechanism exhibits a more concentrated attention distribution, effectively mitigating the dilution of critical features caused by redundant multi-kernel computations. This design achieves an optimal balance between enhanced detection accuracy and computational efficiency in WBC detection tasks.
Normalized Gaussian Wasserstein distance
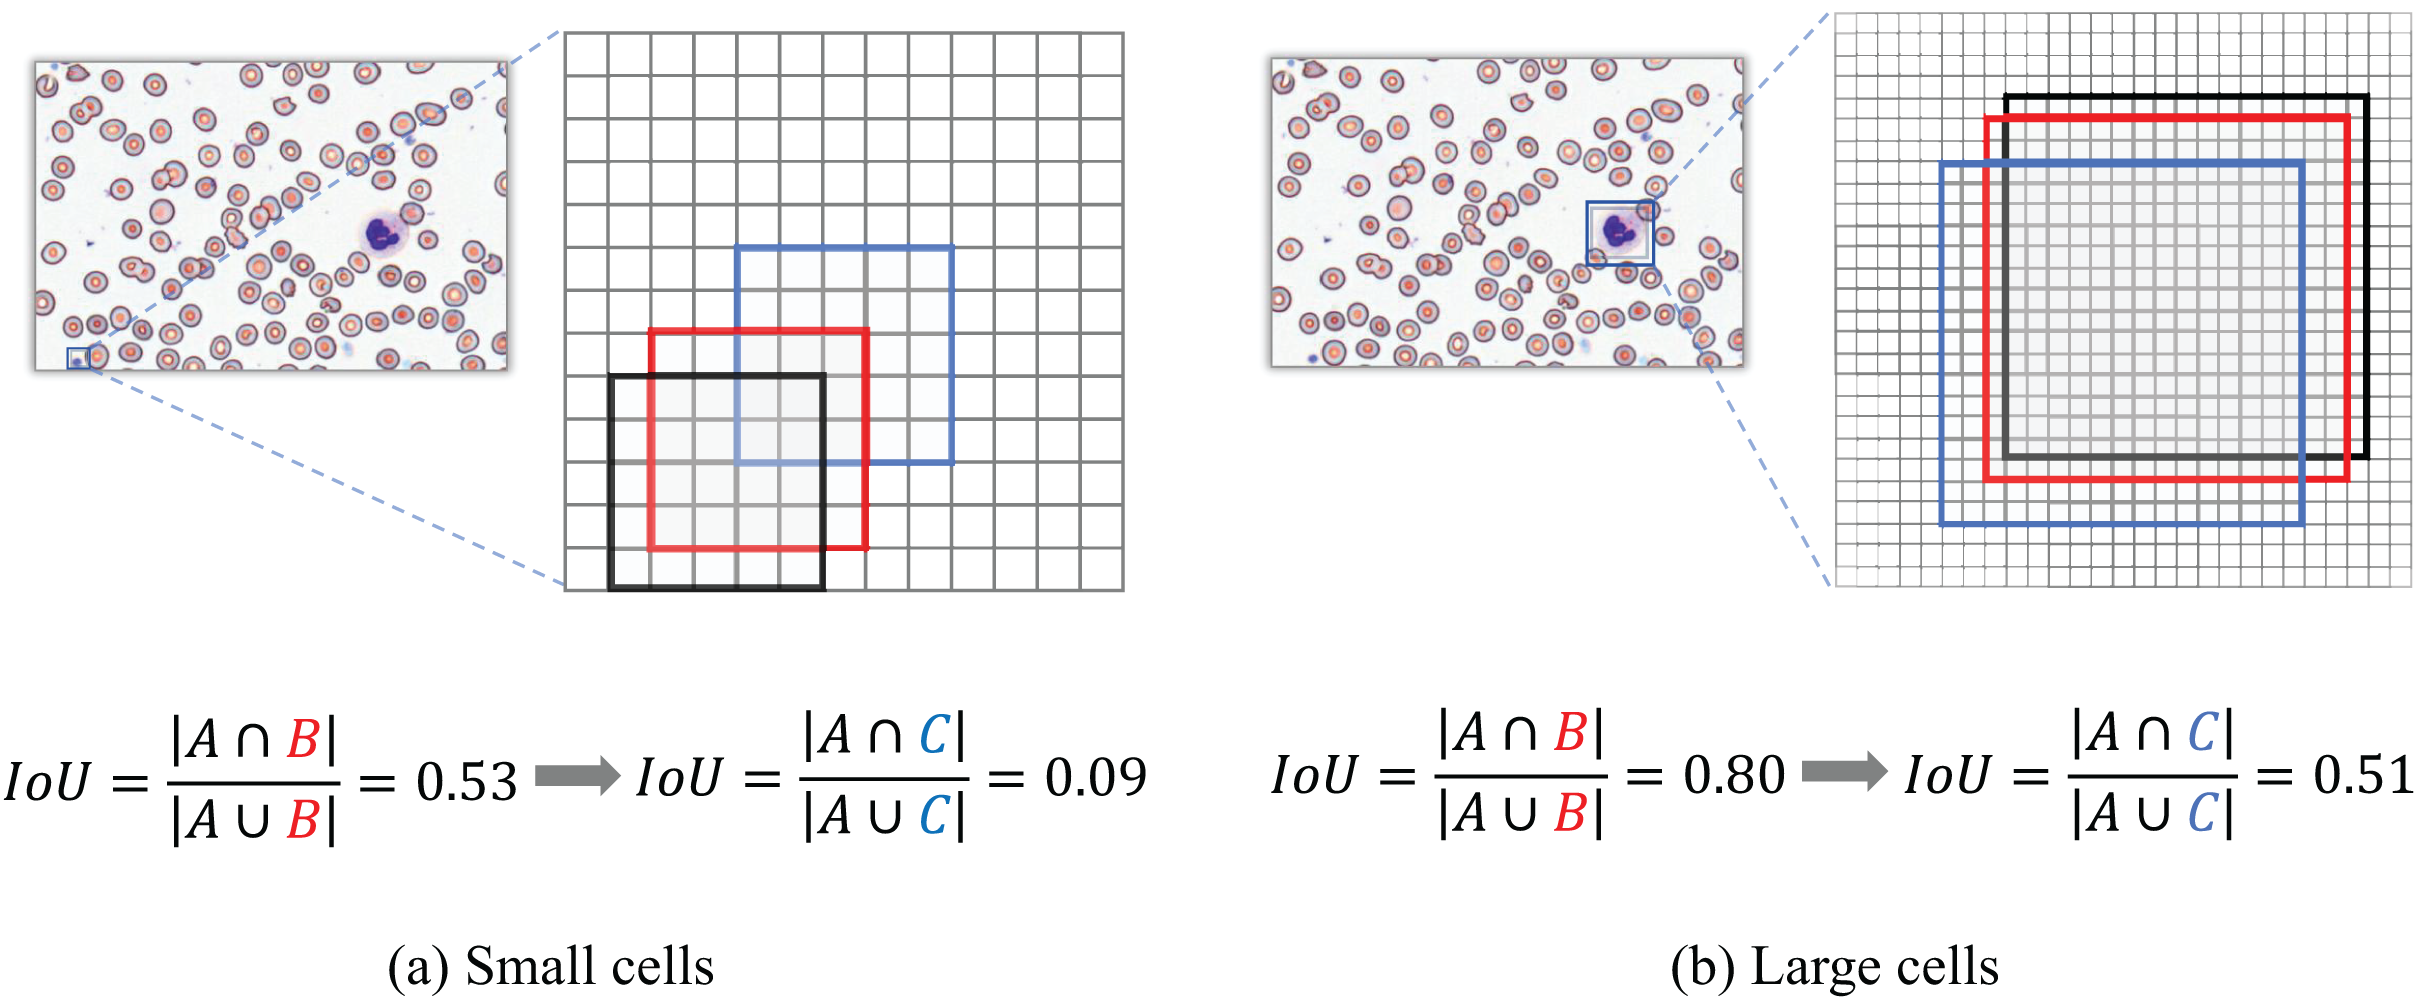
When evaluating detection performance on blood smear cell datasets, the conventional Intersection over Union (IoU) metric exhibits significant limitations, particularly in our constructed SBSD dataset, as demonstrated in Fig. 12. Predicted bounding boxes exhibit heightened sensitivity to positional deviations for small targets such as platelets or fragmented RBC debris. Specifically, minor positional shifts for platelets result in disproportionately amplified changes in IoU values, whereas the same pixel-level displacement induces relatively minor IoU variations for larger cells, such as WBCs.
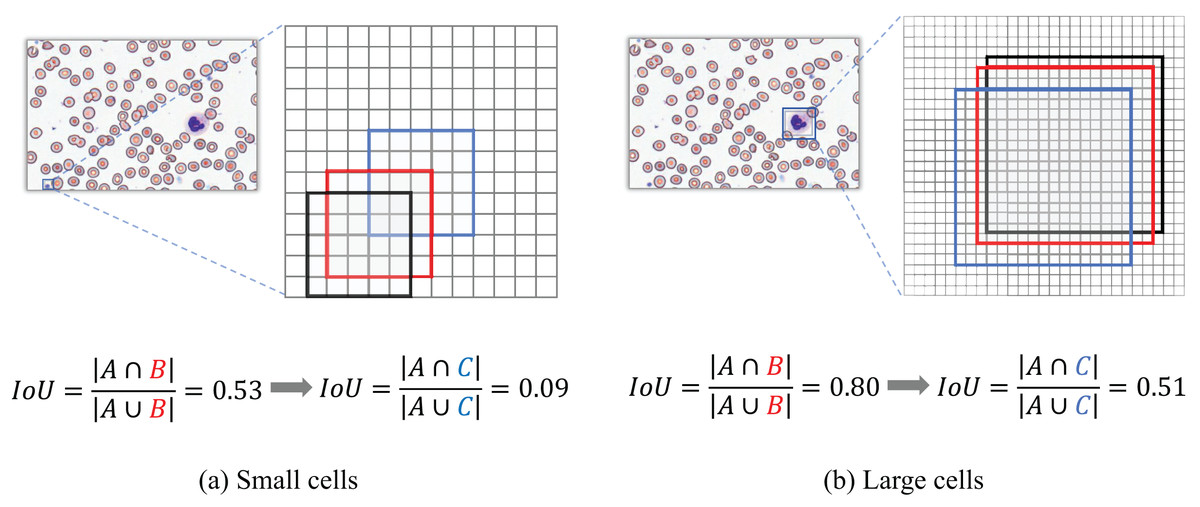
Figure 12: IoU deviation extent for large vs small target detection.
Figure 12 Black box A denotes the ground-truth bounding box; red box B represents the predicted bounding box with a diagonal displacement of 1 pixel; blue box C corresponds to the predicted bounding box with a diagonal displacement of three pixels.
Traditional IoU exhibits significant limitations in evaluating bounding box similarity for tiny objects. To address this, our study introduces the NWD, which leverages the Wasserstein distance to assess the similarity of bounding boxes for small targets by modeling them as two-dimensional Gaussian distributions.
Gaussian distribution modeling for bounding boxes
In the SBSD dataset, most cells exhibit non-rectangular morphologies (e.g., platelets with biconvex discoid or elliptical shapes), which inherently misalign with axis-aligned rectangular bounding boxes. Directly applying rectangular bounding boxes in SBSD inevitably encapsulates partial staining background regions, thereby introducing localization inaccuracies. To address this, we model bounding boxes as two-dimensional Gaussian distributions, where the central region (corresponding to the actual cellular structure) is assigned higher pixel weights, while weights decay towards the edges. The mathematical formulation for the inscribed ellipse is provided in Eq. (14):
(14)
Here, (cx, cy) denotes the center coordinates of the rectangle, while and represent the semi-axis lengths along the x-axis and y-axis of the rectangle, respectively.
For any axis-aligned bounding box defined by its center coordinates , width , and height , we parameterize it as a 2D Gaussian distribution through the following steps:
(1) Mean Vector : The mean is set to the center of the bounding box, placing the peak of the Gaussian distribution at the box’s center: .
(2) Covariance Matrix Σ: The covariance matrix is set to a diagonal matrix, where the diagonal elements are derived from the width and height of the box. This ensures the Gaussian distribution’s spread matches the box’s dimensions: .
This choice of is geometrically motivated. The semi-axis lengths of the ellipse inscribed within the bounding box are and . For a 2D Gaussian distribution, the ellipse defined by the Mahalanobis distance ⊺ corresponds to the inscribed ellipse when . Thus, the Gaussian distribution accurately captures the spatial extent of the bounding box, with highest probability density at the center and decay towards the edges.
The probability density function of the two-dimensional Gaussian distribution is formalized in Eq. (15):
(15) where x denotes the positional coordinates, and represent the mean vector and covariance matrix, respectively.
When ⊺ the axis-aligned bounding box can be modeled as a two-dimensional Gaussian distribution, as formalized in Eq. (16):
(16) where .
To illustrate, consider a ground-truth bounding box for a platelet with coordinates . Using Eq. (16), the Gaussian parameters are:
A predicted bounding box for the same object with coordinates yields:
The NWD between these two Gaussian distributions is then computed using Eqs. (17) and (19).
Normalized Gaussian Wasserstein distance
The Wasserstein distance is employed to compute the similarity between the two-dimensional Gaussian distributions derived from the ground-truth and predicted bounding boxes, as formulated in Eq. (17):
(17)
Since these Gaussian distributions are modeled from bounding boxes A and B, Eq. (17) can be further simplified to Eq. (18):
(18)
Since the traditional IoU operates within the range [0, 1], the Wasserstein distance must also be normalized to align with this scale. The normalization is formulated in Eq. (19):
(19) where is a parameter representing the average absolute sizeof targets in the dataset.
In the integration of NWD loss, we introduce a hybrid weighting parameter to balance the contributions of the traditional IoU loss and the NWD loss, as detailed in Eq. (20).
(20)
Results
Datasets
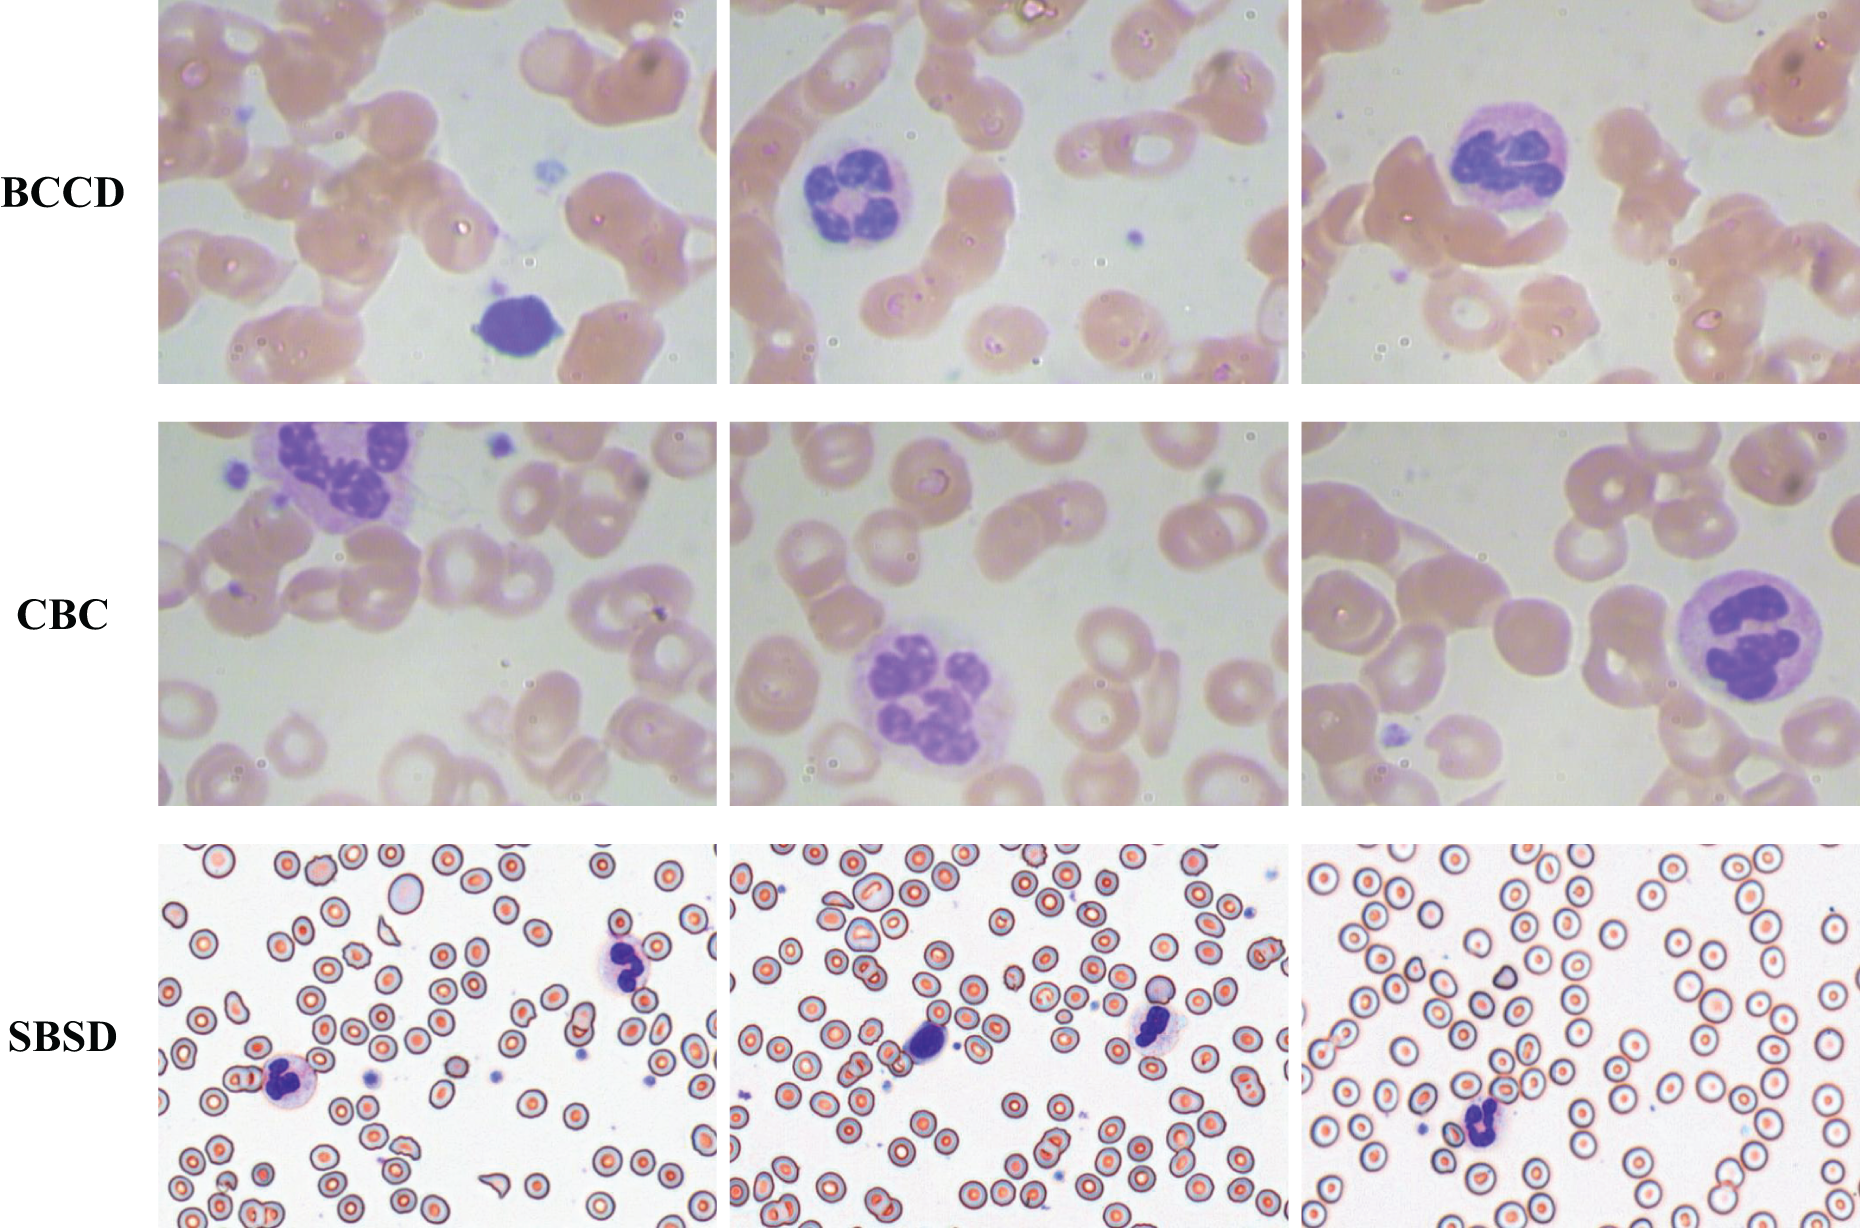
To validate the generalization capability of the proposed algorithm, experiments are conducted on three datasets: SBSD, BCCD, and CBC (Fig. 13). BCCD and CBC are publicly available medical detection datasets containing three blood cell categories: erythrocytes, leukocytes, and platelets. All datasets are partitioned into training, validation, and test sets in an 8:1:1 ratio. The blood smear cell dataset (SBSD) used in this study has been publicly deposited in the Zenodo repository: Chen, R. (2025). Blood Smear Cell Dataset (SBSD) [Data set]. Zenodo. https://doi.org/10.5281/zenodo.15676241.
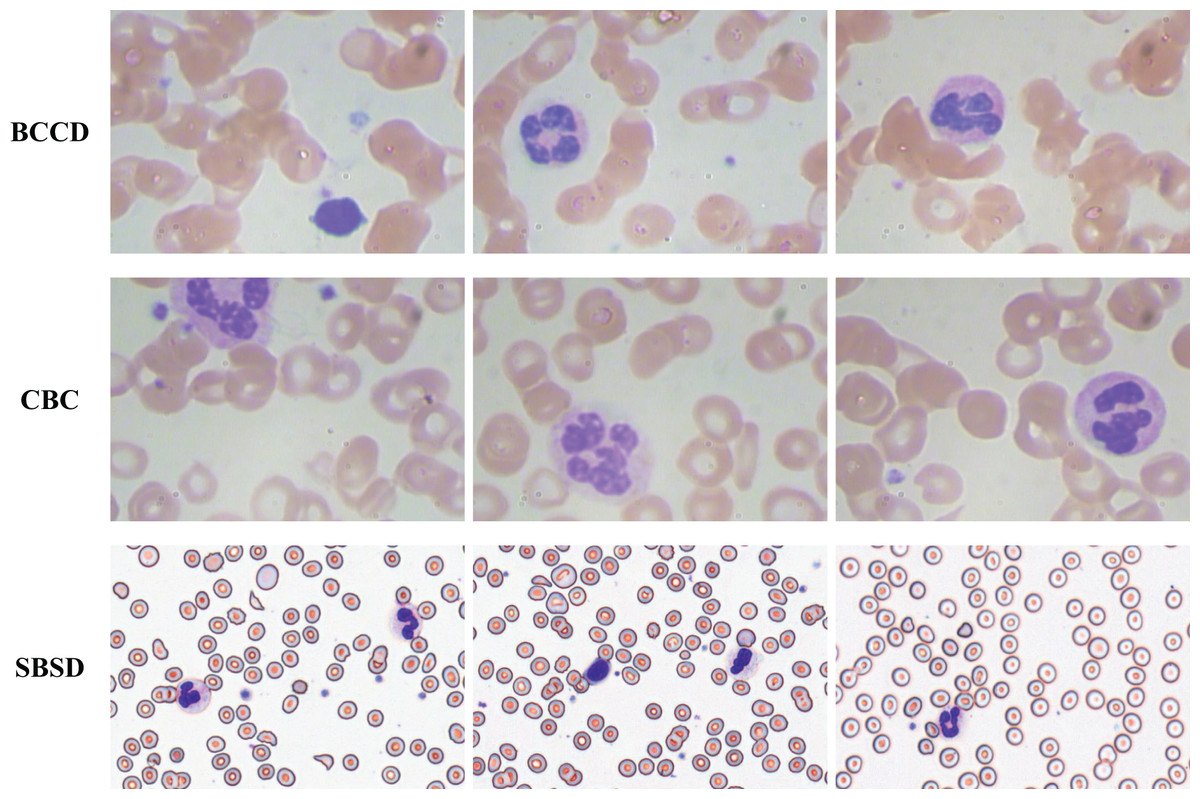
Figure 13: BCCD, CBC, and SBSD datasets.
Experimental setup
The experiments are configured as follows: Hardware: Windows 11 OS, NVIDIA GeForce RTX 4070Super 12G GPU, 13th Gen Intel(R) Core(TM) i5-13490F 2.50 GHz CPU. Software: PyTorch 2.4.1 with CUDA 12.4.Optimizer: SGD with an initial learning rate of 0.01, weight decay coefficient of 0.0005, and momentum factor of 0.937. Training: 100 epochs with a batch size of 4. The hybrid weight parameter for IOU loss and NWD loss is set to 0.3.
Evaluation metrics
The detection performance is evaluated using Precision (P), Recall (R), and mean Average Precision (mAP), with their mathematical formulations provided in Eqs. (21)–(23):
(21)
(22)
(23)
Additionally, model complexity is quantified via the number of parameters (Params), computational complexity is measured in giga floating-point operations (GFLOPs), and inference speed is evaluated using frames per second (FPS).
Experimental results
Ablation study
To validate the efficacy of the four methodologies proposed in ‘Materials and Methods’, ablation experiments were conducted on our in-house SBSD dataset. Using YOLOv10m as the baseline model, the experimental results are detailed in Table 2. Figure 14 illustrates the training progression and loss variation as each module is incrementally integrated into the model.
| Model | MSCA | CSD | SHA | NWD | P | R | [email protected] | Param (M) | GFLOPs | FPS |
|---|---|---|---|---|---|---|---|---|---|---|
| Baseline | 0.869 | 0.860 | 0.919 ± 0.0018 | 16.5M | 63.4 | 107.5 | ||||
| Baseline | √ | 0.889 | 0.855 | 0.927 | 17.0M | 63.9 | 80.0 | |||
| Baseline | √ | 0.879 | 0.879 | 0.931 | 15.2M | 56.2 | 108.7 | |||
| Baseline | √ | 0.882 | 0.866 | 0.925 | 17.3M | 64.1 | 93.5 | |||
| Baseline | √ | 0.900 | 0.890 | 0.938 | 16.5M | 63.4 | 109 | |||
| Baseline | √ | √ | 0.886 | 0.878 | 0.932 | 15.5M | 56.4 | 81.3 | ||
| Baseline | √ | √ | 0.898 | 0.872 | 0.932 | 17.9M | 64.6 | 75.2 | ||
| Baseline | √ | √ | 0.901 | 0.886 | 0.945 | 17.0M | 63.9 | 80.1 | ||
| Baseline | √ | √ | 0.881 | 0.887 | 0.934 | 16.1M | 56.8 | 90.9 | ||
| Baseline | √ | √ | 0.887 | 0.901 | 0.946 | 15.2M | 56.2 | 102 | ||
| Baseline | √ | √ | 0.892 | 0.894 | 0.946 | 17.3M | 64.1 | 86.2 | ||
| Baseline | √ | √ | √ | 0.897 | 0.884 | 0.937 | 16.6M | 57.3 | 72.4 | |
| Baseline | √ | √ | √ | 0.912 | 0.903 | 0.948 | 15.5M | 56.4 | 75.8 | |
| Baseline | √ | √ | √ | 0.911 | 0.884 | 0.946 | 17.9M | 64.6 | 71.4 | |
| Baseline | √ | √ | √ | 0.913 | 0.883 | 0.947 | 16.1M | 56.8 | 72.9 | |
| Baseline | √ | √ | √ | √ | 0.915 | 0.922 | 0.958 ± 0.0022 | 16.6M | 57.3 | 64.9 |
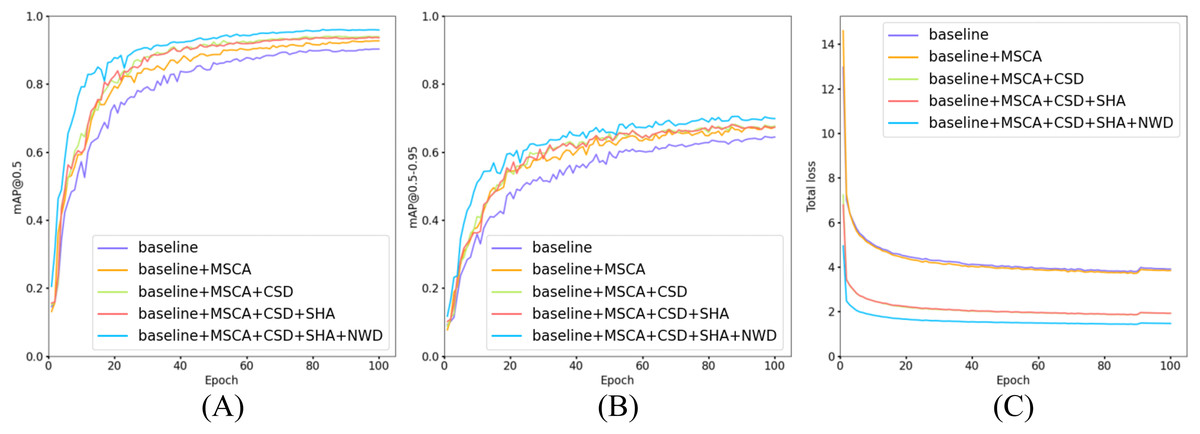
Figure 14: Comparison of training and loss curves: baseline models vs models with incrementally added modules.
(A) Trend curves of [email protected] for five model configurations during training. (B) Trend curves of [email protected]–0.95 for five model configurations during training. (C) Trend curves of total loss for five model configurations during training.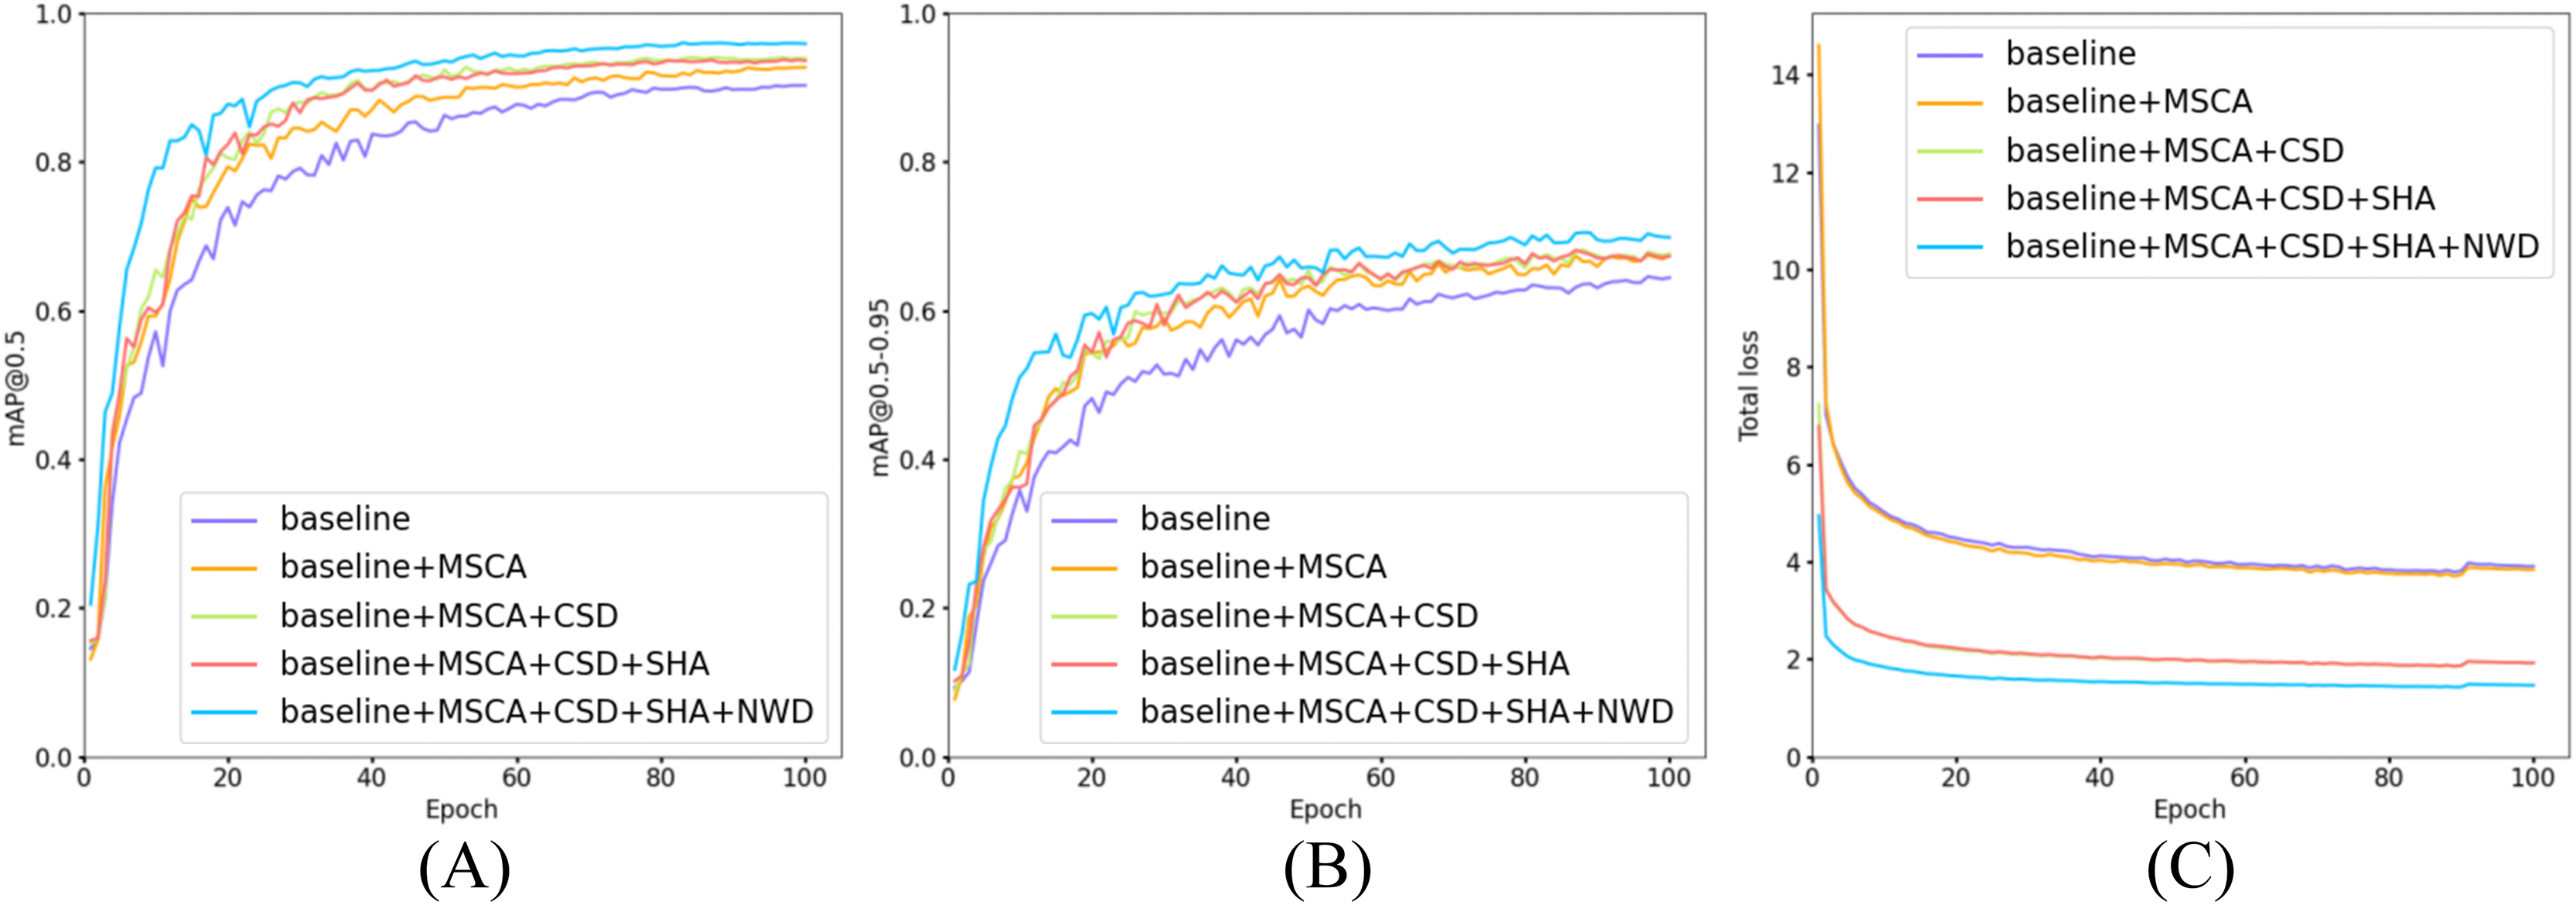
As shown in Table 2, the proposed MCS-Net achieves the highest overall performance on the SBSD dataset, attaining an [email protected] of 0.958 ± 0.0022—a statistically significant improvement of 3.9% over the baseline model (0.919 ± 0.0018), as confirmed by a paired t-test (p < 0.001). It also achieves the highest precision (0.915) and recall (0.922) among all configurations. While maintaining stable parameter counts (16.5M → 16.6M) and reducing computational complexity by 9.6% (GFLOPs: 63.4 → 57.3), the model exhibits a slight decline in inference speed, reflecting a trade-off between accuracy and real-time performance.
When individually integrating the four modules (MSCA, CSD, SHA, NWD), all configurations improve [email protected]. Notably, the CSD module significantly reduces model complexity and computational load (15.2M Params, 56.2 GFLOPs) while preserving high inference speed (108.7 FPS), underscoring its pivotal role in lightweight design. (We rigorously define a model as “lightweight” if it simultaneously satisfies three criteria: parameter count (Params) ≤20M, computational complexity (GFLOPs) ≤60, and inference speed (FPS) ≥100 on a high-end GPU, ensuring deployability on resource-constrained clinical hardware). The NWD module enhances localization robustness for tiny targets via Gaussian distribution modeling, achieving [email protected] = 0.938 (+1.7%) without additional computational overhead. The CSD+NWD lightweight combinationachieves [email protected] = 0.946 with 15.2M parametersand 102 FPS, making it ideal for real-time scenarios. Meanwhile, the MSCA+NWD configurationbalances [email protected] = 0.945 and 80.1 FPS, suitable for applications with moderate accuracy demands.
As illustrated in Fig. 14, all five model configurations exhibit convergence toward stability in both [email protected] and [email protected]–0.95 metrics as training epochs progressively increase. The incremental integration of each proposed module consistently enhances [email protected] and [email protected]–0.95. Notably, in Fig. 14C, the introduction of the CSD detection head significantly reduces the total loss, indicating that its dynamic weight allocation strategy effectively promotes balanced detection across diverse cell categories. Furthermore, the NWD module improves the detection performance for small cells (e.g., platelets and fragmented erythrocytes), resulting in a further reduction in total loss. The full model configuration achieves faster convergence and lower total loss values, demonstrating the synergistic benefits of the proposed modules.
This study conducts a comprehensive investigation into the impact of individual algorithmic modules on the detection performance of six critical blood cell categories: RBC, platelets, schistocytes, granulocytes, monocytes, and lymphocytes. Through rigorous experimentation, we validate the efficacy of each module in addressing detection challenges across cells of varying morphological scales (2–50 μm). Module A denotes the CSD module, Module B represents the SHA module, Module C corresponds to the NWD module, and MCS-Net represents the full configuration integrating CSD, SHA, NWD, and MSCA modules.
Table 3 presents a comprehensive evaluation of how the proposed modules individually and synergistically improve detection accuracy for six blood cell categories in the SBSD dataset. Key observations include: The baseline model (YOLOv10m) achieves strong performance for erythrocytes (RBC: 0.989 ± 0.0004) and granulocytes (GRAN: 0.967 ± 0.0033) but struggles with smaller or morphologically complex targets, particularly schistocytes (0.848 ± 0.0075 AP) and monocytes (MONO: 0.896). The CSD module enhances the detection of granulocytes (GRAN: +0.3% to 0.970) and monocytes (MONO: +3.3% to 0.929) by mitigating feature suppression in dense clusters. SHA: Improves schistocyte detection (0.841 vs. baseline 0.834) through focused nuclear-cytoplasmic correlation modeling but slightly reduces platelet (PLT: 0.872) precision due to attention dilution. NWD: Significantly boosts schistocyte AP (+5.5% to 0.895) by addressing positional sensitivity for fragmented cells. MSCA: Strengthens platelet detection (PLT: 0.899 vs. baseline 0.883) through multi-scale feature fusion but marginally degrades lymphocyte (LYM: 0.948) performance. CSD+NWD: Achieves balanced improvements across scales, elevating PLT (0.906), GRAN (0.984), LYM (0.983), and schistocytes (0.882) while maintaining real-time efficiency. SHA+NWD+MSCA: Demonstrates strong synergy for schistocytes (0.896 AP) and monocytes (0.947), validating the complementary roles of attention and distributional loss. Full MCS-Net Integration: The complete model (MSCA+CSD+SHA+NWD) attains peak performance for GRAN (0.987 ± 0.0023), LYM (0.980 ± 0.0035), MONO (0.980 ± 0.0050), and schistocytes (0.901 ± 0.0039), resolving inter-class conflicts through hierarchical feature fusion. While the SHA module alone slightly reduces PLT precision, its integration within the full MCS-Net framework, complemented by NWD and other components, restores and enhances overall accuracy, achieving a final PLT AP of 0.908 ± 0.0066.
| Model | AP | |||||
|---|---|---|---|---|---|---|
| RBC | PLT | GRAN | LYM | MONO | Schistocyte | |
| Baseline | 0.989 ± 0.0004 |
0.843 ± 0.0033 |
0.967 ± 0.0033 |
0.934 ± 0.0122 |
0.934 ± 0.0059 |
0.848 ± 0.0075 |
| +CSD | 0.988 | 0.891 | 0.970 | 0.971 | 0.929 | 0.836 |
| +SHA | 0.990 | 0.872 | 0.965 | 0.957 | 0.925 | 0.841 |
| +NWD | 0.990 | 0.887 | 0.972 | 0.962 | 0.923 | 0.895 |
| +MSCA | 0.990 | 0.899 | 0.974 | 0.948 | 0.911 | 0.838 |
| +CSD+SHA | 0.988 | 0.887 | 0.978 | 0.962 | 0.954 | 0.837 |
| +CSD+NWD | 0.989 | 0.906 | 0.984 | 0.983 | 0.955 | 0.882 |
| +CSD+MSCA | 0.989 | 0.897 | 0.973 | 0.963 | 0.917 | 0.841 |
| +SHA+NWD | 0.991 | 0.883 | 0.982 | 0.966 | 0.960 | 0.893 |
| +SHA+MSCA | 0.989 | 0.888 | 0.986 | 0.956 | 0.920 | 0.851 |
| +NWD+MSCA | 0.991 | 0.884 | 0.984 | 0.973 | 0.957 | 0.888 |
| +CSD+SHA+NWD | 0.989 | 0.910 | 0.987 | 0.971 | 0.944 | 0.887 |
| +CSD+SHA+MSCA | 0.989 | 0.898 | 0.982 | 0.962 | 0.956 | 0.847 |
| +CSD+NWD+MSCA | 0.989 | 0.910 | 0.987 | 0.971 | 0.944 | 0.887 |
| +SHA+NWD+MSCA | 0.991 | 0.884 | 0.983 | 0.966 | 0.947 | 0.896 |
| MCS-Net | 0.989 ± 0.0000 |
0.908 ± 0.0066 |
0.987 ± 0.0023 |
0.980 ± 0.0035 |
0.980 ± 0.0050 |
0.901 ± 0.0039 |
The synergistic value of the full MCS-Net is justified by the complementary insights from Tables 2 and 3. While certain module combinations (e.g., CSD+NWD) achieve high overall mAP and efficiency, they exhibit subtle but important trade-offs in specific cell categories, as detailed in Table 3. The complete MCS-Net architecture is therefore motivated by the need for holistic optimization. By integrating all four components, the model achieves synergistic compensation—where the MSCA provides a multi-scale foundation, the CSD head enables dynamic feature refinement, the SHA enhances large-cell context, and the NWD ensures precise micro-target localization. This results in the most balanced and superior performance across all cell types, particularly for critical pathological targets like schistocytes, without the performance compromises seen in suboptimal combinations.
Figure 15 illustrates a comparative analysis of detection performance between the baseline model and the MCS-Net model on the SBSD dataset. While both models demonstrate robust detection capabilities, subtle differences are observed in their results: Fig. 15A displays three original images, where the black dashed boxes and corresponding enlarged areas represent regions selected for detection comparison. In Fig. 15B, two black arrows indicate undetected platelets. Figure 15B shows that the baseline model misclassifies a schistocyte as an erythrocyte. Figure 15B reveals false positives for schistocytes generated by the baseline model. In contrast, Figure 15C demonstrates that MCS-Net accurately identifies platelets within the blue dashed box. Figure 15C confirms that MCS-Net eliminates such misclassifications, highlighting its superior specificity.
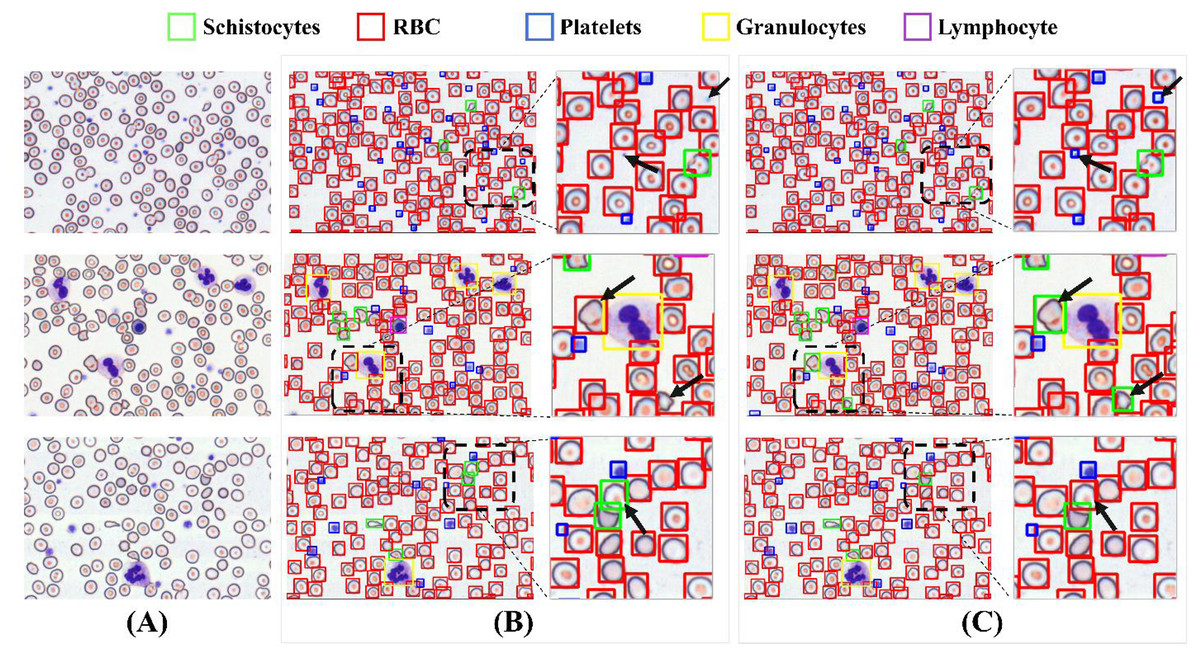
Figure 15: Comparison of detection performance between baseline model and MCS-Net.
(A) Original images. (B) Baseline detection results. (C) MCS-Net model detection results, the green bounding boxes denote schistocytes, the red bounding boxes represent red blood cells (RBCs), the blue bounding boxes indicate platelets, the yellow bounding boxes correspond to granulocytes, and the purple bounding boxes signify lymphocytes.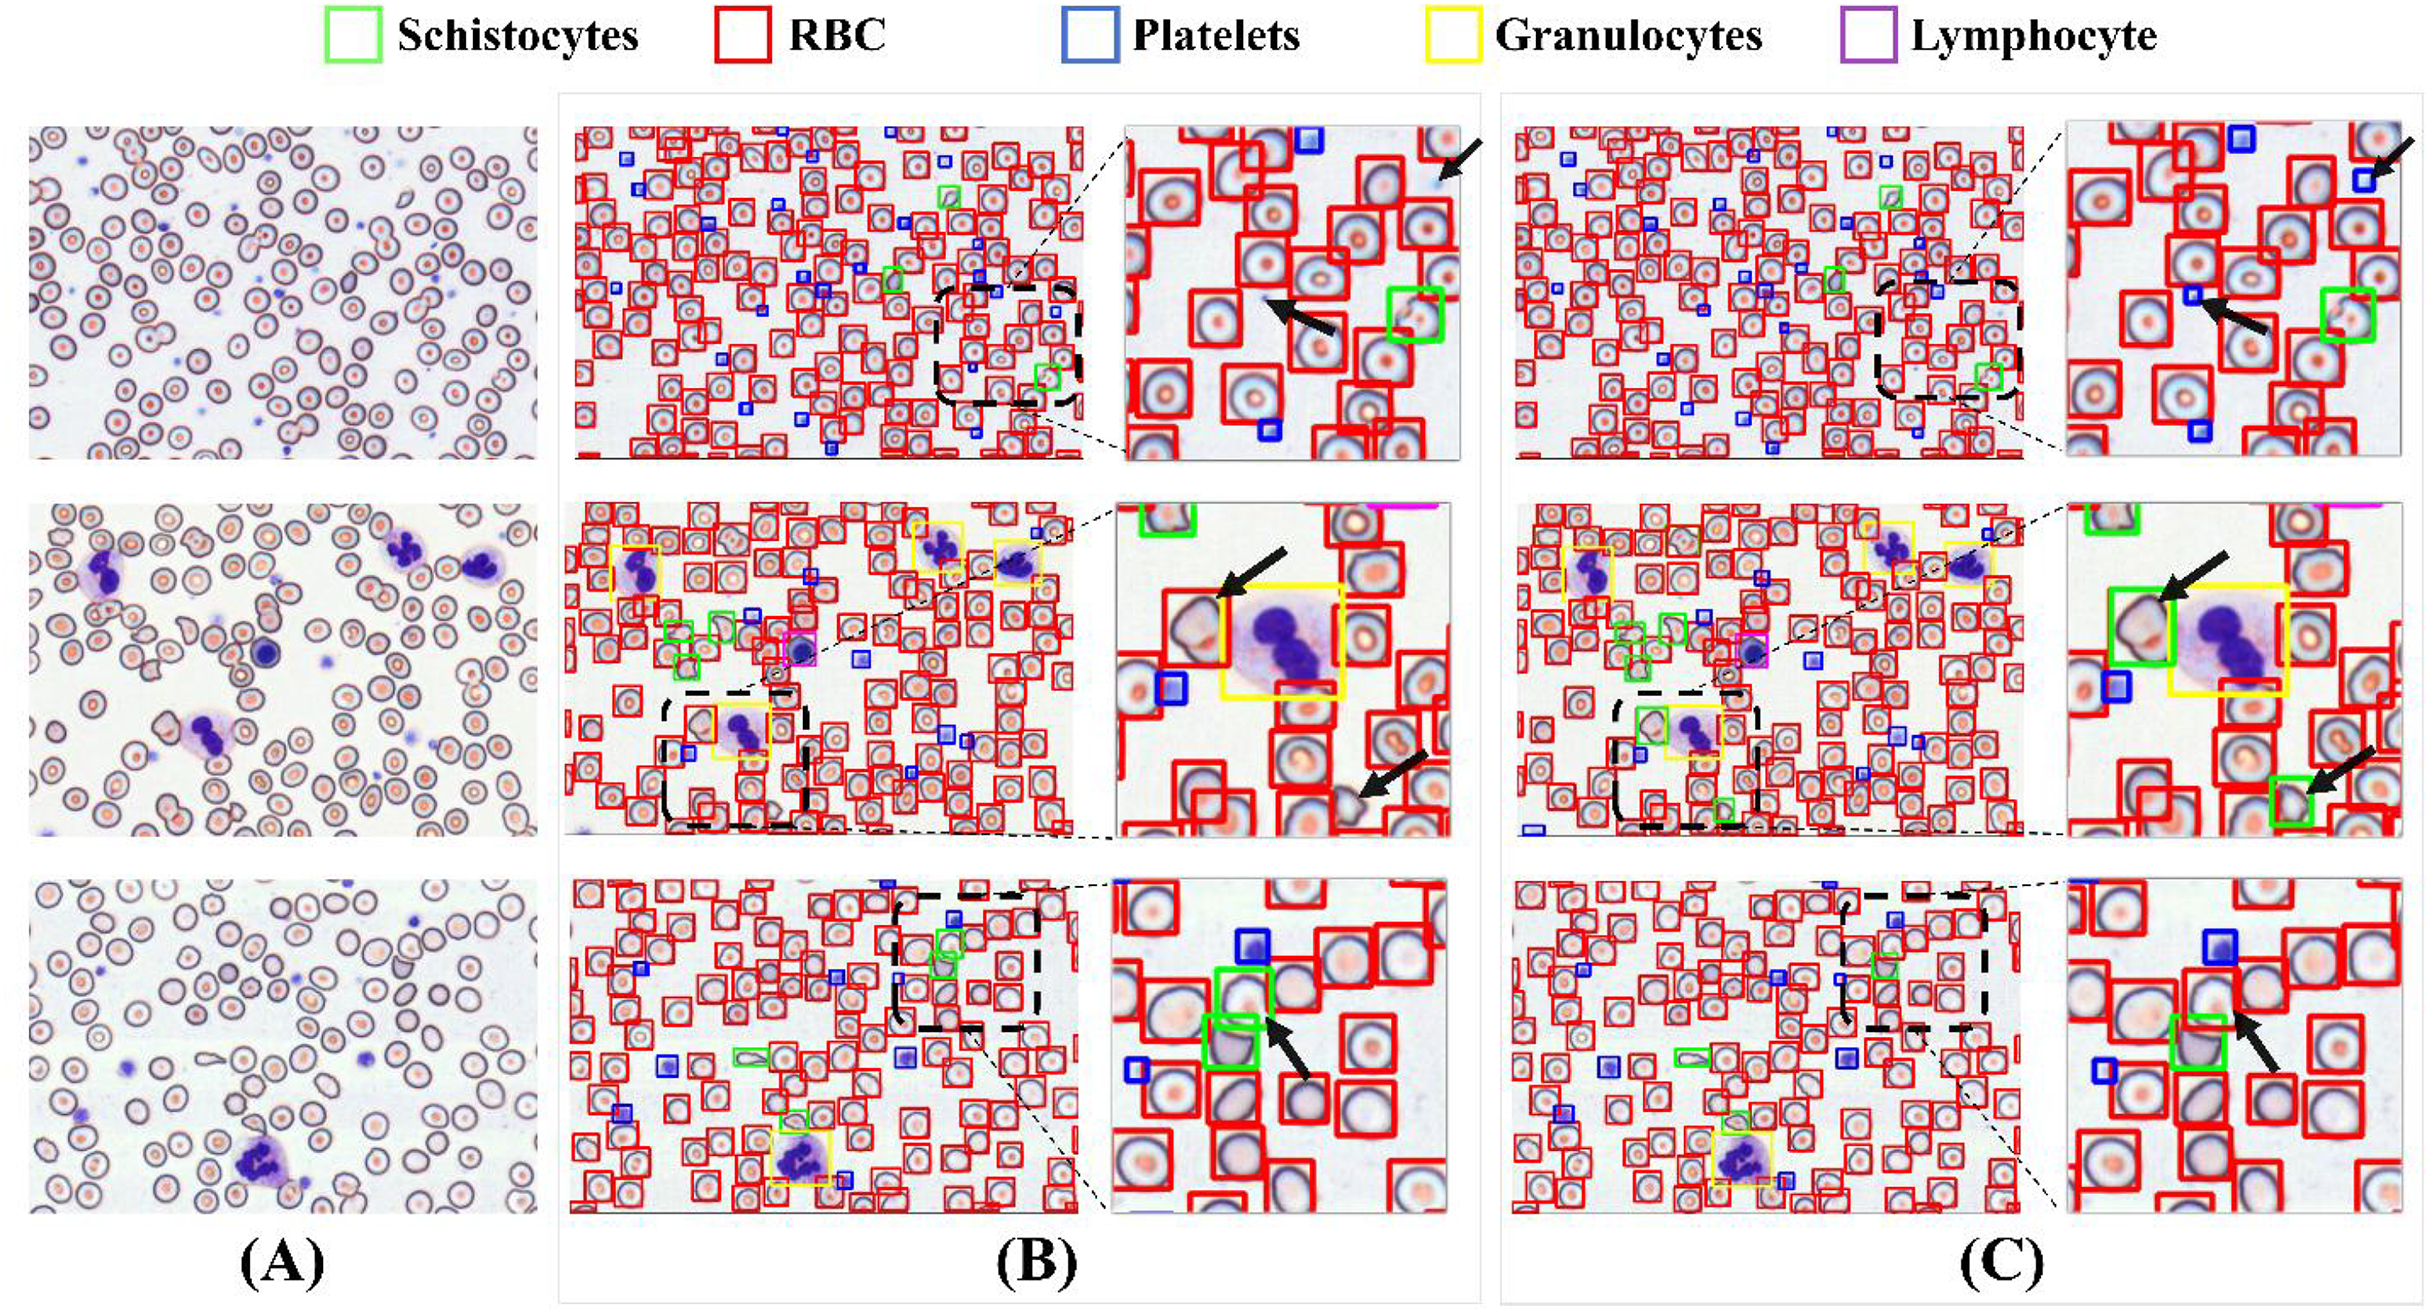
To validate detection efficacy, this study employs XGrad-CAM for visualization analysis of blood smear images (Fu et al., 2020). As shown in Fig. 16A displays two original images. Figure 16B presents the XGrad-CAM visualizations generated by the baseline method. Figure 16C illustrates the XGrad-CAM visualizations produced by the proposed MCS-Net model on the same images. By comparing the visualization results, it is evident that the MCS-Net model demonstrates superior feature extraction capabilities across diverse cell categories and avoids potential missed detections of marginal cells compared to the baseline. Particularly for small cells such as platelets and schistocytes, the heatmaps generated by MCS-Net are more concentrated. These improvements stem from the MSCA module, which efficiently integrates local detail and global semantic features, and the CSD module, whose dynamic weight allocation strategy excels in recognizing cells of varying scales.
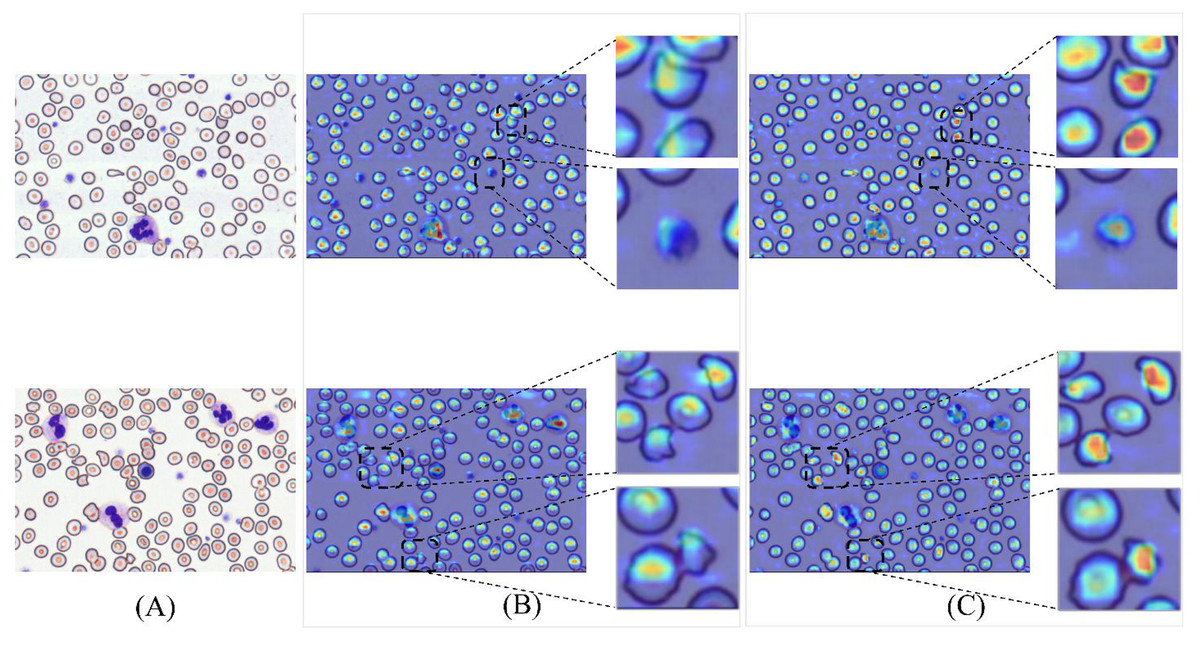
Figure 16: Comparison of detection heatmaps: baseline models vs MCS-Net.
(A) Original images. (B) XGrad-CAM visualizations generated by the baseline method. (C) XGrad-CAM visualizations produced by the MCS-Net model.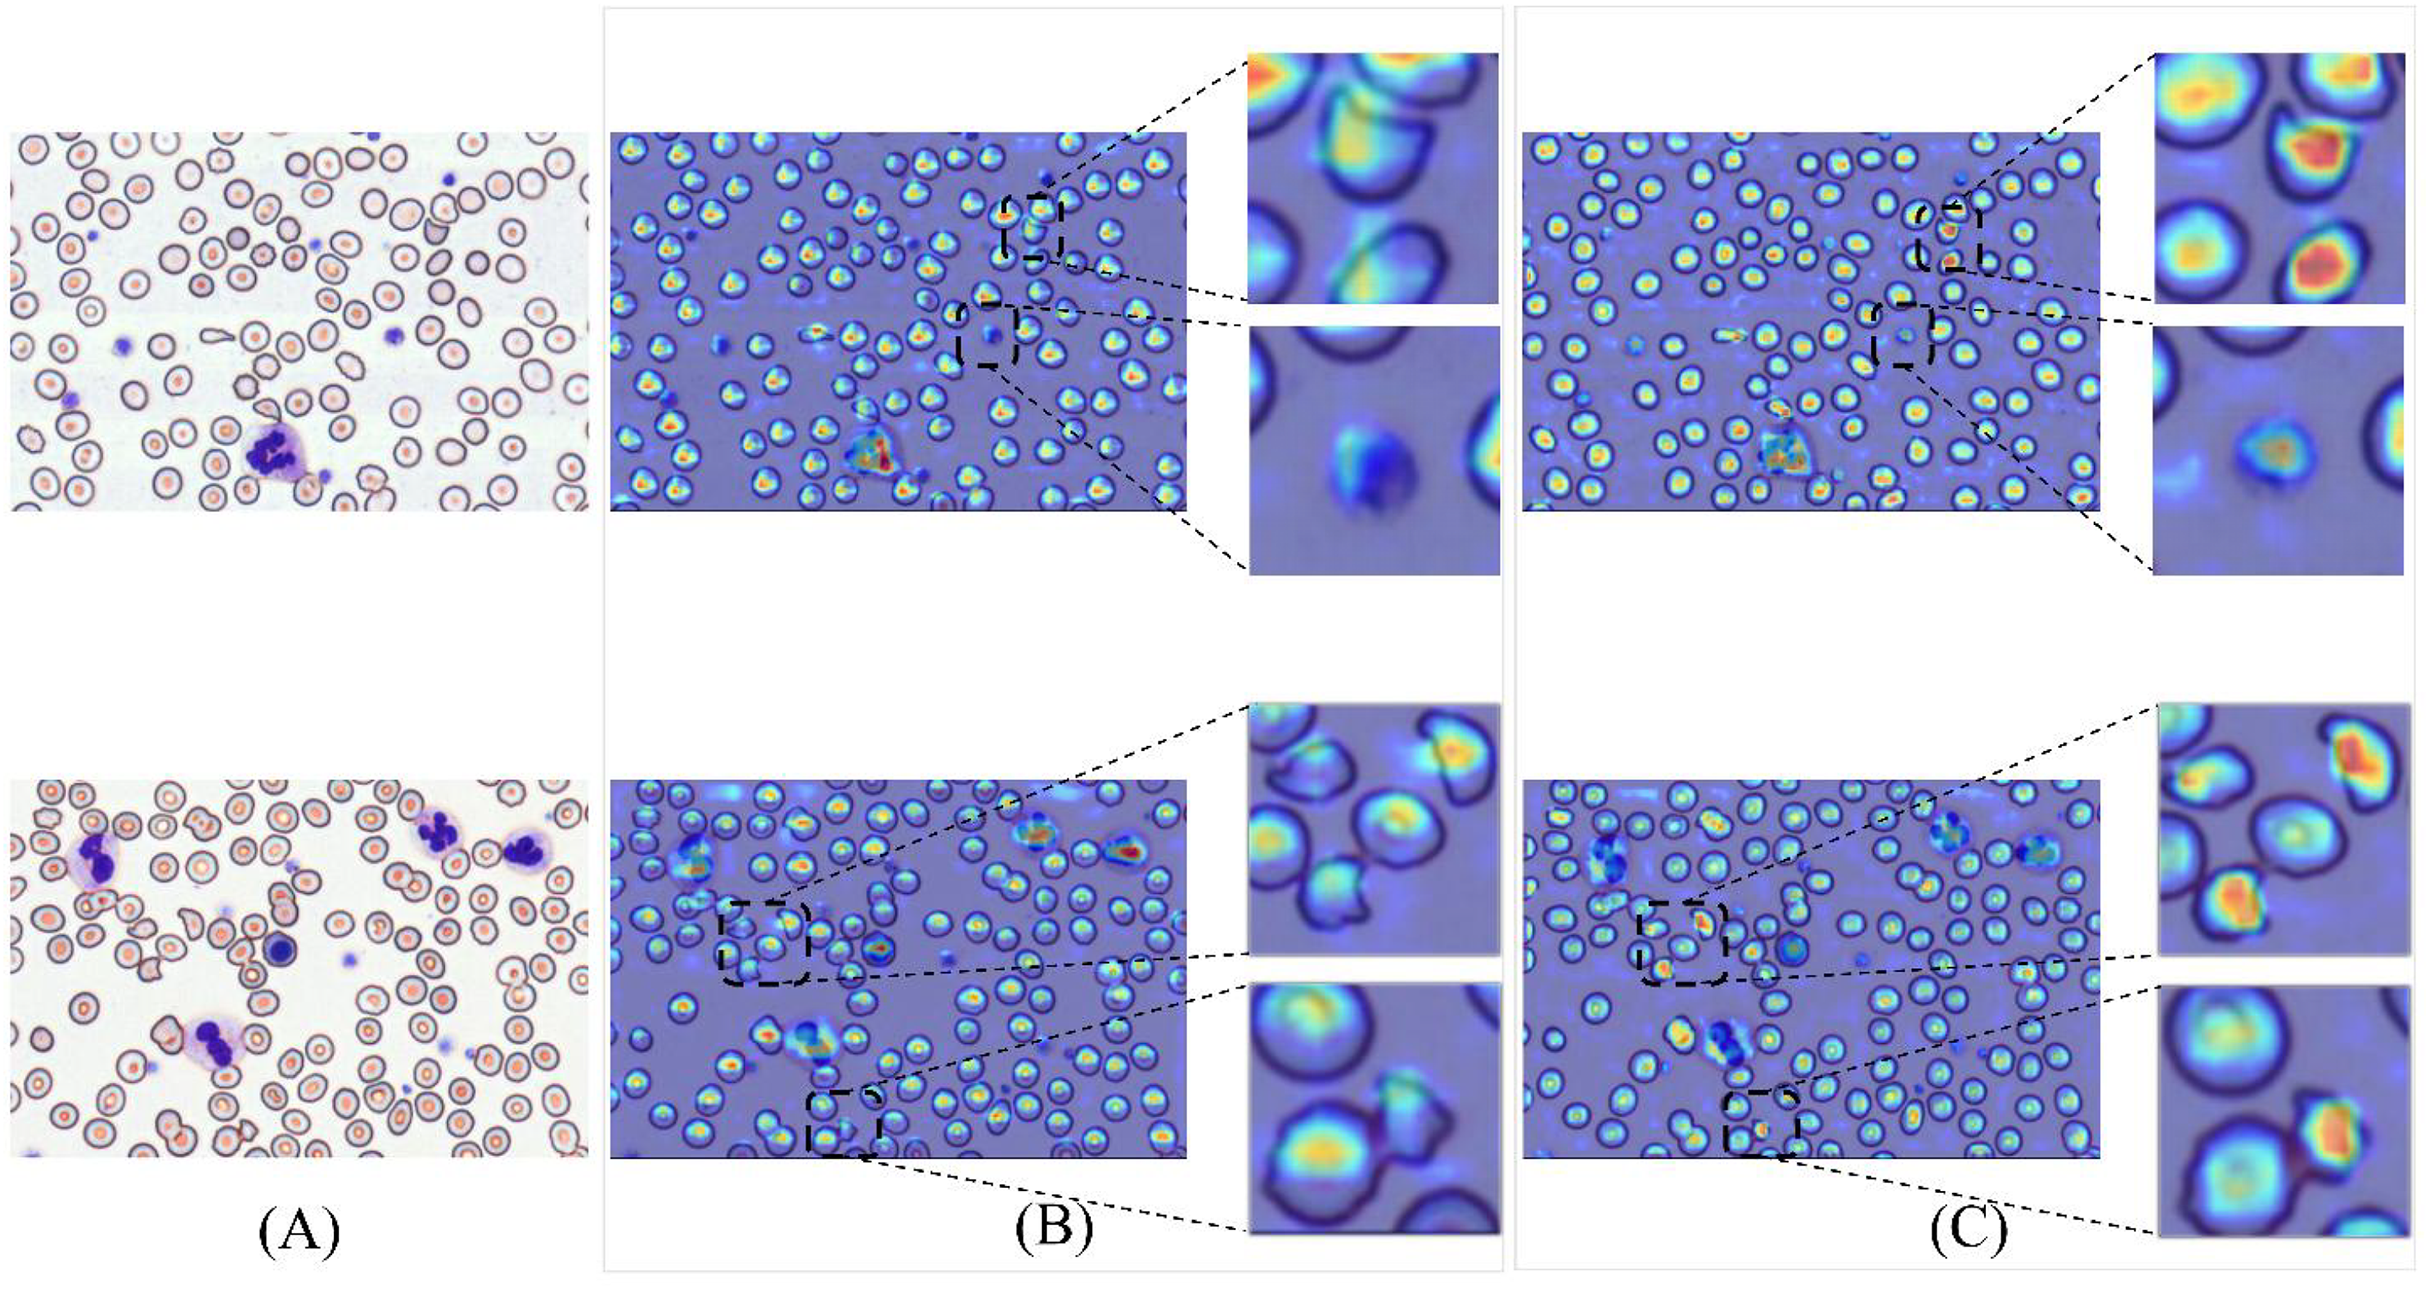
Comparative experiments
To validate the superiority of the final model, we conducted a series of comparative experiments against state-of-the-art object detection algorithms (e.g., SSD (Liu et al., 2015), Faster R-CNN, CenterNet (Duan et al., 2019), YOLOv5, YOLOv8), with the results benchmarked in Table 4.
| Model | Precision | Recall | [email protected] | Param (M) | GFLOPs | FPS |
|---|---|---|---|---|---|---|
| SSD | 0.751 | 0.735 | 0.782 | 24.3M | 61.3 | 56.7 |
| Faster RCNN | 0.822 | 0.794 | 0.831 | 136.8M | 369.8 | 42.4 |
| CenterNet | 0.784 | 0.759 | 0.803 | 32.7M | 70.2 | 60.2 |
| YOLOv5 | 0.811 | 0.813 | 0.864 | 25.1M | 64.5 | 141.2 |
| YOLOv8 | 0.829 | 0.819 | 0.871 | 25.8M | 79.7 | 109.8 |
| YOLOv10 | 0.869 | 0.860 | 0.921 | 16.5M | 63.4 | 107.5 |
| RT-DETR | 0.883 | 0.874 | 0.919 | 23.4M | 68.8 | 51.2 |
| IHA-YOLO | 0.851 | 0.859 | 0.914 | 20.9M | 73.2 | 100 |
| ASF-YOLO | 0.889 | 0.867 | 0.924 | 25.6M | 69.1 | 87.4 |
| MCS-Net | 0.915 | 0.922 | 0.958 ± 0.0022 |
16.6M | 57.3 | 64.9 |
As evidenced by Table 4, the MCS-Net model demonstrates significant comprehensive advantages in blood smear cell detection tasks. It achieves an [email protected] of 0.958 ± 0.0022, marking a 3.9 ± 0.39% improvement over the baseline model YOLOv10 (0.919 ± 0.0018) and substantially outperforming other mainstream algorithms (e.g., Faster R-CNN: 0.831; YOLOv8: 0.871). RT-DETR is an advanced real-time object detector based on the Transformer architecture, whose detection performance surpasses that of most general-purpose object detection models. However, it suffers from limited real-time deployment capability due to its relatively low FPS. Both IHA-YOLO and ASF-YOLO are models specifically designed for cell detection, and they exhibit strong small object detection capabilities. On our SBSD dataset, both achieve [email protected] above 0.9. Although their FPS is superior to that of MCS-Net, they come with higher model complexity. MCS-Net also excels in lightweight design: its parameter count (16.6M) remains comparable to YOLOv10 (16.5M), while reducing computational complexity by 9.6% (57.3 vs 63.4 GFLOPs), surpassing other YOLO variants (e.g., YOLOv8: 79.7 GFLOPs). Although its inference speed (64.9 FPS) is slightly lower than YOLOv10 (107.5 FPS), its accuracy-speed trade-off significantly outperforms two-stage models (e.g., Faster R-CNN: 42.4 FPS). Notably, the lightweight configuration (CSD+NWD) maintains [email protected] = 0.946 at 102 FPS, offering an efficient solution for real-time medical imaging analysis. By integrating multi-scale dynamic interactions, optimized attention mechanisms, and Gaussian distribution modeling, MCS-Net effectively addresses localization deviations for tiny targets, achieving a schistocyte detection precision of 0.901 ± 0.0039. This advancement establishes MCS-Net as a high-precision, robust tool for early screening of DIC and MAHA.
Figure 17 resents a comprehensive comparison of object detection models across three critical metrics: computational efficiency (A), parameter efficiency (B), and accuracy trade-offs (C). Figure 17A (Param vs. GFLOPs) highlights MCS-Net (yellow diamond) as a computationally efficient model, achieving competitive GFLOPs (57.3) with moderate parameters (16.6M), outperforming heavier architectures like YOLOv5 (79.7 GFLOPs) and Faster R-CNN. Figure 17B (Param vs. [email protected]) demonstrates MCS-Net’s superior parameter efficiency, attaining the highest [email protected] among models with comparable parameters. Figure 17C (GFLOPs vs. [email protected]) underscores its optimal balance between speed and accuracy, positioning it closer to the Pareto frontier compared to computationally intensive models (e.g., Faster R-CNN: 42.4 FPS, 0.831 mAP).
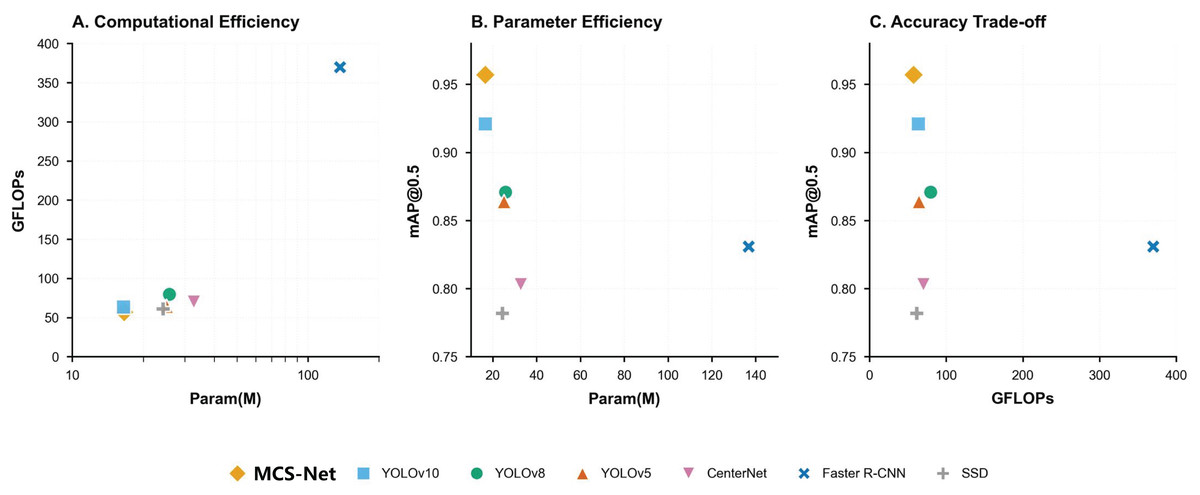
Figure 17: Trade-off analysis of object detection models.
(A) Computational efficiency (GFLOPs vs parameters). (B) Parameter efficiency ([email protected] vs parameters). (C) Accuracy trade-offs ([email protected] vs GFLOPs).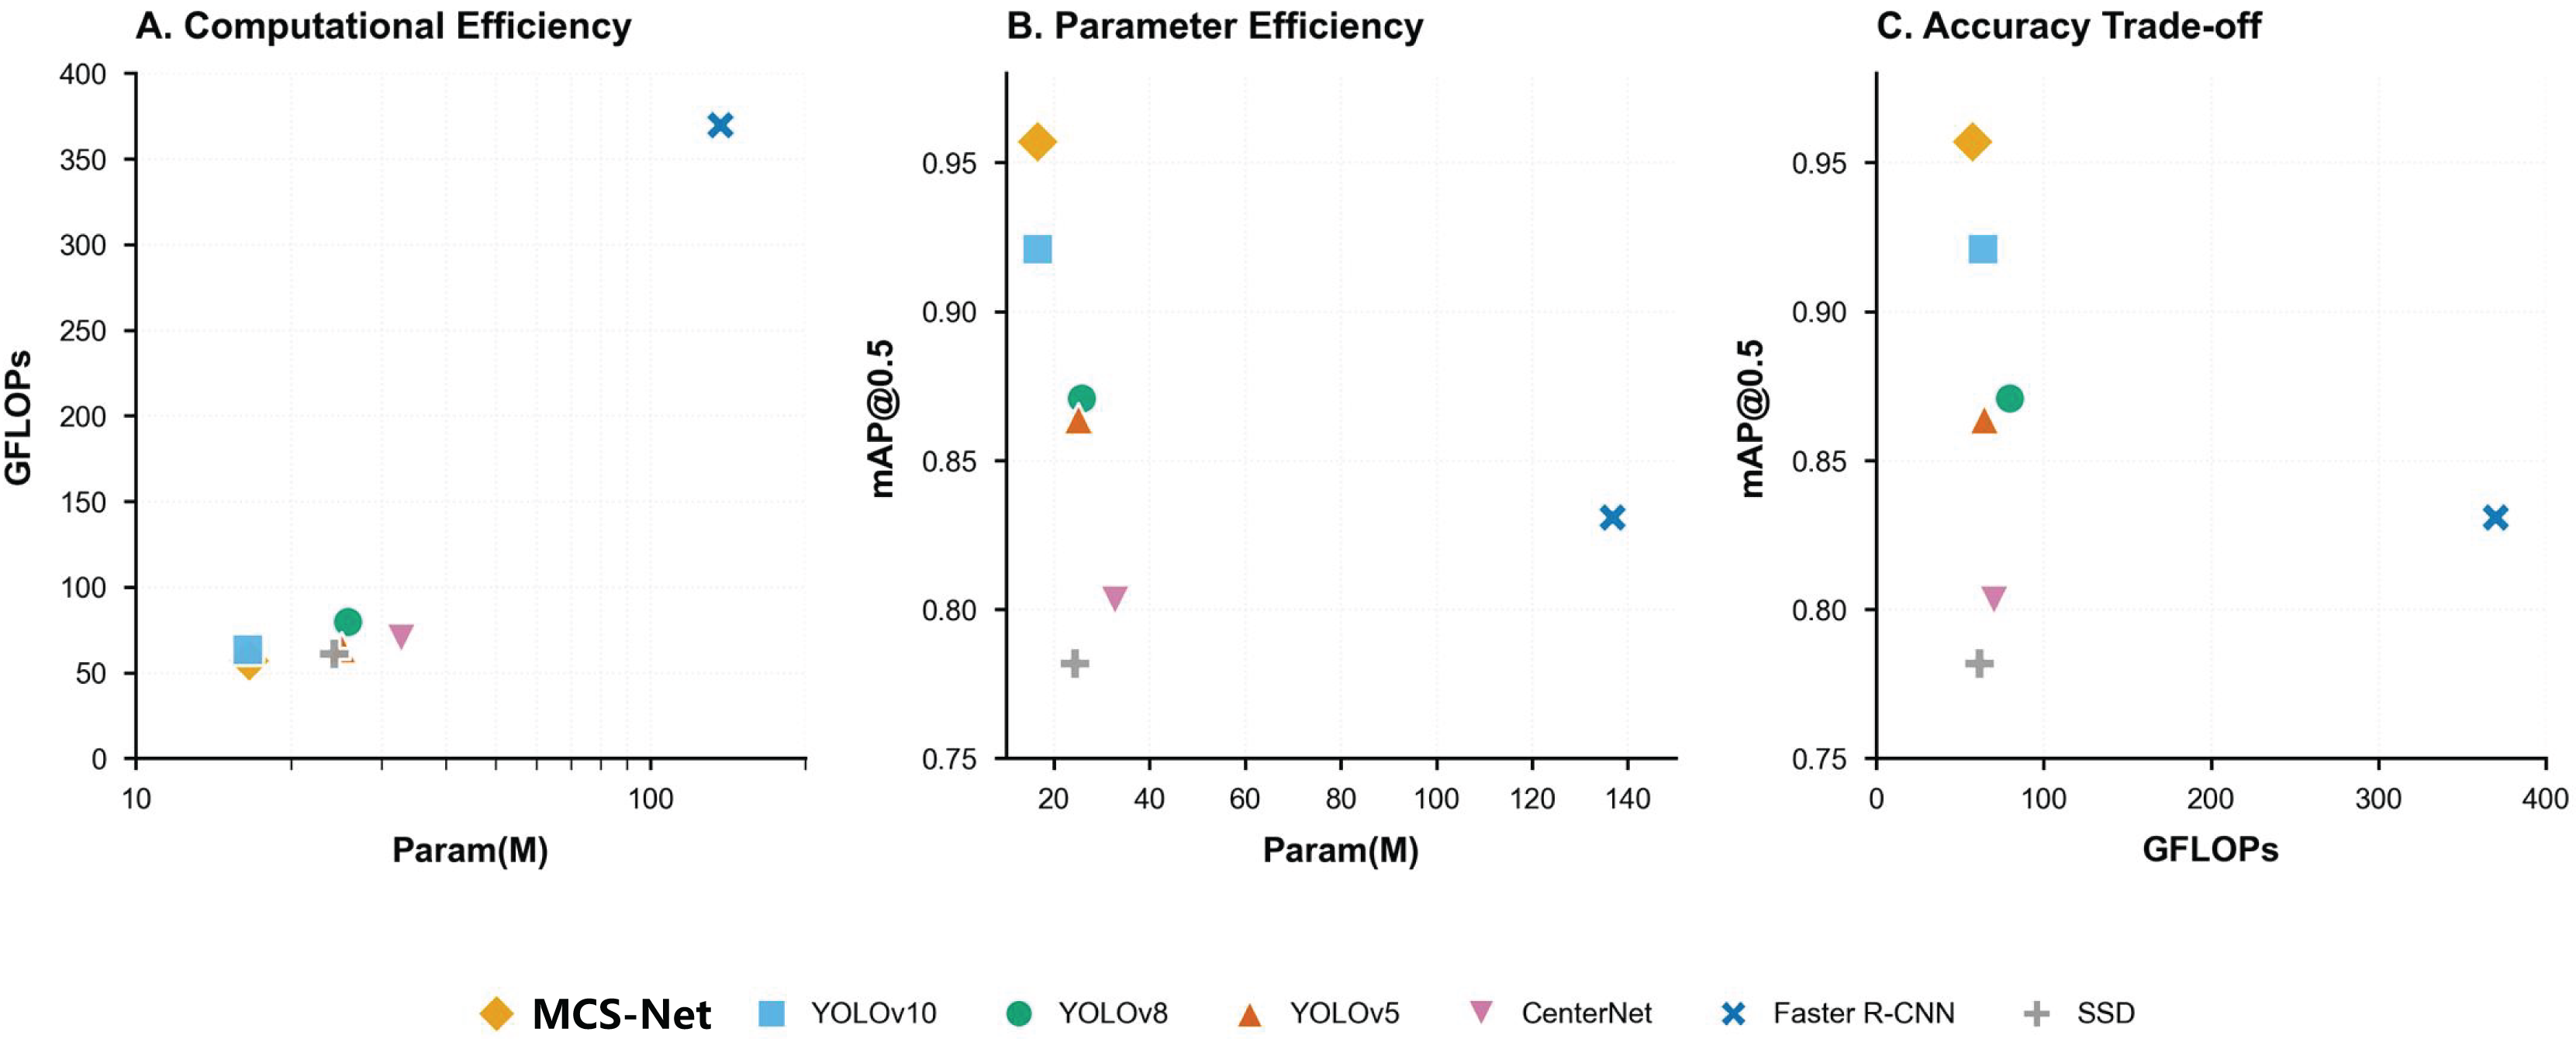
Moreover, this study validates the robustness of MCS-Net across multiple datasets, as detailed in Table 5. Specifically, comparative experiments were conducted on three datasets: BCCD, CBC, and SBSD (Alam & Islam, 2019; Xia et al., 2020; Shakarami et al., 2021; Liu, Li & Huang, 2021; Xu et al., 2022; Chen, Tsai & Ho, 2022; Kang et al., 2024b; Mao et al., 2024; Chen & Lu, 2025). Cross-domain evaluations on these datasets demonstrate the model’s exceptional generalization capability and superiority in pathological cell detection: On the general-purpose BCCD dataset, MCS-Net achieves an [email protected] of 0.939 ± 0.0036, representing a 4.7 ± 0.36% improvement over the YOLOv10 model, with PLT detection AP surpassing 0.949 ± 0.0056. On the CBC dataset, MCS-Net maintains its lead with an [email protected] of 0.919 ± 0.0061, achieving an RBC detection precision of 0.874 ± 0.0076 (+3.5 ± 0.76% over the baseline). On the in-house SBSD dataset, MCS-Net comprehensively outperforms the baseline with an [email protected] of 0.958 ± 0.0022, particularly excelling in the detection of schistocytes—a critical pathological indicator—with a precision of 90.1 ± 0.39%, underscoring its dominance in complex morphological cell detection. These results confirm that MCS-Net not only overcomes the limitations of traditional models in detecting pathological cell subtypes but also exhibits stable robustness across diverse data distributions.
| Work | Dataset | Model | RBC | PLT | WBC | GRAN | LYM | MONO | Schistocyte | [email protected] |
|---|---|---|---|---|---|---|---|---|---|---|
| Alam & Islam (2019) | BCCD | YOLO-tiny | – | – | – | – | – | – | – | 0.624 |
| Inceptionv3 | – | – | – | – | – | – | – | 0.683 | ||
| ResNet50 | – | – | – | – | – | – | – | 0.744 | ||
| VGG16 | – | – | – | – | – | – | – | 0.713 | ||
| MobileNet | – | – | – | – | – | – | – | 0.521 | ||
| Chen et al. (2017) | Resnet50-SSD | – | – | – | – | – | – | – | 0.775 | |
| Shakarami et al. (2021) | FED | – | – | – | – | – | – | – | 0.889 | |
| Liu et al. (2021) | ISE-YOLO | – | – | – | – | – | – | – | 0.857 | |
| Xu et al. (2022) | TE-YOLOF | – | – | – | – | – | – | – | 0.919 | |
| Xia et al. (2020) | YOLOv3 | – | – | – | – | – | – | – | 0.886 | |
| YOLOv3-spp | – | – | – | – | – | – | – | 0.810 | ||
| YOLOv3-tiny | – | – | – | – | – | – | – | 0.780 | ||
| Chen & Lu, (2025) | CAF-YOLO | – | – | – | – | – | – | – | 0.938 | |
| Mao et al. (2024) | DWS-YOLO | 0.917 | 0.906 | 0.991 | – | – | – | – | 0.922 | |
| Kang et al. (2024b) | CST-YOLO | 0.869 | 0.928 | 0.984 | – | – | – | – | 0.927 | |
| Ours | RT-DETR | 0.855 | 0.921 | 0.973 | – | – | – | – | 0.916 | |
| IHA-YOLO | 0.867 | 0.905 | 0.995 | – | – | – | – | 0.922 | ||
| ASF-YOLO | 0.880 | 0.925 | 0.995 | – | – | – | – | 0.933 | ||
| YOLOv10 | 0.839 | 0.843 | 0.993 | – | – | – | – | 0.892 | ||
| MCS-Net | 0.874 ± 0.0076 |
0.949 ± 0.0056 |
0.994 ± 0.0008 |
– | – | – | – | 0.939 ± 0.0036 |
||
| Kang et al. (2024b) | CBC | CST-YOLO | 0.857 | 0.978 | 0.899 | – | – | – | – | 0.911 |
| Ours | RT-DETR | 0.847 | 0.914 | 0.985 | – | – | – | – | 0.915 | |
| IHA-YOLO | 0.810 | 0.894 | 0.986 | – | – | – | – | 0.897 | ||
| ASF-YOLO | 0.841 | 0.917 | 0.995 | – | – | – | – | 0.918 | ||
| YOLOv10 | 0.837 | 0.922 | 0.989 | – | – | – | – | 0.916 | ||
| MCS-Net | 0.863 ± 0.0027 |
0.915 ± 0.0471 |
0.980 ± 0.0327 |
– | – | – | – | 0.919 ± 0.0061 |
||
| SBSD | YOLOv10 | 0.989 ± 0.0004 | 0.843 ± 0.0033 | 0.945 ± 0.0071 |
0.967 ± 0.0033 | 0.934 ± 0.0122 | 0.934 ± 0.0059 | 0.848 ± 0.0075 | 0.919 ± 0.0018 | |
| RT-DETR | 0.988 | 0.891 | 0.931 | 0.973 | 0.919 | 0.903 | 0.842 | 0.919 | ||
| IHA-YOLO | 0.989 | 0.820 | 0.948 | 0.961 | 0.929 | 0.954 | 0.831 | 0.914 | ||
| ASF-YOLO | 0.987 | 0.889 | 0.948 | 0.978 | 0.923 | 0.945 | 0.824 | 0.924 | ||
| MCS-Net | 0.989 ± 0.0000 | 0.908 ± 0.0066 | 0.982 ± 0.0036 |
0.987 ± 0.0023 | 0.980 ± 0.0035 |
0.980 ± 0.0050 |
0.901 ± 0.0039 | 0.958 ± 0.0022 |
Our comparative analysis with prior blood cell detection studies reveals that most existing works were evaluated on the BCCD dataset. The proposed model achieved state-of-the-art performance with an [email protected] of 0.901 ± 0.0039, demonstrating significant superiority in detecting small-scale targets such as PLT. While the model did not achieve the highest accuracy in RBC detection, it exhibited the most robust comprehensive performance overall, balancing precision across multiple cell categories and scales.
Figures 18, 14 illustrates the training convergence of MCS-Net vs the baseline model across the BCCD and CBC datasets, evaluating three metrics: [email protected], [email protected]–0.95, and total loss. Both models achieve near-optimal [email protected] values (~1.0) on BCCD and CBC by epoch 100, demonstrating comparable high-confidence detection accuracy. However, MCS-Net exhibits superior robustness in [email protected]–0.95, reflecting enhanced adaptability to localization variability critical for irregular cell detection (e.g., schistocytes). Notably, MCS-Net achieves significantly lower total loss values with smoother convergence curves, attributed to its MSCA and NWD that mitigate gradient oscillations. The consistent blue (baseline) and orange (MCS-Net) trends across both datasets underscore the model’s cross-dataset reliability, positioning it as a clinically viable solution for precise and stable hematological analysis.
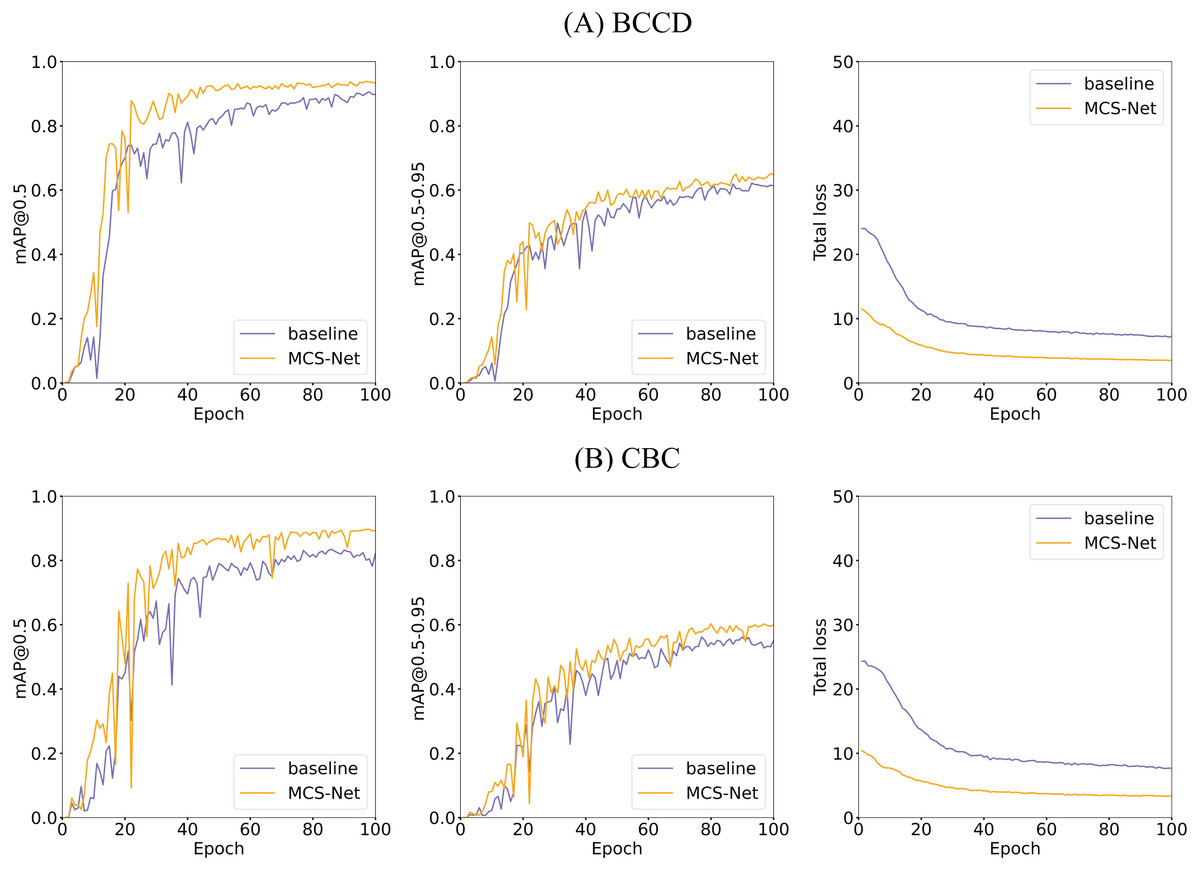
Figure 18: Comparison of training and loss curves between MCS Net and baseline models on BCCD and CBC datasets.
(A) Visual comparison of training and loss curves: MCS-Net vs baseline models on the BCCD dataset. (B) Visual comparison of training and loss curves: MCS-Net vs baseline models on the CBC dataset.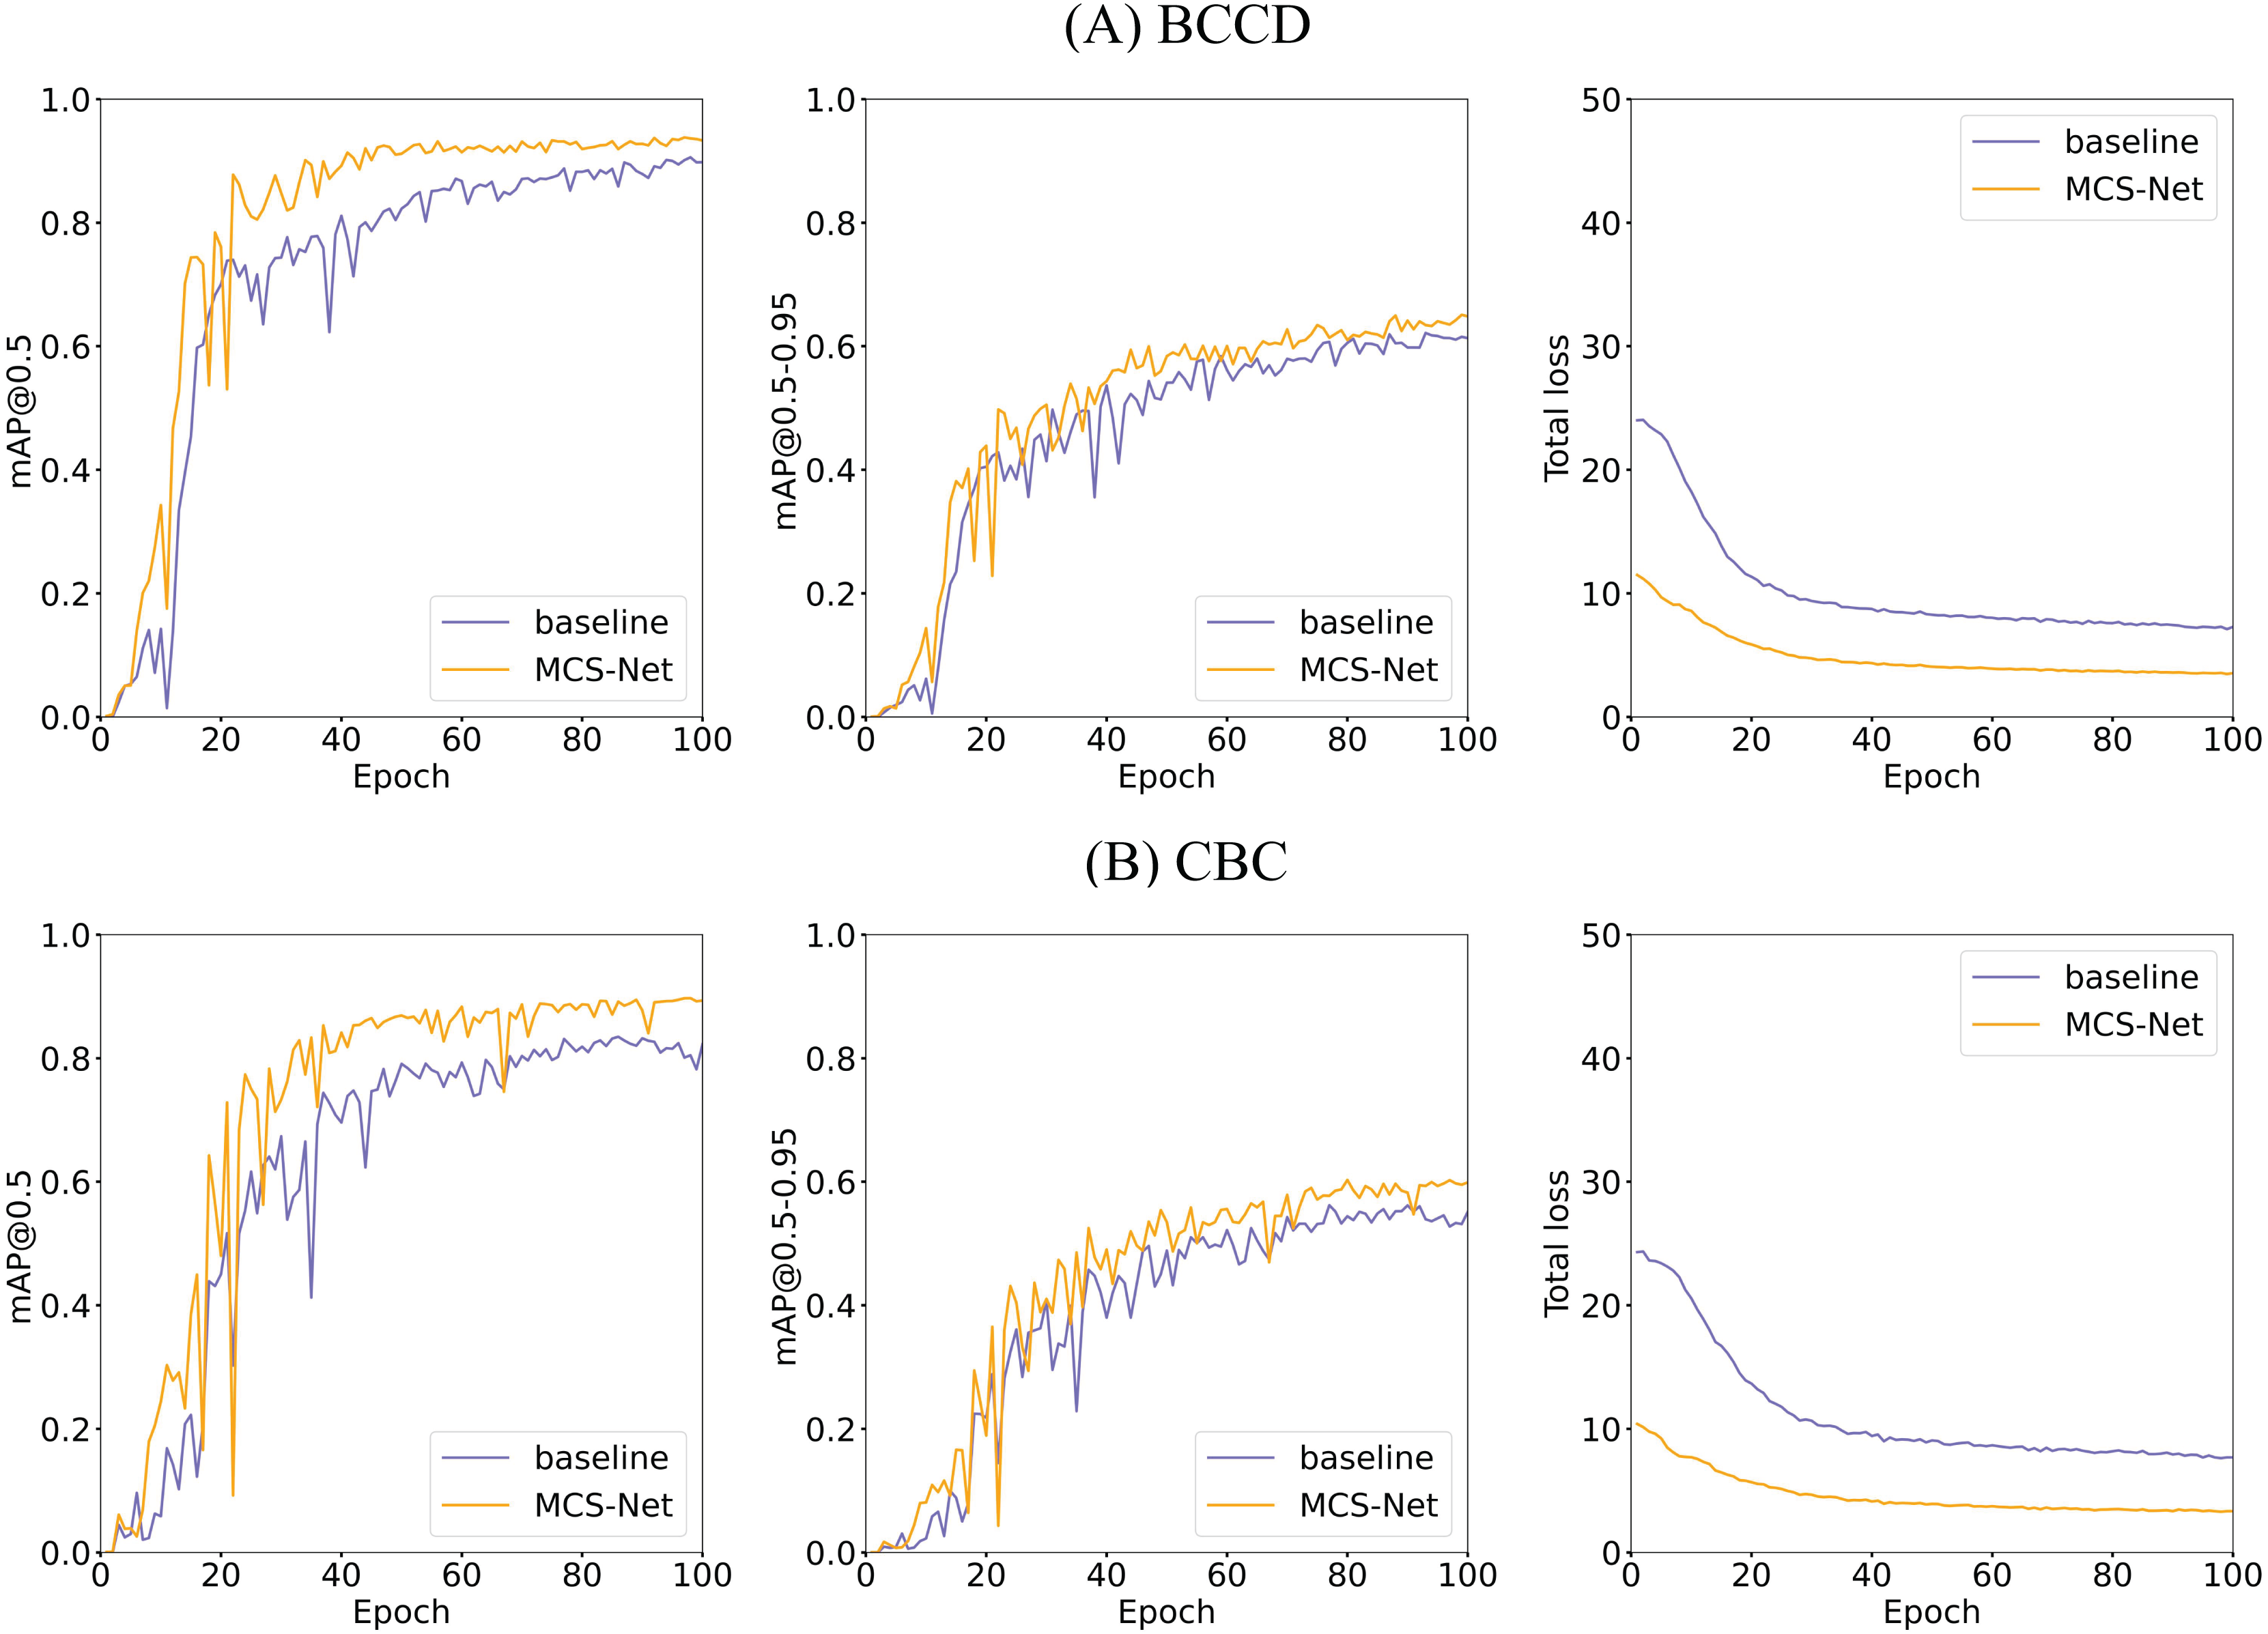
Figures 19 and 20 illustrate the comparative detection performance between the baseline model and MCS-Net on the BCCD and CBC datasets, respectively. The baseline model exhibits missed detections of erythrocytes (red blood cells), whereas MCS-Net significantly reduces such omissions. Additionally, the baseline model suffers from overlapping bounding boxes and localization inaccuracies during detection. The results demonstrate that MCS-Net achieves superior detection capability compared to the baseline, delivering enhanced accuracy and specificity across diverse cell subtypes. Notably, these performance improvements are not confined to the proprietary SBSD dataset but are consistently observed on public benchmarks (BCCD and CBC), underscoring the model’s robust generalization capability.
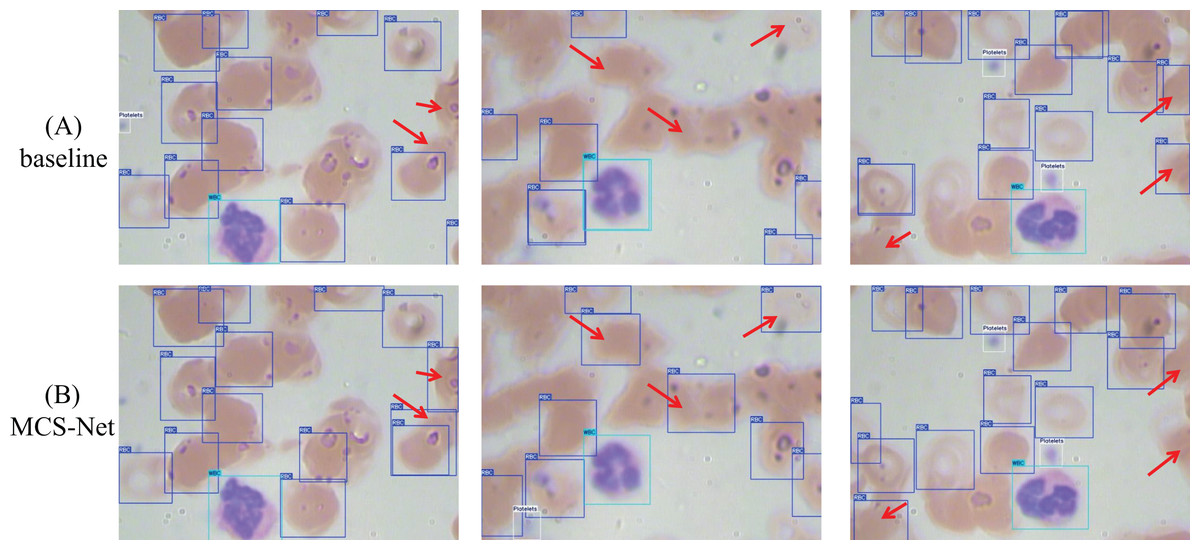
Figure 19: Detection performance comparison between MCS-Net and baseline models on BCCD dataset.
Red arrows indicate regions with divergent detection results. (A) Detection performance of baseline model. (B) Detection performance of MCS-Net.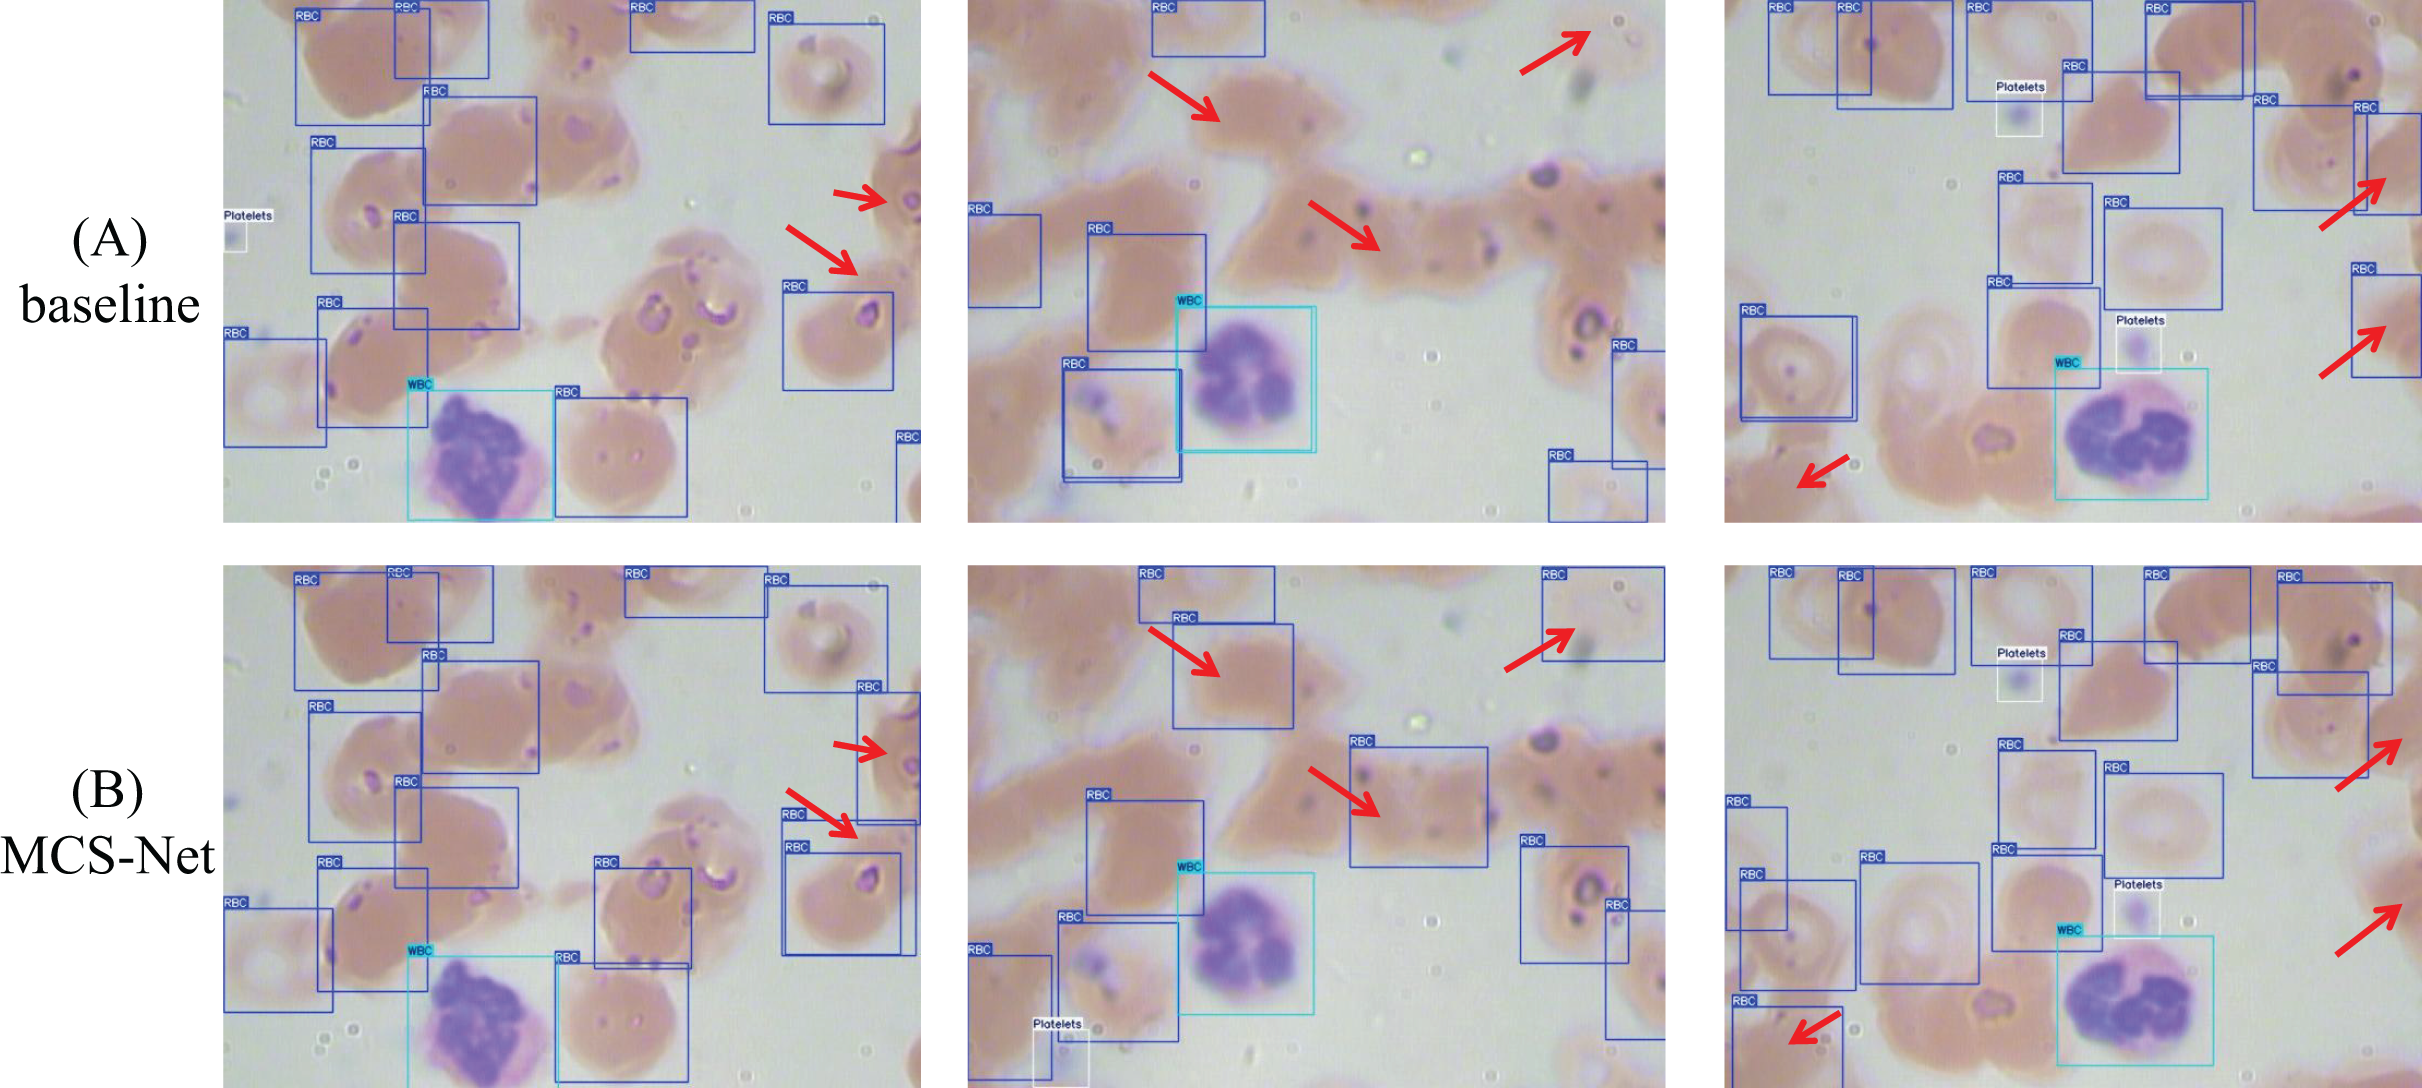
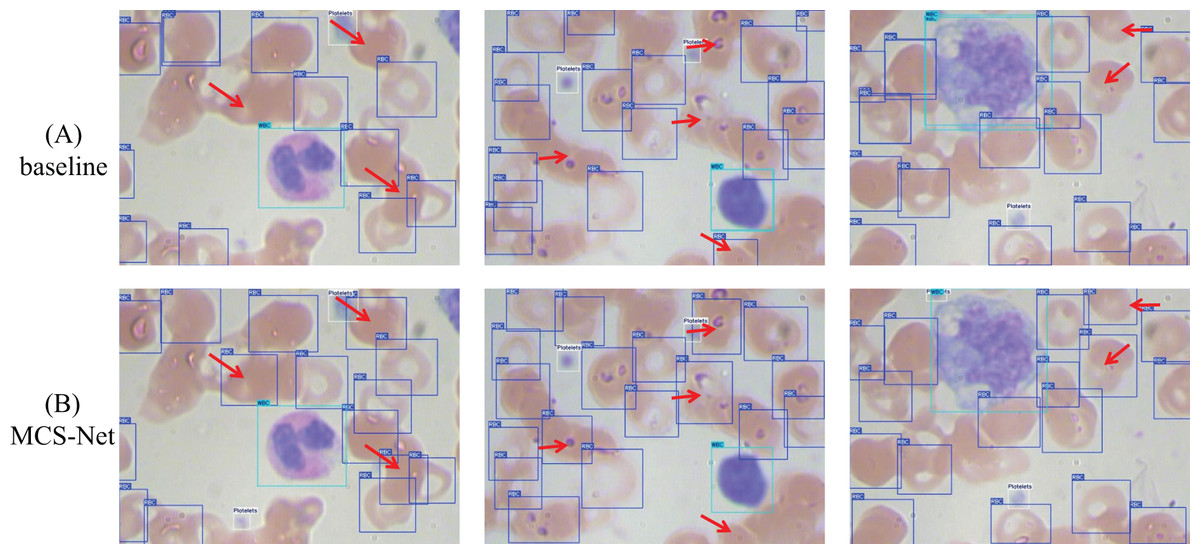
Figure 20: Detection performance comparison between MCS-Net and baseline models on CBC dataset.
Red arrows indicate regions with divergent detection results. (A) Detection performance of baseline model. (B) Detection performance of MCS-Net.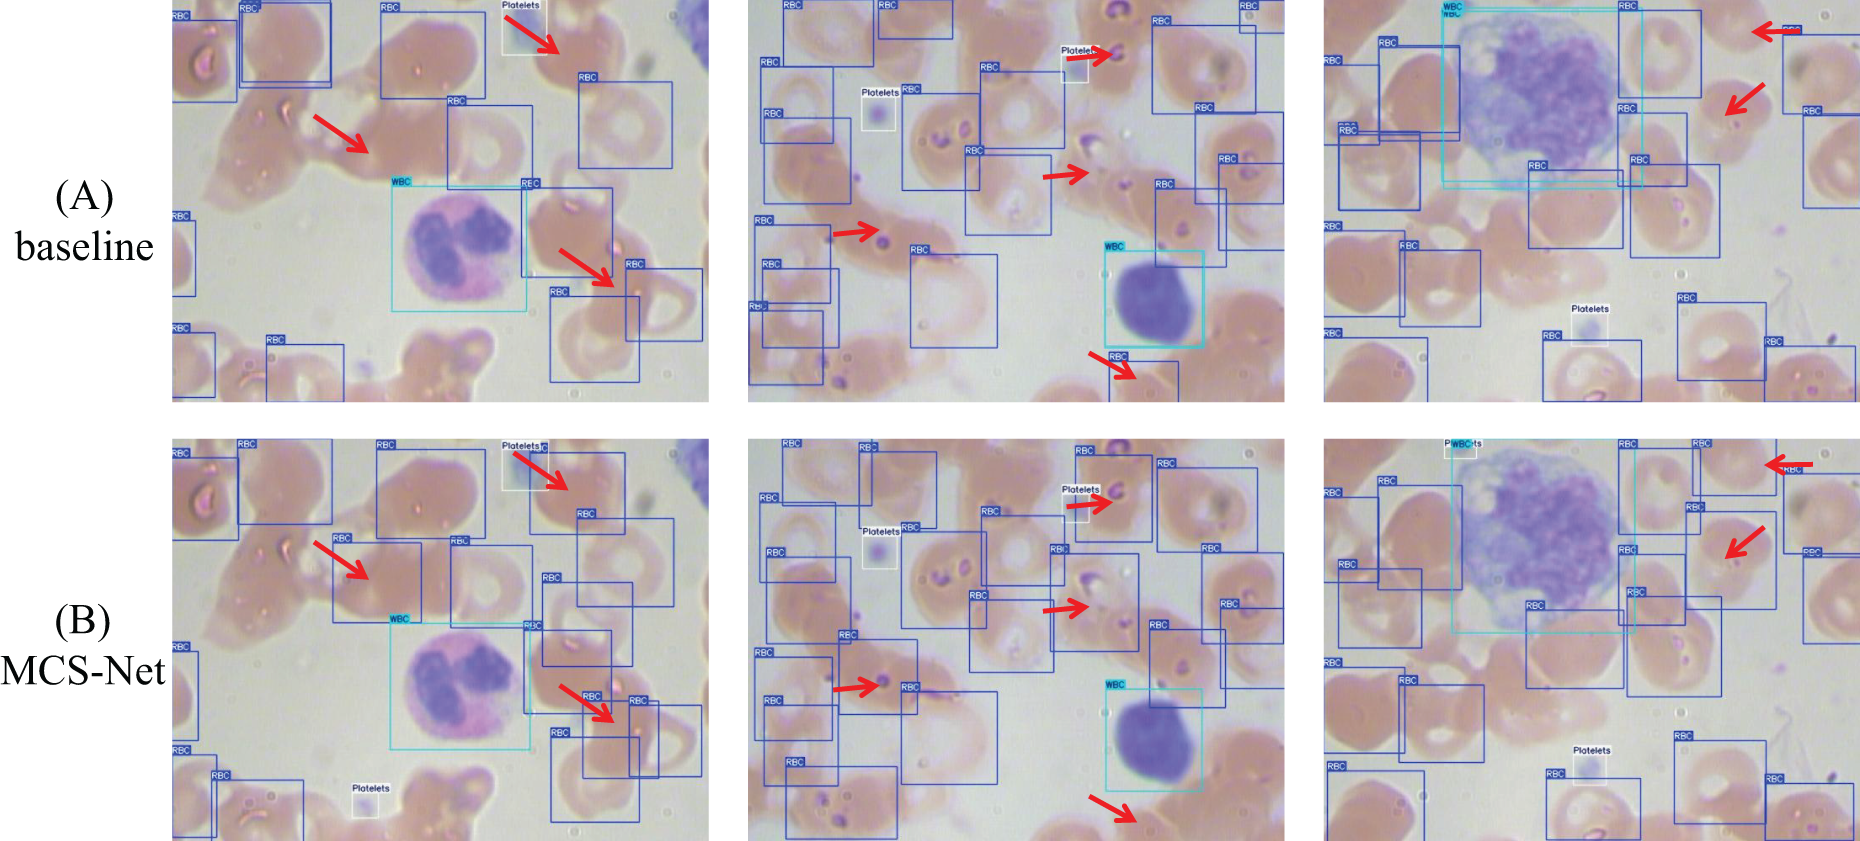
Discussion
Limitations
While this study establishes the novel SBSD dataset and validates the efficacy of MCS-Net through rigorous experimentation, several limitations warrant critical evaluation.
Dataset scope constraints: The current granulocyte categorization in SBSD lacks granular subclassifications (e.g., neutrophils, eosinophils, basophils) and developmental stage annotations (e.g., myeloblasts to segmented neutrophils). Such subclassifications are clinically pivotal, as the neutrophil-to-lymphocyte ratio (NLR) serves as a prognostic biomarker in sepsis, while eosinophil elevation indicates parasitic infections. Manual annotation of these subtypes remains constrained by two factors: Morphological ambiguity: Transitional forms between developmental stages (e.g., promyelocytes vs myelocytes) require hematopathologist-level expertise for discrimination; Staining variability: Inter-institutional differences in Wright-Giemsa staining protocols may introduce cytoplasmic granularity artifacts, complicating automated classification. Future iterations will implement a hybrid annotation pipeline combining: Weak supervision: Leveraging hematology analyzers’ preliminary classification results as pseudo-labels. Active learning: Prioritizing uncertain samples flagged by MCS-Net for expert verification. Real-time performance: The inference speed of MCS-Net may face constraints in scenarios demanding ultra-high real-time processing.
Future direction
The primary future direction of this research involves expanding the granularity and scope of the SBSD dataset to encompass finer cell subtype classifications and developmental stages. Current annotations for granulocytes (e.g., neutrophils, eosinophils, basophils) and their maturation phases (e.g., myeloblasts, promyelocytes, segmented cells) remain insufficient, limiting the model’s capacity to reflect systemic physiological states. Future efforts will prioritize annotating these subcategories to enhance diagnostic precision for conditions like sepsis or leukemia, where cell maturation abnormalities are critical biomarkers. Additionally, integrating rare pathological morphologies (e.g., dysplastic neutrophils in myelodysplastic syndromes) will address clinical demands for comprehensive hematological analysis. This expansion necessitates collaborative frameworks with hematopathologists to ensure annotation accuracy while mitigating the labor-intensive challenges inherent in specialized cytomorphological labeling.
Another critical focus lies in optimizing the MCS-Net architecture for real-time deployment in clinical settings. While the current model achieves 64.9 FPS, ultra-high-throughput scenarios (e.g., emergency diagnostics) require further lightweight enhancements without compromising detection accuracy. Potential strategies include replacing the backbone network with computationally efficient architectures or implementing neural architecture search to automate model compression. Parallel efforts will explore hybrid quantization techniques and hardware-software co-design to accelerate inference on edge devices. Furthermore, extending the NWD loss function to handle overlapping cell distributions and validating the model on multi-center datasets will bolster generalizability across diverse imaging protocols. While the multi-seed validation approach employed in this study provides robust statistical evidence for the reported performance, the computational intensity of training deep detection models precluded the use of k-fold cross-validation. To further enhance the methodological rigor and generalizability of our findings, future work will formally integrate k-fold cross-validation into the evaluation protocol, particularly for benchmarking studies involving complex cellular morphology analysis. This expansion will provide deeper insights into model stability across diverse data partitions and clinical scenarios. These advancements aim to transition AI-assisted blood smear analysis from research prototypes to scalable, clinic-ready tools, ultimately bridging the gap between automated hematology and precision diagnostics.
Conclusions
To address the challenge of multi-scale target detection in blood smear cell analysis, this study proposes the innovative MCS-Net model and constructs the SBSD dataset, encompassing six cell categories, including schistocytes, by integrating medical prior knowledge. This dataset establishes a critical benchmark for diagnosing MAHA and DIC. Experimental results demonstrate that SBSD significantly enhances the model’s sensitivity to schistocytes (90.1 ± 0.39%, detection precision), providing reliable support for clinical threshold determination (>1% schistocyte count). Algorithmically, the MSCA module synergizes dilated convolution groups (3 × 3 to 7 × 7) with global attention mechanisms to enhance edge feature extraction for fragmented erythrocytes, achieving [email protected] = 0.958 ± 0.0022. The CSD module mitigates scale bias in traditional FPN architectures, elevating detection precision for platelets (2–3 μm) and monocytes (14–20 μm) to 90.8 ± 0.66% and 98 ± 0.5%, respectively. The SHA module employs a single-head self-attention mechanism to focus on nuclear lobe gap features in neutrophils. The NWD loss function reduces localization sensitivity to positional deviations, resolving misclassification between platelets and erythrocyte fragments.
In future work, we plan to develop a more granular blood smear dataset, covering developmental stages of granulocytes (e.g., myeloblasts to segmented neutrophils) and their subtypes (neutrophils, eosinophils, basophils), alongside adopting lighter backbone architectures. Collectively, this study introduces a novel technical paradigm for automated hematological diagnosis, offering robust technical support for blood cell research and enabling precise identification of diverse cell types inclinical workflows.