
Automatic medical report generation: a comprehensive review of methodologies and applications
- Published
- Accepted
- Received
- Academic Editor
- Bilal Alatas
- Subject Areas
- Artificial Intelligence, Computer Vision, Data Mining and Machine Learning, Natural Language and Speech, Neural Networks
- Keywords
- Medical image report, Automatic generation, Artificial intelligence, Deep learning, Image-text fusion
- Copyright
- © 2026 Yan et al.
- Licence
- This is an open access article distributed under the terms of the Creative Commons Attribution License, which permits unrestricted use, distribution, reproduction and adaptation in any medium and for any purpose provided that it is properly attributed. For attribution, the original author(s), title, publication source (PeerJ Computer Science) and either DOI or URL of the article must be cited.
- Cite this article
- 2026. Automatic medical report generation: a comprehensive review of methodologies and applications. PeerJ Computer Science 12:e3474 https://doi.org/10.7717/peerj-cs.3474
Abstract
The increasing demand for medical imaging has significantly challenged healthcare systems, emphasizing the need for efficient and accurate diagnostic support tools. Recent advancements in computer vision (CV) and natural language processing (NLP) have demonstrated great promise in addressing these challenges, particularly through the automation of medical report generation. Automatic medical report generation (AMRG) has become a pivotal application of artificial intelligence (AI) in the medical domain, which involves extracting critical information from medical images and generating textual reports. These reports aid clinicians in analyzing image content more efficiently and accurately, thereby improving diagnostic precision. This article provides a comprehensive review of recent advancements in AMRG, with a particular focus on the commonly—employed methodologies, including convolutional neural network (CNN), recurrent neural network (RNN), Transformers and their variants, and large language model (LLM) into AMRG. Moreover, this review also examines both widely—used and less frequently-used datasets and compares various evaluation metrics to provide an in-depth analysis of different AMRG methodologies. Finally, key achievements and future research directions in the field are summarized, highlighting challenges such as cross-modal fusion, model interpretability, and data privacy protection, while suggesting potential future trends in the development of this technology.
Introduction
With the rapid advancement in medical imaging technology, imaging modalities have become increasingly essential for clinical diagnosis and treatment decision-making. Examinations such as computed tomography (CT), magnetic resonance imaging (MRI), X-ray, and ultrasound (US) provide detailed visual representations of a patient’s physiological conditions and have become indispensable tools for diagnosing a wide range of diseases. These technologies are particularly crucial in fields such as musculoskeletal disorders (Wenham, Grainger & Conaghan, 2014), neurological diseases (Shetewi, Mutairi & Bafaraj, 2020), cardiovascular conditions (Higgins & de Roos, 2006), and oncology (Young & Knopp, 2006). The growing reliance of medical imaging is evident in national statistics. In a populous region of Italy (about 10 million residents, including 1 million children), the number of CT scans rose from 700,000 in 2004 to over 1 million in 2014, indicating an increase of 43% (Pola et al., 2018). Similarly, in the United Kingdom (UK), the number of radiological examinations has been increasing at an alarming rate of 10% per year (Heptonstall, Ali & Mankad, 2016). However, 97% of imaging departments in the UK reported being unable to meet the demand for radiological diagnostic reports (Rimmer, 2017). As the demand for medical imaging examinations continues to rise (Pepe et al., 2023), the shortage of radiologists poses a critical challenge. In certain situations, clinicians may need to interpret images and make medical decisions independently without professional radiological consultation. This practice eventually increases the risk of misdiagnosis, missed diagnoses, or delayed treatment, which can significantly impact patient outcomes and prognosis.
Automatic Medical Report Generation (AMRG) is an automated technology that combines medical image data, clinical knowledge, and patient medical history to generate clear, concise, accurate, and structured medical reports to assist clinical decision-making (Kaur, Mittal & Singh, 2022). A key subfield of AMRG is Diagnostic Captioning (DC), which focuses on generating diagnostic descriptions based on medical images. The emergence of Medical Report Generation (MRG) has been largely driven by the rapid advancements in Computer Vision (CV) and Natural Language Processing (NLP). As a result, AMRG has become a prominent research focus in the field of medical imaging, offering a viable solution to the increasing volume of imaging data and the growing shortage of healthcare professionals.
Beddiar, Oussalah & Seppänen (2023a) categorized DC methods into four distinct approaches based on their technical characteristics: retrieval-based methods, template-based methods, generative methods, and hybrid methods. Building upon this classification, Reale-Nosei, Amador-Domínguez & Serrano (2024) carried out a systematic review of the latest research progress in AMRG. In addition, several studies (Hartsock & Rasool, 2024; Guo et al., 2024; Liao, Liu & Spasić, 2023; Pang, Li & Zhao, 2023), and Sun et al. (2023) have explored different aspects of AMRG that further advance the field. However, existing research has predominantly focused on a limited number of public datasets, lacking a systematic analysis of a wider range of datasets and real-world applications. To bridge this gap, this article provides a comprehensive review of AMRG, emphasizing a broader perspective on dataset utilization and practical applications. The key contributions of this review include:
A critical review and quantitative analysis of the AMRG dataset. This article not only comprehensively reviews public and private datasets but also provides an innovative quantitative analysis of methodological trends across major benchmarks. Beyond serving as a simple catalog, it further examines the inherent biases of datasets and highlights the negative impact of private data on research reproducibility.
A deep causal analysis of methodological evolution. This article systematically traces the complete development of AMRG methods, from early rule-based systems to cutting-edge large language model (LLM), through an evolutionary narrative structure. Unlike previous reviews, this study offers an in-depth causal analysis for each technical paradigm, exploring the root causes of success or failure of specific methods, providing deeper insights into the field‘s trajectory.
Unique focus on the translational gap and a forward-looking roadmap. This article uniquely focuses on the translational gap between research benchmarks and real-world clinical deployment and includes a dedicated analysis of practical barriers to adoption. Furthermore, a concrete and actionable roadmap for future research is proposed, providing clear directions for addressing key gaps in evaluation metrics, model interpretability, and data diversity.
This literature review is intended for researchers, clinicians, and practitioners working in the domains of medical imaging, artificial intelligence (AI), and healthcare automation. We performed a systematic search of peer-reviewed articles, conference papers, and preprints published between 2018 and 2025 to guarantee a thorough and objective overview. Seven leading academic databases and search engines in the fields of medicine, computer science, and engineering were selected, with the rationale explained as follows: PubMed and Web of Science were our top choices due to their extensive coverage of high-quality, peer-reviewed biomedical and clinical research literature, ensuring coverage of AMRG’s core research findings at the medical application level. The IEEE Digital Library and ACM Digital Library were included to capture the underlying technologies and recent advances in CV, NLP, and AI, which are the technological foundations driving AMRG. SpringerLink and ScienceDirect (Elsevier) offer broad access to a wide range of interdisciplinary academic journals and conference proceedings, helping to discover relevant research that may not be indexed by the more specialized databases mentioned above. It is recognized that preprints are of increasing importance in a rapidly evolving field like AMRG. To address this, Google Scholar was incorporated into the search strategy. Although independent preprint servers such as arXiv and medRxiv were not searched directly, the extensive indexing capabilities of Google Scholar can effectively identify and capture preprint manuscripts with high impact and high citation rates, ensuring that cutting-edge research is included alongside published peer-reviewed literature. The search was performed using a variety of relevant keywords, including “medical report generation,” “radiology report synthesis,” “chest X-ray captioning,” “automated diagnostic reporting,” “cross-modal medical generation,” “deep learning for report generation,” “Transformer medical NLP,” “LLM medical reports,” “image-to-text medical datasets,” and “self-supervised medical generation.” This comprehensive set of keywords was designed to be inclusive, aiming to cover synonyms and related sub-topics; for instance, “medical report generation” and “automated diagnostic reporting” were intended to capture the literature on “medical narrative generation” and “structured radiology reporting,” respectively.
The inclusion criteria were centered on English-language publications that were full-text and directly relevant to the creation of AMRG. Exclusion criteria eliminated studies that were not relevant to AMRG, such as those focused solely on image classification without report generation or general image captioning. Additionally, articles that were editorial in character, lacking experimental data, summaries, or sufficient methodological description, were also excluded. To make sure that only high-quality studies were included, a two-stage screening procedure was used. In the first stage, titles and abstracts were screened to remove irrelevant publications. In the second stage, a full-text review was conducted to confirm that the selected studies satisfied the inclusion requirements, with particular attention paid to technical details, dataset usage, and assessment techniques. Figure 1 details the literature selection process for this systematic review, which adhered to the PRISMA 2020 standards. A total of 1,286 articles were initially retrieved from seven major databases. After removing 232 duplicates, the titles and abstracts of the remaining 1,054 articles were screened, resulting in the exclusion of 744 studies that were not directly related to AMRG or were non-research articles. Subsequently, the full text of 310 articles was reviewed, and based on pre-specified inclusion and exclusion criteria, ultimately included 146 high-quality studies for comprehensive analysis. Among these 146 included studies, approximately 40 were identified as preprints, accounting for about 27.4% of the total. This proportion highlights the importance of capturing cutting-edge findings in a rapidly evolving field such as AMRG, as emphasized in our search strategy. This process ensured the systematic and comprehensive nature of this review.
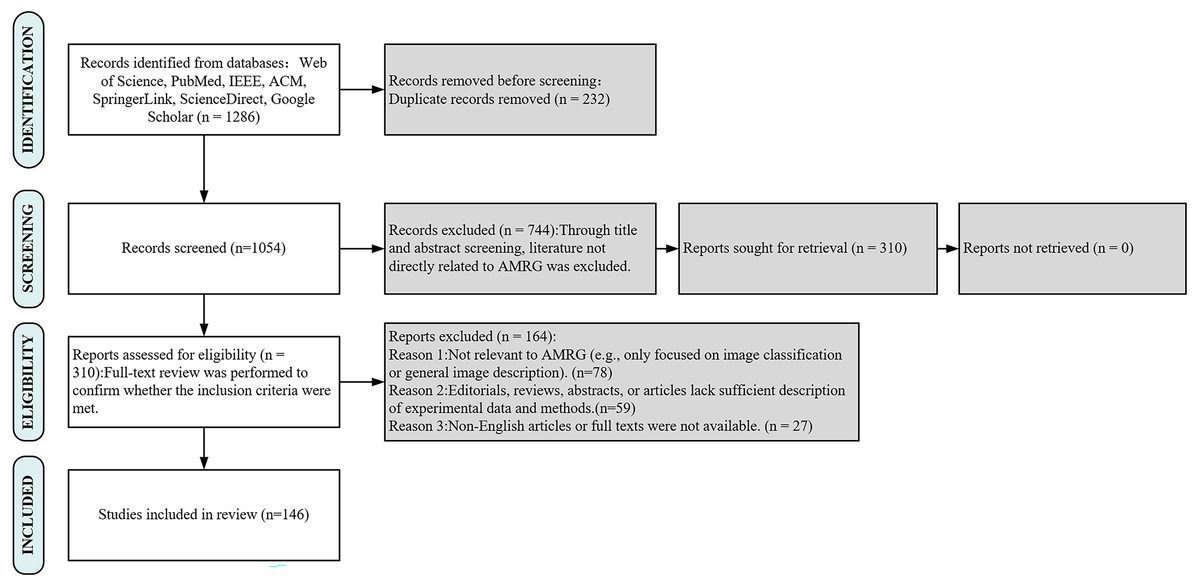
Figure 1: PRISMA flow diagram of search strategy and study selection.
This PRISMA flow demonstrates the rigorous, multi-stage screening process used to ensure the selection of high-quality, relevant studies for this review.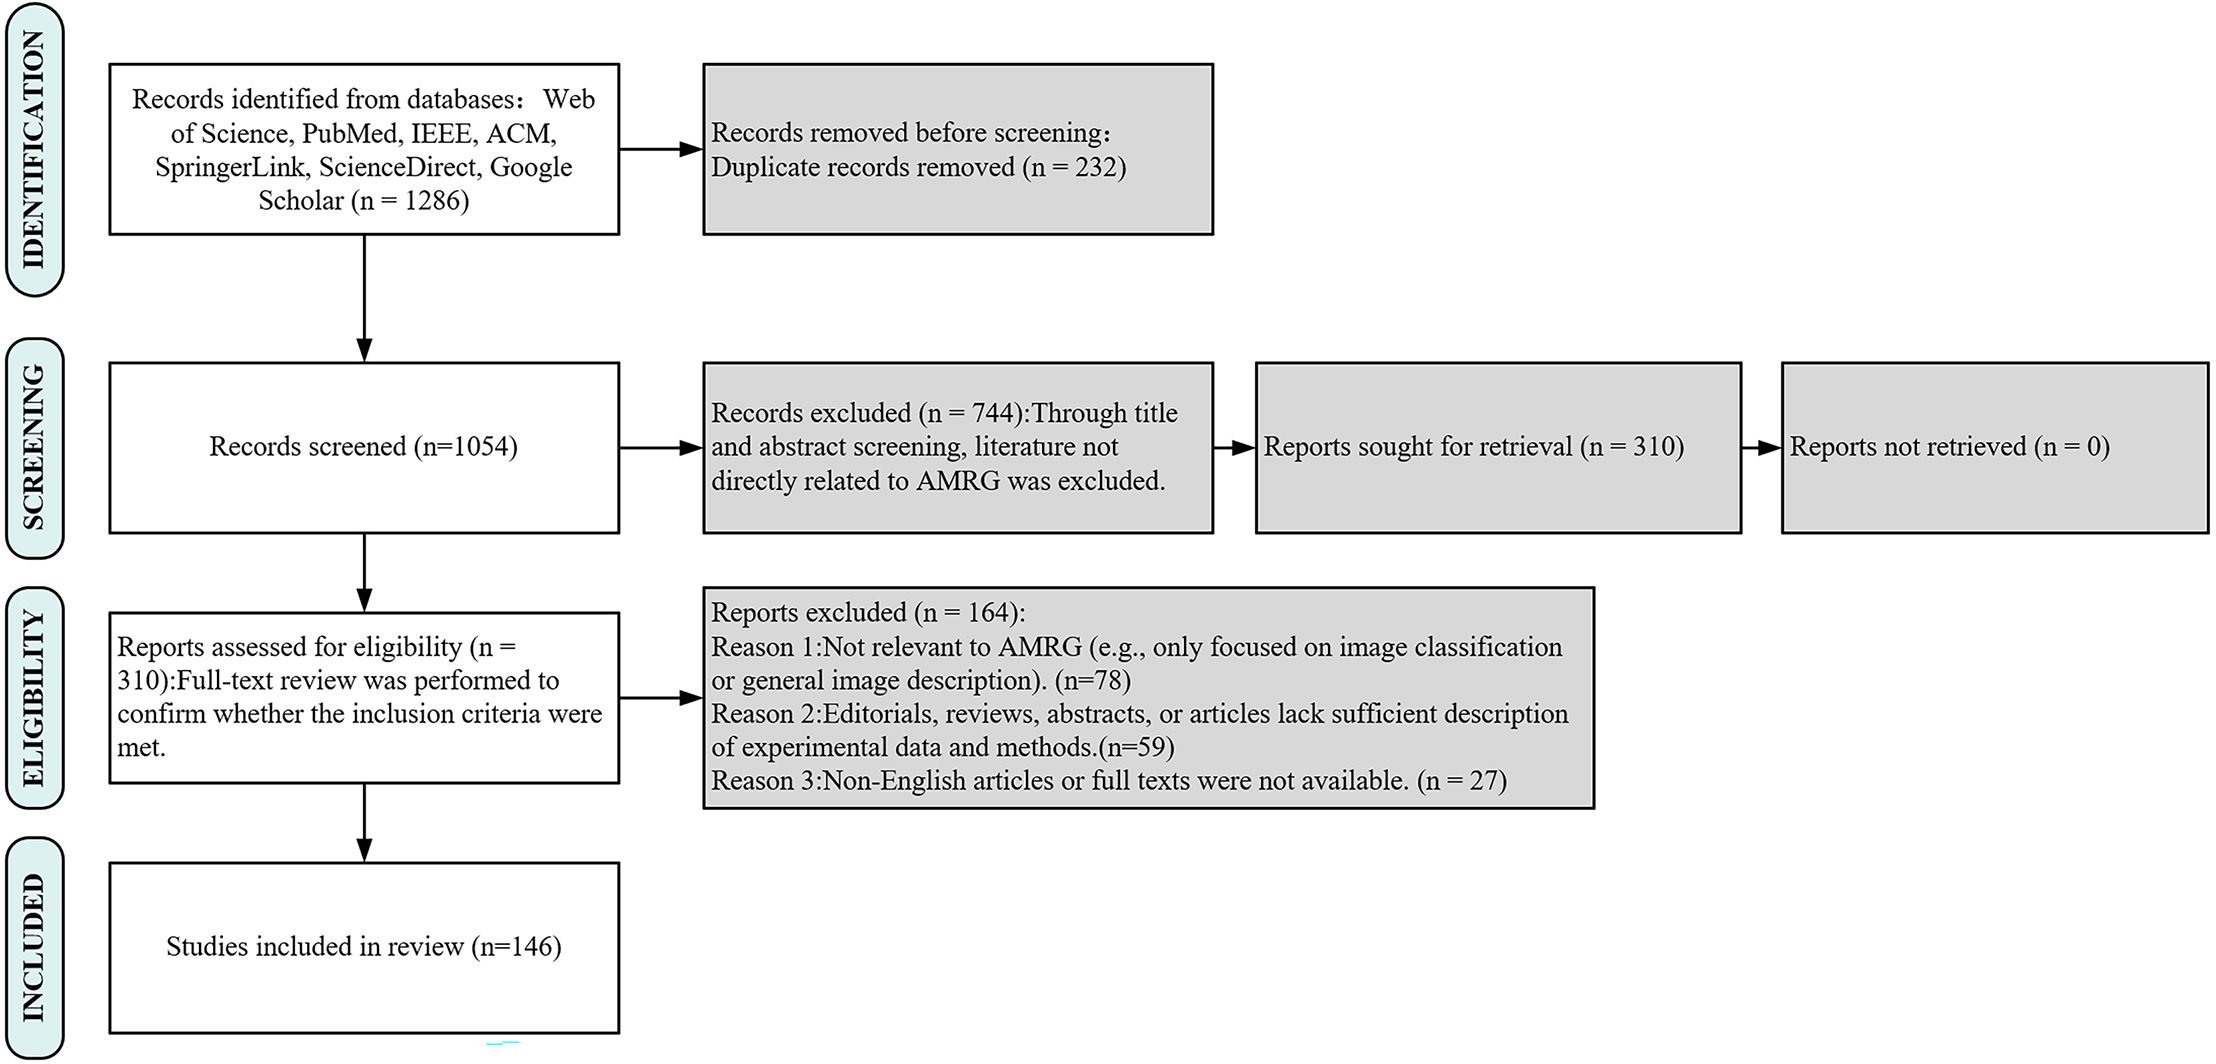
The rest of the article is organized as follows (Fig. 2). ‘Background’ provides an overview of the background of AMRG. ‘Methods’ reviews the mainstream methods of AMRG tasks. ‘Evaluation Metrics’ introduces the current evaluation metrics in the AMRG field. ‘Datasets and Applications’ aims to explore the available datasets and their applications in AMRG tasks. ‘Conclusion’ provides a comprehensive summary of this article and discusses the current problems in this field and potential future directions.
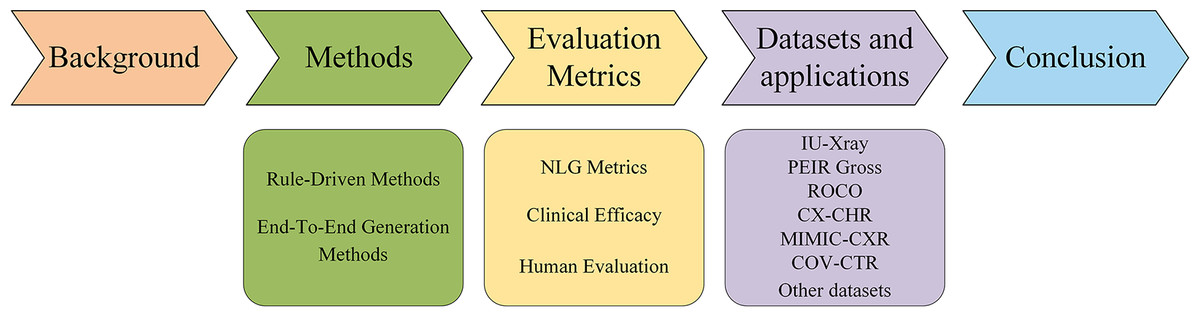
Figure 2: Organizational diagram of this article.
This figure serves as a visual guide for the reader, outlining the logical flow of the article from foundational concepts (Background, Methods) to application components (Metrics, Datasets) and future outlooks (Conclusion).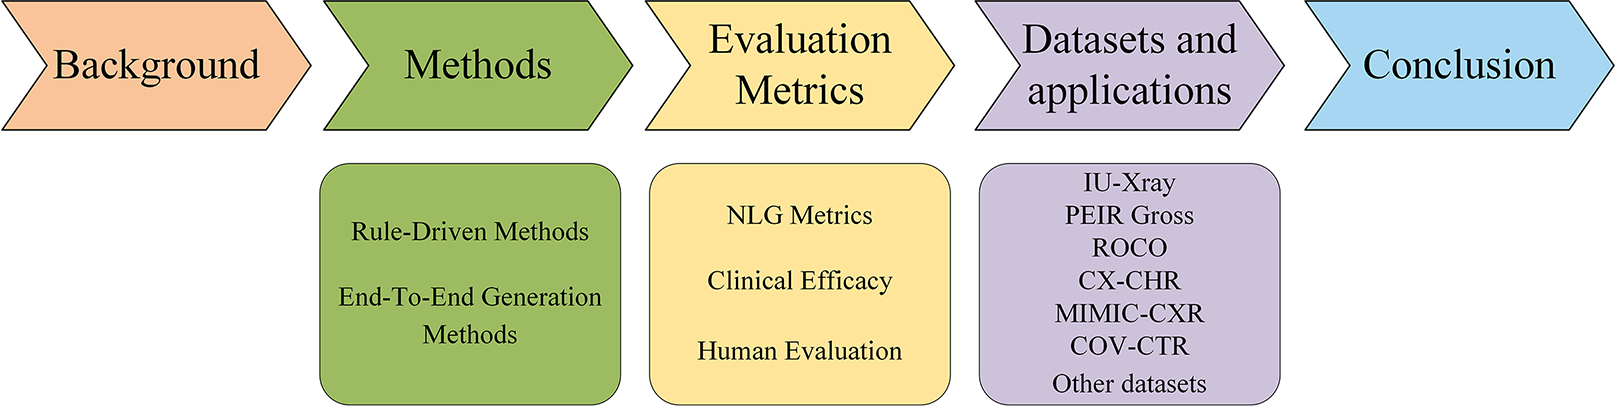
Background
Radiology reports are designed to convey the detailed anatomical and pathological information obtained from imaging examinations. A well-structured radiology report should not only provide a clear diagnosis, differential diagnosis, and suggestive diagnosis but also integrate the patient’s clinical context to serve as a decision-making reference for clinicians. Moreover, many physicians prefer structured reports as they help reduce subjective interpretation variability and improve diagnostic consistency. Despite efforts by various national medical societies to promote structured radiology reporting, its widespread adoption in routine clinical practice remains limited (dos Santos et al., 2023). A comprehensive radiology report is generally expected to include at least two core components: Findings and Impressions, as illustrated in Fig. 3. The Findings section provides an objective description of the imaging results, which details lesion morphology, size, location, boundaries, density, and enhancement characteristics. This section should minimize subjective interpretation and present only the observable facts from the imaging study. In contrast, the Impressions section synthesizes the findings with clinical considerations and typically offers different sections such as a diagnostic conclusion, differential diagnosis, and recommendations for further evaluation or treatment.
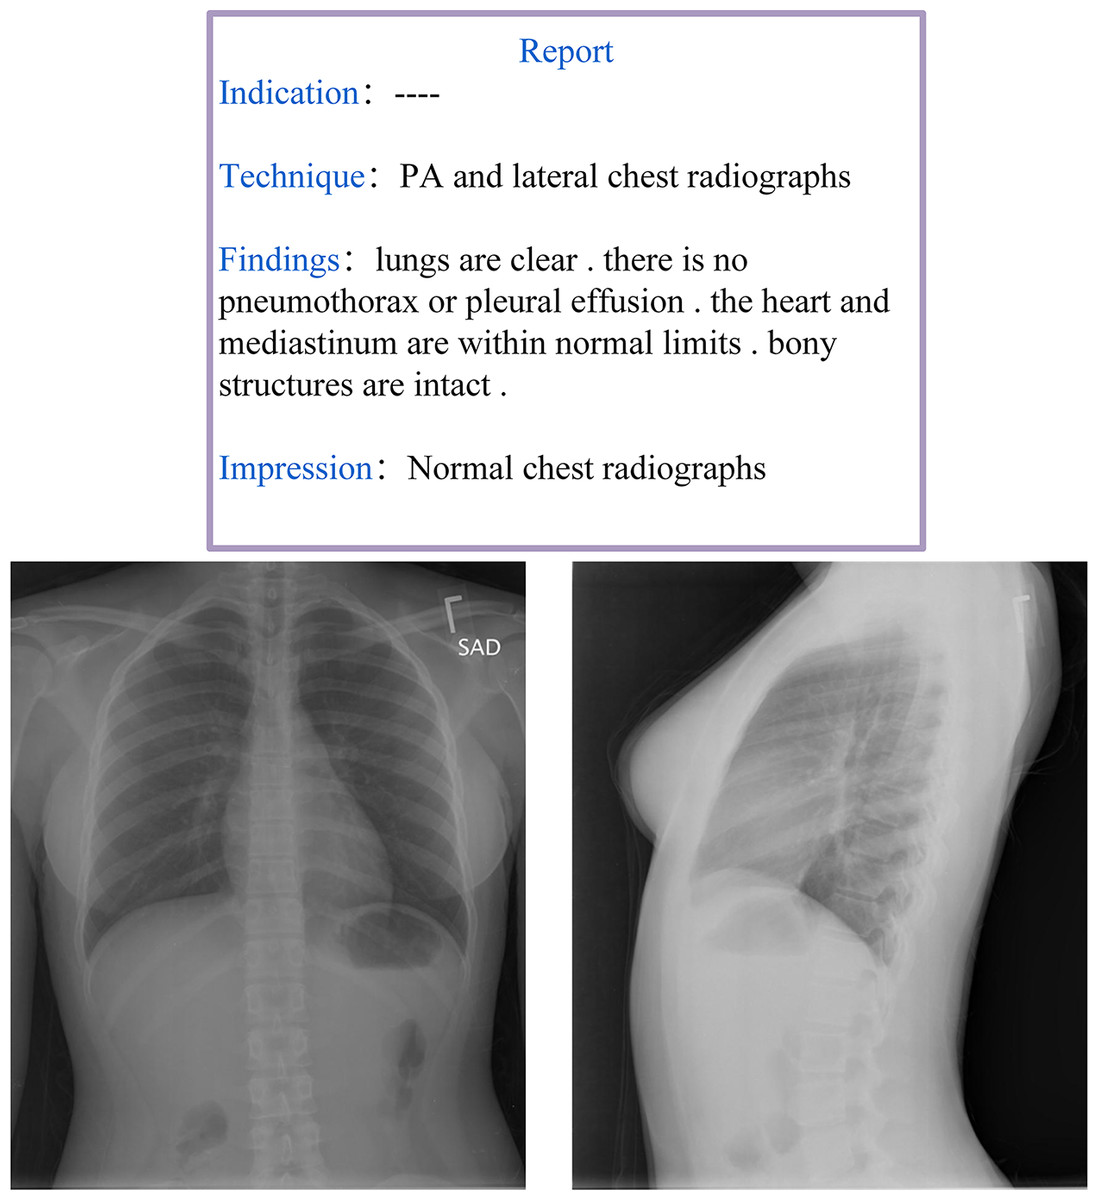
Figure 3: Example of a radiology report and image from the IU-Xray dataset (Demner-Fushman et al., 2016).
This two-part structure (objective ‘Findings’ vs. synthetic ‘Impressions’) is a core challenge for AMRG models, which must learn to both describe visual evidence and generate a diagnostic conclusion.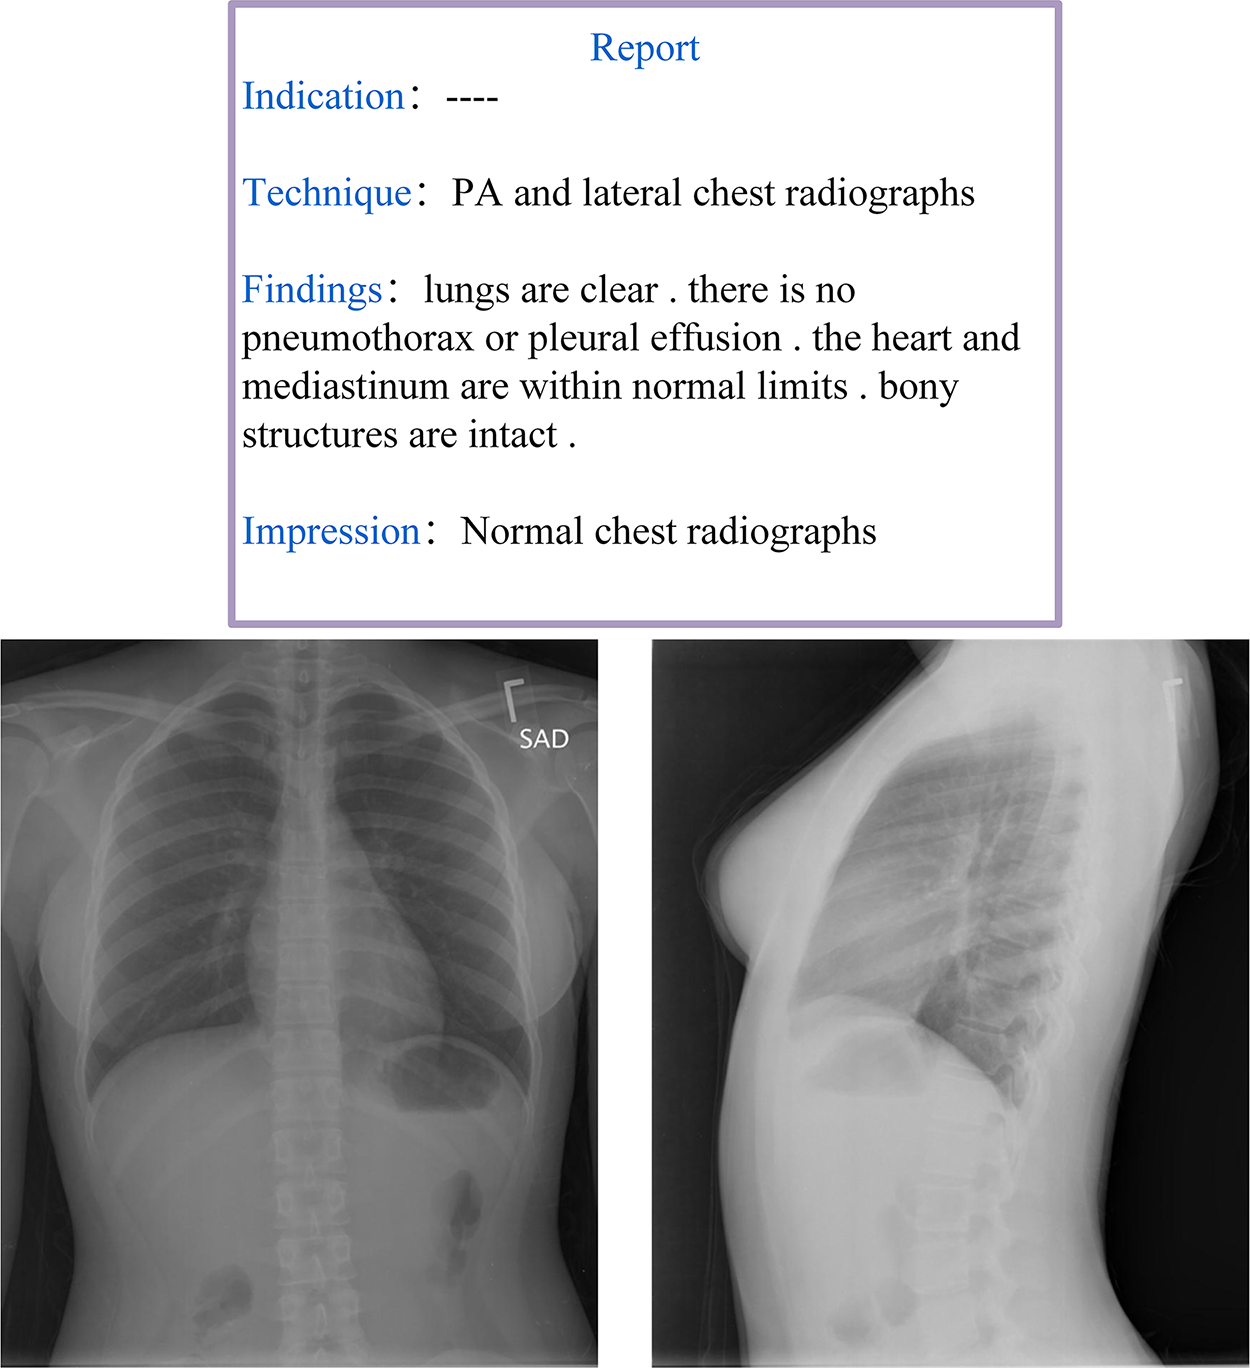
The primary objective of AMRG is to extract key information from various medical images and train models to generate descriptive text sequences that accurately depict the medical conditions present in the images. The core subtasks of AMRG include locating and identifying pathological features, mapping imaging findings to medical concepts, and generating clinically standardized natural language descriptions. The fundamental goals of AMRG can be summarized as follows:
Enhancing diagnostic efficiency: Traditional medical imaging diagnosis heavily relies on the expertise of radiologists, which necessitates them to manually analyze large volumes of images and compose detailed reports. In clinical practice, even a single case may require 10 to 15 min for a radiologist to generate a complete report, and this could potentially lead to delays. According to data from the British Radiology Department, nearly 333,000 patients waited over a month for their X-ray results in 2015 (Mayor, 2015). Given these challenges, automated report generation has the potential to reduce the workload of radiologists, accelerate the reporting process, optimize hospital operations, and minimize patient waiting times, ultimately facilitating timely treatment.
Reduce human errors: The extensive workload of radiologists can lead to fatigue and cognitive overload, which increases the risk of diagnostic errors. Studies (Brady, 2017) indicate that the error rate in radiology reports written by experienced professionals ranges from 3% to 5%, with some specialized studies reporting even higher error rates. These inaccuracies impose significant burdens on both patients and healthcare institutions. By providing consistent and objective analysis, automated report generation can mitigate human errors and improve diagnostic reliability, leading to more accurate and standardized medical assessments.
Standardizing radiology reports: Currently, variations in reporting styles and terminology among different radiologists pose challenges for report consistency and clinical interpretation. In addition, the lack of standardized report templates remains a concern. As highlighted in dos Santos et al. (2023), there is an urgent need to establish more structured and standardized radiology report formats to enhance medical efficiency. As a solution, AMRG offers a highly structured and uniform reporting format, ensuring that generated reports align with the standardization requirements and future developments in radiology.
The AMRG task integrates CV and NLP techniques to facilitate a comprehensive understanding of medical images. CV, a key branch of artificial intelligence, aims to enable computers to “see” and interpret visual information from images and videos. By simulating the human visual system, CV extracts, processes, analyzes, and interprets information from medical images (Khan, Laghari & Awan, 2021). Its core objective is to acquire knowledge and make data-driven decisions based on two-dimensional and three-dimensional images. In the context of AMRG, the primary role of CV is to extract relevant features from medical images. For instance, in X-rays, CT scans, and MRI images, it is necessary to identify and locate specific pathological regions, such as tumors, nodules, or fractures. However, unlike natural images (e.g., those of animals or everyday objects), radiological images exhibit high inter-similarity, often differing by subtle variations (Wang et al., 2022b). These nuanced changes can significantly impact the accuracy of generated reports, necessitating precise feature extraction techniques. NLP focuses on the automatic processing and understanding of human language in its textual form Kang et al. (2020). Unlike basic text interpretation, NLP tasks require a deep contextual understanding of words and their relationships within a given text. In AMRG, NLP is responsible for converting extracted image features into natural language reports that adhere to medical standards. This process demands the generation of grammatically accurate, medically precise, and clinically relevant text. Notably, AMRG differs from traditional NLP tasks in which the generated reports tend to be longer and often contain highly similar yet semantically distinct sentences. Wang et al. (2022b) highlights that radiology reports exhibit fine-grained variations, in which normal findings are frequently described in repetitive language, whereas descriptions of pathological abnormalities are often less consistent or even omitted entirely.
Image analysis has long served as the foundation of AMRG tasks. Traditional machine learning algorithms are inherently constrained by limited data availability and model complexity. However, with the breakthrough advancements in deep learning, particularly convolutional neural network (CNN) and Transformer-based architectures, deep learning models have become the dominant approach in AMRG. Medical image report generation requires not only fluent and coherent text generation but also high medical accuracy and clinical relevance. In recent years, researchers have increasingly integrated medical knowledge graphs into AMRG models to meet the specialized demands of the medical field and enhance the diagnostic reliability and clinical value of generated reports (Liu et al., 2021c). Furthermore, the performance of medical image report generation is highly dependent on the quality and diversity of training datasets. With the continuous accumulation of medical imaging and radiology reports, an increasing number of high-quality datasets have been developed, thereby providing a stronger foundation for AMRG research.
Methods
The core task of automatic medical report generation (AMRG) is to convert visual information into structured text. The methodological evolution in this field can be roughly divided into two major phases (as shown in Fig. 4): early rule-driven approaches and later end-to-end generative methods. This chapter systematically explores these approaches, illustrating their core principles, advantages, and limitations, providing profound insights into the development of medical image report generation technology.
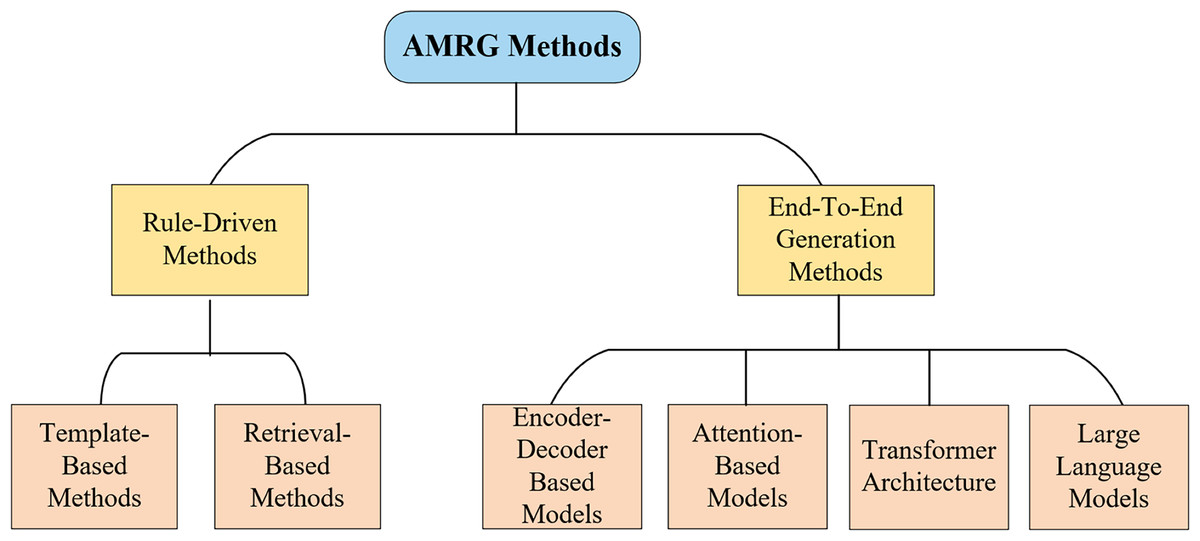
Figure 4: Classification of AMRG methods.
This chart highlights the primary technological shift in the field: a clear evolution from rigid, rule-driven approaches toward more flexible and powerful end-to-end deep learning paradigms.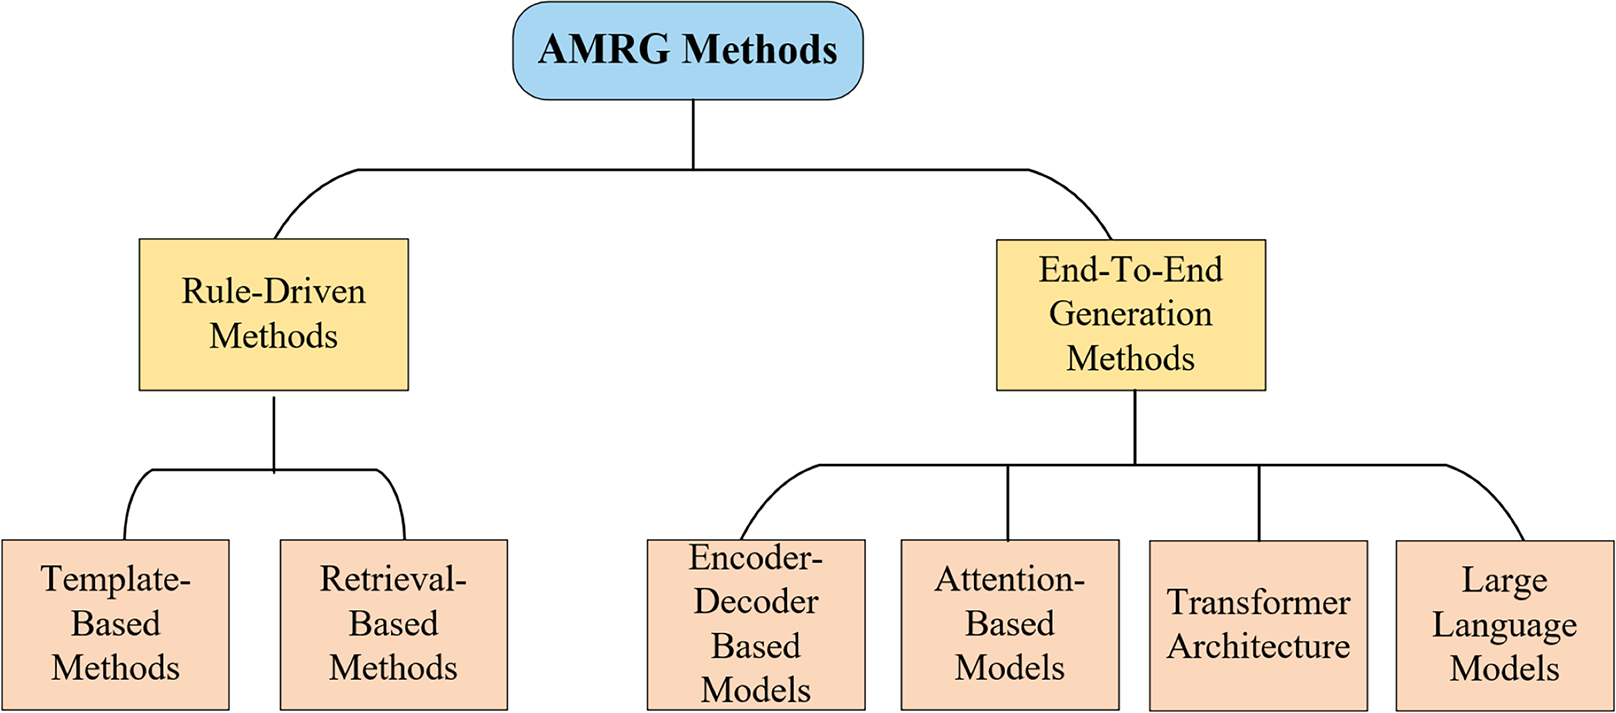
Early paradigms: rule-driven approaches
Before deep learning became mainstream, early AMRG systems relied primarily on well-defined rules and pre-built resource libraries. While these approaches had limited flexibility, they laid the foundation for the emergence of more complex models. They were primarily categorized into two strategies: template-based and retrieval-based.
Template-based methods
One approach to AMRG is the template-based generation scheme, which relies on predefined template structures and specific grammatical rules. The core principle involves generating medical reports by defining structured templates and populating them with key information extracted from medical images. Template-based methods ensure that the generated reports maintain structural consistency and linguistic uniformity, and they adhere to a standardized format and grammatical framework. This consistency is particularly valuable in medical report standardization, as it enables healthcare professionals to extract critical information quickly and accurately. Given their simplicity and reliability, template-based approaches have been widely adopted in scenarios with limited data availability or high annotation costs, where more complex deep learning models may be impractical.
Yin et al. (2012) designed a template designer (WYSIWYG) with a visualization component library as its core module, which incorporated 39 visualization components as fundamental units for templates and reports. This system enabled the automatic generation of medical reports and significantly reduced the time required for physicians to complete their documentation. Harzig, Einfalt & Lienhart (2019) advanced this paradigm by applying a template library to gastrointestinal examination videos. Additionally, by integrating class activation maps (CAMs), their approach can simultaneously generate detailed text reports and visual guidance that indicates the spatial locations and anatomical landmarks of detected abnormalities. Kale & Jadhav (2023) proposed a novel template-based generation method that first constructed small sentence fragments describing abnormal findings and subsequently replaced them with predefined normal report templates to generate clinically consistent reports. They further introduced a replacement dataset mapping pathological phrases to their corresponding normal sentences, which enhanced language naturalness. Nevertheless, this replacement strategy may risk simplifying complex exceptions and reducing the diversity of generated reports. Pino et al. (2021) introduced CNN-TRG, a simplified yet effective template-based report generation model that coupled CNN-based abnormality detection with template-based report generation. By adopting evaluation metrics such as Chexpert (Irvin et al., 2019) and MIRQI (Zhang et al., 2020), they demonstrated superior performance in clinical correctness compared with prior template systems. However, both the CNN-TRG framework and the adopted CheXpert metrics were restricted to 13 predefined anomalies, leaving many important pathologies unaccounted for.
On the other hand, early template-based methods are typically designed for specific disease types or imaging modalities, which limit their scalability. When applied to different image types or diseases, these templates often require redesign or manual adjustment, making large-scale implementation tedious and resource-intensive. Aside from that, existing templates are generally populated with predefined text descriptions of medical images, with the model simply matching extracted image features to template variables. However, generating abnormal findings is inherently more challenging than describing normal conditions. While normal descriptions follow consistent patterns, abnormalities usually require detailed explanations and precise localization within the image, which necessitates modifications to the template to accommodate such information (Beddiar, Oussalah & Seppänen, 2023a). Ayesha et al. (2021) argue that template-based AMRG highlights that template-based AMRG offers simplicity and controllability while adhering to correct syntactic structures and generating reliable reports for structured and standardized tasks. However, its dependence on predefined visual concepts results in restricted flexibility and personalization, making it less effective in handling the complexity and high variability of medical imaging scenarios.
Retrieval-based methods
Retrieval-based generation methods operate on the assumption that similar medical images correspond to similar report descriptions. These methods construct a large-scale database of image-report pairs. When presented with a new image, the system retrieves the most similar image and its corresponding report based on predefined similarity rules and matching schemes. The final report is then generated by selecting, combining, or modifying relevant fragments from the retrieved reports (Fig. 5). Unlike template-based methods, retrieval-based approaches utilize a vast repository of annotated medical reports and case records, which primarily rely on image-text similarity matching to generate reports. Liu et al. (2019) demonstrated that retrieval-based methods achieved higher recall rates compared to other approaches, even when simply assigning the most similar retrieved report to a new image. Given their reduced reliance on large-scale training datasets and computational resources, retrieval-based methods have been widely explored, particularly in data-limited scenarios.
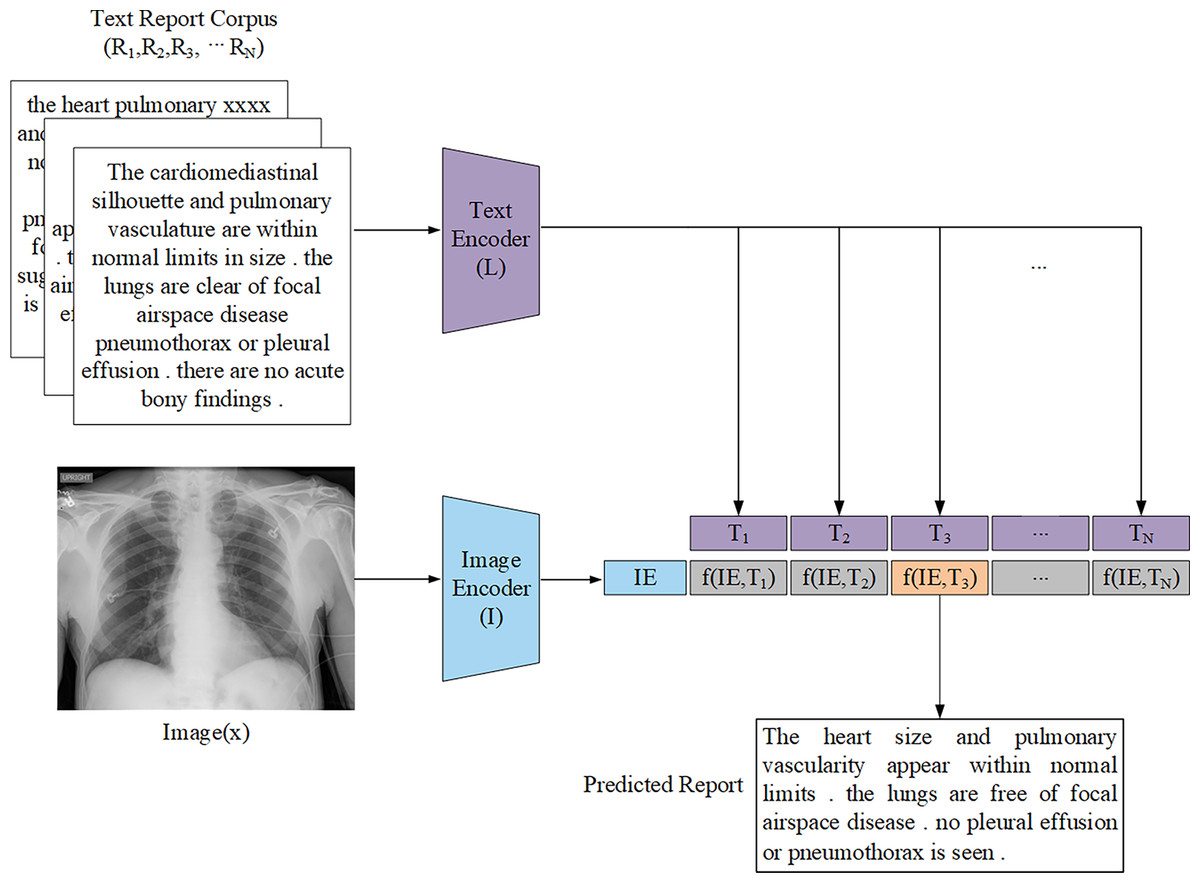
Figure 5: General architecture representation of the retrieval-based AMRG computed via a distance function.
The text encoder L is passed through the report corpus R to produce the text embedding T. The image encoder I is passed through the input image x to produce the image embedding IE.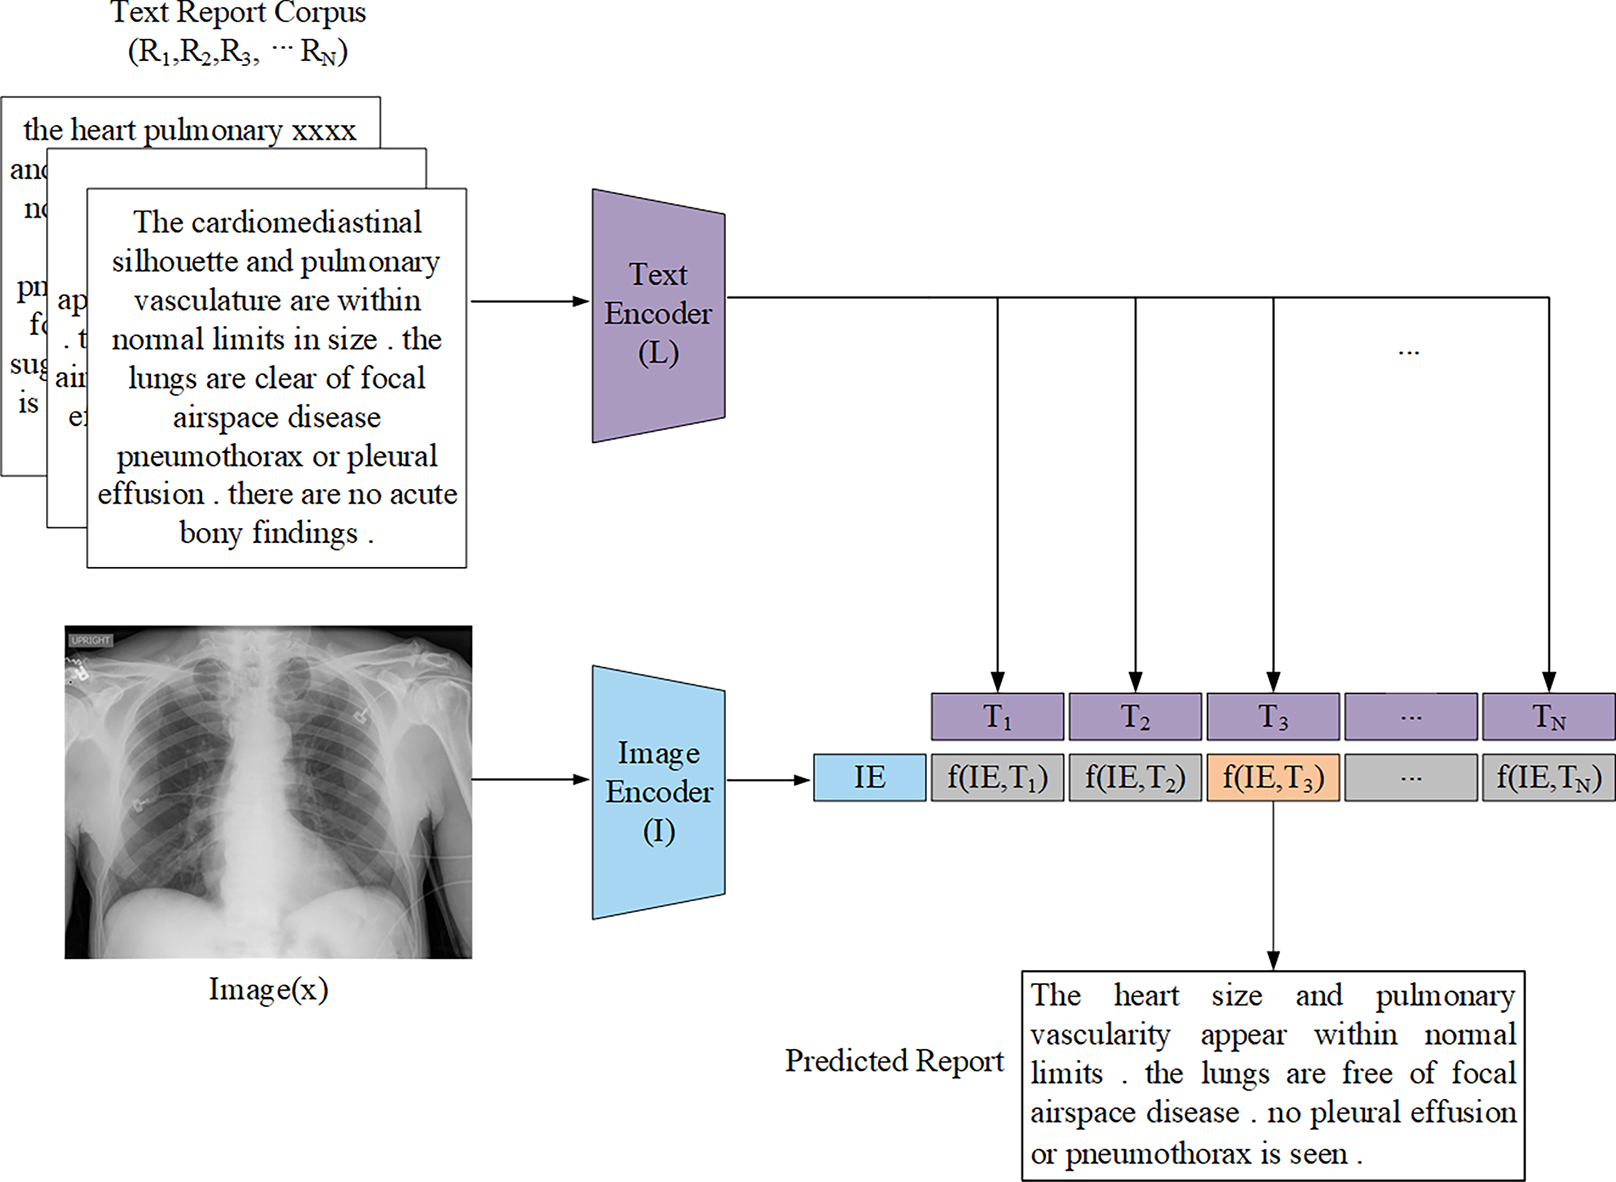
Zhang et al. (2018) proposed a multi-label classification scheme combined with transfer learning to address the annotation challenge in the ImageCLEF2018 caption task. Their retrieval-based approach generated captions by retrieving similar images using color and texture features, then aggregating the captions of top-ranked matches. Yang et al. (2021a) introduced MedWriter, a model based on a hierarchical retrieval mechanism designed to automatically extract report and sentence-level templates for report generation. MedWriter innovatively proposed three key modules: (1) Visual-Language Retrieval (VLR) to retrieve the most relevant report template for a given image, (2) Language-Language Retrieval (LLR) to select relevant sentences based on the previously generated descriptions to ensure logical coherence within the report, and (3) Hierarchical Language Decoder to fuse image features with the retrieved report and sentence features to generate clinically meaningful medical reports. Endo et al. (2021) proposed CXR-RePaiR, a retrieval-based radiology report generation method that utilized a pre-trained contrastive language-image model. They argued that report generation should be reframed as a retrieval task rather than a traditional image captioning or language generation task so as to leverage zero-shot learning and the limited space of possible findings and diagnoses inherent in medical reports. However, while their ablation studies analyzed how factors such as pre-training techniques, retrieval corpus type, and the number of selected sentences impacted model performance, their method did not address a key limitation of retrieval-based approaches: the inability to predict rare pathologies that were absent from the reference corpus. Notably, Jeong et al. (2024) adopted a similar image-text retrieval approach to that of Endo et al. (2021) for radiology report generation. However, unlike (Endo et al., 2021) who used two pre-trained unimodal encoders to compute similarity scores, Jeong et al. (2024) attempted to overcome the problem of retrieval-based attempts often retrieving reports unrelated to the input image by using a multimodal encoder that fuses image and text representations to achieve image-text matching, thereby improving retrieval accuracy. However, this approach suffers from significant data bias, and whether it can achieve significant results outside of the domain remains unknown. Syeda-Mahmood et al. (2020) introduced a domain-aware retrieval framework that leveraged fine-grained lesion descriptions and constructed a multi-model feature pyramid to enhance retrieval quality. Although their approach improved clinical precision, the system required extensive domain knowledge and manual feature engineering, which hinders scalability. Sun et al. (2024) proposed a fact-aware multimodal retrieval-augmented pipeline (FactMM-RAG) for radiology report generation. Their approach used RadGraph (Jain et al., 2021) to annotate chest X-ray reports and extract clinically relevant concept pairs. They then used a pre-trained multimodal encoding architecture to perform dense retrieval of paired radiology reports. While still relying on a report corpus, this approach significantly improved clinical effectiveness.
Although retrieval-based methods have demonstrated promising results in AMRG by leveraging large amounts of annotated data to efficiently match and generate medical reports, they remain fundamentally data-dependent. As Endo et al. (2021) highlighted, clinical scenarios were highly complex and dynamic. When encountering emerging diseases or intricate medical images, retrieval-based approaches often struggle to generate accurate and reliable reports. Similarly, Chen et al. (2020) pointed out that the pathological heterogeneity of real-world medical data posed significant challenges in constructing large-scale retrieval databases, which further limited the adaptability of retrieval-based models. Nevertheless, with the growing availability of medical data and advancements in retrieval algorithms, these methods are expected to become increasingly flexible and accurate and offer improved adaptability to diverse clinical settings.
Template-based and retrieval-based methods face inherent challenges in terms of flexibility and scalability. Their limited ability to handle the high variability and complexity of clinical scenarios has paved the way for more flexible, data-driven end-to-end generative approaches.
The deep learning era: the rise of end-to-end generation methods
End-to-end generation methods learn the mapping relationship between medical images and textual descriptions and demonstrate strong performance in processing complex visual content and generating fluent and natural language reports. With the rapid advancement of deep learning technologies, end-to-end generation has progressively supplanted rule-based approaches and become the predominant paradigm in AMRG. Consequently, this framework has represented the mainstream direction for most contemporary research in AMRG. This section provides a systematic analysis of the most employed architectures in end-to-end generation methods and highlights their key components, advantages, and limitations.
The encoder-decoder model is the most widely used architecture in AMRG. While various encoder-decoder configurations have been developed, they all follow the same fundamental principle. This architecture consists of two key components: the encoder and the decoder. The encoder processes the input data and maps it to a fixed-size hidden state vector. In the context of medical image report generation, the encoder is responsible for extracting meaningful features from medical images, and it typically utilizes CNN as the primary image encoder. On the contrary, the decoder is primarily used to generate descriptive text corresponding to the input image, and the decoder implementation commonly employs Recurrent Neural Network (RNN) and their variants, such as Long Short-Term Memory (LSTM) networks and Gated Recurrent Unit (GRU). The application of the encoder-decoder architecture in AMRG is illustrated in Fig. 6.
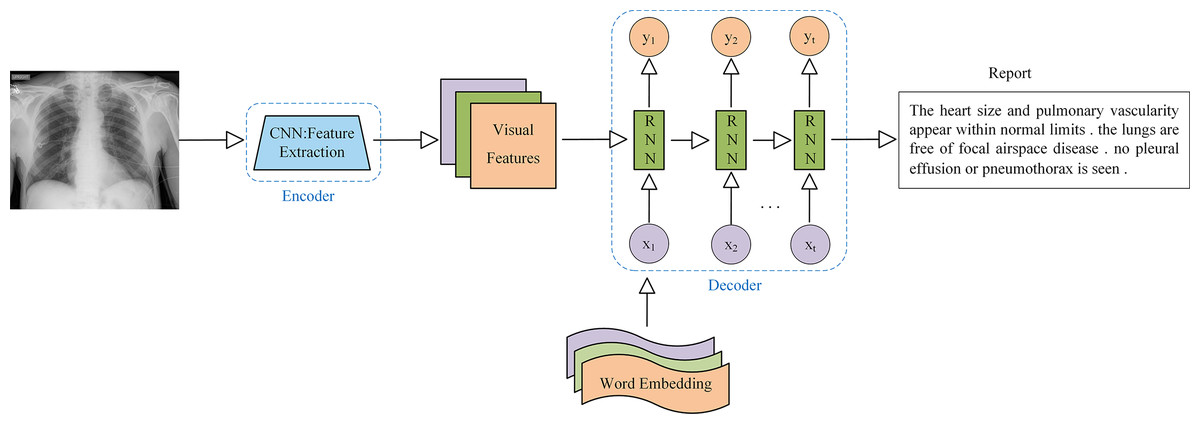
Figure 6: Example of a medical image report generation model based on the encoder-decoder architecture.
Note: x represents the input layer, y represents the output layer, and t represents the time step.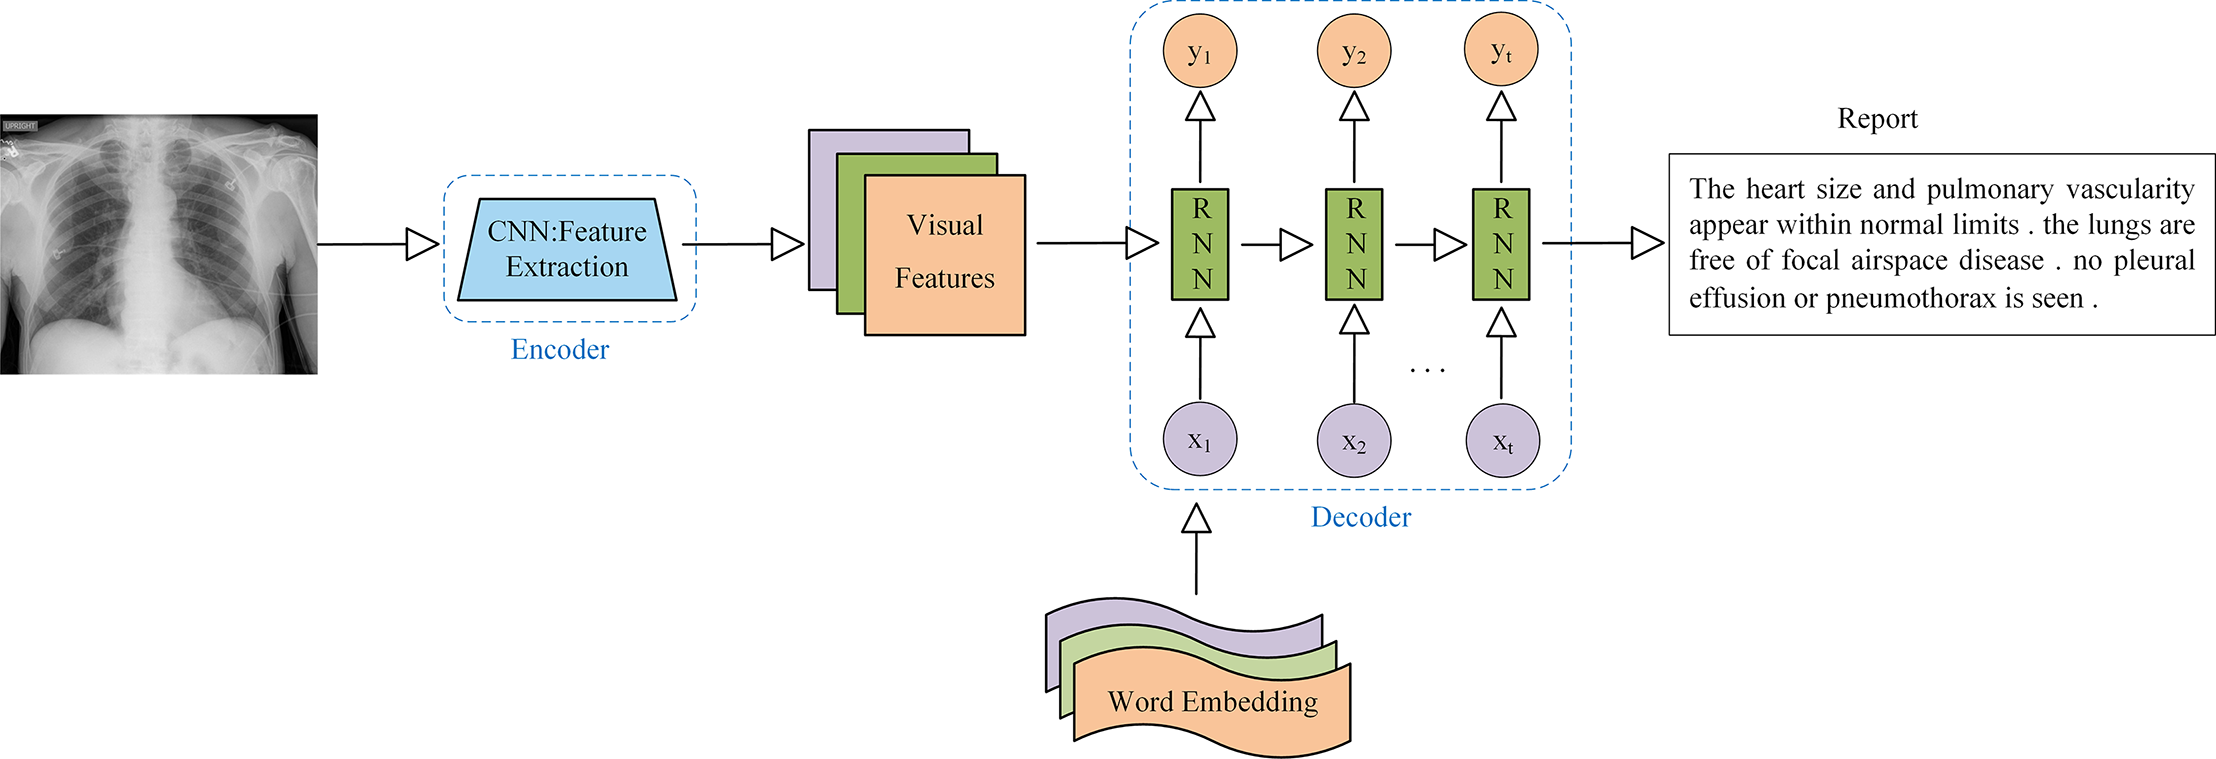
The application of the encoder-decoder model architecture to the AMRG task was originally inspired by the Show-And-Tell model proposed by Vinyals et al. (2015) in the field of natural image captioning. This model employed CNN for image encoding and LSTM for text generation, which successfully produced descriptive sentences for natural images with outstanding performance. Hence, the introduction of the Show-and-Tell model laid the foundation for adopting the encoder-decoder architecture in AMRG. Shin et al. (2016) were the first to apply the encoder-decoder framework to AMRG. They developed a CNN-RNN deep learning model capable of simultaneously detecting diseases and annotating contextual information, such as location, severity, and affected organs, from medical images. Their approach involved using image annotations to extract disease names, which were then used to train a CNN. Subsequently, an RNN was then trained to generate descriptive context based on the extracted deep CNN features. Singh et al. (2019) extended this approach by utilizing the Inception-v3 model (Szegedy et al., 2016) as the CNN encoder and a multi-level stacked LSTM as the decoder, which converted medical image features into radiology reports, and their findings demonstrated the potential of stacked RNN (SRNN) for generating radiology reports. Building on the concept of SRNN, researchers have also explored hierarchical RNN (HRNN) as decoders. The core idea of HRNN is to introduce multi-level hierarchical processing for sequential data, enabling them to capture language features more effectively and generate longer and more coherent texts (Krause et al., 2017). For example, Jing, Xie & Xing (2017) argued that single-layer LSTMs had limited modeling capacity for long word sequences. To address this, they leveraged the compositional nature of medical reports and introduced a hierarchical LSTM for long-text generation. In this framework, after CNN encoding was completed, the context vector was passed to a sentence-level LSTM, which expanded over several steps to produce topic vectors that represented the semantics of each sentence to be generated. These topic vectors were then fed into a word-level LSTM, which generated fine-grained word sequences to form sentences. Wang et al. (2022a) built on this approach by selecting DenseNet-121 (Huang et al., 2017) as the encoder network backbone and implementing a two-layer LSTM decoder similar to the one proposed by Jing et al. In addition, they also introduced a graph convolutional neural network (GCN) module, which integrated prior knowledge from text mining to enhance the medical accuracy of generated radiology reports. Subsequent studies by Huang et al. (2019), Yuan et al. (2019) and Harzig et al. (2019) further advanced hierarchical RNN in various ways.
It is evident that the majority of encoder-decoder-based research in AMRG has centered around LSTM networks that can achieve state-of-the-art (SOTA) results. This success is attributed to the gating mechanisms of LSTM—the input gate, forget gate, and output gate—which regulate information flow and effectively mitigate the gradient vanishing problem (the LSTM architecture is illustrated in Fig. 7). These properties make LSTM well-suited for tasks requiring the capturing of long-term dependencies. However, despite its ability to model long-range dependencies, LSTM-based text generation may still lead to word omissions in the generated report sentences (Najdenkoska et al., 2021). Compared to LSTM, the GRU offers a more streamlined architecture, improved computational efficiency, and a similar gating mechanism. Consequently, GRU is often a preferable choice in scenarios with limited data availability or constrained computational resources, as it can achieve comparable or even superior performance. Akbar et al. (2023) employed GRU as the decoder in their CNN-GRU model architecture. Their approach fed both the image vector and text embedding layers into the GRU decoder during training, demonstrating promising results in generating short and grammatically correct sentences with fluent medical terminology.
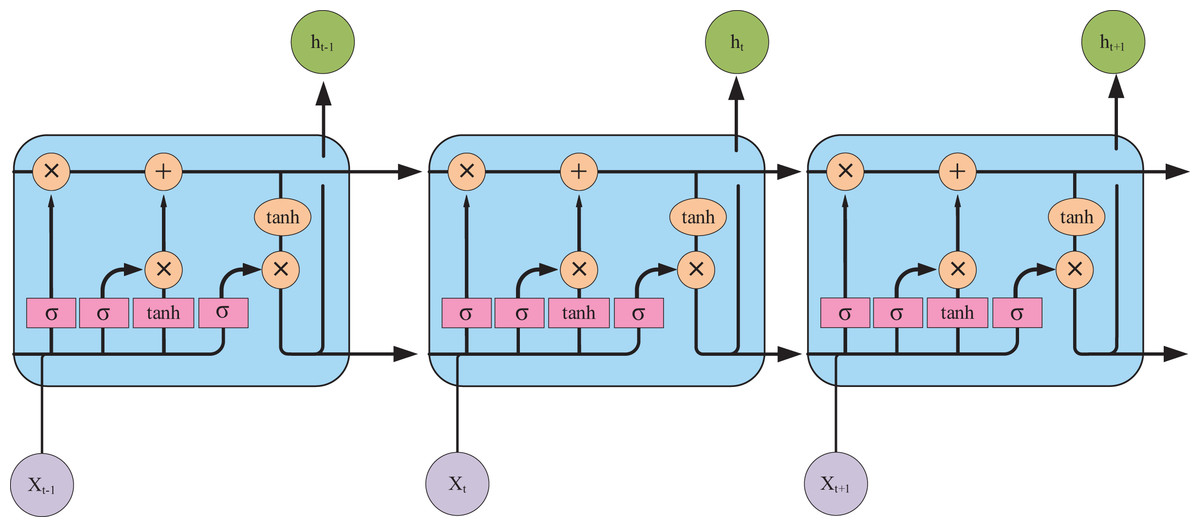
Figure 7: The internal structure of the LSTM unit.
Pink represents neural network layers (σ is the sigmoid activation function), and orange represents vector element operations (× represents vector element multiplication, + represents vector element addition).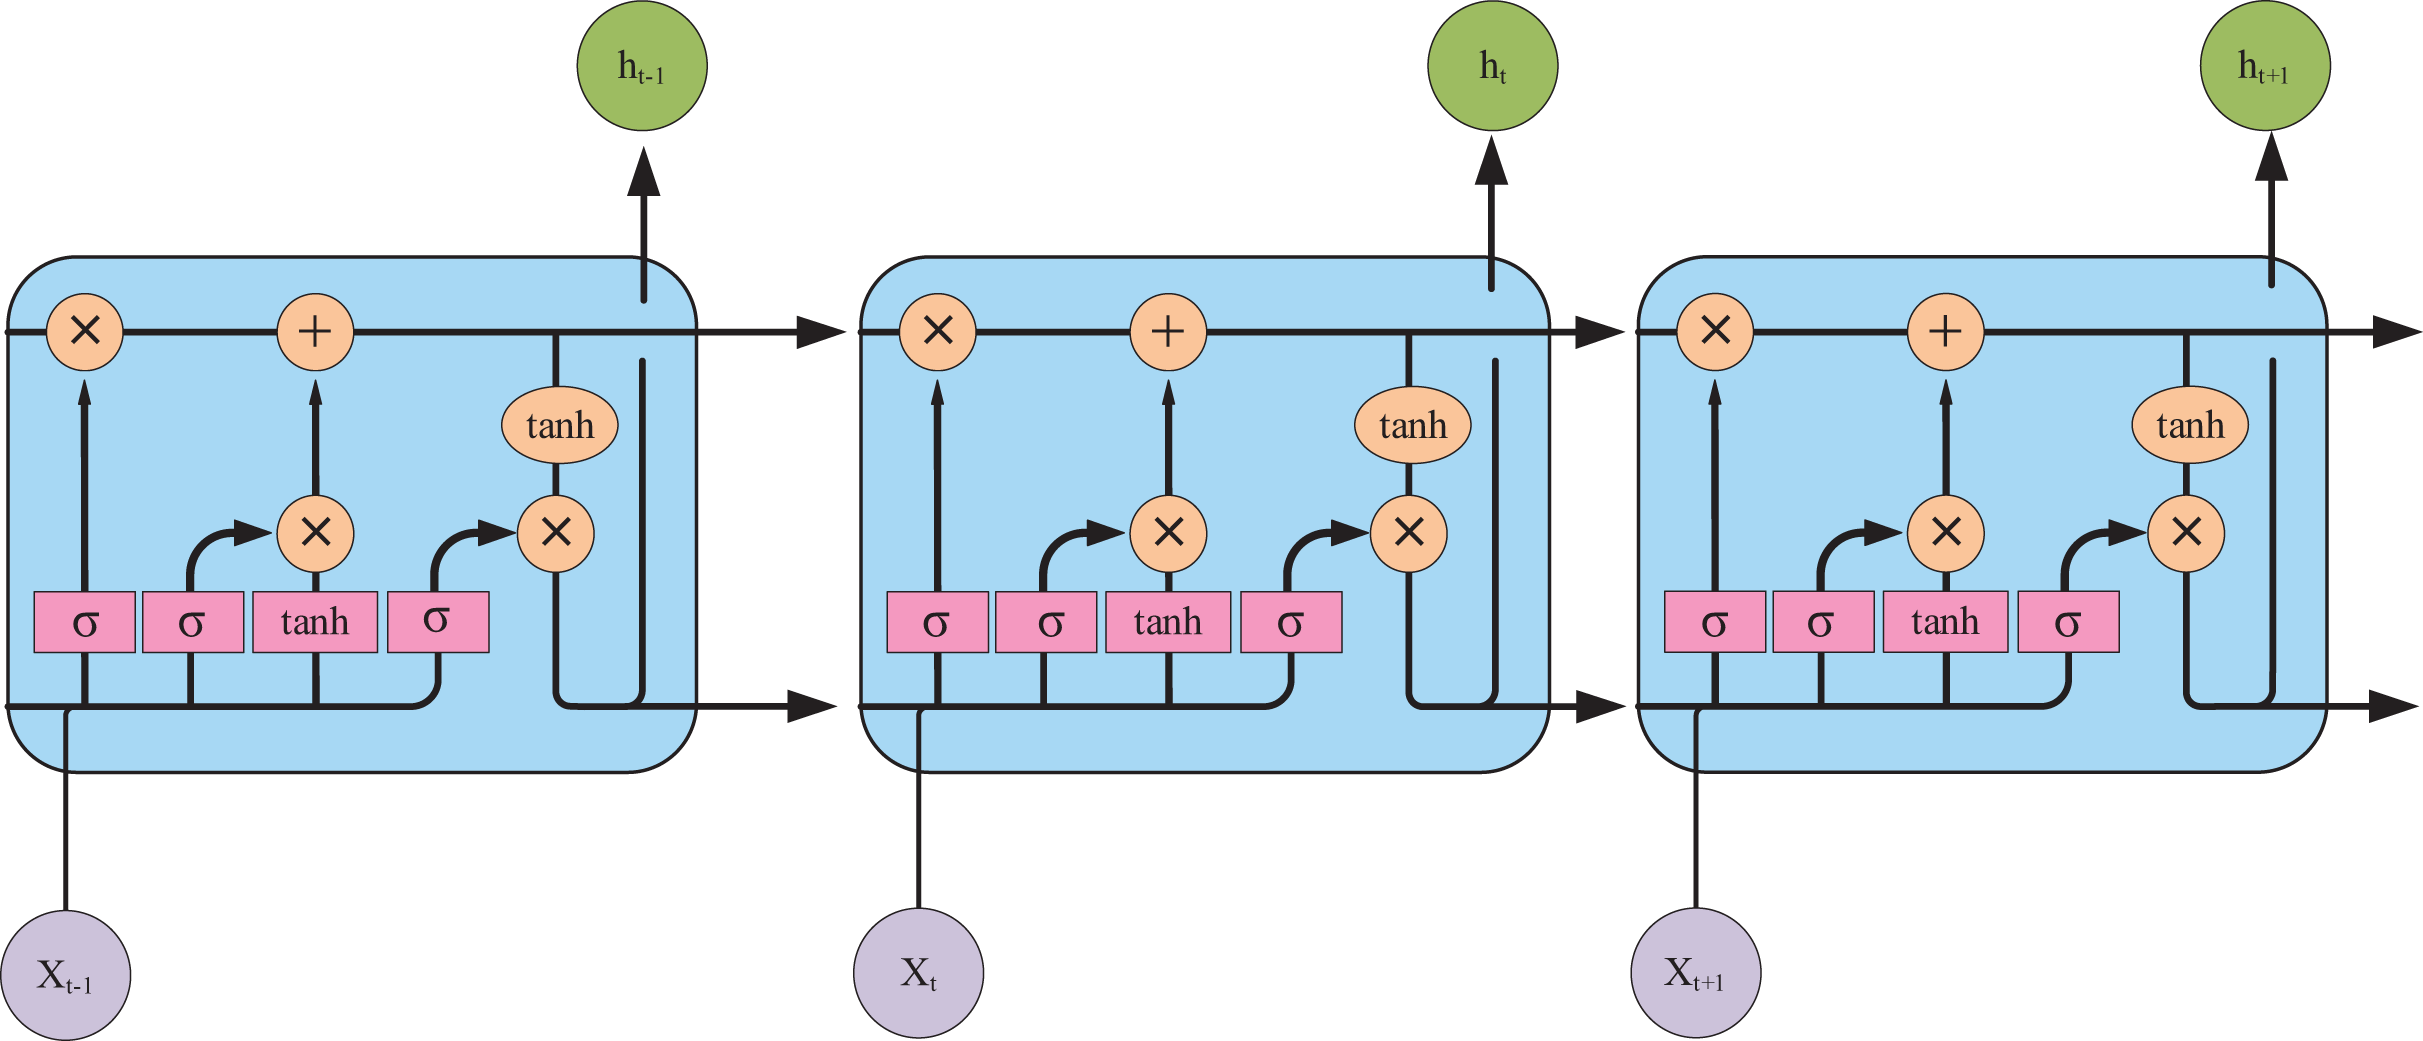
These developments illustrate the evolution of encoder-decoder models in AMRG: from simple CNN-RNN pipelines to more sophisticated hierarchical architectures that attempt to balance fluency and clinical correctness. Despite the enormous success of encoder-decoder models, their core bottleneck lies in the fact that the encoder must compress all input information into a fixed-length context vector. For information-rich medical images and lengthy reports, this compression process inevitably leads to information loss, especially when dealing with long-range dependencies. This fundamental limitation motivates the introduction of the attention mechanism.
The transformer revolution: redefining sequence modeling
In order to solve the information bottleneck problem of the traditional encoder-decoder architecture, researchers have explored various attention mechanisms (Niu, Zhong & Yu, 2021), enabling the model to selectively “look back” at different regions of the image during generation. This paradigm ultimately culminated in the Transformer, which replaced the sequential RNN structure entirely with a more powerful self-attention mechanism, proving far more effective at managing these complex relationships.
Attention-based models
The attention mechanism allows the decoder to dynamically focus on different regions of the input image when generating each word (Fig. 8), rather than relying on a single fixed vector. This enables the model to more effectively capture key visual areas and subtle pathological changes. However, different variants approach this goal from distinct perspectives, including refinement of spatial focus, hierarchical alignment with medical semantics, or high-order feature interactions. Representative advances and their respective contributions are summarized below.
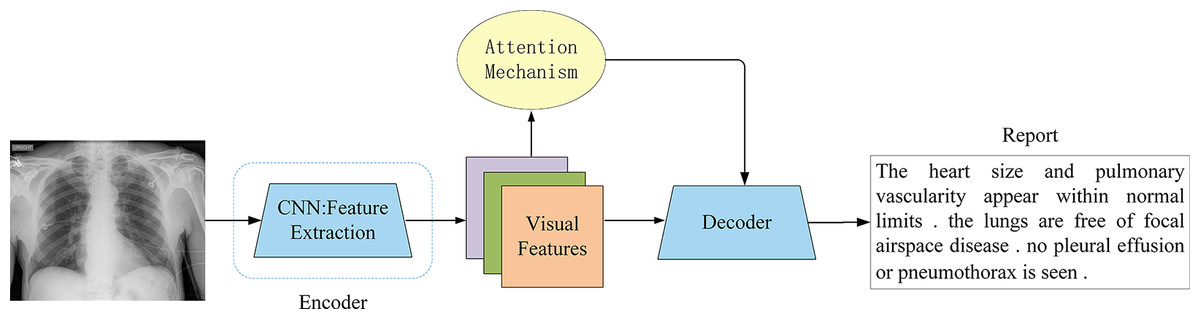
Figure 8: Attention-based encoder-decoder architecture.
The attention mechanism was a key innovation, allowing the decoder to dynamically focus on the most relevant image regions while generating each word, overcoming the fixed-vector bottleneck of earlier models.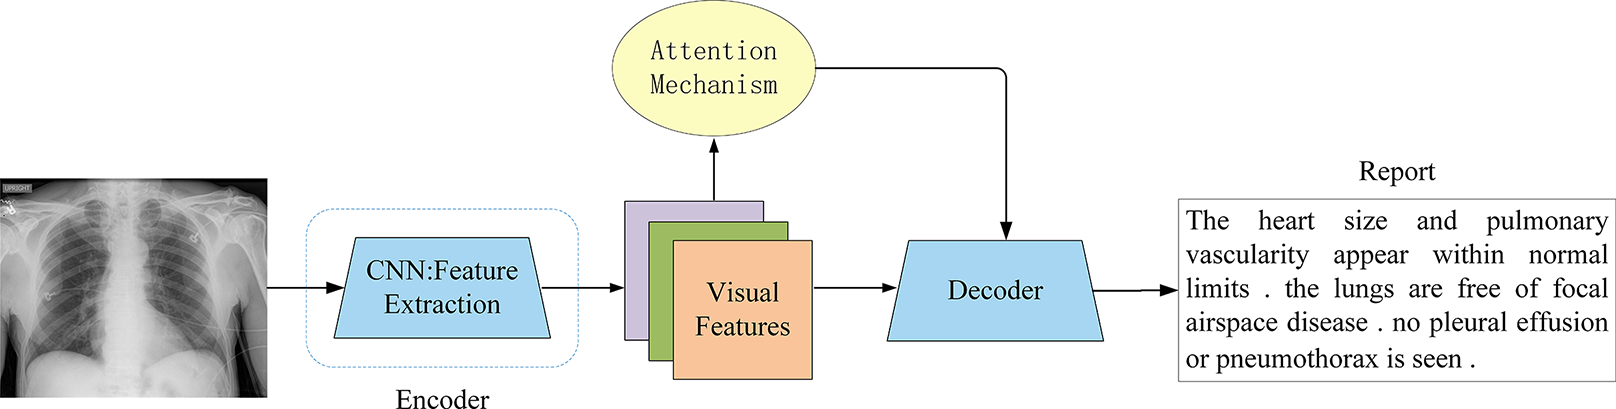
Zhang et al. (2017) were among the first to incorporate attention mechanisms into medical image models. They proposed a diagnostic captioning model for bladder cancer images, named MDNET, which integrated both image and language models. Their approach introduced an auxiliary attention sharpening (AAS) module that was designed to refine the original attention mechanism and ensured a stronger focus on informative regions. This model achieved SOTA performance on a dataset consisting of pathological bladder images and their corresponding diagnostic reports. While effective, its reliance on handcrafted attention sharpening limited scalability to more complex imaging modalities. Subsequent studies extended attention to capture richer local or multimodal contexts. Han et al. (2021) introduced a neural-symbolic learning (NSL) framework for spinal radiology report generation, integrating deep neural learning with symbolic reasoning. Their local semantic attention mechanism modeled visual features as symbolic nodes, enabling probabilistic weighting of multiple image regions. This design improved multi-perspective information capture, though its symbolic abstraction may struggle with highly heterogeneous imaging data. Jing, Xie & Xing (2017) advanced this line of work with a co-attention mechanism in a multi-task framework, jointly attending to visual sub-regions and semantic embeddings. This approach facilitated precise localization of abnormalities but increased computational cost. Park et al. (2020) further extended co-attention with collaborative attention in mDiTag, which combined feature differences and label information with a hierarchical LSTM decoder to improve the accuracy of anomaly detection. You et al. (2021) proposed aligned hierarchical attention (AHA), which hierarchically aligned visual regions with disease labels. By leveraging the structured nature of radiology reports, AHA captured disease-relevant features at multiple granularities, although its hierarchical design requires careful tuning to avoid overfitting to label distributions. Wang et al. (2022c) introduced memory-enhanced sparse attention (MSA) to enhance the ability of the model to capture fine-grained visual differences. Specifically, they employed bilinear pooling to model high-order interactions between fine-grained image features, while simultaneously generating sparse attention to better adapt to radiological images with fine-grained details. Xu et al. (2023) proposed M-linear attention, which was also based on bilinear pooling blocks, to enhance intra- and inter-modality reasoning. While both methods improved fine-grained feature modeling, their reliance on bilinear pooling highlights the trade-off between representational richness and efficiency. Song et al. (2022) introduced a cross-modal contrast attention (CMCA) model designed to capture visual and semantic information from similar medical cases. CMCA employed visual contrast attention to identify unique abnormal regions and cross-modal attention to dynamically align textual semantics with image features during report generation. Although the addition of CMCA can enhance contextual relevance, it remains sensitive to the quality and diversity of retrieved clinical cases, raising questions about robustness in underrepresented conditions.
Collectively, these studies demonstrate how attention mechanisms evolve from fine-grained local focus to achieving multi-level semantic alignment and modeling complex high-order interactions. While attention mechanisms significantly improve the accuracy and interpretability of AMRG systems, different variants face trade-offs between computational complexity, reliance on high-quality annotations, and generalization to diverse clinical conditions. This comparison suggests that no single attention mechanism universally addresses the challenges of AMRG, but each contributes to bridging the vision-language gap.
The dominance of the transformer architecture
The attention mechanism represents a significant advancement in sequence-to-sequence models, enabling them to dynamically focus on the most relevant parts of the input when generating each output element. Building on this concept, the introduction of the Transformer (Vaswani et al., 2017) architecture has marked a major breakthrough, as it fully leverages the self-attention mechanism to redefine the technical paradigm of medical image report generation. By effectively capturing long-range dependencies, this facilitates both image features and textual information processing, enhances contextual modeling, and ultimately improves report generation quality. As a result, the Transformer architecture has progressively supplanted various deep learning frameworks and led to a transformative shift in the advancement of AMRG.
The Transformer architecture in AMRG is typically combined with a CNN encoder (Fig. 9). Chen et al. (2020) proposed a memory-driven Transformer model, R2Gen, for radiology report generation, incorporating relational memory to retain information from previous text generation steps. This innovation helped alleviate the problem of context fragmentation in long medical reports. However, the reliance on CNN-based feature extraction limited its ability to capture long-range visual dependencies. R2GenCMN, another model by Chen et al. (2022), extended R2Gen by integrating Cross-Modal Memory Networks (CMN) to improve cross-modal interaction and alignment. CMN stored cross-modal information in a memory matrix, which retrieved the most relevant memory vectors based on input visual and textual features. These weighted memory vectors were then used to generate a response, which was subsequently fed into the Transformer encoder and decoder layers to produce the final report. While CMN improved alignment between visual and textual features, it introduced higher computational costs and increased model complexity, which may hinder clinical deployment. Zhang et al. (2022) combined a Transformer text encoder with CNN-derived image features and further integrated a medical knowledge graph to enrich disease representation. This hybridization improved semantic accuracy, but its performance was constrained by the incompleteness and domain-dependence of medical knowledge graphs. Huang, Zhang & Zhang (2023) introduced the Knowledge-injected U-Transformer (KiUT), designed to learn multi-level visual representations while dynamically integrating contextual and clinical knowledge to improve word prediction. Their model incorporated U-connections between encoder and decoder layers, which enabled feature aggregation at all decoder layers. Furthermore, by injecting visual, contextual, and clinical knowledge signals, their approach generated clinically relevant reports that better align with real-world medical scenarios. Several other studies have also explored the application of Transformers in AMRG (Yang et al., 2022b; You et al., 2022; Zhang et al., 2023a; Qin & Song, 2022) and Hou et al. (2023c). However, it is important to note that while these models incorporated Transformers, they did not completely replace CNN. One study (Wang et al., 2022b), in contrast, abandoned CNN entirely and developed a pure Transformer-based model that eliminated the need for CNN. Instead of relying on CNN for image feature extraction, they employed a Transformer-based visual encoder to overcome the limited receptive field of CNN and enable the model to learn long-range visual dependencies more effectively. Ye et al. (2024) proposed a multimodal dynamic traceability learning framework, DTrace, designed to supervise semantic validity and optimize the dynamic learning strategy for generated reports. As a dual-stream Transformer model, DTrace maintained separate feature representations for images and text while allowing effective cross-modal information exchange through attention mechanisms. This approach ensures both modality independence and robust feature interaction, but the model‘s reliance on dynamic traceability learning introduces training instability and requires careful hyperparameter tuning. In contrast to R2Gen, which focused on retaining temporal context using a memory network to ensure report coherence, DTrace focuses on cross-modal semantic validity by dynamically tracing the generated text back to specific image features. This shift in focus yields concrete performance gains, as DTrace shows improvements over R2Gen on MIMIC-CXR in both linguistic metrics (e.g., BLEU-1: 0.392 compared to 0.353) and, more importantly, in clinical efficacy (CE F1: 0.391 compared to 0.276).
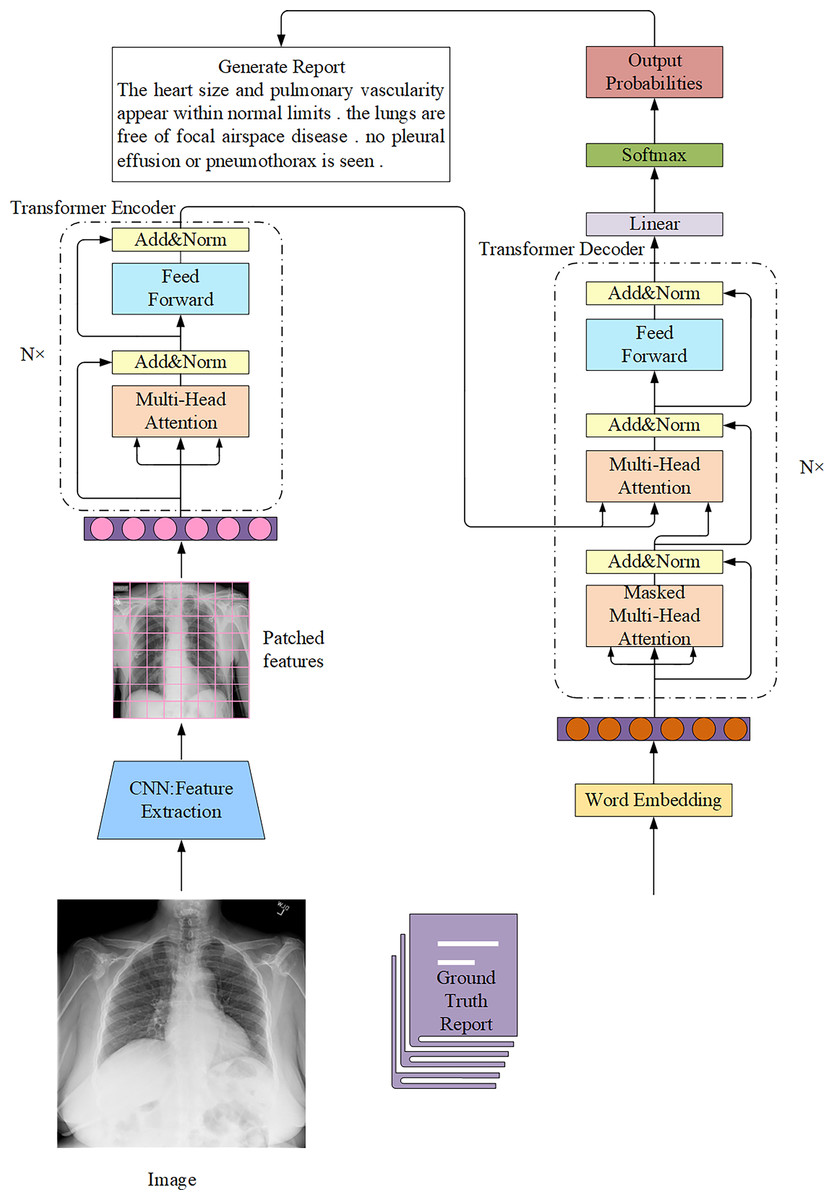
Figure 9: The overall architecture of the Transformer connected to the CNN in the AMRG task.
In this architecture, radiological images are usually regarded as source sequences and the corresponding reports are regarded as target sequences.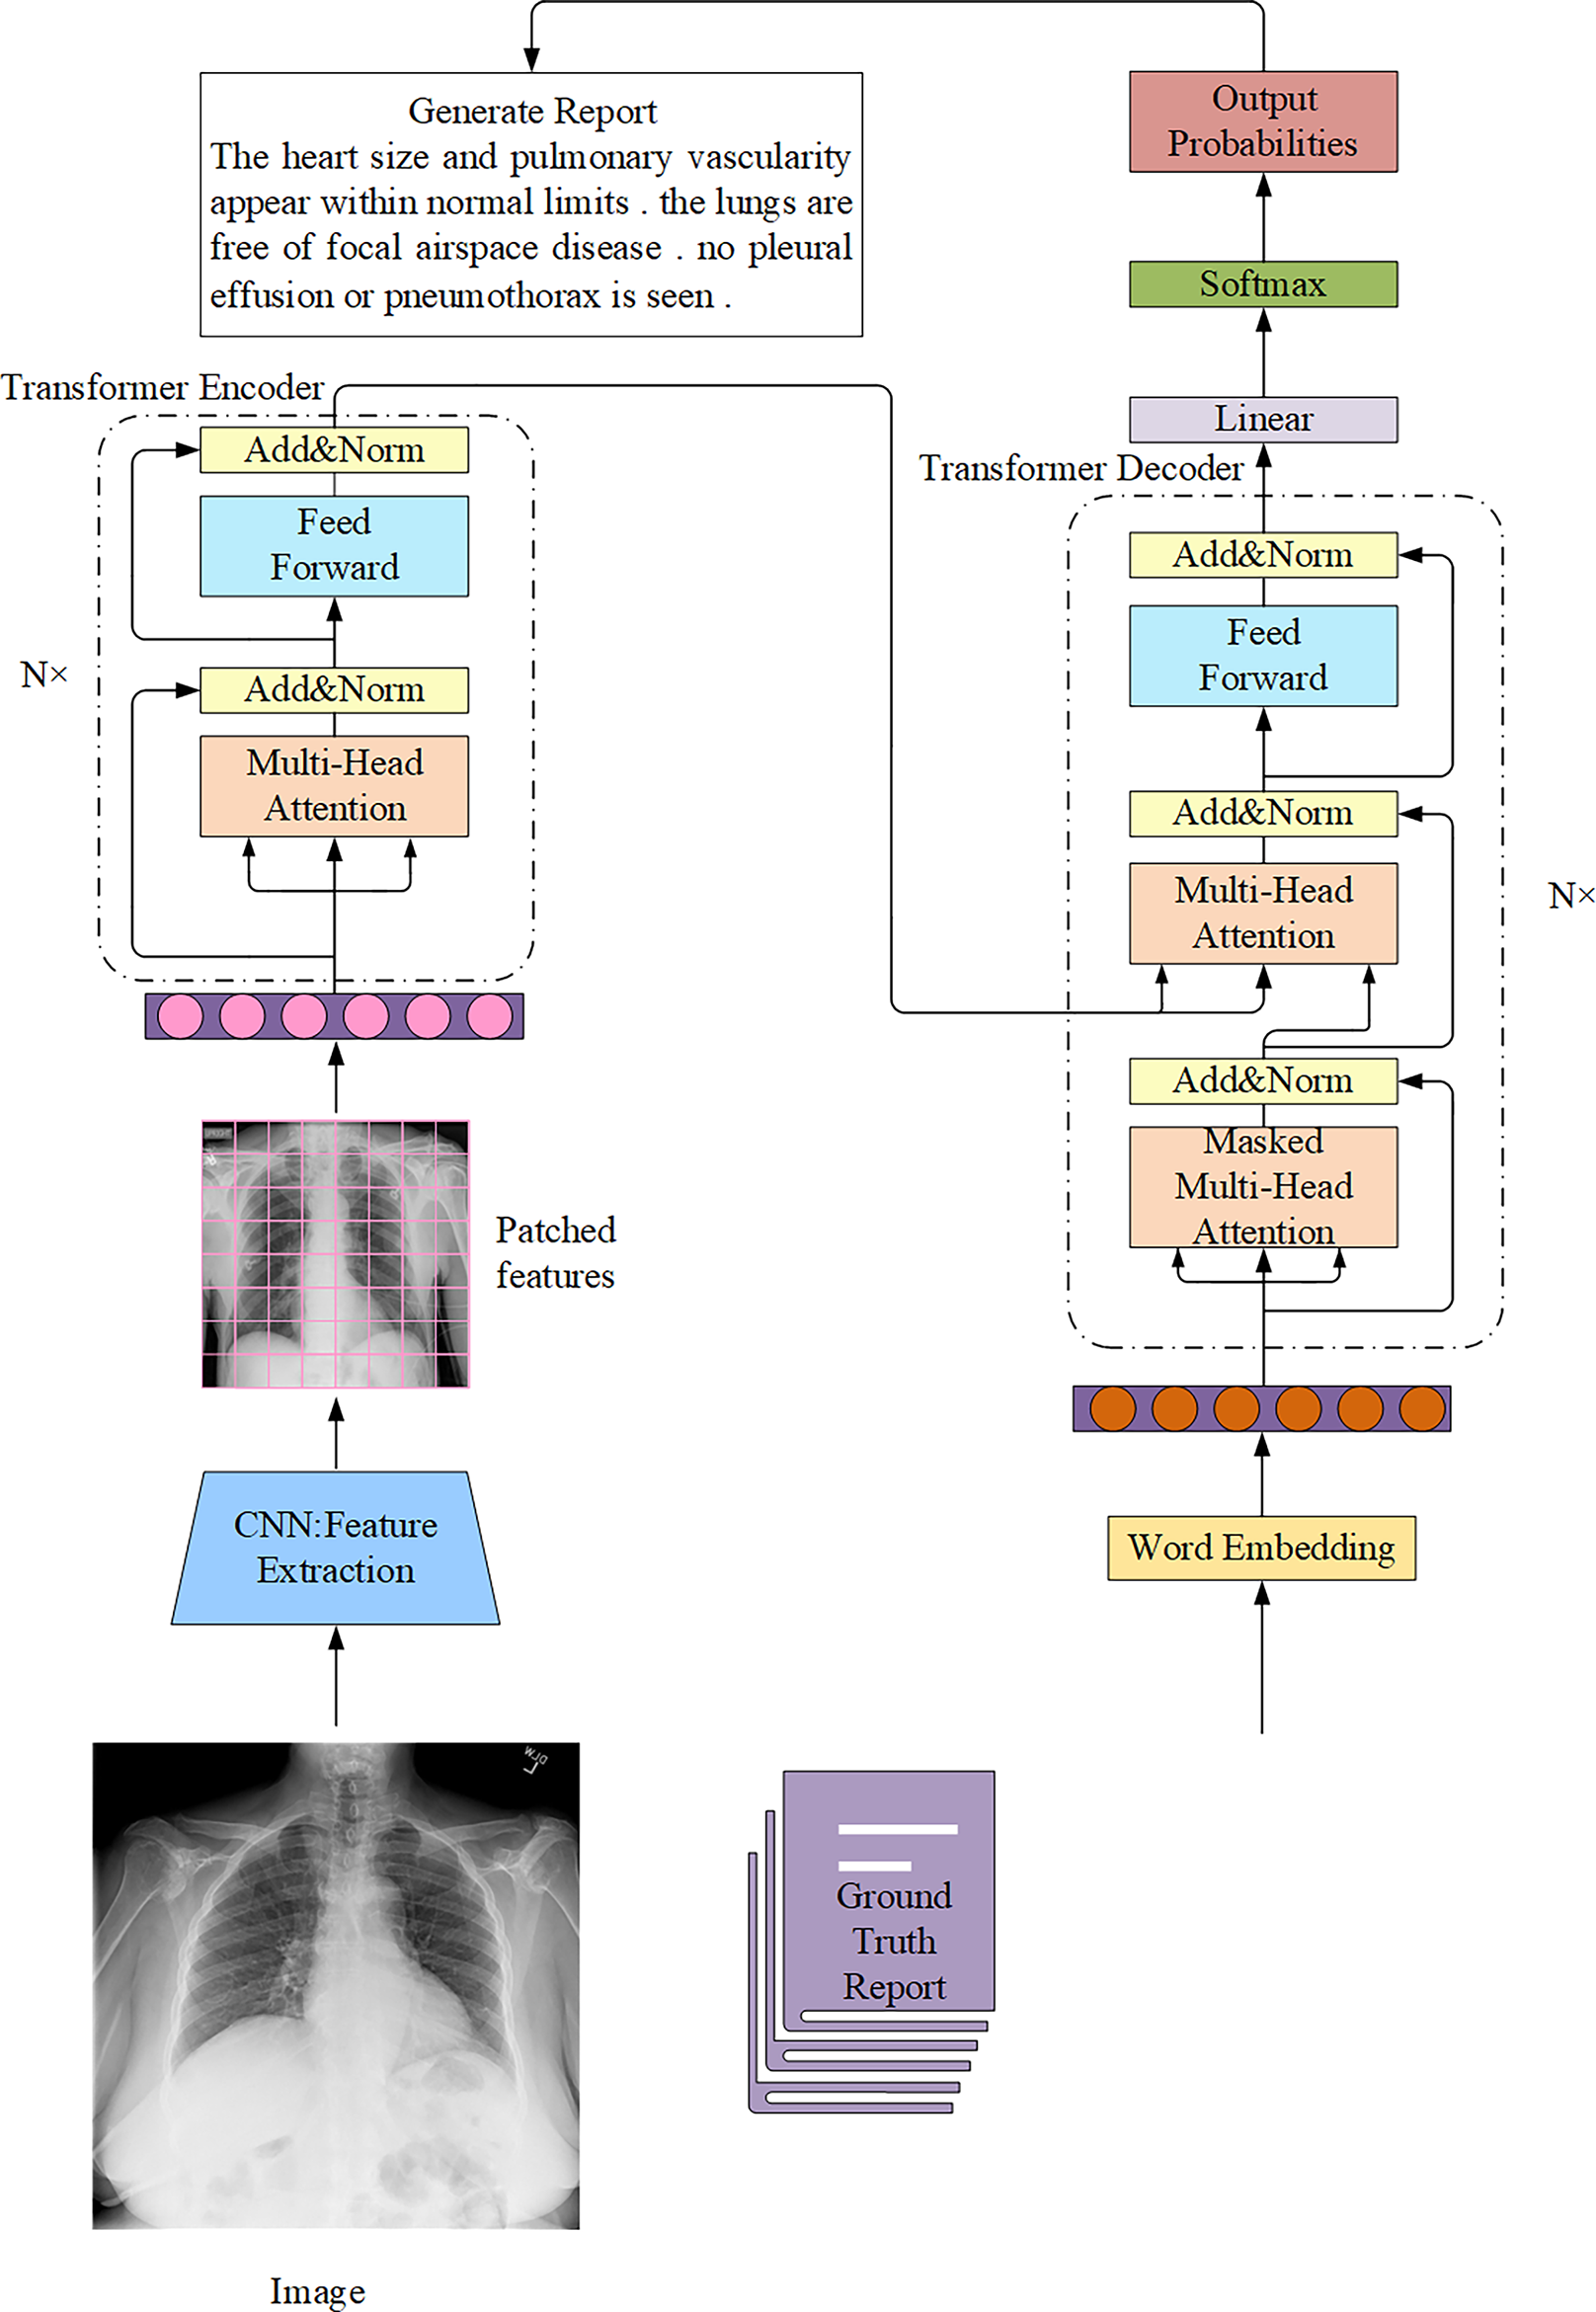
The success of Transformer lies in its powerful context modeling capabilities and parallel processing efficiency, making it particularly suitable for generating complex and logical radiology reports. However, training large Transformer models requires massive computing resources and data, which has driven research towards the use of pre-trained large language models.
The new frontier: adaptation of large language model
With the emergence of large language model (LLM) with billions of parameters, their superior semantic understanding and text generation capabilities have brought new transformative opportunities to AMRG. Applying LLM to AMRG is an emerging and innovative research direction. LLM follow a pre-training and fine-tuning strategy, allowing for effective adaptation to specific domains through post-training techniques such as domain adaptation. While pre-training does not directly optimize performance for a specific task, subsequent fine-tuning enables LLM to specialize in AMRG. Furthermore, their zero-shot and few-shot learning capabilities significantly reduce the dependency on large-scale annotated datasets, thereby mitigating data scarcity challenges in medical image report generation.
Despite the high expectations for LLM in AMRG, their extensive parameter count presents a significant challenge in terms of computational resources. A common approach to address this issue is to freeze the LLM and employ a lightweight network to map image features into the text feature space of the LLM. This strategy reduces computational overhead and enhances model adaptation efficiency. Zhang et al. (2024c) proposed MSMedCap, a medical image captioning model based on a dual image encoder and hybrid semantic learning, designed to enhance feature encoding and capture both global and fine-grained details in medical images. Their approach utilized two visual Transformers pre-trained with Contrastive Language-Image Pre-training (CLIP) and the Segment Anything Model (SAM) as image encoders. The extracted image features were then aligned and aggregated through Dual Query Transformers (Q-Former) and linear projection layers before being fed into the frozen LLM to generate medical captions via text prompts. Q-Former, originally proposed by Li et al. (2023a), served as a trainable mapping module that facilitated the integration of frozen image encoders with frozen LLM. However, the effectiveness of freezing both the visual encoder and LLM in AMRG tasks remained an open research question, as it necessitated large-scale aligned medical data for pre-training. Lu et al. (2023) challenged the frozen LLM paradigm, arguing that fine-tuning the visual model could enhance AMRG performance. They introduced a two-stage fine-tuning strategy, in which the visual encoder, mapping network, and text decoder were fine-tuned in stages. Initially, the visual encoder remained frozen for one epoch, allowing the mapping network to align information between the two modalities. Subsequently, the visual encoder was unfrozen for the remaining epochs. This progressive fine-tuning approach ensured that visual features remained consistent with the text embedding space of LLM, thereby improving clinical accuracy across multiple scales. Liu et al. (2024b) proposed a method to guide LLM to generate radiology reports through in-domain instance induction and a coarse-to-fine decoding process. They employed MiniGPT-4 (Zhu et al., 2023a) as the visual encoder to extract latent visual representations. The text generator of MiniGPT-4 was then guided by instance retrieval and contrastive semantic ranking, aligning the LLM with radiology-specific text reports to generate coarse initial reports. A subsequent coarse-to-fine decoding process further refined these reports to produce clinically coherent and structured outputs, and the fine-tuned LLM demonstrated promising potential in AMRG. Wang et al. (2024c) chose to use MAMBA (Gu & Dao, 2023), a time-varying state-space model based on a selection mechanism, as a visual backbone. Unlike Transformers, MAMBA offers linear computational complexity, significantly reducing computational costs while achieving comparable performance to Transformer-based vision models. In addition, before extracting visual tokens, their model performed context retrieval on mini-batch samples during training that improved feature representation and discriminative learning. Ultimately, the LLM played a central role in report generation, integrating visual and textual residuals from positive and negative context samples along with the corresponding text tokens to generate clinically relevant reports.
LLM demonstrates great potential for generating highly coherent, semantically rich reports. However, LLM also presents unprecedented risks and challenges, representing chasms that must be overcome before their practical clinical application. First, clinical “hallucinations” are the most critical risk of LLM in the medical field. Unlike simple model errors, “hallucinations” occur when the model generates fluent, seemingly plausible descriptions that are completely inconsistent with the imaging facts. The fundamental reason for this is that LLM is essentially probabilistic text generators, not factual reasoning engines. They are trained to predict the most likely next word, not to verify the truth of a statement. Therefore, due to the frequent presence of irrelevant information in the training set, the model may “fabricate” a common pathology that is not present in the image or miss a rare but critical finding. In clinical practice, a “hallucinated” false-positive result can lead to unnecessary patient anxiety and expensive testing, while a false-negative (omission) can have catastrophic consequences. Second, directly applying a model trained on a general corpus to radiology presents significant challenges. Radiology reports typically contain a large number of precise anatomical and pathological terms and follow a specific report structure. A general LLM without sufficient domain adaptation may replace precise medical terminology with ambiguous everyday terms or fail to understand the diagnostic logic implicit in radiology reports, resulting in the generation of clinically unreliable or even misleading content. Therefore, simple text fine-tuning is insufficient. Future fine-tuning strategies could incorporate structured medical knowledge, forcing the model to learn the logical chain and causal relationships of diagnosis, rather than simply mimicking the report’s writing style. Furthermore, leveraging retrieval-augmented generation (RAG) technology to “anchor” its output on a real clinical knowledge base may be one of the most promising approaches to addressing the problem of missing factual evidence.
Evaluation metrics
This section discusses various evaluation metrics employed to assess the quality of report generation. The primary objective of AMRG is to produce clear, concise, accurate, and structured medical reports that are semantically equivalent to those written by professional radiologists. Thus, a critical requirement is that generated reports must be both grammatically and factually accurate to ensure strict readability and clinical reliability. Evaluating the effectiveness of AMRG models is essential for maintaining high model performance and ensuring the quality of generated reports. The studies reviewed in this survey adopt a range of evaluation methodologies, which can be broadly categorized into three key approaches: (1) Natural Language Generation (NLG) metrics to assess the fluency, coherence, and lexical similarity of generated reports compared to reference reports; (2) Clinical Efficacy (CE) metrics to evaluate the clinical correctness and diagnostic accuracy of generated reports; and (3) human evaluation that involves expert assessments to measure the readability, consistency, and diagnostic reliability of the generated text.
Natural language generation (NLG) metrics
NLG metrics were originally designed for natural language processing tasks. However, due to the lack of dedicated evaluation metrics for AMRG, NLG metrics have been widely adopted in this domain. These evaluation methods measure the similarity between the generated reports and ground-truth reports based on word overlap. The most commonly used NLG metrics include:
1. Bilingual Evaluation Understudy (BLEU) (Papineni et al., 2002): BLEU is a metric used to evaluate the closeness between a candidate (machine) translation and a reference (true) translation and is widely used in machine translation and text generation tasks. In the AMRG task, BLEU measures the similarity between the generated report and the true report by analyzing the overlap of n-grams of length up to 4-word sequences. BLEU scores range from 0 to 1, with values approaching 1 indicating greater consistency between the generated and reference reports. BLEU-1 measures the overlap of unigrams, while BLEU-2, BLEU-3, and BLEU-4 are used for bigrams, trigrams, and tetragrams, respectively. It simultaneously considers different parameters, such as text length, vocabulary selection, and word order, and the similarity between the real report to penalize or reward the generated text. BLEU can be expressed in Eq. (1):
(1)
BP is referred to as the brevity penalty, which enables the selection of candidate translations that are most likely to be close to the true translation in terms of length, vocabulary choice, and word order. Precision(n) represents the precision of different n-grams, and wn is the weight of the n-gram that is conventionally set to 1/N with N = 4. The calculation of BP is shown in Eq. (2):
(2) where c is the length of the model-generated text, and r is the length of the reference text.
2. Recall-Oriented Understudy for Gisting Evaluation (ROUGE) (Lin, 2004): ROUGE is a standardized tool for evaluating the quality of automatic text generation. It mainly measures its quality by comparing the overlap between the generated text and the reference text, with a particular focus on the recall of the generated text, that is, how much common part the generated text has with the reference text.
ROUGE-L is the most commonly used variant, which is calculated based on the longest common subsequence (LCS) and can better reflect the grammatical structure and sentence fluency of the report. The formula is displayed in Eq. (3):
(3) where β is a hyperparameter, which can be modified according to the needs of the specific task. Rlcs and Plcs represent the recall rate based on LCS and the accuracy rate based on LCS, respectively.
In the AMRG task, the ROUGE metric is employed to evaluate whether the generated report is consistent with the reference report annotated by experts, especially focusing on the fluency and relevance between sentences. The ROUGE score ranges from 0 to 1, and the higher the score, the better the relevance between the generated text and the reference text.
3. Consensus-based Image Description Evaluation (CIDEr) (Vedantam, Lawrence Zitnick & Parikh, 2015): CIDEr is an automatic evaluation metric mainly used for image description generation tasks. It uses the Term Frequency Inverse Document Frequency (TF-IDF) weighted n-gram measure to generate captions and reference letters by effectively accounting for syntax, saliency, and accuracy. The cosine similarity between them is used to evaluate the quality of the generated image description. TF assigns higher weights to n-grams that frequently appear in reference sentences describing images, while IDF assigns lower weights to n-grams that frequently appear in all images in the dataset. The CIDEr score of an n-gram of length n can be expressed using Eq. (4):
(4) where gn(sij) is the vector formed by gk(sij) corresponding to all n-grams of length n, and ||gn(sij)|| is the size of the vector gn(sij). Similarly for gn(ci). The TF-IDF weight gk(sij) of each n-gram ωk (ngram ωk is a set of one or more ordered words) can be calculated using Eq. (5):
(5)
For a candidate sentence ci, the number of times the n-gram ωk appears in the reference sentence sij is denoted as hk(sij). Where Ω is the vocabulary size of all n-grams, and I is the set of all images in the dataset.
Finally, CIDEr is calculated by combining the scores of n-grams of different lengths (usually uniform weight wn = 1/N works best) as shown in Eq. (6):
(6)
CIDEr is particularly important in the field of image description generation because it not only examines the degree of vocabulary matching but also emphasizes the diversity, accuracy, and comprehensive capture of image content.
4. Metric for Evaluation of Translation with Explicit Ordering (METEOR) (Banerjee & Lavie, 2005): METEOR aims to overcome the limitations of traditional evaluation metrics such as BLEU. In particular, it better reflects the semantic consistency of text through flexible treatment of synonyms, word form changes, and word order, rather than relying solely on literal vocabulary overlap. This metric is developed with the explicit aim of surpassing the evaluation quality of BLEU, especially in dealing with semantic matching and synonym replacement. Its core methodology incorporates flexible matching rules that consider the influence of synonyms, word form changes, and word order in the text, which ensures that the evaluation can reflect the true quality of the generated text. This method calculates the harmonic mean of unigram precision and recall, which can be mathematically expressed via Eq. (7):
(7) where Fmean is the harmonic mean of precision and recall. Penalty is used to penalize candidate sequences with poor word order. The penalty function examines the order and relative position of the vocabulary matching between the candidate text and the reference text, and it applies a score reduction if the matching vocabulary order does not match the reference text. The calculation formula for Penalty is displayed in Eq. (8):
(8) where #chunks represent the number of phrases in the candidate translation and the reference translation that are relatively consistent in position and continuously match, and m represents the total number of matches between the candidate words and the reference words.
In the AMRG task, METEOR effectively assesses similarity between the generated report and the expert annotation report by evaluating synonym matching, word forms, word order, grammatical consistency, and the textual diversity, leading to its widespread adoption.
5. Bidirectional Encoder Representations from Transformers (BERTScore) (Zhang et al., 2019): BERTScore is a language generation evaluation metric based on pre-trained BERT contextual embeddings. Different from traditional n-gram overlap-based evaluation metrics (such as BLEU, ROUGE, METEOR, etc.), BERTScore considers not only the matching of words but also the context of words to capture deeper semantic information. In the original article (Zhang et al., 2019), the authors demonstrated that BERTScore was more correlated with human judgment and provided stronger model selection performance than existing indicators. The full process of its calculation is as follows:
First, BERTScore processes both the reference and the candidate texts through a pre-trained BERT model to obtain the BERT representation of each word in a context-sensitive word vector. Then cosine similarity is used to calculate the similarity of the two-word vectors via Eq. (9):
(9)
Among them, x and y represent the BERT representation vector of a word in the candidate text and the reference text, respectively, and ||x|| and ||y|| represent the Euclidean norm of the two vectors. Usually, a pre-normalized vector is used, and the calculation can be simplified to the inner product x • y. BERTScore employs cosine similarity to calculate the following three metrics: Precision (normalized maximum similarities from candidate to reference tokens), Recall (normalized maximum similarities from reference to candidate tokens), and their harmonic mean as F1-score. The final BERTScore usually uses the F1 value as a comprehensive score, which indicates the semantic alignment between the candidate text and the reference text. The calculation of the three metrics is shown in Eqs. (10)–(12):
(10)
(11)
(12) where Cgen and Cref are the word sets in the candidate text and the reference text, respectively.
Due to its foundation on the BERT pre-trained model, BERTScore exhibits adaptability across languages, fields, and tasks. In particular, BERTScore performs well in certain AMRG tasks that require deep semantic understanding. Although the BERTScore metric has been used in studies such as Syeda-Mahmood et al. (2020), Sun et al. (2024), Kapadnis et al. (2024), Miura et al. (2020), Cabello-Collado et al. (2024) and Leonardi, Portinale & Santomauro (2023), it is not included in the subsequent application evaluation due to its lack of widespread use.
6. Semantic Propositional Image Caption Evaluation (SPICE) (Anderson et al., 2016): SPICE is an automatic evaluation metric for natural image captions. SPICE analyzes the semantic structure of image descriptions and pays special attention to the semantic relationships conveyed in the descriptions. Rather than focusing merely on vocabulary overlap, it aims to assess if the generated description can accurately and completely express the semantic information in the image. Compared with traditional indicators such as BLEU, ROUGE, and METEOR, this metric provides higher precision in quality assessment of the generated description, suggesting its prospective widespread application in AMRG evaluation. It is worth noting that it is not tailored to medical terminology or domain-specific ontologies, so its ability to capture subtle diagnostic correctness remains limited.
Although NLG metrics are widely used due to their automation and convenience, they suffer from fundamental flaws when evaluating medical reports. These metrics focus on measuring lexical overlap rather than clinical semantic equivalence. This flaw leads to significant evaluation bias. For example, two clinically identical statements, “heart size and outline are normal” and “no cardiac enlargement was observed,” will have BLEU or ROUGE scores approaching zero due to minimal lexical overlap. Conversely, a model might achieve a high NLG score by repeating common “normal” descriptive terms in a dataset while completely missing a critical, potentially life-threatening abnormal finding in the imaging. This disconnect between “linguistic similarity” and “clinical accuracy” highlights the dangers of relying solely on NLG metrics. A report that scores highly on an NLG metric may be clinically useless or even harmful.
More recently, metrics such as RadGraph F1 and RadCliQ have been proposed to better reflect clinical accuracy by evaluating medical entities and relations within reports. These directions highlight the necessity of moving beyond surface-level lexical comparisons toward clinically grounded evaluation. Ultimately, no single metric fully captures linguistic quality and medical correctness. Therefore, the AMRG field urgently needs methods that can directly assess the correctness of diagnostic content, which has led to the development of clinical efficacy (CE) indicators.
Clinical efficacy (CE)
To fill the gap in NLG metrics for clinical accuracy assessment, researchers have developed CE metrics. Currently, the most popular CE assessment method is based on CheXpert, Irvin et al. (2019) a rule-based label extractor designed specifically for chest X-ray reports. Chen et al. (2020) applied CheXpert to generated reports, comparing their content against 14 predefined categories related to thoracic diseases and support devices. They then calculated tag-based precision, recall, and F1-scores and utilized them as CE metrics to evaluate model performance.
Currently, CheXpert-based evaluation methods have been widely adopted in AMRG research (Boag et al., 2020; Chen et al., 2022; Dalla Serra et al., 2022; Gao et al., 2024; Hirsch, Dawidowicz & Tal, 2024; Hou et al., 2023a, 2023b; Huang, Zhang & Zhang, 2023; Jin et al., 2024; Li et al., 2023b; Liu et al., 2024a, 2024b, 2021b, 2021c, 2019, 2023; Lovelace & Mortazavi, 2020; Lu et al., 2023; Moon et al., 2022; Najdenkoska et al., 2021, 2022; Nguyen et al., 2021; Nicolson, Dowling & Koopman, 2023; Nooralahzadeh et al., 2021; Qin & Song, 2022; Serra et al., 2023; Shang et al., 2022; Song et al., 2022; Tang et al., 2024; Tu et al., 2024; Wang et al., 2024a, 2023e, 2023f; Wu et al., 2022; Wu, Huang & Huang, 2023; Yan et al., 2021; Yan & Pei, 2022; Yang et al., 2023, 2022a, 2022b; Ye et al., 2024; Yi et al., 2024; Zhang et al., 2022, 2023b; Zhu et al., 2023b; Liu et al., 2025; Lang, Liu & Zhang, 2025; Wang et al., 2025; Li et al., 2025b; Tanno et al., 2025). Although CE metrics represent an important step toward bridging this gap by capturing disease-related findings, they are strongly tied to specific datasets (e.g., MIMIC-CXR) and are limited to predefined labels, making them less generalizable across diverse clinical settings.
Human evaluation
Human language is inherently complex and diverse, making the accurate and effective evaluation of AMRG models a challenging task. As a result, human evaluation is introduced as the most reliable assessment method to address the limitations of automatic evaluation metrics and ensure a more comprehensive assessment of report quality. In AMRG, this involves a subjective assessment of generated reports, which is conducted by medical experts such as radiologists and clinicians. Drawing from their professional expertise, these experts score and provide feedback based on key criteria, including accuracy, completeness, readability, and clinical value. Unlike automated metrics, human evaluation can identify subtle errors and potential issues that may be overlooked by computational methods. Given its ability to capture fine-grained details and clinical nuances, human evaluation plays a critical role in the development and optimization of AMRG systems, ensuring their practical applicability in real-world clinical scenarios.
We reviewed 18 related studies (Dalla Serra et al., 2022; Liu et al., 2021b, 2021c; Qin & Song, 2022; Li et al., 2019, 2023c, 2018; Liu et al., 2022, 2021d; Wang et al., 2020, 2024d; Yang et al., 2020a, 2021a; You et al., 2021; Zhang et al., 2024a, 2024b; Cao et al., 2023; Tanno et al., 2025) that incorporated human expert evaluation to assess the quality of AMRG models. Among them, Li et al. (2019, 2018) selected a subset of test samples from each method and conducted a survey via Amazon Mechanical Turk (MTurk). Participants were asked to choose the report that best matched the reference report from multiple generated outputs, based on key criteria such as language fluency, content selection, and accuracy of abnormal medical findings. Other studies (Liu et al., 2021b, 2021c; Qin & Song, 2022; Liu et al., 2022, 2021d; Wang et al., 2020; You et al., 2021; Zhang et al., 2024a), invited domain experts with relevant medical experience to evaluate the quality of generated reports. Specifically, evaluators were required to identify the most reasonable report from outputs generated by the research model, baseline models, or ground-truth reports, based on factors such as fluency of the generated text, comprehensiveness in capturing real anomalies, and factual fidelity of the report content. To ensure unbiased evaluation, the evaluation employed a blinded methodology wherein experts assessed reports without knowledge of their generative sources. Additionally, Wang et al. (2024d) and Yang et al. (2021a) invited experienced radiologists to evaluate generated reports and required them to assign ratings on a scale of 1 to 5, where higher scores indicated greater report acceptability. Notably, one study (Wang et al., 2024d) specified that reports should be evaluated based on three quality dimensions: accuracy, information content, and readability. Finally, in Dalla Serra et al. (2022) and Zhang et al. (2024b), evaluators assessed model performance by counting the errors and omissions in generated reports, which provided a quantitative measure of model reliability and accuracy.
While existing research confirms human evaluation as accurate, reliable, and effective, which commonly results in higher human preference ratings compared to baseline models, this methodology presents notable limitations. Most importantly, human evaluation is both time-consuming and resource-intensive (Yu et al., 2023). Moreover, clinicians and radiologists often operate under significant time constraints, making their participation in manual evaluations challenging. Requiring them to engage in extensive assessments not only disrupts their routine clinical work but also contradicts the primary goal of AMRG to alleviate the workload of medical professionals. Given these challenges, it is understandable that the majority of studies in our survey did not incorporate human evaluation, opting instead for automated evaluation metrics as a more scalable and practical alternative.
Finally, we added a comparison Table 1 to more intuitively summarize and contrast the characteristics, advantages, and limitations of various evaluation methods.
| Metric | Core principle | Semantic equivalence | Diagnostic fidelity | Key strengths | Key weaknesses |
|---|---|---|---|---|---|
| BLEU | Precision calculation based on N-gram overlap. | Low. Relies on strict lexical matching and cannot understand synonyms or paraphrases. | Low. Insufficient ability to assess the accuracy of clinical content, and may even be misleading. | Simple, fast, and computationally inexpensive; suitable for measuring text fluency and phrase-level accuracy. | Ignores semantics, word order, and clinical implications; has low sensitivity to lexical diversity. |
| ROUGE | Recall calculation based on N-gram overlap, especially the longest common subsequence (LCS). | Low. Similar to BLEU, relies on vocabulary matching. | Low. Unable to assess the accuracy of diagnostic content. | Ability to measure how much key information from reference reports is included in the generated report (recall rate). | Ignores semantics, clinical concepts, and overall coherence of the report. |
| METEOR | Unigram matching taking into account synonyms, stems, and word order. | Medium-low. Goes beyond pure lexical comparison to some extent through synonym matching. | Low. Although there have been improvements, the core of the approach is still linguistic rather than clinical concept matching. | Its ability to capture semantics is better than BLEU and ROUGE, and is more correlated with human judgment. | Unable to understand complex medical terminology and diagnostic logic; matching rules are still relatively superficial. |
| CIDEr | N-gram cosine similarity weighted by TF-IDF. | Medium-high. Capable of capturing the deep semantic information of words in context. | Low. Can indirectly highlight keywords related to diagnosis, but not directly evaluate. | Reward informative descriptions that are consistent with expert consensus. | The quality of the reference report set is heavily dependent, and the assessment of rare findings may be inaccurate. |
| BERTScore | BERT-based cosine similarity of contextual word vectors. | High. Aims to evaluate whether the generated text accurately and completely expresses the semantic information in the image. | Medium-low. Has stronger semantic understanding capabilities, but models that have not been fine-tuned in the medical field may not accurately understand professional terminology. | High correlation with human judgment in terms of semantic similarity. | The computational cost is relatively high; its effectiveness depends on the domain adaptability of the pre-trained model. |
| SPICE | Parse text into a scene graph and match semantic tuples (objects, attributes, relationships). | High (within its range). Compare clinical concepts directly rather than words. | Low (untested in the medical field). Although it has strong semantic analysis capabilities, it was not used for AMRG tasks in this survey. | Going beyond lexical overlap, it evaluates the accuracy of core semantic propositions, achieving higher assessment accuracy. | Currently, it is rarely used in the AMRG field; the adaptability of its scene graph parser to professional medical terminology needs to be verified. |
| CheXpert (CE) | Rule-based extraction and comparison of 14 predefined clinical findings. | High (within its range). Compare clinical concepts directly rather than words. | High (within its range). It is the current mainstream automated method for directly evaluating the accuracy of clinical content. | It bypasses the limitations of NLG indicators and achieves quantitative evaluation of clinical diagnosis. | The evaluation scope is limited to predefined labels and cannot evaluate other pathological features; it is mainly applicable to the MIMIC-CXR dataset. |
| Human Evaluation | Subjective assessment by domain experts (e.g., radiologists). Metric | Very high. Considered the “gold standard” for understanding semantic and clinical nuances. | Very high. Ability to comprehensively assess the report’s accuracy, completeness, logic, and clinical value. | The most accurate and reliable assessment method, capable of detecting subtle errors that automated metrics cannot detect. | Time-consuming, expensive, subjective, and difficult to scale. |
Note:
The comparison highlights a fundamental trade-off: NLG metrics offer automation and linguistic fluency checking, but lack clinical validation. Conversely, CE metrics and Human Evaluation prioritize clinical accuracy, but at the cost of limited scope or scalability.
Datasets and applications
In the field of AMRG, the quality and diversity of datasets play a critical role in determining model performance and generalization capability. In recent years, an increasing number of benchmark datasets has been introduced for training and evaluating medical image generation models. These datasets not only contain extensive medical images but also include corresponding textual descriptions or annotated information, which serve as valuable resources for researchers. While benchmark datasets provide a fundamental basis for medical image report generation, many models still rely on high-quality and customized datasets for further optimization and fine-tuning. Beyond these public benchmarks, private datasets and domain-specific datasets have also played a vital role in advancing the field, particularly in addressing specialized clinical needs and improving model robustness.
This section provides an overview of the widely used medical imaging datasets and their applications in AMRG (‘Benchmark Datasets and Applications’) that focuses on the distinct characteristics of different datasets and their practical implications. Additionally, we also explore the potential of lesser-studied private and customized datasets (‘Other Datasets’) to offer a broader perspective for model training and foster innovation in medical image report generation technology.
Benchmark datasets and applications
Benchmark datasets serve not only as the data foundation for research in AMRG but also as a standardized benchmark for comparing different models. These datasets are crucial resources for evaluating model performance and have significantly contributed to the advancement of medical image report generation. This section introduces some of the most commonly used benchmark datasets in AMRG. Table 2 provides an overview of the key characteristics and relevant information of these datasets.
| Data set | Year | Data type | Images | Reports | Patients | Availability |
|---|---|---|---|---|---|---|
| IU-X-ray (Demner-Fushman et al., 2016) | 2016 | X-ray | 7,470 | 3,955 | 3,955 | http://openi.nlm.nih.gov/ |
| PEIR gross (Jing, Xie & Xing, 2017) | 2018 | Radiology teaching images | 7,442 | 7,442 | – | https://peir.path.uab.edu/library/ |
| ROCO (Pelka et al., 2018) | 2018 | X-Ray, CT, MRI, Ultrasound | 81,000 | – | – | https://github.com/razorx89/roco-dataset |
| CX-CHR (Li et al., 2018) | 2018 | X-ray | 45,598 | 33,236 | 35,609 | – |
| MIMIC-CXR (Johnson et al., 2019) | 2019 | X-ray | 377,110 | 227,835 | 65,379 | https://physionet.org/content/mimic-cxr/2.0.0/ |
| COV-CTR (Li et al., 2023c) | 2022 | CT | 728 | 728 | – | https://github.com/mlii0117/COV-CTR/tree/master/Datasets |
IU-Xray
The Indiana University Chest X-ray (IU-X-ray) (Demner-Fushman et al., 2016) dataset, commonly known as the OpenI dataset, is one of the most widely used public benchmark datasets for AMRG, particularly for learning the associations between chest X-ray images and radiology reports. Released by Indiana University in 2016, the dataset contains 7,470 chest X-ray images that include frontal and lateral views along with corresponding radiology reports for 3,955 patients. Each radiology report is structured into five distinct sections: Indications, Findings, Impressions, Manual Coding, and MTI Coding. The dataset encompasses a wide range of common chest diseases and abnormalities, including pneumonia, tuberculosis, pneumothorax, and lung nodules. Since the dataset does not come with an official train-validation-test split, researchers typically follow the approach of Chen et al. (2020), which involves randomly partitioning the dataset into training (70%), validation (10%), and test sets (20%).
The IU-X-ray dataset provides a rich source of training data, making it a valuable resource for cross-disciplinary research in medical imaging and natural language generation. Due to its high-quality images and detailed textual reports, the dataset has been extensively used in AMRG research. In our survey, 101 studies utilized IU-X-ray for model evaluation. A summary of these evaluation results is presented in Table 3.
| Model/Method | Author | Year | BLEU | ROUGE | CIDEr | METEOR | Human evaluation | |||
|---|---|---|---|---|---|---|---|---|---|---|
| −1 | −2 | −3 | −4 | |||||||
| CoAtt (Jing, Xie & Xing, 2017) | Jing et al. | 2018 | 0.517 | 0.386 | 0.306 | 0.247 | 0.447 | 0.327 | 0.217 | – |
| MRA (Xue et al., 2018) | Xue et al. | 2018 | 0.464 | 0.358 | 0.270 | 0.195 | 0.366 | – | 0.274 | – |
| HRGR-Agent (Li et al., 2018) | Li et al. | 2018 | 0.438 | 0.298 | 0.208 | 0.151 | 0.322 | 0.343 | – | √ |
| KERP (Li et al., 2019) | Li et al. | 2019 | 0.482 | 0.325 | 0.226 | 0.162 | 0.339 | 0.280 | – | √ |
| Harzig et al. (2019) | Harzig et al. | 2019 | 0.373 | 0.246 | 0.175 | 0.126 | 0.315 | 0.359 | 0.163 | – |
| Vispi (Li, Cao & Zhu, 2019) | Li et al. | 2019 | 0.419 | 0.280 | 0.201 | 0.150 | 0.371 | 0.553 | – | – |
| Singh et al. (2019) | Singh et al. | 2019 | 0.374 | 0.224 | 0.153 | 0.110 | 0.308 | 0.360 | 0.164 | – |
| HRNN (Yin et al., 2019) | Yin et al. | 2019 | 0.445 | 0.292 | 0.201 | 0.154 | 0.344 | 0.342 | 0.175 | – |
| Xue & Huang (2019) | Xue et al. | 2019 | 0.489 | 0.340 | 0.252 | 0.195 | 0.478 | 0.565 | 0.230 | – |
| CMAS-RL (Jing, Wang & Xing, 2020) | Jing et al. | 2020 | 0.464 | 0.301 | 0.210 | 0.154 | 0.362 | 0.275 | – | – |
| R2Gen (Chen et al., 2020) | Chen et al. | 2020 | 0.470 | 0.304 | 0.219 | 0.165 | 0.371 | – | 0.187 | – |
| FFL+CFL (Syeda-Mahmood et al., 2020) | Syeda-Mahmood et al. | 2020 | 0.560 | 0.510 | 0.500 | 0.490 | 0.580 | – | 0.550 | – |
| Pino et al. (2020) | Pino et al. | 2020 | 0.361 | 0.226 | 0.152 | 0.106 | 0.314 | 0.187 | – | – |
| MvMM (Yang et al., 2020a) | Yang et al. | 2020 | 0.443 | 0.306 | 0.215 | 0.145 | 0.374 | 0.500 | – | √ |
| Relation-paraNet (VGG19) (Wang et al., 2020) | Wang et al. | 2020 | 0.505 | 0.329 | 0.230 | 0.168 | 0.372 | 0.317 | – | √ |
| KGAE (Liu et al., 2021c) | Liu et al. | 2021 | 0.512 | 0.327 | 0.240 | 0.179 | 0.383 | – | 0.195 | √ |
| PPKED (Liu et al., 2021a) | Liu et al. | 2021 | 0.483 | 0.315 | 0.224 | 0.168 | 0.376 | 0.351 | – | – |
| Contrastive attention (Liu et al., 2021b) | Liu et al. | 2021 | 0.492 | 0.314 | 0.222 | 0.169 | 0.381 | – | 0.193 | √ |
| AlignTransformer (You et al., 2021) | You et al. | 2021 | 0.484 | 0.313 | 0.225 | 0.173 | 0.379 | – | 0.204 | √ |
| TriNet (Yang et al., 2021b) | Yang et al. | 2021 | 0.478 | 0.344 | 0.248 | 0.180 | 0.398 | 0.439 | – | – |
| MV+T+I (Nguyen et al., 2021) | Nguyen et al. | 2021 | 0.515 | 0.378 | 0.293 | 0.235 | 0.436 | – | 0.219 | – |
| Wang et al. (2021) | Wang et al. | 2021 | 0.487 | 0.346 | 0.270 | 0.208 | 0.359 | 0.452 | – | – |
| CDGPT2 (Alfarghaly et al., 2021) | Alfarghaly et al. | 2021 | 0.387 | 0.245 | 0.166 | 0.111 | 0.289 | 0.257 | 0.164 | – |
| VTI (Najdenkoska et al., 2021) | Najdenkoska et al. | 2021 | 0.493 | 0.360 | 0.291 | 0.154 | 0.375 | – | 0.218 | – |
| M2TR. PROGRESSIVE (Nooralahzadeh et al., 2021) | Nooralahzadeh et al. | 2021 | 0.486 | 0.317 | 0.232 | 0.173 | 0.390 | – | 0.192 | – |
| MedWriter (Yang et al., 2021a) | Yang et al. | 2021 | 0.471 | 0.336 | 0.238 | 0.166 | 0.382 | 0.345 | – | √ |
| MedSkip (Pahwa et al., 2021) | Pahwa et al. | 2021 | 0.467 | 0.297 | 0.214 | 0.162 | 0.355 | – | 0.187 | – |
| DeltaNet (Wu et al., 2022) | Wu et al. | 2022 | 0.485 | 0.324 | 0.238 | 0.184 | 0.379 | 0.802 | – | – |
| R2GenCMN (Chen et al., 2022) | Chen et al. | 2022 | 0.475 | 0.309 | 0.222 | 0.170 | 0.375 | – | 0.191 | – |
| CMCL (Liu et al., 2022) | Liu et al. | 2022 | 0.473 | 0.305 | 0.217 | 0.162 | 0.378 | – | 0.186 | √ |
| Wang et al. (2022a) | Wang et al. | 2022 | 0.450 | 0.301 | 0.213 | 0.158 | 0.384 | 0.340 | – | – |
| CTN (Yang et al., 2022b) | Yang et al. | 2022 | 0.491 | 0.334 | 0.242 | 0.180 | 0.397 | 0.469 | 0.212 | – |
| CMM+RL (Qin & Song, 2022) | Qin and Song | 2022 | 0.494 | 0.321 | 0.235 | 0.181 | 0.384 | – | 0.201 | √ |
| Yang et al. (2022a) | Yang et al. | 2022 | 0.496 | 0.327 | 0.238 | 0.178 | 0.381 | 0.382 | – | – |
| VTI-TRS (Najdenkoska et al., 2022) | Najdenkoska et al. | 2022 | 0.503 | 0.394 | 0.302 | 0.170 | 0.390 | – | 0.230 | – |
| SGF (Li et al., 2022) | Li et al. | 2022 | 0.467 | 0.334 | 0.261 | 0.215 | 0.415 | – | 0.201 | – |
| XPRONET (Wang, Bhalerao & He, 2022) | Wang et al. | 2022 | 0.525 | 0.357 | 0.262 | 0.199 | 0.411 | 0.359 | 0.220 | – |
| JPG (You et al., 2022) | You et al. | 2022 | 0.479 | 0.319 | 0.222 | 0.174 | 0.377 | – | 0.193 | – |
| CMCA (Song et al., 2022) | Song et al. | 2022 | 0.497 | 0.349 | 0.268 | 0.215 | 0.392 | – | 0.209 | – |
| Wang et al. (2022b) | Wang et al. | 2022 | 0.496 | 0.319 | 0.241 | 0.175 | 0.377 | 0.449 | – | – |
| AMLMA (Gajbhiye, Nandedkar & Faye, 2022) | Gajbhiye et al. | 2022 | 0.471 | 0.315 | 0.231 | 0.172 | 0.376 | 0.381 | 0.247 | – |
| Zhang et al. (2022) | Zhang et al. | 2022 | 0.505 | 0.379 | 0.303 | 0.251 | 0.446 | – | 0.218 | – |
| Clinical-BERT (Yan & Pei, 2022) | Yan et al. | 2022 | 0.495 | 0.330 | 0.231 | 0.170 | 0.376 | 0.432 | – | – |
| RepsNet (Tanwani, Barral & Freedman, 2022) | Tanwani et al. | 2022 | 0.580 | 0.440 | 0.320 | 0.270 | – | – | – | – |
| MATNet (Shang et al., 2022) | Shang et al. | 2022 | 0.518 | 0.387 | 0.308 | 0.254 | 0.446 | – | 0.222 | – |
| TrMRG (Mohsan et al., 2022) | Mohsan et al. | 2022 | 0.532 | 0.344 | 0.233 | 0.158 | 0.387 | 0.500 | 0.218 | – |
| SVEH-Net (Tang et al., 2022) | Tang et al. | 2022 | 0.508 | 0.356 | 0.259 | 0.191 | 0.408 | 0.415 | 0.225 | – |
| ODM (Chen & Tang, 2022) | Chen et al. | 2022 | 0.498 | 0.336 | 0.241 | 0.192 | 0.391 | 0.414 | 0.204 | – |
| ICT (Zhang et al., 2023a) | Zhang et al. | 2023 | 0.503 | 0.341 | 0.246 | 0.186 | 0.390 | – | 0.208 | – |
| Kim et al. (2023) | Kim et al. | 2023 | 0.438 | 0.280 | 0.201 | 0.155 | 0.351 | 0.631 | – | – |
| UAR (Li et al., 2023d) | Li et al. | 2023 | 0.530 | 0.365 | 0.263 | 0.200 | 0.405 | 0.501 | 0.218 | – |
| DCL (Li et al., 2023b) | Li et al. | 2023 | – | – | – | 0.163 | 0.383 | 0.586 | 0.193 | – |
| M2KT (Yang et al., 2023) | Yang et al. | 2023 | 0.497 | 0.319 | 0.230 | 0.174 | 0.399 | 0.407 | – | – |
| KiUT (Huang, Zhang & Zhang, 2023) | Huang et al. | 2023 | 0.525 | 0.360 | 0.251 | 0.185 | 0.409 | – | 0.242 | – |
| MMTN (Cao et al., 2023) | Cao et al. | 2023 | 0.486 | 0.321 | 0.232 | 0.175 | 0.375 | 0.361 | – | – |
| AGFNet (Wang et al., 2023d) | Wang et al. | 2023 | 0.505 | 0.345 | 0.243 | 0.176 | 0.396 | – | 0.205 | – |
| PhenotypeCLIP (Wang et al., 2023c) | Wang et al. | 2023 | – | – | – | 0.205 | 0.414 | 0.370 | 0.223 | – |
| ORGAN (Hou et al., 2023b) | Hou et al. | 2023 | 0.510 | 0.346 | 0.255 | 0.195 | 0.399 | – | 0.205 | – |
| METransformer (Wang et al., 2023e) | Wang et al. | 2023 | 0.483 | 0.322 | 0.228 | 0.172 | 0.380 | 0.435 | 0.192 | – |
| CvT-212DistilGPT2 (Nicolson, Dowling & Koopman, 2023) | Nicolson et al. | 2023 | 0.473 | 0.304 | 0.224 | 0.175 | 0.376 | 0.694 | 0.200 | – |
| HReMRG-MR (Xu et al., 2023) | Xu et al. | 2023 | 0.440 | 0.306 | 0.214 | 0.149 | 0.381 | 0.524 | 0.197 | – |
| R2GenGPT (Wang et al., 2023f) | Wang et al. | 2023 | 0.488 | 0.316 | 0.228 | 0.173 | 0.377 | 0.438 | 0.211 | – |
| RAMT (Zhang et al., 2023b) | Zhang et al. | 2023 | 0.482 | 0.310 | 0.221 | 0.165 | 0.377 | – | 0.195 | – |
| FMVP (Liu et al., 2023) | Liu et al. | 2023 | 0.499 | 0.339 | 0.256 | 0.206 | 0.423 | – | 0.211 | – |
| MSCL (Zhao et al., 2023) | Zhao et al. | 2023 | 0.485 | 0.355 | 0.275 | 0.221 | 0.433 | – | 0.210 | – |
| MVCO-DOT (Wang et al., 2023a) | Wang et al. | 2023 | 0.453 | 0.318 | 0.223 | 0.157 | 0.374 | – | 0.196 | – |
| CheXPrune (Kaur & Mittal, 2023) | Kaur et al. | 2023 | 0.543 | 0.445 | 0.374 | 0.320 | 0.598 | 0.322 | – | – |
| MKCL (Hou et al., 2023c) | Hou et al. | 2023 | 0.490 | 0.311 | 0.222 | 0.167 | 0.385 | 0.523 | – | – |
| TIMER (Wu, Huang & Huang, 2023) | Wu et al. | 2023 | 0.493 | 0.325 | 0.238 | 0.186 | 0.383 | – | 0.204 | – |
| CVAM+MVSL (Gu et al., 2023) | Gu et al. | 2023 | 0.460 | 0.284 | 0.207 | 0.152 | 0.385 | 0.409 | – | – |
| AdaMatch-Cyclic (Chen et al., 2023) | Chen et al. | 2023 | 0.416 | 0.300 | 0.207 | 0.145 | 0.366 | – | 0.162 | – |
| AENSI (Lin et al., 2023) | Lin et al. | 2023 | 0.542 | 0.364 | 0.267 | 0.198 | 0.433 | 0.464 | – | – |
| C2M-DoT (Wang et al., 2023b) | Wang et al. | 2023 | 0.458 | 0.321 | 0.230 | 0.159 | 0.380 | – | 0.204 | – |
| Yan et al. (2024) | Yan et al. | 2024 | 0.495 | 0.315 | 0.226 | 0.178 | 0.377 | – | 0.211 | – |
| PromptMRG (Jin et al., 2024) | Jin et al. | 2024 | 0.401 | – | – | 0.098 | 0.281 | – | 0.160 | – |
| CAMANet (Wang et al., 2024a) | Wang et al. | 2024 | 0.504 | 0.363 | 0.279 | 0.218 | 0.404 | 0.418 | 0.203 | – |
| TranSQ (Gao et al., 2024) | Gao et al. | 2024 | 0.516 | 0.365 | 0.272 | 0.205 | 0.409 | – | 0.210 | – |
| TSGET (Yi et al., 2024) | Yi et al. | 2024 | 0.500 | 0.349 | 0.256 | 0.194 | 0.402 | – | 0.218 | – |
| S3-Net (Pan et al., 2023) | Pan et al. | 2024 | 0.499 | 0.334 | 0.246 | 0.172 | 0.401 | – | 0.206 | – |
| MINIGPT-4 + I3+C2FD (Liu et al., 2024b) | Liu et al. | 2024 | 0.499 | 0.323 | 0.238 | 0.184 | 0.390 | – | 0.208 | – |
| DTrace (Ye et al., 2024) | Ye et al. | 2024 | 0.516 | 0.353 | 0.278 | 0.204 | 0.386 | 0.469 | 0.233 | – |
| Liu et al. (2024a) | Liu et al. | 2024 | 0.472 | 0.321 | 0.234 | 0.175 | 0.379 | 0.368 | 0.192 | – |
| MedCycle (Hirsch, Dawidowicz & Tal, 2024) | Hirsch et al. | 2024 | 0.349 | 0.195 | 0.115 | 0.072 | 0.239 | – | 0.128 | – |
| BiomedGPT (Zhang et al., 2024b) | Zhang et al. | 2024 | – | – | – | – | 0.285 | 0.401 | 0.129 | √ |
| R2GenCSR (Wang et al., 2024c) | Wang et al. | 2024 | 0.514 | 0.351 | 0.262 | 0.206 | 0.401 | 0.579 | 0.215 | – |
| DMVF (Tang et al., 2024) | Tang et al. | 2024 | 0.518 | 0.349 | 0.252 | 0.190 | 0.398 | 0.411 | 0.215 | – |
| Wang et al. (2024d) | Wang et al. | 2024 | 0.497 | 0.357 | 0.279 | 0.225 | 0.408 | – | 0.217 | √ |
| SVAML (Huang et al., 2024) | Huang et al. | 2024 | 0.557 | 0.377 | 0.281 | 0.213 | 0.435 | 0.475 | – | – |
| SERPENT-VLM (Kapadnis et al., 2024) | Kapadnis et al. | 2024 | 0.547 | 0.356 | 0.242 | 0.190 | 0.452 | – | – | – |
| SA3RT (Song et al., 2024) | Song et al. | 2024 | 0.483 | 0.323 | 0.244 | 0.197 | 0.378 | – | 0.205 | – |
| HDGAN (Zhang et al., 2024a) | Zhang et al. | 2024 | 0.477 | 0.318 | 0.226 | 0.167 | 0.417 | 0.426 | 0.190 | √ |
| MDAKF (Tan et al., 2024) | Tan et al. | 2024 | 0.494 | 0.318 | 0.229 | 0.174 | 0.389 | 0.371 | 0.194 | – |
| LACCOL (Liu et al., 2025) | Liu et al. | 2025 | 0.508 | 0.321 | 0.229 | 0.172 | 0.392 | – | 0.198 | – |
| RCAN (Hou et al., 2025) | Hou et al. | 2025 | 0.521 | 0.346 | 0.245 | 0.186 | 0.399 | – | 0.212 | – |
| DACG (Lang, Liu & Zhang, 2025) | Lang et al. | 2025 | 0.518 | 0.355 | 0.260 | 0.198 | 0.414 | 0.415 | 0.216 | – |
| VLDSE (Chen et al., 2025) | Chen et al. | 2025 | 0.475 | 0.313 | 0.234 | 0.186 | 0.372 | – | 0.193 | – |
| DCTMN (Dong et al., 2025) | Dong et al. | 2025 | 0.506 | 0.392 | 0.299 | 0.234 | 0.412 | – | 0.197 | – |
| AM-MRG (Wang et al., 2025) | Wang et al. | 2025 | 0.489 | 0.339 | 0.253 | 0.192 | 0.384 | 0.613 | 0.225 | – |
| AHP (Yu et al., 2025b) | Yu et al. | 2025 | 0.502 | 0.338 | 0.250 | 0.196 | 0.388 | 0.670 | 0.212 | – |
| Li et al. (2025b) | Li et al. | 2025 | 0.491 | 0.359 | 0.263 | 0.209 | 0.408 | 0.396 | 0.212 | – |
| UMIT (Yu et al., 2025a) | Yu et al. | 2025 | – | – | – | – | 0.303 | 0.343 | 0.160 | – |
Note:
All values are taken from the original article. The best result is in bold, the second-best result is underlined. A dash (–) indicates a metric that the model did not evaluate. The table is grouped by year.
According to the included evaluation metrics, the most effective model is FFL+CFL proposed by Syeda-Mahmood et al. (2020). In their study, they introduced a deep learning approach trained on a large set of fine-finding labels (FFL) that served as detailed and comprehensive descriptors of chest X-ray findings. These labels not only captured pathological features but also included laterality, anatomical location, and severity, enhancing the granularity of report generation. Given a new chest X-ray image, the model predicted fine-finding labels as pattern vectors. It then retrieved the most relevant reports from a predefined database of labeled patterns and associated reports and refined the retrieved reports to ensure coherence and consistency. Notably, the model was trained on MIMIC-NIH, a combined dataset from three sources, and tested on IU-X-ray that achieved top performance across most NLG evaluation metrics. The success of this approach stems from its ability to decompose the complex end-to-end generation task into a more structured intermediate step. Rather than generating text directly from pixels, the model first encodes the imaging findings into a set of refined labels containing rich information such as pathological features, anatomical location, and severity. The model then retrieves the most relevant reports based on these structured labels. This “image—structured semantics—text” strategy significantly reduces the risk of factual errors and ensures high consistency between report content and imaging findings. Despite demonstrating superior results, the authors did not release their model code or conduct ablation studies, posing challenges to experimenting with reproducibility and in-depth evaluation of their approach. RepsNet proposed by Tanwani, Barral & Freedman (2022), employed ResNeXt-101 (Xie et al., 2017) and BERT (Devlin, 2018) as image and text encoders, respectively. It fuses cross-modal representations through a bilinear attention network (BAN) (Kim, Jun & Zhang, 2018), and utilizes GPT-2 (Radford et al., 2019) as a language decoder for report generation. This approach achieved SOTA performance on BLEU-1, with ablation studies confirming performance improvements through the incremental incorporation of contrastive learning and prior context information. RepsNet’s success lies in its ingenious fusion of SOTA components from various fields at the time. By using powerful pre-trained models as building blocks and effectively integrating cross-modal information with BAN, the model maximizes the knowledge dividend of large-scale pre-training. This demonstrates that leveraging the prior knowledge of large external models is an extremely effective strategy for relatively small datasets like IU-Xray. Nicolson, Dowling & Koopman (2023) introduced cvt2distilgpt2, a model that integrated a Convolutional Vision Transformer (CvT) encoder and a Distilled Generative Pre-trained Transformer 2 (DistilGPT2) decoder with warm-start initialization, and their approach achieved the second-highest score on CIDE. Nicolson, Dowling & Koopman (2023) and Tanwani, Barral & Freedman (2022) did not achieve an absolute score advantage on most indicators. This is potentially due to the tendency of LLM-based models to generate more diverse and more paraphrased sentences, so their outputs may express correct clinical meanings but score lower on vocabulary overlap indicators. Nevertheless, their methods still highlight the great research potential and scalability of utilizing large language models in automatic medical report generation. Wu et al. (2022) proposed DeltaNet, a conditional medical report generation model that incorporated comparative analysis between input and reference X-rays. The model consisted of the following components: A CNN-based visual encoder, which extracted features from the input X-ray image; a conditional encoder, which captured differences between the input X-ray and a reference X-ray by embedding the conditional report via a Bidirectional LSTM (BiLSTM); and a decoder, which generated the final medical report. DeltaNet achieved the highest CIDEr score of 0.802, validating its effectiveness in structured report generation. The key to DeltaNet lies in its introduction of a comparative analysis perspective. Rather than describing a static image in isolation, the model generates a report by comparing it with a “reference” image. This successfully simulates the real-world diagnostic process of radiologists during follow-up reviews, which focuses on the “changes” or “differences” between the two images. This conditional generation task is more constrained than unconditional generation and more closely aligned with clinical needs, enabling the model to generate more precise and contextually relevant reports, particularly in scenarios describing disease progression or stability. Kaur & Mittal (2023) introduced CheXPrune, a multi-attention-based model that pioneered the use of parameter pruning for radiology report generation. Parameter pruning acts as an effective regularizer. By removing redundant parameters, the model is forced to learn more robust and generalizable feature representations, which can reduce the risk of overfitting on moderately sized datasets like IU-Xray. A leaner, more efficient model may be more likely to capture the core content of the report. This model achieved the second-best performance on multiple metrics and attained the highest score on ROUGE. Nevertheless, future research should explore ablation studies and address the feasibility of deploying this method on low-computation devices.
PEIR gross
PEIR Gross is a pathology image dataset provided by the Pathology Education Informational Resource (PEIR) digital library. It contains 7,442 medical images, covering 21 subcategories of diseases and anatomical structures. Each image in PEIR Gross is only paired with a short textual description, making it particularly well-suited for single-sentence generation tasks in AMRG. Jing, Xie & Xing (2017) were the first to utilize the PEIR Gross dataset in their research, which provided a foundational reference for subsequent studies. In our survey, ten studies have employed this dataset, with detailed information presented in Table 4.
| Model/Method | Author | Year | BLEU | ROUGE | CIDEr | METEOR | Human evaluation | |||
|---|---|---|---|---|---|---|---|---|---|---|
| −1 | −2 | −3 | −4 | |||||||
| CoAtt (Jing, Xie & Xing, 2017) | Jing et al. | 2018 | 0.300 | 0.218 | 0.165 | 0.113 | 0.279 | 0.329 | 0.149 | – |
| Nearest-neighbor (Pavlopoulos, Kougia & Androutsopoulos, 2019) | Pavlopoulos et al. | 2019 | 0.346 | 0.262 | 0.206 | 0.156 | 0.347 | – | 0.181 | – |
| MedSkip (Pahwa et al., 2021) | Pahwa et al. | 2021 | 0.399 | 0.278 | 0.209 | 0.148 | 0.414 | – | 0.176 | – |
| SVEH-Net (Tang et al., 2022) | Tang et al. | 2022 | 0.466 | 0.323 | 0.233 | 0.169 | 0.374 | 0.269 | 0.199 | – |
| AENSI (Lin et al., 2023) | Lin et al. | 2023 | 0.442 | 0.315 | 0.227 | 0.176 | 0.436 | 0.282 | – | – |
| BiomedGPT (Zhang et al., 2024b) | Zhang et al. | 2024 | – | – | – | – | 0.360 | 1.227 | 0.154 | √ |
| SVAML (Huang et al., 2024) | Huang et al. | 2024 | 0.467 | 0.333 | 0.241 | 0.172 | 0.446 | – | 0.312 | – |
| Dragonfly-Med (Chen et al., 2024) | Chen et al. | 2024 | – | – | – | – | 0.420 | 1.985 | 0.402 | – |
| UMIT (Yu et al., 2025a) | Yu et al. | 2025 | – | – | – | – | 0.426 | 1.070 | 0.229 | – |
| MicarVLMoE (Izhar et al., 2025) | Izhar et al. | 2025 | 0.321 | 0.236 | 0.182 | 0.132 | 0.302 | – | 0.287 | – |
Note:
All values are taken from the original article. The best result is in bold, the second-best result is underlined. A dash (–) indicates a metric that the model did not evaluate. The table is grouped by year.
Among these ten studies, the Semantic and Visual Attention-driven Multi-LSTM Network (SVAML) proposed by Huang et al. (2024) achieved the highest performance across most evaluation metrics, making it the current SOTA model for this dataset. SVAML introduced a hybrid feature extraction approach leveraging the ConViT architecture, which combined Vision Transformer (ViT) and CNN to extract visual features. By synergistically combining the ability of CNN to capture local, fine-grained features with the advantage of ViT in modeling global, long-range dependencies, the model provides a richer and more comprehensive visual representation for subsequent attention mechanisms and text generators, thereby improving the accuracy of reports. Additionally, it integrated a double-weighted multi-head attention mechanism, which enhanced the understanding of medical image impressions. SVEH-Net, developed by Tang et al. (2022), also exhibited good performance. This method achieved excellent scores on multiple indicators by adopting an image feature encoding (IFE) module and a hierarchical decoder (H-Decoder), but this approach offers substantial room for improving generation accuracy. The IFE module improves visual feature representation, but it primarily focuses on extracting low- to mid-level features. Without sufficient integration of domain-specific medical knowledge or structured clinical priors, the model may misinterpret subtle pathological cues, leading to inaccuracies in report generation. The H-Decoder is designed to improve sentence- and paragraph-level coherence. However, it may still struggle with fine-grained abnormality descriptions, especially when multiple co-existing findings appear in a single image. The hierarchical structure does not fully resolve semantic drift or omission problems, which reduces factual correctness. The Visual-Language Model (VLM) Dragonfly-Med, introduced by Chen et al. (2024), employed high-resolution processing and multi-crop techniques to increase image resolution, allowing the model to capture fine-grained visual details more effectively. This approach has led to excellent performance in the CIDEr and METEOR metrics. However, it is important to note that the evaluation of Dragonfly-Med was limited to three metrics, including ROUGE, CIDEr, and METEOR. Furthermore, processing high-resolution images and multiple crops of an image allows the model to more effectively capture fine visual details in the image but at the same time requires more computational resources and time than processing a single low-resolution image. Therefore, the performance improvement comes at the cost of increased computational burden.
ROCO
The ROCO dataset is a large-scale public dataset introduced by Pelka et al. (2018). It was constructed by retrieving image-caption pairs from the open-access biomedical literature database PubMedCentral, followed by automated filtering using a binary classifier fine-tuned with a deep convolutional neural network system. The dataset was refined by removing composite, multi-pane, and non-radiology images. The initial release of ROCO contains over 81,000 medical images, covering a wide range of imaging modalities that include Computed Tomography (CT), X-ray, Magnetic Resonance Imaging (MRI), and Ultrasound. Each image is annotated with titles, keywords, Unified Medical Language System (UMLS) concepts, unique identifiers, and semantic types, making it a highly structured and multimodal resource. Due to its large-scale and diverse dataset composition, ROCO has become a core resource in medical artificial intelligence research and is widely utilized in ImageCLEF competitions and AMRG-related studies.
We have identified five relevant studies that leveraged the ROCO dataset, and they are summarized in Table 5. Among them, the approach by Beddiar, Oussalah & Seppanen (2023b) achieved the highest scores for all four BLEU metrics. Their method combined an encoder-decoder generative model with a template-based retrieval model to form a hybrid multi-stage approach. This hybrid approach is successful because it combines the strengths of both paradigms, leveraging their strengths and weaknesses. The generative model provides the flexibility to identify key concepts in images, while the retrieval model ensures that the resulting text output is fluent and rooted in real human language examples. This strategy effectively balances the diversity of the generated text with the linguistic quality and factual reliability of the reports. However, their study did not release code or conduct ablation experiments, and it relied solely on BLEU scores as evaluation metrics, which limits further investigation and comparative analysis. Kapadnis et al. (2024) proposed SERPENT-VLM, which introduces a self-optimizing loss mechanism to iteratively reduce hallucinations during text generation by explicitly penalizing inconsistencies between intermediate outputs and ground-truth image information, thereby improving text consistency and factual support. This method achieved SOTA performance on the ROUGE metric, an improvement that demonstrates that self-refinement strategies can effectively suppress the tendency of generative models to fabricate unfounded findings, a key challenge in clinical applications. It is worth noting that while self-refinement strategies benefit lexical overlap metrics like ROUGE, they do not necessarily improve semantic fidelity or clinical correctness. Future work could combine this with domain knowledge and clinical consistency objectives to achieve balanced improvements across evaluation metrics. Additionally, Dragonfly-Med (Chen et al., 2024), which previously demonstrated strong performance on the PEIR Gross dataset, also performed well on ROCO, highlighting the versatility and generalizability of its model architecture across different datasets.
| Model/Method | Author | Year | BLEU | ROUGE | CIDEr | METEOR | Human evaluation | |||
|---|---|---|---|---|---|---|---|---|---|---|
| −1 | −2 | −3 | −4 | |||||||
| ODM (Chen & Tang, 2022) | Chen et al. | 2022 | 0.256 | 0.145 | 0.101 | 0.076 | 0.200 | 0.193 | 0.128 | – |
| Beddiar, Oussalah & Seppanen (2023b) | Beddiar et al. | 2023 | 0.466 | 0.330 | 0.236 | 0.186 | – | – | – | – |
| SERPENT-VLM (Kapadnis et al., 2024) | Kapadnis et al. | 2024 | 0.243 | 0.169 | 0.108 | 0.057 | 0.212 | – | – | – |
| Dragonfly-Med (Chen et al., 2024) | Chen et al. | 2024 | – | – | – | – | 0.192 | 0.452 | 0.155 | – |
| MicarVLMoE (Izhar et al., 2025) | Izhar et al. | 2025 | 0.136 | 0.069 | 0.034 | 0.018 | 0.144 | - | 0.177 | – |
Note:
All values are taken from the original article. The best result is in bold. A dash (–) indicates a metric that the model did not evaluate. The table is grouped by year.
Although ROCO includes a diverse range of image types and pathologies, models may still face unique challenges when processing rare conditions, small-sample cases, or complex lesions. Nevertheless, due to its extensive annotations and broad coverage of medical imaging modalities, ROCO remains an indispensable benchmark dataset for automated diagnosis and radiology report generation research.
CX-CHR
CX-CHR is a private chest X-ray dataset focusing on Chinese medical imaging. It comprises 45,598 images from 35,609 patients, with each image accompanied by a detailed Chinese radiology report. These reports provide comprehensive descriptions of lesion locations, abnormality types, and normal anatomical structures. Compared to English-language datasets such as IU-Xray, CX-CHR enhances model adaptability to Chinese medical terminology and clinical logic, making it particularly valuable for AMRG in Chinese. Although CX-CHR is not publicly available, researchers can apply for access and sign relevant agreements for academic research purposes. Li et al. (2018) were the first to utilize CX-CHR for AMRG studies, as summarized in Table 6.
| Model/Method | Author | Year | BLEU | ROUGE | CIDEr | Human evaluation | |||
|---|---|---|---|---|---|---|---|---|---|
| −1 | −2 | −3 | −4 | ||||||
| HRGR-agent (Li et al., 2018) | Li et al. | 2018 | 0.673 | 0.587 | 0.530 | 0.486 | 0.612 | 2.895 | √ |
| KERP (Li et al., 2019) | Li et al. | 2019 | 0.673 | 0.588 | 0.532 | 0.473 | 0.618 | 2.850 | √ |
| CMAS-RL (Jing, Wang & Xing, 2020) | Jing et al. | 2020 | 0.693 | 0.626 | 0.580 | 0.545 | 0.661 | 2.900 | – |
| Relation-paraNet (Wang et al., 2020) | Wang et al. | 2020 | 0.711 | 0.637 | 0.586 | 0.548 | 0.675 | 3.249 | √ |
| Medical-VLBERT (Liu et al., 2021d) | Liu et al. | 2021 | 0.700 | 0.627 | 0.570 | 0.534 | 0.655 | 3.220 | √ |
| ASGK (Li et al., 2023c) | Li et al. | 2022 | 0.686 | 0.608 | 0.558 | 0.523 | 0.641 | 3.245 | √ |
Note:
All values are taken from the original article. The best result is in bold, the second-best result is underlined. A dash (–) indicates a metric that the model did not evaluate. Models are chronologically arranged by publication year.
Among the reviewed studies, Relation-paraNet, proposed by Wang et al. (2020) achieved SOTA performance that obtained the highest scores across all evaluation metrics. This model employed hybrid-knowledge co-reasoning within a deep convolutional network and integrates template retrieval and sentence generation. This sophisticated knowledge integration framework generates detailed and accurate descriptions of abnormal findings while ensuring the overall semantic coherence of the report, effectively striking a balance between generative freedom and clinical standardization. Notably, Wang et al. (2020) conducted ablation studies and engaged clinical experts for manual evaluation, which reinforced the reliability and robustness of their findings. Additionally, Li et al. (2023c) proposed the Auxiliary Signal-Guided Knowledge (ASGK) model, which incorporated auxiliary signals—such as suspicious region enhancement patches and pre-training on external medical corpora—to guide the knowledge encoder-decoder framework. By introducing “suspicious region enhancement patches,” the model is given explicit visual cues, forcing it to focus on the most clinically significant areas of the image. This prevents the model from being distracted by normal anatomical structures, enabling more accurate identification and description of pathological features. Furthermore, pre-training on an external medical corpus enables the model to learn a rich set of medical terminology and professional report writing styles before beginning the image-to-text generation task. This provides a solid linguistic foundation, significantly improving the semantic coherence and medical terminology accuracy of the generated reports. Their ablation experiments further demonstrated that auxiliary signals enhanced label classification performance and improved the overall report quality.
MIMIC-CXR
The Medical Information Mart for Intensive Care-Chest X-ray (MIMIC-CXR) (Johnson et al., 2019) is the largest publicly available medical image report dataset to date. It contains 377,110 chest radiographs (frontal and lateral views) and 227,835 radiology reports, with the majority featuring both Findings and Impressions components. The dataset is collected from 65,379 patients at Beth Israel Deaconess Medical Center between 2011 and 2016 and offers official train, validation, and test splits that facilitate standardized benchmarking. Since its release, multiple dataset variants have been developed, making MIMIC-CXR one of the most widely used datasets in AMRG. Researchers can apply for access via the official website after signing the required agreements.
We have identified 78 studies utilizing MIMIC-CXR, with Table 7 summarizing the performance of various models on this dataset. Among them, the study by Serra et al. (2023) achieved outstanding results. Their approach incorporated previously scanned images as additional inputs, aligning, concatenating, and fusing historical imaging data with current patient scans to create a joint representation. The inclusion of this longitudinal data successfully simulates the real-world workflow of radiologists, as doctors often compare multiple images to assess changes in a patient’s condition (e.g., progression, stability, or improvement). By allowing the model to learn from this temporal variation, the generated reports are not only more accurate in describing the current image but also include valuable clinical information about the disease’s dynamics. To further enhance model performance, they also introduced sentence-anatomy dropout, a mechanism that improves report generation quality. Additionally, they partitioned the test set to evaluate the effectiveness of the model on both initial and follow-up scans. It is important to note that reliance on historical imaging data may limit the model’s applicability in situations where no prior scans are available, while sentence anatomy dropout requires precise sentence structure annotations, which may limit its scalability to other datasets. This highlights a broader issue in the AMRG study—methods that achieve high performance under specific conditions may face obstacles when applied to heterogeneous real-world clinical data. MATNet, proposed by Shang et al. (2022), also demonstrated strong performance. This method consisted of three key components, including a multimodal encoder, a disease classifier, and an adaptive decoder, which mitigated data bias and dynamically adjusted the contributions of visual and textual signals to word prediction. The adaptive decoder was particularly effective in addressing the imbalance between frequent normal findings and rarer abnormal cases. However, the reliance on handcrafted disease classifiers may reduce flexibility in handling unseen disease categories, suggesting that the scalability of MATNet remains a potential bottleneck.
| Model/Method | Author | Year | BLEU | ROUGE | CIDEr | METEOR | Clinical efficacy | Human evaluation | |||
|---|---|---|---|---|---|---|---|---|---|---|---|
| −1 | −2 | −3 | −4 | ||||||||
| Clinically coherent reward (Liu et al., 2019) | Liu et al. | 2019 | 0.313 | 0.206 | 0.146 | 0.103 | 0.306 | 1.046 | – | √ | – |
| R2Gen (Chen et al., 2020) | Chen et al. | 2020 | 0.353 | 0.218 | 0.145 | 0.103 | 0.277 | – | 0.142 | √ | – |
| Gumbel transformer (Lovelace & Mortazavi, 2020) | Lovelace et al. | 2020 | 0.415 | 0.272 | 0.193 | 0.146 | 0.318 | 0.316 | 0.159 | √ | – |
| Boag et al. (2020) | Boag et al. | 2020 | 0.305 | 0.201 | 0.137 | 0.092 | – | 0.850 | – | √ | – |
| KGAE (Liu et al., 2021c) | Liu et al. | 2021 | 0.369 | 0.231 | 0.156 | 0.118 | 0.295 | – | 0.153 | √ | √ |
| PPKED (Liu et al., 2021a) | Liu et al. | 2021 | 0.360 | 0.224 | 0.149 | 0.106 | 0.284 | – | 0.149 | – | – |
| Contrastive attention (Liu et al., 2021b) | Liu et al. | 2021 | 0.350 | 0.219 | 0.152 | 0.109 | 0.283 | – | 0.151 | √ | √ |
| MDT+WCL (Yan et al., 2021) | Yan et al. | 2021 | 0.373 | – | – | 0.107 | 0.274 | – | 0.144 | √ | – |
| AlignTransformer (You et al., 2021) | You et al. | 2021 | 0.378 | 0.235 | 0.156 | 0.112 | 0.283 | – | 0.158 | – | √ |
| TriNet (Yang et al., 2021b) | Yang et al. | 2021 | 0.362 | 0.251 | 0.188 | 0.143 | 0.326 | 0.273 | – | – | – |
| MV+T+I (Nguyen et al., 2021) | Nguyen et al. | 2021 | 0.495 | 0.360 | 0.278 | 0.224 | 0.390 | – | 0.222 | √ | – |
| VTI (Najdenkoska et al., 2021) | Najdenkoska et al. | 2021 | 0.418 | 0.293 | 0.152 | 0.109 | 0.302 | – | 0.177 | √ | – |
| M2TR. PROGRESSIVE (Nooralahzadeh et al., 2021) | Nooralahzadeh et al. | 2021 | 0.378 | 0.232 | 0.154 | 0.107 | 0.272 | – | 0.145 | √ | – |
| MedWriter (Yang et al., 2021a) | Yang et al. | 2021 | 0.438 | 0.297 | 0.216 | 0.164 | 0.332 | 0.306 | – | √ | √ |
| R2GenCMN (Chen et al., 2022) | Chen et al. | 2022 | 0.353 | 0.218 | 0.148 | 0.106 | 0.278 | – | 0.142 | √ | – |
| MedViLL (Moon et al., 2022) | Moon et al. | 2022 | – | – | – | 0.066 | – | – | – | √ | – |
| CMCL (Liu et al., 2022) | Liu et al. | 2022 | 0.344 | 0.217 | 0.140 | 0.097 | 0.281 | – | 0.133 | – | √ |
| CTN (Yang et al., 2022b) | Yang et al. | 2022 | 0.362 | 0.224 | 0.150 | 0.108 | 0.276 | 0.157 | 0.142 | √ | – |
| CMM+RL (Qin & Song, 2022) | Qin and Song | 2022 | 0.381 | 0.232 | 0.155 | 0.109 | 0.287 | – | 0.151 | √ | √ |
| Yang et al. (2022a) | Yang et al. | 2022 | 0.363 | 0.228 | 0.156 | 0.115 | 0.284 | 0.203 | – | √ | – |
| VTI-TRS (Najdenkoska et al., 2022) | Najdenkoska et al. | 2022 | 0.475 | 0.314 | 0.196 | 0.136 | 0.315 | – | 0.191 | √ | – |
| XPRONET (Wang, Bhalerao & He, 2022) | Wang et al. | 2022 | 0.344 | 0.215 | 0.146 | 0.105 | 0.279 | – | 0.138 | – | – |
| CMCA (Song et al., 2022) | Song et al. | 2022 | 0.360 | 0.227 | 0.156 | 0.117 | 0.287 | – | 0.148 | √ | – |
| Wang et al. (2022b) | Wang et al. | 2022 | 0.351 | 0.223 | 0.157 | 0.118 | 0.287 | 0.281 | – | – | – |
| Zhang et al. (2022) | Zhang et al. | 2022 | 0.491 | 0.358 | 0.278 | 0.225 | 0.389 | – | 0.215 | √ | – |
| Wang et al. (2022c) | Wang et al. | 2022 | 0.413 | 0.266 | 0.186 | 0.136 | 0.298 | 0.429 | 0.170 | – | – |
| Clinical-BERT (Yan & Pei, 2022) | Yan et al. | 2022 | 0.383 | 0.230 | 0.151 | 0.106 | 0.275 | – | 0.144 | √ | – |
| MATNet (Shang et al., 2022) | Shang et al. | 2022 | 0.506 | 0.370 | 0.288 | 0.233 | 0.395 | – | 0.221 | √ | – |
| DeltaNet (Wu et al., 2022) | Wu et al. | 2022 | 0.361 | 0.225 | 0.154 | 0.114 | 0.277 | 0.281 | – | √ | – |
| Dalla Serra et al. (2022) | Dalla Serra et al. | 2022 | 0.363 | 0.245 | 0.178 | 0.136 | 0.313 | – | 0.161 | √ | √ |
| ODM (Chen & Tang, 2022) | Chen et al. | 2022 | 0.383 | 0.246 | 0.174 | 0.121 | 0.299 | 0.302 | 0.169 | – | – |
| Kim et al. (2023) | Kim et al. | 2023 | 0.342 | 0.222 | 0.152 | 0.110 | 0.301 | 0.166 | – | – | – |
| ICT (Zhang et al., 2023a) | Zhang et al. | 2023 | 0.376 | 0.233 | 0.157 | 0.113 | 0.276 | – | 0.144 | – | – |
| OpenLLaMA (Lu et al., 2023) | Lu et al. | 2023 | – | – | – | 0.069 | 0.235 | – | – | √ | – |
| UAR (Li et al., 2023d) | Li et al. | 2023 | 0.363 | 0.229 | 0.158 | 0.107 | 0.289 | 0.246 | 0.157 | – | – |
| DCL (Li et al., 2023b) | Li et al. | 2023 | – | – | – | 0.109 | 0.284 | 0.281 | 0.150 | √ | – |
| M2KT (Yang et al., 2023) | Yang et al. | 2023 | 0.386 | 0.237 | 0.157 | 0.111 | 0.274 | 0.111 | – | √ | – |
| KiUT (Huang, Zhang & Zhang, 2023) | Huang et al. | 2023 | 0.393 | 0.243 | 0.159 | 0.113 | 0.285 | – | 0.160 | √ | – |
| MMTN (Cao et al., 2023) | Cao et al. | 2023 | 0.379 | 0.238 | 0.159 | 0.116 | 0.283 | 0.161 | – | – | – |
| AGFNet (Wang et al., 2023d) | Wang et al. | 2023 | 0.363 | 0.235 | 0.164 | 0.118 | 0.301 | – | 0.136 | – | – |
| PhenotypeCLIP (Wang et al., 2023c) | Wang et al. | 2023 | – | – | – | 0.119 | 0.286 | 0.259 | 0.158 | – | – |
| ORGAN (Hou et al., 2023b) | Hou et al. | 2023 | 0.407 | 0.256 | 0.172 | 0.123 | 0.293 | – | 0.162 | √ | – |
| METransformer (Wang et al., 2023e) | Wang et al. | 2023 | 0.386 | 0.250 | 0.169 | 0.124 | 0.291 | 0.362 | 0.152 | √ | – |
| RECAP (Hou et al., 2023a) | Hou et al. | 2023 | 0.429 | 0.267 | 0.177 | 0.125 | 0.288 | – | 0.168 | √ | – |
| RGRG (Tanida et al., 2023) | Tanida et al. | 2023 | 0.373 | 0.249 | 0.175 | 0.126 | 0.264 | 0.495 | 0.168 | √ | – |
| CvT-212DistilGPT2 (Nicolson, Dowling & Koopman, 2023) | Nicolson et al. | 2023 | 0.393 | 0.248 | 0.171 | 0.127 | 0.286 | 0.389 | 0.155 | √ | – |
| HReMRG-MR (Xu et al., 2023) | Xu et al. | 2023 | 0.481 | 0.343 | 0.256 | 0.192 | 0.380 | 0.372 | 0.207 | – | – |
| R2GenGPT (Wang et al., 2023f) | Wang et al. | 2023 | 0.411 | 0.267 | 0.186 | 0.134 | 0.297 | 0.269 | 0.160 | √ | – |
| RAMT (Zhang et al., 2023b) | Zhang et al. | 2023 | 0.362 | 0.229 | 0.157 | 0.113 | 0.284 | – | 0.153 | √ | – |
| FMVP (Liu et al., 2023) | Liu et al. | 2023 | 0.391 | 0.249 | 0.172 | 0.125 | 0.304 | – | 0.160 | √ | – |
| TIMER (Wu, Huang & Huang, 2023) | Wu et al. | 2023 | 0.383 | 0.225 | 0.146 | 0.104 | 0.280 | – | 0.147 | √ | – |
| Serra et al. (2023) | Dalla Serra et al. | 2023 | 0.486 | 0.366 | 0.295 | 0.246 | 0.423 | – | 0.216 | √ | – |
| Zhu et al. (2023b) | Zhu et al. | 2023 | 0.343 | 0.210 | 0.140 | 0.099 | 0.271 | – | 0.137 | √ | – |
| AdaMatch-Cyclic (Chen et al., 2023) | Chen et al. | 2023 | 0.379 | 0.235 | 0.154 | 0.106 | 0.286 | – | 0.163 | – | – |
| C2M-DoT (Wang et al., 2023b) | Wang et al. | 2023 | 0.484 | 0.345 | 0.258 | 0.193 | 0.385 | – | 0.210 | – | – |
| PromptMRG (Jin et al., 2024) | Jin et al. | 2024 | 0.398 | – | – | 0.112 | 0.268 | – | 0.157 | √ | – |
| CAMANet (Wang et al., 2024a) | Wang et al. | 2024 | 0.374 | 0.230 | 0.155 | 0.112 | 0.279 | 0.161 | 0.145 | √ | – |
| Med-PaLM M (Tu et al., 2024) | Tu et al. | 2024 | 0.323 | – | – | 0.115 | 0.275 | 0.262 | – | √ | – |
| TranSQ (Gao et al., 2024) | Gao et al. | 2024 | 0.423 | 0.261 | 0.171 | 0.116 | 0.286 | – | 0.168 | √ | – |
| TSGET (Yi et al., 2024) | Yi et al. | 2024 | 0.398 | 0.248 | 0.169 | 0.121 | 0.281 | – | 0.149 | √ | – |
| S3-Net (Pan et al., 2023) | Pan et al. | 2024 | 0.358 | 0.239 | 0.158 | 0.125 | 0.291 | – | 0.154 | – | – |
| MINIGPT-4 + I3+C2FD (Liu et al., 2024b) | Liu et al. | 2024 | 0.402 | 0.262 | 0.180 | 0.128 | 0.291 | – | 0.175 | √ | – |
| DTrace (Ye et al., 2024) | Ye et al. | 2024 | 0.392 | 0.260 | 0.171 | 0.129 | 0.309 | 0.311 | 0.162 | √ | – |
| Liu et al. (2024a) | Liu et al. | 2024 | 0.406 | 0.267 | 0.190 | 0.141 | 0.309 | – | 0.163 | √ | – |
| MedCycle (Hirsch, Dawidowicz & Tal, 2024) | Hirsch et al. | 2024 | 0.349 | 0.195 | 0.115 | 0.072 | 0.239 | – | 0.128 | √ | – |
| BiomedGPT (Zhang et al., 2024b) | Zhang et al. | 2024 | – | – | – | – | 0.287 | 0.234 | 0.159 | – | √ |
| R2GenCSR (Wang et al., 2024c) | Wang et al. | 2024 | 0.420 | 0.268 | 0.186 | 0.136 | 0.291 | 0.267 | 0.167 | – | – |
| DMVF (Tang et al., 2024) | Tang et al. | 2024 | 0.396 | 0.245 | 0.162 | 0.116 | 0.289 | 0.116 | 0.154 | √ | – |
| SA3RT (Song et al., 2024) | Song et al. | 2024 | 0.386 | 0.236 | 0.159 | 0.115 | 0.269 | – | 0.145 | – | – |
| HDGAN (Zhang et al., 2024a) | Zhang et al. | 2024 | 0.352 | 0.195 | 0.122 | 0.084 | 0.290 | – | 0.115 | – | √ |
| LACCOL (Liu et al., 2025) | Liu et al. | 2025 | 0.381 | 0.230 | 0.155 | 0.112 | 0.292 | – | 0.154 | √ | – |
| RCAN (Hou et al., 2025) | Hou et al. | 2025 | 0.392 | 0.247 | 0.167 | 0.118 | 0.275 | – | 0.153 | – | – |
| DACG (Lang, Liu & Zhang, 2025) | Lang et al. | 2025 | 0.398 | 0.249 | 0.167 | 0.117 | 0.290 | – | 0.162 | √ | – |
| DCTMN (Dong et al., 2025) | Dong et al. | 2025 | 0.402 | 0.261 | 0.171 | 0.146 | 0.286 | – | 0.188 | – | – |
| AM-MRG (Wang et al., 2025) | Wang et al. | 2025 | 0.426 | 0.271 | 0.187 | 0.136 | 0.291 | 0.261 | 0.174 | √ | – |
| AHP (Yu et al., 2025b) | Yu et al. | 2025 | 0.400 | 0.250 | 0.172 | 0.126 | 0.285 | 0.169 | 0.154 | √ | – |
| Li et al. (2025b) | Li et al. | 2025 | 0.411 | 0.284 | 0.195 | 0.138 | 0.312 | 0.195 | 0.203 | √ | – |
| Flamingo-CXR (Tanno et al., 2025) | Tanno et al. | 2025 | – | – | – | 0.101 | 0.297 | 0.138 | – | √ | √ |
Note:
All values are taken from the original article. The best result is in bold, the second-best result is underlined. A dash (–) indicates a metric that the model did not evaluate. The table is grouped by year.
Additionally, as discussed in ‘Clinical Efficacy (CE)’, the CE metric serves as a crucial benchmark for evaluating model performance on the MIMIC-CXR dataset. Among the 78 studies surveyed, 51 studies incorporated CE metrics, as summarized in Table 8. The Flexible Multi-view Paradigm (FMVP), proposed by Liu et al. (2023), achieved the excellent CE score. This model first acquired patient-specific prior knowledge, either automatically or with radiologist assistance, to enhance report generation quality. It then introduced a hierarchical alignment strategy to bridge the gap between pre-training and report generation. Finally, a multi-view knowledge decoder was employed to capture complementary information from different prior knowledge sources, effectively decoding fused multi-view representations to generate reports that closely resemble those written by radiologists. The findings of the study indicated that the proposed hierarchical alignment strategy and multi-view knowledge integration effectively mitigated discrepancies between the pre-training and generation stages, thereby enhancing cross-modal learning and improving overall report quality. Nevertheless, FMVP highlights a key trend in AMRG research: models leveraging multiple views or auxiliary knowledge sources can significantly improve clinical accuracy compared to purely image-driven approaches. For researchers, focusing on clinical accuracy is clearly more valuable than focusing on NLP metrics, so future research could explore scalable strategies for incorporating diverse prior information while minimizing the additional annotation burden.
| Model/Method | Author | Year | Precision | Recall | F1 |
|---|---|---|---|---|---|
| Clinically coherent reward (Liu et al., 2019) | Liu et al. | 2019 | 0.309 | 0.134 | – |
| R2Gen (Chen et al., 2020) | Chen et al. | 2020 | 0.333 | 0.273 | 0.276 |
| Gumbel transformer (Lovelace & Mortazavi, 2020) | Lovelace et al. | 2020 | 0.333 | 0.217 | 0.228 |
| Boag et al. (2020) | Boag et al. | 2020 | 0.304 | – | 0.186 |
| KGAE (Liu et al., 2021c) | Liu et al. | 2021 | 0.389 | 0.362 | 0.355 |
| Contrastive attention (Liu et al., 2021b) | Liu et al. | 2021 | 0.352 | 0.298 | 0.303 |
| MDT+WCL (Yan et al., 2021) | Yan et al. | 2021 | 0.385 | 0.274 | 0.294 |
| MV+T+I (Nguyen et al., 2021) | Nguyen et al. | 2021 | 0.432 | 0.418 | 0.412 |
| VTI (Najdenkoska et al., 2021) | Najdenkoska et al. | 2021 | 0.350 | 0.151 | 0.210 |
| M2TR. PROGRESSIVE (Nooralahzadeh et al., 2021) | Nooralahzadeh et al. | 2021 | 0.240 | 0.428 | 0.308 |
| R2GenCMN (Chen et al., 2022) | Chen et al. | 2022 | 0.334 | 0.275 | 0.278 |
| MedViLL (Moon et al., 2022) | Moon et al. | 2022 | 0.698 | 0.559 | 0.621 |
| CTN (Yang et al., 2022b) | Yang et al. | 2022 | 0.310 | 0.306 | 0.284 |
| CMM+RL (Qin & Song, 2022) | Qin and Song | 2022 | 0.342 | 0.294 | 0.292 |
| Yang et al. (2022a) | Yang et al. | 2022 | 0.458 | 0.348 | 0.371 |
| VTI-TRS (Najdenkoska et al., 2022) | Najdenkoska et al. | 2022 | 0.396 | 0.312 | 0.350 |
| CMCA (Song et al., 2022) | Song et al. | 2022 | 0.444 | 0.297 | 0.356 |
| Zhang et al. (2022) | Zhang et al. | 2022 | 0.587 | 0.593 | 0.560 |
| MATNet (Shang et al., 2022) | Shang et al. | 2022 | 0.454 | 0.391 | 0.405 |
| Clinical-BERT (Yan & Pei, 2022) | Yan et al. | 2022 | 0.397 | 0.435 | 0.415 |
| DeltaNet (Wu et al., 2022) | Wu et al. | 2022 | 0.470 | 0.399 | 0.406 |
| Dalla Serra et al. (2022) | Dalla Serra et al. | 2022 | 0.428 | 0.459 | 0.443 |
| OpenLLaMA (Lu et al., 2023) | Lu et al. | 2023 | – | – | 0.320 |
| DCL (Li et al., 2023b) | Li et al. | 2023 | 0.471 | 0.352 | 0.373 |
| M2KT (Yang et al., 2023) | Yang et al. | 2023 | 0.420 | 0.339 | 0.352 |
| KiUT (Huang, Zhang & Zhang, 2023) | Huang et al. | 2023 | 0.371 | 0.318 | 0.321 |
| ORGAN (Hou et al., 2023b) | Hou et al. | 2023 | 0.416 | 0.418 | 0.385 |
| METransformer (Wang et al., 2023e) | Wang et al. | 2023 | 0.364 | 0.309 | 0.311 |
| RECAP (Hou et al., 2023a) | Hou et al. | 2023 | 0.389 | 0.443 | 0.393 |
| CvT-212DistilGPT2 (Nicolson, Dowling & Koopman, 2023) | Nicolson et al. | 2023 | 0.367 | 0.418 | 0.391 |
| R2GenGPT (Wang et al., 2023f) | Wang et al. | 2023 | 0.392 | 0.387 | 0.389 |
| RAMT (Zhang et al., 2023b) | Zhang et al. | 2023 | 0.380 | 0.342 | 0.335 |
| FMVP (Liu et al., 2023) | Liu et al. | 2023 | 0.855 | 0.730 | 0.773 |
| TIMER (Wu, Huang & Huang, 2023) | Wu et al. | 2023 | – | – | 0.759 |
| Serra et al. (2023) | Dalla Serra et al. | 2023 | 0.597 | 0.516 | 0.553 |
| Zhu et al. (2023b) | Zhu et al. | 2023 | 0.538 | 0.434 | 0.480 |
| PromptMRG (Jin et al., 2024) | Jin et al. | 2024 | 0.501 | 0.509 | 0.476 |
| CAMANet (Wang et al., 2024a) | Wang et al. | 2024 | 0.483 | 0.323 | 0.387 |
| Med-PaLM M (Tu et al., 2024) | Tu et al. | 2024 | – | – | 0.398 |
| TranSQ (Gao et al., 2024) | Gao et al. | 2024 | 0.482 | 0.563 | 0.519 |
| TSGET (Yi et al., 2024) | Yi et al. | 2024 | 0.319 | 0.509 | 0.393 |
| MINIGPT-4+I3+C2FD (Liu et al., 2024b) | Liu et al. | 2024 | 0.465 | 0.482 | 0.473 |
| DTrace (Ye et al., 2024) | Ye et al. | 2024 | 0.411 | 0.436 | 0.391 |
| Liu et al. (2024a) | Liu et al. | 2024 | 0.457 | 0.337 | 0.330 |
| MedCycle (Hirsch, Dawidowicz & Tal, 2024) | Hirsch et al. | 2024 | 0.237 | 0.197 | 0.183 |
| DMVF (Tang et al., 2024) | Tang et al. | 2024 | 0.451 | 0.386 | 0.413 |
| LACCOL (Liu et al., 2025) | Liu et al. | 2025 | 0.384 | 0.376 | 0.304 |
| DACG (Lang, Liu & Zhang, 2025) | Lang et al. | 2025 | 0.422 | 0.405 | 0.389 |
| AM-MRG (Wang et al., 2025) | Wang et al. | 2025 | 0.555 | 0.429 | 0.484 |
| Li et al. (2025b) | Li et al. | 2025 | 0.405 | 0.469 | 0.431 |
| Flamingo-CXR (Tanno et al., 2025) | Tanno et al. | 2025 | – | – | 0.519 |
Note:
All values are taken from the original article. The best result is in bold, the second-best result is underlined. A dash (–) indicates a metric that the model did not evaluate. The table is grouped by year.
COV-CTR
The COV-CTR (COVID-19 CT Report) dataset is a public dataset specifically designed for COVID-19 lung CT image analysis and Chinese radiology report generation. It consists of two primary components: 728 CT images, collected by Yang et al. (2020b) during the COVID-19 pandemic (349 COVID-19 cases and 379 non-COVID cases), and Chinese diagnostic reports, constructed by Li et al. (2023c), which include Findings and Impressions sections. To enhance clinical interpretability, radiologists have annotated abnormal terms and highlighted key areas within the reports. However, it is important to note that the dataset only contains binary labels (COVID-19 and Non-COVID) and does not include annotations for other pulmonary diseases.
We have identified nine relevant studies utilizing COV-CTR, with Table 9 summarizing their key findings. Among them, Wang et al. (2021) explicitly quantified the inherent visual-text uncertainty in multimodal radiology report generation at both the report level and sentence level. To address this challenge, they proposed a Sentence Matched Adjusted Semantic Similarity (SMAS) method, which provided a more precise measurement of semantic similarity between radiology reports. This approach achieved SOTA performance on COV-CTR. However, while their model effectively captured visual-text uncertainty at the report level, it did not explicitly map sentence-level uncertainty to specific uncertain regions in the image. Addressing this limitation could further enhance model performance. Moreover, Clinical-BERT, proposed by Yan & Pei (2022), also demonstrated strong results and achieved the second-highest scores across multiple evaluation metrics. Their approach represented the first attempt to incorporate domain-specific knowledge into pre-training for medical applications. Clinical-BERT introduced three domain-specific pre-training tasks: Clinical Diagnosis (CD), which performed multi-label classification for radiological findings; Masked MeSH Modeling (MMM), which predicted grid-based masked medical terms; and Image-MeSH Matching (IMM), which aligned image-text reports through sparse attention mechanisms. These pre-training objectives enabled better understanding of X-rays, significantly improving performance on downstream radiology tasks.
| Model/Method | Author | Year | BLEU | ROUGE | CIDEr | METEOR | Human evaluation | |||
|---|---|---|---|---|---|---|---|---|---|---|
| −1 | −2 | −3 | −4 | |||||||
| Wang et al. (2021) | Wang et al. | 2021 | 0.810 | 0.766 | 0.721 | 0.679 | 0.790 | 2.371 | – | – |
| Clinical-BERT (Yan & Pei, 2022) | Yan et al. | 2022 | 0.759 | 0.713 | 0.675 | 0.641 | 0.737 | 1.218 | – | – |
| ASGK (Li et al., 2023c) | Li et al. | 2022 | 0.712 | 0.659 | 0.611 | 0.570 | 0.746 | 0.684 | – | √ |
| ICT (Zhang et al., 2023a) | Zhang et al. | 2023 | 0.768 | 0.692 | 0.629 | 0.577 | 0.716 | – | 0.423 | – |
| SA3RT (Song et al., 2024) | Song et al. | 2024 | 0.703 | 0.644 | 0.601 | 0.566 | 0.691 | – | 0.419 | – |
| HDGAN (Zhang et al., 2024a) | Zhang et al. | 2024 | 0.765 | 0.705 | 0.656 | 0.617 | 0.758 | – | 0.442 | √ |
| MDAKF (Tan et al., 2024) | Tan et al. | 2024 | 0.726 | 0.651 | 0.583 | 0.539 | 0.683 | 1.354 | 0.401 | – |
| Wang et al. (2024d) | Wang et al. | 2024 | 0.753 | 0.680 | 0.620 | 0.569 | 0.730 | – | 0.437 | √ |
| MicarVLMoE (Izhar et al., 2025) | Izhar et al. | 2025 | 0.744 | 0.662 | 0.599 | 0.545 | 0.692 | – | 0.690 | – |
Note:
All values are taken from the original article. The best result is in bold, the second-best result is underlined. A dash (–) indicates a metric that the model did not evaluate. The table is grouped by year.
To further uncover research trends and patterns in the AMRG field, we analyzed the frequency of application of different methodologies across several major datasets, as shown in Table 10. A quantitative visualization of this distribution (Fig. 10), presented in the form of a heat map or stacked bar chart, revealing the applicability and popularity of different technical paradigms across different data sizes and types. The results indicate that the smaller but classic IU-Xray dataset has attracted the most diverse methodological research, ranging from early CNN-RNN models to the latest LLM, making it an ideal platform for testing new ideas. In contrast, the large-scale MIMIC-CXR dataset is a clear battleground for Transformer-based models, thanks to their requirement for massive amounts of data for effective training. Transformer-based methods dominate across all datasets, especially on large datasets like MIMIC-CXR, confirming their status as the current SOTA paradigm. Although LLM-based methods are still relatively few in number, they have been applied to all major datasets, demonstrating that this is a rapidly emerging research direction with great potential. Rule-driven methods have the fewest applications, primarily concentrated in early research or as part of hybrid models, reflecting their decline from mainstream practice in the era of end-to-end deep learning.
| Dataset | CNN-RNN | Transformer | LLM | Rule-driven | Total |
|---|---|---|---|---|---|
| IU-Xray | 27 | 55 | 12 | 7 | 101 |
| MIMIC-CXR | 11 | 51 | 13 | 3 | 78 |
| PEIR Gross | 5 | 2 | 3 | 0 | 10 |
| ROCO | 1 | 2 | 2 | 0 | 5 |
| COV-CTR | 2 | 6 | 1 | 0 | 9 |
| CX-CHR | 1 | 1 | 1 | 3 | 6 |
Note:
The data highlights a clear trend: Transformer-based models dominate across datasets, particularly large ones like MIMIC-CXR. LLMs are a rapidly emerging direction, while rule-driven methods are sparsely used.
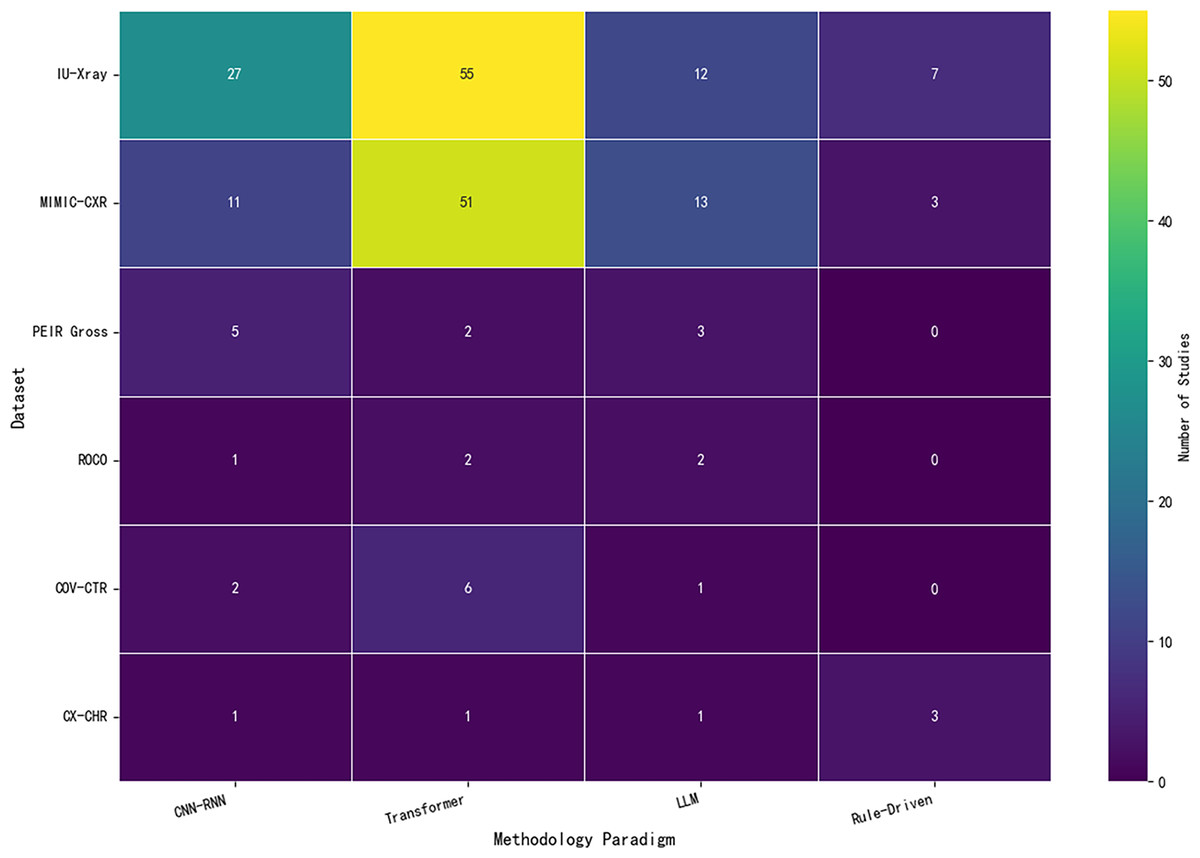
Figure 10: A heatmap visualization of the application frequency of different methodologies on several mainstream datasets.
The brighter the cell, the more research has been done on that method on that dataset.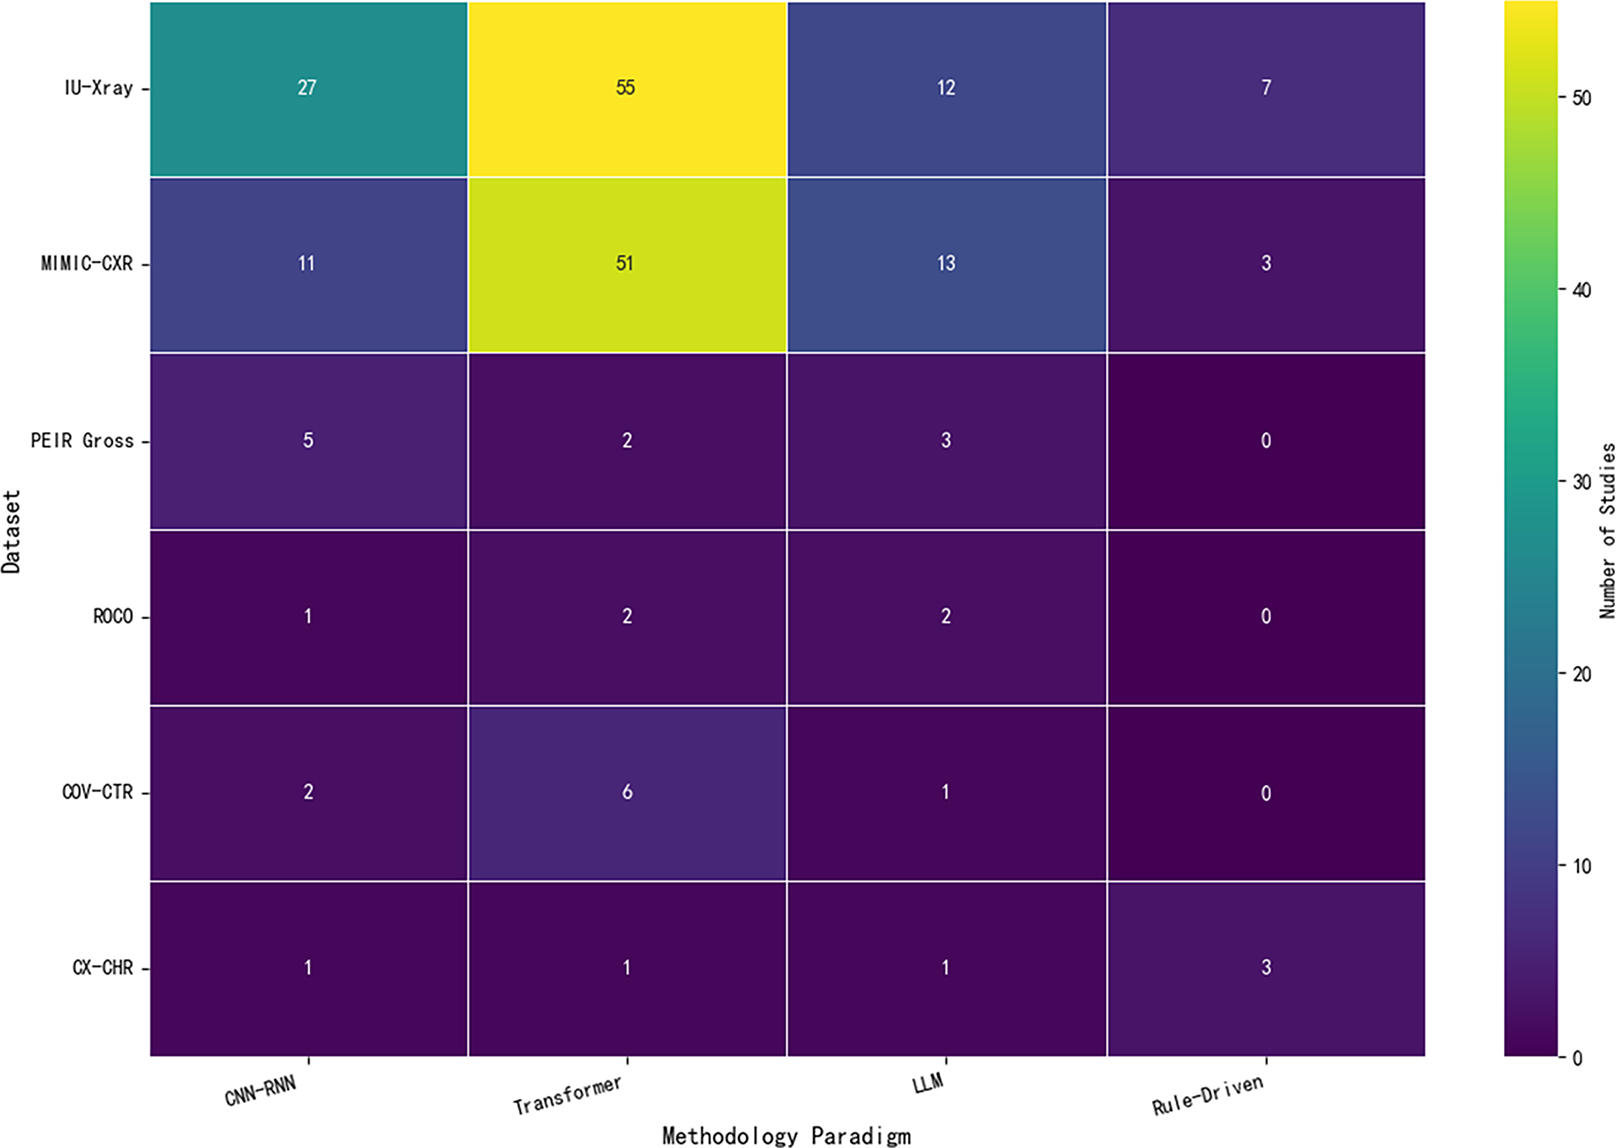
Other datasets
Beyond the fundamental role of benchmark datasets in AMRG research, the construction and utilization of diverse and multidimensional datasets hold irreplaceable strategic value in advancing this field. While benchmark datasets provide a standardized platform for the initial validation of algorithmic models, they possess inherent limitations such as single-modality data, restricted case diversity, and idealized clinical settings. Consequently, models trained solely on these datasets often struggle to adapt to the complexities of real-world medical environments. To overcome these limitations, the development of dedicated datasets tailored to specific clinical needs, technical challenges, and application scenarios has become increasingly crucial. These specialized datasets not only complement benchmark datasets but also drive medical image report generation technology toward greater clinical applicability. In this section, we introduce several additional datasets and explore their potential applications in AMRG tasks. Further details can be found in Table 11.
| Dataset | Author | Year | Data type | Patients | Availability |
|---|---|---|---|---|---|
| INbreast dataset (Moreira et al., 2012) | Moreira et al. | 2011 | X-ray | 115 | https://www.kaggle.com/datasets/ramanathansp20/INbreast-dataset |
| ChestX-ray14 (Wang et al., 2017) | Wang et al. | 2017 | X-ray | 30,805 | https://nihcc.app.box.com/v/ChestXray-NIHCC |
| lumbar spine (Han et al., 2018) | Han et al. | 2018 | MRI | 253 | – |
| Chexpert (Irvin et al., 2019) | Irvin et al. | 2019 | X-ray | 65,240 | https://stanfordmlgroup.github.io/competitions/chexpert |
| PadChest (Bustos et al., 2020) | Bustos et al. | 2020 | X-ray | 67,000 | https://bimcv.cipf.es/bimcv-projects/padchest/ |
| Gallbladder/Kindey/Liver (Zeng et al., 2020) | Zeng et al. | 2020 | Ultrasound | 25,659 | – |
| FFA-IR (Li et al., 2021) | Li et al. | 2021 | FFA | – | https://physionet.org/content/ffa-ir-medical-report/1.0.0/ |
| GE (Cao et al., 2023) | – | 2023 | White Light | 3,168 | – |
| Ophthalmic dataset (Wang et al., 2024b) | Wang et al. | 2024 | Ultrasound | 2,417 | – |
| CT-RATE (Hamamci et al., 2024) | Hamamci et al. | 2024 | CT | 21,304 | https://huggingface.co/datasets/ibrahimhamamci/CT-RATE |
| Breast/Thyroid/Liver (Li et al., 2024) | Li et al. | 2024 | Ultrasound | 3,521/2,474/1,395 | https://lijunrio.github.io/Ultrasound-Report-Generation/ |
| HiSBreast dataset (Luong, Nguyen & Thai-Nghe, 2024) | Luong et al. | 2024 | Ultrasound | 972 | https://doi.org/10.17632/5c723rpwz2.1 |
| 3D-BRAINCT (Li et al., 2025a) | Li et al. | 2025 | 3DCT | 9,689 | Email: [email protected] |
| MM-Retinal (Wu et al., 2025) | Wu et al. | 2025 | FFA/CFP/OCT | 2,169/1,947/233 | https://github.com/lxirich/MM-Retinal |
INbreast dataset (Moreira et al., 2012): The INbreast dataset is a publicly available medical imaging dataset designed for breast cancer detection and diagnosis. It was collected at the Centro Hospitalar de São João (CHSJ) Breast Centre in Porto, Portugal, with approval from the Portuguese National Data Protection Commission and the Hospital Ethics Committee. The dataset is specifically tailored for mammography research and comprises 115 cases, including 90 female patients with both breasts affected and 25 patients who had undergone unilateral mastectomy. In total, the dataset contains 410 full-field digital mammography (FFDM) images depicting various types of breast lesions. Unlike digitized mammograms, FFDM images offer higher image quality and variability, making this dataset an invaluable resource for computer-aided breast cancer diagnosis. Additionally, precise annotations are provided for further research applications.
ChestX-ray14 (Wang et al., 2017): The ChestX-ray14 dataset is an extended version of ChestX-ray8, which is released by the National Institutes of Health (NIH). ChestX-ray8 contains 108,948 X-ray images (eight chest diseases) from 32,717 patients, and ChestX-ray14 further increases the disease types and sample size with a collection of 112,120 X-ray images including 14 chest diseases (atelectasis, consolidation, infiltration, pneumothorax, edema, emphysema, fibrosis, effusion, pneumonia, pleural thickening, cardiac hypertrophy, nodules, swelling, and hernia) from 30,805 patients. Each X-ray image is assigned with the corresponding disease label, and the labels are annotated by professional radiologists based on the results of medical imaging diagnosis. The purpose of this dataset is to enable the data-hungry deep neural network paradigm to create clinically meaningful applications, including common disease pattern mining, disease correlation analysis, automatic radiology report generation, etc.
Lumbar spine (Han et al., 2018): The lumbar spine dataset consists of MRI scan images of 253 clinical patients (147 females and 106 males). Han et al. (2018) constructed this dataset and applied it to the AMRG task, attempting to automatically generate unified reports of lumbar spine MRI in the field of radiology to support clinical decision-making. They combined deep learning and symbolic program synthesis theory to build a weakly supervised framework, and the generated reports covered almost all types of lumbar structures, including six intervertebral discs, six neural foramina, and five lumbar vertebrae. Unfortunately, the dataset is not public, and the work has not published the code and ablation experiments, which poses a challenge to in-depth research.
CheXpert (Irvin et al., 2019): CheXpert is a large chest X-ray image dataset released by Stanford University, which contains 224,316 chest X-ray images of 65,240 patients. Each image is accurately annotated and covers 14 different disease categories. It is worth noting that the annotation of this dataset was performed by professional radiologists, ensuring the diagnostic accuracy of the labeled data. In addition, Irvin et al. (2019) designed a labeler to automatically detect the presence of 14 observations in radiology reports and capture the inherent uncertainty in the interpretation of X-rays. As described in ‘Clinical Efficacy (CE)’, the proposed tagger brings CE evaluation to the AMRG field.
PadChest (Bustos et al., 2020): PadChest is a labeled, large-scale, high-resolution chest X-ray dataset for automatic exploration of medical images and their associated reports. Bustos et al. (2020) collected over 160,000 images of 67,000 patients, interpreted and reported by radiologists at Hospital San Juan between 2009 and 2017. It covers six different positional views as well as additional information about image acquisition and patient demographics. Among them, 27% of the reports were annotated manually by expert doctors, while the rest were performed using a supervised method based on recurrent neural networks. It is worth noting that these reports are in Spanish. For the AMGR field, training datasets with different languages is beneficial and challenging for the generalization ability of the model. Our investigation revealed that despite the public availability of the dataset, it has seen limited adoption in research with unclear patterns of implementation across studies. However, it is undeniable that PadChest is an indispensable and important resource in the AMRG field.
Gallbladder/Kidney/Liver (Zeng et al., 2020): Zeng et al. (2020) collaborated with a hospital in Chongqing, China, to collect ultrasound images of clinical examinations from 2014 to 2015. The original dataset contained ultrasound images and reports of 25,659 patients, with each patient providing one ultrasound image and the corresponding report. The images contain three organs (gallbladder, kidney, liver) and 11 diseases (gallbladder stone, gallbladder polyp, normal gallbladder, hydronephrosis, kidney stone, renal cysts, normal kidney, liver cyst, fatty liver, hemangioma, normal liver). They applied the ultrasound dataset to a semantic fusion network (SFNet) consisting of a lesion region detection model and a diagnosis generation model to automatically generate ultrasound reports and achieved SOTA results. The model used a target detection algorithm to automatically separate lesion and background areas in medical images, then utilized the isolated lesion regions to derive coding vectors and pathological information. This approach ensured that the coding vectors contained enriched lesion data, resulting in more accurate pathological information in generated diagnostic reports. Notably, the pathological information of the generated report is extracted through keyword matching (similar to BLEU as a post-processing step), which causes the generated pathological information to be different from the actual pathological information and cannot be used for parameter optimization.
FFA-IR (Li et al., 2021): FFA-IR (Fundus Fluorescein Angiography Images and Reports) is a medical image dataset for fundus lesion research that focuses on the automated diagnosis and report generation of retinal vascular lesions. Unlike traditional fundus photographs, FFA images can visualize the flow and abnormalities of retinal blood vessels in detail by injecting fluorescein dye, which helps to identify fundus lesions such as diabetic retinopathy and macular degeneration. The FFA-IR dataset contains 10,790 bilingual Chinese-English reports and 1,048,584 FFA images from clinical practice, including interpretable annotations based on schemas of 46 lesion categories. Along with the dataset, a set of nine human evaluation criteria are proposed to assess the quality of generated reports and study the reliability of natural language generation metrics in the medical field.
GE (Cao et al., 2023): Gastrointestinal Endoscope image dataset (GE) is a private dataset containing white light images of 3,168 patients from the Department of Gastroenterology and their Chinese reports. The dataset provides multiple gastrointestinal endoscopic images per patient, acquired from different perspectives, along with their associated medical reports. Cao et al. (2023) obtained 15,345 images and 3,069 reports collected from the dataset by selecting patients with five images and collected 126 medical terminologies from gastroenterologists, including 89 abnormal findings and 37 normal findings. They constructed a Multi-modal Memory Transformer Network (MMTN), which leveraged the cross-modal complementarity of multimodal medical features to weigh the contributions of visual and language features and generated medical reports that are consistent with image reports. This method achieved advanced results and has provided directions and ideas for future research.
Ophthalmic dataset (Wang et al., 2024b): The Ophthalmic Dataset is a labeled ophthalmology dataset containing 4,858 ultrasound images of 2,417 patients and their corresponding text reports that describe the imaging manifestations and corresponding anatomical locations of 15 typical intraocular diseases. Each image shows three blood flow indices of three specific arteries, providing nine parameter values to describe the spectral characteristics of blood flow distribution. In Wang et al. (2024b), this dataset was also used to evaluate cross-modal medical report generation models, including R2Gen (Chen et al., 2020) and CMN (Chen et al., 2022) models. The authors demonstrated the effectiveness of this dataset for medical report generation through visualization and other methods. Their findings also suggested that the dataset could contribute to the development of automatic diagnostic learning algorithms in the field of ophthalmology, thus reducing the pressure on ophthalmologists in clinical work.
CT-RATE (Hamamci et al., 2024): CT-RATE is the first dataset that pairs 3D medical images with their corresponding text reports. The dataset includes 25,692 non-contrast 3D chest CT scans from 21,304 unique patients. Through various reconstructions, these scans have been expanded to 50,188 volumes, totaling more than 14.3 million 2D slices. Each scan is matched with its corresponding radiology report. The construction of CT-RATE represents a major advancement in the generation of 3D medical image reports and plays a pioneering role in research in the AMRG field.
Breast/Thyroid/Liver (Li et al., 2024): Li et al. (2024) constructed three large-scale ultrasound image text datasets from different organs: a breast dataset comprising 3,521 patients, a thyroid dataset with 2,474 patients, and a liver dataset containing 1,395 patients. Each set of ultrasound images is associated with a report. For ultrasound report generation, they proposed a framework that used an unsupervised learning method to extract latent knowledge from ultrasound text reports. This information serves as prior information to guide the model for aligning visual and text features, thereby addressing the challenge of feature differences.
HiSBreast dataset (Luong, Nguyen & Thai-Nghe, 2024): The HiSBreast dataset was collected using HiS software at Ca Mau Provincial General Hospital, Vietnam, by VNPT Group. It contains breast ultrasound images of 972 hospitalized patients who underwent breast ultrasound between 2018 and 2022. Each sample includes an ultrasound image and a description of the disease symptoms based on the image, as well as the clinical diagnosis. Luong, Nguyen & Thai-Nghe (2024) utilized this dataset alongside the INbreast Dataset for constructing a breast cancer image caption generator, and the generator achieved impressive results.
3D-BRAINCT (Li et al., 2025a): The 3D-BrainCT dataset comprises 18,885 brain CT scans (742,501 slices) and paired text-scan records from 9,689 patients. It encompasses a wide spectrum of cases, including normal brain anatomy, chronic conditions, previous infarcts with residual manifestations, and acute brain lesions. The associated reports provide detailed information regarding lesion degree, spatial landmark, visual features, and final impression, making the dataset highly valuable for fine-grained diagnostic reasoning and generation tasks. The CT images include a variety of common neurology conditions affecting the skull, brain parenchyma, nasal sinuses, and the eye, increasing its generalizability to real-world clinical scenarios.
MM-Retinal (Wu et al., 2025): The MM-Retinal dataset is a multi-modal retinal imaging dataset that includes 2,169 color fundus photography (CFP) cases, 1,947 fundus fluorescein angiography (FFA) cases, and 233 optical coherence tomography (OCT) cases. Each case is provided with an image and texts in both English and Chinese. Upon MM-Retinal, MM-Retinal V2 consists of 6,720 CFP cases, 5,119 FFA cases, and 5,502 OCT cases, and covers over 96 fundus diseases and abnormalities. The MM-Retinal V2 dataset is further enriched with a text-only subset, containing a total of 452K utterances, providing a substantial repository of textual information for multimodal retinal disease analysis and report generation. Izhar et al. (2025) used the MM-Retinal dataset to explore report generation in retinal imaging, which is another step forward in the expansion of AMRG research from chest radiographs to multimodality.
A critical discussion of dataset biases and limitations
Although benchmark datasets have significantly advanced the field of AMRG, a critical examination of them reveals several underlying biases and limitations that not only affect the performance evaluation of current models but also potentially hinder the translation of technology to real-world clinical settings.
The current AMRG research landscape suffers from significant modality bias. Most of the large, high-impact benchmark datasets analyzed in this review, such as IU-Xray, MIMIC-CXR, and CX-CHR, consist entirely of chest X-rays (CXRs). While CXRs are one of the most common imaging examinations, this overrepresentation leads to the following issues: First, the vast majority of SOTA models are trained and optimized on CXRs, leaving a significant uncertainty regarding their ability to generalize directly to modalities such as CT, MRI, or ultrasound, which have fundamentally different characteristics (e.g., 3D data and varying tissue contrast). Second, the homogeneity of datasets has led to a convergence of research directions, resulting in a relative lag in research on report generation for other equally important imaging modalities. This overrepresentation is not merely anecdotal; of the 146 studies included in this review, our own analysis (summarized in Fig. 10) confirms that studies utilizing the IU-Xray and MIMIC-CXR datasets account for the overwhelming majority of published research, starkly illustrating this modality bias.
The “gold standard” for the AMRG task, which is normally radiologist-written reports, is inherently rife with variability. Different doctors vary in their reporting styles, terminology, and level of detail, which introduces label noise into model training. In the PadChest dataset, some reports are manually annotated, while others are generated using supervised methods, which can introduce systematic label inconsistencies. This noise makes it difficult for the model to learn a stable and reliable image-text mapping and can affect the reliability of evaluation results.
Currently, the vast majority of research studies train and test models on internal partitions of a single dataset. While this practice is standard in academia, it cannot guarantee model performance on external data. A model that performs well on data from Hospital A may experience a sharp decline in performance when tested on data from Hospital B (which may use equipment from a different manufacturer, have different scanning protocols, or serve a different patient population). This widespread lack of external validation is one of the key gaps between current AMRG research and actual clinical deployment.
This review also covers several high-quality but private datasets, such as CX-CHR, lumbar spine, and GE. While these datasets have advanced research in specific areas, their closed nature poses an obstacle to the long-term development of the field as a whole. First, reliance on proprietary data fundamentally undermines research reproducibility, a cornerstone of the scientific method. When a SOTA result is produced on a dataset that is not publicly accessible, independent third-party verification becomes impossible. This makes it impossible for the academic community to confirm the robustness of the result or accurately determine whether its success stems from genuine algorithmic innovation or simply exploits undisclosed features of a specific dataset. Second, closed datasets hinder fair and standardized benchmarking. Progress in the AMRG field relies on new models consistently competing against the best existing models. If the leading baseline is established on a closed dataset, subsequent innovators cannot directly compare their performance. This not only makes it difficult to assess the true value of new technologies but also can lead to a waste of research resources, as researchers may reinvent themselves on problems that have already been solved. Finally, this practice creates research silos, slowing the collective pace of innovation across the field. Scientific progress is a collaborative and cumulative process that relies on the free flow of ideas and tools. When critical data resources are locked within a few institutions, the chain of shared knowledge is broken. This stands in stark contrast to the open science ethos championed by large public benchmarks like MIMIC-CXR, which have greatly accelerated the pace of innovation across the field by providing open, accessible resources. Therefore, while private datasets have value in exploring specific questions, they pose a significant constraint to the long-term health of the scientific community.
To promote healthier and faster development in the AMRG field, future research requires not only algorithmic innovations but also concerted efforts to build more diverse, high-quality, externally validated, and openly shared datasets.
Conclusion
AMRG has emerged as a crucial research direction at the intersection of AI and medical imaging, making remarkable advancements in recent years. With the continuous innovation of deep learning technologies, particularly the introduction of Transformer-based architectures, the accuracy, fluency, and professionalism of generated medical reports have significantly improved. As image-based feature extraction, natural language generation, and cross-modal models continue to evolve, AMRG not only enhances clinical efficiency but also assists physicians in extracting valuable diagnostic insights from medical images. This review provides a comprehensive survey of recent AMRG research and covers three key aspects: methodologies, evaluation metrics, and datasets with their applications.
Methodology: This review systematically examines two main approaches—rule-driven methods and end-to-end generative methods. End-to-end generative methods are currently the most widely adopted methods, among which LLM adaptation represents a promising future direction. Evaluation metrics: A comprehensive overview of the most widely used evaluation indicators in AMRG is provided, with detailed discussion of their underlying principles, typical applications, and limitations in capturing clinical accuracy. Datasets and Applications: In addition to widely used benchmark datasets such as IU-Xray and MIMIC-CXR, this review also highlights less frequently utilized datasets, including both public and private sources. Based on these datasets, we conduct a comprehensive analysis covering studies from 2018 to 2025, aiming to increase their visibility and broaden AMRG research perspectives.
Despite significant progress in the AMRG field, several key challenges remain to be addressed for true clinical application. Based on the gaps revealed in this review, several potential research avenues may be considered. First, developing clinically oriented and fine-grained evaluation metrics could be a valuable avenue. This review found that currently widely used NLG metrics are ineffective in assessing the clinical accuracy of reports. While CE metrics have improved, their coverage, such as CheXpert, is limited to 14 chest findings. Future work may move beyond simple label matching, with a promising direction as development of evaluation metrics based on knowledge graphs and entity relationships. The use of assessment tools such as RadGraph may lead to more effective clinical accuracy, as parsing both generated and reference reports into entity-relationship graphs allows a more fine-grained assessment of clinical facts by comparing the consistency of these two graphs across nodes, attributes, and relationships. Second, improving model interpretability and clinical trustworthiness is another promising direction. Current methods, such as attention heatmaps, can show where a model is looking but rarely explain why it says what it says. Research could shift from visual interpretability to causal interpretability, grounding generated text to specific pixel regions. For example, when a model generates “a 5 mm nodule is visible in the right upper lobe of the lung,” the system would ideally simultaneously highlight the nodule’s precise location. This requires exploring more advanced multimodal alignment techniques, potentially going beyond standard attention mechanisms. Third, our analysis indicates that existing research is heavily focused on chest X-rays. There is an urgent need to construct large-scale, publicly available datasets encompassing multiple modalities, such as CT, MRI, and ultrasound, as well as multiple organs, such as the abdomen, brain, and breast. Recent 3D datasets such as CT-RATE and 3D-BrainCT are a good start, but further expansion is needed. Research by Dalla Serra et al. (2022) has demonstrated that comparative analysis using historical patient images can significantly improve report quality. Therefore, a key future direction is to construct large, publicly available datasets containing imaging sequences from the same patient at different time points. This will provide a data foundation for research on disease progression modeling and the automated generation of follow-up reports. Furthermore, data privacy issues also limit the construction of large, diverse datasets, and exploring privacy-preserving computing technologies such as federated learning may provide a feasible approach to addressing data silos and privacy issues. Finally, noise and irrelevant information in medical reports can cause models to hallucinate, generating content inconsistent with the images (Ramesh, Chi & Rajpurkar, 2022). This is one of the greatest obstacles to the clinical application of AMRG, particularly in LLM. A potential way forward is to move toward generation paradigms that are more strongly constrained by external knowledge sources. Some studies, such as those mentioned in this review, have incorporated large-scale medical knowledge graphs into the generation process, providing a factual basis for the model and constraining it from generating content that violates medical common sense.
The ultimate goal of AMRG systems is arguably their integration into the clinical environment. Radiologists’ work is heavily dependent on picture archiving and communication systems (PACS) and radiology information systems (RIS). Therefore, they prefer “interoperable reports” that are easy to review and modify. This requires a high degree of system interoperability and adherence to medical information standards such as DICOM and HL7. On the one hand, the introduction of any AI tool does not reduce radiologists’ productivity. The interface for reviewing and editing AI reports should be intuitive and efficient, at least faster than a physician dictating a report from scratch. Otherwise, this would defeat the purpose and render the technology clinically obsolete, deemed “nice to have but impractical.” On the other hand, the core goal of AMRG technology is to reduce clinician workload, provide decision support information, and improve patient experience, not to replace radiologists. In this new model of human-machine collaboration, the role of the radiologist will also shift. The AI system will provide the initial draft report, while the radiologists’ core responsibilities will shift to verifying, editing, revising, and ultimately signing the AI-generated content. However, diagnosis and legal responsibility will remain entirely with the human physician. This requires radiologists to not only have a solid foundation in medical knowledge but also the ability to identify potential AI errors, particularly those that present a smooth but untrue “illusion.” Furthermore, efficient human-machine interaction and feedback mechanisms are crucial so that the model can continuously learn and improve based on physician corrections.
In most countries, AI software used for assisted diagnosis is considered a medical device and must obtain regulatory approval. This is a lengthy and costly process, requiring extensive clinical validation data. Importantly, it is essential to robust quality assurance and risk control systems. When erroneous diagnostic information is detected, the system could require mandatory human secondary review to prevent incorrect diagnoses from being disseminated to the clinician. Overcoming these deployment challenges and realizing the clinical value of AMRG requires researchers to invest as much effort as developing the algorithm itself.