
MS-YOLO11: a multidimensional synergistic you only look once 11 algorithm for pulmonary nodule detection
- Published
- Accepted
- Received
- Academic Editor
- Mehmet Cunkas
- Subject Areas
- Algorithms and Analysis of Algorithms, Artificial Intelligence, Computer Vision, Visual Analytics, Neural Networks
- Keywords
- Pulmonary nodules, Small target detection, Multidimensional collaborative attention, Synergistic multi attention transformer, YOLO11
- Copyright
- © 2026 Yin et al.
- Licence
- This is an open access article distributed under the terms of the Creative Commons Attribution License, which permits unrestricted use, distribution, reproduction and adaptation in any medium and for any purpose provided that it is properly attributed. For attribution, the original author(s), title, publication source (PeerJ Computer Science) and either DOI or URL of the article must be cited.
- Cite this article
- 2026. MS-YOLO11: a multidimensional synergistic you only look once 11 algorithm for pulmonary nodule detection. PeerJ Computer Science 12:e3473 https://doi.org/10.7717/peerj-cs.3473
Abstract
Objective
To address the misdiagnosis problem of pulmonary nodules caused by complex background interference, difficulty in detecting small targets, and morphological diversity in computed tomography (CT) imaging diagnosis, this study proposes an improved deep learning algorithm model to improve the detection accuracy and robustness of pulmonary nodules.
Method
Based on the You Only Look Once (YOLO)11 framework, the Multidimensional Collaborative Attention (MCA) method and the Synergistic Multi Attention Transformer (SMAT) method were combined to construct a novel model, Multidimensional Synergistic YOLO11 (MS-YOLO11). MCA dynamically enhances the representation of key features by applying attention mechanisms along the channel, height, and width dimensions. At the same time, SMAT combines pixel, channel, and spatial multi-attention mechanisms to optimize global and local feature interaction. This experiment is based on the 2016 Lung Nodal Analysis dataset (LUNA16) and evaluates the performance of the new model on segmentation and non-segmentation lung parenchyma data through ablation experiments and comparative experiments. This study mainly compared three indicators: average precision of small target (APsmall), average recall rate of small target (ARsmall), and mean average precision (mAP50) to further verify the performance of the new model.
Result
The mAP50 of MS-YOLO11 on the dataset without segmented lung parenchyma was 83.66%, which was 4.14 percentage points higher than the baseline YOLO11 (79.52%). In small object detection, APsmall increased from 34.89% to 37.88% (+2.99%), and ARsmall increased from 46.25% to 50.74% (+4.49%). Compared to traditional models such as Single Shot MultiBox Detector (SSD) (49.07%) and Faster Region-based Convolutional Neural Network (Faster-R-CNN) (61.76%), MS-YOLO11 achieved significantly better mAP50 while maintaining a lightweight structure of only 9.35 MB. Moreover, even when compared to recent advanced models specifically designed for small object detection, MS-YOLO11 achieved superior results across all key metrics with a smaller size, highlighting its robustness. Experiments further showed that using the entire unsegmented lung parenchyma image data preserves complete nodule features and leads to optimal detection performance. The synergistic effect of the MCA and SMAT methods effectively mitigates background interference, improves the accuracy of small object detection, and enhances overall model robustness.
Introduction
Pulmonary nodules present complex diagnostic challenges in thoracic computed tomography (CT) due to their small size, irregular morphology, and variable contrast against surrounding anatomical structures. Accurate detection is particularly difficult for sub-centimeter nodules, which often exhibit low contrast and are easily confused with vessels, bronchi, or pleural tissues (Zhang et al., 2023). Although deep learning-based detectors such as Faster Region-based Convolutional Neural Network (R-CNN), Single Shot MultiBox Detector (SSD), and the You Only Look Once (YOLO) series have achieved remarkable progress in general object detection, their performance in pulmonary nodule detection remains limited by several domain-specific issues: (1) weak sensitivity to small targets, (2) suboptimal multi-scale feature fusion, and (3) insufficient suppression of anatomical background interference.
Current landscape of lung nodule detection
Recent studies have adapted YOLO-based and Transformer-based architectures to this task, yet persistent gaps remain. For example, BiPRN-YOLOvX (Han et al., 2023) enhanced multi-scale feature extraction through recursive pyramids, but its single-dimensional attention design constrained discriminative ability for small nodules adjacent to vascular structures. Similarly, YOLOv7 variants (Wu et al., 2024; Mammeri et al., 2024) improved feature representation but introduced higher false positives or dependency on pre-segmented lung regions, risking the omission of pleural-edge nodules. Multi-scale convolutional neural network (CNN) frameworks such as Lung-RetinaNet (Mahum & Al-Salman, 2023) and STBi-YOLO (Liu, 2022) attempted to localize sub-centimeter lesions, yet their fixed receptive fields limited adaptability to morphological diversity. Transformer-based detectors, including Swin Transformer 3D (Zhang et al., 2025) and LN-DETR (Tang et al., 2025c), modeled global context across CT volumes but often compromised local texture details crucial for edge and margin discrimination.
Limitations of existing strategies
Attention mechanisms have been widely integrated to suppress irrelevant backgrounds; however, traditional methods such as SE and CBAM (Hu, Shen & Sun, 2018; Woo et al., 2018) remain constrained to single-dimensional operations (channel or spatial), hindering multi-aspect feature modeling. Deformable or coordinate attention extensions (Ji et al., 2024; Liu & Ao, 2024) enhance structural adaptability but still fail to capture the interdependence between channel, spatial, and contextual cues. Segmentation-based preprocessing methods, though effective in reducing background noise, may truncate juxtapleural nodules or introduce boundary artifacts (Mammeri et al., 2024; Zamanidoost, Ould-Bachir & Martel, 2024). Conversely, segmentation-free strategies preserve complete contextual information but require more advanced attention mechanisms to mitigate interference from lung walls and vascular tissues (Fang et al., 2023). Consequently, an effective pulmonary nodule detector must not only emphasize multidimensional contextual cues but also maintain computational efficiency suitable for clinical deployment.
Motivation
These observations underscore the need for a unified framework that synergistically captures global and local semantics, enhances multi-scale adaptability, and dynamically integrates multidimensional attention. Existing models either emphasize long-range dependency at the expense of fine detail (as in pure Transformer-based designs) or strengthen local perception without sufficient contextual awareness (as in conventional CNNs). Therefore, a lightweight yet robust detection framework capable of balancing these complementary aspects is critical for reliable clinical use.
Our approach
To address these challenges, we propose Multidimensional Synergistic YOLO11 (MS-YOLO11), a novel detection framework that integrates two core methods:
Multidimensional Collaborative Attention (MCA) dynamically allocates attention across channel, height, and width dimensions, enhancing the contrast and continuity of small nodules (3–5 mm) and reinforcing structural cues such as spiculation and calcification (Yu et al., 2023).
Synergistic Multi-Attention Transformer (SMAT) combines global transformer-based attention with local E-MLP convolution to fuse long-range dependencies and fine-grained texture details, improving feature consistency across scales (Zheng et al., 2024).
Additionally, a direct detection strategy on unsegmented CT slices is adopted to preserve full contextual integrity and avoid information loss during preprocessing (Mammeri et al., 2024).
Contributions
The major contributions of this study are summarized as follows:
-
We propose MS-YOLO11, an efficient and robust pulmonary nodule detection framework that integrates MCA and SMAT within the YOLO11 architecture. MS-YOLO11 employs a Multidimensional Synergistic mechanism to adaptively fuse global and local features across spatial, channel, and contextual dimensions, thereby enhancing sensitivity to sub-centimeter nodules and reducing false positives in complex anatomical regions.
-
Based on the original LUNA16 dataset, we performed customized preprocessing and constructed two derived datasets: Luna16 Undivided (without lung parenchyma segmentation processing) and Luna16 Segmentation (with lung parenchyma segmentation processing). This dual-dataset design enables a systematic comparison of how segmentation influences nodule detection accuracy and the balance between global and local perception.
-
We conduct extensive experiments and ablation analyses demonstrating that MS-YOLO11 surpasses baseline and state-of-the-art detectors (YOLO series, SSD, Faster R-CNN, MSDet) in mAP50, APsmall, and ARsmall metrics while maintaining a compact model size of only 9.35 MB.
-
We further provide interpretability analysis through attention visualization and discuss clinical implications and generalizability, facilitating transparency and future extension to 3D and multi-center datasets.
Overall, MS-YOLO11 establishes a balance between accuracy, efficiency, and interpretability, offering a clinically practical solution for precise pulmonary nodule detection.
Related work
Recent advances in deep learning have greatly accelerated progress in pulmonary nodule detection. However, several persistent challenges—such as the localization of small targets, morphological variability, and interference from complex anatomical backgrounds—continue to limit robustness and clinical applicability.
YOLO-based and CNN frameworks
Many recent studies have sought to enhance feature extraction and multi-scale fusion within the YOLO family. For example, Han et al. (2023) proposed BiPRN-YOLOvX, which incorporates a bidirectional recursive pyramid to enhance multi-scale representations. Nevertheless, its reliance on single-dimensional attention mechanisms restricts its ability to differentiate small nodules from surrounding vessels. Similarly, Mammeri et al. (2024) combined YOLOv7 with transfer learning for nodule classification; however, its dependency on pre-segmented lung regions risks omitting juxtapleural nodules and degrades boundary integrity. Wu et al. (2024) introduced YOLOv7-SODL, which added a Small Object Detection Layer to strengthen low-contrast target representation but also increased false positives near bronchi. Tang et al. (2025a) proposed Circle-YOLO, an anchor-free detector employing bounding circle representations to preserve pleural-attached nodules, though it struggles to generalize to diffuse or irregular boundaries due to its geometric priors.
Multi-scale and context-aware CNNs
Efforts to improve small-nodule sensitivity have explored multi-scale and receptive-field augmentation. For instance, Mahum & Al-Salman (2023) introduced Lung-RetinaNet, which uses dilated convolutions for sub-centimeter nodules but sacrifices texture sensitivity. Liu (2022) developed STBi-YOLO with stochastic bidirectional pyramid pooling to improve shape adaptability, yet its fixed receptive field limits flexibility. Traditional FPN-based approaches also suffer from rigid feature fusion and insufficient contextual awareness.
Transformer-based approaches
To capture broader semantic dependencies, Transformer-based frameworks have been applied to CT imaging. Tang et al. (2025c) introduced LN-DETR, a 3D Detection Transformer that effectively models long-range relations but is vulnerable to slice-wise noise and unsegmented background artifacts. Hybrid CNN-Transformer designs such as Lin, She & Chen’s (2023) IR-UNet++ fuse convolutional and global attention methods but introduce segmentation-dependent artifacts and increased computational costs.
Attention and feature enhancement mechanisms
Attention-based strategies have been widely employed to suppress anatomical noise. Methods like SE (Hu, Shen & Sun, 2018) and CBAM (Woo et al., 2018) enhance channel or spatial selectivity, yet they remain single-dimensional and struggle to integrate diverse contextual cues. Deformable and coordinate attention variants (Ji et al., 2024; Liu & Ao, 2024) improve structural adaptability but still lack comprehensive channel–spatial synergy. Jian et al. (2025) proposed CSSANet to capture inter-slice correlations through channel shuffle operations, but its 3D computation cost restricts clinical deployment.
Segmentation-free vs. segmentation-based detection
Direct detection on unsegmented CT data retains peripheral context and pleural information (Fang et al., 2023), though it requires advanced attention methods to mitigate pleural line interference. In contrast, segmentation-based preprocessing (e.g., Zamanidoost, Ould-Bachir & Martel (2024), Mammeri et al. (2024)) effectively reduces background noise but risks masking juxtapleural nodules. Hence, balancing contextual completeness and interference suppression remains an open challenge.
MSDet: state-of-the-art multi-scale detection network
Recently, Cai et al. (2024) proposed MSDet, a multi-scale attention and receptive field network that integrates the Extended Receptive Domain (ERD) strategy, the Position Channel Attention Mechanism (PCAM), and the Tiny Object Detection Block (TODB) to strengthen the detection of sub-5 mm nodules. MSDet achieved outstanding results on LUNA16, reporting 97.3% mAP under high-end computational settings. However, when re-evaluated under a unified hardware and training configuration, its performance (78.17% mAP50) falls below both YOLO11 (79.52%) and the proposed MS-YOLO11 (83.66%). This discrepancy highlights MSDets sensitivity to computational constraints and emphasizes the robustness and adaptability of MS-YOLO11 under realistic deployment conditions.
Summary
These studies collectively reveal ongoing limitations in small-target sensitivity, morphological adaptability, and background suppression. To overcome these challenges, the proposed MS-YOLO11 integrates the Multidimensional Collaborative Attention (MCA) method and the Synergistic Multi-Attention Transformer (SMAT) within the YOLO11 architecture. This design enables dynamic multi-dimensional attention fusion across channel, spatial, and contextual domains, effectively bridging global–local perception and improving detection reliability in complex lung CT imagery.
A concise comparison of representative lung nodule detection methods is summarized in Table 1, highlighting differences in datasets, architectures, and design principles.
| Method | Year | Architecture type | Dataset | Main feature/Method | Limitation |
|---|---|---|---|---|---|
| BiPRN-YOLOvX (Han et al., 2023) | 2023 | YOLO-based CNN | LUNA16 | Bidirectional pyramid recursive network | Limited multidimensional attention |
| Lung-RetinaNet (Mahum & Al-Salman, 2023) | 2023 | Multi-scale CNN | LIDC-IDRI | Dilated convolution for sub-centimeter nodules | Low sensitivity to heterogeneous textures |
| STBi-YOLO (Liu, 2022) | 2022 | CNN + SPP | LUNA16 | Stochastic bidirectional pyramid pooling | Fixed receptive field |
| YOLOv7-SODL (Wu et al., 2024) | 2024 | YOLOv7 variant | LUNA16 | Small object detection layer (SODL) | High false positives due to bronchial interference |
| Circle-YOLO (Tang et al., 2025a) | 2025 | Anchor-free CNN | LUNA16 | Bounding circle representation for pleural nodules | Poor generalization to diffuse boundaries |
| LN-DETR (Tang et al., 2025c) | 2025 | Transformer-based | LUNA16/LIDC-IDRI | Detection Transformer for 3D localization | Sensitive to slice-wise noise in 2D data |
| MSDet (Cai et al., 2024) | 2024 | CNN + Attention hybrid | LUNA16 | Multi-scale attention, ERD, PCAM, TODB | Performance drop under limited computation |
| MS-YOLO11 (Ours) | 2025 | YOLO11 + MCA + SMAT | LUNA16 (2D slices) | Multidimensional and synergistic attention fusion | 2D only, lacks 3D contextual continuity |
Method
Sources and characteristics of public data
The LUNA16 dataset is the lung nodule dataset used in this article, sourced from the 2016 Lung Nodal Analysis competition. This dataset is based on the largest and publicly available lung nodule database LIDC-IDRI (Armato et al., 2009; Clark et al., 2013), provided by the Cancer Imaging Archive of the National Cancer Institute in the United States. It includes 1,018 chest CT scans from seven academic institutions, covering various scanning devices and parameters. Each CT scan is independently annotated in two stages, blind and non blind, by four chest radiologists. According to the recommendations of the pulmonary nodule management guidelines (Naidich et al., 2013; Kazerooni et al., 2014), researchers screened out scans with layer thickness greater than 3 mm and inconsistent or missing sections, and ultimately retained 888 images to form the LUNA16 dataset, which is provided in .mhd format and can be downloaded from the LUNA16 official website. This dataset includes pulmonary medical imaging data and corresponding textual annotation data. The images are stored in raw format and are accompanied by .mhd files that record CT acquisition parameters. The images consist of a series of 512 512 pixel tomographic slices. Annotate the file in CSV format to record the specific location and diameter information of nodules, providing standardized support for lung nodule detection and analysis; There is also an .mhd file corresponding to the raw image, which contains 13 fields and details the parameter information during acquisition, such as patient position, coordinate origin, pixel spacing, etc. These information are of great significance for data preprocessing and format conversion, helping to standardize images and improve analysis accuracy.
Data preprocessing
This study employed the publicly available LUNA16 dataset, a subset of the LIDC-IDRI database, which consists of 888 volumetric CT scans after standard exclusions. Each CT scan was decomposed into two-dimensional (2D) axial slices for object detection training, resulting in a total of 1,186 slices (512 512 pixels each) and their corresponding annotation files. In this study, the term CT scan refers to a complete three-dimensional volume, while image or slice denotes a single 2D axial slice extracted from the CT scan. All experiments were performed on these 2D slices, following the convention of previous LUNA16-based studies (Tang et al., 2025b, 2025a).
Before training the YOLO11 model, the original data were preprocessed to meet its input format requirements. YOLO11 uses a quadruple annotation format normalized to the [0,1] interval, representing the center coordinates of the bounding box and its width and height relative to the entire image. Therefore, the core of data preprocessing includes the conversion of annotation files and image data to construct standardized datasets compliant with the YOLO11 specification.
Annotation conversion
The original annotation data provided by LUNA16 are stored in .mhd files containing the spatial coordinates and sizes of lung nodules. Since CT images may have different orientations under varying scanning conditions, it is necessary to determine the image flipping direction by parsing the TransformMatrix field in the .mhd file and converting world coordinates into image coordinates accordingly. The normalized bounding box parameters are computed using Eq. (1):
(1) where W and H denote the image width and height, respectively, while and represent the center coordinates of the bounding box, and and its width and height. The normalized annotation information is stored in YOLO11 format as text files, where each 2D slice corresponds to an annotation file recording the target category and position parameters.
HU value processing
CT images store X-ray attenuation values in Hounsfield Units (HU), whose wide range can affect model convergence if used directly. Therefore, the HU range was clipped to [−1,000, 400] to retain important tissue information (from air to bone) and suppress irrelevant content. The HU value is calculated as follows Eq. (2):
(2) where is the linear attenuation coefficient of the tissue, and and are the attenuation coefficients of water and air, respectively. The processed grayscale slices were converted to RGB-format JPG images for compatibility with YOLO11, expanding the color channels to ensure correct visualization.
Segmentation comparison
To assess the influence of lung parenchyma segmentation on pulmonary nodule detection, a classical segmentation workflow was applied. The process begins with adaptive thresholding or Otsus method to extract lung regions (Otsu, 1979). A flood-fill algorithm is then employed to remove non-lung regions (Hu, Hoffman & Reinhardt, 2001), followed by contour detection and region filling to suppress small-area noise. Morphological closing operations further refine lung boundaries (Gonzalez, 2009; Serra, 1983). Finally, binary masks are used to extract the lung parenchyma. While this reduces background interference, it may exclude nodules near pleural edges or vessels, compromising detection completeness. Therefore, comparative experiments were conducted using datasets with and without segmentation, evaluated by APsmall, ARsmall, and mAP50 metrics.
Dataset construction
In the final stage of preprocessing, two datasets were constructed from the processed LUNA16 data: (1) Luna16 Undivided, which is directly derived from the original LUNA16 dataset after standard preprocessing but without lung parenchyma segmentation, thereby preserving the complete thoracic context including pleural and vascular structures; and (2) Luna16 Segmentation, which is constructed from the same preprocessed LUNA16 data but with additional lung parenchyma segmentation applied, isolating the lung regions through thresholding, flood filling, and morphological refinement to reduce background interference.
Both datasets contained identical 1,186 2D slices derived from 888 CT scans. To ensure robustness and reproducibility, a 10-fold cross-validation strategy was employed. Specifically, the slices were randomly partitioned into 10 equally sized folds, with each fold sequentially used as the validation subset while the remaining nine folds served as the training subset. Each slice is accompanied by its corresponding annotation file. This dual-dataset design enables a systematic comparison of how segmentation influences both global and local perception in pulmonary nodule detection.
A summary of dataset statistics is presented in Table 2, clarifying the correspondence between CT scans, 2D slices, annotation files, and the division of training and validation subsets under the 10-fold cross-validation scheme.
| Dataset | CT scans | 2D slices | Annotation files | Training slices per fold | Validation slices per fold |
|---|---|---|---|---|---|
| Luna16 undivided | 888 | 1,186 | 1,186 | 1,067 | 119 |
| Luna16 segmentation | 888 | 1,186 | 1,186 | 1,067 | 119 |
After this preprocessing step, two standardized 2D lung nodule detection datasets were established, fully compatible with the input requirements of YOLO11, providing a robust foundation for subsequent training, ablation, and comparative experiments.
Framework of MS-YOLO11
MS-YOLO11 is an improved model based on the YOLO11 framework, focusing on issues such as small target sensitivity, complex background interference, and morphological diversity in lung nodule detection. This model embeds MCA methods and SMAT methods in the multi-scale feature extraction and fusion stage to significantly improve detection accuracy.
Adaptation of new methods
MS-YOLO11 has undergone structural optimization in both the backbone and head sections. As shown in Fig. 1.
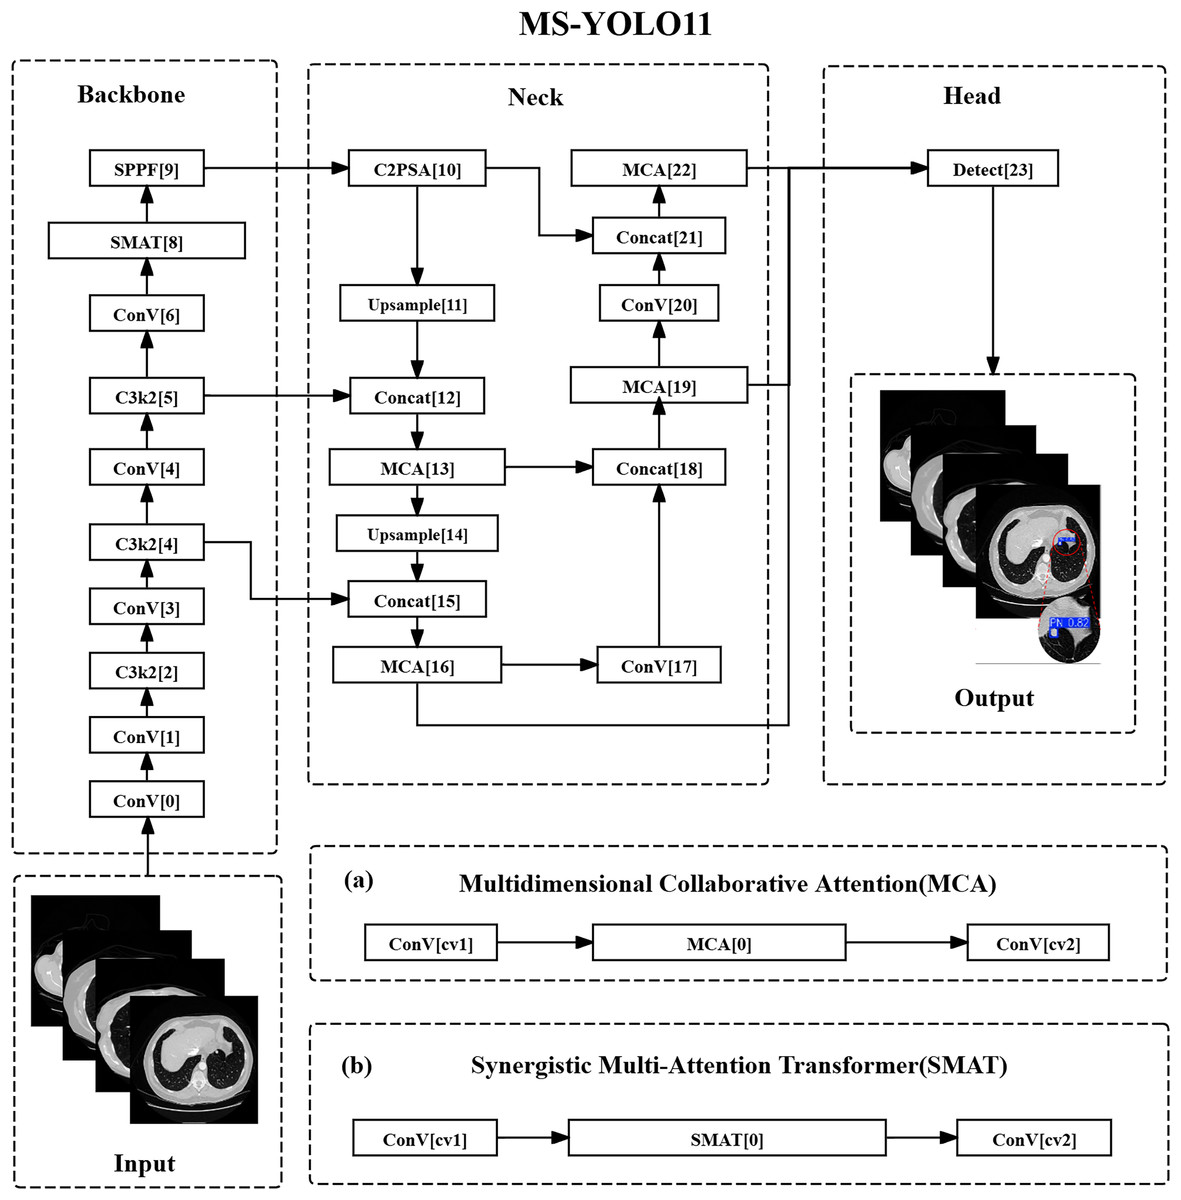
Figure 1: Multidimensional synergistic YOLO11 structure.
(A) Multidimensional collaborative attention (MCA). (B) Synergistic multi-attention transformer (SMAT).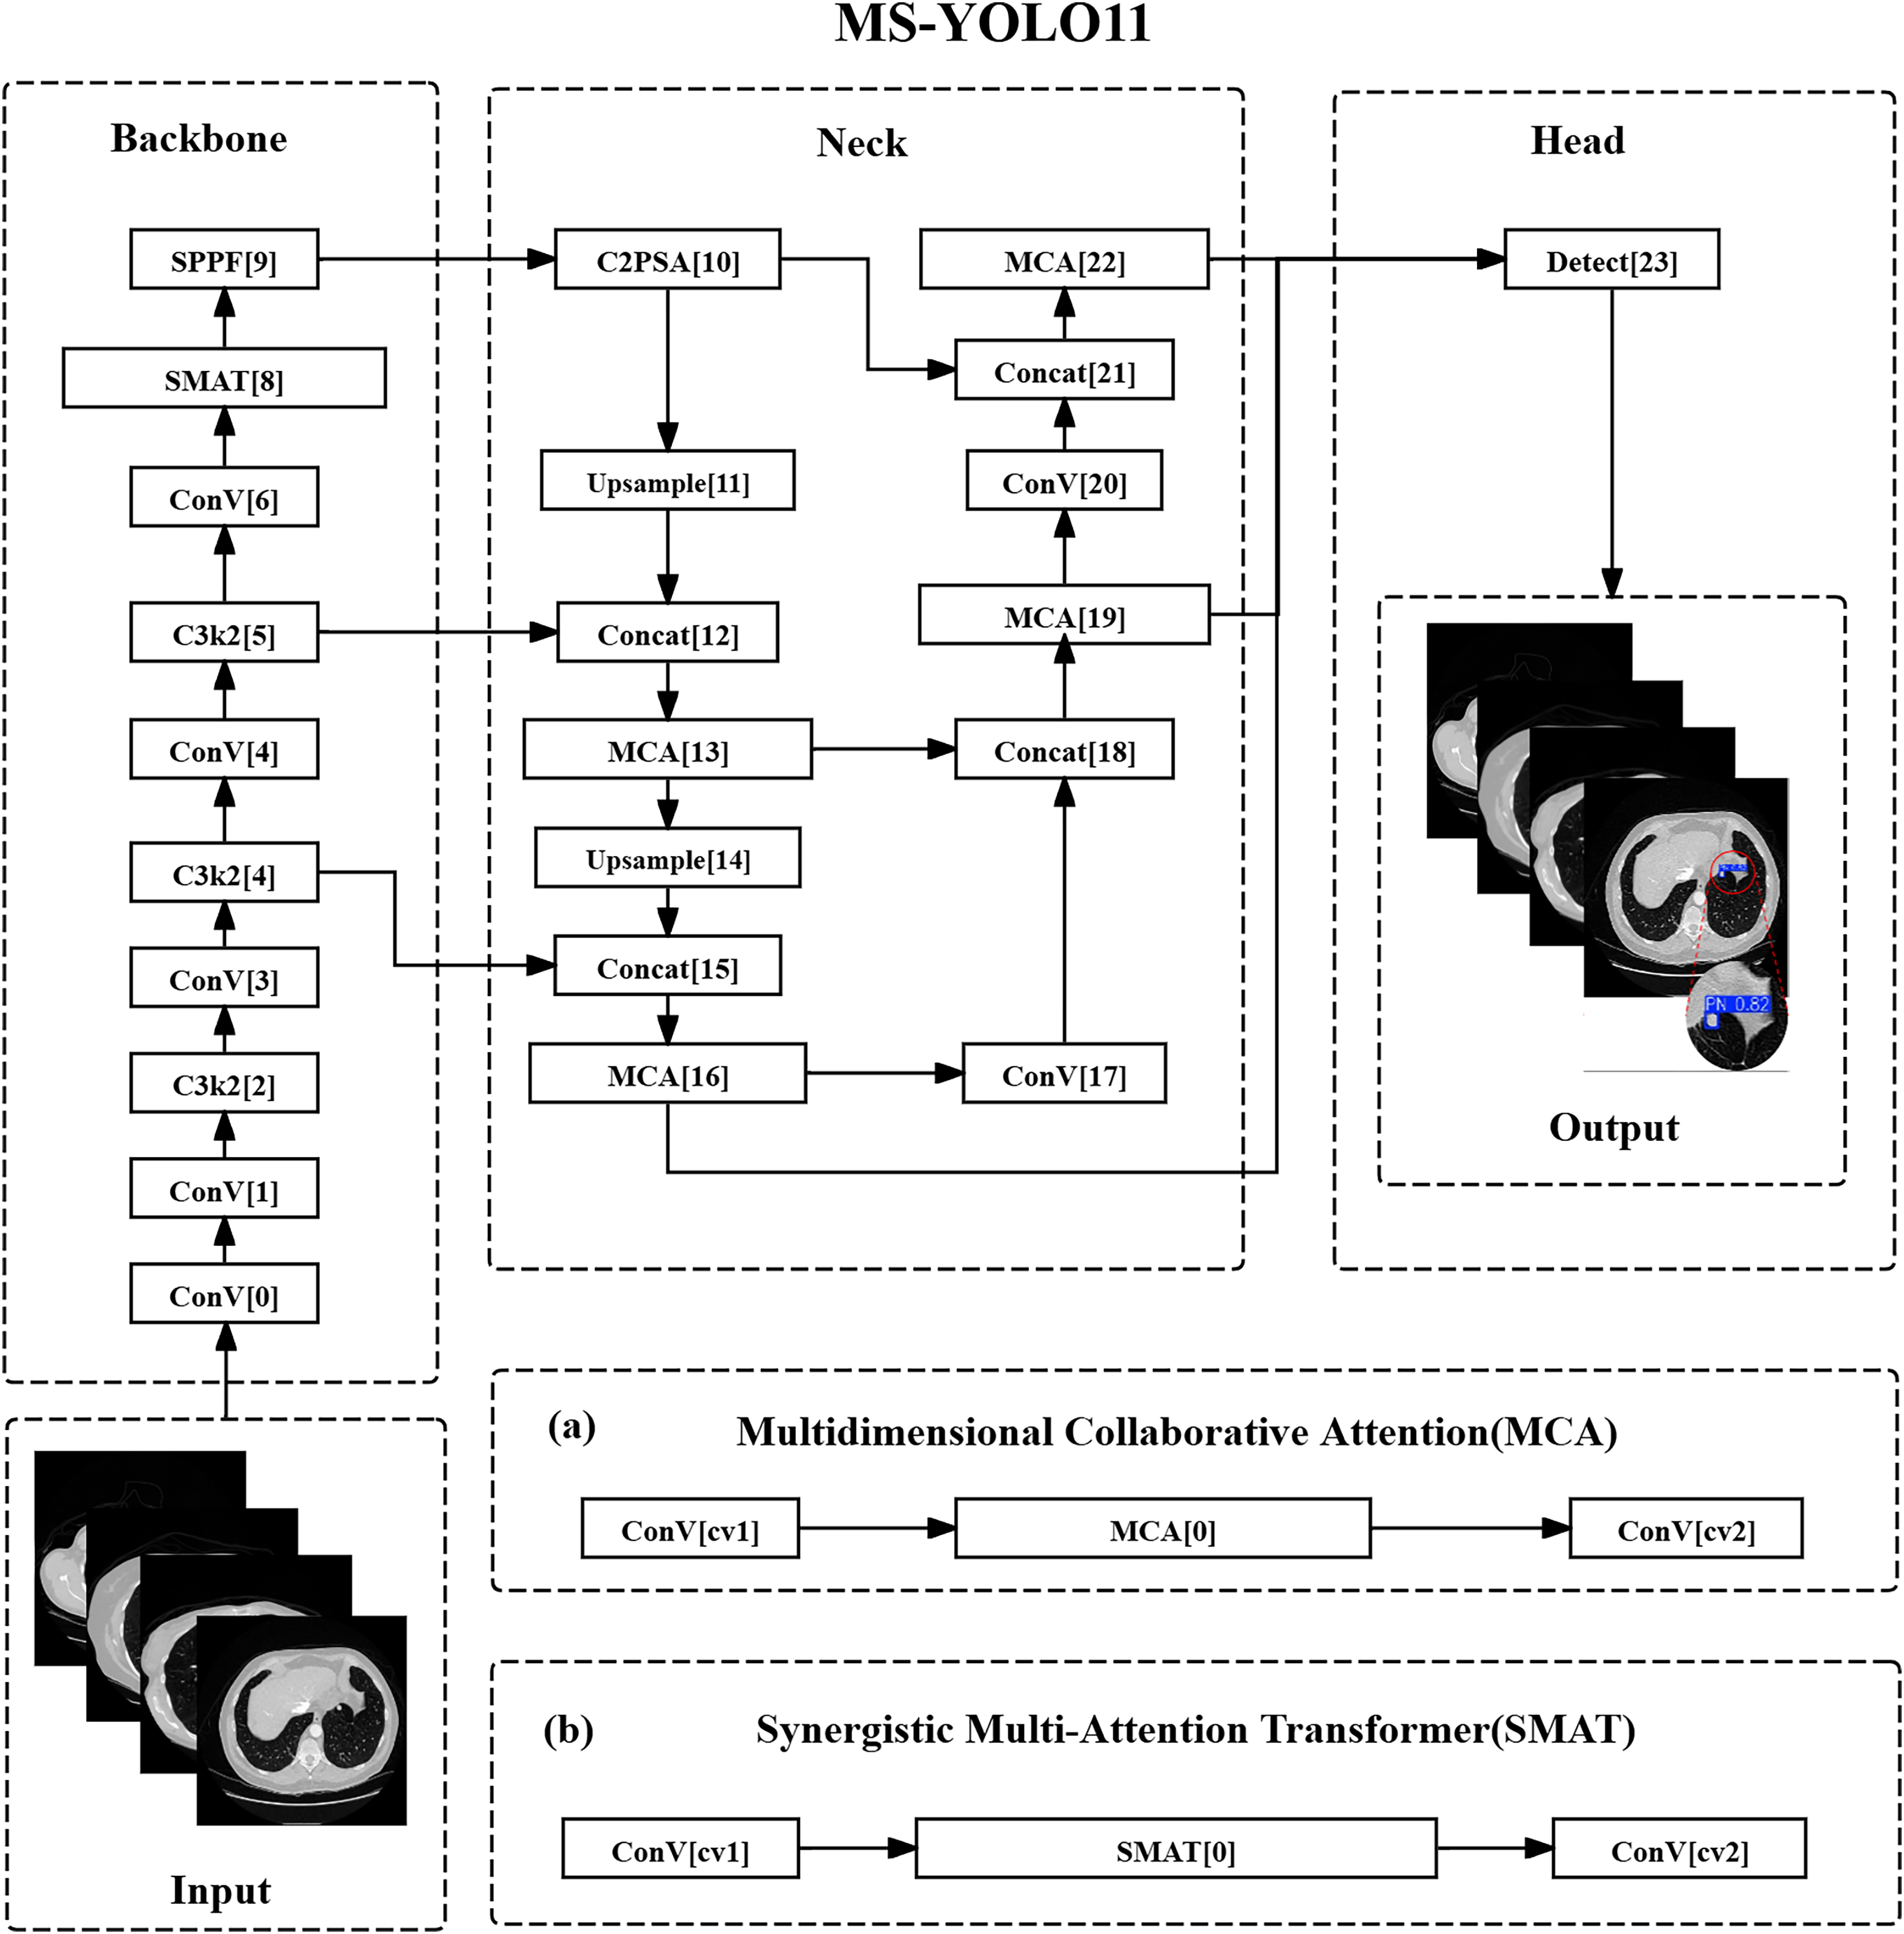
In the backbone network section, the C3k2 method of layer 8 has been replaced with SMAT, introducing the SMAT structure. This optimization mainly targets the deep feature extraction stage ( resolution), where represents the feature map at the fifth pyramid level, and denotes the total downsampling factor with respect to the input resolution. This stage improves the recognition ability of lung nodules through global context modeling. Among them, channel attention is used to screen features related to high-density areas of nodules (such as calcifications), while spatial attention suppresses interference such as blood vessels and bronchi in CT images. In addition, in E-MLP, deep convolution can extract local texture features across slices to assist in identifying the continuous distribution of small nodules.
In the detection head section, the C3k2 methods of layers 13, 16, 19, and 22 have been replaced with MCA, which is the insertion position of the MCA method. MCA collaborates with FPN multi-scale fusion ( , , ), where , , and represent the feature maps at pyramid levels 3, 4, and 5 respectively, and , , indicate the corresponding downsampling ratios. This fusion optimizes the expression of nodule features at different resolutions. Modeling the spatial distribution of nodules with height/width branches aims to improve the localization accuracy of sub-centimeter nodules; the adaptive pooling combination (AvgPool & SdPool).
Multidimensional attention design
From the illustrations in Figs. 1A and 1B, it can be seen that the MCA method and SMAT method are the core innovations of MS-YOLO11. Among them, the MCA method extracts the overall density features of nodules in the channel dimension through global average pooling (AvgPool) and captures local density fluctuations, such as faint shadows of ground glass nodules, using standard deviation pooling (StdPool). In the spatial dimension, feature map rotation and local convolution kernels are used to model the long and short axis distribution of nodules in CT slices, solving the problem of boundary blurring caused by partial volume effects. The SMAT method mainly interacts between the pixel and channel dimensions. In the E-MLP structure, a pixel convolution is used to enhance the contrast between nodule edges and surrounding tissues, such as the pleural traction sign. At the same time, the multi-scale segmentation modulator is embedded with position encoding to alleviate the problem of insufficient spatial offset sensitivity of small nodules (diameter mm) in the Anchor mechanism.
Global feature balance strategy
In this model design, shallow features were optimized by introducing the MCA method at the 16th layer of the detection head corresponding to P3/8 resolution. The height/width attention mechanism was utilized to enhance the saliency of the nodule center region, thereby reducing the loss of small pulmonary nodule information caused by downsampling. At the same time, in terms of deep features, SMAT method was adopted in the 8th layer (P5/32) of the backbone network, using the Transformer’s global attention to model cross slice continuity, such as the morphological changes of nodules in multi-slice CT. Finally, the output of MCA and SMAT was integrated through a dynamic weight fusion strategy, avoiding the overfitting of specific scales by a single attention mechanism.
Optimization of pulmonary nodule recognition
In medical imaging detection, MS-YOLO11 achieves efficient detection of small nodules, effective suppression of complex backgrounds, and compatibility with cross-modal imaging through its multi-dimensional attention mechanism and modular design. Specifically, the spatial rotation attention mechanism of MCA can enhance the edge contrast of 3–5 mm nodules at P3/8 resolution and reduce missed detections, and its multidimensional attention mechanism can adjust pooling strategies according to different modalities to adapt to the low-contrast features of X-rays. SMAT’s E-MLP convolution can extract micro texture features of nodules, such as burrs and lobes, to enhance the recognition robustness of irregularly shaped targets. In addition, channel attention dynamic screening can suppress redundant features in uniform regions of the lungs and reduce false positive rates, while spatial attention can filter out interference in vascular intersection areas at P4/16 resolution. The modular design enables MS-YOLO11 to be compatible with CT and X-ray imaging.
MS-YOLO11 summary
MS-YOLO11 has achieved end-to-end collaborative optimization of channel, spatial, and pixel multidimensional attention for the first time in its core architecture, balancing local details and global dependencies. Through a lightweight dynamic modulation design, the use of multi-scale segmentation modulators in SMAT and adaptive pooling in MCA can effectively reduce computational overhead, enabling the model to be applied to real-time clinical detection. In terms of lung nodule detection, MS-YOLO11 has higher sensitivity for detecting sub-centimeter-sized small nodules, which can assist radiologists in quickly locating suspected lesions. By combining the synergistic effect of local convolution in E-MLP and global attention in SMA, this model can also accurately detect irregular nodules. Through the innovative fusion of MCA and SMAT methods, MS-YOLO11 can effectively address the three core challenges of pulmonary nodule detection from a theoretical perspective: difficulty in detecting small targets, false positives caused by background interference, and morphological diversity.
Building upon this overall architecture, the following subsections provide detailed descriptions of the two key methods embedded in MS-YOLO11—MCA and SMAT. These methods are responsible for enhancing feature representation at both the spatial and channel levels, enabling the model to achieve its improved detection performance.
Multidimensional collaborative attention method
Method overview
The core goal of the MCA method is to model attention in the three dimensions of channel, height, and width in deep convolutional neural networks to enhance the expression ability of image features. The inspiration for this method comes from the human visual system’s integration mechanism of multidimensional information and captures feature interactions between different dimensions through a three-branch structure (Yu et al., 2023). Therefore, in pulmonary nodule detection tasks, MCA can help the model more accurately focus on the spatial position of nodules in CT images and their key features in the channel dimension, thereby improving the localization ability of small-sized targets.
Composition structure
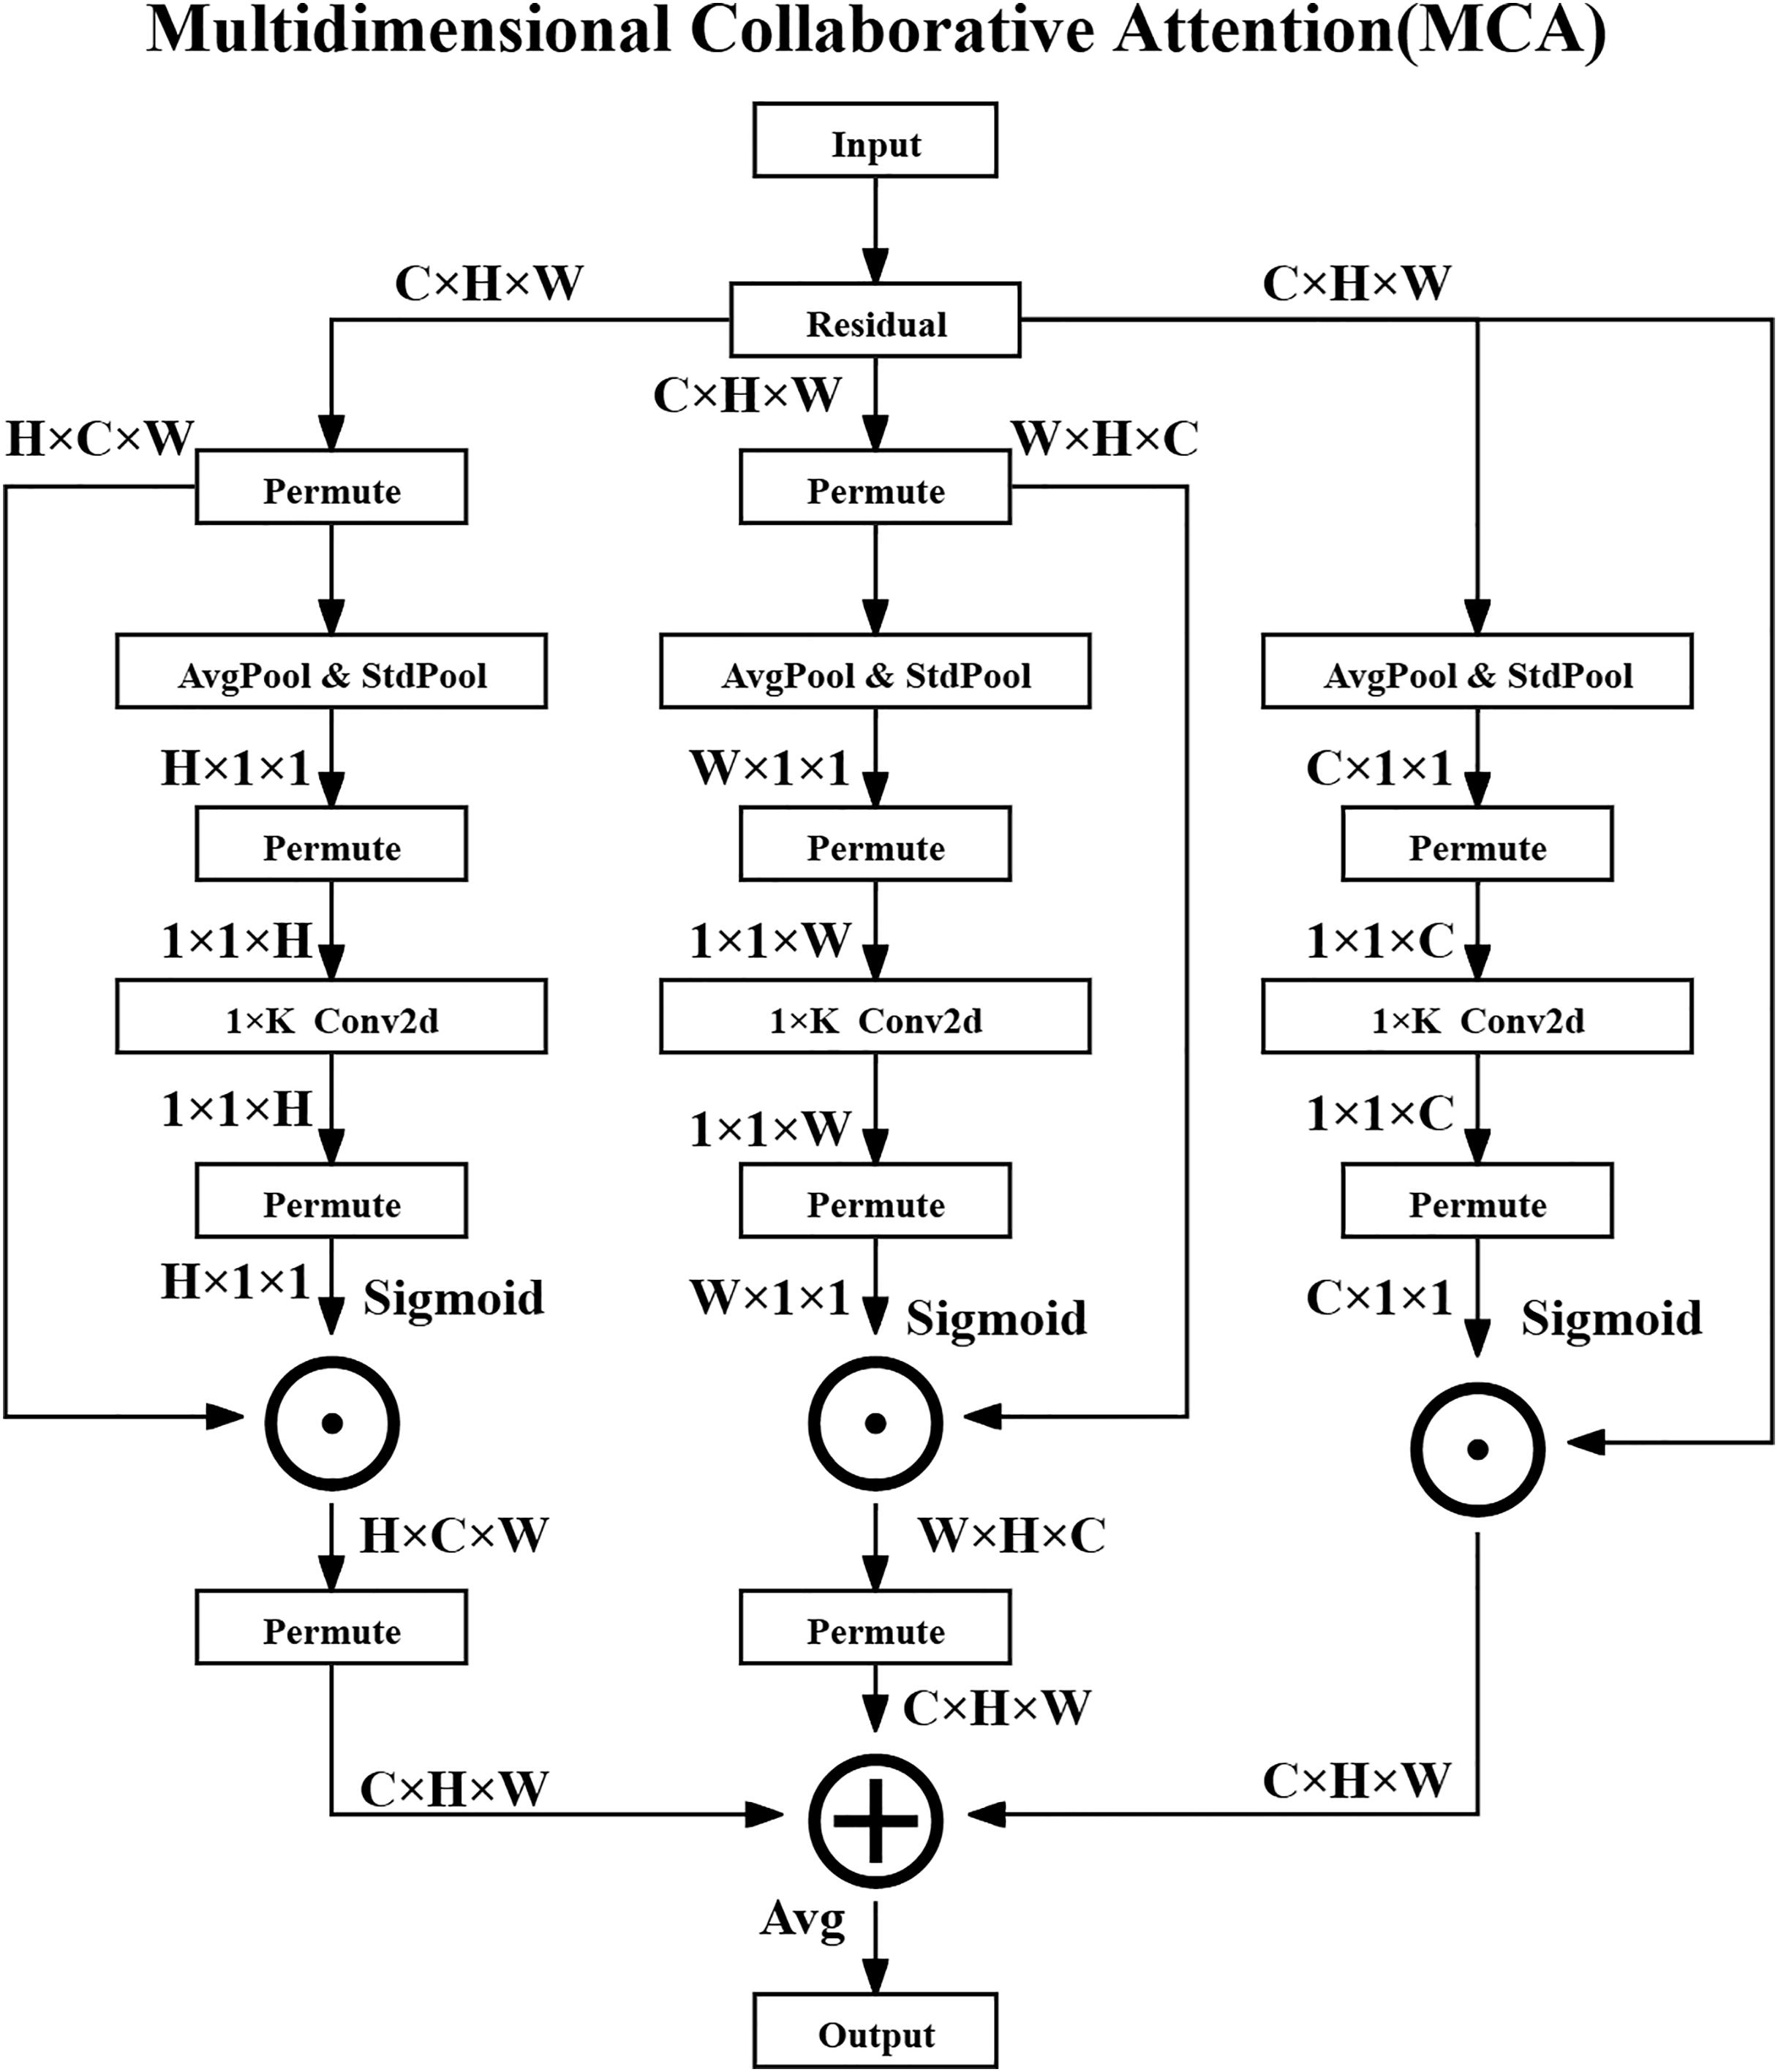
The MCA method consists of three parallel branches that process attention in the channel, height, and width dimensions and ultimately generate optimized feature maps through fusion strategies. The overall architecture diagram of the MCA method is shown in Fig. 2.
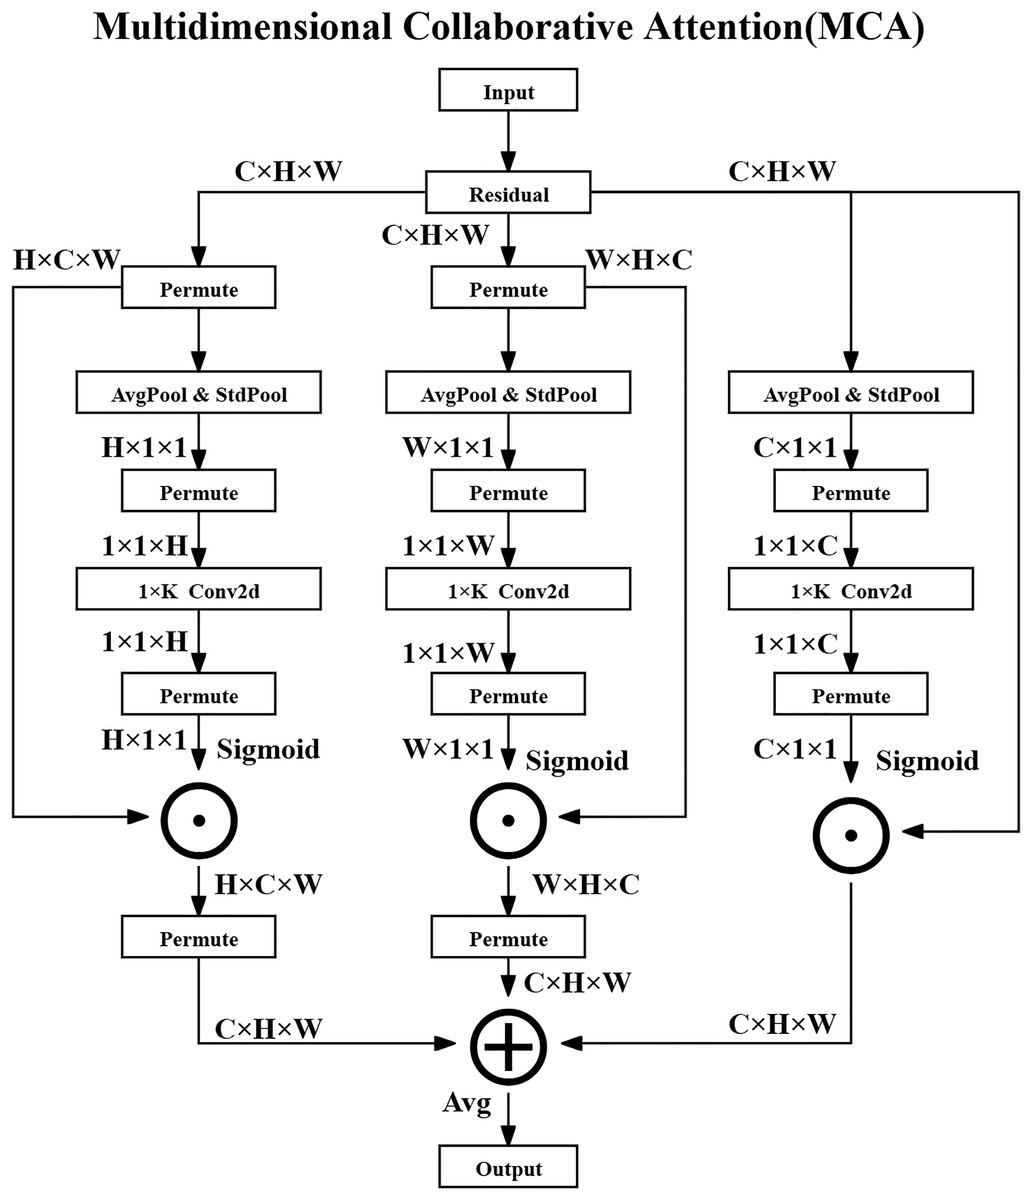
Figure 2: Multidimensional collaborative attention structure.
In the Channel Attention Branch, the input feature map is denoted as , where represents the set of real numbers, C is the number of channels, and H and W are the spatial dimensions—specifically, the height and width of the feature map, respectively.
Firstly, global average pooling (AvgPool) and standard deviation pooling (StdPool) are performed over the spatial dimensions of the feature map to extract statistical features for each channel. For the -th channel, the operations are defined as the following Eqs. (3) and (4):
(3)
(4) where denotes the value at spatial location in the -th channel. The average value represents the mean activation in that channel, while captures its standard deviation, quantifying the variation of activations across spatial locations.
Next, a one-dimensional convolution ( Conv2D) is applied to the concatenated descriptors to capture local channel-wise dependencies, and the output is activated via a Sigmoid function to obtain the channel attention weights as shown in the following Eq. (5):
(5) where is the Sigmoid activation function, denotes channel-wise concatenation, and is a 1D convolution with kernel size K. The resulting attention weights are broadcasted and applied element-wise to the original feature map as shown in the following Eq. (6):
(6) where denotes element-wise multiplication, meaning that the attention weights modulate the original channel responses.
For the Height and Width Attention Branches, the input feature map is permuted to rearrange its dimensions and facilitate similar pooling and convolution operations along the height and width directions. For the height attention branch, the operation is shown in the following Eq. (7):
(7) which adjusts the tensor shape so that height-specific features can be pooled and processed. The attention generation is then conducted as shown in the following Eqs. (8) and (9):
(8)
(9) where and are the attention weights along height and width, respectively. These weights are then broadcast and applied to the feature map in the corresponding dimensions, as shown in the following Eqs. (10) and (11):
(10)
(11)
Finally, the output feature maps from the three branches are fused through element-wise averaging to produce the final enhanced feature representation as shown in the following Eq. (12):
(12)
Method advantages
The multidimensional collaborative modeling method is the first to jointly model attention in the channel, height, and width dimensions in lung nodule detection tasks, overcoming the limitations of traditional methods that only focus on a single dimension. By using a three-way branching structure, the network can simultaneously enhance local feature expression and global feature interaction, improving the sensitivity of the model to small targets.
The adaptive pooling combination mechanism introduces learnable parameters and during the squeezing transformation process to dynamically fuse mean pooling and standard deviation pooling, as shown in the following Eq. (13):
(13)
Here, and are learnable scalar weights that control the relative contributions of average-pooled and standard-deviation-pooled features. and denote the globally pooled feature descriptors using average and standard deviation, respectively.
A variable convolution kernel size strategy is employed to adaptively determine the kernel size K as shown in the following Eq. (14):
(14)
In this formula, C is the number of channels, and are hyperparameters that control the scaling behavior of the kernel size, and indicates rounding down to the nearest odd integer. This strategy allows the convolutional kernel size to adapt to varying channel depths, balancing the receptive field and computational efficiency.
Performance enhancement
The MCA method enhances feature representation by simultaneously modeling attention across three dimensions—channel, height, and width—through a collaborative attention mechanism. Specifically, in the channel dimension, MCA emphasizes clinically significant features such as calcification and spiculation in lung nodules, guiding the model to focus on diagnostically relevant information. In the spatial dimensions, attention across height and width improves the detection and localization of small lesions while suppressing irrelevant background noise, which is crucial for accurate medical image interpretation. Furthermore, MCA incorporates an adaptive attention computation strategy that adjusts according to the feature distribution, allowing the model to generalize well across diverse datasets and clinical tasks. Its lightweight structure also offers a favorable trade-off between accuracy and efficiency, making it ideal for deployment in environments with limited computational resources.
Method summary
The MCA method is a lightweight and effective multidimensional attention mechanism designed to improve feature extraction in medical image analysis. It consists of three collaborative branches that model attention in channel, height, and width dimensions, respectively. By integrating adaptive pooling and local interaction methods, MCA strengthens the network’s ability to capture both global context and fine-grained local patterns. In pulmonary nodule detection, this enables more accurate identification and classification of nodules, thereby supporting more reliable diagnostic decisions. Compared with traditional attention methods such as SE and CBAM, MCA achieves better performance with significantly lower computational cost.
Synergistic multi-attention transformer method
Method overview
The SMAT is the core component of SMAFormer, aimed at enhancing the multi-scale feature capture capability of medical image segmentation tasks through Synergistic Multi-Attention (SMA) and Enhanced Multi Layer Perceptron (E-MLP) (Zheng et al., 2024). Therefore, the SMAT structure is particularly suitable for lung nodule detection tasks, effectively alleviating the shortcomings of traditional Transformers in local context perception, thereby improving the localization accuracy of small-sized and irregularly shaped nodules.
Composition structure
The SMAT method consists of two core methods: SMA and E-MLP. SMA can integrate pixel attention, channel attention, and spatial attention to enhance the model’s global and local feature extraction capabilities. E-MLP can combine Depth-wise Convolution and Pixel-wise Convolution to enhance local information capture. The overall architecture diagram of the SMAT method is shown in Fig. 3.
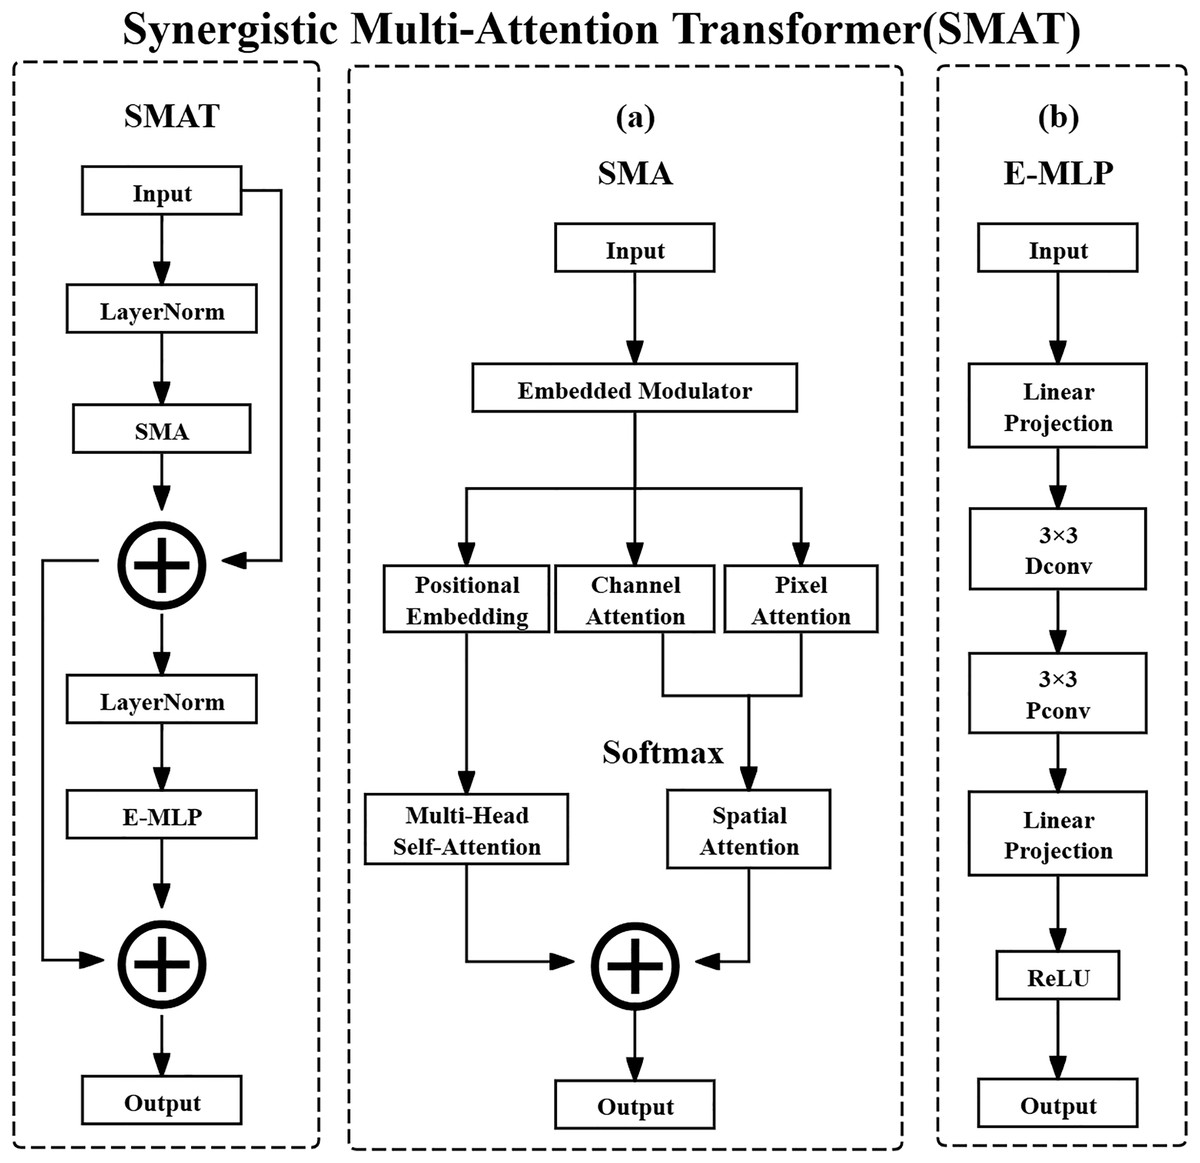
Figure 3: Synergistic multi-attention transformer structure.
(A) Synergistic multi-attention (SMA). (B) Enhanced multi layer perceptron (E-MLP).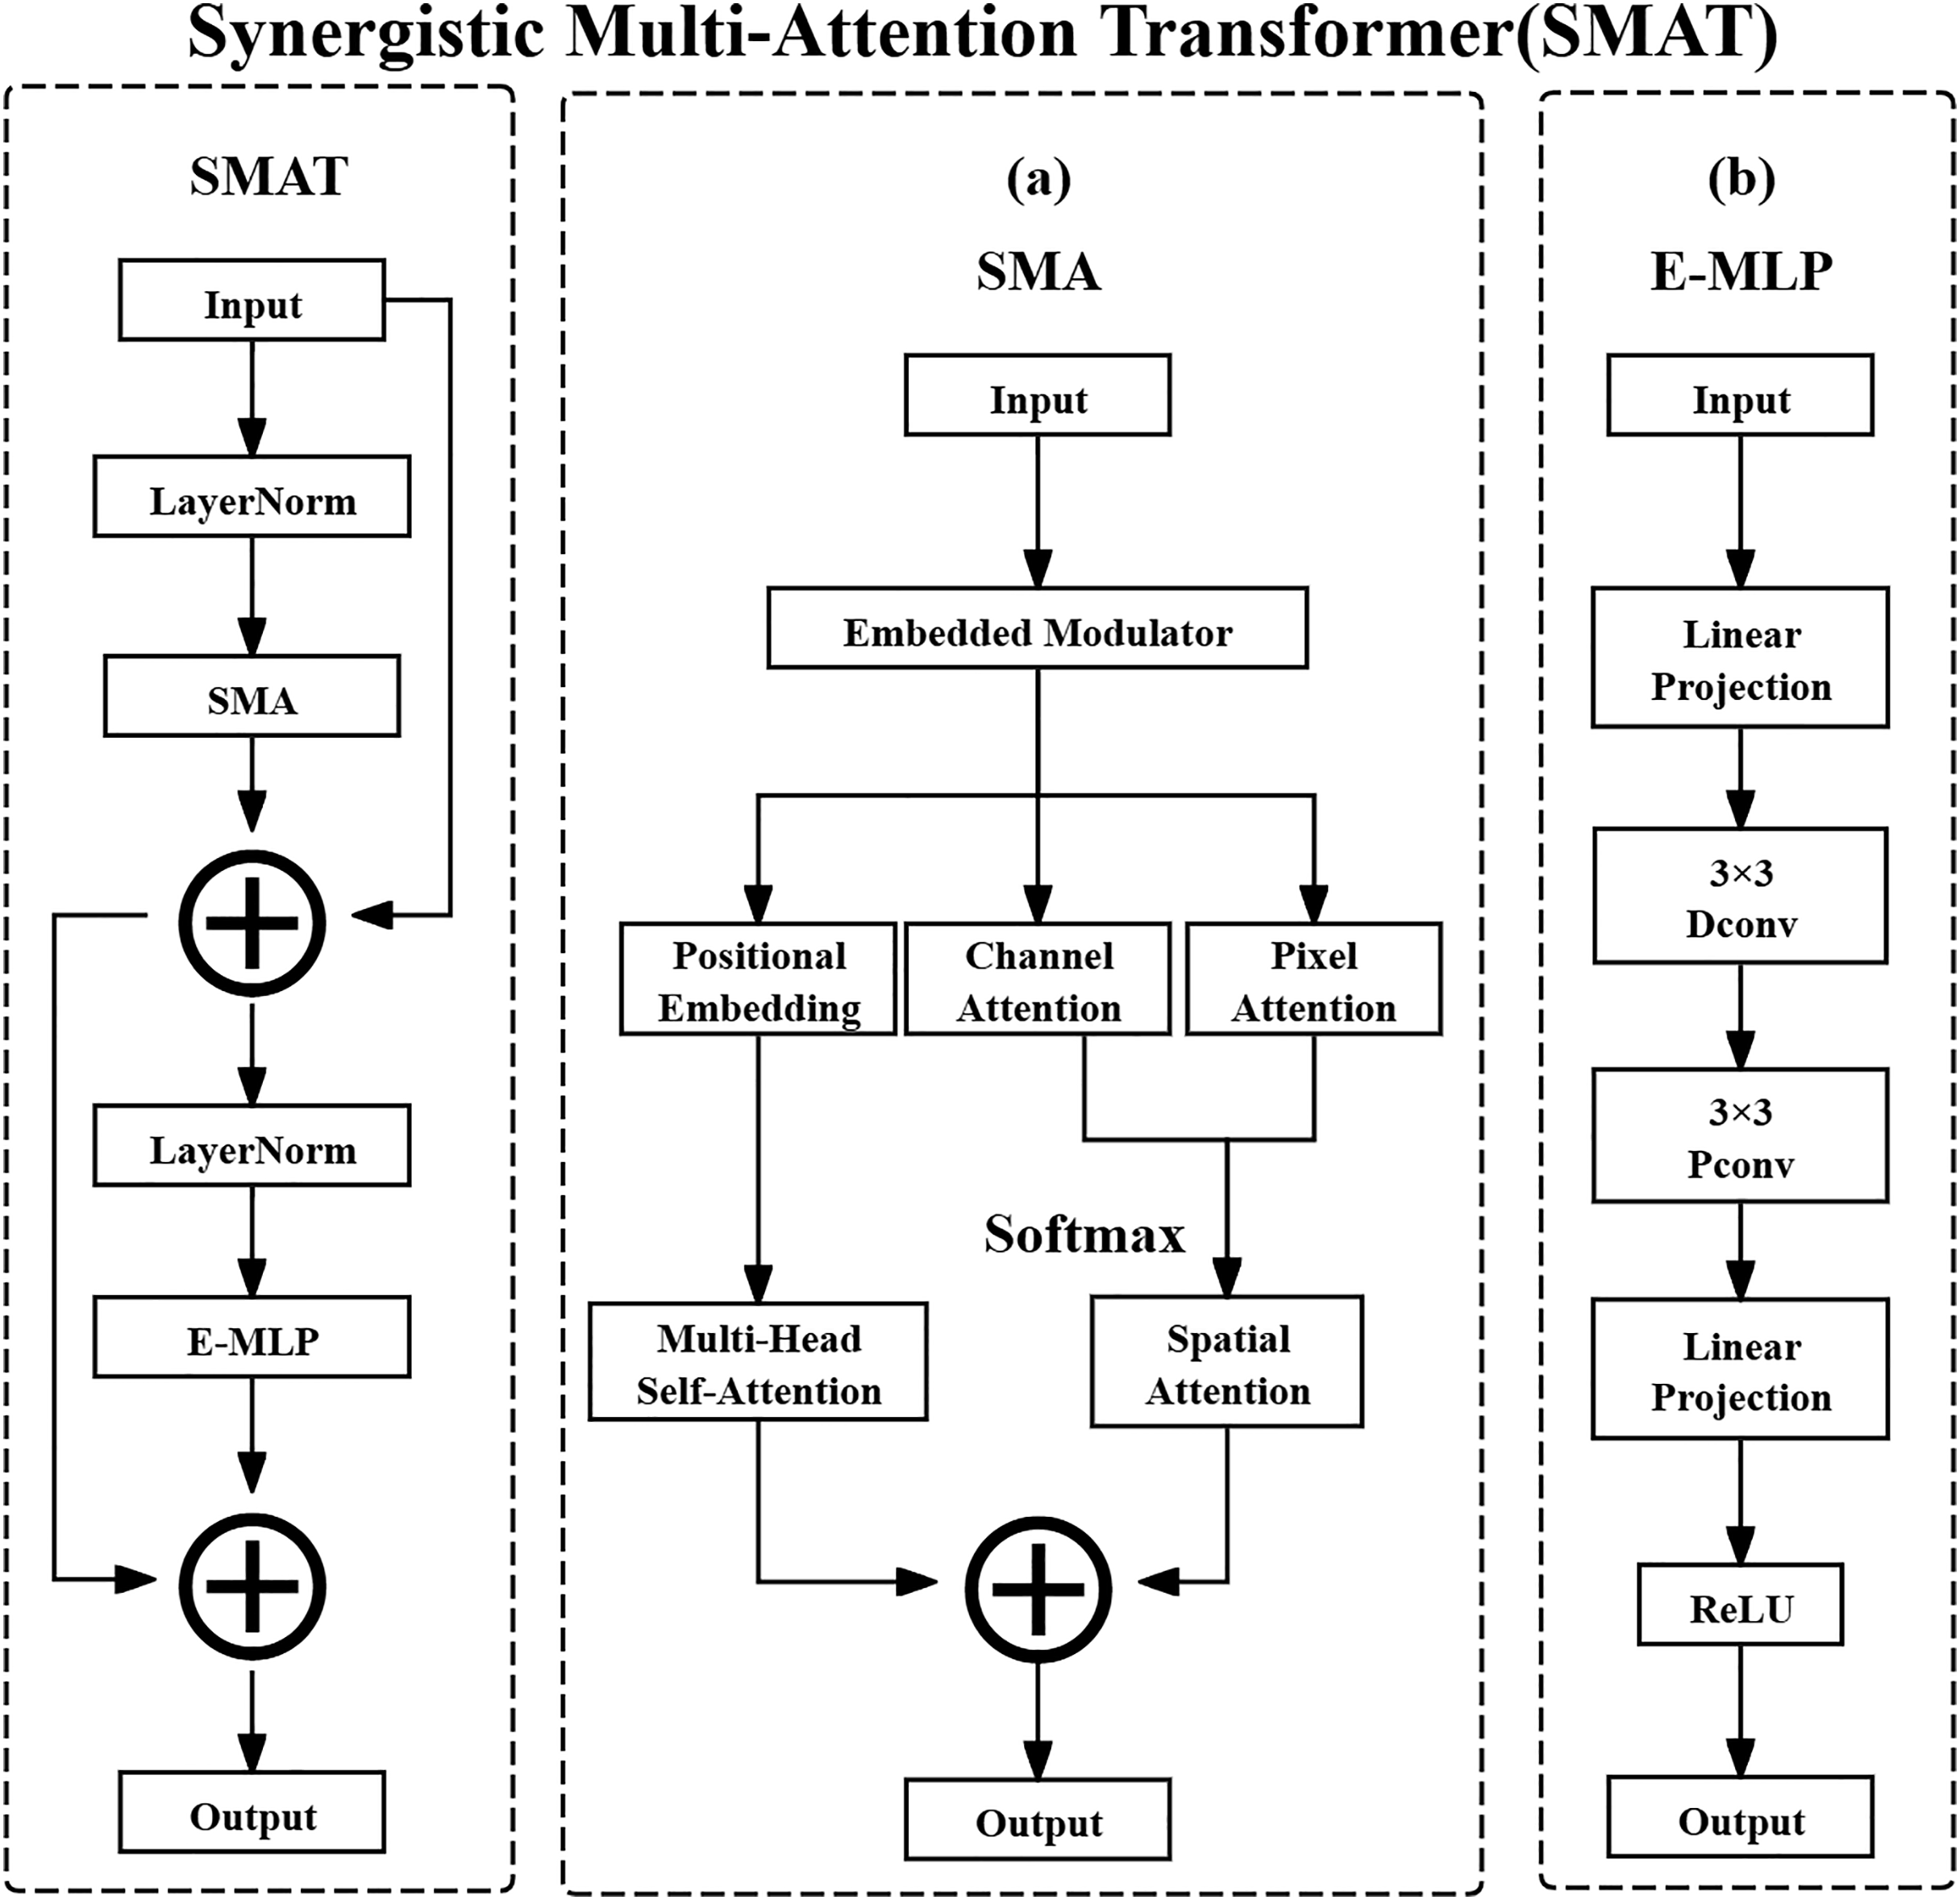
The input feature map of SMA is defined as shown in the following Eq. (15):
(15) where X denotes the input feature map tensor. The notation represents the set of real-valued tensors with shape , where is the symbol for the set of real numbers. Specifically, C is the number of channels in the feature map, typically reflecting different learned or raw feature types, such as various tissue responses in CT images. H and W are the spatial height and width of the feature map, which in the case of CT images correspond to the physical spatial location of structures such as lung nodules on a 2D axial slice. The computation process for SMA is defined as shown in the following Eq. (16):
(16)
In this equation, denotes the input feature map at the th layer, and refers to applying Layer Normalization to , which standardizes the feature map along the channel dimension to accelerate convergence and stabilize the training process. denotes the operation of the SMA method, which applies attention mechanisms. The resulting represents the intermediate output feature map after applying SMA, which retains the attention-enhanced feature representation. The residual connection is used to facilitate gradient flow and preserve original feature information.
After normalization and attention operations, SMA computes channel attention, pixel attention, and position embedding separately. These are then combined using Multi-Head Self-Attention and Spatial Attention for comprehensive feature aggregation. Channel attention assigns importance weights to different channels, dynamically highlighting critical features such as nodule calcification or spiculation. Pixel attention operates at the spatial level, adaptively emphasizing important pixels like nodule boundaries. Spatial attention locates key spatial regions and suppresses irrelevant background, improving the signal-to-noise ratio of extracted features.
E-MLP then further processes the feature map obtained from SMA with the operation as shown in the following Eq. (17):
(17)
In this equation, is the intermediate feature map produced by SMA. It is first passed through Layer Normalization to normalize the feature distribution and improve stability. The result is then input to the Enhanced Multi Layer Perceptron method, denoted , which outputs the next-layer feature map . The residual connection helps retain previous features and ease gradient backpropagation.
E-MLP employs a structure that includes Linear Projection, Depth-wise Convolution, and ReLU activation. Linear Projection refers to a fully connected layer applied across the spatial dimensions of each channel independently, enhancing local feature expressions. The Pixel-wise Convolution (interpreted here as Depth-wise Convolution with a spatial kernel of size ) enables channel-specific spatial filtering and facilitates cross-channel interactions. Rectified Linear Unit (ReLU) is a non-linear activation function that improves the representational power of the model by introducing non-linearity.
Method advantages
The combination of multidimensional attention fusion and local feature enhancement integrates cross-dimensional feature interactions through SMA’s three-way parallel attention mechanism (channel, spatial, and pixel attention). Meanwhile, E-MLP combines deep convolution and pixel convolution to compensate for the local information loss of traditional Transformers in detecting small objects. In addition, dynamic feature modulation provides multi-scale information embedding through embedded modulators, optimizing position perception ability, while trainable bias makes the attention map more focused on key lesion areas, reducing false positives. This integration method performs well in medical image analysis tasks such as lung nodule detection. For example, channel attention filters relevant feature channels, spatial attention suppresses background interference, pixel attention enhances nodule edges, and local convolution can recognize nodule boundary features with a diameter less than 5 mm, improving detection accuracy.
Performance enhancement
The optimization strategy of SMAT mainly includes the following aspects: enhancing the saliency of nodule features through multi-dimensional feature complementarity, utilizing channel attention to strengthen high-density regions, using spatial attention to accurately locate nodule positions, and refining edge contours through pixel attention. At the same time, balancing local and global information, the convolution operation of E-MLP preserves local details, while SMA models long-range dependencies with global attention to avoid feature dilution. In addition, adopting a dynamic information retention strategy and a multi-scale segmentation modulator reduces the information loss caused by feature map reconstruction, ensuring that small nodules can still be effectively identified after multiple downsampling.
Method summary
The SMAT method enhances the applicability of the Transformer in lung nodule detection. It integrates pixel, channel, and spatial attention mechanisms, combines an E-MLP to amplify local information, and employs a lightweight feature modulation strategy. This approach enables accurate identification of lung nodules of various sizes and shapes, particularly in detecting early small nodules, which holds significant clinical importance.
Experiment
Experimental configuration and evaluation indicators
Hardware configuration
The GPU used in this experiment is NVIDIA GeForce RTX 4070s, which has powerful parallel computing capabilities and can effectively accelerate the training and inference process of deep learning tasks. The CPU uses Intel i5-13490F to provide necessary computing support for data processing and model training. The system is equipped with 16 GB DDR5 6000 memory to ensure smooth processing of large-scale data during the experiment. In addition, the storage device adopts 8 TB SSD, providing high-speed data read and write capabilities to improve data loading efficiency. The peak AI computing power (TOPS) of the experimental platform is 568.
Software environment configuration
This experiment was conducted on the Windows 10 system, using Anaconda 3-2023.09-0-Vost-x86_64 to build a deep learning environment and Python 3.10. The deep learning framework uses PyTorch 2.2.1 and relies on CUDA 12.2 for GPU acceleration. In the experiment, OpenCV was used to process images, NumPy and Pandas were used to analyze data, and Tensorboard was used for visualization. Before the experiment, YOLO11-related dependencies need to be installed, and pre-trained weight files need to be loaded.
Training strategy
During the training process, a series of optimization strategies were adopted to improve the convergence speed and stability of the model. The training setting parameter comparison table is shown in Table 3.
| Parameter | Value |
|---|---|
| Epoch | 300 |
| Batch size | 8 |
| Patience | 100 |
| Workers | 0 |
| Device | 0 |
| Optimizer | SGD |
| Learning rate (lr) | 0.01 |
| Momentum | 0.937 |
| Weight_decay | 0.0005 |
| Random seed | 0 |
During the training process, parameter settings have a direct impact on the convergence speed, stability, and performance of the model. In this experiment, the random seed was fixed to 0 using a unified function that synchronizes the random state across Python, NumPy, and PyTorch (including CUDA backends), ensuring the reproducibility of all experiments. The training epochs (Epoch) were set to 300, and the model iteratively traversed the training set 300 times to learn the data features. An early stopping mechanism (patience = 100) was applied—if the performance did not improve for 100 consecutive epochs, the training process was terminated and the optimal model parameters were retained. The batch size was set to 8 to balance computational efficiency and memory usage. The initial learning rate (lr = 0.01) was decayed periodically to stabilize later-stage optimization. The optimizer was stochastic gradient descent (SGD) with a momentum of 0.937 to accelerate convergence and reduce oscillations. Weight decay was set to 0.0005 to prevent overfitting. The number of workers was fixed at 0, avoiding multi-threaded data loading for better reproducibility. All experiments were conducted on GPU device 0.
Dataset partitioning
The dataset is derived from the Luna16 public dataset and has undergone specific preprocessing to construct two versions: one consisting of the raw lung parenchyma images (Luna16 Undivided), and the other consisting of images processed through lung parenchyma segmentation (Luna16 Segmentation). To ensure robustness and reproducibility, a 10-fold cross-validation strategy was employed. Specifically, all 1,186 2D slices derived from 888 CT scans were randomly partitioned into 10 equally sized folds, with each fold sequentially used as the validation set while the remaining nine folds served as the training set. Each slice retains its corresponding annotation file to maintain consistency across folds (Tang et al., 2025b, 2025a).
Evaluation indicators
To ensure a comprehensive and clinically meaningful assessment of model performance, this study employs both the general object detection metrics (e.g., Common Objects in Context (COCO)-style indicators) and the lung nodule detection–specific metrics widely adopted in prior literature.
(1) General detection metrics. According to the COCO evaluation protocol, model performance is comprehensively assessed under multiple Intersection over Union (IoU) thresholds and object scales. In this study, three key metrics are adopted to evaluate detection performance on pulmonary nodules, especially small-sized ones:
Average Precision of Small Targets (APsmall): Quantifies the detection accuracy for small nodules (area < 32 pixels2).
Average Recall of Small Targets (ARsmall): Measures the models capability to recall small nodules across various IoU thresholds.
Mean Average Precision at IoU = 0.5 (mAP50): Represents the average precision over all categories when the IoU threshold is fixed at 0.5.
The definitions of these metrics are formulated as follows:
(18) where:
T denotes the number of recall threshold points (commonly 101, ranging from 0 to 1).
and represent the precision and recall at threshold and IoU threshold , respectively, computed within the IoU range with an interval of 0.05.
N is the total number of categories, and refers to the average precision of category at an IoU of 0.5.
In summary, APsmall and ARsmall specifically emphasize the models precision and recall performance on small pulmonary nodules, which are typically characterized by limited pixel areas and subtle texture features. These metrics are particularly critical for evaluating detection robustness in early-stage lesions. In contrast, mAP50 provides an overall evaluation benchmark across all lesion categories and serves as a standard indicator in COCO-style object detection frameworks (Cai et al., 2024).
(2) Medical Detection Metrics. Because lung nodule detection tasks differ from general object detection by emphasizing clinical sensitivity and false-positive control, additional quantitative indicators were included following established medical imaging standards:
-
Detection Rate (DR): The ratio of correctly detected nodules (true positives) to the total number of annotated nodules, reflecting the models completeness of detection.
(19)
-
Sensitivity (SEN): Equivalent to recall in medical contexts, measuring the probability that a true nodule is correctly identified by the model.
(20)
-
False Positives per Scan (FPs/scan): Indicates the average number of non-nodule regions incorrectly detected as nodules in each CT scan.
(21)
-
Accuracy (ACC): Reflects the overall correctness of the models classification and detection decisions, jointly considering true positives and true negatives. It is defined as:
(22) In practical evaluation of medical detection tasks where true negatives are difficult to enumerate explicitly, accuracy can be estimated as the harmonic mean of precision and recall:
(23) where P denotes precision and R denotes recall (or SEN).
By combining both general and clinical indicators, this evaluation framework provides a dual perspective: COCO-style metrics measure localization and classification accuracy at the pixel level, while DR, SEN, FPs/scan, and ACC capture clinical reliability and diagnostic safety. This integration ensures that the proposed MS-YOLO11 model is rigorously evaluated under both computer vision and medical imaging standards.
Model ablation experiment
In order to analyze the effects of MCA methods and SMAT methods on the MS-YOLO11 model, ablation experiments were conducted. The comparison table of ablation experiments is shown in Table 4.
| Models | Luna16 (Undivided) | Luna16 (Segmentation) | ||||||||||||||
|---|---|---|---|---|---|---|---|---|---|---|---|---|---|---|---|---|
| APsmall/% | ARsmall/% | mAP50/% | DR/% | SEN/% | FPs/scan | Accuracy/% | Weight/MB | APsmall/% | ARsmall/% | mAP50/% | DR/% | SEN/% | FPs/scan | Accuracy/% | Weight/MB | |
| YOLO11 | 34.89 | 46.25 | 79.52 | 83.45 | 82.72 | 2.10 | 78.06 | 5.25 | 30.69 | 44.46 | 77.48 | 81.82 | 80.66 | 2.35 | 76.04 | 5.25 |
| MCA-YOLO11 | 37.11 | 49.82 | 80.24 | 84.73 | 83.58 | 1.95 | 79.01 | 5.45 | 33.40 | 46.07 | 78.72 | 82.96 | 82.34 | 2.20 | 77.83 | 5.45 |
| SMAT-YOLO11 | 37.56 | 50.14 | 82.30 | 86.61 | 85.67 | 1.78 | 81.01 | 9.15 | 33.31 | 45.45 | 79.69 | 83.84 | 83.06 | 2.05 | 78.42 | 9.15 |
| MS-YOLO11 | 37.88 | 50.74 | 83.66 | 87.91 | 87.12 | 1.60 | 82.38 | 9.35 | 35.23 | 47.27 | 80.43 | 84.79 | 84.11 | 1.85 | 79.31 | 9.35 |
Analysis of ablation experimental data
From Table 4, the following observations can be made by comparing the two halves of the table:
-
Overall Detection Performance: Models trained on the Luna16 Undivided dataset generally achieve higher mAP50 and detection-related metrics compared to those trained on the Luna16 Segmentation dataset. For instance, MS-YOLO11 reaches 83.66% mAP50 on the Undivided dataset vs. 80.43% on the Segmentation dataset, highlighting the benefit of preserving complete contextual information in the full CT scans.
Small Nodule Detection: On the Undivided dataset, the baseline YOLO11 model shows limited small nodule detection capability (APsmall 34.89%, ARsmall 46.25%), likely due to low contrast and small size. Incorporating the MCA method (MCA-YOLO11) improves these metrics to 37.11% and 49.82%, indicating that channel attention enhances feature representation. SMAT-YOLO11 further boosts performance (APsmall 37.56%, ARsmall 50.14%) by optimizing spatial features, while the combined MS-YOLO11 achieves the best results (37.88% and 50.74%), demonstrating that the synergy of MCA and SMAT effectively improves small target detection. On the Segmentation dataset, all models experience slightly lower APsmall and ARsmall values, likely due to loss of peripheral context and edge information during segmentation. MS-YOLO11 still leads (APsmall 35.23%, ARsmall 47.27%), indicating robust adaptability.
Detection Rate and Sensitivity: Incorporating MCA and SMAT methods progressively enhances both DR and SEN metrics. On the Undivided dataset, YOLO11 achieves 83.45% DR and 82.72% SEN, MCA-YOLO11 improves to 84.73% DR and 83.58% SEN, SMAT-YOLO11 reaches 86.61% DR and 85.67% SEN, and the combined MS-YOLO11 attains the highest 87.91% DR and 87.12% SEN. A similar trend is observed on the Segmentation dataset, with MS-YOLO11 achieving 84.79% DR and 84.11% SEN. This shows that the attention methods not only improve detection coverage but also enhance the models ability to correctly identify positive nodules.
False Positives and Accuracy: The progressive integration of MCA and SMAT effectively reduces false positives per scan while improving overall accuracy. On the Undivided dataset, YOLO11 produces 2.10 FPs per scan with 78.06% accuracy, MCA-YOLO11 reduces FPs to 1.95 with 79.01% accuracy, SMAT-YOLO11 further lowers FPs to 1.78 with 81.01% accuracy, and MS-YOLO11 achieves the best combination of 1.60 FPs and 82.38% accuracy. On the Segmentation dataset, MS-YOLO11 maintains low FPs (1.85 per scan) and highest accuracy (79.31%), demonstrating a balanced trade-off between minimizing false alarms and maximizing detection reliability.
Model Size and Efficiency: YOLO11 is the smallest model at 5.25 MB but achieves relatively lower detection performance. MCA-YOLO11 slightly increases the size to 5.45 MB while improving accuracy, DR, and SEN. SMAT-YOLO11 expands to 9.15 MB, trading increased model size for significant gains in performance. MS-YOLO11 combines both attention methods, reaching 9.35 MB while achieving the highest accuracy, DR, and SEN. This demonstrates that the modest increase in model size is justified by substantial improvements in both overall and small nodule detection, effectively balancing model size and detection performance for practical deployment.
In summary, the ablation analysis demonstrates that: (1) Combining MCA and SMAT methods in MS-YOLO11 significantly enhances both overall and small nodule detection; (2) Retaining full global information (Undivided dataset) improves detection accuracy, sensitivity, and small nodule recognition; (3) The slight increase in model size is justified by the substantial gains in detection performance, making MS-YOLO11 a practical and efficient choice for lung nodule detection tasks.
Performance comparison
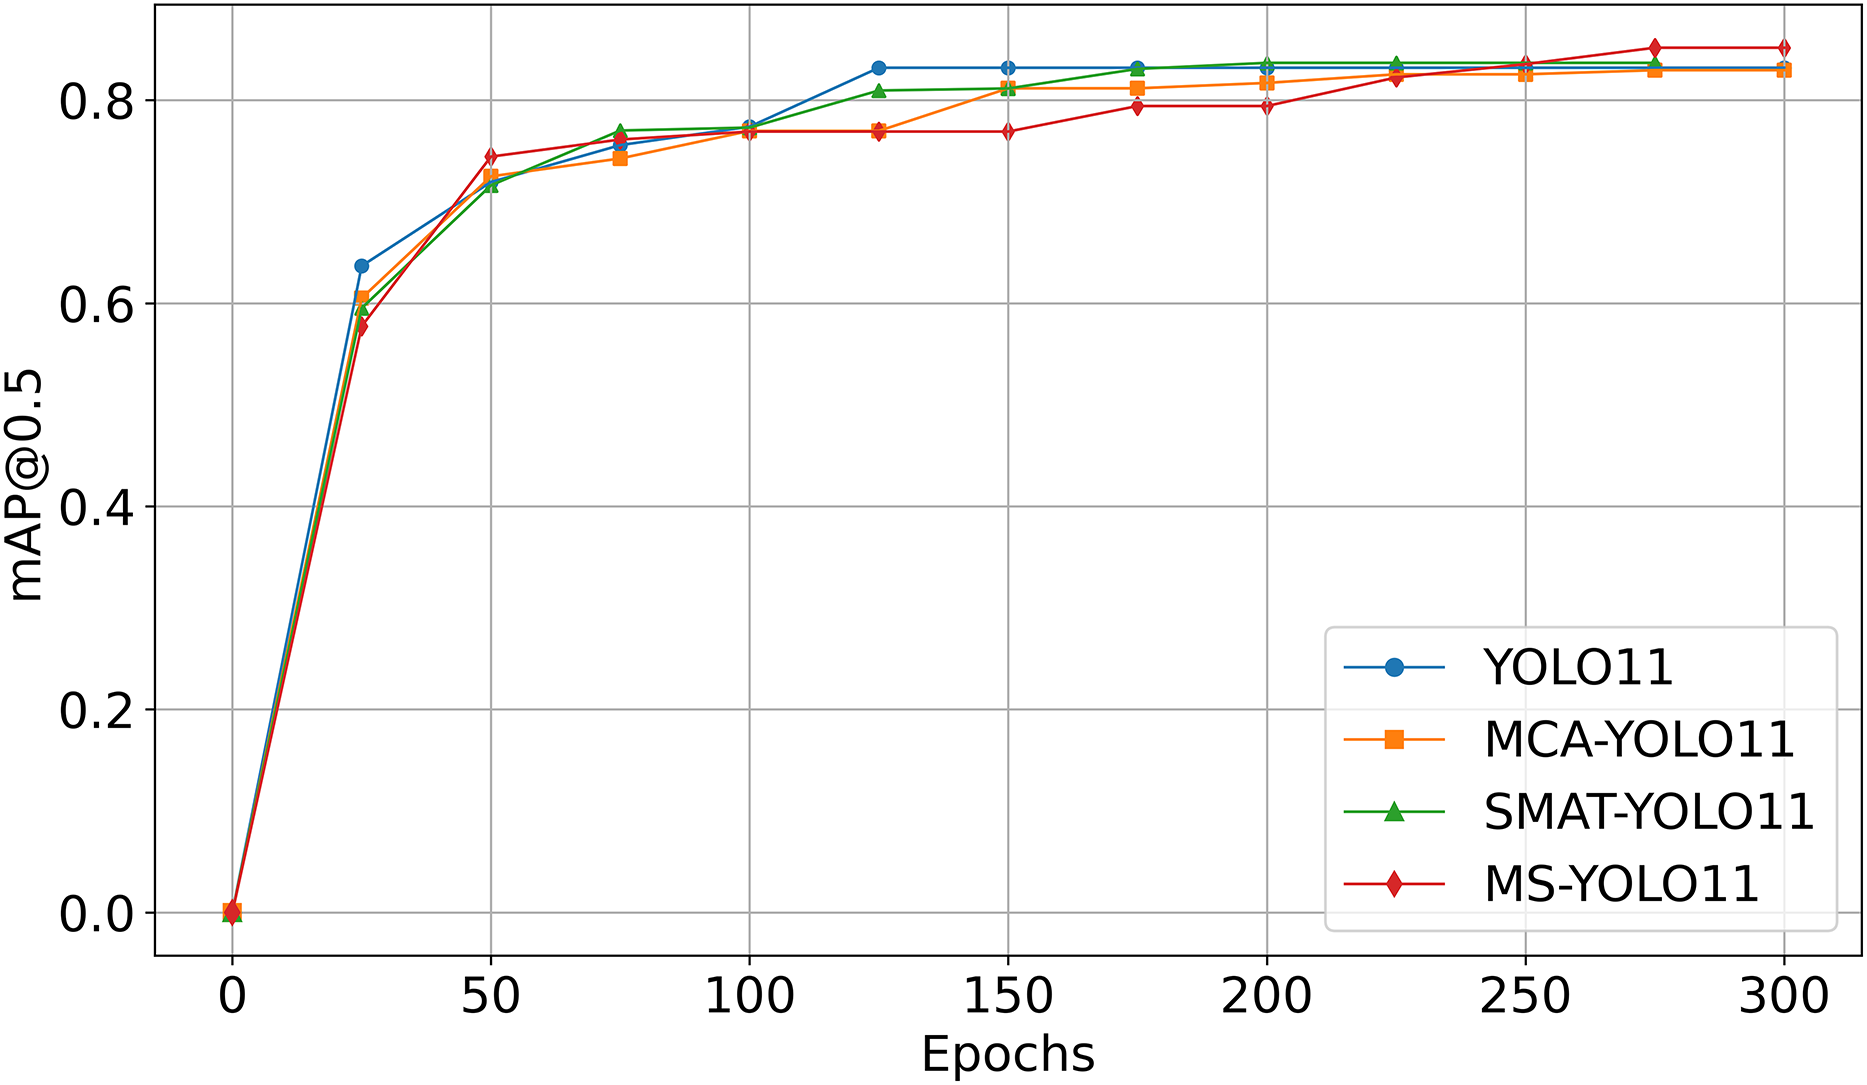
Figure 4 shows the mAP50 curve as a function of Epoch during the training process. It is important to note that the curves are obtained from experiments using the Luna16 Undivided dataset.
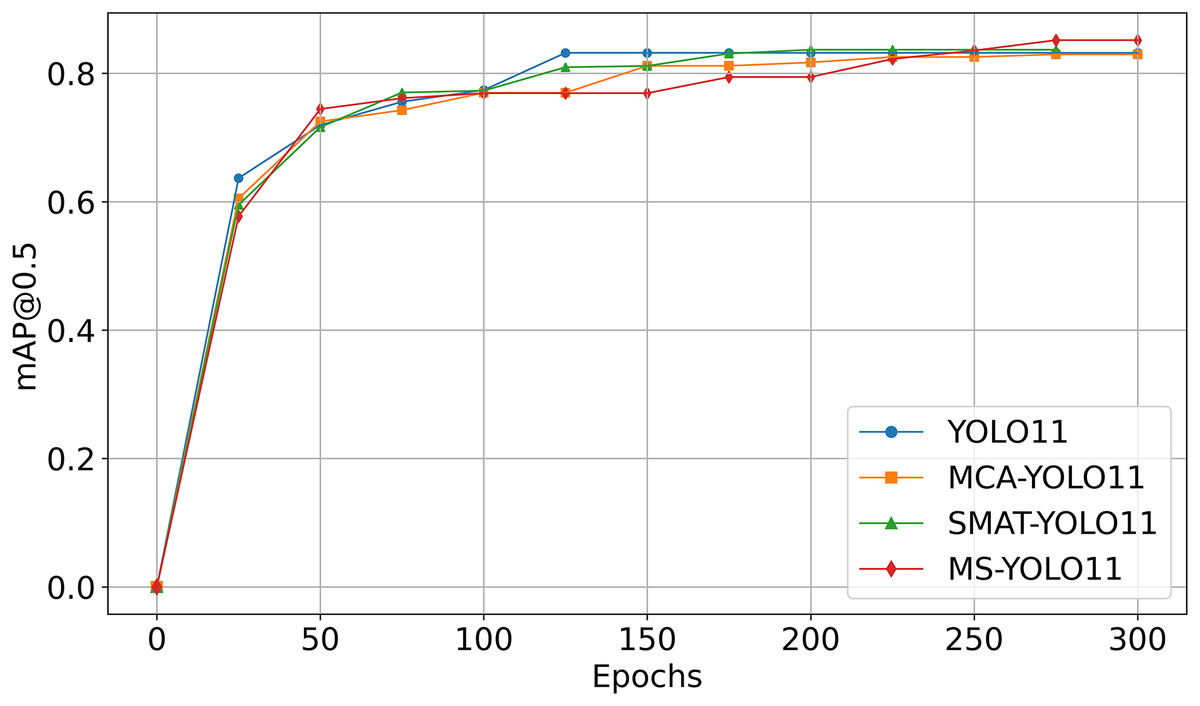
Figure 4: Comparison of mAP50 curves in ablation experiments.
As seen in Fig. 4:
-
YOLO11 (blue curve) reaches mAP50 of 79.52% on Luna16 Undivided, showing baseline capability.
MCA-YOLO11 (orange curve) improves to 80.24% with better attention via the MCA method.
SMAT-YOLO11 (green curve) achieves 82.30% by enhancing feature extraction.
MS-YOLO11 (red curve), combining both methods, reaches the highest mAP50 of 83.66%, with stable training and fast convergence, making it the best-performing model.
This graph analysis further validates that MS-YOLO11 achieves the best performance with a mAP50 of 83.66% by integrating both MCA and SMAT methods, outperforming all other methods.
Ablation experiment conclusion
The ablation experiment demonstrates that the detection performance on the Luna16 Undivided dataset is superior to that on the Luna16 Segmentation dataset, which confirms that preserving complete CT information benefits lung nodule detection. Additionally, both MCA and SMAT contribute to performance improvements, and their combination in MS-YOLO11 yields the best results in terms of overall detection accuracy and small target detection.
Model comparison experiment
To comprehensively evaluate the performance of MS-YOLO11 in lung nodule detection tasks, this study compares it with multiple versions of the YOLO series, the traditional object detection models Faster R-CNN and SSD, as well as a recently proposed pulmonary nodule detection method, MSDet (Cai et al., 2024). The experimental performance is summarized in Table 5.
| Models | Luna16 (Undivided) | Luna16 (Segmentation) | ||||||||||||||
|---|---|---|---|---|---|---|---|---|---|---|---|---|---|---|---|---|
| APsmall/% | ARsmall/% | mAP50/% | DR/% | SEN/% | FPs/scan | Accuracy/% | Weight/MB | APsmall/% | ARsmall/% | mAP50/% | DR/% | SEN/% | FPs/scan | Accuracy/% | Weight/MB | |
| SSD | 14.64 | 31.68 | 49.07 | 52.89 | 52.31 | 3.27 | 48.11 | 50.3 | 9.66 | 25.21 | 40.11 | 44.02 | 43.57 | 3.50 | 38.88 | 50.3 |
| Faster R-CNN | 23.65 | 33.36 | 61.76 | 65.92 | 65.34 | 2.96 | 60.48 | 314 | 19.71 | 28.99 | 58.39 | 62.25 | 61.82 | 3.04 | 57.11 | 314 |
| MSDet | 35.20 | 47.86 | 78.17 | 82.31 | 81.79 | 2.50 | 77.05 | 13.7 | 34.44 | 46.39 | 72.18 | 76.04 | 75.63 | 2.69 | 71.02 | 13.7 |
| YOLOv3 | 33.53 | 46.79 | 76.02 | 80.11 | 79.48 | 2.57 | 74.95 | 188 | 31.25 | 43.84 | 71.53 | 75.42 | 75.08 | 2.71 | 70.27 | 188 |
| YOLOv5 | 36.86 | 48.39 | 74.58 | 78.73 | 78.16 | 2.61 | 73.42 | 5.06 | 33.95 | 46.96 | 71.67 | 75.55 | 75.21 | 2.71 | 70.50 | 5.06 |
| YOLOv6 | 32.37 | 45.00 | 75.84 | 79.91 | 79.37 | 2.57 | 74.73 | 8.17 | 29.64 | 44.20 | 68.87 | 72.91 | 72.42 | 2.78 | 67.63 | 8.17 |
| YOLOv8 | 37.29 | 50.62 | 77.67 | 81.84 | 81.25 | 2.51 | 76.49 | 5.98 | 32.19 | 43.13 | 72.65 | 76.71 | 76.18 | 2.68 | 71.41 | 5.98 |
| YOLOv9t | 34.55 | 50.18 | 78.10 | 82.25 | 81.69 | 2.50 | 76.85 | 4.00 | 33.12 | 46.34 | 74.72 | 78.61 | 78.09 | 2.61 | 73.56 | 4.00 |
| YOLOv10 | 36.95 | 50.09 | 75.44 | 79.51 | 78.97 | 2.59 | 74.21 | 5.51 | 33.04 | 46.28 | 72.74 | 76.81 | 76.20 | 2.68 | 71.57 | 5.51 |
| YOLO11 | 34.89 | 46.25 | 79.52 | 83.45 | 82.72 | 2.10 | 78.06 | 5.25 | 30.69 | 44.46 | 77.48 | 81.82 | 80.66 | 2.35 | 76.04 | 5.25 |
| YOLO12 | 35.18 | 48.21 | 77.76 | 81.92 | 81.34 | 2.51 | 76.59 | 5.29 | 34.40 | 45.54 | 75.54 | 79.62 | 79.03 | 2.58 | 74.36 | 5.29 |
| MS-YOLO11 | 37.88 | 50.74 | 83.66 | 87.91 | 87.12 | 1.60 | 82.38 | 9.35 | 35.23 | 47.27 | 80.43 | 84.79 | 84.11 | 1.85 | 79.31 | 9.35 |
Analysis of comparative experiment data
By analyzing the results presented in Table 5, the following observations can be made:
-
Overall Detection Performance: All evaluated models achieve higher detection performance on the LUNA16 Undivided dataset compared to the Segmentation dataset. For example, MS-YOLO11 reaches 83.66% mAP50 on the Undivided dataset, while its performance drops to 80.43% on the Segmentation dataset. This indicates that pre-segmentation may result in partial loss of spatial information relevant for nodule detection. Compared to MSDet, which achieves 78.17% mAP50, both YOLO11 (79.52%) and MS-YOLO11 (83.66%) perform better under the unified hardware and training configuration used in this study, demonstrating the robustness and adaptability of MS-YOLO11 in realistic deployment scenarios.
Small Nodule Detection: Metrics specifically targeting small nodules, i.e., APsmall and ARsmall, are consistently higher on the Undivided dataset, reflecting the importance of complete spatial context for detecting tiny nodules. MS-YOLO11 achieves the best small-target detection with 37.88% APsmall and 50.74% ARsmall on the Undivided dataset. While MSDet (35.20%/47.86%) and YOLOv10 (36.95%/50.09%) show competitive performance, they are still surpassed by MS-YOLO11, highlighting the effectiveness of its multidimensional synergistic attention design for enhancing small object detection.
Detection Rate and Sensitivity: MS-YOLO11 achieves the highest detection rate (DR) of 87.91% and sensitivity (SEN) of 87.12% on the Undivided dataset, outperforming all other compared models. This indicates that the proposed architecture not only improves precise localization (mAP50) but also enhances the ability to correctly identify positive nodules, reducing false negatives.
False Positives and Accuracy: MS-YOLO11 maintains the lowest false positives per scan (1.60 for Undivided, 1.85 for Segmentation) while achieving the highest overall accuracy (82.38% for Undivided, 79.31% for Segmentation). This demonstrates a balanced trade-off between reducing false alarms and maintaining high detection reliability.
Model Size and Efficiency: Considering storage and deployment constraints, MS-YOLO11 remains lightweight at 9.35MB, smaller than MSDet (13.7MB) and much lighter than two-stage models like Faster R-CNN (314 MB) and SSD (50.3 MB). Despite the compact size, MS-YOLO11 achieves superior performance across nearly all metrics, confirming an excellent balance between model complexity and detection capability.
-
MSDet vs. MS-YOLO11: To further contextualize the performance of MS-YOLO11, it was compared with the latest state-of-the-art (SOTA) model, MSDet (Cai et al., 2024), which reported a notably high mAP on the LUNA16 dataset and has been benchmarked against numerous advanced detectors, including Faster R-CNN (Xu et al., 2023), Two-Stage CNN (Jain, Choudhari & Gour, 2023), LungSeek (Zhang & Zhang, 2023), DLDS-CT (Lu et al., 2024), EfficientDet-d (Tan, Pang & Le, 2020), CenterNet (Zhou, Wang & Krähenbühl, 2019), STBi-YOLO (Liu, 2022), YOLOv5-CASP (Ji et al., 2023), and YOLO-MSRF (Wu et al., 2024). Although MSDet employs specialized methods for small nodule detection—such as the Tiny Object Detection Block (TODB), Extended Receptive Domain (ERD), and Position Channel Attention Mechanism (PCAM)—its open-source version, re-implemented under the identical experimental configuration used for MS-YOLO11 (as detailed in Table 3), yielded an mAP50 of 78.17% on the Luna16 Undivided dataset, whereas MS-YOLO11 reached 83.66%, outperforming MSDet by 5.49 percentage points. Moreover, MS-YOLO11 achieved higher APsmall (37.88% vs. 35.20%) and ARsmall (50.74% vs. 47.86%), demonstrating stronger small-nodule detection capability. Notably, MSDet was evaluated only on the Luna16 Undivided dataset, while MS-YOLO11 was validated on both Luna16 Undivided and Luna16 Segmentation datasets, consistently outperforming MSDet across all evaluation metrics. These findings underscore that the multidimensional synergistic design of MS-YOLO11 provides more effective feature representation, higher detection precision, and stronger robustness, advancing beyond existing state-of-the-art methods.
In summary, these results indicate that using complete, unsegmented CT scans provides richer spatial information that benefits nodule detection, and the MS-YOLO11 model achieves superior accuracy, sensitivity, and small-object detection performance while maintaining a compact model size.
Loss comparison
Figure 5 shows the loss vs. Epoch curves for the compared models when trained on the Luna16 Undivided dataset.
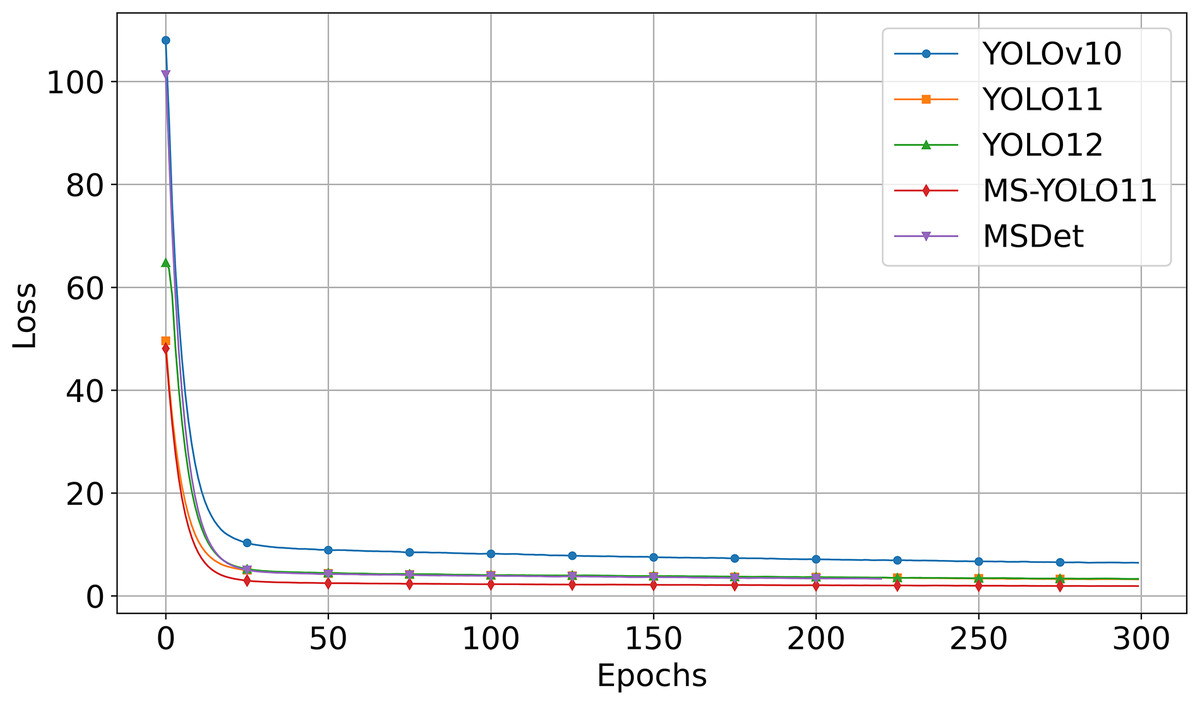
Figure 5: Comparison of loss curve in comparative experiment.
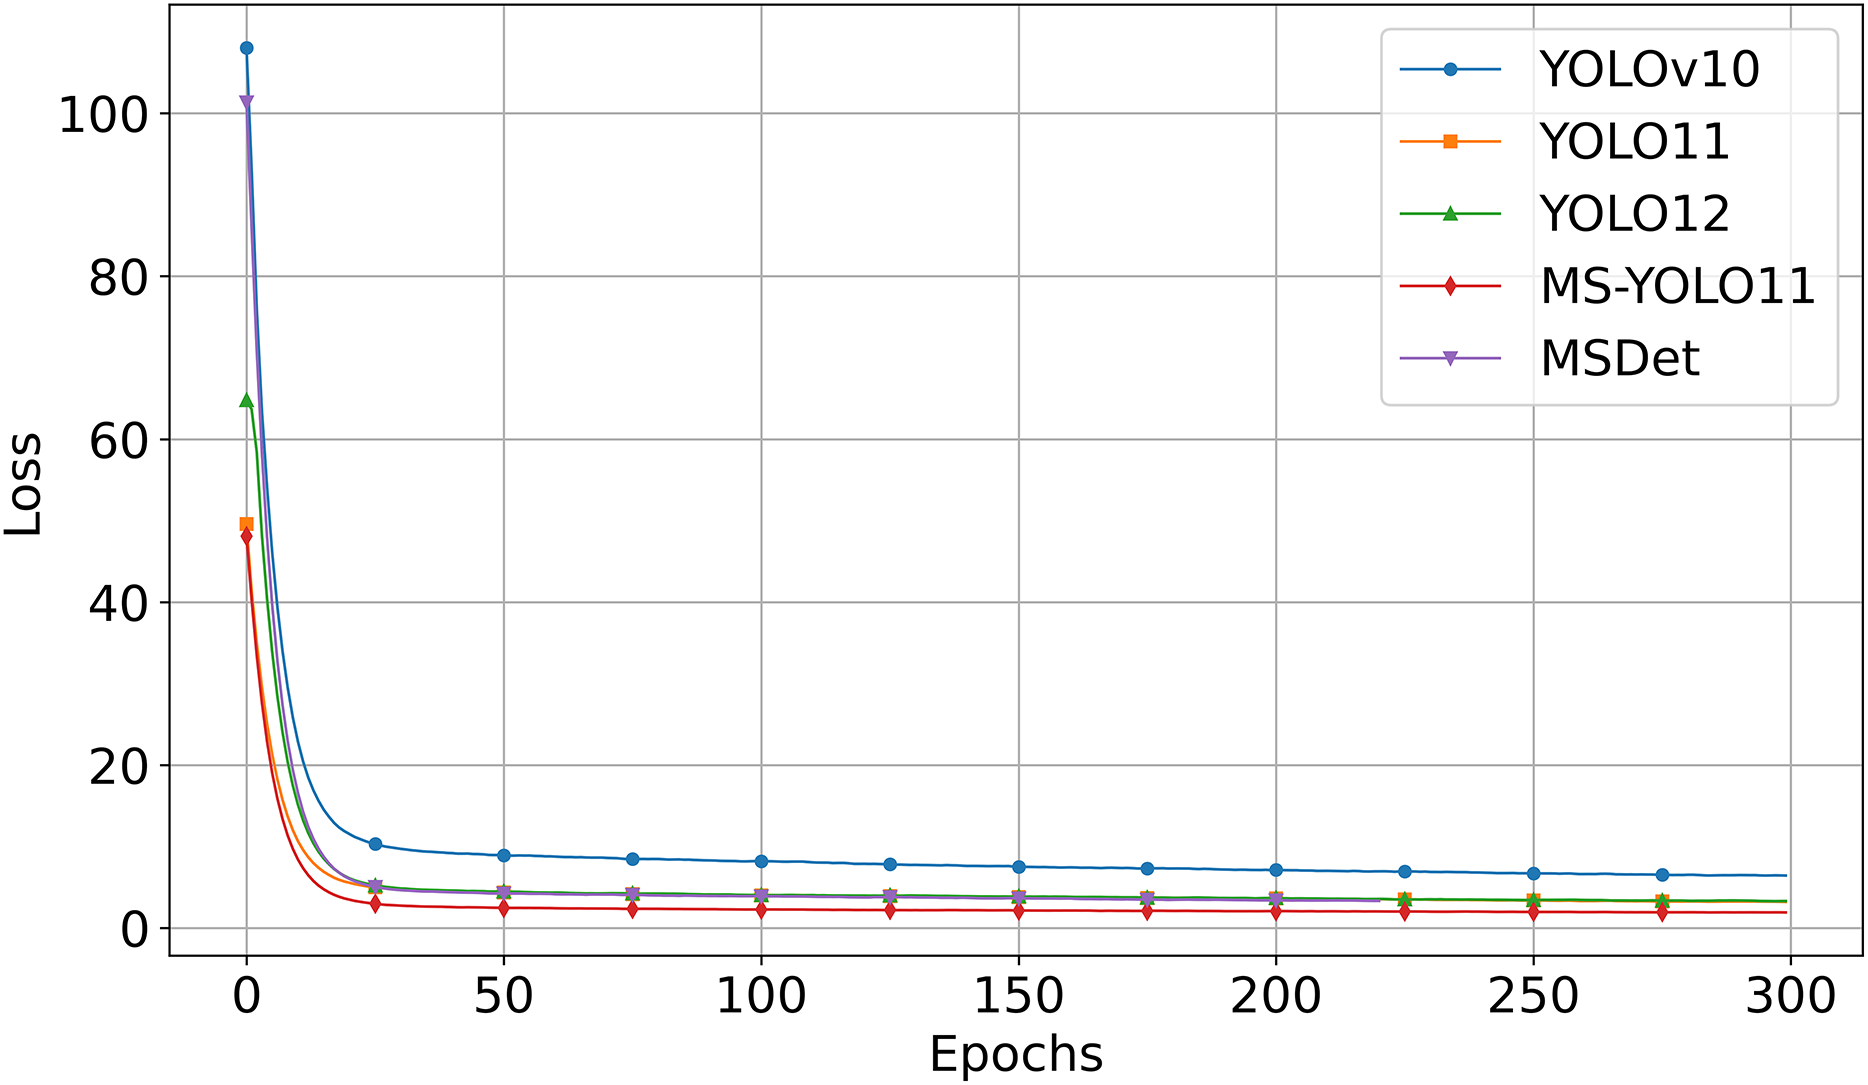
Figure 5 shows that:
-
MS-YOLO11 (red curve) consistently maintains the lowest loss value during training and converges the fastest.
YOLOv10 (blue curve) starts with a significantly higher initial loss and converges more slowly compared to the other models. The loss decreases steadily over time but remains at the highest level.
YOLO11 (orange curve) and YOLO12 (green curve) converge quickly, though their final loss values remain slightly higher than that of MS-YOLO11.
MSDet (purple curve) also shows rapid initial convergence but maintains higher loss values than MS-YOLO11 throughout the training process. Despite utilizing multiscale receptive field enhancement (Cai et al., 2024), it demonstrates weaker convergence stability and optimization capability compared to MS-YOLO11 under the unified training configuration.
This graph analysis corroborates that MS-YOLO11 achieves the fastest and most stable convergence with the lowest loss, outperforming YOLOv10, YOLO11, YOLO12, and MSDet in training stability and optimization effectiveness.
Comparison experiment conclusion
The comparison results show that using unsegmented lung data yields consistently better detection performance, underscoring the importance of preserving complete lung data. Among all models, MS-YOLO11 achieves the highest scores in mAP50 (83.66%), APsmall (37.88%), and ARsmall (50.74%), demonstrating superior accuracy in detecting small pulmonary nodules. This performance gain is attributed to its innovative multidimensional synergistic design, which effectively enhances feature representation and spatial context utilization. Compared to MSDet, which incorporates multiscale receptive field enhancement and attention mechanisms, MS-YOLO11 not only achieves better accuracy but also converges faster and maintains a smaller model size. These results confirm that MS-YOLO11 offers a robust solution for pulmonary nodule detection tasks.
Visualization
Detection results
In this study, to investigate the impact of lung parenchyma segmentation on lung nodule detection results, a comparative experiment was conducted between two scenarios: “Non-segmentation” and “Segmentation”. Each row corresponds to a different detection method, including Ground Truth, YOLO11, and the MS-YOLO11 proposed in this article. Visualize the detection, as shown in Fig. 6.
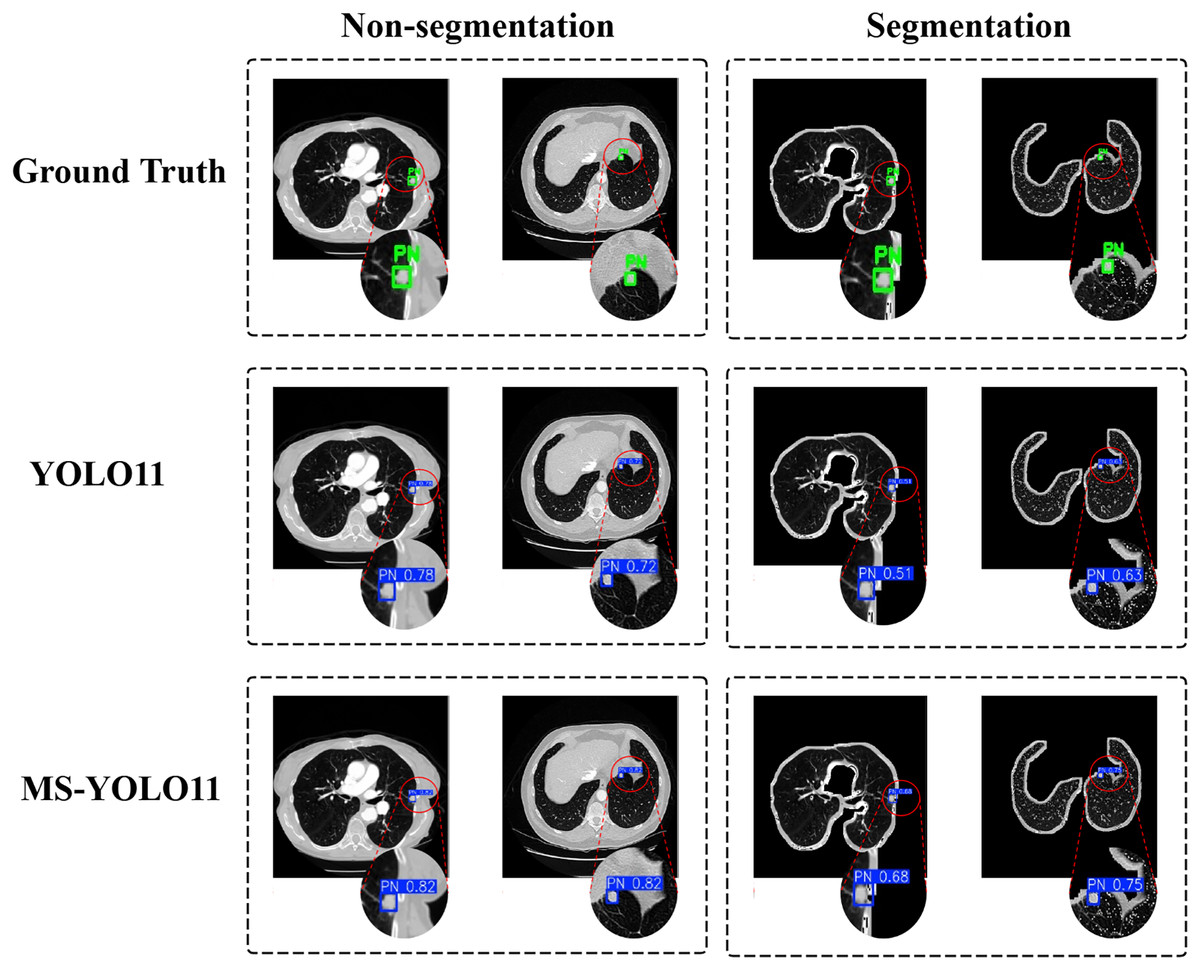
Figure 6: Detection results under segmentation and non-segmentation conditions.
The left half displays the performance of different models on the Luna16 Undivided dataset, while the right half displays the performance of different models on the Luna16 Segmentation dataset.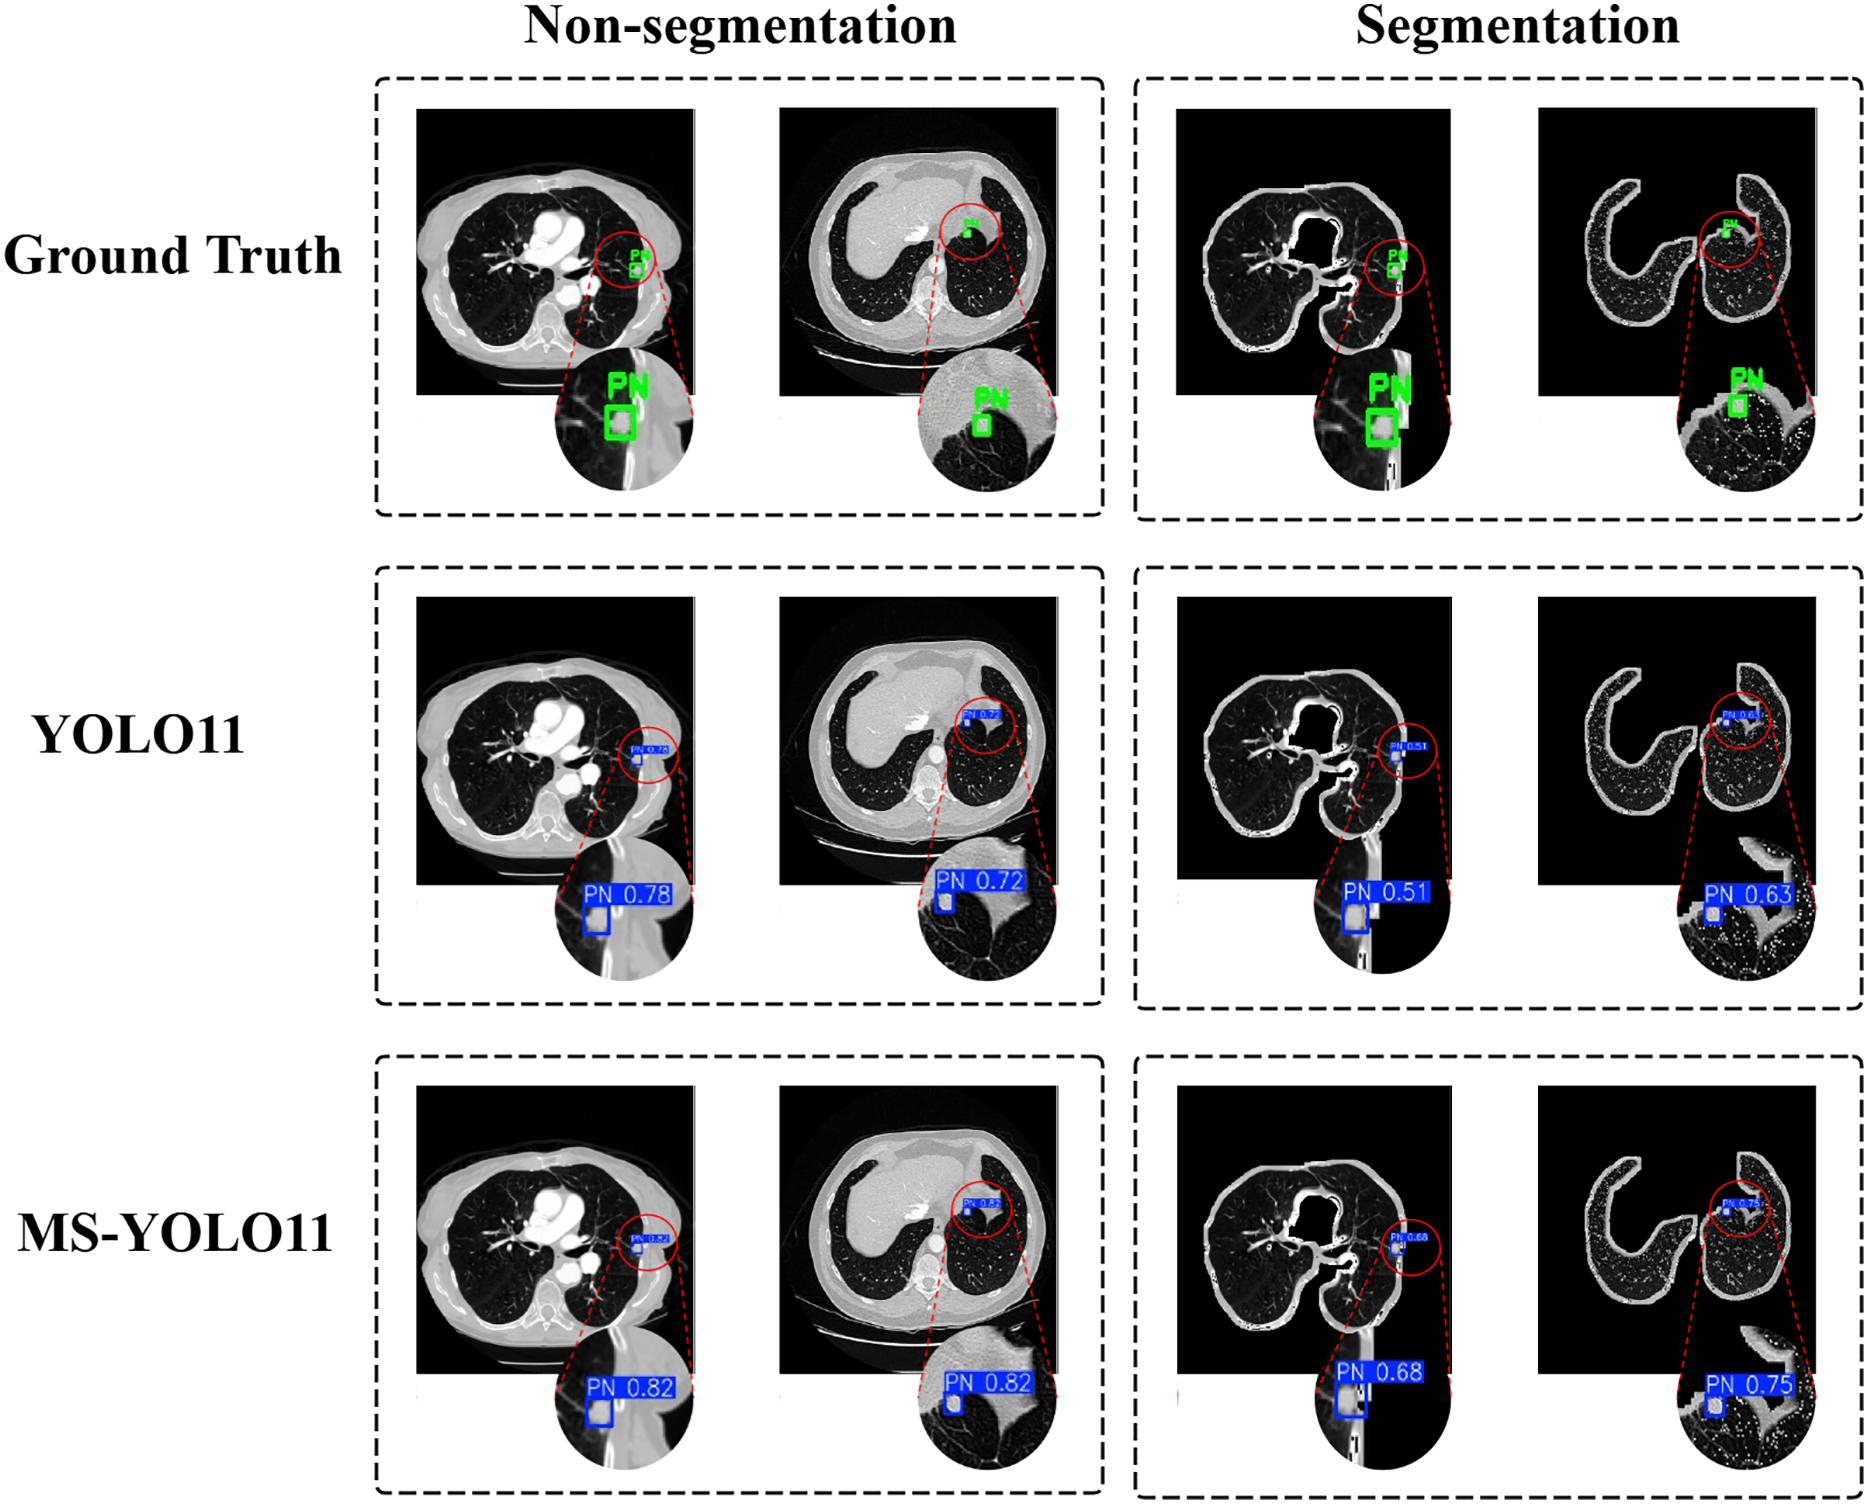
In Ground Truth, standard pulmonary nodule labeling locations are provided and displayed with a green box PN (Pulmonary Nodule). In the YOLO11 method, traditional YOLO11 is used for detection. In the case of “Non-segmentation” (first column), YOLO11 detected lung nodules more accurately on the original CT image, with confidence levels of 0.78 and 0.72, respectively. In the “Segmentation” scenario (second column), YOLO11 detected significantly reduced confidence levels of nodules in the segmented lung parenchyma region, with confidence levels of 0.51 and 0.63, respectively. This indicates that the detection performance of YOLO11 is significantly affected under segmentation conditions. In contrast, MS-YOLO11 performs more stably and excellently in the “Non-segmentation” scenario. The confidence levels of the detected nodules were 0.82 and 0.92, respectively, significantly higher than the segmentation levels of 0.68 and 0.75. This result indicates that MS-YOLO11 can better adapt to complex background environments, especially performing better in nodule detection with blurred edges or near lung parenchyma boundaries. The comparison chart shows that without lung parenchyma segmentation, nodule detection is more stable and accurate, especially in nodule detection near lung boundaries or complex backgrounds. The high confidence results of MS-YOLO11 under non segmentation conditions also support this point. Research has shown that although lung parenchyma segmentation can reduce non pulmonary interference, it does not always improve detection accuracy. The improved MS-YOLO11 model can better capture key features and improve detection performance without segmentation.
Heat maps
In the task of detecting pulmonary nodules, to more intuitively demonstrate the attention level and feature extraction effect of the model in specific areas, this article generated heat maps of different detection models and conducted a comparative analysis. By comparing the Ground Truth, the YOLO11 model, and the MS-YOLO11 model, the performance and differences of each model in lung nodule detection can be more clearly understood, as shown in Fig. 7.
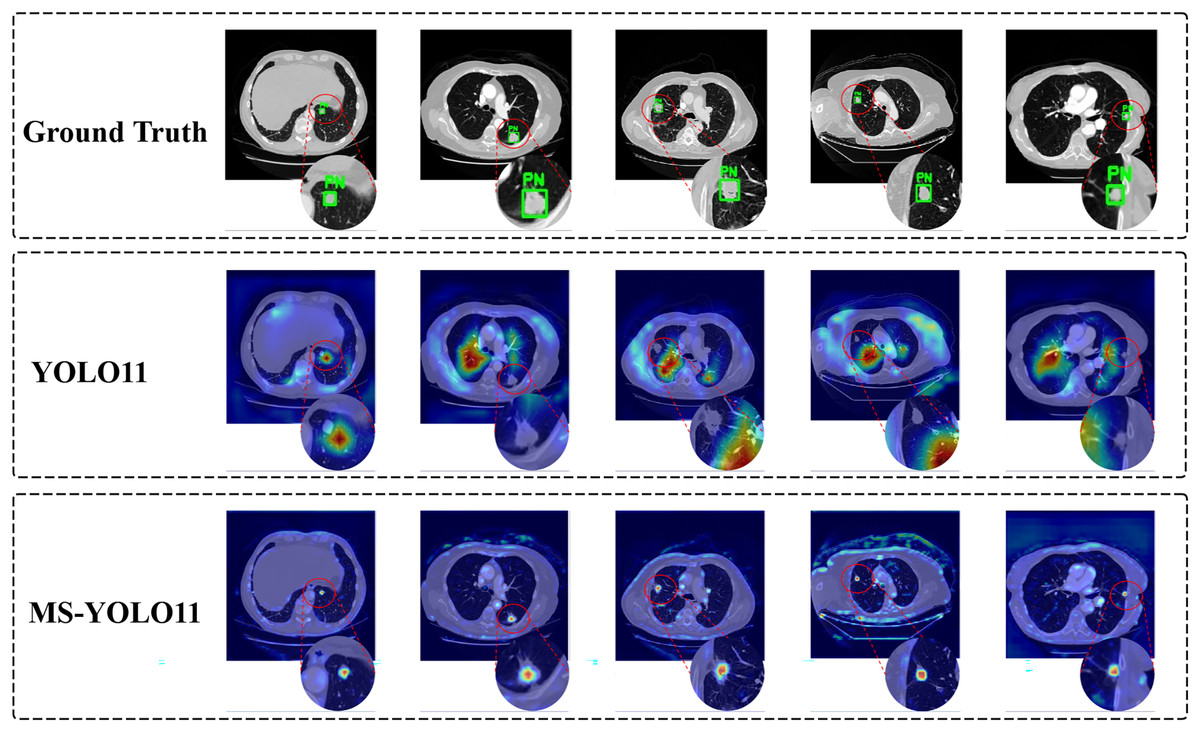
Figure 7: Model attention visualization via heatmaps in pulmonary nodule detection.
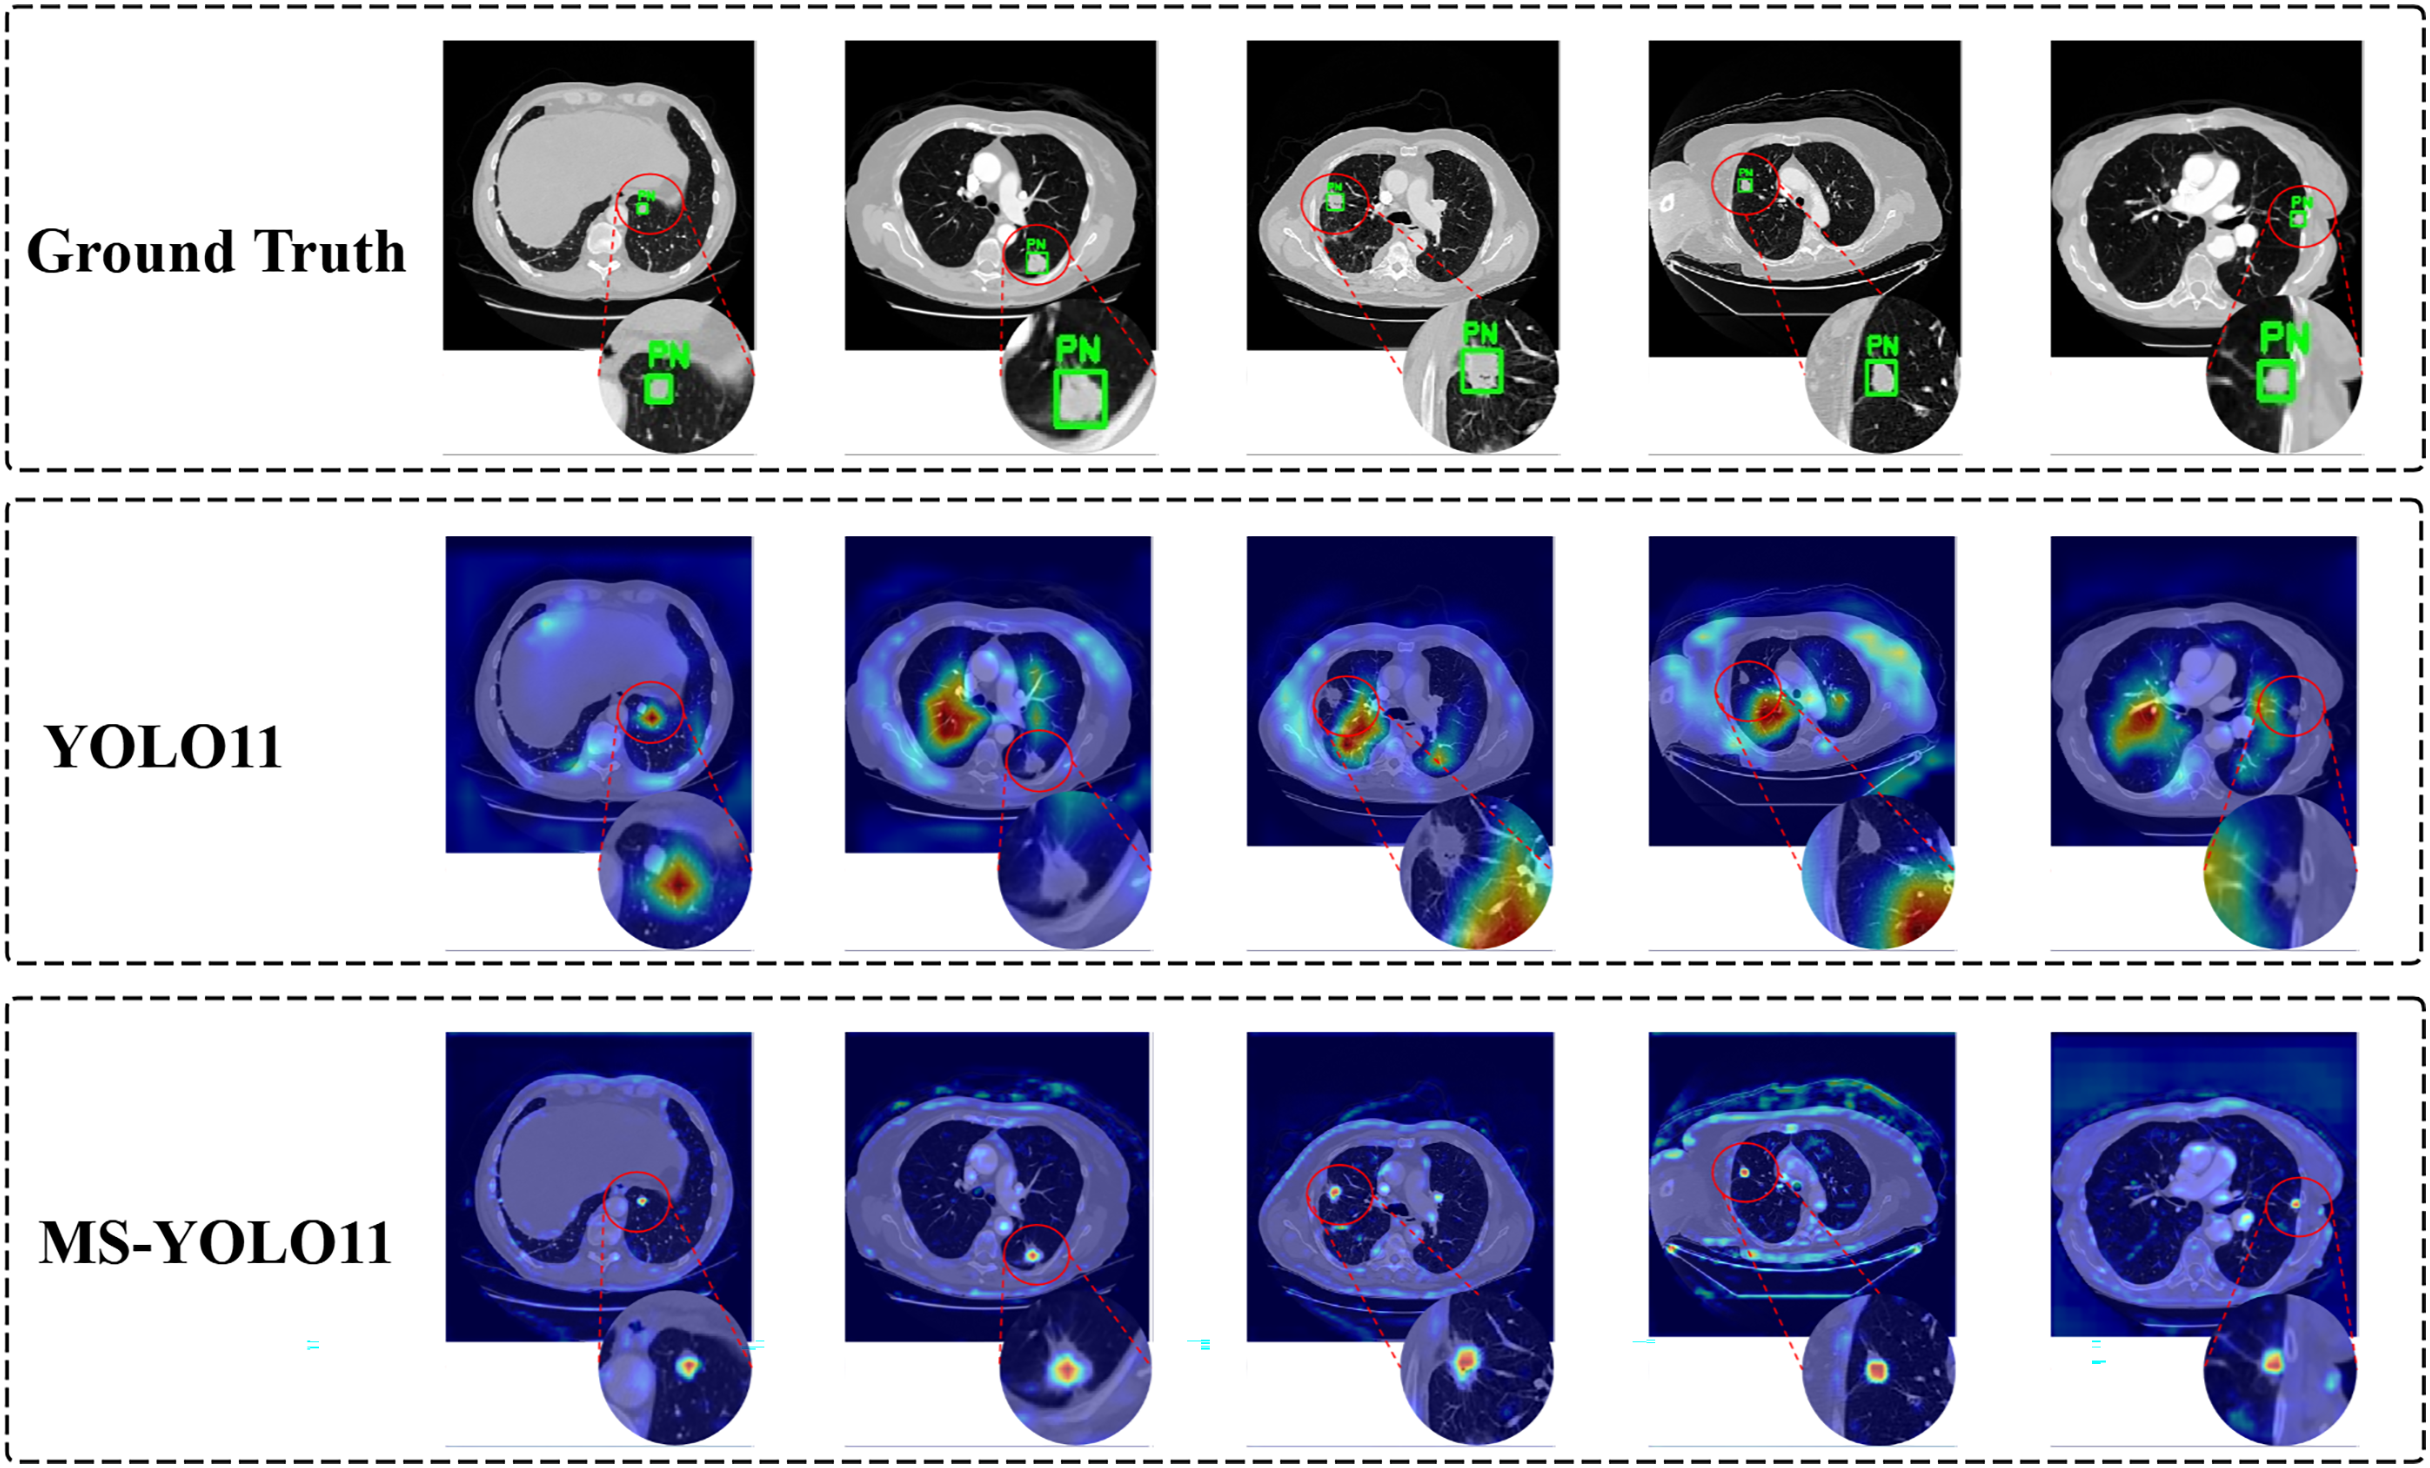
In Fig. 7, the heatmap shows the detection performance of ground truth and different models on several samples. Each row corresponds to the output of the Ground Truth, YOLO11 model, and MS-YOLO11 model in sequence. The red dashed circle in the image is used to highlight the magnification effect of the detection area and assist in demonstrating the model’s attention to the location of nodules. In the Ground Truth row, the annotated pulmonary nodule area (marked with a green box and labeled as “PN (Pulmonary Nodule)”) can be seen from the heatmap. These annotations serve as reference standards for model detection, ensuring accurate capture of target features during the model training process. The heat map of the YOLO11 model shows scattered response to pulmonary nodules, with more noise and misjudgment, limited feature extraction ability, and susceptibility to background interference. The MS-YOLO11 model, through multi-scale feature fusion and improvement strategies, has a more concentrated heatmap response, can accurately focus on lung nodules, suppress irrelevant region responses, improve small nodule detection capabilities, and reduce false alarm rates. Its heatmap has a stronger response at the location of pulmonary nodules, significantly better than YOLO11, reflecting a significant improvement in feature extraction and detection accuracy.
Experimental summary and evaluation analysis
Experimental results show that MS-YOLO11 performs robustly across multiple metrics. Ablation studies confirm that integrating MCA and SMAT enhances detection. Compared with other YOLO variants, Faster R-CNN, SSD, and the recent small-nodule model MSDet, MS-YOLO11 achieves higher mAP50, APsmall, and ARsmall while maintaining a smaller model size. Bypassing lung parenchyma segmentation preserves contextual information, further improving accuracy, demonstrating that MS-YOLO11 is accurate, reliable, and suitable for clinical applications.
Conclusion
This study presented MS-YOLO11, an efficient and robust pulmonary nodule detection framework that integrates the MCA and SMAT methods into the YOLO11 architecture. By leveraging a multidimensional synergistic mechanism, MS-YOLO11 adaptively fuses global and local contextual information across spatial and channel dimensions, thereby enhancing the sensitivity to small nodules and reducing false positives in complex anatomical regions.
Comprehensive experiments on both Luna16 Undivided and Luna16 Segmentation datasets verified the models effectiveness. Under identical experimental settings, MS-YOLO11 consistently outperformed baseline and state-of-the-art detectors, including YOLO series, SSD, Faster R-CNN, and the current most advanced SOTA model, MSDet. In particular, it achieved higher mAP50, APsmall, and ARsmall scores while maintaining a lightweight model size of 9.35 MB, enabling real-time deployment in clinical environments.
Moreover, comparative evaluations demonstrated that MS-YOLO11 performs more effectively on unsegmented CT data, indicating that preserving the complete contextual information of lung slices benefits both localization and classification. Overall, MS-YOLO11 provides an accurate, interpretable, and deployable solution for pulmonary nodule detection, demonstrating clear advancement beyond the current state-of-the-art. Future work will extend validation to multi-center and 3D volumetric datasets to further enhance robustness and generalizability. Additionally, human-in-the-loop evaluation with radiologists will be conducted to establish clinical interpretability and trust, addressing current limitations regarding clinical validation.