
Using multiple correspondence analysis to determine recommended professional profiles for Smart Cities projects
- Published
- Accepted
- Received
- Academic Editor
- Davide Chicco
- Subject Areas
- Human-Computer Interaction, Data Science, Emerging Technologies, Social Computing, Internet of Things
- Keywords
- Engineers, ESCO, Multiple correspondence analysis, Multivariate data analysis, Professional profiles, Smart cities, Technicians
- Copyright
- © 2026 López-Baldominos et al.
- Licence
- This is an open access article distributed under the terms of the Creative Commons Attribution License, which permits unrestricted use, distribution, reproduction and adaptation in any medium and for any purpose provided that it is properly attributed. For attribution, the original author(s), title, publication source (PeerJ Computer Science) and either DOI or URL of the article must be cited.
- Cite this article
- 2026. Using multiple correspondence analysis to determine recommended professional profiles for Smart Cities projects. PeerJ Computer Science 12:e3466 https://doi.org/10.7717/peerj-cs.3466
Abstract
The absence of clearly defined professional profiles for Smart City engineers and technicians motivated this study, which aims to identify their key functions and skill requirements. An international survey was conducted among relevant stakeholders involved in Smart City projects to shape those two profiles. The collected data were analysed through descriptive statistics and Multiple Correspondence Analysis (MCA), allowing the identification of functional domains that are essential for both roles, while also revealing distinctive patterns between them. The findings show that, although engineers and technicians share core technical competencies, engineers place comparatively greater emphasis on soft and green skills. Overall, the study provides an evidence-based characterisation of Smart City professional profiles, contributing to the refinement of European qualification and skills frameworks.
Introduction
The relevance of Smart Cities as a research domain has increased significantly since 2010, reaching a peak around 2018–2019 (Karimi et al., 2021). A Smart City is commonly defined as a complex socio-technical ecosystem in which Information and Communication Technologies (ICT) enhance urban life by addressing challenges related to organisation, resilience, and sustainability (Tsoutsa, Fitsilis & Iatrellis, 2021). The implementation of Smart Cities requires a long-term strategic vision that extends beyond technical deployment, aiming to improve quality of life, promote social inclusion, and foster economic development (Nusir et al., 2024).
In this context, Klisenko & Serral (2022) reviewed sixteen maturity models for evaluating Smart City readiness and emphasised the pivotal role of workforce competencies. Closely related technological domains, such as the Internet of Things (IoT), have identified key enablers of project success (Pospelova et al., 2023; Bhardwaj et al., 2023). However, empirical evidence reveals a shortage of adequately trained professionals and an insufficient talent pipeline to meet the growing demand for Smart City initiatives (Iatrellis et al., 2021).
Recent studies have further highlighted the transformative impact of Artificial Intelligence (AI), IoT, and digital governance in shaping Smart City ecosystems. These emerging areas directly influence the skills required from professionals, who must now combine technical expertise with data-driven decision-making, ethical awareness, and cross-sectoral collaboration. This evolution underscores the urgency of developing updated professional profiles that reflect the integration of new technologies and governance paradigms in Smart City development (European Court of Auditors, 2023).
While other ICT-related domains benefit from established professional standards that guide education, recruitment, and career development, Smart City practice still lacks such frameworks. Neither the European Skills, Competences, Qualifications and Occupations classification (ESCO) (European Commission, 2024) nor the EN16234-1:2019 standard, known as the e-Competence Framework (e-CF) (CEN European Committee for Standardization, 2021), include explicit references to technical Smart City roles. Although ESCO, developed with contributions from over 200 experts, comprises more than 3,000 occupational profiles and 13,000 knowledge and skill descriptors, it only includes a general consultancy profile related to Smart Cities. Similarly, EN16234 defines 41 ICT competencies and 30 example roles, but does not specify functions directly applicable to Smart City projects.
This gap motivated the present study, which aims to define evidence-based professional profiles for Smart City Engineers and Technicians through a comprehensive, data-driven approach. First, expert opinions were collected from multiple countries within the framework of an EU-funded project. Second, robust analytical techniques were employed to extract meaningful patterns from the data. Third, the proposed profiles were aligned with existing qualification frameworks to facilitate their adoption by stakeholders already using ESCO and e-CF as reference systems.
Accordingly, this study addresses the absence of standardised qualification references for Smart City professionals. It seeks to identify and characterise the functional and skill-related dimensions that define engineers and technicians in this domain. The research relies on a multinational dataset of expert opinions analysed using descriptive statistics and multivariate techniques, with ESCO serving as the conceptual foundation. Specifically, this article aims to: (i) define recommended professional profiles for Smart City Engineers and Technicians based on a multinational dataset of expert assessments; (ii) examine the main differences between these profiles, identifying the most influential functional and skill categories; and (iii) explore the relationships between functions and skills within each professional group.
The selection of Multiple Correspondence Analysis (MCA) is justified by its capacity to explore relationships among categorical variables and identify latent structures in multidimensional datasets. This method is particularly suitable for profiling Smart City professionals, as the ESCO-aligned survey relies entirely on qualitative categories. Moreover, MCA enables interpretable geometric representations of associations among functions and skills, which are not easily captured by regression-based or purely quantitative models.
The remainder of this article is organized as follows: ‘Background’ presents the research background; ‘Data Collection’ describes the data collection process and sample composition; ‘Materials and Methods’ outlines the methodological framework; ‘Results’ reports and interprets the empirical results; ‘Discussion’ discusses the findings in light of existing literature; and ‘Conclusions and Further Works’ concludes with final remarks and directions for future work.
Background
As noted earlier, the growing demand for Smart City projects has placed increasing pressure on solution providers, who often face challenges in managing available talent due to the absence of clearly defined qualification profiles for engineers and technicians within development teams. The ERASMUS+ project Boosting the Technical and Non-Technical Skills and Competencies of Smart Cities Technicians and Engineers (SMACITE) (European Commission (Erasmus+), 2025) was conceived to address this challenge by identifying and describing recommended professional profiles as a foundation for designing a multidisciplinary curriculum. The program integrates ICT-related technical skills in Smart City enabling technologies with soft, entrepreneurial, and green skills, thereby fostering the holistic perspective required for successful Smart City implementation.
Within SMACITE, Work Package 2 (WP2) focused on developing a competency map for Smart Cities to outline two emerging professional roles, “Smart Cities Technician” and “Smart Cities Engineer”, aligning them with the ESCO and EN16234 standards to ensure broad European applicability. The development of the competency map followed a two-phase process. In the first phase, desk research and focus groups involving experts and key stakeholders were conducted to identify an initial set of relevant knowledge areas, skills, and competencies. In the second phase, an international online survey was distributed among three main stakeholder groups and key beneficiaries: (i) municipalities as clients, (ii) Smart City solution providers as suppliers, and (iii) users represented by independent experts. Stakeholder input was essential to refine and validate the professional profiles for Smart City roles.
The desk research began with a review of academic programs, European projects, white papers, and technical reports related to Smart City professionalism. This analysis enabled the identification of core knowledge areas and the most comparable occupations within the ESCO framework (European Commission, 2024), providing the conceptual foundation for the “Smart Cities Technician” and “Smart Cities Engineer” profiles. A complementary reference was the Erasmus+ project Smart DevOps (European Commission (Erasmus+), 2018), which examined the adaptation of DevOps principles to the management and operation of Smart City Information Technology (IT) projects (Panagiotakopoulos, Iatrellis & Kameas, 2022). As a result, a set of technical functions and competences, non-technical functions and competences focused on sustainability and the environment, and finally, both interpersonal and personal soft skills were added. Aligned with post-pandemic frameworks, the project also incorporated resilience and adaptability as soft competencies, recognising their importance in responding to disruptions, fostering organisational learning, and supporting sustainable urban transitions.
The identification of functions and competencies was guided by a panel of five experts from three European countries within the SMACITE project. This panel reviewed the technological domains most relevant to Smart City implementation using ESCO-aligned terminology and supporting literature. Through a consensus-based process, they selected the following categories as essential for inclusion in the survey: the IoT, cybersecurity, cloud computing, data analytics, and machine learning/big data. These domains were considered sufficiently comprehensive to represent the technological backbone of Smart City projects from both engineering and technical perspectives.
As described in the introduction, ESCO offers detailed descriptions of more than 3,000 occupations. A deeper analysis of the identified domains was conducted using a local replica of the ESCO 1.1 database, which facilitated semantic searches to detect relevant terms and associations linked to Smart City projects. This process led to the identification of 15 relevant occupations covering all key thematic areas. These functions, classified by their relevance for Smart City engineers or technicians, enabled the distinction between essential and optional knowledge and skills for each profile.
Based on the evaluation of the expert panel, three initially proposed technologies (3D printing, blockchain, and drones) were excluded from the final version of the survey due to their limited and context-specific relevance in current Smart City professionalism. Other technologies, such as 5G and robotics, were discussed during the panel but they were not added because they were either considered transversal enablers already embedded in IoT and AI-based systems, or not yet sufficiently standardised within ESCO occupational categories. This decision ensured conceptual alignment with ESCO while maintaining a manageable and interpretable survey structure. The soft skills were grouped in accordance with the experts’ recommendations. To be aligned with post-pandemic tendencies, the project incorporated resilience and adaptability as soft skills, recognising their importance in responding to disruptions, fostering organisational learning, and supporting sustainable urban transitions.
Unlike existing competence models, such as the European e-CF (EN16234-1:2019) or traditional Smart City maturity models, the present study integrates the ESCO taxonomy with a data-driven analytical approach. This combination enables an evidence-based alignment between emerging professional roles and functional areas grounded in real-world Smart City practice. The application of MCA allows for an empirical exploration of relationships among categorical variables, revealing underlying competence structures that extend beyond descriptive classifications and reflect the perspectives of field experts.
Data collection
The study relies on an exploratory and opportunistic sample including professionals from several European countries (Bulgaria, Greece, Ireland, Netherlands, Romania, Spain, Italy, Portugal, Germany, Sweden, and Poland). Although not representative of the entire European Smart City ecosystem, it captures diverse perspectives across regions and provides valuable insights into emerging competence trends.
As stated before, the first step was the validation of the profiles by conducting an online survey with stakeholders and main beneficiaries. Experts of the focus work continued working on linking key terms on ESCO descriptions for functions, skills, and knowledge with the survey statements to make the survey more user-friendly in terms of dedication and comprehension requirements while maintaining the link to the reference framework. In line with ESCO, engineers are considered professionals primarily engaged in system design, integration, and coordination, whereas technicians are mainly focused on implementation, maintenance, and operational support. Additionally, the following considerations were adopted in the design of the survey:
Survey items were pilot-tested by the expert focus group composed of five professionals from three European countries to ensure clarity, consistency, and terminological accuracy. The final Likert categories used in the survey were Essential, Relevant, Useful, Marginal, Worthless, and Not Sure.
Statements and questions were designed to be concise and synthetic to avoid excessive length and dedication requirements.
The survey was designed initially in English; however, some project partners translated it into their local languages to facilitate participation.
The survey’s content was thoughtfully organised into three distinct sections. Each section addresses specific aspects of the subject matter, ensuring a comprehensive and well-structured approach to gathering valuable insights. These sections were:
Profile data. In this section, participants are asked about their gender, nationality, and experience in the Smart Cities field, including years of experience, stakeholder (client side, supply side, or user side), and their role within the stakeholder.
Functions and responsibilities. Participants are asked to rate each function derived from the desk research according to the designed scale.
Competencies and knowledge for the profiles. Participants are asked to what extent each category of competencies is important for Smart City engineers and technicians. Competencies and knowledge were structured into four main categories: Enabling Technologies, Management and Business, Green Skills, and Soft Skills. The list of enabling technologies was defined following the ESCO framework and complemented with recent literature (Myung & Wang, 2021).
Survey development and validation have been previously published by the authors (Pospelova et al., 2023) in another journal. In the present study, additional details are provided regarding the expert validation process. Specifically, a five-member panel from three European countries reviewed and refined the list of enabling technologies to ensure conceptual alignment with ESCO and practical relevance for Smart City professionalism. The panel agreed that IoT, cybersecurity, cloud computing, data analytics, and machine learning/big data captured the essential technological domains for inclusion. Based on the reviewed literature, the following section describes the survey design and data collection process.
Survey implementation and sampling process
In this study, two professional profiles were considered: Smart City engineers and technicians. The distinction follows the ESCO classification and the perspective adopted in the SMACITE project. As professionals, engineers are usually responsible for system design, integration, and decision-making in Smart City projects, typically holding university-level qualifications and engaging in analytical or managerial functions. Technicians, by contrast, primarily focus on implementation, maintenance, and operational support, often with vocational or technical education. This operational definition guided the analysis of roles, skills, and dependencies presented in the following sections.
Countries were grouped into five European subregions (Central, Eastern, Northern, Western, and Southern Europe) following the EuroVoc classification (European Commission, 2025). However, as not all countries within each EuroVoc-defined region were represented in the sample, this grouping was adapted for analytical purposes. Southern Europe was retained as a separate category given its higher representation, allowing more consistent intra-regional comparisons.
Based on this distinction, the study presented in this article was conducted as an observational, cross-sectional, and retrospective study, which took place from 25th July 2022 to 18th September 2022. This online survey was launched in English, Spanish, Italian and Greek and distributed to different stakeholders from the public, private or civil sectors involved in Smart Cities projects with different roles. The distribution of this survey was made at the European level and considered different types of stakeholders: client, supply and user side. No gender preferences were considered in distributing this survey, and neither familiarity nor experience with Smart Cities has been considered, allowing different types of users to give their opinions.
The access to the survey was disseminated through links of URL shortener (Bit.ly) to keep track of clicks. There were 394 clicks during the period of dissemination of the survey. The survey finally collected 142 contributions to the questionnaire; the rate of response was 36%. The language with the highest number of clicks was Spanish (194 clicks), followed by English (148 clicks). The country with the highest rate of responses was Spain (35.6%). Finally, the survey responses generated a data set with 142 records and 24 variables.
Before analysis, data cleaning was performed to merge low-frequency categories (less than 5%) and to standardise the naming of professional roles, ensuring consistency across responses. Both the raw and preprocessed datasets are provided as Supplemental Materials for full transparency and reproducibility.
Initial sample
As has been described before, the data set obtained a total of 142 records, which represented our initial sample size. The full list of profile variables is provided in Table 1.
| Variable | Description | Categories |
|---|---|---|
| Nationality | Limited only to Europe to obtain better comprehension of final results aligned to the European frameworks |
|
| Familiarity with Smart Cities | Familiarity with the asked topic |
|
| Gender | Further analysis of roles differences classified by gender |
|
| Experience | General, not limited to the topic, working years of experience |
|
| Stakeholder | Identify what is the working field of the user: supply/user/client side |
|
Additionally, this data set also contains variables related to the user’s opinion about the qualification profile. A total of 10 variables, regarding functions and skills categories, were asked for the engineer profiles and 9 for technicians. To populate the data set with this information, it has been based on user responses following the statements for engineers’ and technicians’ functions. These statements were extracted from the ESCO framework, and they contained an agreement for the functions and skills categories that an ICT profile oriented to Smart Cities would be desirable to have. The statements were measured following the Likert 5 scale: essential, relevant, useful, marginal, worthless and another control option: not sure.
For both roles (engineer and technician), the different functions and skills categories have been surveyed. According to the information contained in the ESCO framework, the description of the different functions in this area is provided. For engineers the study included functions related to Civil Engineering (CivilEng), Project Management (PM), Cloud Computing (Cloud), Security, Data Analytics (Data), and Internet of Things (IoT) and skills related to Enabling Technologies (ET), which include IoT, Security, Cloud and Data skills, Business and Management (B/M), Soft (SS) and Green skills (GS). For technicians, the study considered the same functions and skills except for CivilEng. Note that IoT appears in the study both as a professional function and as a skill. In the first case, it refers to professional activities in this field; in the second, it represents a technological ability in this domain that is considered essential for Smart City implementation.
Table 2 contains a summary of the variables asked in the survey for each role. For each variable, participants were asked to indicate its importance regarding Smart Cities according to the categories Essential, Relevant, Useful, Marginal, Worthless, and Not Sure. Note that the functions listed in Table 2 refer to professional roles and responsibilities, not to specific Smart City technology domains (e.g., smart mobility, smart energy, or smart waste management). The survey was designed to capture cross-cutting functions that are relevant across multiple Smart City areas, rather than vertical segments.
| Role | Functions | Skills | Categories |
|---|---|---|---|
| Engineer |
|
|
|
| Technician |
|
|
|
Based on these statements, a further analysis is performed as described in the following sections.
Materials and Methods
This section details the analytical framework applied to explore relationships among categorical variables from the survey. The approach integrates hypothesis testing ( and Fisher’s Exact tests) with MCA to identify patterns in functions and skills for Smart City engineers and technicians.
Multivariate data analysis
Data analysis techniques can be broadly divided into two categories according to the number of variables considered simultaneously: Univariate Data Analysis (UDA) and Multivariate Data Analysis (MDA) (Hair, 2011). UDA explores each variable individually through descriptive statistics such as measures of position, central tendency, shape, and dispersion. In contrast, MDA is applied when analysing three or more variables jointly, capturing multidimensional relationships. The particular case of two-variable studies is referred to as Bivariate Data Analysis (BDA), which can be viewed as a subset of MDA.
Within MDA, the choice of method depends on the nature of the variables. When all variables are quantitative, Principal Component Analysis (PCA) is commonly used. When all variables are qualitative, Correspondence Analysis (CA) is the appropriate technique, selecting between Simple Correspondence Analysis (SCA) or MCA, depending on whether two or more categorical variables are considered. For mixed datasets, combining quantitative and qualitative variables, the Factorial Analysis of Mixed Data (FAMD) is typically employed. Figure 1 illustrates the main types of multivariate analysis methods (adapted from Abdi & Valentin (2007)).
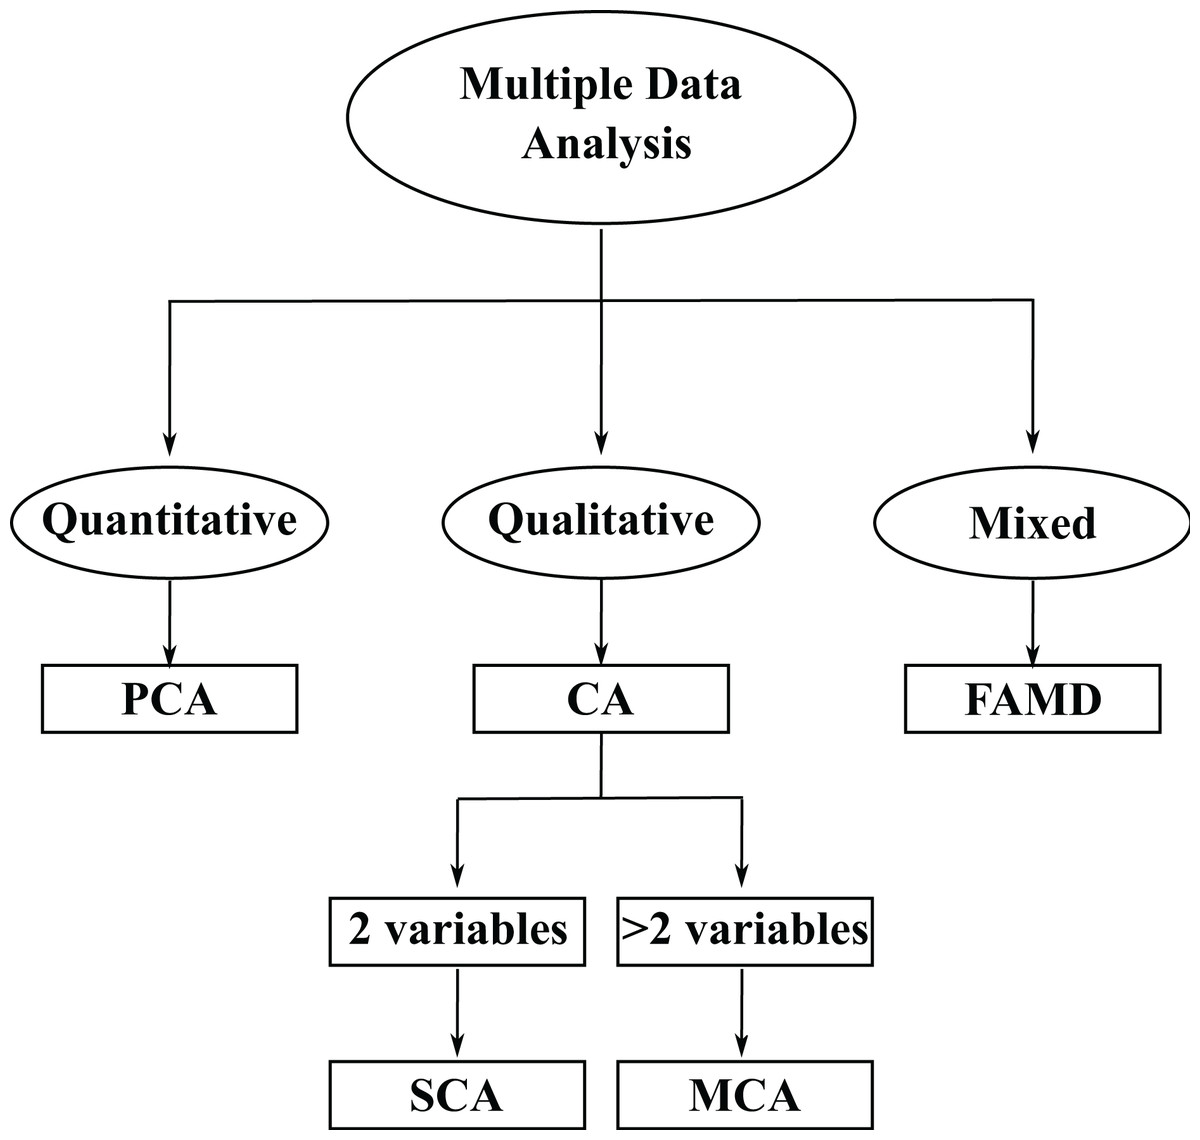
Figure 1: Overview of multiple data analysis techniques: PCA (quantitative), CA/MCA (qualitative), FAMD (mixed).
Adapted from Abdi & Valentin (2007).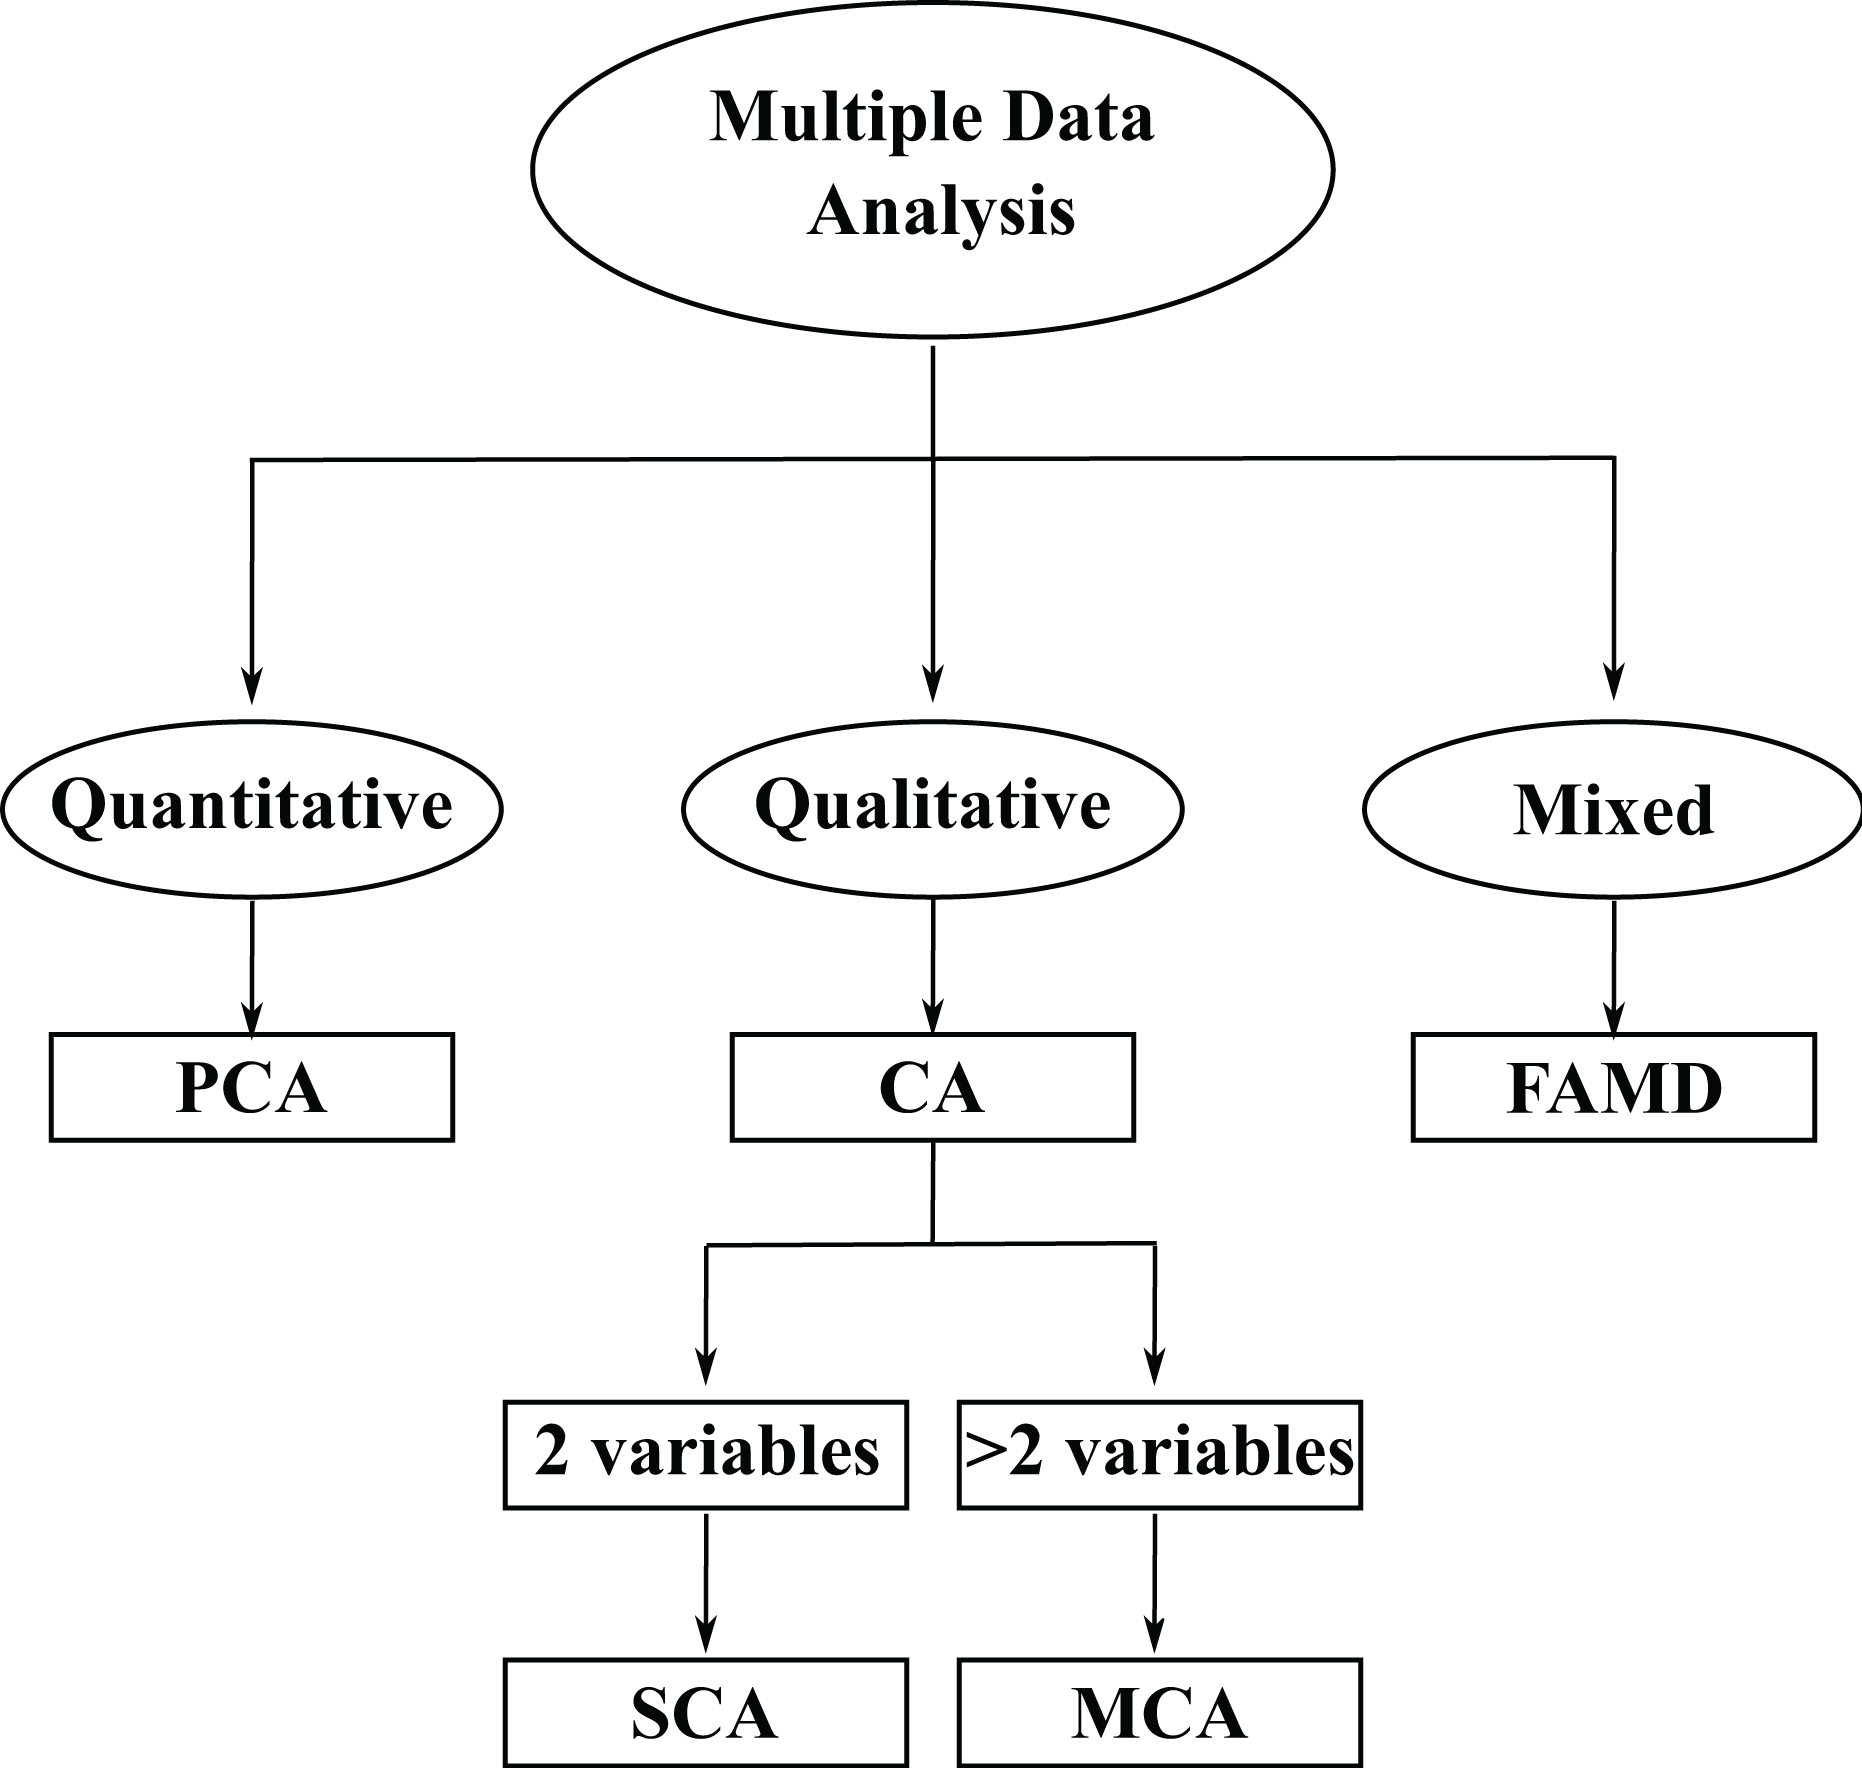
In this article, since all variables are categorical, MCA was applied to capture their multidimensional associations, as detailed in the following section.
Multiple correspondence analysis
CA (and MCA for multiple variables) is the counterpart to PCA for categorical or qualitative variables. For mixed datasets combining quantitative and qualitative variables, the appropriate method is FAMD (Mardia, Kent & Taylor, 2024).
In the case of SCA, the starting information is a matrix of dimensions , which represents the observed absolute frequencies of two qualitative variables in n elements. The first variable is represented by rows, and it is assumed that it takes I possible values, and the second is represented by columns, and takes J possible values. In this way, a matrix of positive values is generated whose tabular representation is called a contingency table, where the number in each cell represents the absolute frequency observed for each combination of the two variables.
The SCA is, therefore, a procedure to summarise the information contained in a contingency table created according to the procedure specified above. One of the ways that SCA can be interpreted is as a way to represent variables in a lower-dimensional space, analogous to PCA, but defining the distance between points consistent with the interpretation of the data. That is why, instead of using the Euclidean distance, the distance is considered.
From a technical perspective, MCA is derived by applying a standard SCA to an indicator matrix, where the entries are binary (0 or 1). Adjustments are made to account for corrected percentages of explained variance, and the interpretation of interpoint distances is adapted to align with the SCA framework.
MCA, a technique developed by Benzécri (1973), is employed to analyse a collection of observations characterised by a set of nominal variables. Each nominal variable consists of multiple levels, and each of these levels is represented as a binary variable. Thus, the complete data table is formed by binary columns, each having one and only one column assigned the value per nominal variable. This way, the coding structure of MCA implies that each row sums up to the same total, which, in the context of SCA, suggests that each row possesses the same mass probability function (Abdi & Valentin, 2007).
For reasons of simplicity, the case of two variables is first defined, that is, the context of an SCA.
Let be the matrix of relative frequencies obtained by dividing each cell by the total number of observed elements and let be the relative frequencies for and , which verify that
(1)
The matrix can be considered by rows or by columns because any logical analysis of this matrix must be equivalent to that applied to its transpose. This is due to the choice of the variable to be placed in rows, instead of columns, being arbitrary, and should not influence such an analysis. Next, the analysis by rows of this matrix is presented. Analogously, the analysis by columns is performed.
In the analysis of by rows, the I rows can be taken as I points in the space . The objective is to find a representation of these I points in a space with a smaller dimension that allows us to appreciate their relative distances. This objective is analogous to the one pursued with the PCA, but now the peculiarities of the qualitative data are taken into account. These peculiarities come from the fact that the relative frequency of each row is different, which implies that: (i) all rows (points in ) do not have the same weight since some rows contain more data than others. When representing the set of rows (points), more weight should be given to those rows that contain more data. (ii) The Euclidean distance between points is not a good measure of their proximity, and this distance must be modified, as it will be seen above.
Starting with the first point, each row of the matrix has a relative frequency, , defined as
(2) Let be the vector which contains the set of these relative frequencies calculated as follows
(3) where is a column vector of length J which contains the value 1 in all its positions. This way, the vector can be considered as weights since they are positive numbers that sum to one. Thus, the vector of weights can be used to give the proportional weight to each row.
Analogously, in the analysis of by columns, the J rows can be taken as J points in the space . Let be the vector which contains the set of these relative frequencies calculated as follows
(4) where denotes the transpose matrix of and is a row vector of length I which contains the value 1 in all its positions.
As said before, the aim is to find a representation of these I points in a space of smaller dimensions that allows us to appreciate their relative distances. Next, the distance measure which should be used will be analysed. Let be the matrix which represents the conditioned relative frequencies given by
(5) where is a diagonal matrix with the terms of the vector , are the relative frequencies of the rows, on the main diagonal. This operation transforms the original matrix of relative frequencies, , into another matrix whose row entries sum to one. Each row of this matrix represents the distribution of the variable in columns conditioned on the attribute represented by the row.
Let be the -th row of the matrix of row-conditioned relative frequencies, which can be considered a point (or a vector) in the space . Since the sum of the components of is equal to 1, all points are in a dimensional space. The aim is to project these points into a lower-dimensional space so that rows with the same structure are close, and those with a very different structure are far apart. To this end, a measure of distance between two rows and is defined for with . One possibility is to use the Euclidean distance, but this distance has the drawback of treating all components of these vectors equally.
To obtain reasonable comparisons between these relative frequencies, it is necessary to consider the relative frequency of occurrence of the attribute under study. In the case of rare attributes, small absolute differences can result in significant relative differences, whereas for attributes with high frequency, the same difference may be less important. An intuitive way to construct comparisons is to weigh the differences in relative frequency between two attributes inversely proportional to the frequency of that attribute. Let be the distance between rows and defined as
(6) where is a diagonal matrix with terms . Since this metric considers the relative frequency of each attribute when calculating the distance between rows, it provides a more meaningful comparison.
The sum of all these distances, weighted by their significance, is known as the total inertia of the table. Inertia is a term used to describe the total variance or variability in the data captured by the analysis. Inertia is a fundamental concept similar to the total variance explained in PCA for continuous data. The inertia is obtained based on the contingency table or cross-tabulation of categorical variables. This table displays how the categories of one variable are distributed concerning the categories of another variable.
As previously mentioned, the SCA can be extended to study tables of any dimension under the name of MCA. In this approach, singular value decomposition is used to simultaneously approximate all two-dimensional tables that can be derived from a multidimensional table. Thus, in MCA, the inertia is computed based on the contingency table or cross-tabulation of categorical variables. This table shows how the categories of one variable are distributed with respect to the categories of other variables.
As in SCA, in MCA, inertia represents the total variability or information contained in the categorical data set. It quantifies how much information or structure is present in the data, taking into account the relationships between categorical variables. Additionally, the inertia can be partitioned into separate contributions from each dimension or component extracted in the analysis. This partitioning helps identify how much of the total variability is explained by each dimension. Eigenvalues and their corresponding eigenvectors are used for this purpose.
This way, eigenvalues in MCA are used to measure the variance or inertia explained by each dimension or component because they are considered a critical tool for understanding the structure of categorical data and identifying the most relevant patterns and relationships. Next, the steps performed by MCA to assess the importance of each dimension or component and make informed decisions about dimensionality reduction and data interpretation are explained:
-
1.
MCA begins by constructing a Burt matrix (also known as the indicator matrix) that encodes the relationships between the categorical variables. The eigenvalues of this matrix represent the total variance in the data.
-
2.
MCA then computes the cross-products matrix, which is derived from the Burt matrix. The eigenvalues of this matrix represent the variance explained by each dimension or component
-
3.
The eigenvalues provide a measure of how much variance each dimension or component explains in the data. Higher eigenvalues correspond to dimensions that capture more of the variation in the data, while lower eigenvalues indicate dimensions with less explanatory power.
-
4.
Eigenvalues are often used to decide how many dimensions or components to retain in the analysis. A common criterion is to retain dimensions with eigenvalues greater than 1 or some other threshold. These dimensions are considered meaningful and contribute significantly to explaining the variance in the data.
-
5.
Finally, scree plots, biplots and different numerical values are provided. Both plots are defined below.
To interpret an MCA, assessing whether there is a significant dependence between the rows and columns is first necessary that is, the relationship between different variables must be analysed two by two. The method used for this purpose is detailed below.
MCA was selected because it enables the joint exploration of relationships among multiple categorical variables, providing a factorial representation of their associations. This method is particularly suitable given the purely qualitative nature of the dataset.
Variable design for multiple correspondence analysis
Based on this design, separate MCAs were conducted for engineers and technicians to capture the factorial structure of competences and functions. Two thematic blocks were analysed independently: (i) professional functions and (ii) competencies. For technicians, active variables in the functions block included PM-Civil, Cloud, Security, Data, and IoT, whereas for engineers these comprised PM, Cloud, Security, Data, IoT, and CivilEng. The skills block, common to both profiles, included ET, B/M, SS, and GS. Socio-demographic attributes (Nationality, Experience, Gender, Familiarity, Stakeholder) were excluded from all MCAs as they were considered contextual rather than active dimensions. This information is presented in Table 3.
| Qualification profile | Excluded variables | Included variables (Functions) | Included variables (Skills) |
|---|---|---|---|
| Technicians | Nationality | PM-Civil | ET |
| Experience | Cloud | B/M | |
| Gender | Security | SS | |
| Familiarity | Data | GS | |
| Stakeholder | IoT | ||
| Engineers | Nationality | PM | ET |
| Experience | Cloud | B/M | |
| Gender | Security | SS | |
| Familiarity | Data | GS | |
| Stakeholder | IoT | ||
| CivilEng |
Hence, each MCA was performed on a thematic subset of variables (e.g., professional functions and competencies), rather than on the entire dataset simultaneously. As a result, the number of active categories in each run remains limited, ensuring an adequate ratio between individuals and categories. Although no strict threshold is defined, exploratory guidelines suggest a ratio of 5–10 individuals per active category or at least ten times as many individuals as total active categories (Greenacre & Blasius, 2006; Hair, 2011). Thus, the present analysis satisfies this condition.
Relationship between two variables
The study of the relationship between two variables is generally analysed using an inferential technique known as hypothesis testing. The data set considered in this article consists entirely of qualitative variables. To assess pairwise associations between categorical variables prior to dimensional reduction, tests of independence and Fisher’s Exact test (for small expected frequencies) were applied.
The test of independence is a non-parametric statistical technique based on contingency tables. This test assesses whether the distribution of one variable differs significantly across the categories of another. The null hypothesis ( ) assumes independence between the variables, while the alternative ( ) indicates a statistically significant relationship.
In this case, the test statistic is computed as:
(7) being and the number of rows and columns, respectively, and where denotes the expected frequency of the cell under the null hypothesis given by
(8) where N is the total number of observations, and and represent the marginal totals for rows and columns, respectively.
Under , the statistic follows a distribution with degrees of freedom. The -value is derived from this distribution, and results are evaluated at a significance level of .
When the assumption of minimum expected frequencies ( ) was not met, Fisher’s Exact test was applied instead. Unlike the test, which relies on asymptotic approximations, Fisher’s test computes the exact probability of observing a given frequency distribution under the null hypothesis of independence. This makes it particularly suitable for small samples, contingency tables, or cases with low expected frequencies (typically in any cell). However, for large samples, the test remains preferable, as Fisher’s test can be overly conservative, increasing the likelihood of Type II errors. Therefore, in this study, the test was used when all expected frequencies satisfied , and Fisher’s Exact test was applied otherwise.
When performing multiple pairwise independence tests among categorical variables, the probability of committing at least one Type I error (false positive) increases with the number of comparisons. To maintain the overall confidence level, the Bonferroni correction was applied to control the family-wise error rate (FWER). Formally, given tests, the probability of rejecting at least one true null hypothesis is bounded by the Boole inequality as follows:
(9)
By assigning each individual test a significance level , it is ensured that , even when the tests are not independent. Equivalently, this can be expressed in terms of adjusted p-values:
(10) where denotes the original p-value and is the total number of pairwise tests. Associations were considered statistically significant when . This conservative adjustment guarantees that only robust relationships are retained for subsequent analysis, reducing the likelihood of spurious dependencies introduced by multiple testing.
Following the application of the Bonferroni correction, the magnitude of each statistically significant relationship was further assessed using the effect size coefficient , derived from the statistic ( ) as described below. The magnitude of each association was quantified as:
(11) where denotes the value defined in Eq. (7), and N is the total sample size. This formulation expresses the proportion of total variance in the contingency table that can be attributed to the association between variables. Values of close to 0 indicate weak relationships, whereas values approaching 1 suggest stronger dependencies. Following (Cohen, 1988) conventional benchmarks, was considered weak, moderate, and strong. These thresholds were used to support the interpretation of association strength beyond statistical significance. The combination of Bonferroni-adjusted p-values and coefficients provided a robust basis for selecting relevant variable pairs to be included in the subsequent MCA dimensional reduction.
To further assess the robustness and stability of the MCA results, a non-parametric bootstrap procedure was applied. Bootstrap resampling is a data-driven simulation method that repeatedly draws samples with replacement from the observed dataset, recomputing the analysis on each replicate to estimate the variability of the results (Efron & Tibshirani, 1994). This approach provides empirical confidence measures for the coordinates of categories and dimensions, allowing the evaluation of the stability of the factorial space.
Considering that four independent MCA models were estimated, corresponding to the functions and skills of engineers and technicians, separate bootstrap analyses were carried out for each dataset to account for potential structural differences among subgroups. In each case, 1,000 bootstrap samples were generated, and the corresponding MCA solutions were recalculated. The variability of category coordinates across replications was examined to assess the stability of the factorial dimensions and the consistency of category projections. Categories showing low coordinate dispersion were interpreted as robust indicators of the underlying factorial structure. This procedure ensures that the identified dimensions and associations are not artefacts of sample composition but instead reflect stable multivariate relationships within each professional profile.
To evaluate the reliability of the factorial structures, a non-parametric bootstrap procedure was applied by resampling individuals with replacement. This approach, commonly used in exploratory multivariate analysis, allows for assessing the sensitivity of category coordinates to variations in the dataset while preserving the original joint distribution of responses. By replicating the sampling process across the full dataset, the method provides an unbiased estimation of coordinate variability and overall model robustness. Alternative strategies, such as stratified or category-wise bootstrapping, were considered but ultimately discarded, as they restrict the natural variability of the data by fixing category proportions. Therefore, the individual-level resampling strategy adopted here was considered the most suitable for evaluating the overall stability of the MCA configurations.
Results
This section contains the results obtained. First, the sample preprocessing is explained. Next, a descriptive analysis is detailed. Finally, the MCAs are developed.
Sample preprocessing
As it was detailed before, the dataset initially contains 142 records and 24 variables. However, during the analysis of the results, some of the categories related to user profile data obtained only a few answers, representing less than 5% of the total obtained registers. This is the case for gender and working experience, as one of the possible options in the survey was “prefer not to say”. These registers have been removed from the sample as the data size was not representative enough.
Similar cases happened to functions and skills categories. The registers where the user had selected the options marginal, worthless and not sure were removed from the sample due to very low representativeness, as most variables in the data set were identified as relevant. The sample preprocessing led to adjusting the original data set, which contained 142 records, obtaining a new adjusted sample with 88 records. After the first adjustment, the data set was analysed again, and the variables which were identified with less than 15% representativeness were grouped into common categories.
Although categories such as Marginal and Worthless were initially included in the analysis, their frequency was below 5%. To ensure statistical robustness, these categories were excluded from the final model. A bootstrap resampling procedure was applied to assess the stability of category coordinates. Results revealed that categories with frequencies below 5% exhibited high coordinate variability, indicating instability in their representation within the factorial space. Consequently, their exclusion improves the robustness and interpretability of the MCA results.
Thus, Table 4 summarises the adjustments made to the survey. The preprocessed sample for further analysis contains a total of 88 records and 24 variables.
| Survey question | Initial sample categories | Merged categories |
|---|---|---|
| Nationality (European Commission, 2025) |
|
|
|
|
|
| Familiarity with Smart Cities |
|
|
|
|
|
|
|
|
| Experience |
|
|
|
|
|
| Relevance of functions and importance of skills categories |
|
|
|
|
|
|
|
Descriptive analysis
This section provides a descriptive analysis of all the variables in the dataset. First, Fig. 2 presents a graphical representation of the frequency distribution of the variables related to the user profile. Based on the frequency distributions represented in this figure, the general profile of the sample related to the user profile can be determined by considering the modal class (the category with the highest frequency) for each variable. Thus, the general profile corresponds to a male (74%) from Southern Europe (74%), an origin according to EuroVoc classification (European Commission, 2025), with more than 10 years experience (72%), having high qualifications and professional experience in the field (44%), and belonging to the business sector and providers (48%).
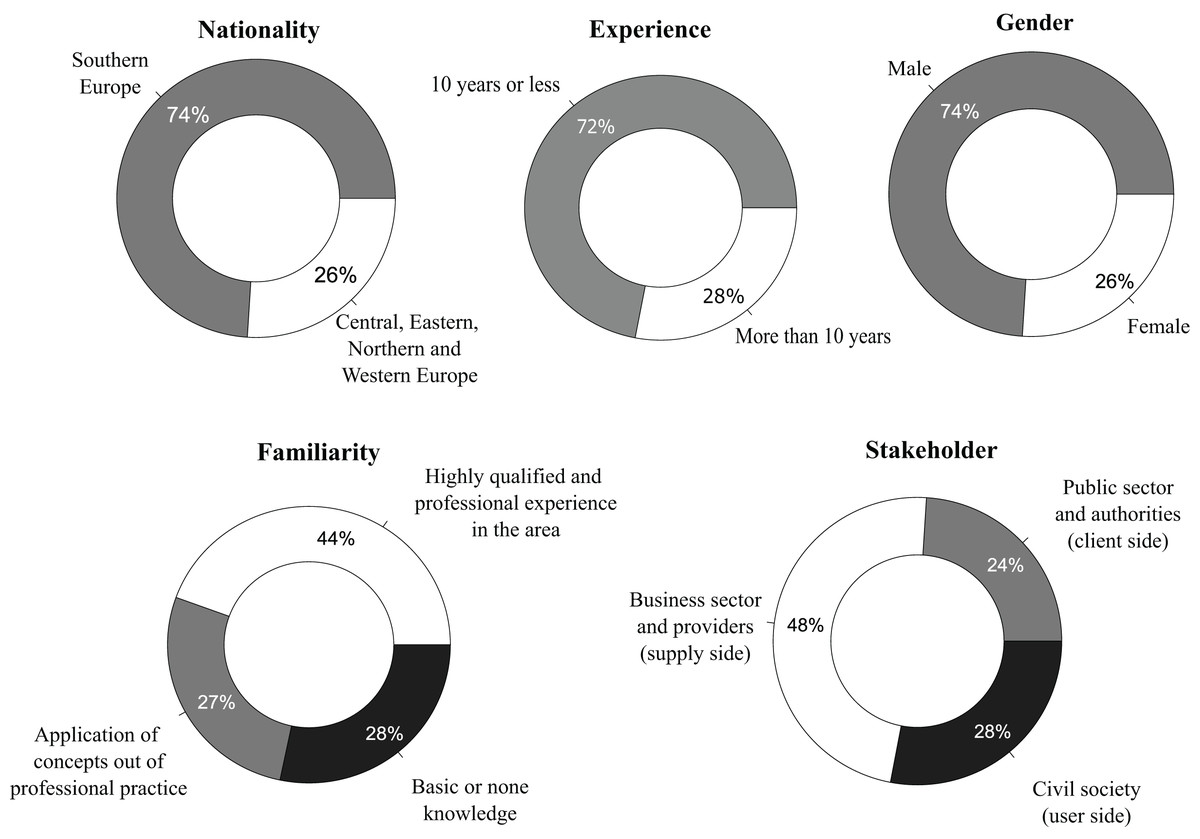
Figure 2: Frequency distribution of the variables related to the user profile.
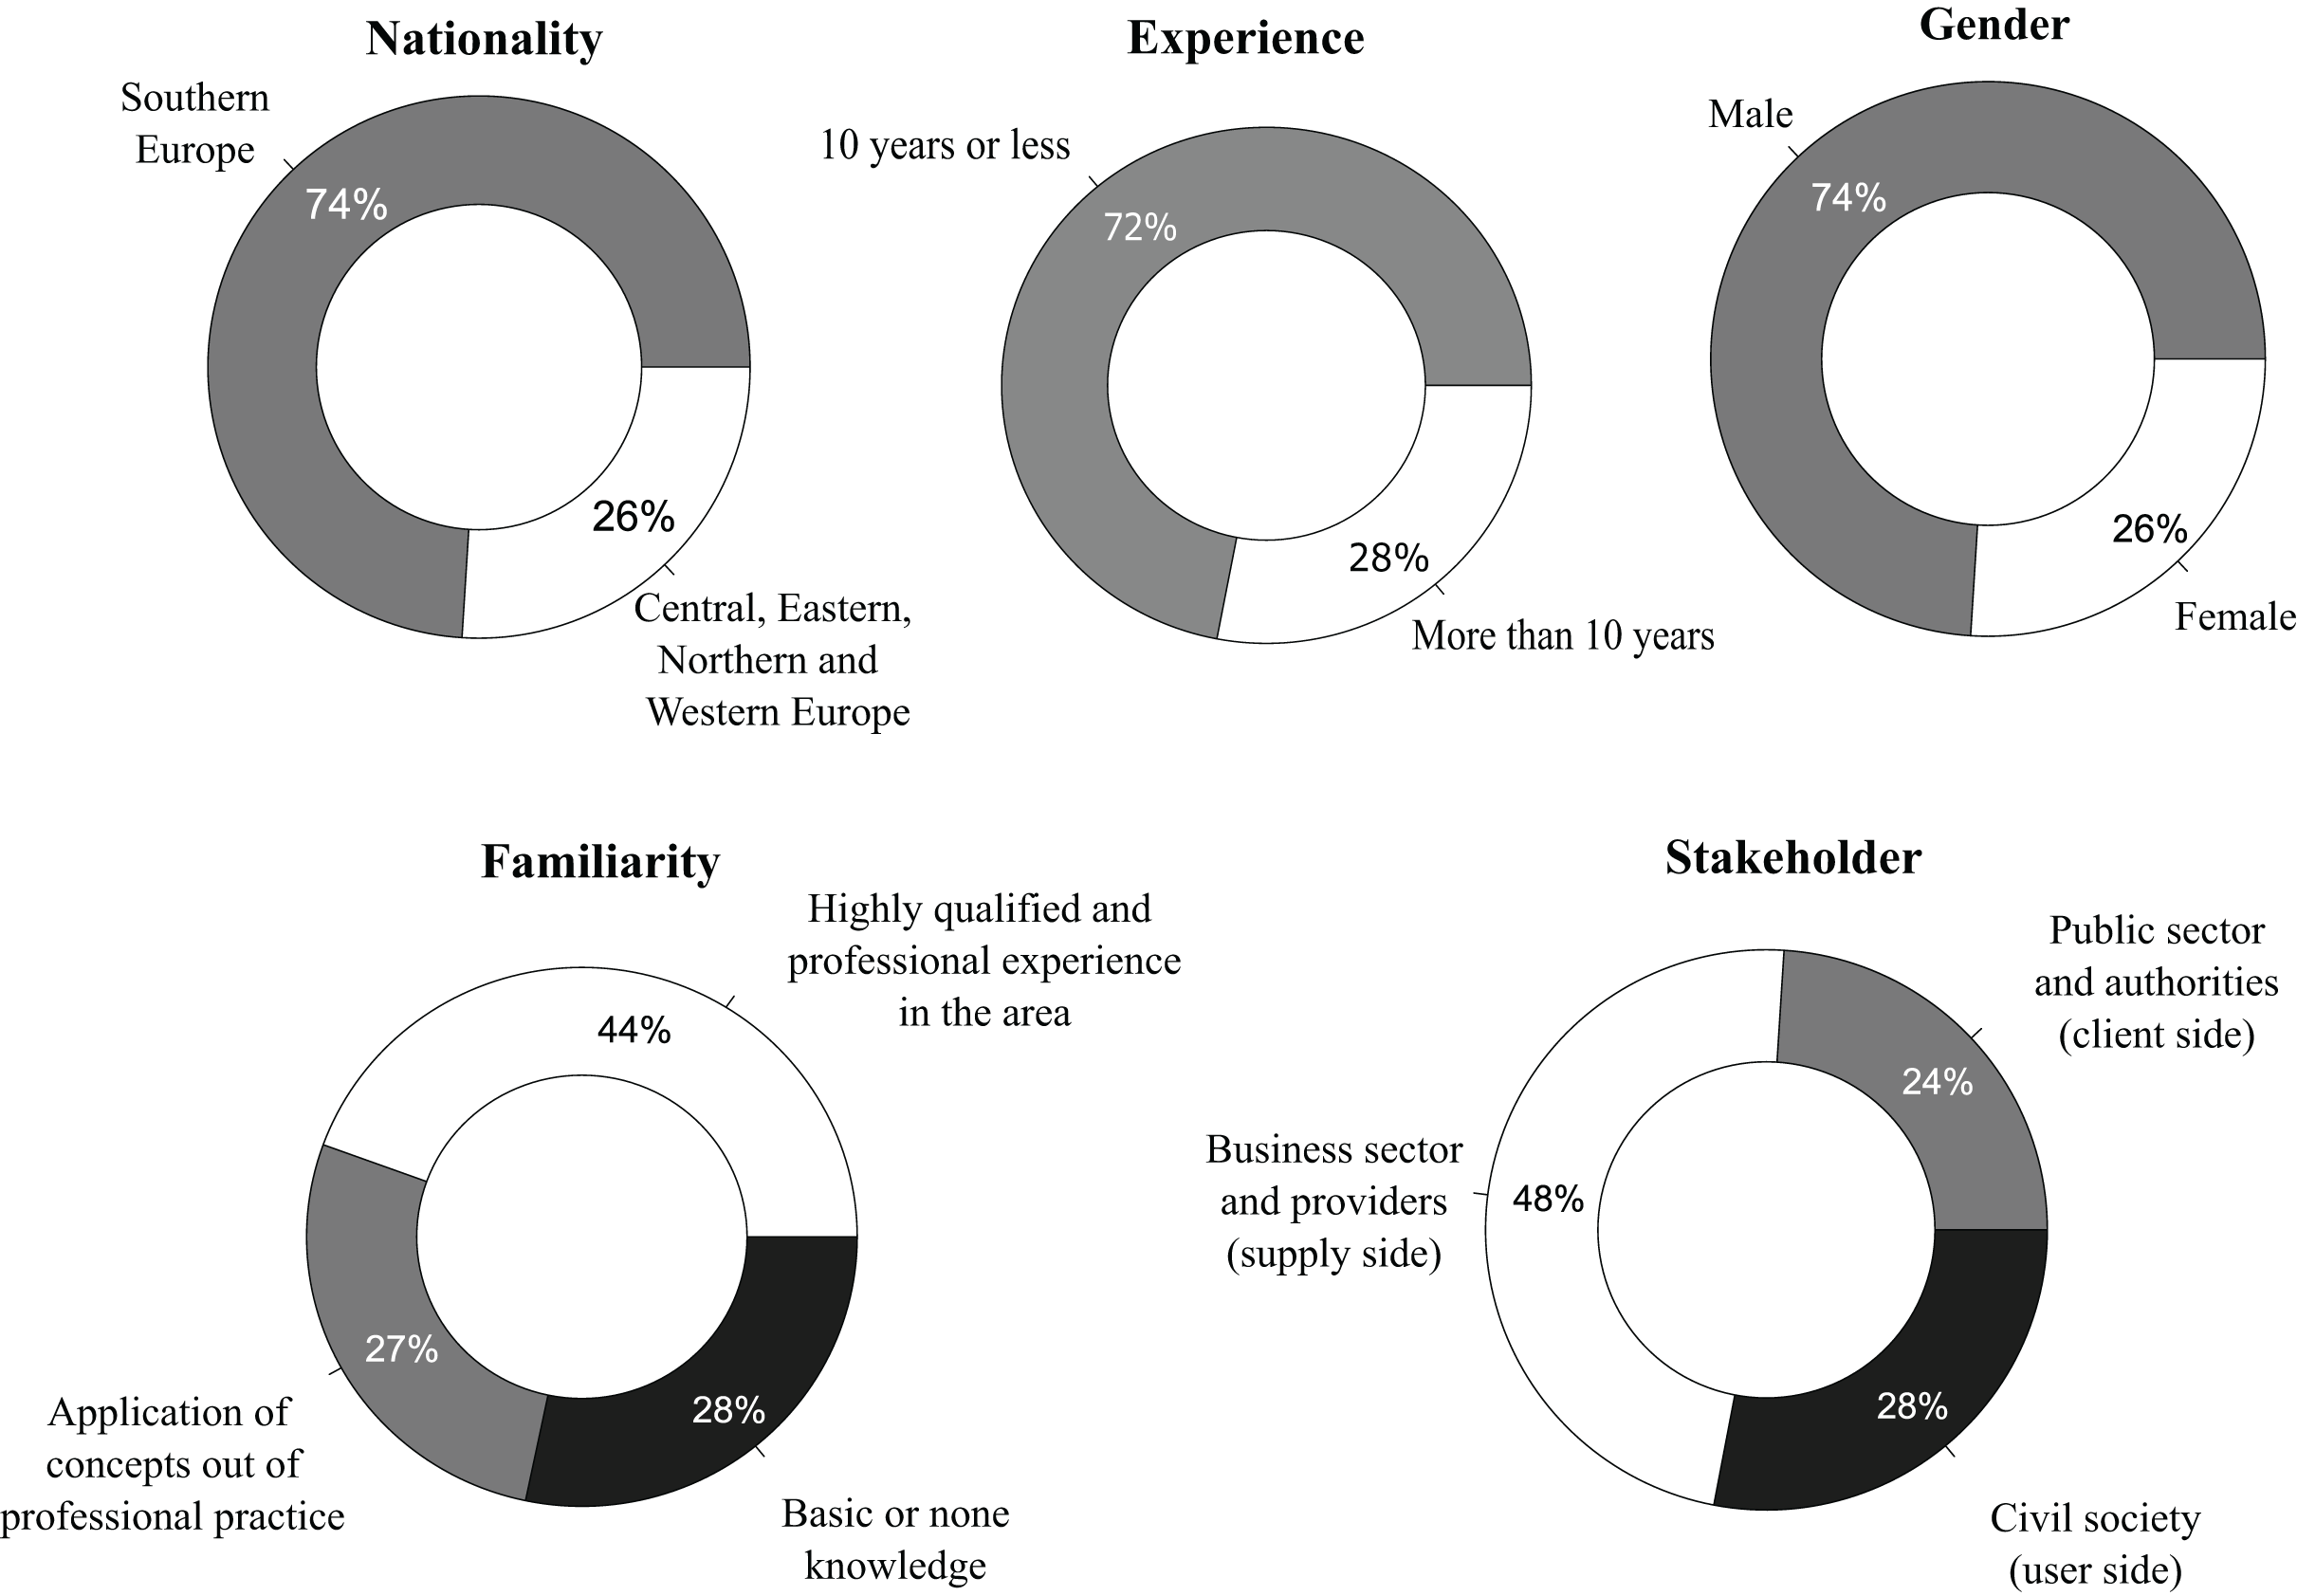
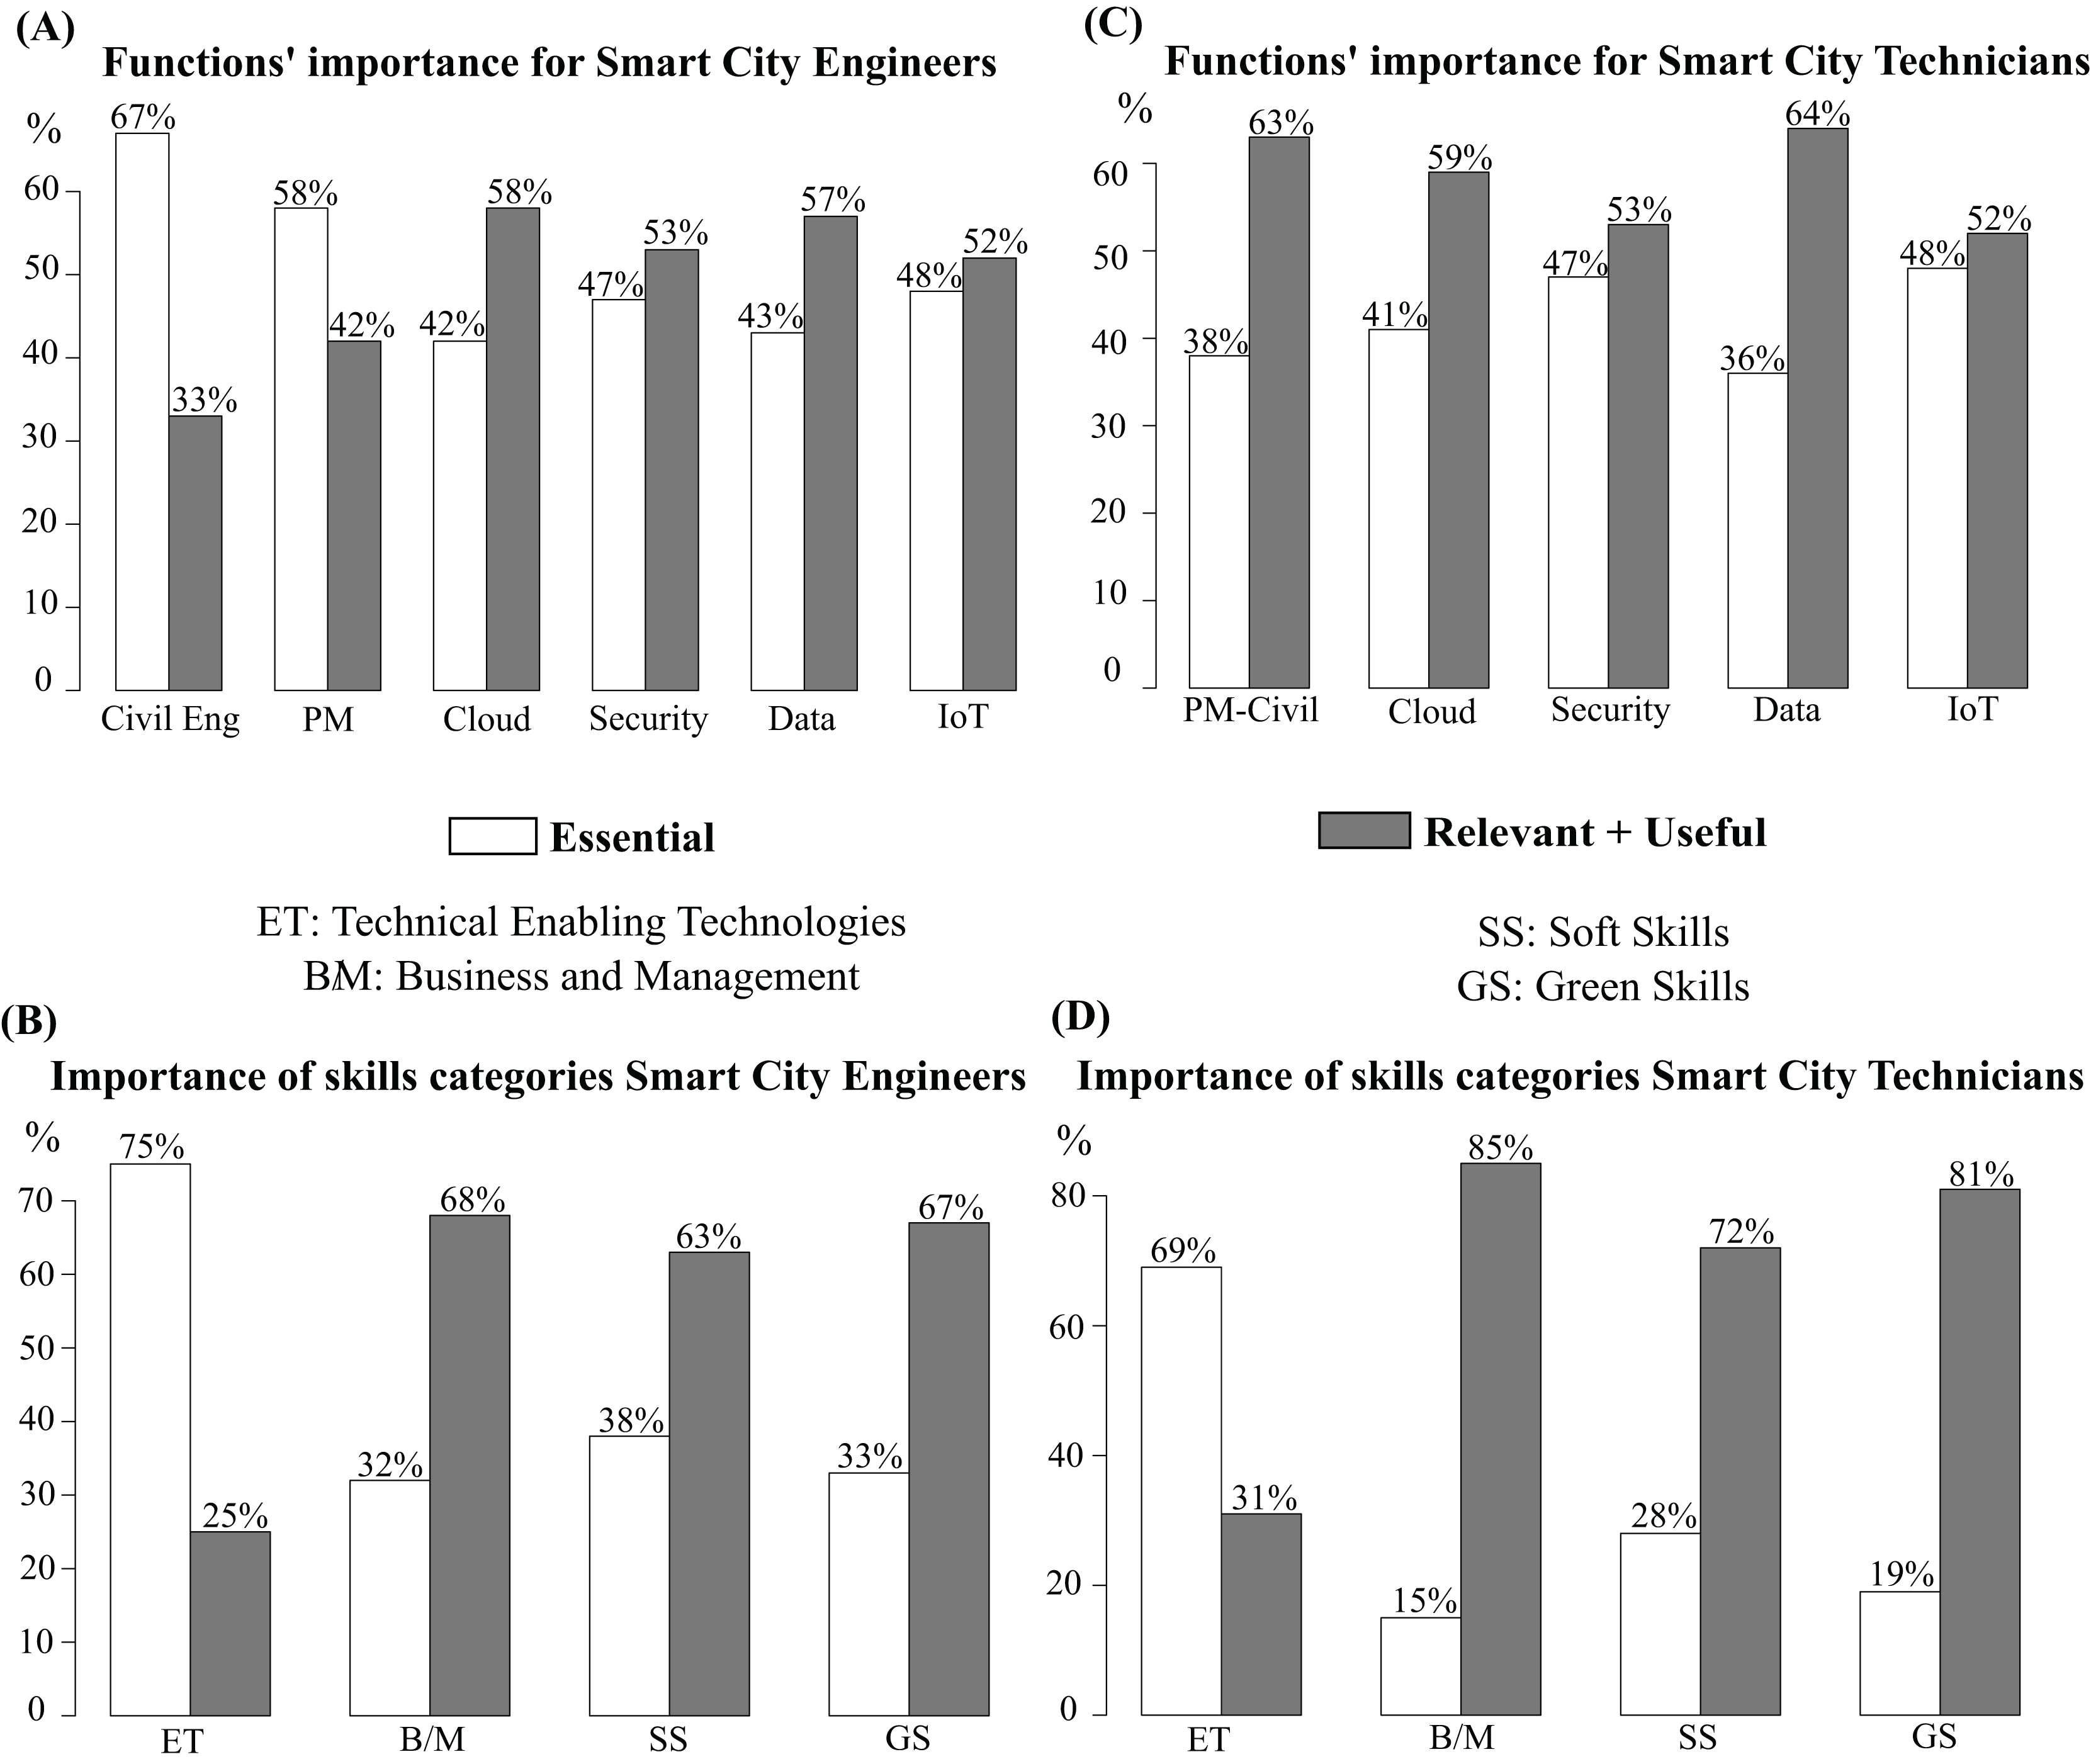
As described in the introduction, the study wants to identify the most influential functions and the most influential skill groups for the engineer profile and for the technician profile to compare the differences between each profile. For this reason, it was necessary to separate the records obtained in the sample into two main groups: engineers and technicians. Figure 3 extracts the summary of the records related to functions and skills categories in the sample for engineers and technicians.
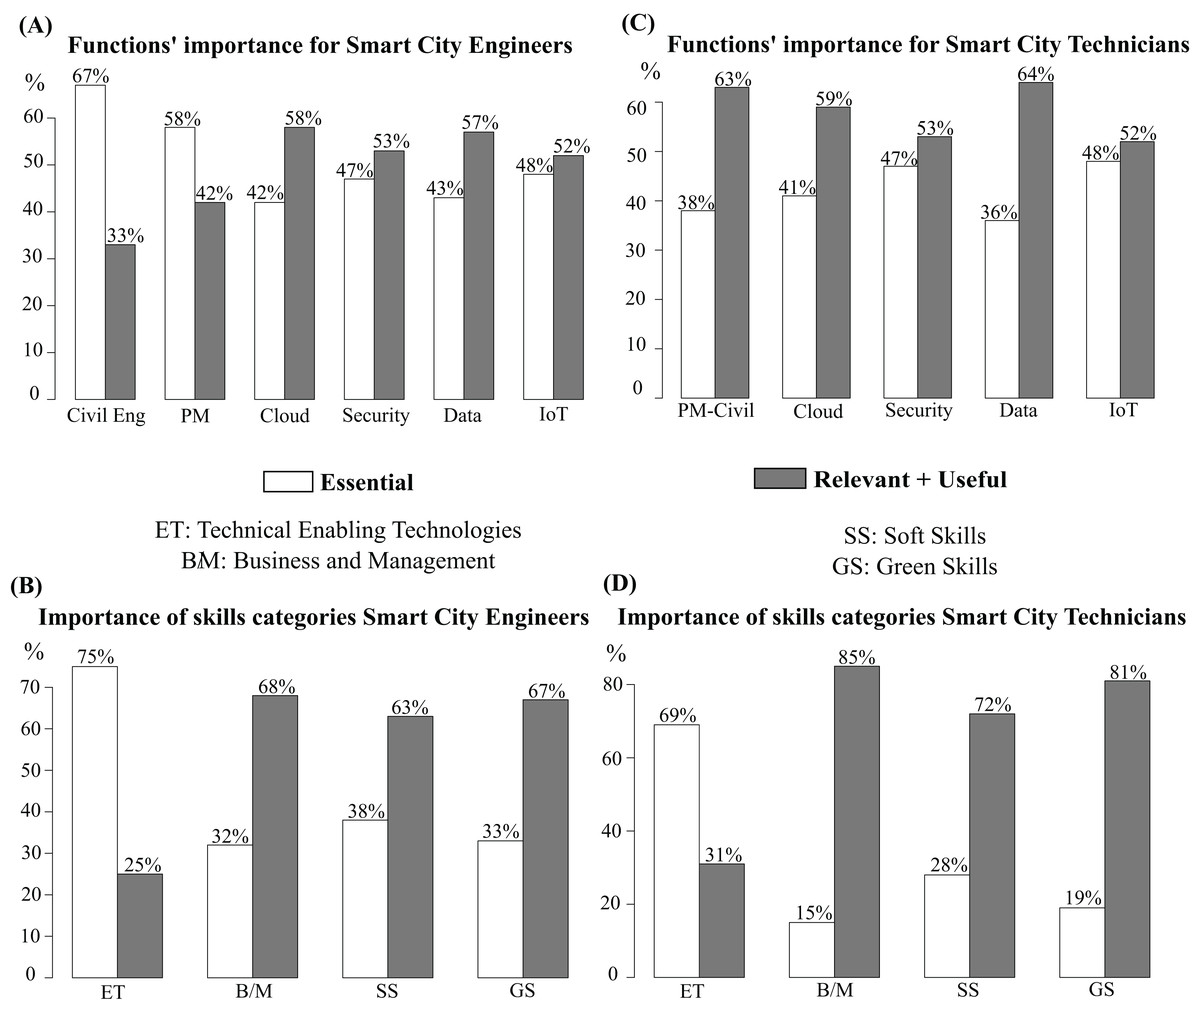
Figure 3: Functions and skills categories for Smart City engineers and technicians.
Regarding the importance of the variables in the sample of the influence of functions on the engineer profile, three main conclusions can be observed in Fig. 3A:
CivilEng and PM were identified as Essential functions. The function CivilEng is the most influential, as the records place it with 67% as Essential and 33% as Relevant + Useful.
Cloud and Data obtained more influence as Relevant + Useful (58% and 57%), so these functions result in less significance than the previous ones.
Finally, still with high importance but in a lower position, the remaining functions, Security and IoT, rated as Relevant + Useful by 53% and 52%.
Regarding the skills categories for engineers, Fig. 3B, two results were identified:
The variable ET was identified as the most important record in the sample, being rated by 75% as Essential and by 25% as Relevant + Useful.
The rest of the skill variables (B/M, SS, and GS) are more identified as Relevant + Useful, rather than Essential.
It is possible to extract from the presented information that for Smart City engineers, the most influential function is CivilEng, and the least influential are Cloud and Data, while ET is the most influential skill category for engineers, while B/M is the least influential skill category.
In the profile of technicians, two conclusions have been identified according to the importance of the different functions, Fig. 3C.
Functions for PM-Civil, Cloud and Data received the highest influence in Relevant + Useful records rather than Essential.
In the other functions, Security and IoT, although the highest responses were obtained for Relevant + Useful, the Essential percentage is bigger than in PM-Civil, Cloud and Data. These two functions obtained the same influence percentage number as for the profile of engineers.
Regarding the skills categories for technicians, Fig. 3D, also two results were identified:
The ET group of skills is the only one which obtained mostly Essential importance (69%) rather than Relevant + Useful (31%).
The rest of the skills categories were mostly rated as Relevant + Useful rather than as Essential.
It was possible to extract that for Smart City technicians, the most important function is IoT, and the least influential is Data. Regarding skills, ET is the most influential category for engineers and technicians, while the less important skills category for technicians and engineers is B/M.
After the complete descriptive analysis performed over the data set, the sample general profile obtained is: a male from southern Europe, with 10 years or less of working experience, highly qualified and with professional experience in the Smart Cities area, working on the supply side (business sector). The data set will be analysed using multivariate analysis techniques, specifically MCA. This analysis is detailed in the next section.
Dataset analysis through multiple correspondence analysis
In this article, separate MCA analyses were conducted for variables related to functions and to skills, each differentiated by professional group (technicians and engineers). Consequently, variables corresponding to user profiles were excluded from this stage. Table 3 summarises the variables included in each analysis. All detailed tables and figures corresponding to the four MCA models, covering both functions and skills for technicians and engineers, are provided, ensuring full transparency and traceability of the results.
Each MCA follows a structured analytical procedure. First, the relationships between variables are examined to identify significant associations. Next, the number of retained dimensions is determined based on their explanatory contribution. Subsequently, the categories exerting the strongest influence on the behaviour of the retained dimensions are identified, together with the formation of clusters among individuals and the relationships between individuals, dimensions, and variable categories. In addition, the quality of representation of each category across the retained dimensions is assessed to ensure adequate interpretability. Finally, the correlations and effects of the variables on the factorial dimensions are quantified, providing a comprehensive understanding of the underlying structure in each professional profile.
Multiple correspondence analysis for the variables related to functions in technicians
In this section, the results of the and Fisher’s Exact tests for variables associated with technicians’ functions are presented. Prior to conducting the MCA, it was necessary to confirm the presence of statistically significant dependencies among pairs of categorical variables. For each pair, the statistic ( ) and its corresponding p-value were computed, with Bonferroni correction applied to control for multiple comparisons. In addition, the effect size ( ) was calculated to evaluate the strength of associations, classified as weak ( ), moderate ( ), or strong ( ). The results are presented in Table 5, where adjusted p-values ( ) below 0.05 indicate statistically significant dependencies. Bold entries denote the strongest relationships according to the classification.
| Variable 1 | Variable 2 | Test | p-value | Effect strength | |||
|---|---|---|---|---|---|---|---|
| Cloud | IoT | 26.317 | 0.000 | 0.230 | 0.000 | Strong | |
| Cloud | Security | 16.084 | 0.000 | 0.155 | 0.001 | Strong | |
| Security | Data | 12.919 | 0.000 | 0.128 | 0.003 | Moderate | |
| Security | IoT | 10.110 | 0.001 | 0.103 | 0.015 | Moderate | |
| Cloud | Data | 9.697 | 0.002 | 0.099 | 0.019 | Moderate | |
| PM-Civil | Cloud | 6.067 | 0.014 | 0.065 | 0.138 | Moderate | |
| Data | IoT | 4.399 | 0.036 | 0.048 | 0.360 | Weak | |
| PM-Civil | Security | 0.515 | 0.473 | 0.006 | 1.000 | Weak | |
| PM-Civil | Data | 0.838 | 0.360 | 0.009 | 1.000 | Weak | |
| PM-Civil | IoT | 0.984 | 0.321 | 0.011 | 1.000 | Weak |
Based on the results obtained, several significant associations were identified among the functional variables of technicians. The variable Cloud shows strong dependence with IoT and Security, as well as moderate associations with Data and PM-Civil, highlighting its central influence in shaping the functional competence structure of this professional group. The variable Security is also dependent on Data and IoT, both displaying moderate values. In contrast, PM-Civil appears largely independent from most other variables except Cloud, suggesting that it represents a distinct and more specialised professional dimension. Finally, the weak association between Data and IoT indicates that these dimensions contribute independently within the functional profile of technicians.
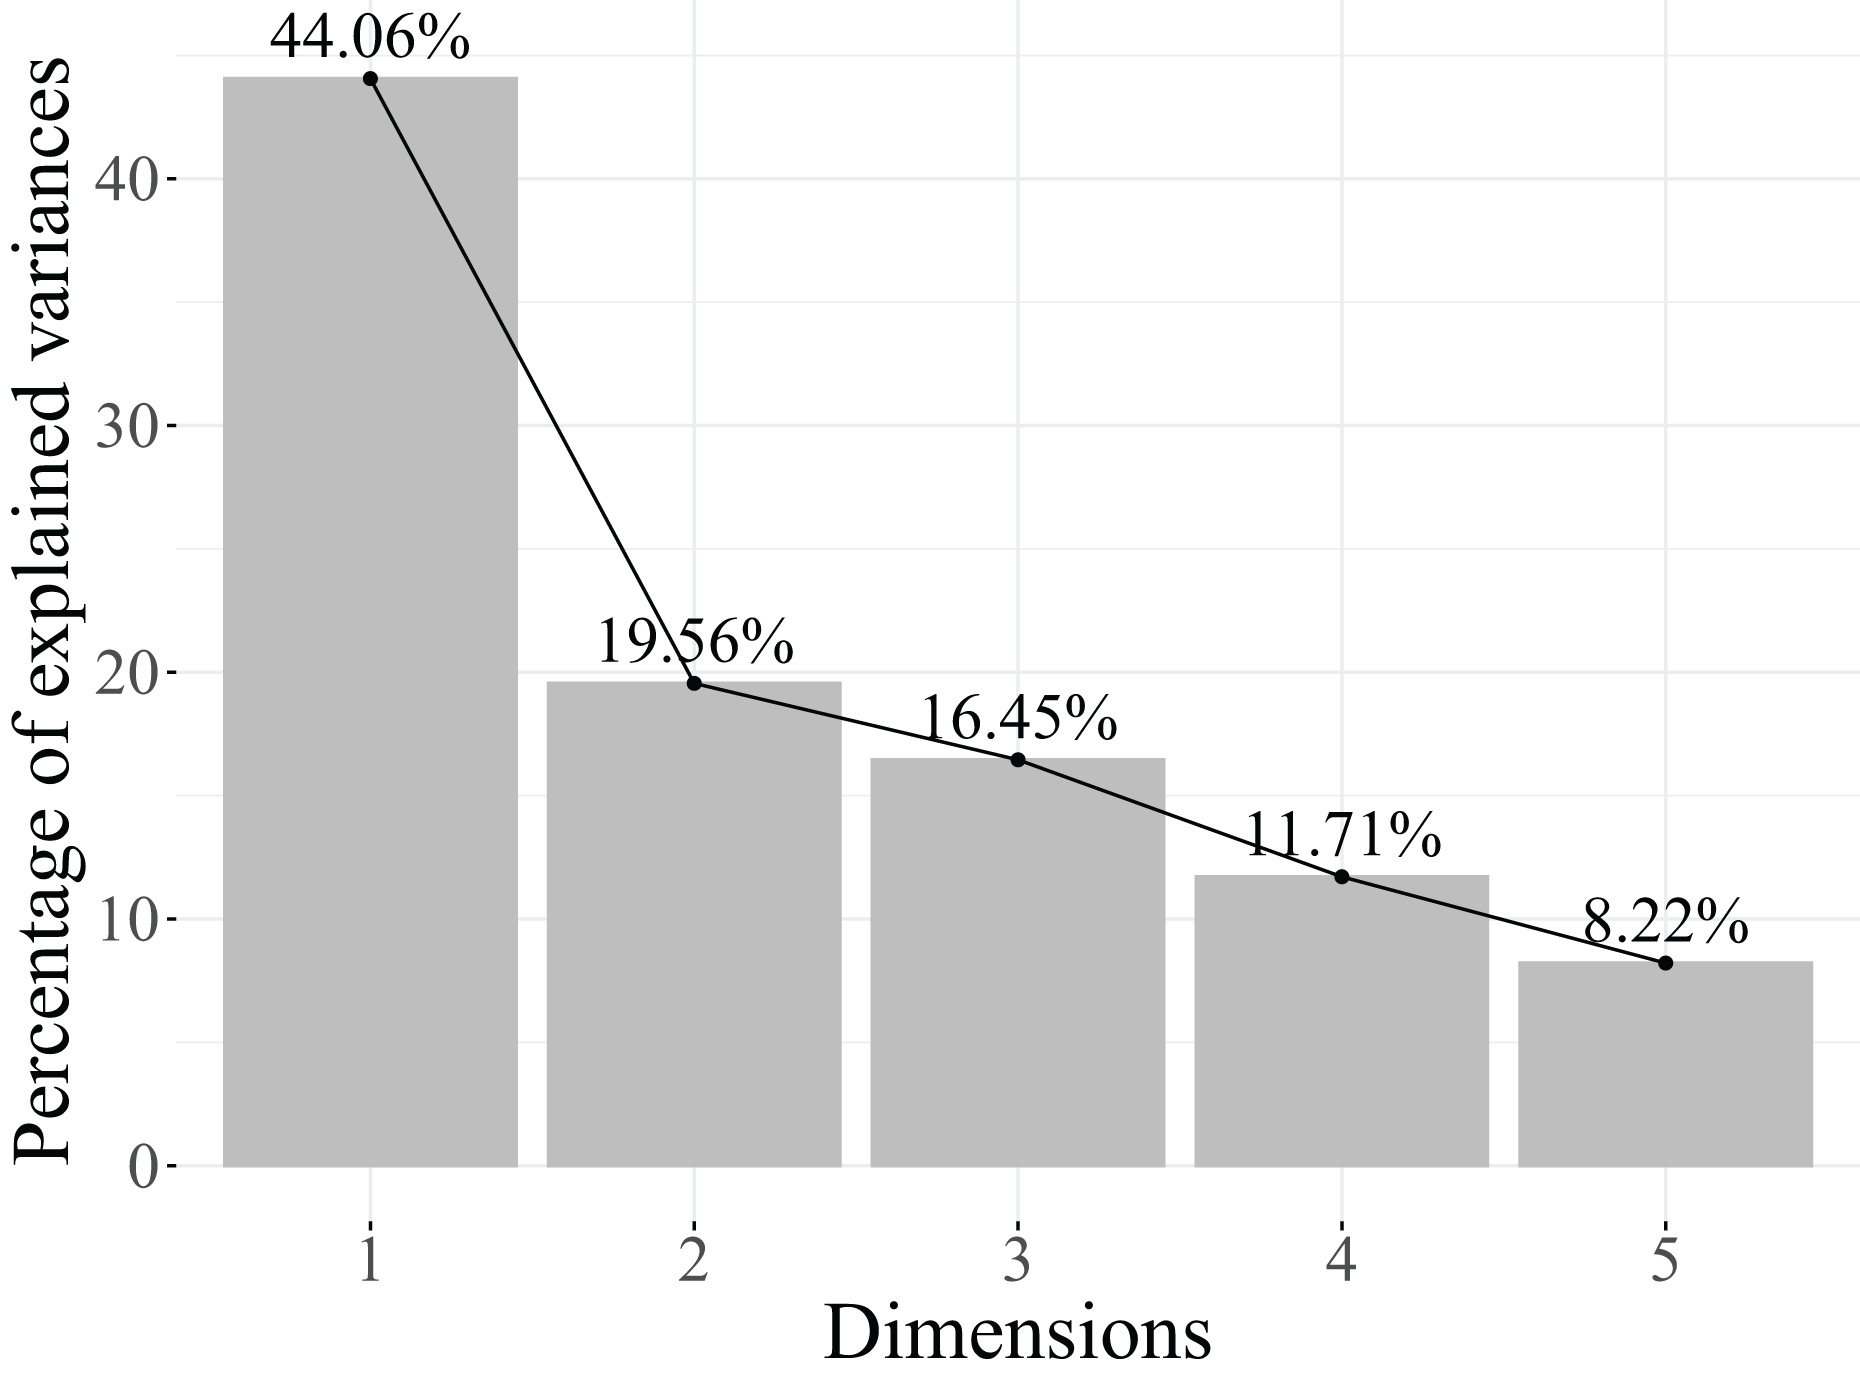
Next, the eigenvalues explained variance, and the cumulative percentage of explained variance are analysed to determine the number of retained dimensions. The results obtained are shown in Table 6. Additionally, Fig. 4 represents the scree plot, which is a graphical representation of the eigenvalues, with the eigenvalues plotted against the dimension number. The point at which the eigenvalues level off or drop below a certain threshold can be used to determine the optimal number of dimensions to retain. One of the distinctive characteristics of MCA is that the dimensions created do not necessarily explain a large percentage of the total variance (Agresti, 2013).
| Dimensions | Eigenvalue | Cumulative variance explained |
|---|---|---|
| Dimension 1 | 0.4406 | 44.06% |
| Dimension 2 | 0.1956 | 63.62% |
| Dimension 3 | 0.1645 | 80.07% |
| Dimension 4 | 0.1171 | 91.78% |
| Dimension 5 | 0.0822 | 100.00% |
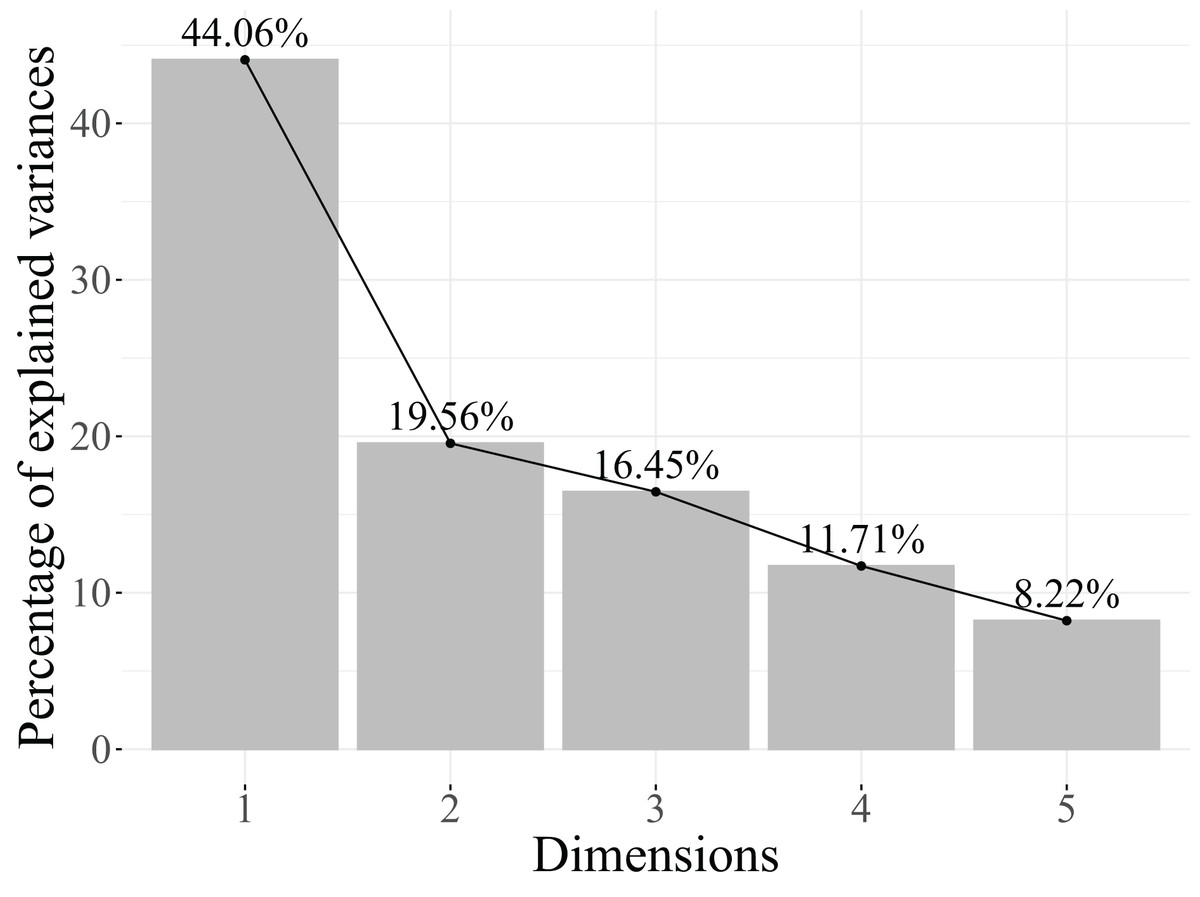
Figure 4: Plot of the percentage of variance explained in MCA, including the variables related to functions in technicians.
Based on the results in Table 6, two dimensions are retained because they account for 63.62% of the explained variance. Additionally, as seen in the scree plot in Fig. 4, the contribution of the subsequent dimensions to the explained variance becomes too small to justify their inclusion in the model.
To interpret the dimensions retained in the MCA, it is first necessary to determine which variables exert the greatest influence on their definition. This is assessed using the coefficient, which measures the proportion of inertia of each dimension explained by a variable. Following the guidelines of Lebart, Morineau & Piron (1995) and Husson, Lê & Pagès (2011), variables with are considered to make a substantial contribution to the inertia of a dimension and are therefore essential for its interpretation.
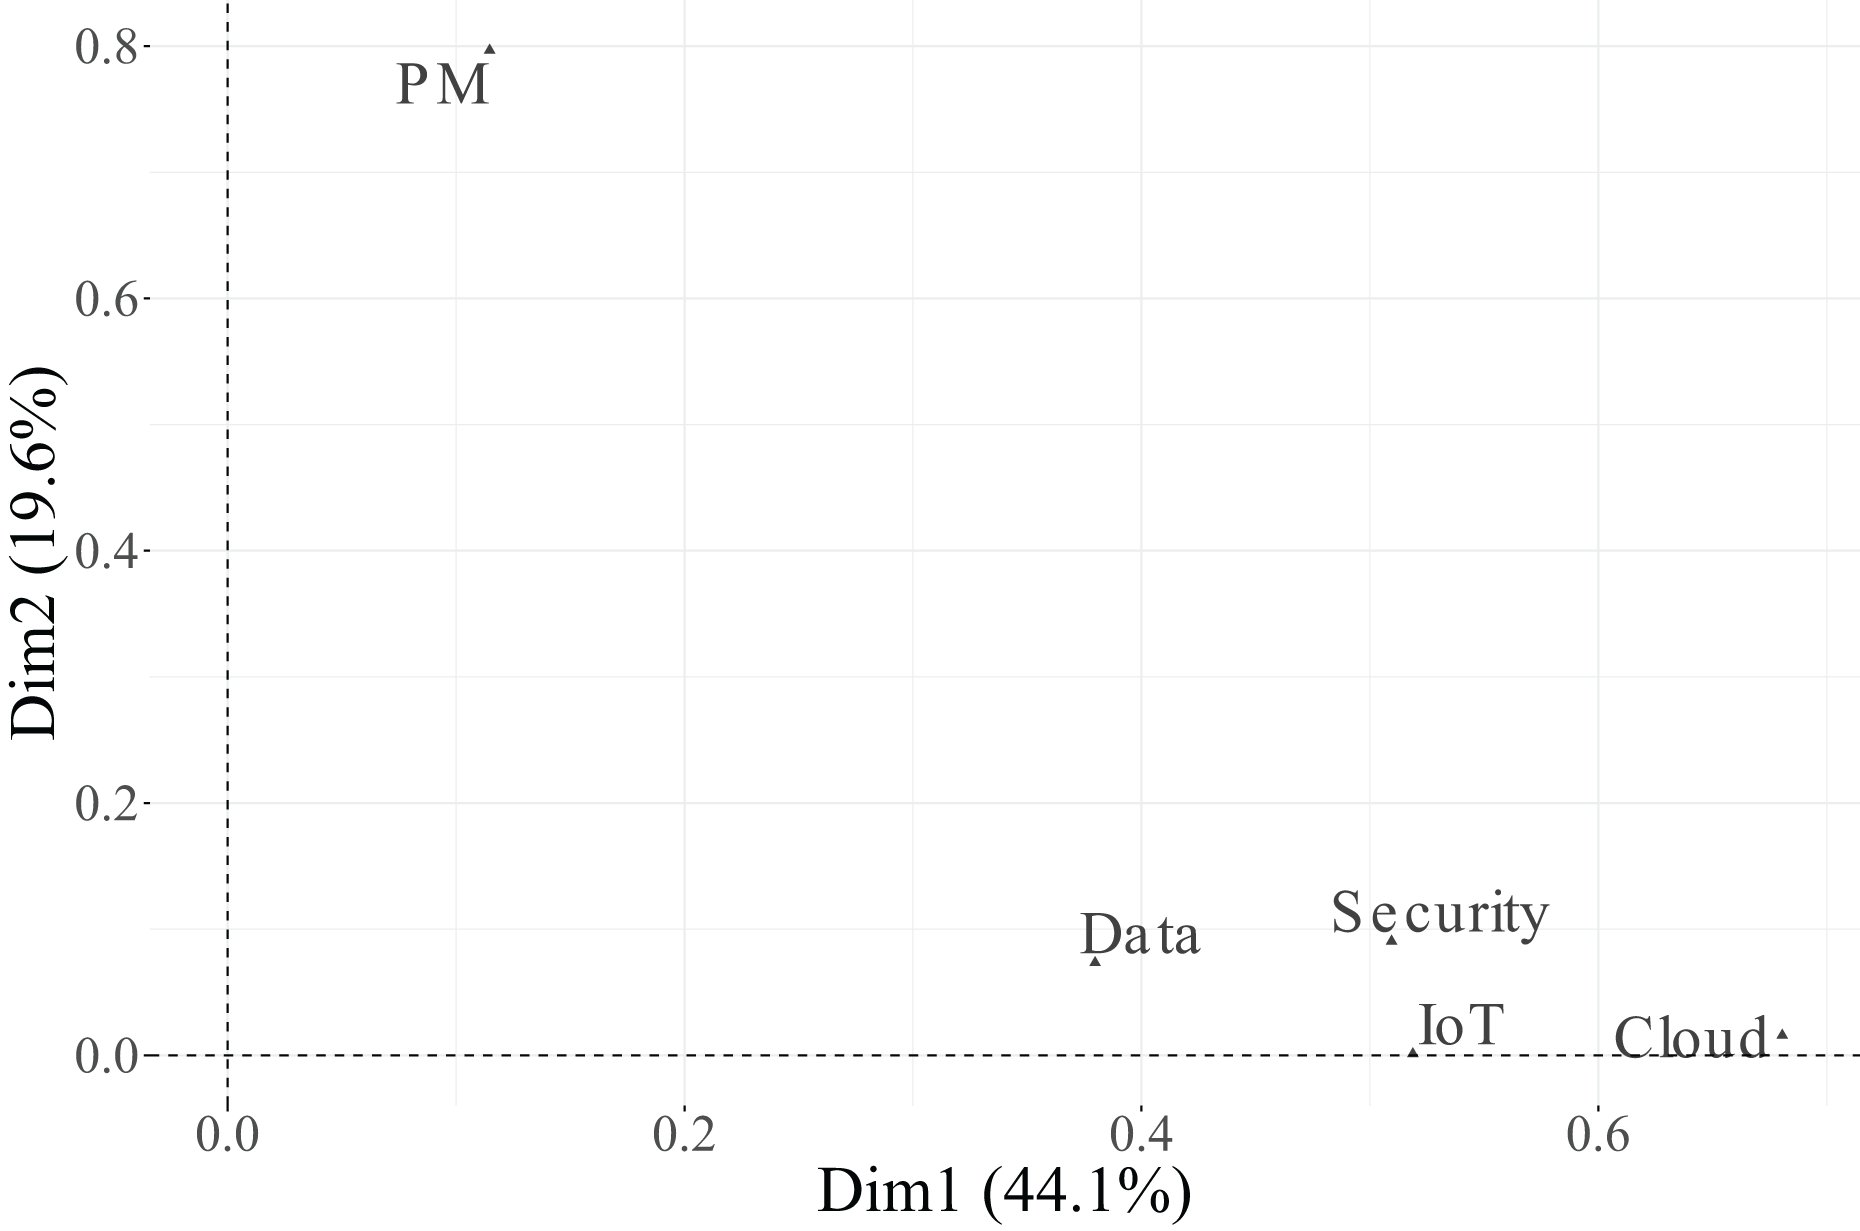
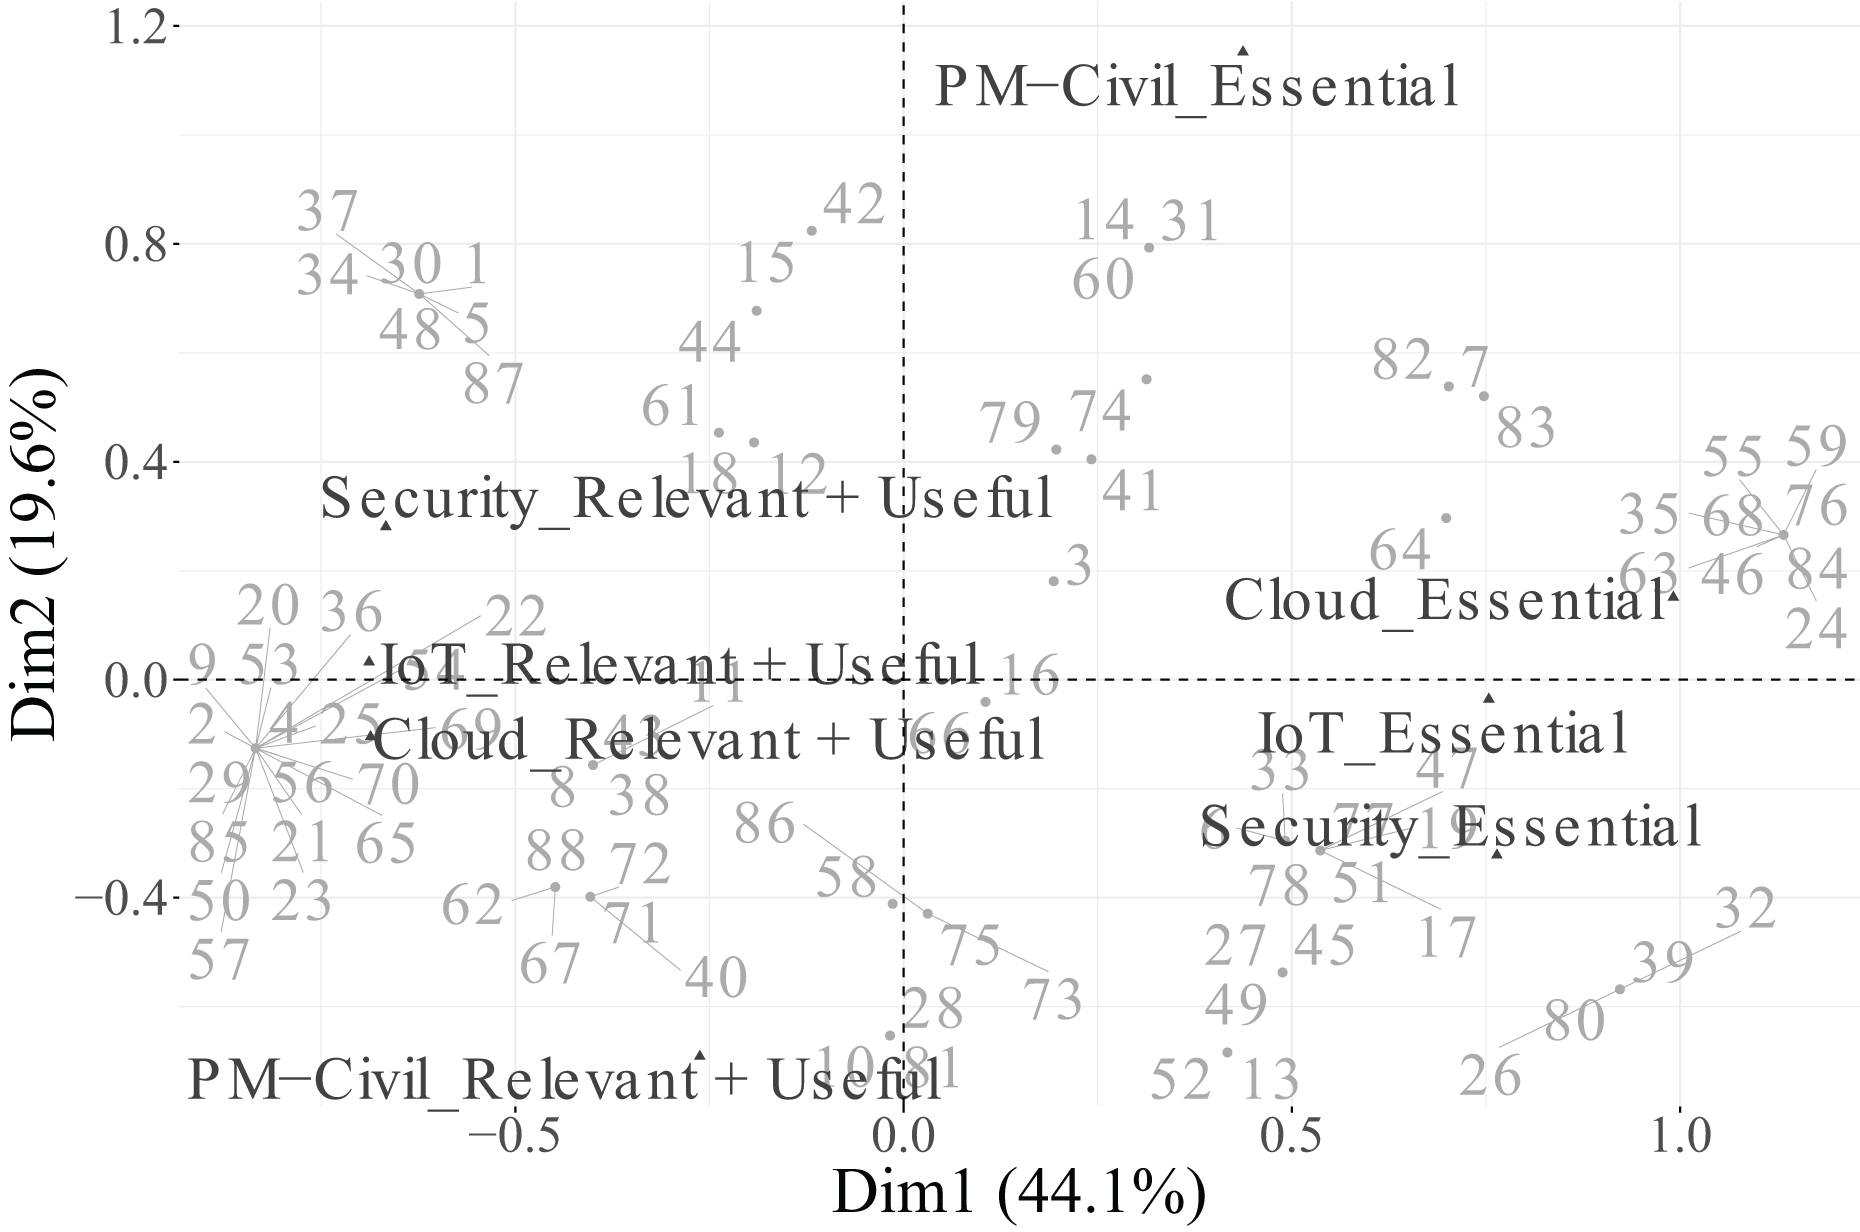
As shown in Table 7 and Fig. 5, all variables present values above the threshold in at least one of the two dimensions. The first dimension (Dimension 1), which explains 44.1% of the total inertia, is primarily structured by the variables Cloud ( ), Security ( ), and IoT ( ). The variable Data ( ) shows a moderate contribution, while PM ( ) stands out in Dimension 2 (which explains 19.6% of inertia). These results indicate that Dimension 1 captures variability linked to technological functions, whereas Dimension 2 reflects differences associated with project management roles.
| Variable | Dim. 1 | Dim. 2 |
|---|---|---|
| PM | 0.1147 | 0.7967 |
| Cloud | 0.6805 | 0.0159 |
| Security | 0.5095 | 0.0904 |
| Data | 0.3797 | 0.0734 |
| IoT | 0.5188 | 0.0012 |
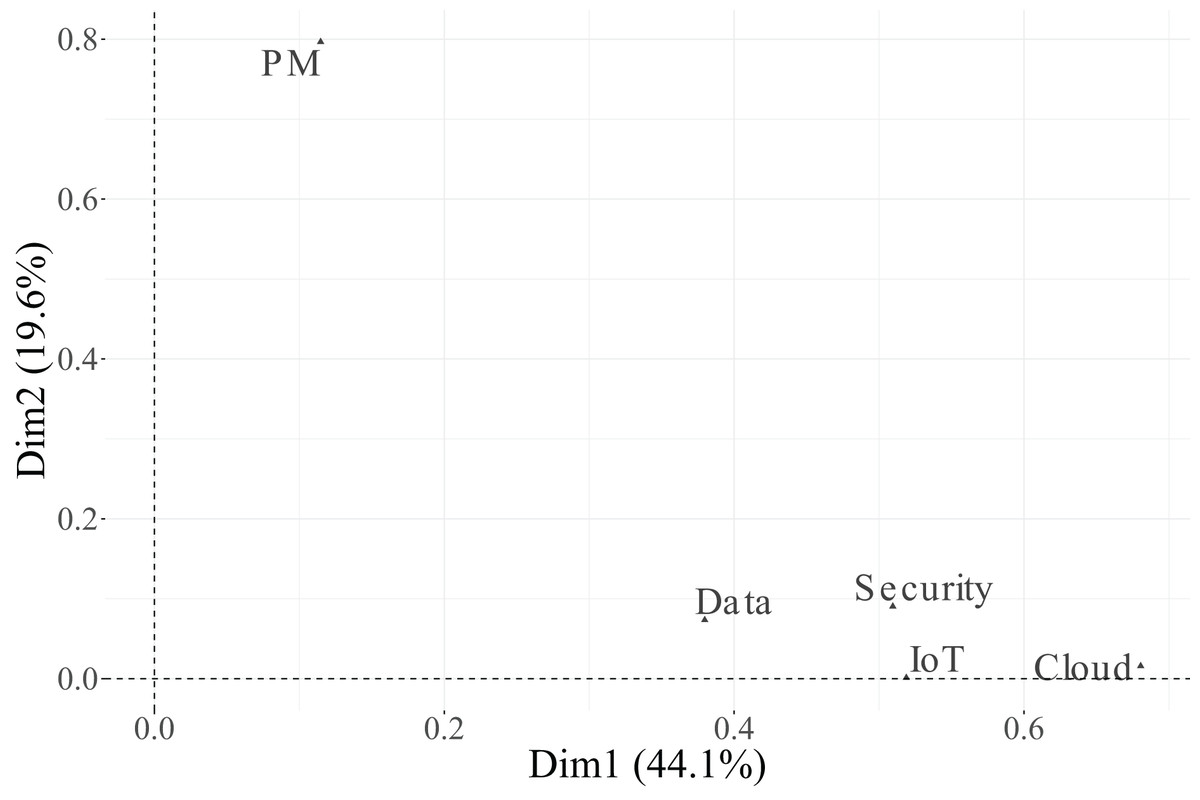
Figure 5: Correlation plot between variables related to functions in technicians and the first two dimensions.
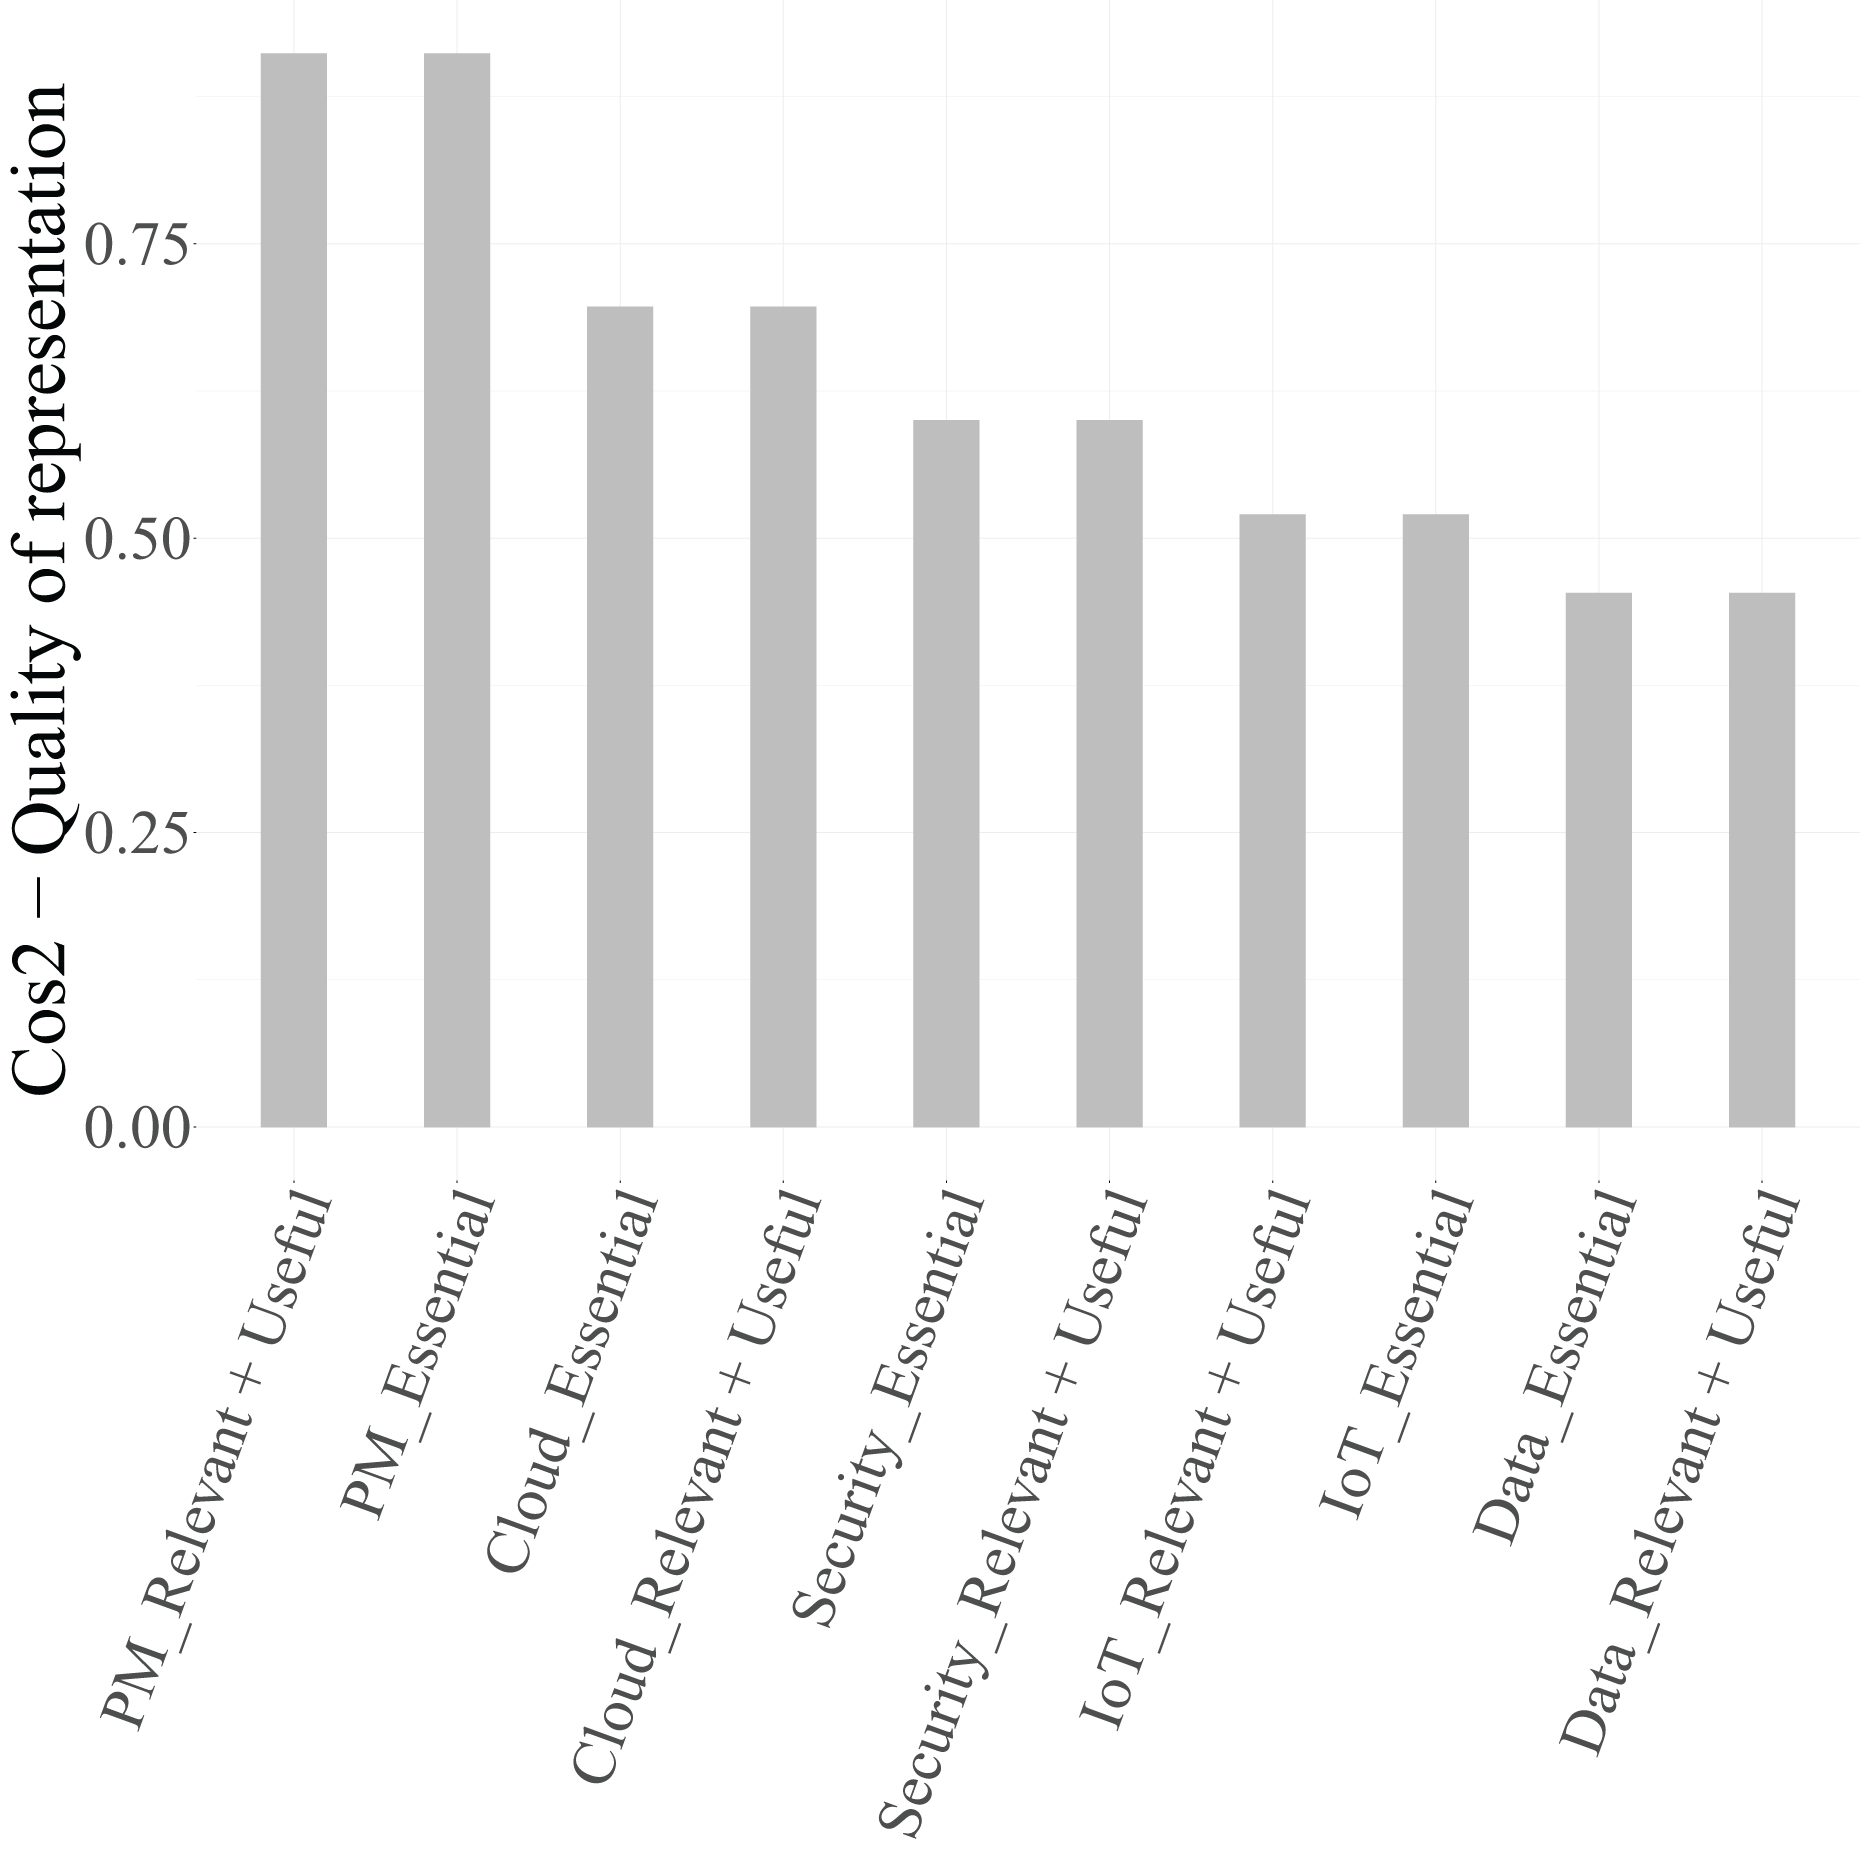
To ensure that only well-represented points are used for interpretation, the squared cosine ( ) values were examined. According to Lebart, Morineau & Piron (1995), Abdi & Williams (2010), and Greenacre (2017), categories with are considered well projected on the factorial map.
From Table 8, it can be observed that, for Dimension 1, the categories Cloud (Essential) and Cloud (Relevant + Useful) ( ), Security (Essential) and Security (Relevant + Useful) ( ), and IoT (Essential) ( ) exceed the threshold and are therefore retained in Fig. 6 as graphical representation. The categories of the variable Data, however, present values below 0.4 and are thus excluded from the biplot due to their limited representational quality. For Dimension 2, both categories of PM-Civil (Essential and Relevant + Useful) show very high values ( ), confirming their relevance for interpreting this axis.
| Category | Dim. 1 | Dim. 2 |
|---|---|---|
| PM-Civil (Essential) | 0.1147 | 0.7967 |
| PM-Civil (Relevant + Useful) | 0.1147 | 0.7967 |
| Cloud (Essential) | 0.6805 | 0.0159 |
| Cloud (Relevant + Useful) | 0.6805 | 0.0159 |
| Security (Essential) | 0.5095 | 0.0904 |
| Security (Relevant + Useful) | 0.5095 | 0.0904 |
| Data (Essential) | 0.3797 | 0.0734 |
| Data (Relevant + Useful) | 0.3797 | 0.0734 |
| IoT (Essential) | 0.5188 | 0.0012 |
| IoT (Relevant + Useful) | 0.5188 | 0.0012 |
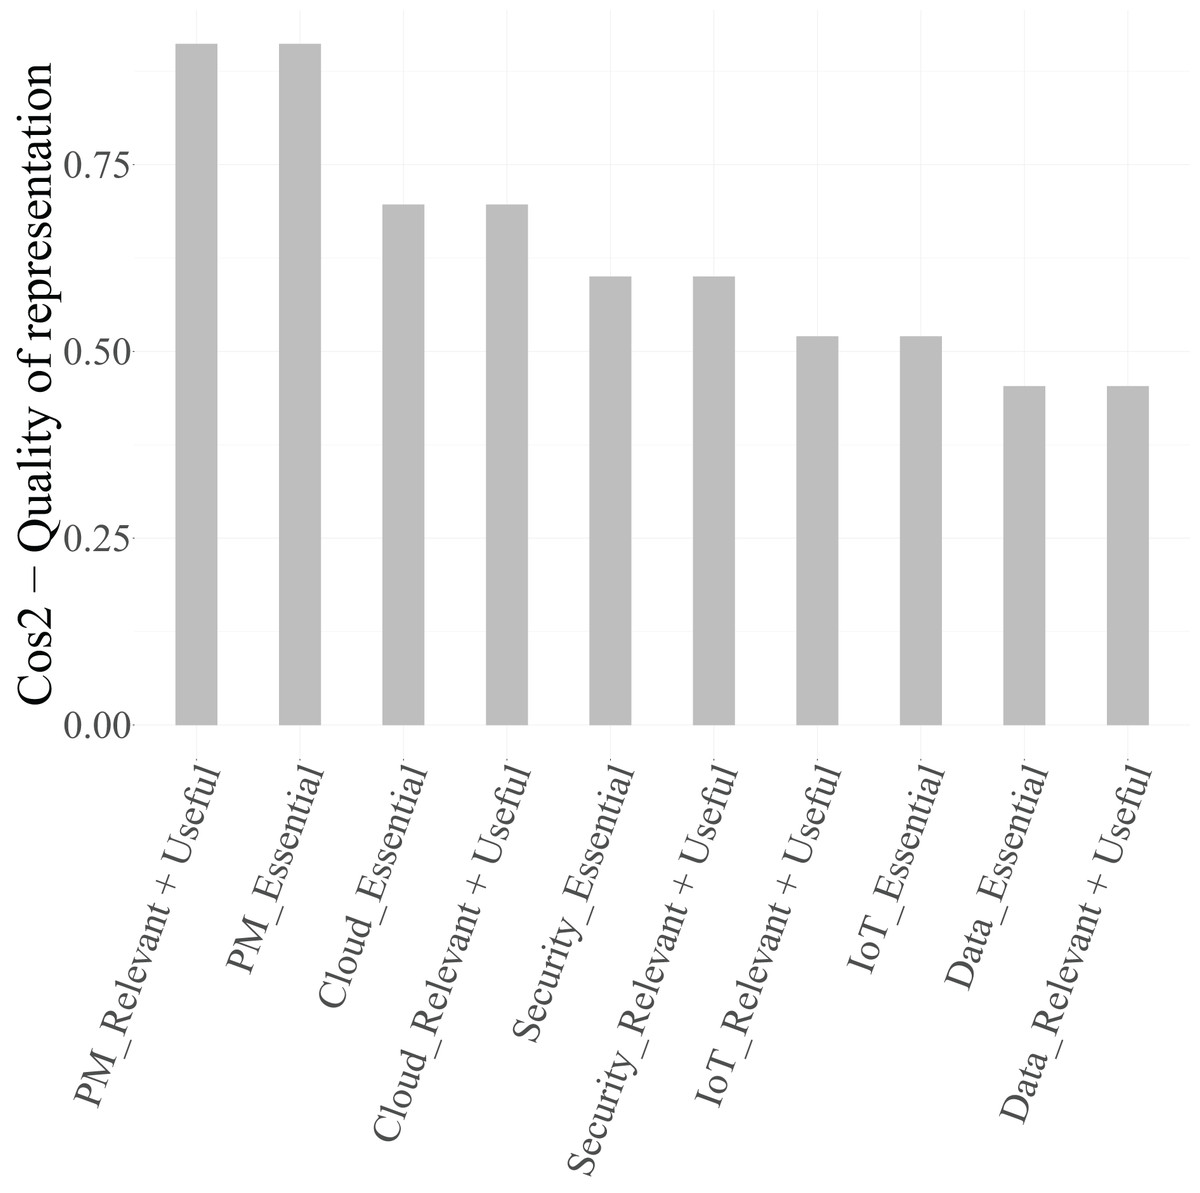
Figure 6: Quality of the representation of the categories of the variables related to functions in technicians in the first two dimensions.
Based on these criteria ( for variables and for categories), the biplot in Fig. 7 includes only those categories that meet both thresholds, ensuring a clear and interpretable representation focused on the most informative variables and categories. Additionally, the percentage contribution of each category to each retained dimension is presented in Table 9.
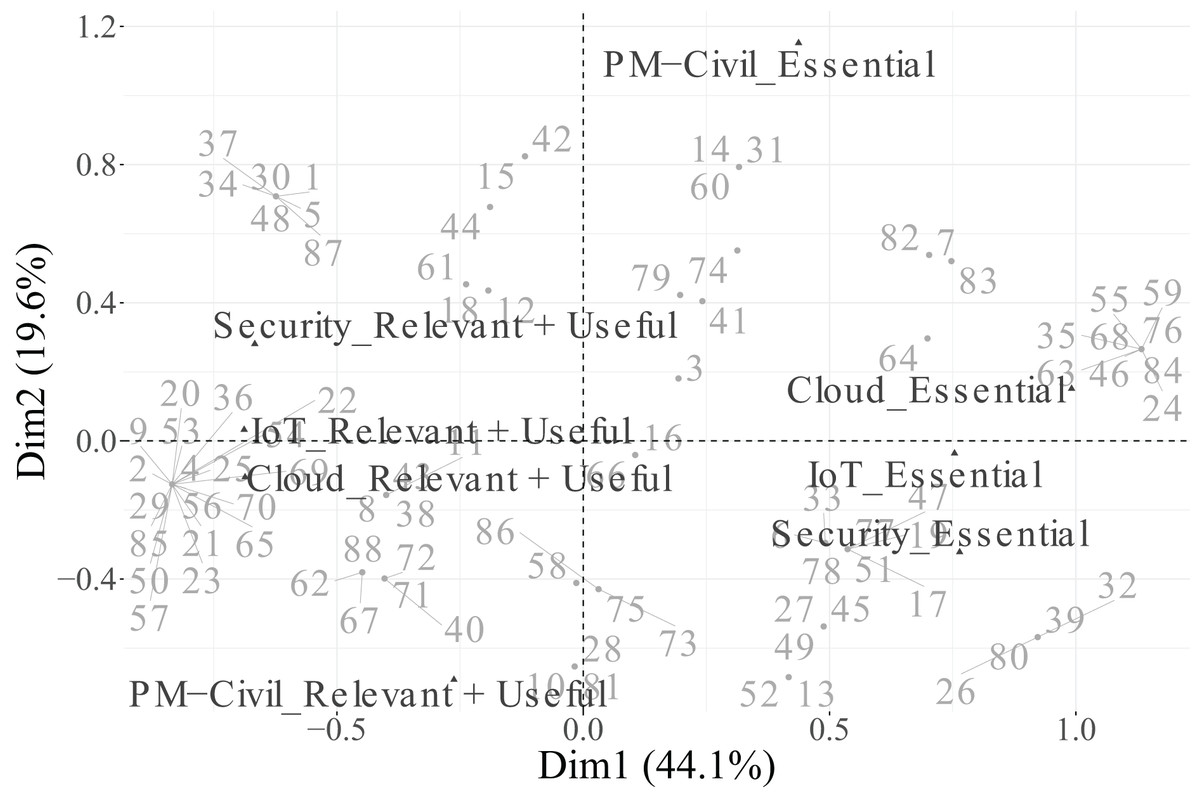
Figure 7: First two dimensions biplot obtained from MCA, including individuals and the variables related to functions in technicians.
| Category | Dim. 1 | Dim. 2 |
|---|---|---|
| PM-Civil (Essential) | 3.26% | 50.94% |
| PM-Civil (Relevant + Useful) | 1.95% | 30.56% |
| Cloud (Essential) | 18.25% | 0.96% |
| Cloud (Relevant + Useful) | 12.63% | 0.66% |
| Security (Essential) | 12.35% | 4.94% |
| Security (Relevant + Useful) | 10.78% | 4.31% |
| Data (Essential) | 10.96% | 4.78% |
| Data (Relevant + Useful) | 6.27% | 2.73% |
| IoT (Essential) | 12.31% | 0.06% |
| IoT (Relevant + Useful) | 11.24% | 0.06% |
In the biplot, Dimension 1 differentiates between two distinct groups of categories. On the positive side, we find Essential categories for Cloud, Security, and IoT, whereas on the negative side, the Relevant + Useful categories of these same variables are grouped together. The categories of Data are not displayed in the plot because they are under the threshold. This pattern suggests that Dimension 1 reflects a contrast between essential and additional relevance perceptions of technological factors, indicating that technicians distinguish strongly between technologies considered indispensable vs. those perceived as supplementary or supportive.
Dimension 2 is primarily defined by the variable PM-Civil, whose two categories (Essential and Relevant + Useful) are projected at opposite extremes along this axis. This implies that Dimension 2 captures variability specifically associated with project management functions, differentiating individuals according to their valuation of PM-related aspects.
Regarding individuals, their distribution across the four quadrants indicates heterogeneity in response profiles. The clustering of individuals near particular category points reflects groups sharing similar evaluations. For instance, individuals located toward the upper-right quadrant tend to associate technological dimensions (Cloud, IoT, Security) with essential importance, while those situated toward the lower-left quadrant are closer to categories rated as Relevant + Useful, suggesting a more moderate perception of importance.
In summary, Dimension 1 represents the technological valuation axis, contrasting essential vs. complementary technological factors (Cloud, Security, IoT, Data), while Dimension 2 corresponds to a project management valuation axis, dominated by PM-Civil. Both categories of the variable Data, despite its moderate contribution to inertia, were excluded from the graphical display due to its low representational quality ( ). This methodological refinement enhances the explanatory clarity of the MCA results and allows a more focused understanding of how technicians differentiate between essential and supportive functions in their professional activities.
Finally, a bootstrap resampling procedure ( ) was conducted to assess the robustness of the factorial configuration obtained for the set of functional categories corresponding to technicians. This approach made it possible to estimate the variability of category coordinates across replicated datasets, offering an empirical measure of the stability of their factorial positioning. The Mean Standard Deviation (Mean SD) across the first two factorial dimensions was calculated as a summary indicator of coordinate dispersion, where lower values denote higher positional stability. The results of this analysis are presented in Table 10.
| Category | SD Dim1 | SD Dim2 | Mean SD |
|---|---|---|---|
| Cloud (Relevant + Useful) | 0.183 | 0.161 | 0.172 |
| Cloud (Essential) | 0.224 | 0.236 | 0.230 |
| Data (Relevant + Useful) | 0.149 | 0.309 | 0.229 |
| Data (Essential) | 0.224 | 0.558 | 0.391 |
| PM-Civil (Essential) | 0.235 | 0.689 | 0.462 |
The results indicate that most functional categories display satisfactory coordinate stability, with Mean SD values generally falling within a moderate range (0.17–0.46). Categories associated with Cloud show the lowest variability, confirming their stable positioning across bootstrap replications. Although Data (Essential) and PM-Civil (Essential) exhibit slightly greater dispersion, these deviations remain within acceptable limits and are restricted to specific instances. Overall, the factorial configuration obtained for technicians in relation to functions demonstrates substantial robustness, as most categories maintain consistent positions throughout the resampling process. Some categories are excluded in the bootstrap output because the resampling was performed at the individual level, and categories with very low frequencies may not be represented in all bootstrap iterations.
Multiple correspondence analysis for the variables related to functions in engineers
Similarly, the dependence analysis was extended to the set of functional variables for engineers. The statistic ( ) and its associated p-values were computed for all possible pairs, applying Bonferroni correction to account for multiple comparisons. The adjusted p-values ( ) and effect sizes ( ) are summarized in Table 11, highlighting the most significant dependencies according to the classification. Note that bold values indicate statistical significance at .
| Variable 1 | Variable 2 | Test | p-value | Effect strength | |||
|---|---|---|---|---|---|---|---|
| Security | Data | 19.729 | 0.000 | 0.183 | 0.000 | Strong | |
| PM | Data | 12.096 | 0.001 | 0.121 | 0.008 | Moderate | |
| Data | IoT | 11.480 | 0.001 | 0.115 | 0.011 | Moderate | |
| PM | IoT | 10.965 | 0.001 | 0.111 | 0.014 | Moderate | |
| PM | Security | 9.820 | 0.002 | 0.100 | 0.026 | Moderate | |
| PM | CivilEng | 9.779 | 0.002 | 0.100 | 0.026 | Moderate | |
| Cloud | Security | 8.568 | 0.003 | 0.089 | 0.051 | Moderate | |
| Cloud | IoT | 7.516 | 0.006 | 0.079 | 0.092 | Moderate | |
| Cloud | Data | 6.895 | 0.009 | 0.073 | 0.130 | Moderate | |
| Security | CivilEng | 4.207 | 0.040 | 0.046 | 0.604 | Weak | |
| Security | IoT | 3.595 | 0.058 | 0.039 | 0.869 | Weak | |
| PM | Cloud | 2.421 | 0.120 | 0.027 | 1.000 | Weak | |
| Cloud | CivilEng | 2.152 | 0.142 | 0.024 | 1.000 | Weak | |
| Data | CivilEng | 0.057 | 0.811 | 0.001 | 1.000 | Weak | |
| IoT | CivilEng | 0.699 | 0.403 | 0.008 | 1.000 | Weak |
The results indicate a more intricate pattern of dependencies among the functional variables of engineers compared with those of technicians. The variable Security shows a strong dependency on Data ( ), while maintaining moderate associations with PM and CivilEng, which confirms its integrative role across technical and managerial dimensions. The variable PM exhibits moderate associations with Data, IoT, Security, and CivilEng, suggesting that project management interacts with several technological functions within the competence structure of engineers. Moreover, Cloud displays moderate dependencies with Security, IoT, and Data, reinforcing its transversal role across digital functions. In contrast, CivilEng shows only weak relationships with most variables, whereas Data and IoT remain significantly associated but behave independently with respect to CivilEng, indicating a clear distinction between general engineering activities and domain-specific roles.
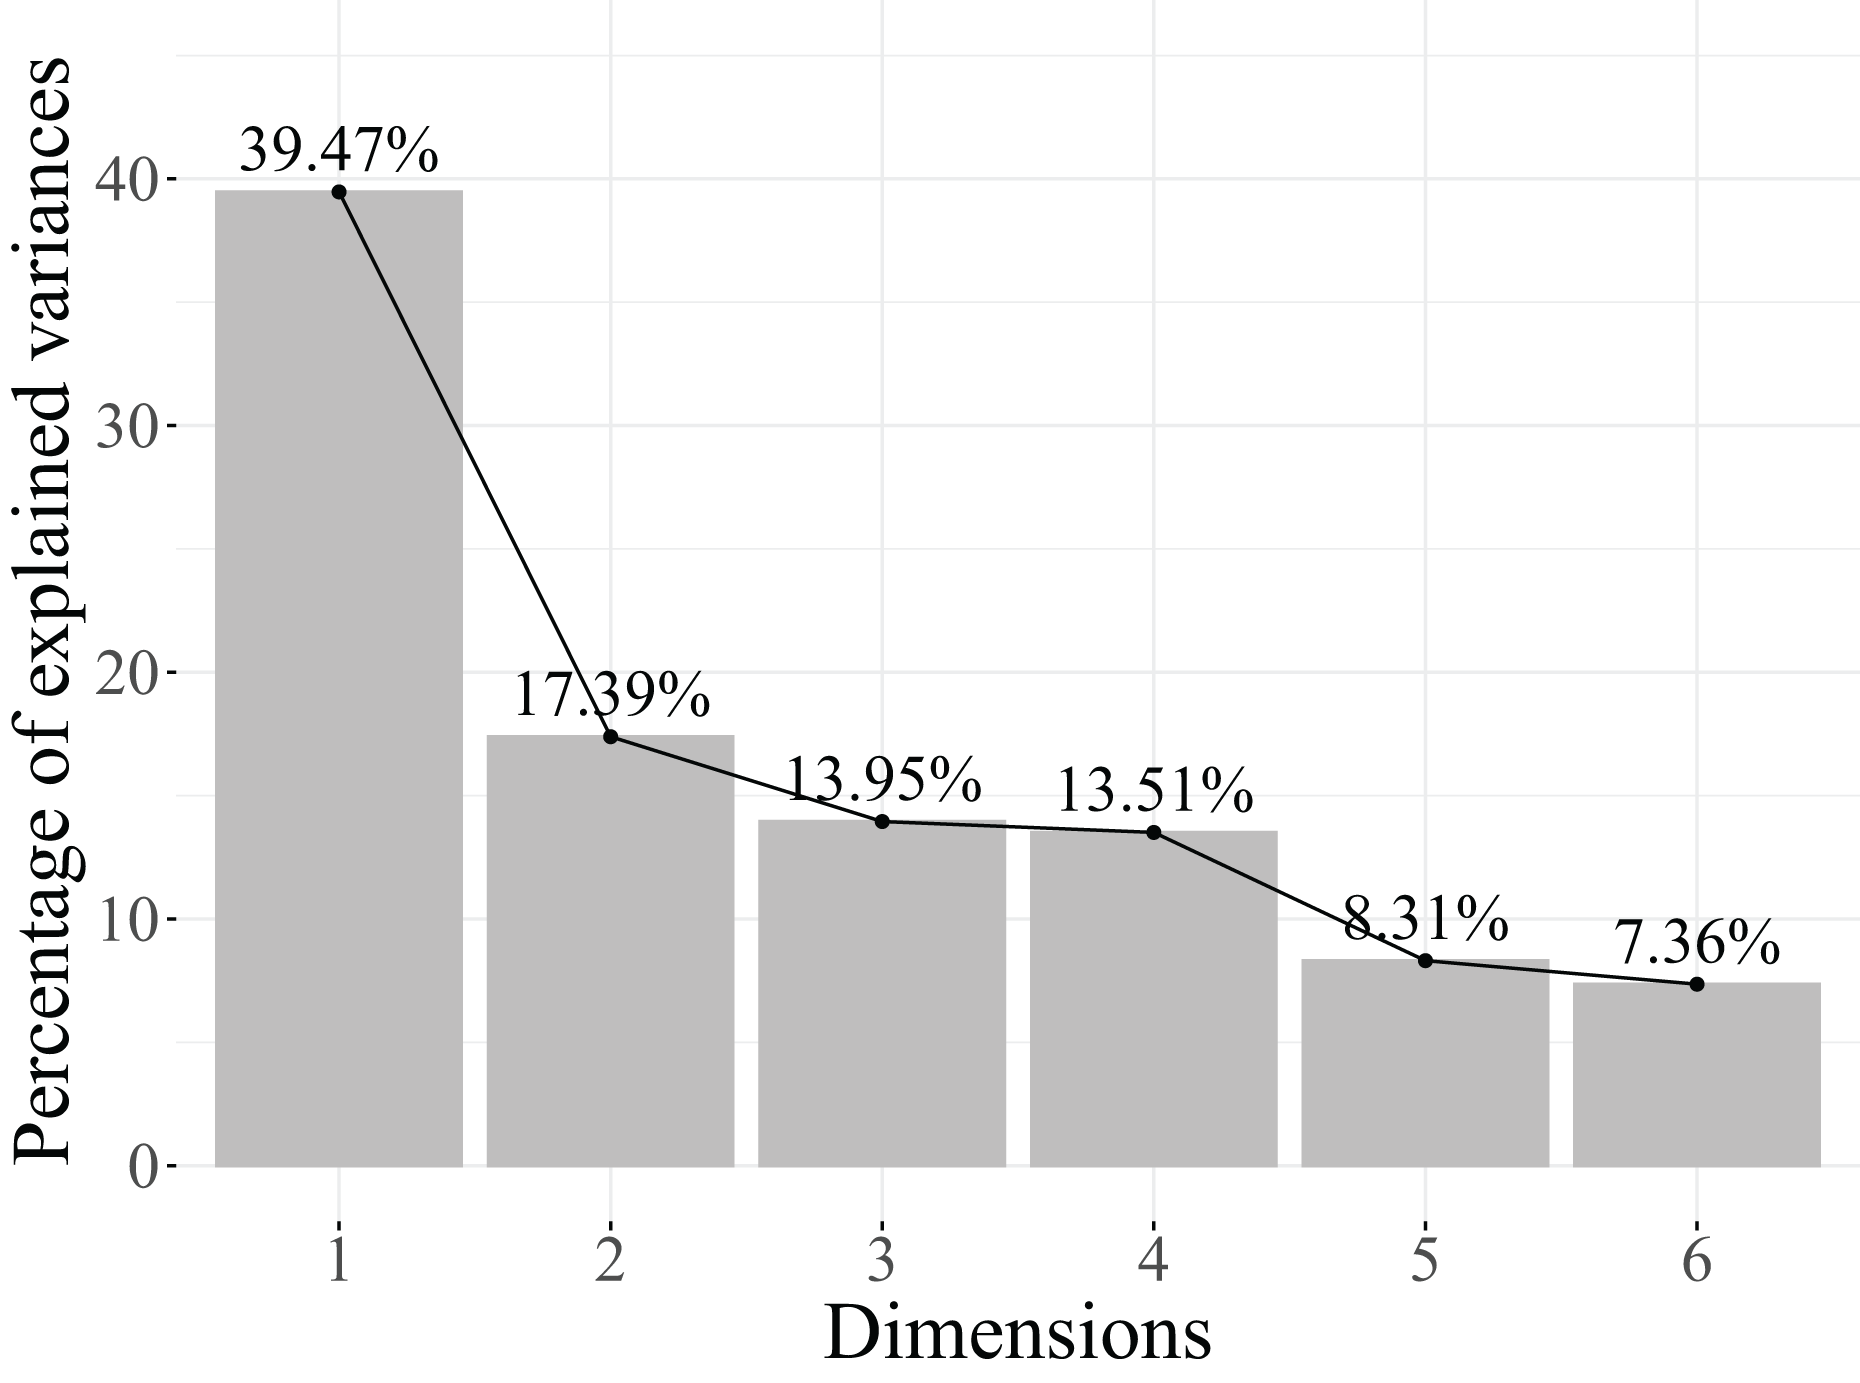
Next, the eigenvalues explained variance, and the cumulative percentage of explained variance are analysed to determine the number of retained dimensions. The results obtained are shown in Table 12 and Fig. 8.
| Dimensions | Eigenvalue | Cumulative variance explained |
|---|---|---|
| Dimension 1 | 0.3947 | 39.47% |
| Dimension 2 | 0.1739 | 56.86% |
| Dimension 3 | 0.1395 | 70.82% |
| Dimension 4 | 0.1351 | 84.33% |
| Dimension5 | 0.0831 | 92.64% |
| Dimension 6 | 0.0736 | 100.00% |
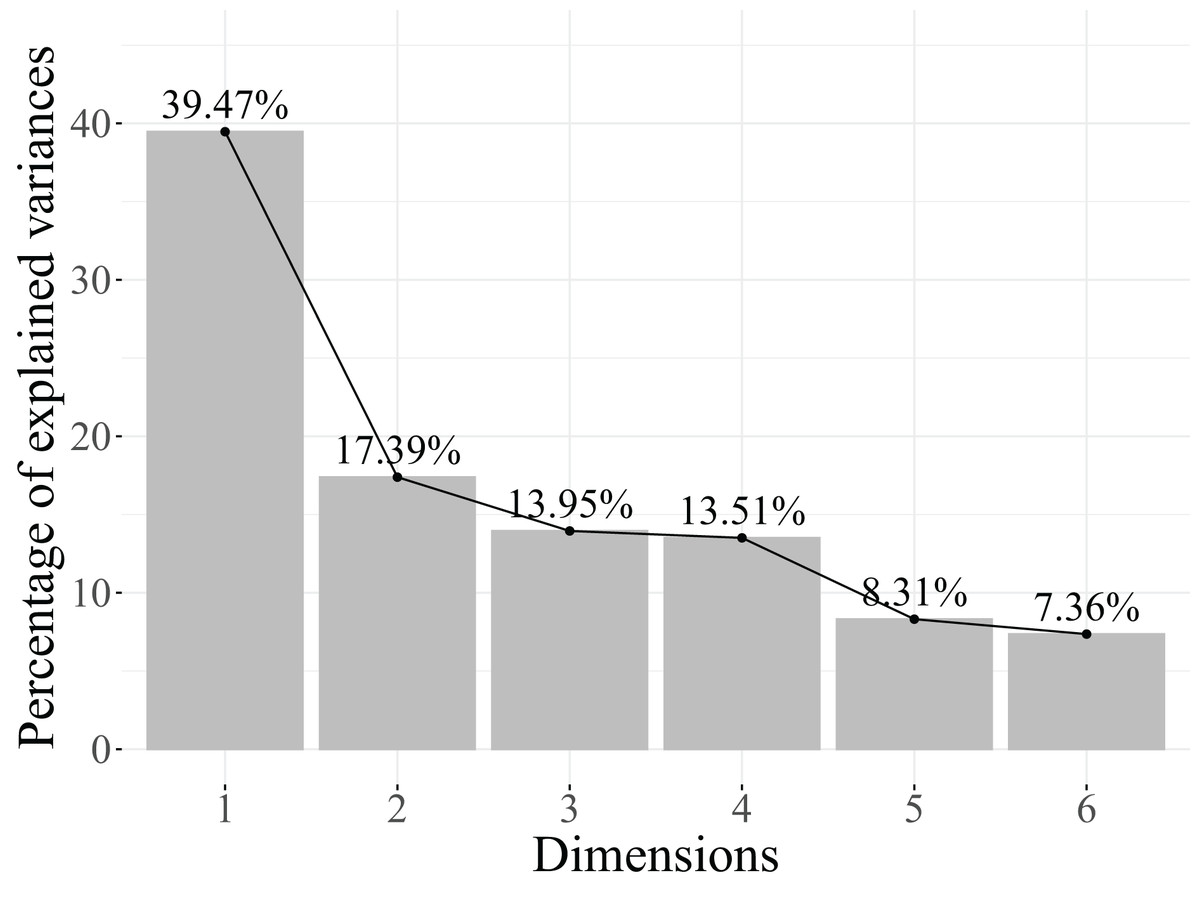
Figure 8: Plot of the percentage of variance explained in MCA, including the variables related to functions in engineers.
According to the results in Table 12, three dimensions are retained, as they account for 70.82% of the cumulative explained variance. Reducing to one dimension less only retains 56.86%, which is not adequate. Furthermore, as illustrated in the scree plot in Fig. 8, starting from the second dimension, the contribution to the explained variance is too small to justify including them in the model.
To interpret the dimensions retained in the MCA, it is first necessary to determine which variables exert the greatest influence on each axis. This influence is assessed using the coefficient. As previously, variables with are considered to make a substantial contribution to the inertia of a dimension and are therefore essential for its interpretation.
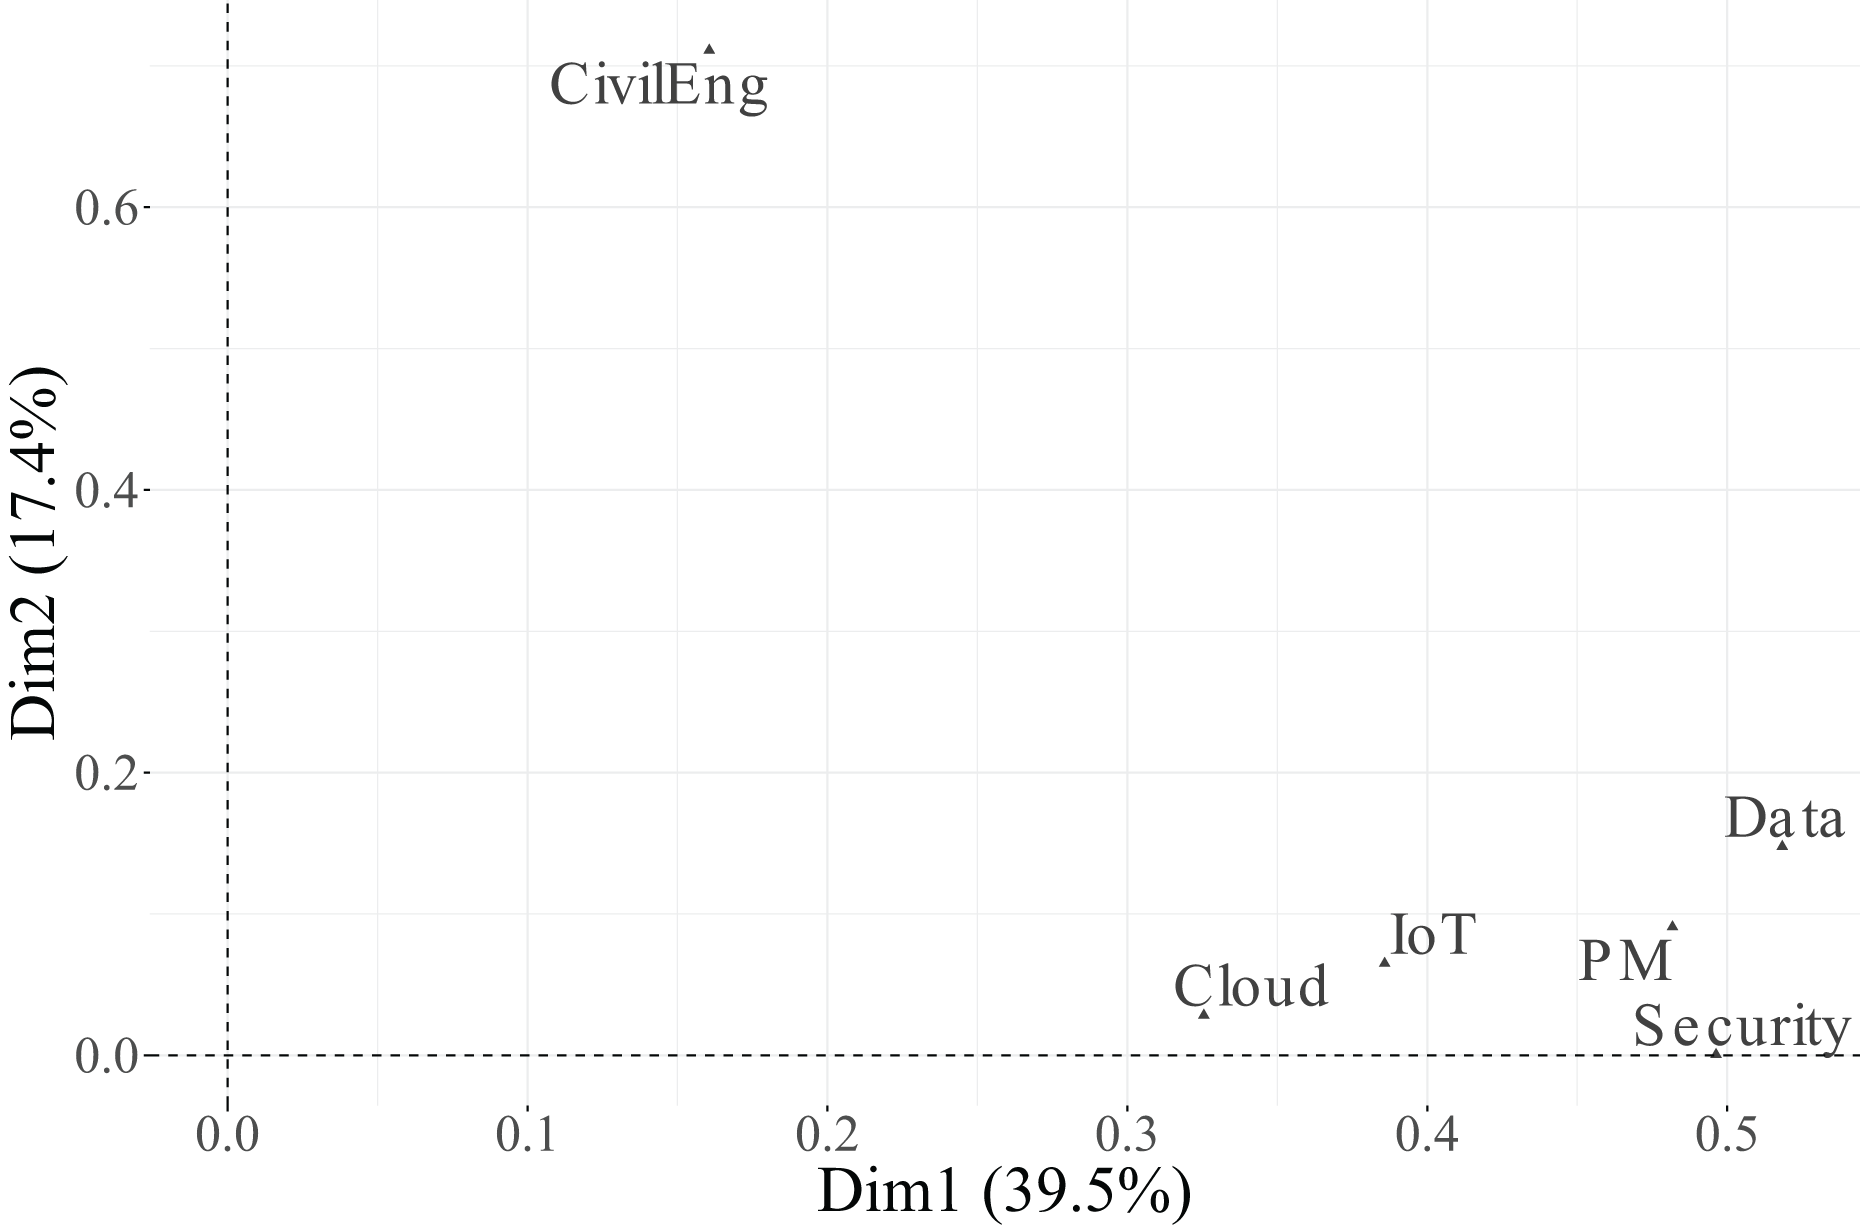
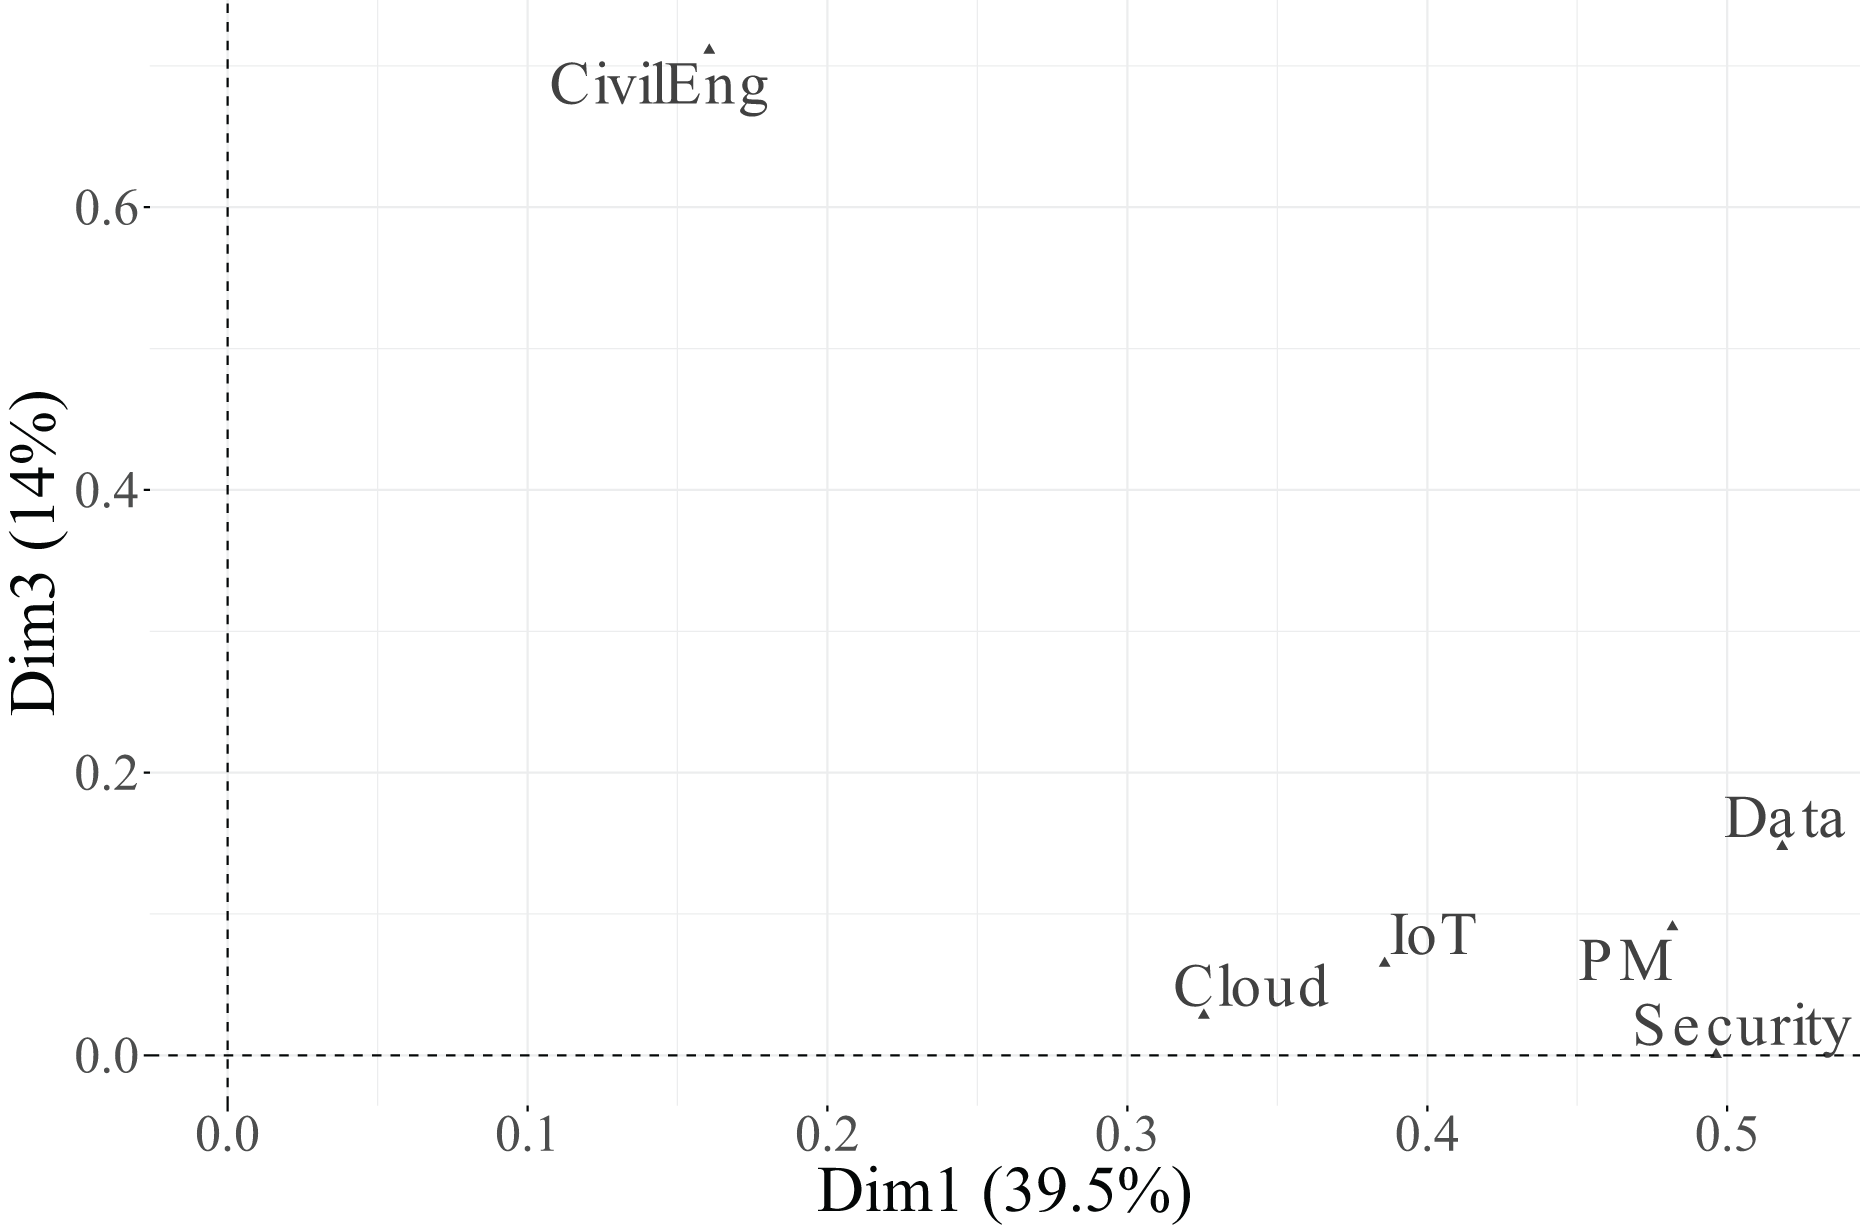
As shown in Table 13 and Figs. 9, 10, and 11, all variables display non-negligible values in at least one of the three retained dimensions. Specifically, Dimension 1, which explains 39.5% of the total inertia, is primarily structured by the variables PM ( ), Security ( ), and Data ( ). IoT ( ) and Cloud ( ) also make moderate contributions. Conversely, CivilEng ( ) exerts little influence on this first dimension.
| Variable | Dim. 1 | Dim. 2 | Dim. 3 |
|---|---|---|---|
| CivilEng | 0.1606 | 0.7111 | 0.0167 |
| PM | 0.4818 | 0.0908 | 0.1910 |
| Cloud | 0.3255 | 0.0283 | 0.4026 |
| Security | 0.4963 | 0.0005 | 0.0782 |
| Data | 0.5183 | 0.1477 | 0.0116 |
| IoT | 0.3858 | 0.0650 | 0.1370 |
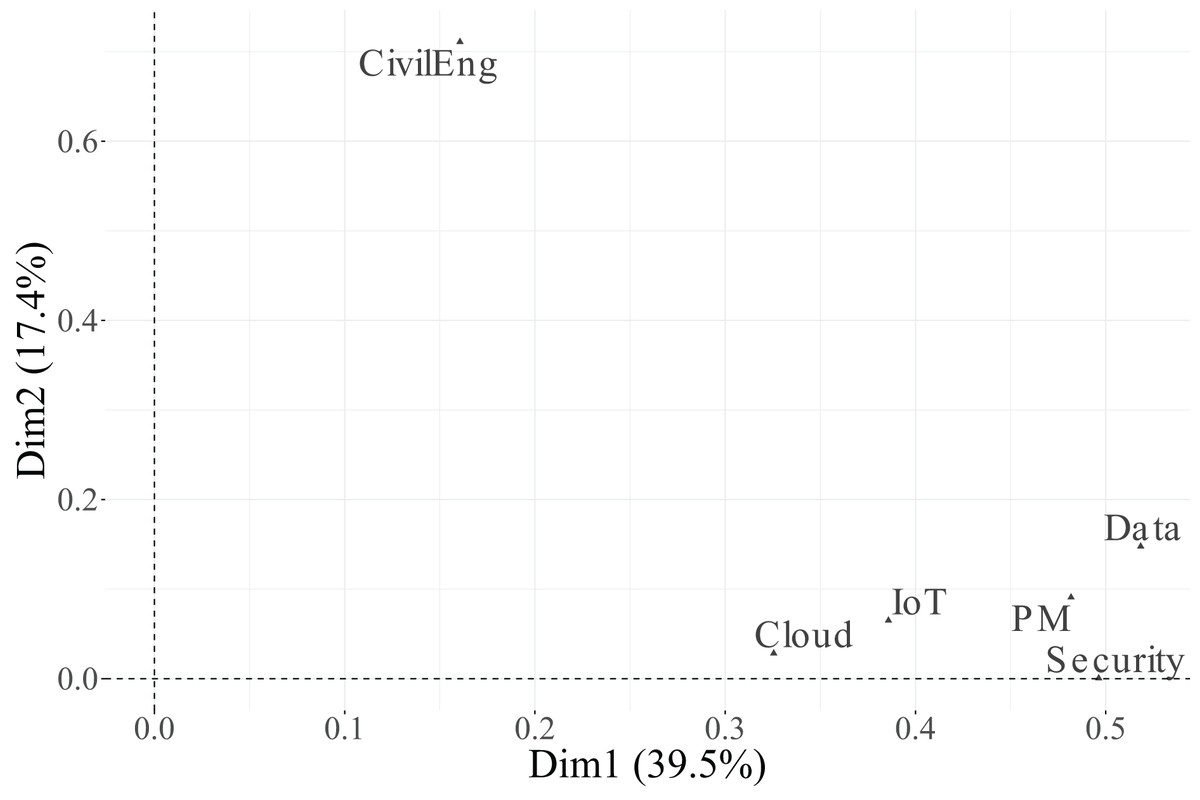
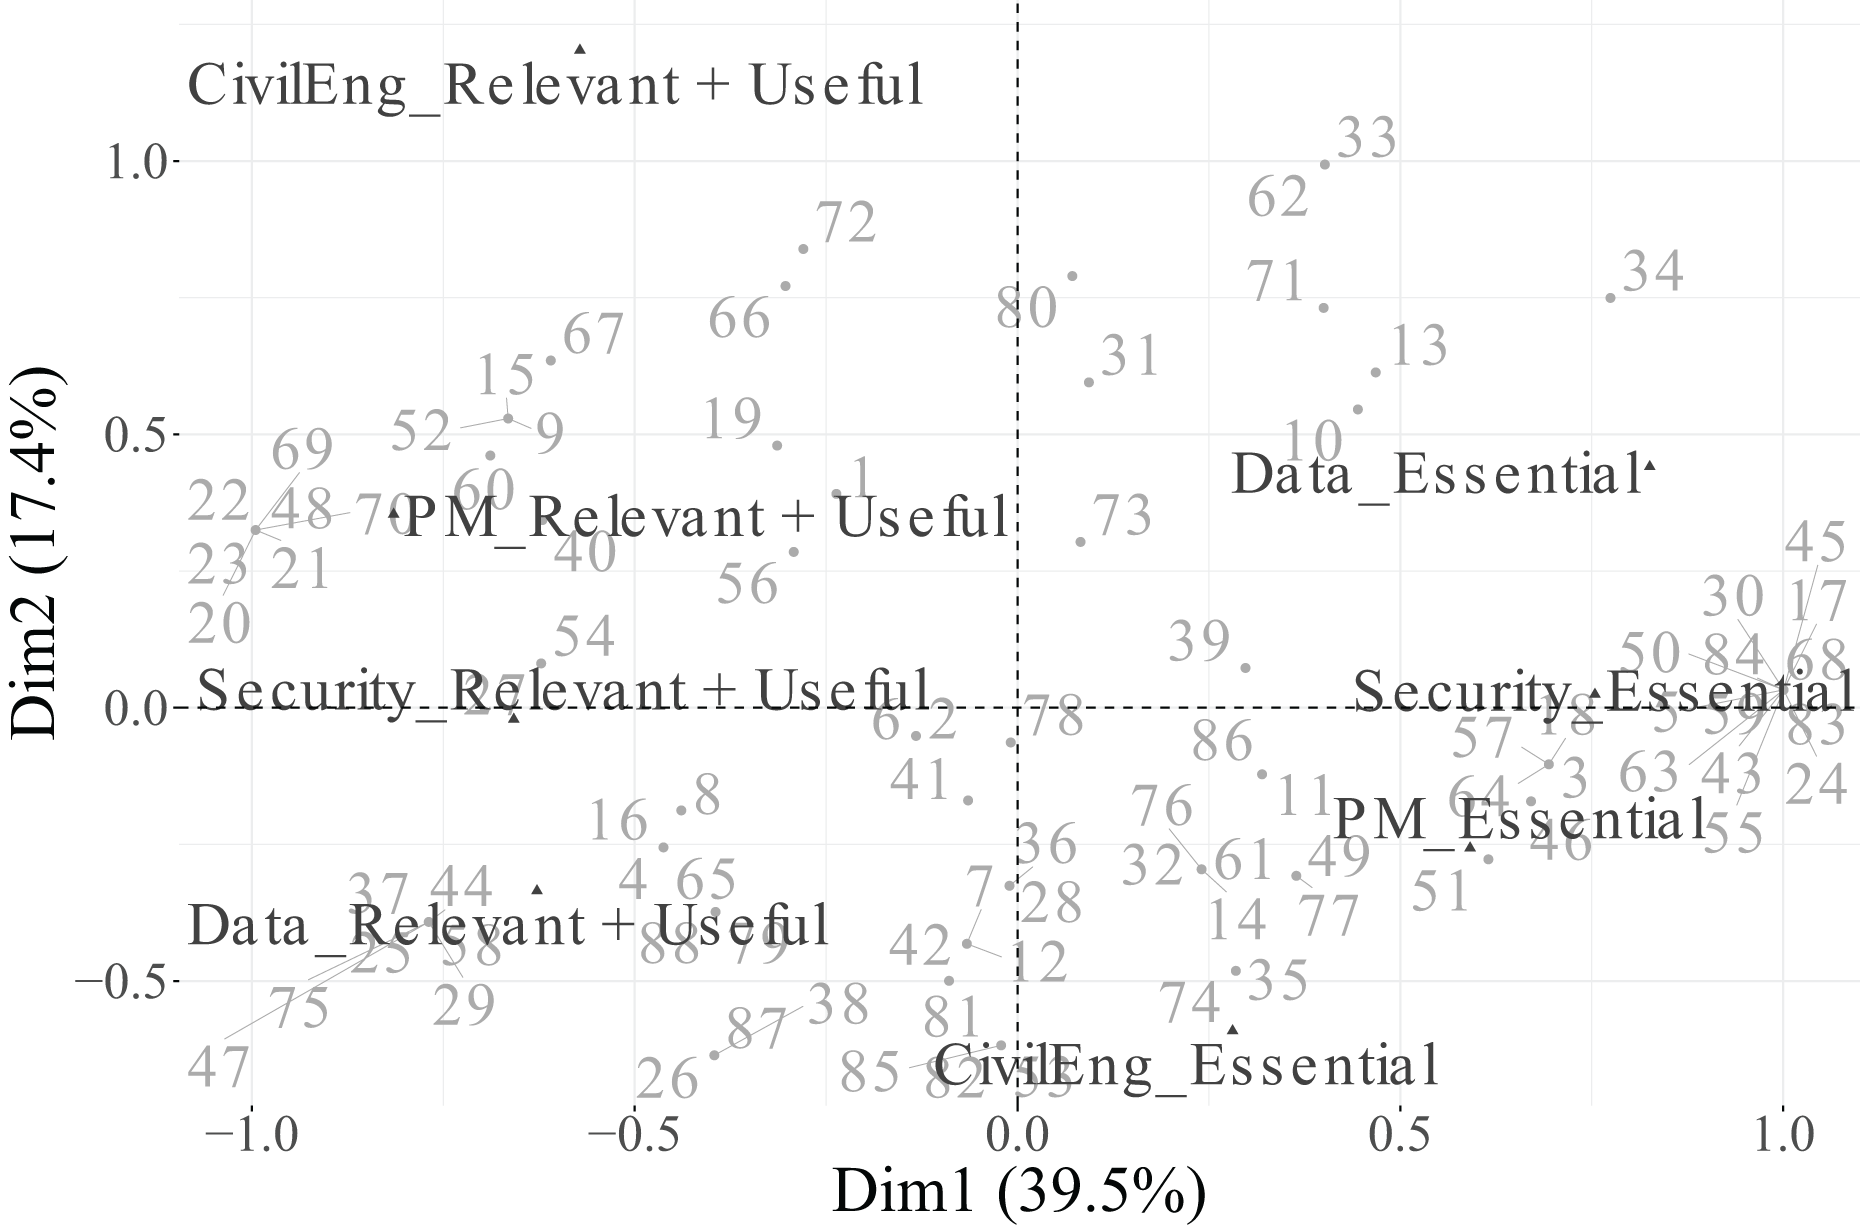
Figure 9: Correlation between variables related to functions in engineers and dimensions 1 and 2.

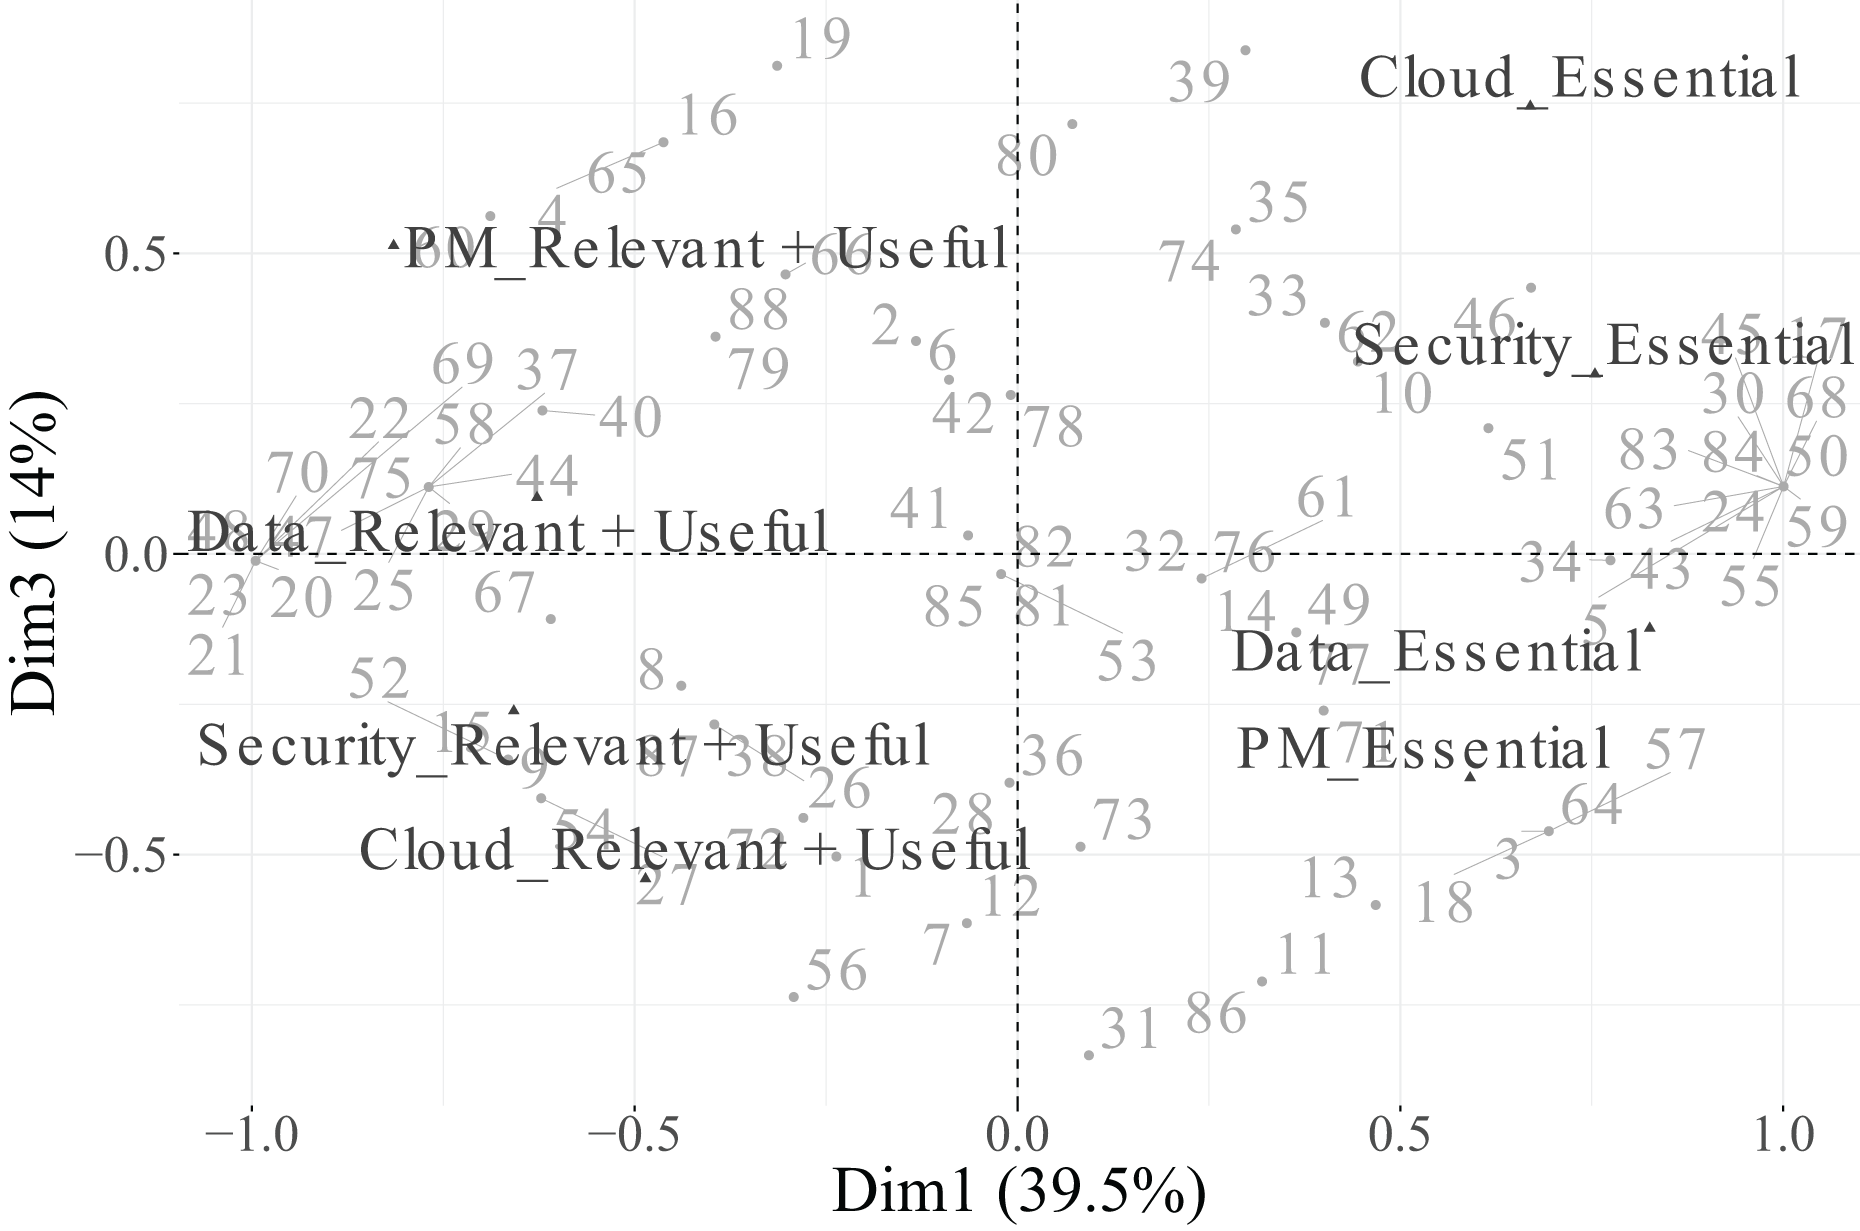
Figure 10: Correlation between variables related to functions in engineers and dimensions 1 and 3.
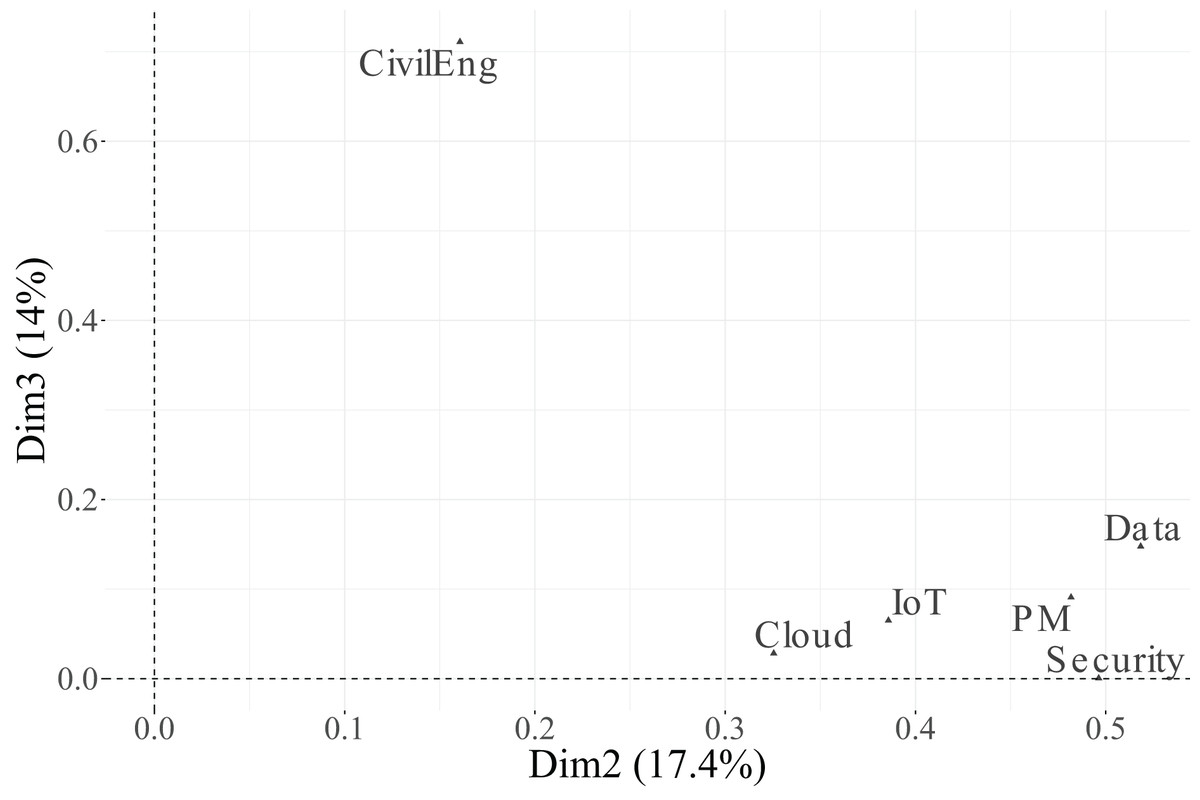
Figure 11: Correlation between variables related to functions in engineers and dimensions 2 and 3.
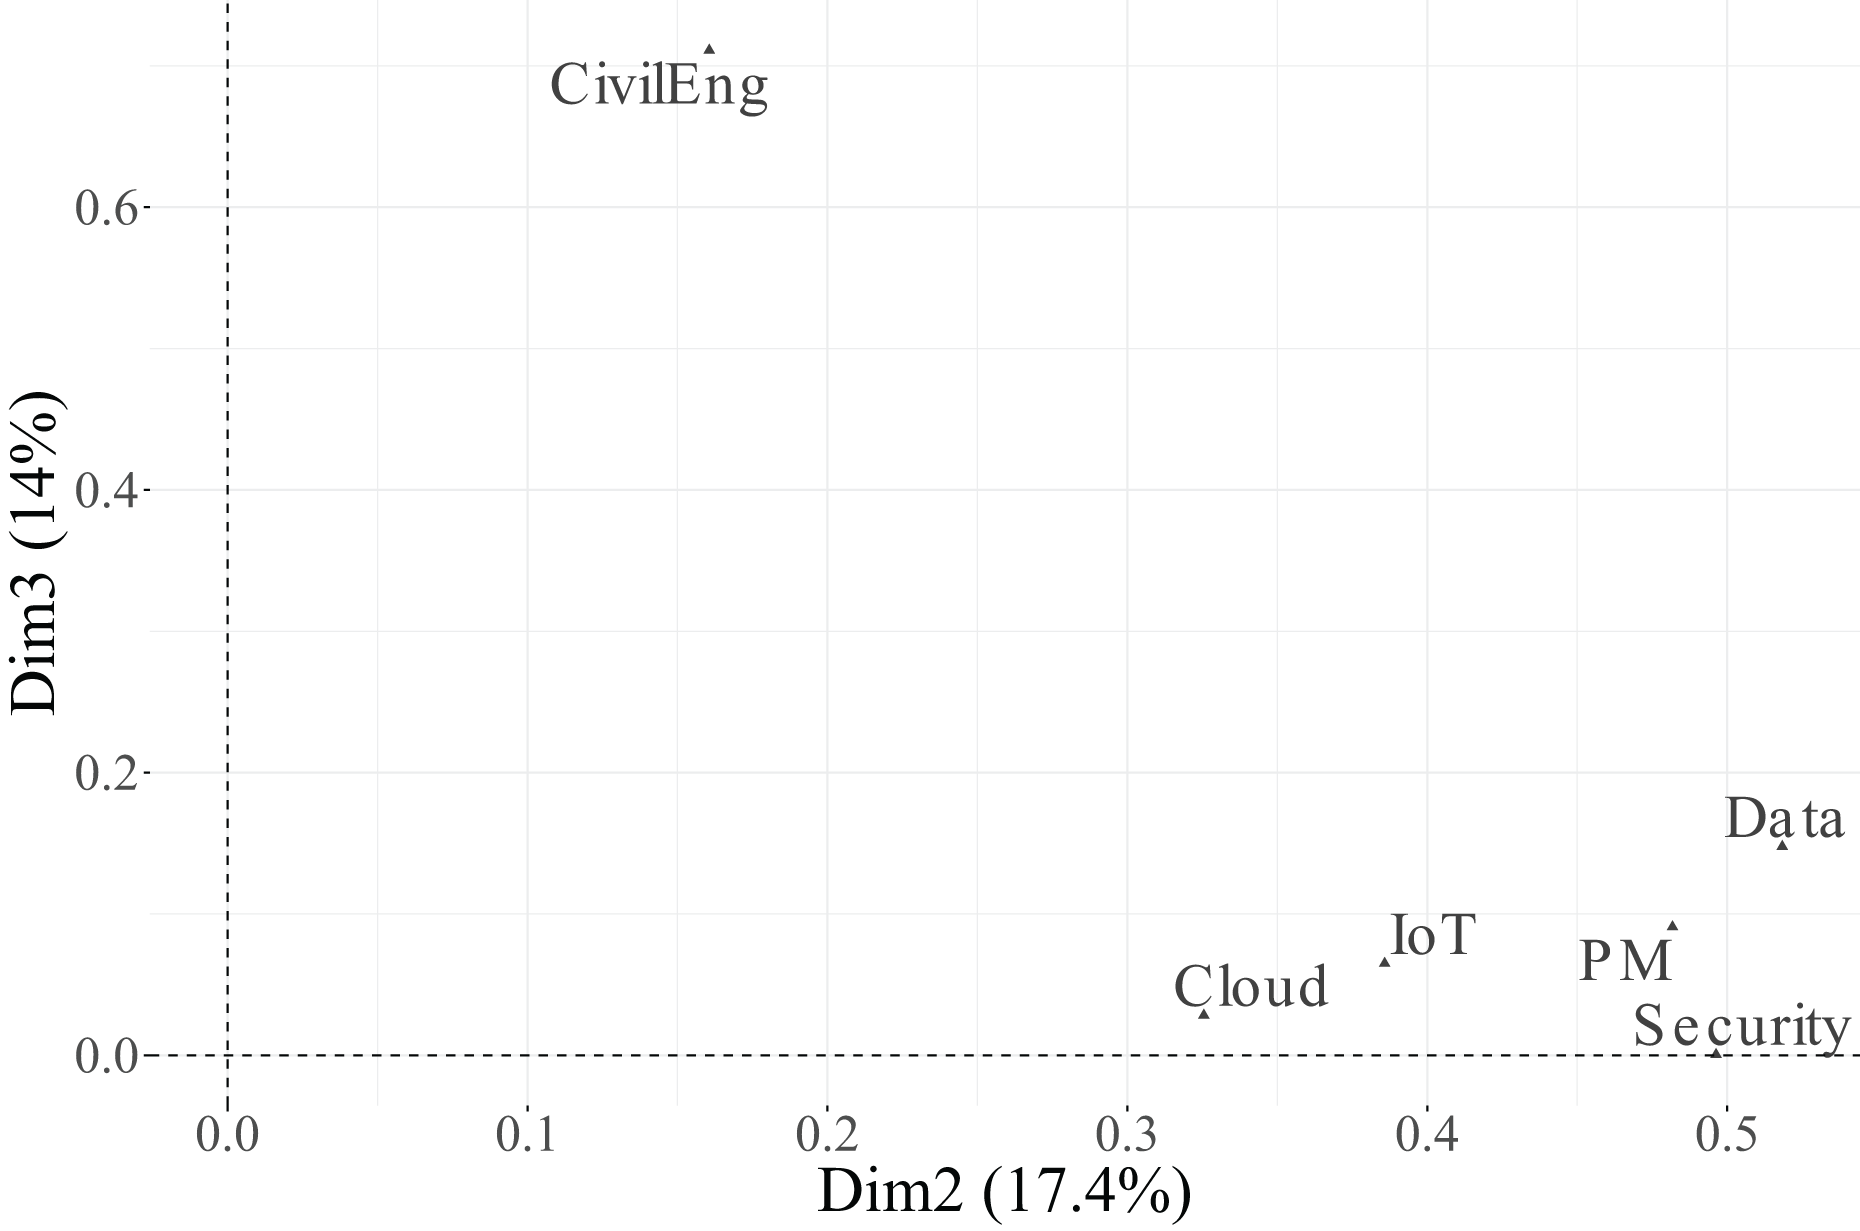
In contrast, Dimension 2, which accounts for 17.4% of the total inertia, is dominated by the variable CivilEng ( ), followed by Data ( ). The remaining variables show low to negligible associations with this dimension, indicating that it captures variation mainly linked to engineering functions.
Finally, Dimension 3, which explains 14.9% of the inertia, is primarily associated with the variables Cloud ( ) and PM ( ), while IoT ( ) and Security ( ) have a more moderate effect. These results suggest that the first dimension represents a general technological valuation axis, the second dimension reflects engineering specialisation, and the third dimension captures complementary variability associated with cloud-based and project management functions.
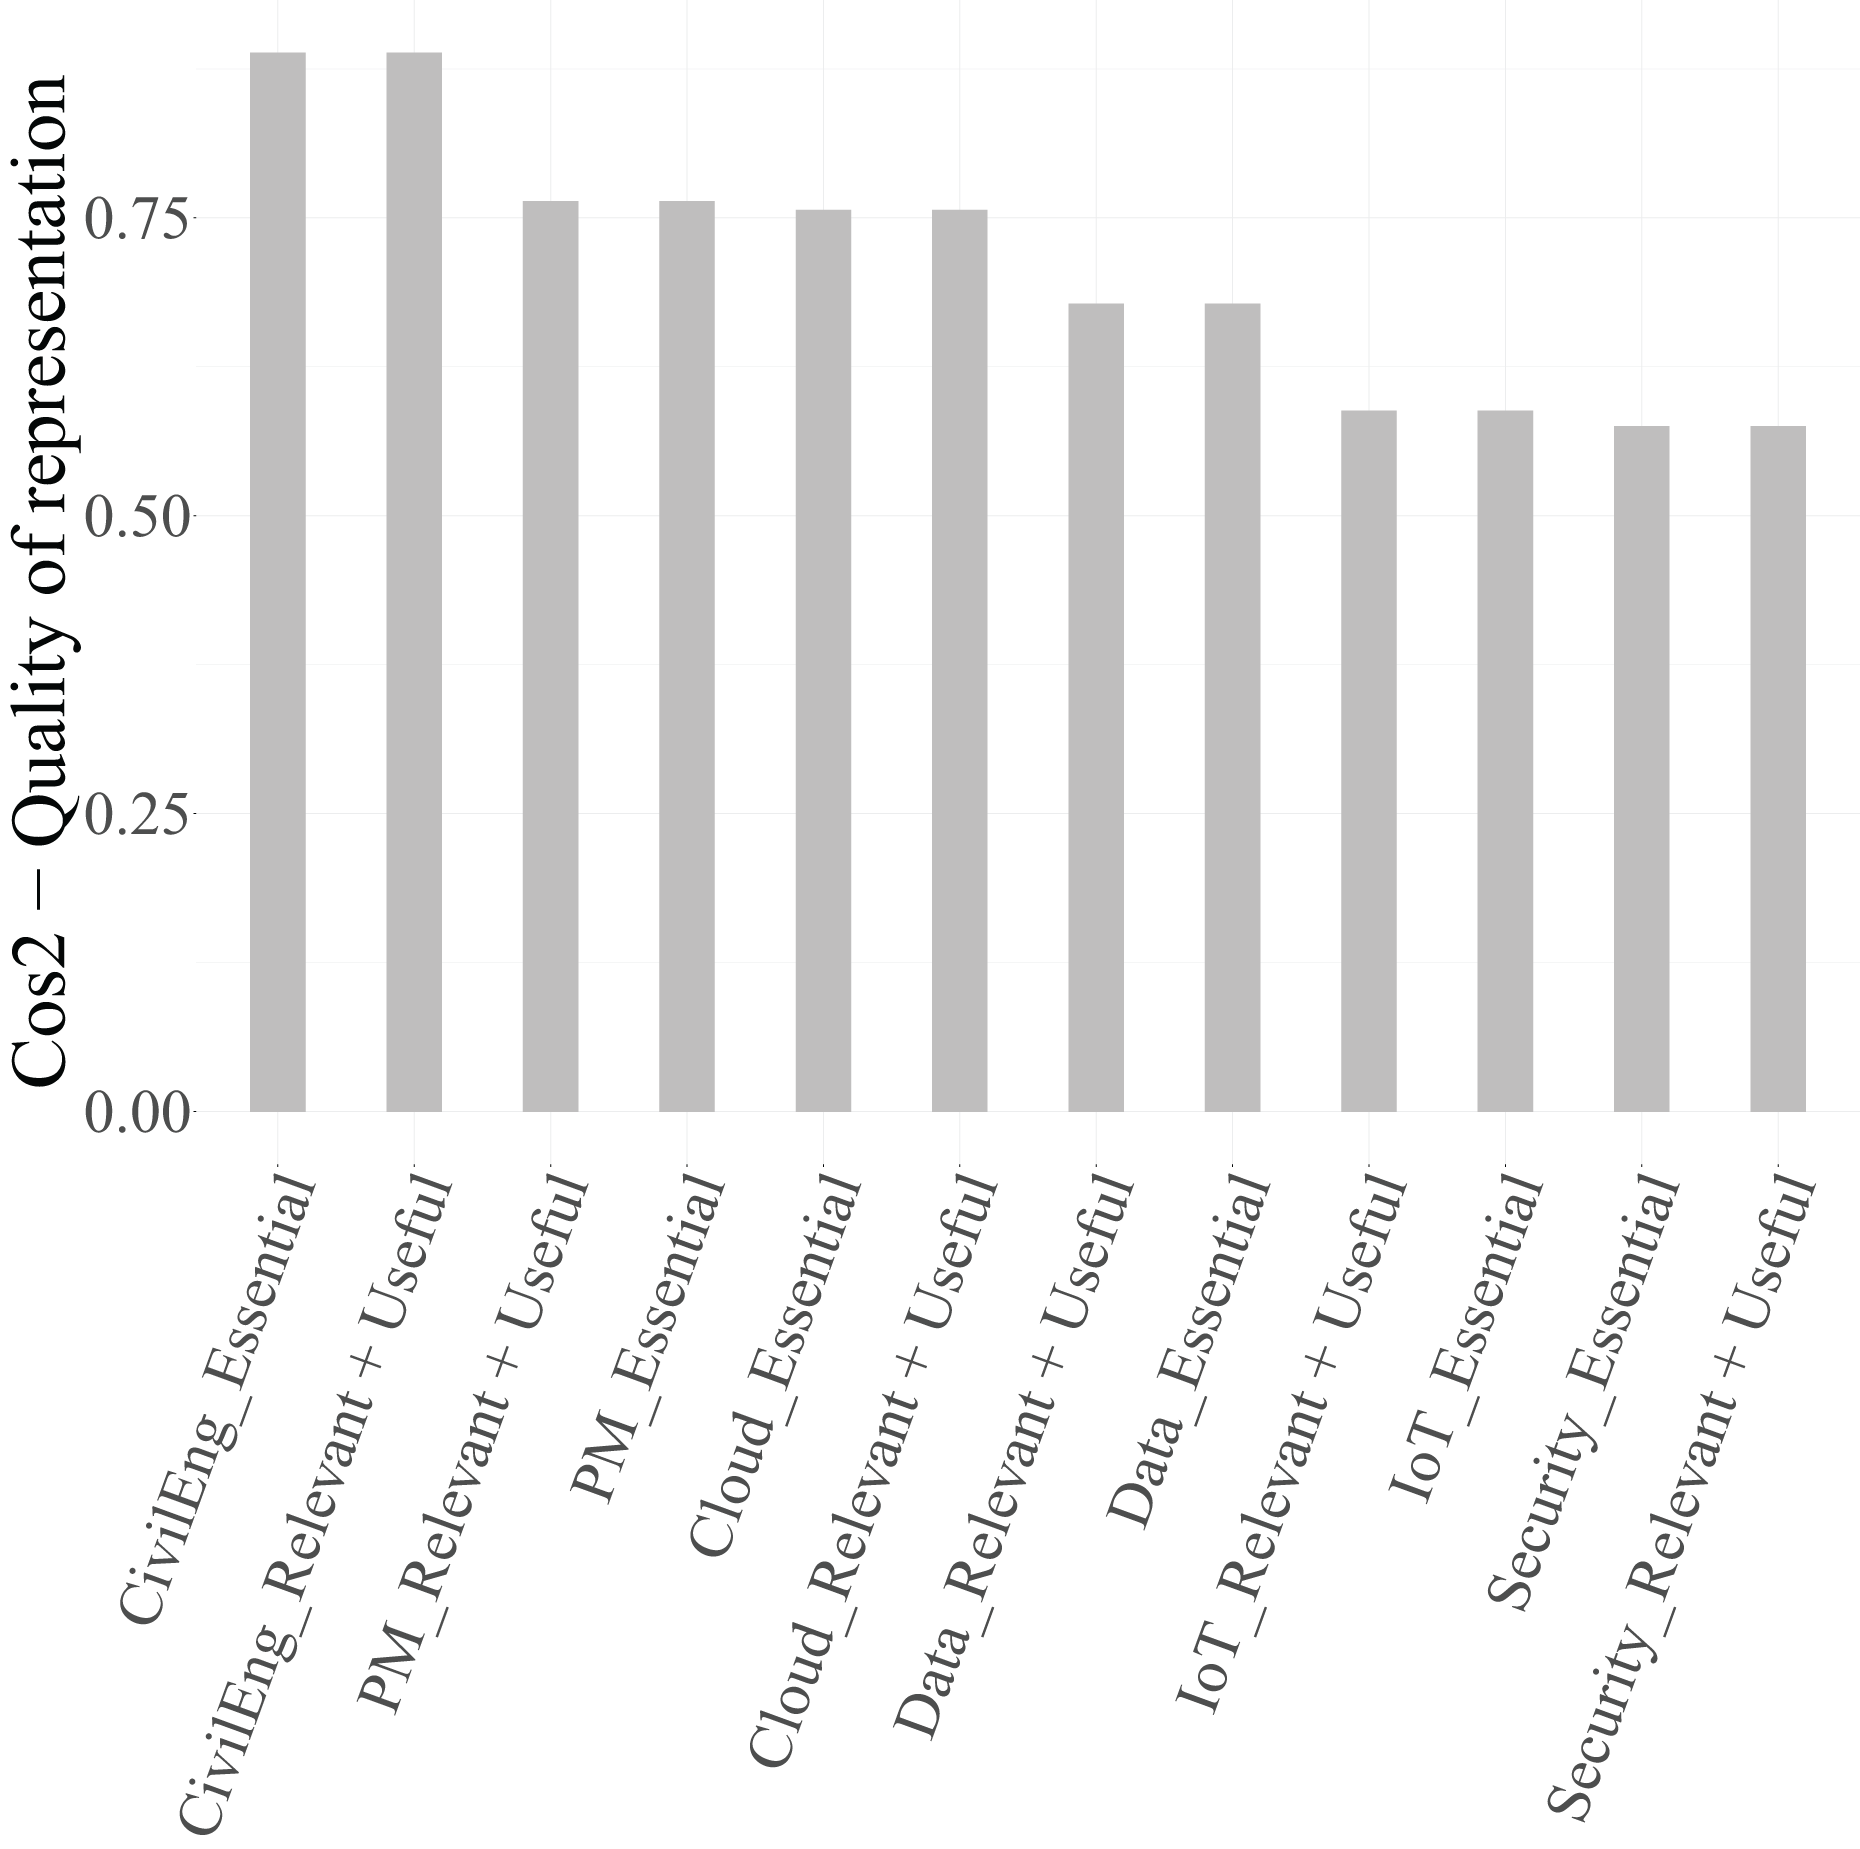
Once the most influential variables are identified, it is necessary to assess the quality of the representation of their categories in the factorial space. This is evaluated using the squared cosine ( ), which measures the proportion of inertia of each category explained by the retained dimensions. As previously, categories with are considered well represented on the factorial map and thus retained for graphical interpretation.
From Table 14 and Fig. 12, it can be observed that several categories reach high values in at least one dimension. For Dimension 1, the categories of PM ( ), Security ( ), and Data ( ) are particularly well represented, confirming their strong association with this axis. The categories of Cloud ( ) and IoT ( ) show moderate representation, while those of CivilEng ( ) fall below the threshold, indicating limited projection quality.
| Category | Dim. 1 | Dim. 2 | Dim. 3 |
|---|---|---|---|
| CivilEng (Essential) | 0.1606 | 0.7111 | 0.0167 |
| CivilEng (Relevant + Useful) | 0.1606 | 0.7111 | 0.0167 |
| PM (Essential) | 0.4818 | 0.0908 | 0.1910 |
| PM (Relevant + Useful) | 0.4818 | 0.0908 | 0.1910 |
| Cloud (Essential) | 0.3255 | 0.0283 | 0.4026 |
| Cloud (Relevant + Useful) | 0.3255 | 0.0283 | 0.4026 |
| Security (Essential) | 0.4963 | 0.0005 | 0.0782 |
| Security (Relevant + Useful) | 0.4963 | 0.0005 | 0.0782 |
| Data (Essential) | 0.5184 | 0.1477 | 0.0116 |
| Data (Relevant + Useful) | 0.5184 | 0.1477 | 0.0116 |
| IoT (Essential) | 0.3858 | 0.0650 | 0.1370 |
| IoT (Relevant + Useful) | 0.3858 | 0.0650 | 0.1370 |
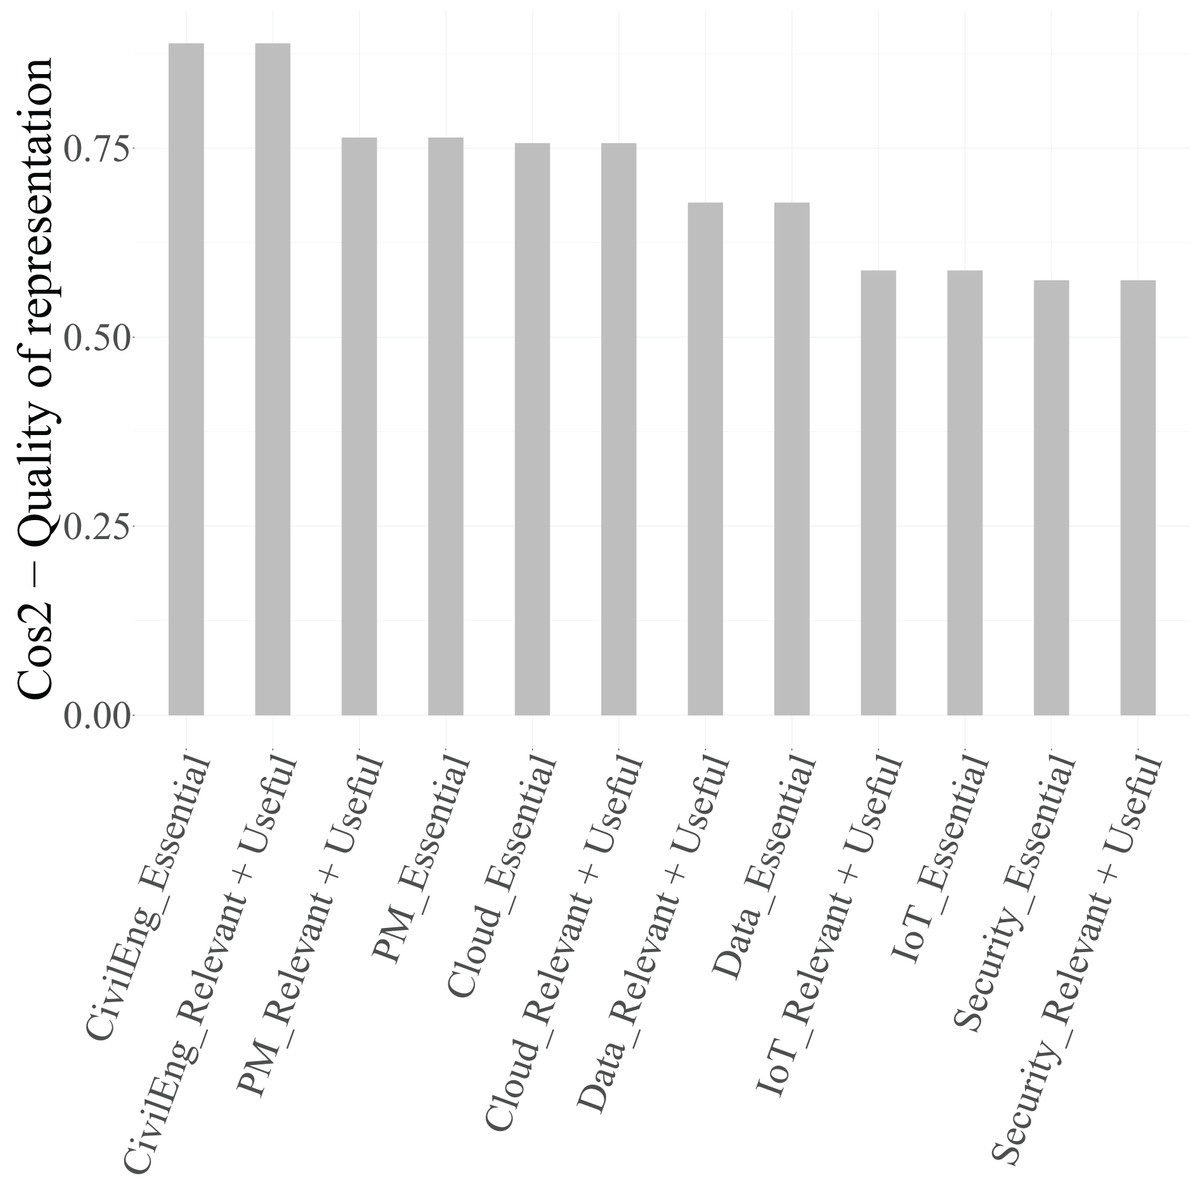
Figure 12: Quality of the representation of the categories of the variables related to functions in engineers in the first three dimensions.
Consequently, the two categories of CivilEng and Cloud were excluded from the biplot of Dimensions 1 and 2 (Fig. 13), as their values do not meet the 0.4 criterion. Similarly, the categories of CivilEng and IoT were removed from the biplot of Dimensions 1 and 3 (Fig. 14), and those of PM, Security, Data, and IoT were excluded from the biplot of Dimensions 2 and 3 (Fig. 15) due to inadequate representation quality.
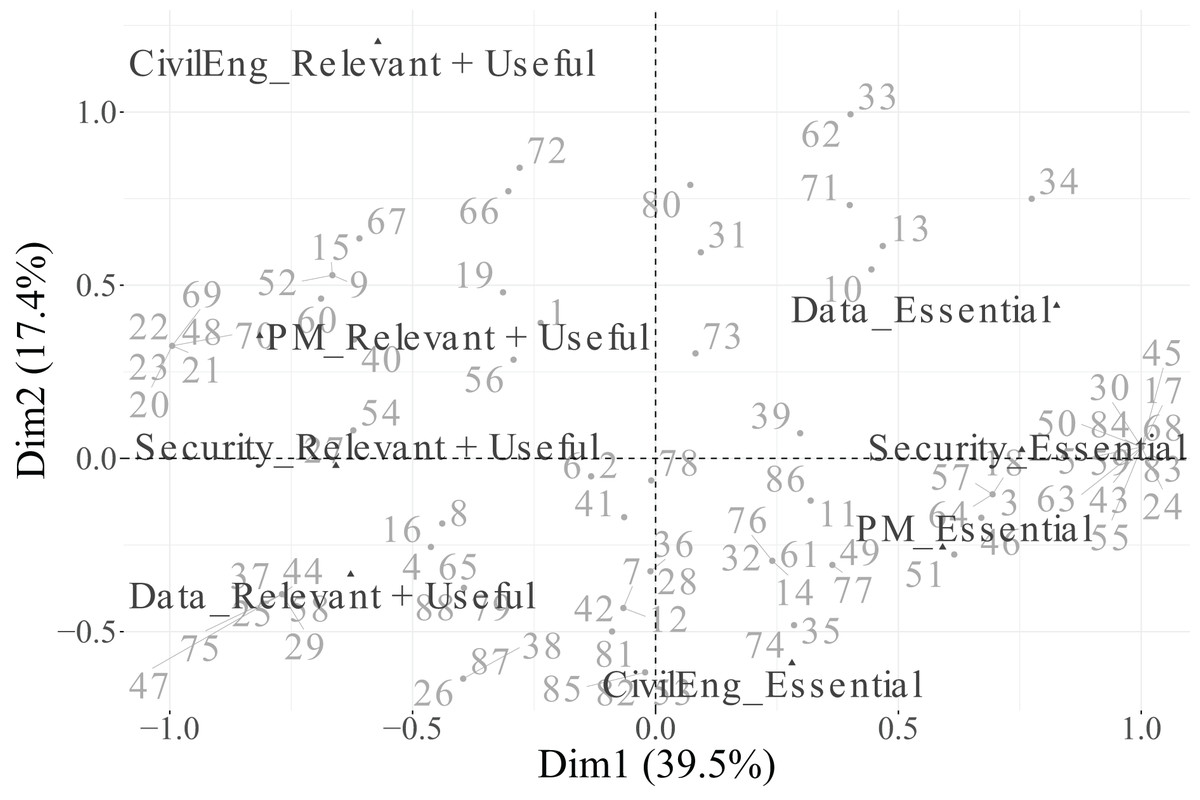
Figure 13: Biplot of dimensions 1 and 2 obtained from MCA, including individuals and the variables related to functions in engineers.
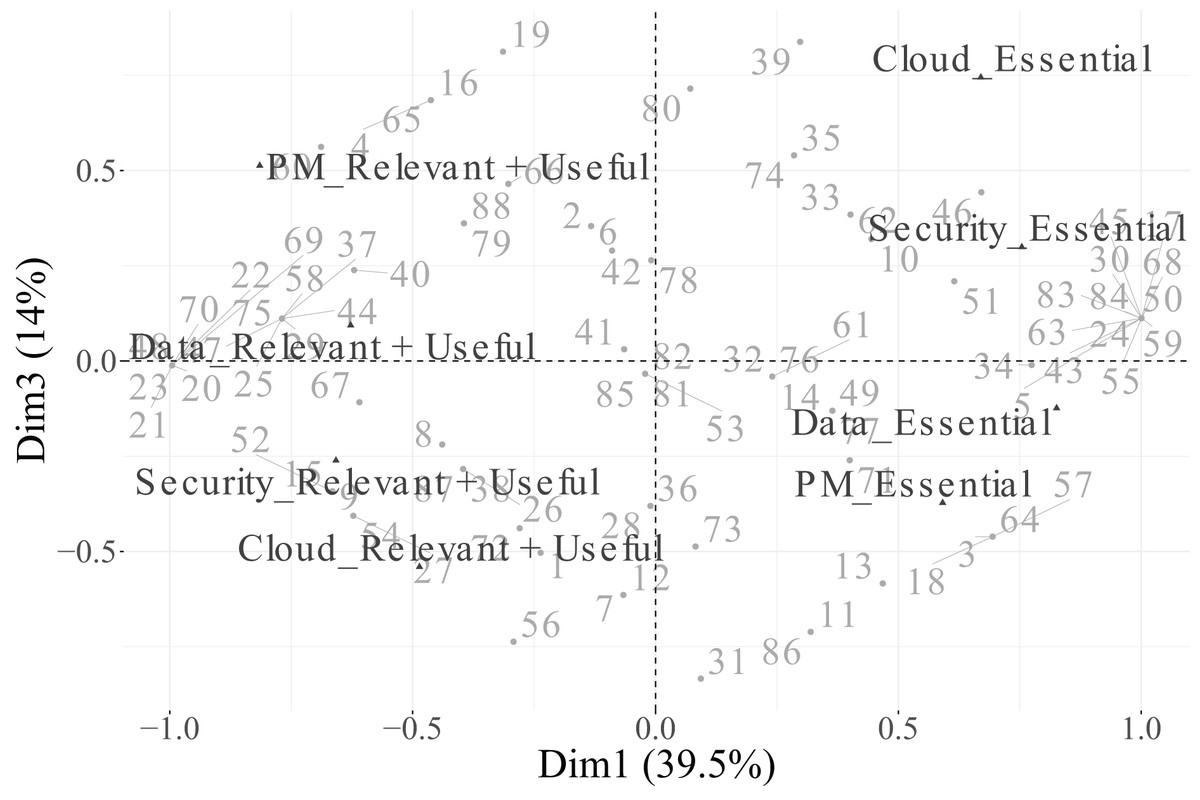
Figure 14: Biplot of dimensions 1 and 3 obtained from MCA, including individuals and the variables related to functions in engineers.
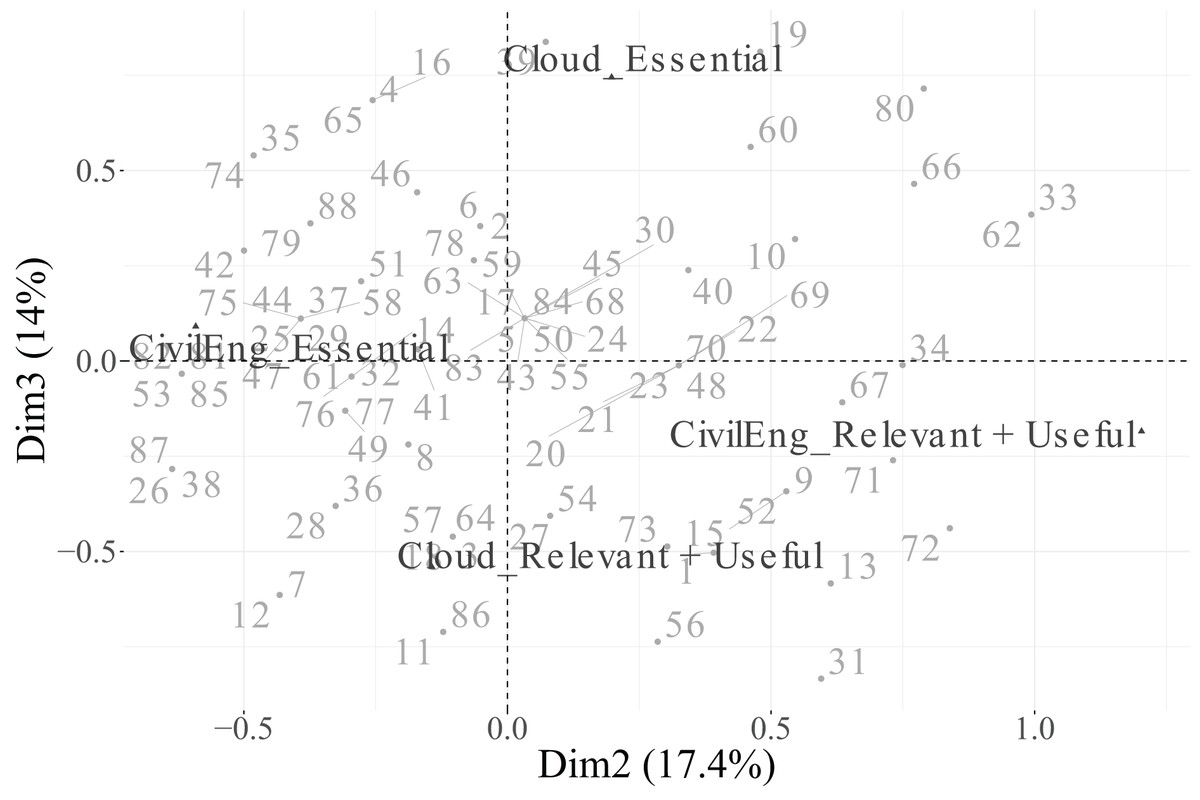
Figure 15: Biplot of dimensions 2 and 3 obtained from MCA, including individuals and the variables related to functions in engineers.
Based on these criteria ( for variables and for categories), the biplots presented in Figs. 13, 14, and 15 include only categories that meet both thresholds, ensuring a clear and interpretable representation focused on the most informative elements.
Additionally, the percentage contribution of each category to each retained dimension is detailed in Table 15. In Dimension 1, the categories PM (Essential and Relevant + Useful), Security (Essential and Relevant + Useful), and Data (Essential and Relevant + Useful) stand out for their strong contributions, confirming their importance in defining the main technological axis. For Dimension 2, the two categories of CivilEng make the largest contribution, consistent with their high value and confirming their role as key descriptors of engineering specialisation. In Dimension 3, the categories of Cloud and PM are the most influential, shaping a secondary axis associated with cloud and project management aspects.
| Category | Dim. 1 | Dim. 2 | Dim. 3 |
|---|---|---|---|
| CivilEng (Essential) | 2.23% | 22.46% | 0.66% |
| CivilEng (Relevant + Useful) | 4.55% | 45.69% | 1.34% |
| PM (Essential) | 8.56% | 3.66% | 9.59% |
| PM (Relevant + Useful) | 11.79% | 5.05% | 13.22% |
| Cloud (Essential) | 7.97% | 1.57% | 27.87% |
| Cloud (Relevant + Useful) | 5.78% | 1.14% | 20.22% |
| Security (Essential) | 11.19% | 0.03% | 4.99% |
| Security (Relevant + Useful) | 9.76% | 0.02% | 4.35% |
| Data (Essential) | 12.43% | 8.04% | 0.79% |
| Data (Relevant + Useful) | 9.45% | 6.11% | 0.60% |
| IoT (Essential) | 8.52% | 3.26% | 8.56% |
| IoT (Relevant + Useful) | 7.77% | 2.97% | 7.81% |
In the biplot of Dimensions 1 and 2 (Fig. 13), Dimension 1 separates categories perceived as Essential (positive side) from those considered Relevant + Useful (negative side) for PM, Security, and Data, illustrating a contrast between indispensable and supportive functions. Dimension 2, in turn, is driven by the CivilEng variable, with its Essential category projected on the negative side and its Relevant + Useful category on the positive side, reflecting diverging evaluations of engineering roles.
In the biplot of Dimensions 1 and 3 (Fig. 14), the Essential categories of PM and Cloud are positioned toward the positive end of Dimension 3, while their Relevant + Useful counterparts appear on the opposite side, indicating a contrast between core and complementary functions within project–cloud interactions.
In the biplot of Dimensions 2 and 3 (Fig. 15), the factorial space is primarily shaped by CivilEng on Dimension 2 and Cloud on Dimension 3, showing how the combination of both axes highlights relationships between engineering specialisation and technological infrastructure.
Regarding individuals, their distribution across the factorial planes indicates substantial variability in response profiles. Despite the dispersion across quadrants, clusters of individuals can be observed around particular category points, suggesting the existence of groups with similar perceptions of function relevance.
In summary, Dimension 1 represents a general technological axis dominated by PM, Security, and Data; Dimension 2 captures engineering specialisation led by CivilEng; and Dimension 3 reflects project–cloud interactions defined by Cloud and PM. Categories that did not meet the representational quality criterion ( ) were excluded from the biplots to ensure analytical rigour and visual clarity. This methodological refinement enhances the explanatory power of the MCA results and provides a focused interpretation of how engineers differentiate between essential and supportive roles across functions.
Finally, a bootstrap resampling procedure ( ) was applied to assess the robustness of the factorial configuration obtained for the function categories of engineers. This approach provides an empirical foundation for evaluating the variability of category coordinates and estimating the consistency of their positions across resampled datasets. The results are presented in Table 16, which reports the standard deviations of category coordinates along the first two factorial dimensions, together with their corresponding Mean SD values.
| Category | SD Dim1 | SD Dim2 | Mean SD |
|---|---|---|---|
| CivilEng (Essential) | 0.297 | 0.190 | 0.243 |
| Cloud (Relevant + Useful) | 0.499 | 0.295 | 0.397 |
| Data (Relevant + Useful) | 0.638 | 0.169 | 0.404 |
| PM (Essential) | 0.598 | 0.211 | 0.405 |
| PM (Relevant + Useful) | 0.825 | 0.290 | 0.557 |
The results indicate a satisfactory degree of coordinate stability, with Mean SD values predominantly within a moderate range (0.24–0.56). The category CivilEng (Essential) exhibits notably high positional consistency, whereas PM (Relevant + Useful) and Cloud (Relevant + Useful) display slightly greater variability, reflecting sensitivity to sample composition in certain cases. Nevertheless, these deviations remain within acceptable limits and do not compromise the factorial configuration. Overall, the findings confirm that the factorial solution for engineers is both stable and reliable, supporting the robustness and interpretability of the structure across resampled datasets. Similar to the previous analysis, some categories are not displayed in the bootstrap results because resampling was conducted at the individual level, and low-frequency categories were not consistently represented in all replicated samples.
Multiple correspondence analysis for the variables related to skills in technicians
This section presents the results of the dependency analysis for variables related to skills among technicians. Pairwise and Fisher’s Exact tests were conducted to identify significant associations between skill categories. To control for the inflation of Type I error due to multiple comparisons, the Bonferroni correction was applied. When applicable, the effect size ( ) was calculated to quantify the strength of the associations. The adjusted p-values ( ) and corresponding effect classifications are summarised in Table 17. The Fisher’s Exact test was employed when the expected frequencies in any cell were below 5, in which case could not be computed and is reported as NA. In Table 17, bolded values indicate statistically significant dependencies after Bonferroni correction ( ), while NA entries for correspond to Fisher’s tests where effect sizes could not be estimated.
| Variable 1 | Variable 2 | Test | -value | Effect Strength | |||
|---|---|---|---|---|---|---|---|
| SS | GS | Fisher’s Exact | NA | 0.001 | NA | 0.003 | NA |
| ET | B/M | Fisher’s Exact | NA | 0.527 | NA | 1.000 | NA |
| ET | SS | 0.118 | 0.731 | 0.001 | 1.000 | Weak | |
| ET | GS | 1.683 | 0.194 | 0.019 | 1.000 | Weak | |
| B/M | SS | Fisher’s Exact | NA | 0.181 | NA | 1.000 | NA |
| B/M | GS | Fisher’s Exact | NA | 0.267 | NA | 1.000 | NA |
As shown in Table 17, only one significant dependency was detected among the skill variables of technicians. The pair “SS”–“GS” exhibits a statistically significant association after Bonferroni correction ( ), indicating that social and green skills tend to co-occur within this professional group. However, since this relationship was assessed using Fisher’s Exact test, the effect size ( ) could not be estimated and is therefore unavailable. All other pairs, including “ET”–“B/M”, “ET”–“SS”, and “ET”–“GS”, show non-significant results with weak or negligible values. Overall, these findings suggest that, for technicians, transversal skill domains remain largely independent, with minimal overlap between digital, managerial, and environmental competences.
Next, the eigenvalues explained variance, and the cumulative percentage of explained variance are analysed to determine the number of dimensions to consider. The results obtained are shown in Table 18 and Fig. 16.
| Dimensions | Eigenvalue | Cumulative variance explained |
|---|---|---|
| Dimension 1 | 0.3736 | 37.36% |
| Dimension 2 | 0.2695 | 64.31% |
| Dimension 3 | 0.2088 | 85.19% |
| Dimension 4 | 0.1481 | 100.00% |
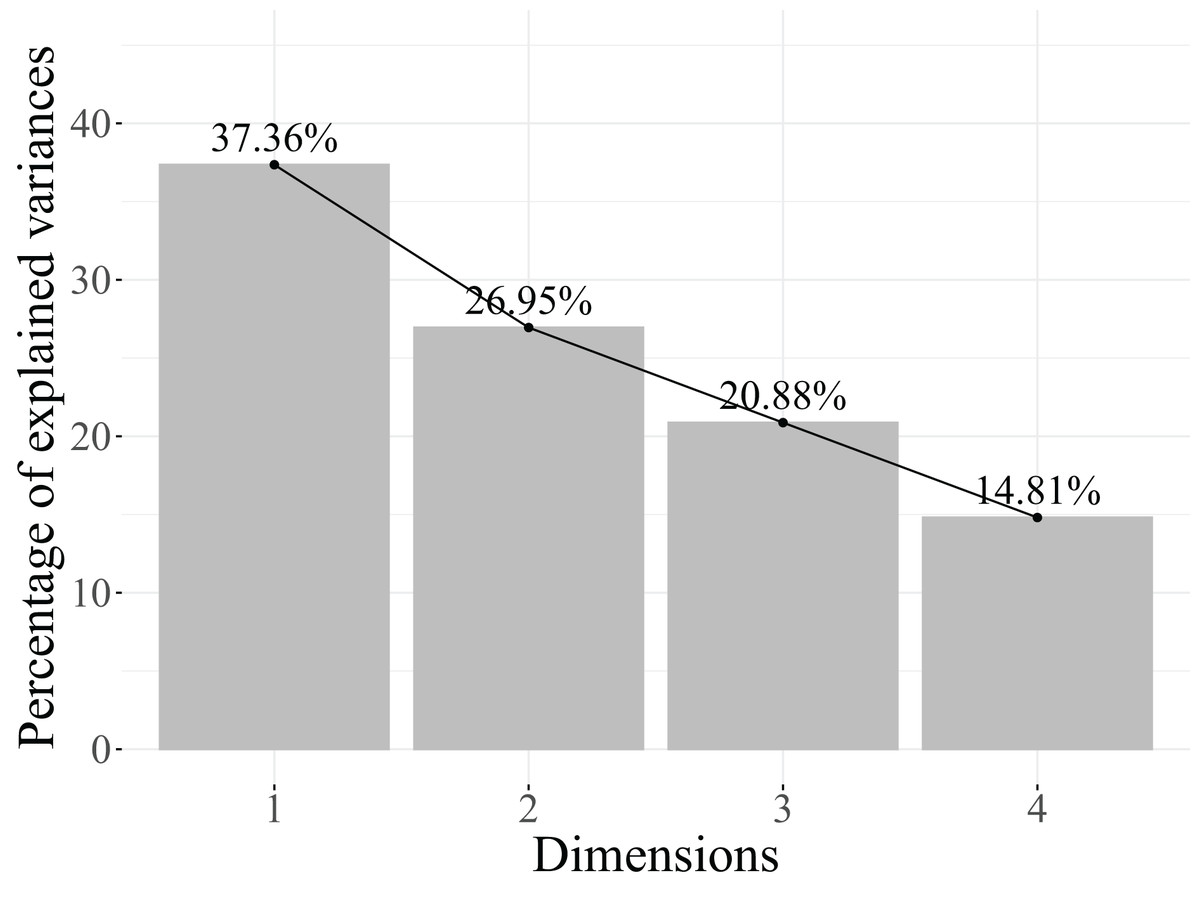
Figure 16: Plot of the percentage of variance explained in MCA, including the variables related to skills in technicians.
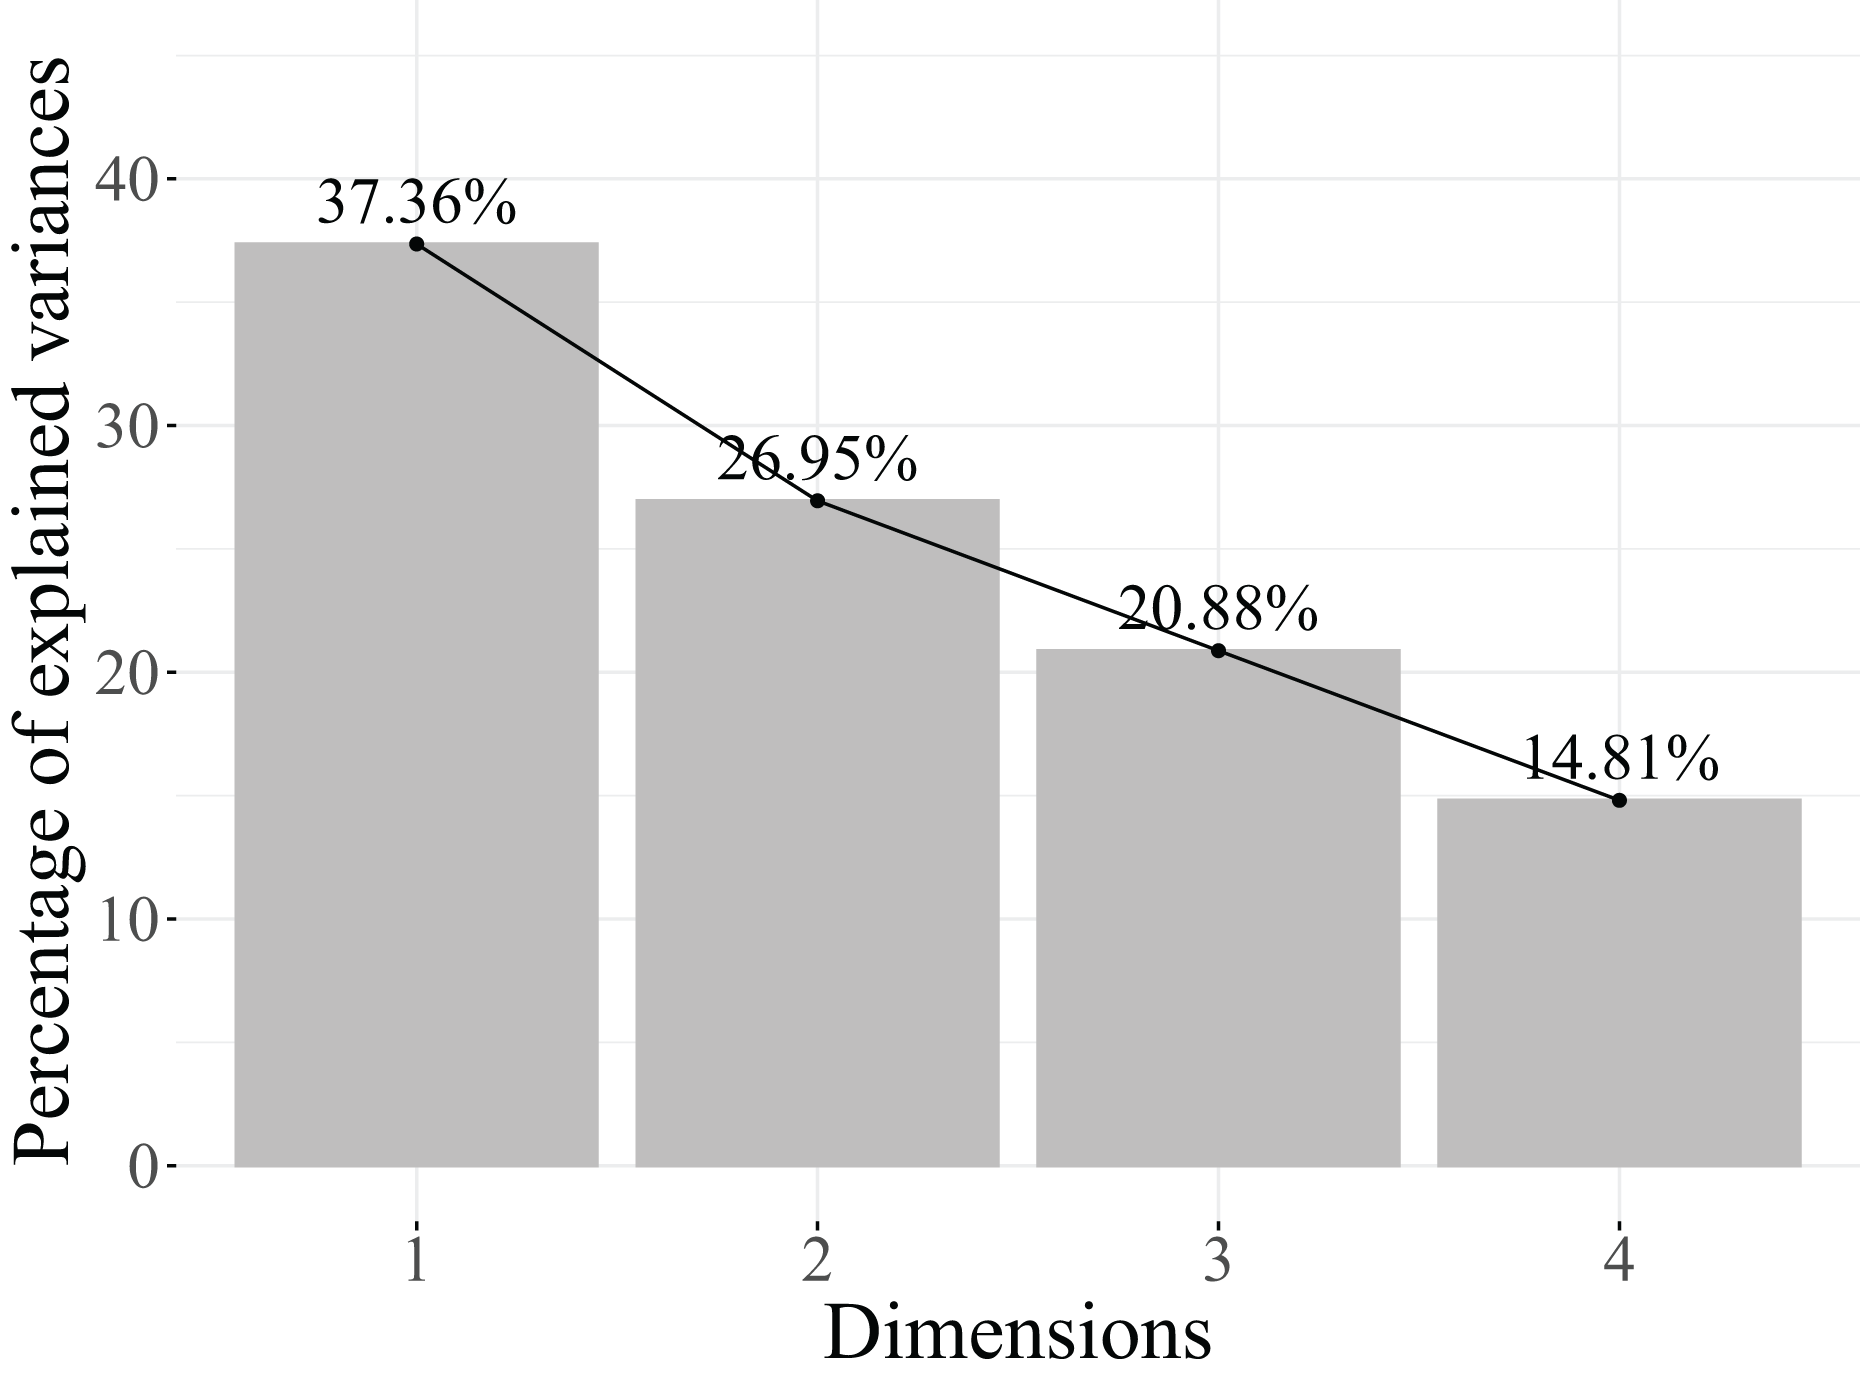
According to the results presented in Table 18, two dimensions will be considered because they explain 64.31% of the variance. Furthermore, as illustrated in the scree plot shown in Fig. 16, starting from the second dimension, the added percentage of explained variance is not significant enough to warrant its inclusion in the model.
To interpret the dimensions retained in the MCA, it is first necessary to determine which variables exert the greatest influence on each axis. This influence is evaluated using the coefficient, which measures the proportion of inertia of each dimension explained by each variable. Following the same criterion used in previous sections, variables with are considered to make a substantial contribution to the inertia of a dimension and are therefore essential for its interpretation.
As shown in Table 19 and Fig. 17, all variables display values above or near the 0.2 threshold in at least one of the two retained dimensions. Dimension 1, which explains 37.4% of the total inertia, is primarily structured by the variables SS ( ) and GS ( ), both of which exert a strong influence on this axis. The variable B/M ( ) has a moderate effect, while ET ( ) shows little association with Dimension 1.
| Variable | Dim. 1 | Dim. 2 |
|---|---|---|
| ET | 0.0490 | 0.6681 |
| B/M | 0.1814 | 0.3779 |
| SS | 0.6283 | 0.0043 |
| GS | 0.6357 | 0.0278 |
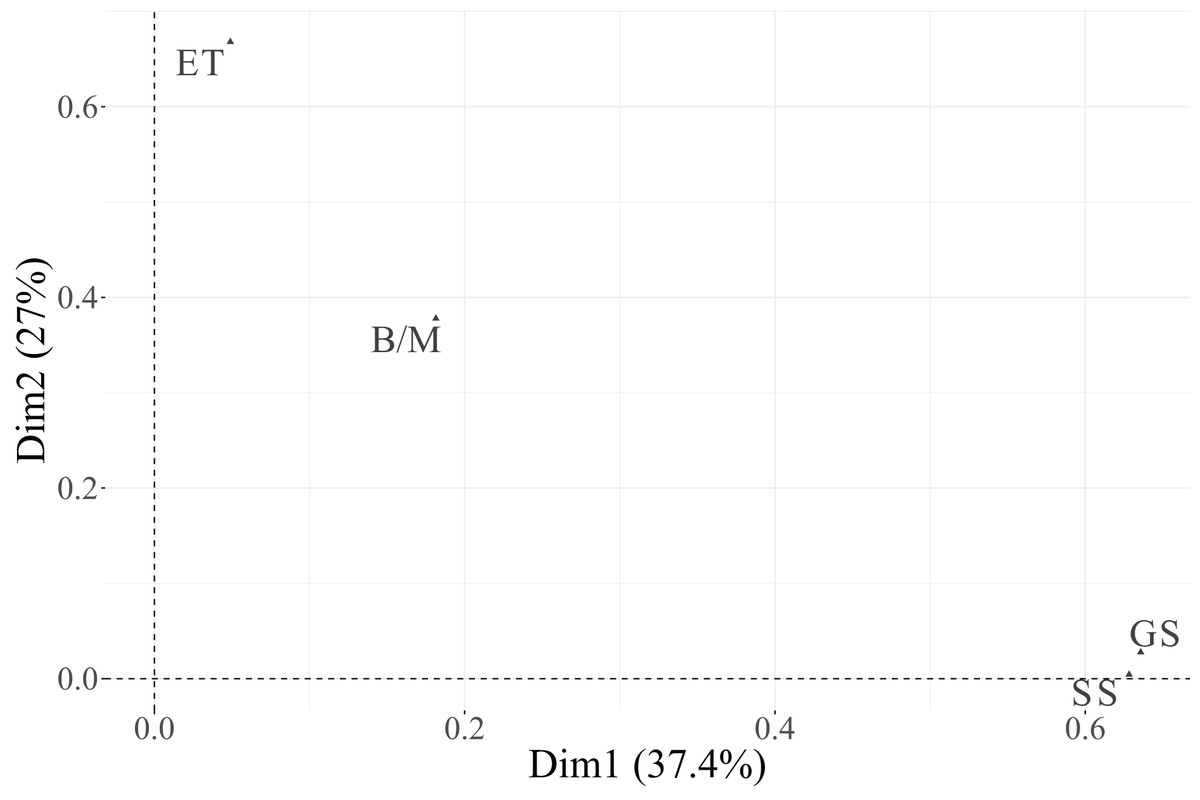
Figure 17: Correlation plot between variables related to skills in technicians and the first two dimensions.
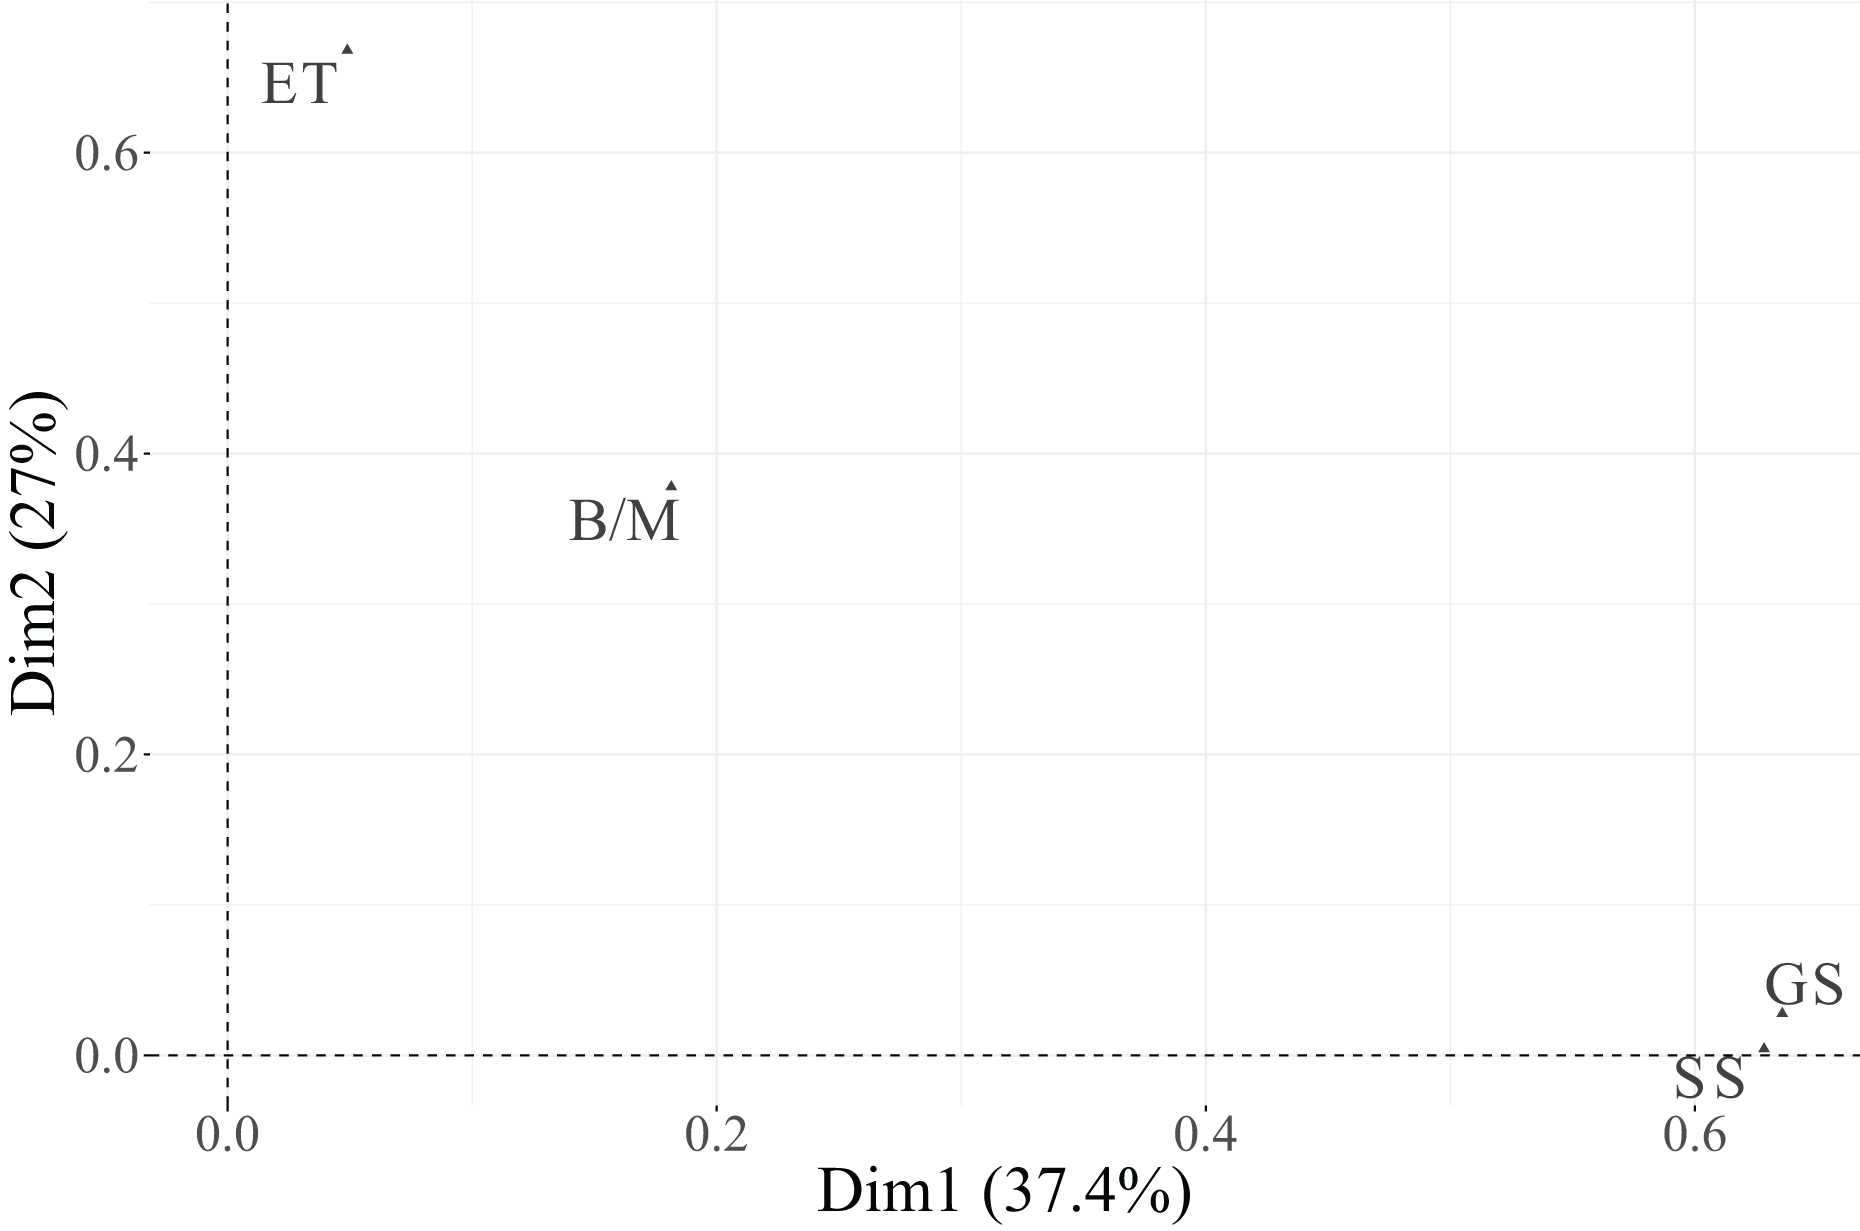
In contrast, Dimension 2, which explains 27.0% of the total inertia, is mainly defined by the variable ET ( ), followed by B/M ( ). The remaining variables, SS and GS, have minimal or no effect on this dimension. These results suggest that Dimension 1 represents a general skills evaluation axis dominated by soft and general skills, while Dimension 2 captures variability associated with technical and management skills.
Once the most influential variables are identified, it is necessary to evaluate the quality of the representation of their categories in the factorial space. This is measured using the squared cosine ( ), which quantifies the proportion of inertia of each category explained by the retained dimensions. As previously stated, categories with are considered well projected and thus retained for interpretation.
From Table 20 and Fig. 18, it can be observed that several categories reach high values in at least one dimension. In Dimension 1, the categories of SS ( ) and GS ( ) are particularly well represented, confirming their strong influence on this axis. In Dimension 2, the two categories of ET ( ) and those of B/M ( ) show moderate to high representation, while the categories of SS and GS display very low values.
| Category | Dim. 1 | Dim. 2 |
|---|---|---|
| ET (Essential) | 0.0490 | 0.6681 |
| ET (Relevant + Useful) | 0.0490 | 0.6681 |
| B/M (Essential) | 0.1814 | 0.3779 |
| B/M (Relevant + Useful) | 0.1814 | 0.3779 |
| SS (Essential) | 0.6283 | 0.0043 |
| SS (Relevant + Useful) | 0.6283 | 0.0043 |
| GS (Essential) | 0.6357 | 0.0278 |
| GS (Relevant + Useful) | 0.6357 | 0.0278 |
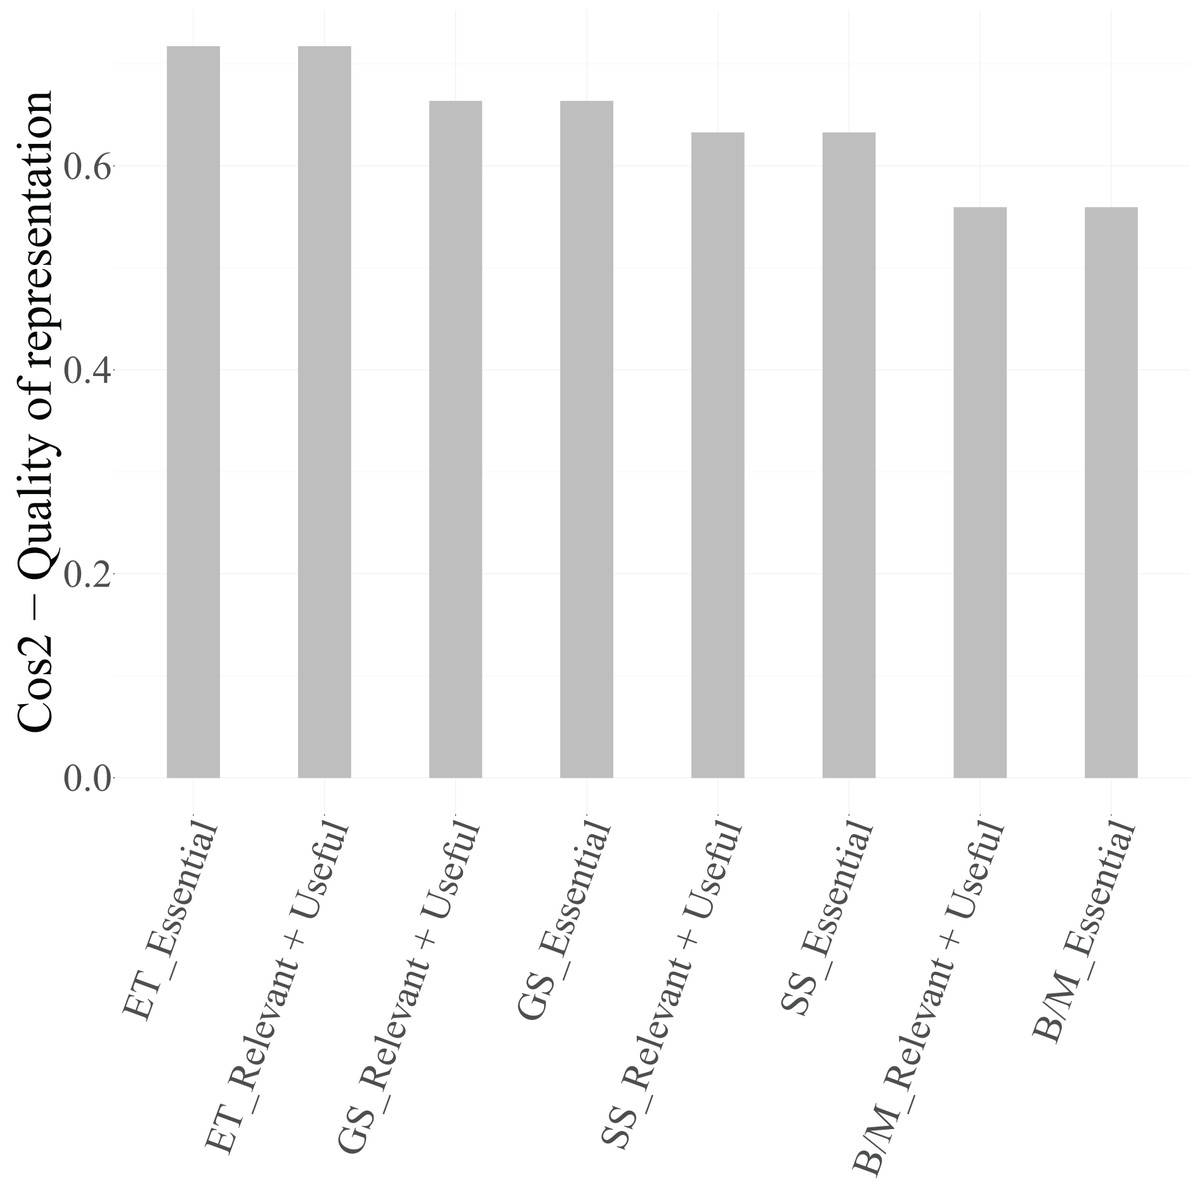
Figure 18: Quality of the representation of the categories of the variables related to skills in technicians in the first two dimensions.
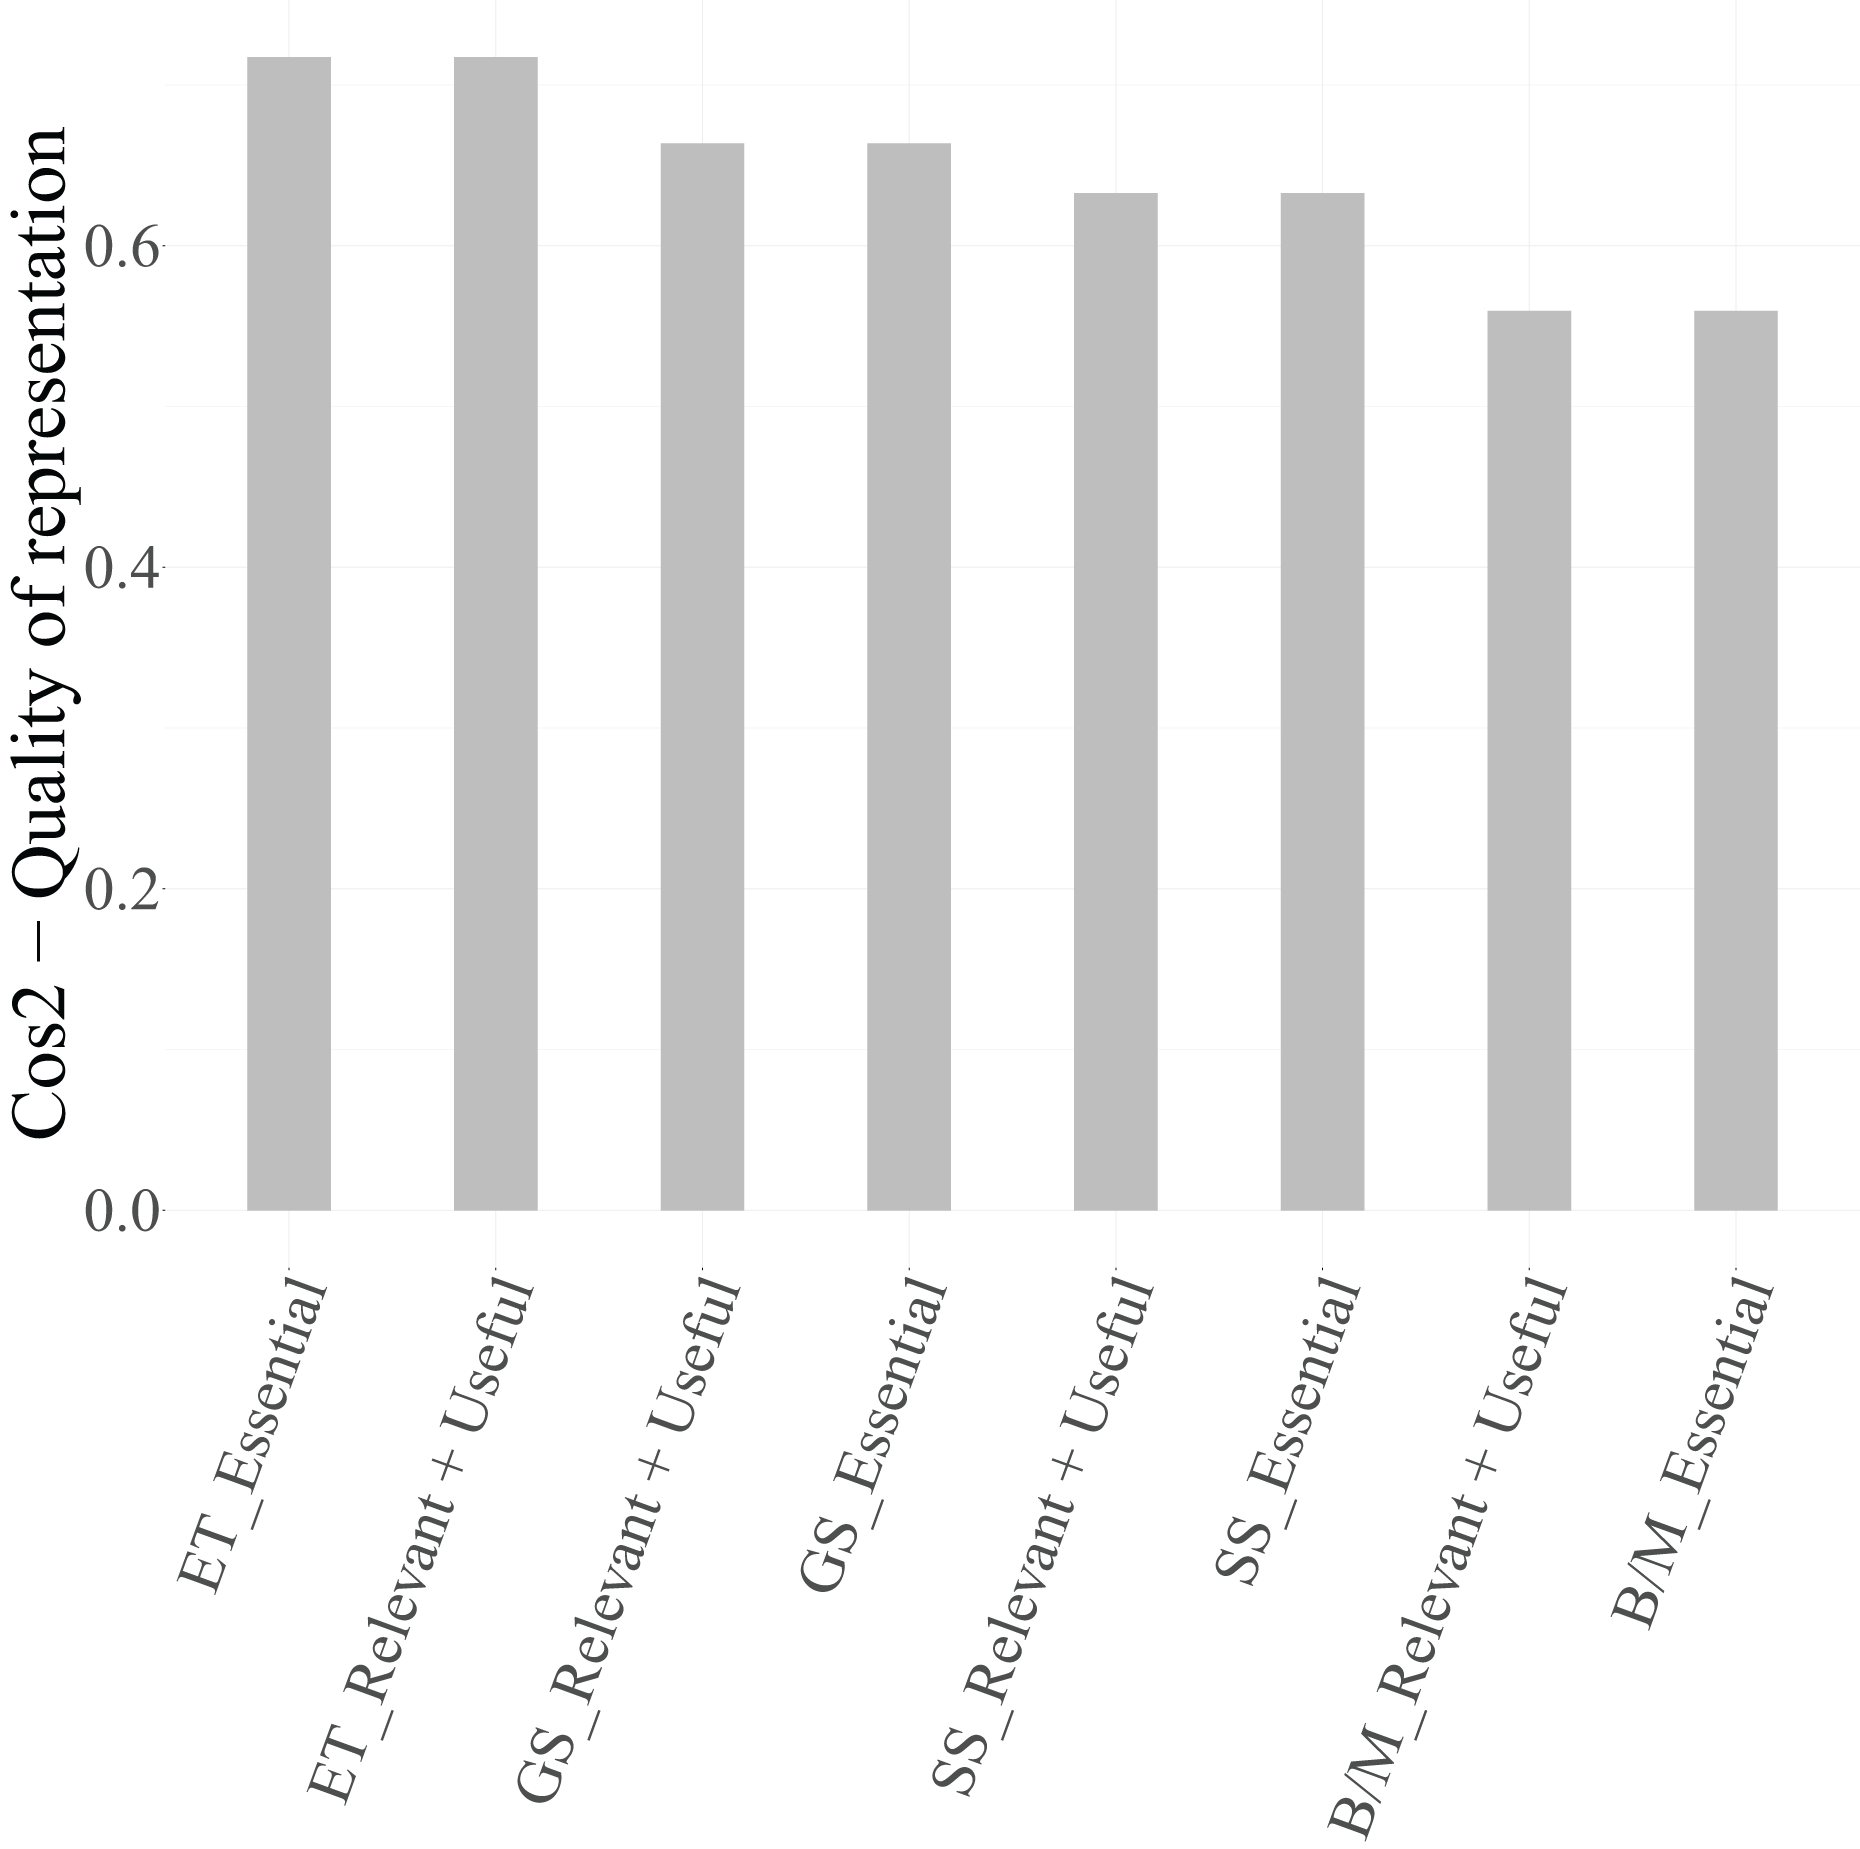
As a result, the categories of the variable B/M were excluded from the biplot of Dimensions 1 and 2 (Fig. 19), since their values do not meet the 0.4 criterion. This ensures that the graphical representation focuses only on categories with satisfactory projection quality, improving interpretability.
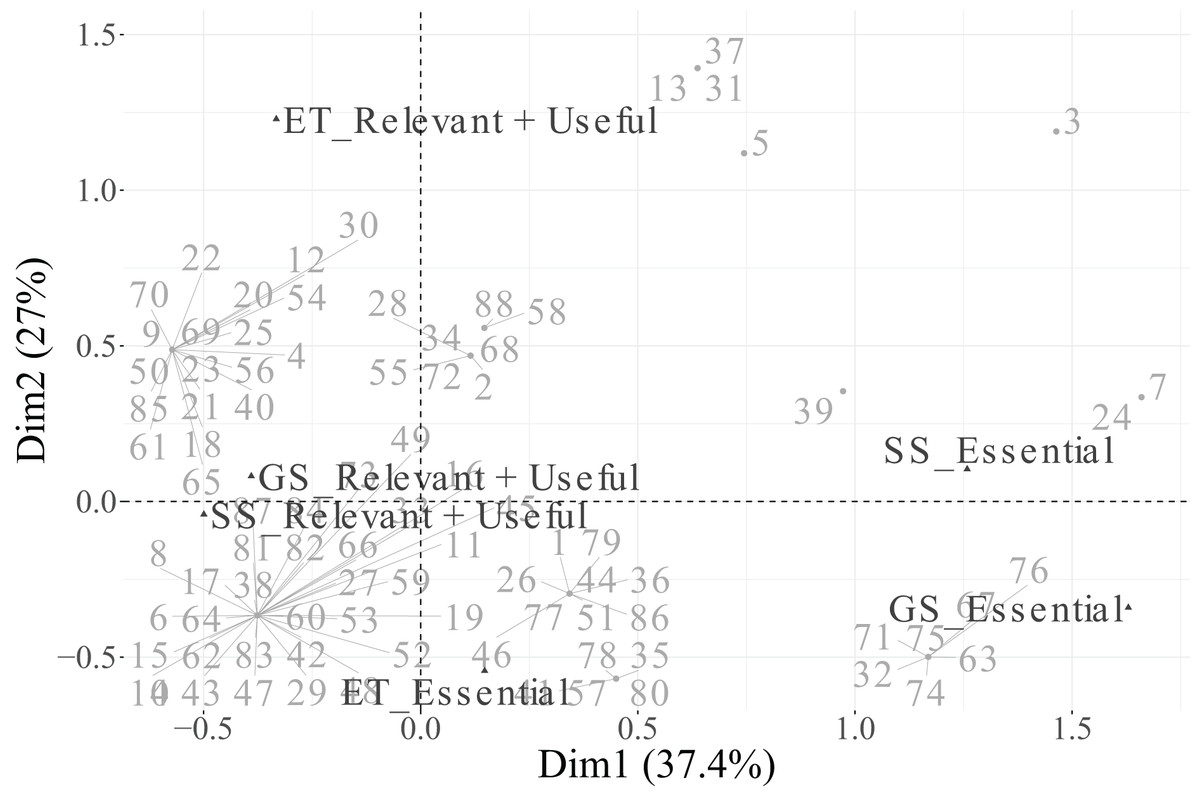
Figure 19: First two dimensions biplot obtained from MCA, including individuals and the variables related to skills in technicians.
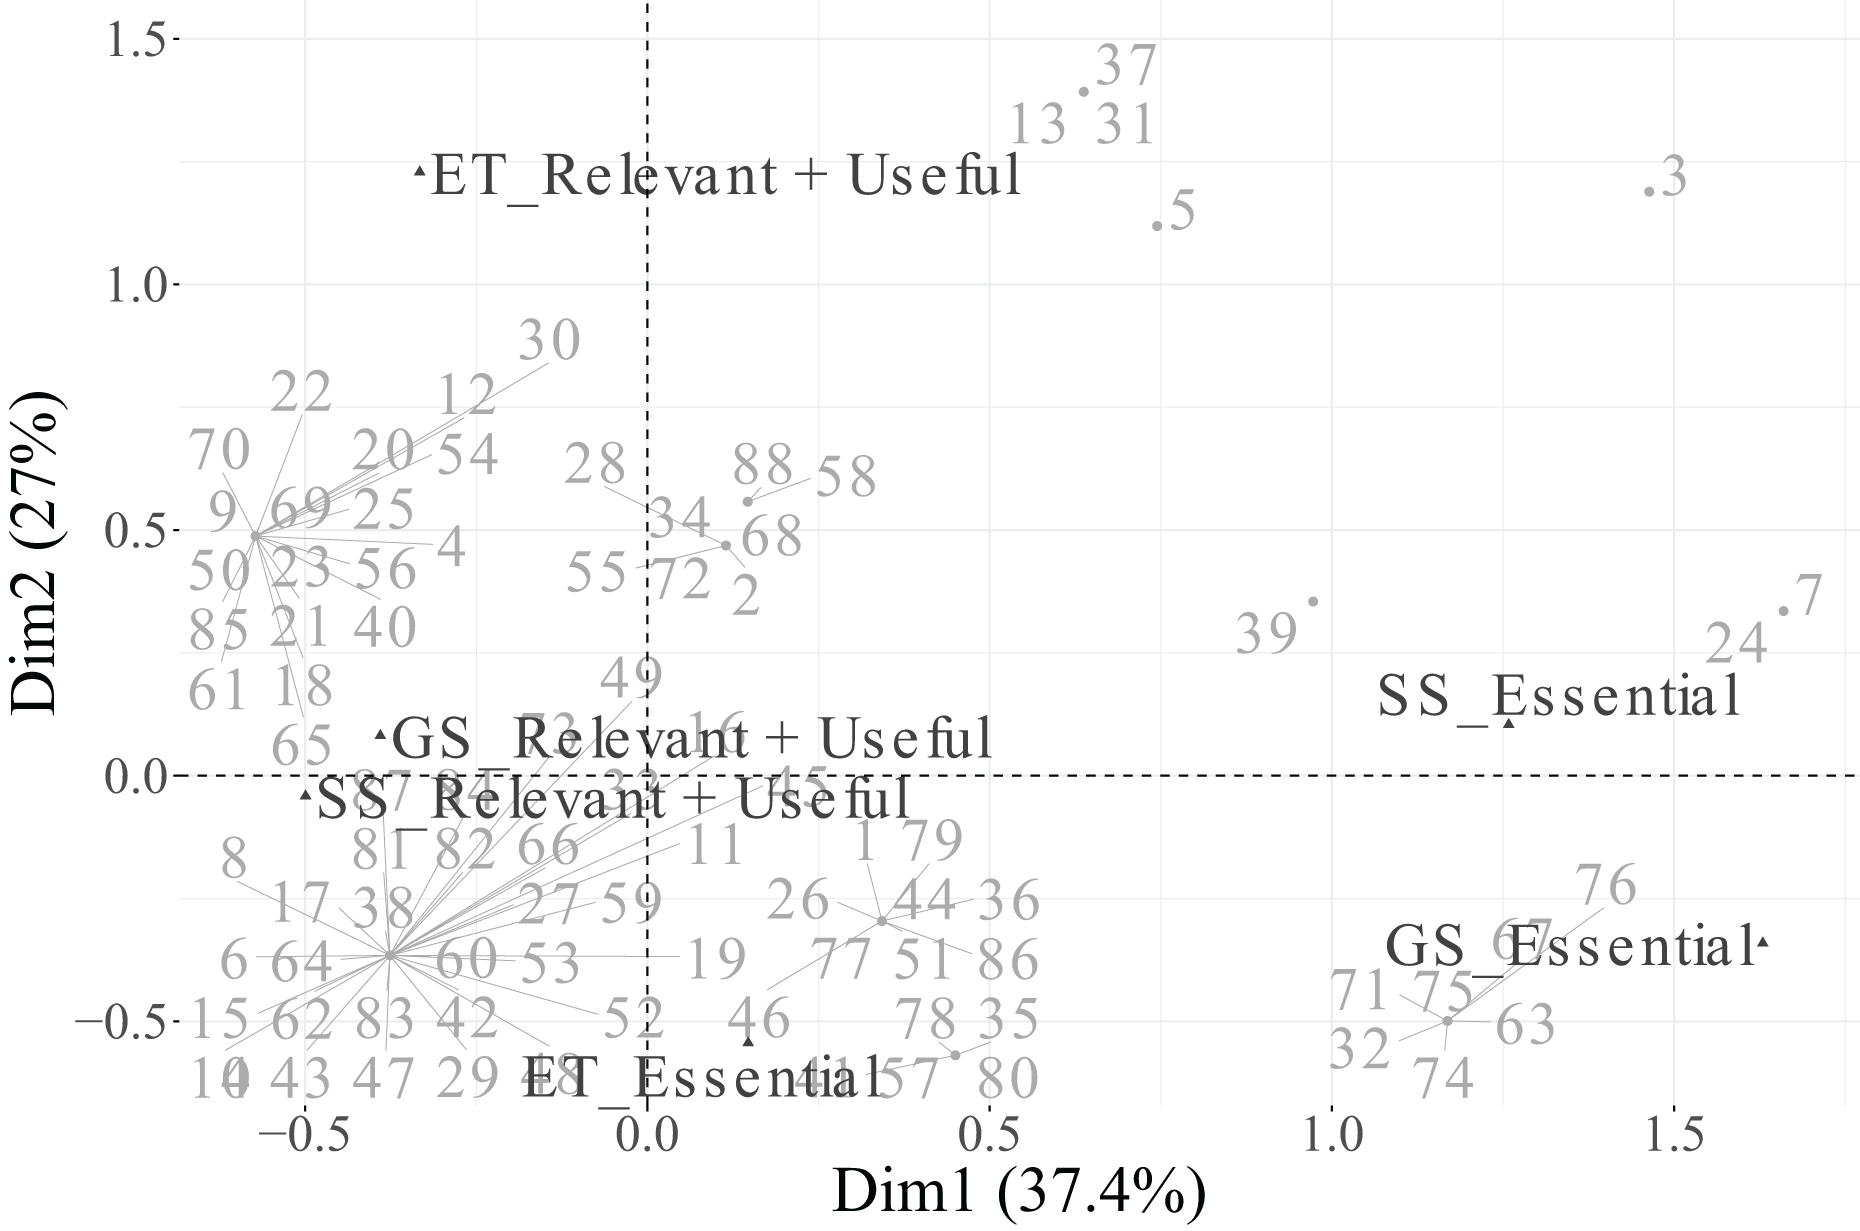
Based on these criteria ( for variables and for categories), the biplot presented in Fig. 19 includes only those categories that meet both thresholds, providing a clear and reliable visual representation centred on the most informative categories.
The percentage contribution of each category to each retained dimension is shown in Table 21. For Dimension 1, the Essential categories of SS (30.10%) and GS (34.32%) are the main contributors, followed by their Relevant + Useful counterparts, which also make notable contributions. This pattern indicates that Dimension 1 reflects a contrast between essential and supportive soft and general skills.
| Category | Dim. 1 | Dim. 2 |
|---|---|---|
| ET (Essential) | 1.00% | 19.01% |
| ET (Relevant + Useful) | 2.27% | 42.96% |
| B/M (Essential) | 10.35% | 29.88% |
| B/M (Relevant + Useful) | 1.79% | 5.18% |
| SS (Essential) | 30.10% | 0.28% |
| SS (Relevant + Useful) | 11.95% | 0.11% |
| GS (Essential) | 34.32% | 2.08% |
| GS (Relevant + Useful) | 8.22% | 0.50% |
In Dimension 2, the strongest contributions correspond to ET (Essential) (19.01%) and ET (Relevant + Useful) (42.96%), followed by B/M (Essential) (29.88%), confirming that this dimension is mainly associated with technical and management skills. The remaining categories contribute marginally to this axis.
In the biplot (Fig. 19), Dimension 1 differentiates between categories positioned on the positive side—corresponding to Essential perceptions of SS and GS (and those located on the negative side) associated with Relevant + Useful categories. This indicates a contrast between highly valued core skills and those considered complementary. Dimension 2, in turn, separates the categories of ET and B/M according to their perceived relevance: Essential categories are projected on the positive side, while Relevant + Useful appear on the negative side. This reflects differing assessments of technical vs. management-oriented skills.
Regarding individuals, although they are dispersed across all quadrants, clusters can be observed around the category points. Specifically, a concentration appears near the Relevant + Useful categories of GS, SS, and B/M, and near the Essential category of ET, suggesting shared evaluation patterns among these groups.
In summary, Dimension 1 represents the axis of soft and general skills, contrasting essential vs. supportive perceptions, while Dimension 2 captures the valuation of technical and management skills. The categories of the variable B/M were excluded from the biplot due to their insufficient projection quality ( ), ensuring analytical consistency and visual clarity. This methodological refinement strengthens the interpretability of the MCA results.
Finally, a bootstrap resampling procedure ( ) was applied to evaluate the robustness of the factorial configuration obtained for the skill categories of technicians. This approach estimated the variability of category coordinates across replicated samples. The Mean Standard Deviation (Mean SD) computed over the first two factorial dimensions served as an indicator of coordinate stability, with lower values denoting higher positional consistency. The results are presented in Table 22.
| Category | SD Dim1 | SD Dim2 | Mean SD |
|---|---|---|---|
| GS (Relevant + Useful) | 0.085 | 0.134 | 0.109 |
| SS (Relevant + Useful) | 0.085 | 0.158 | 0.121 |
| B/M (Relevant + Useful) | 0.117 | 0.148 | 0.132 |
| ET (Essential) | 0.215 | 0.329 | 0.272 |
| B/M (Essential) | 0.656 | 0.970 | 0.813 |
The bootstrap results indicate that most skill categories display satisfactory coordinate stability. In particular, the group labelled ‘Relevant + Useful” shows low Mean SD values (below 0.15), confirming that their positions within the factorial space remain consistent across resampling. Slightly higher variability is observed among the “Essential” categories—especially for “B/M (Essential)”—although these deviations are confined to specific cases and do not compromise the overall factorial configuration. Overall, the findings suggest that the factorial solution obtained from the technician skill data is robust, with a stable underlying structure supported by the majority of categories. As in previous analyses, certain categories do not appear in the bootstrap results because the resampling procedure was performed at the individual level, and low-frequency categories may not be represented in all replicated samples.
Multiple correspondence analysis for the variables related to skills in engineers
The dependency analysis for the skill-related variables in engineers was performed using pairwise tests ( ), with Bonferroni correction applied to account for multiple comparisons. Effect sizes ( ) were computed from the values to evaluate the strength of the detected associations. The results are presented in Table 23. Adjusted p-values ( ) below 0.05 (bold entries) indicate statistically significant dependencies, whereas the classification provides an additional measure of the magnitude of each relationship.
| Variable 1 | Variable 2 | Test | p-value | Effect strength | |||
|---|---|---|---|---|---|---|---|
| SS | GS | 8.233 | 0.004 | 0.086 | 0.025 | Moderate | |
| B/M | SS | 6.761 | 0.009 | 0.071 | 0.056 | Moderate | |
| B/M | GS | 5.400 | 0.020 | 0.058 | 0.121 | Weak | |
| ET | B/M | 1.117 | 0.290 | 0.013 | 1.000 | Weak | |
| ET | SS | 0.016 | 0.899 | 0.000 | 1.000 | Weak | |
| ET | GS | 1.389 | 0.239 | 0.016 | 1.000 | Weak |
As shown in Table 23, two significant dependencies were identified among the skill-related variables for engineers. The strongest association was observed between “SS” and “GS” ( , ), suggesting that social and green skills frequently co-occur within engineer competence profiles. A moderate relationship was also detected between “B/M” and “SS” ( , ), indicating a partial overlap between business management and social skills. In contrast, pairs such as “B/M–GS” and those involving “ET” displayed weak values and non-significant adjusted p-values, implying that entrepreneurial thinking (ET) functions largely as an independent dimension. Overall, the results indicate that while social and green skills show a degree of integration, the main skill domains remain relatively distinct within the competence structure of engineers.
Next, the eigenvalues explained variance, and the cumulative percentage of explained variance are analysed to determine the number of dimensions to consider. The results are shown in Table 24 and Fig. 20.
| Dimensions | Eigenvalue | Cumulative variance explained |
|---|---|---|
| Dimension 1 | 0.3888 | 38.88% |
| Dimension 2 | 0.2712 | 66.00% |
| Dimension 3 | 0.1744 | 83.44% |
| Dimension 4 | 0.1656 | 100.00% |
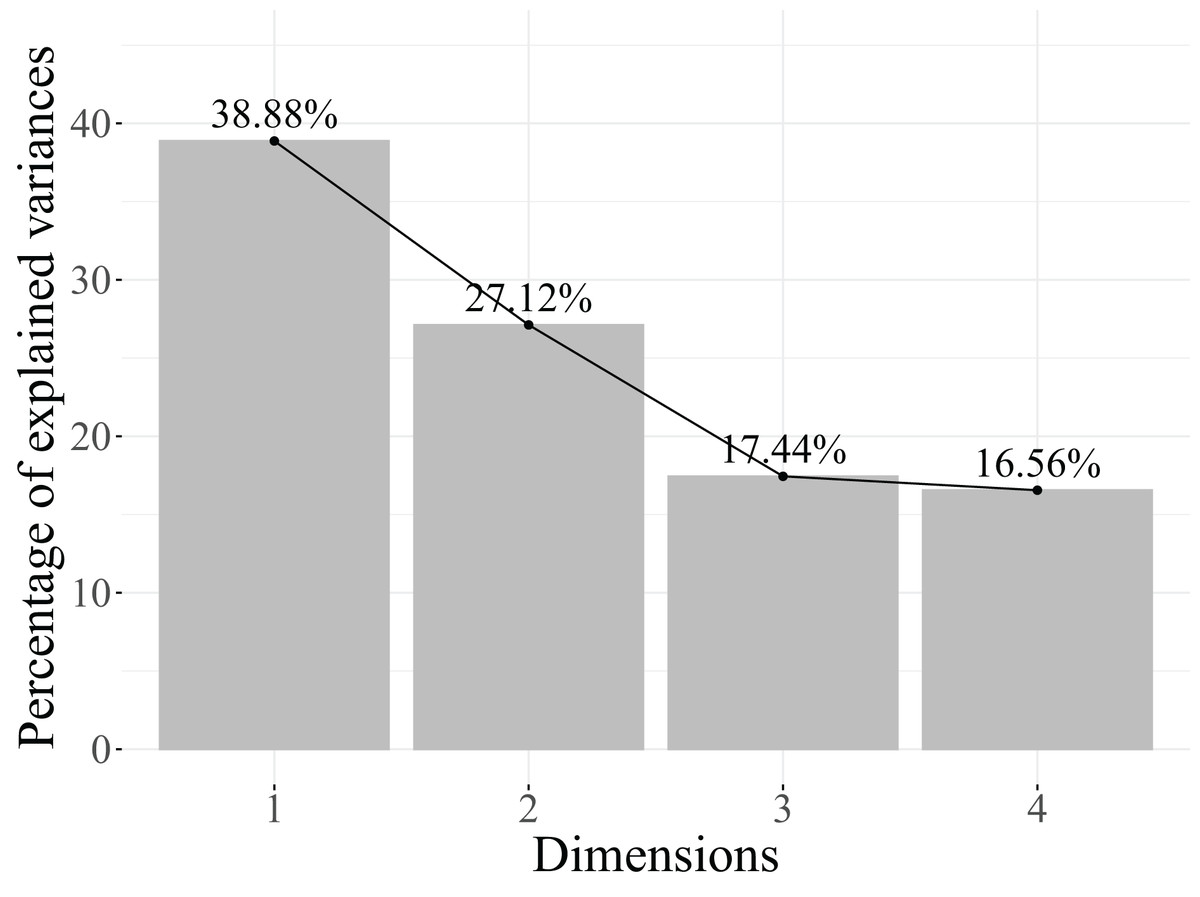
Figure 20: Plot of the percentage of variance explained in MCA, including the variables related to skills in engineers.
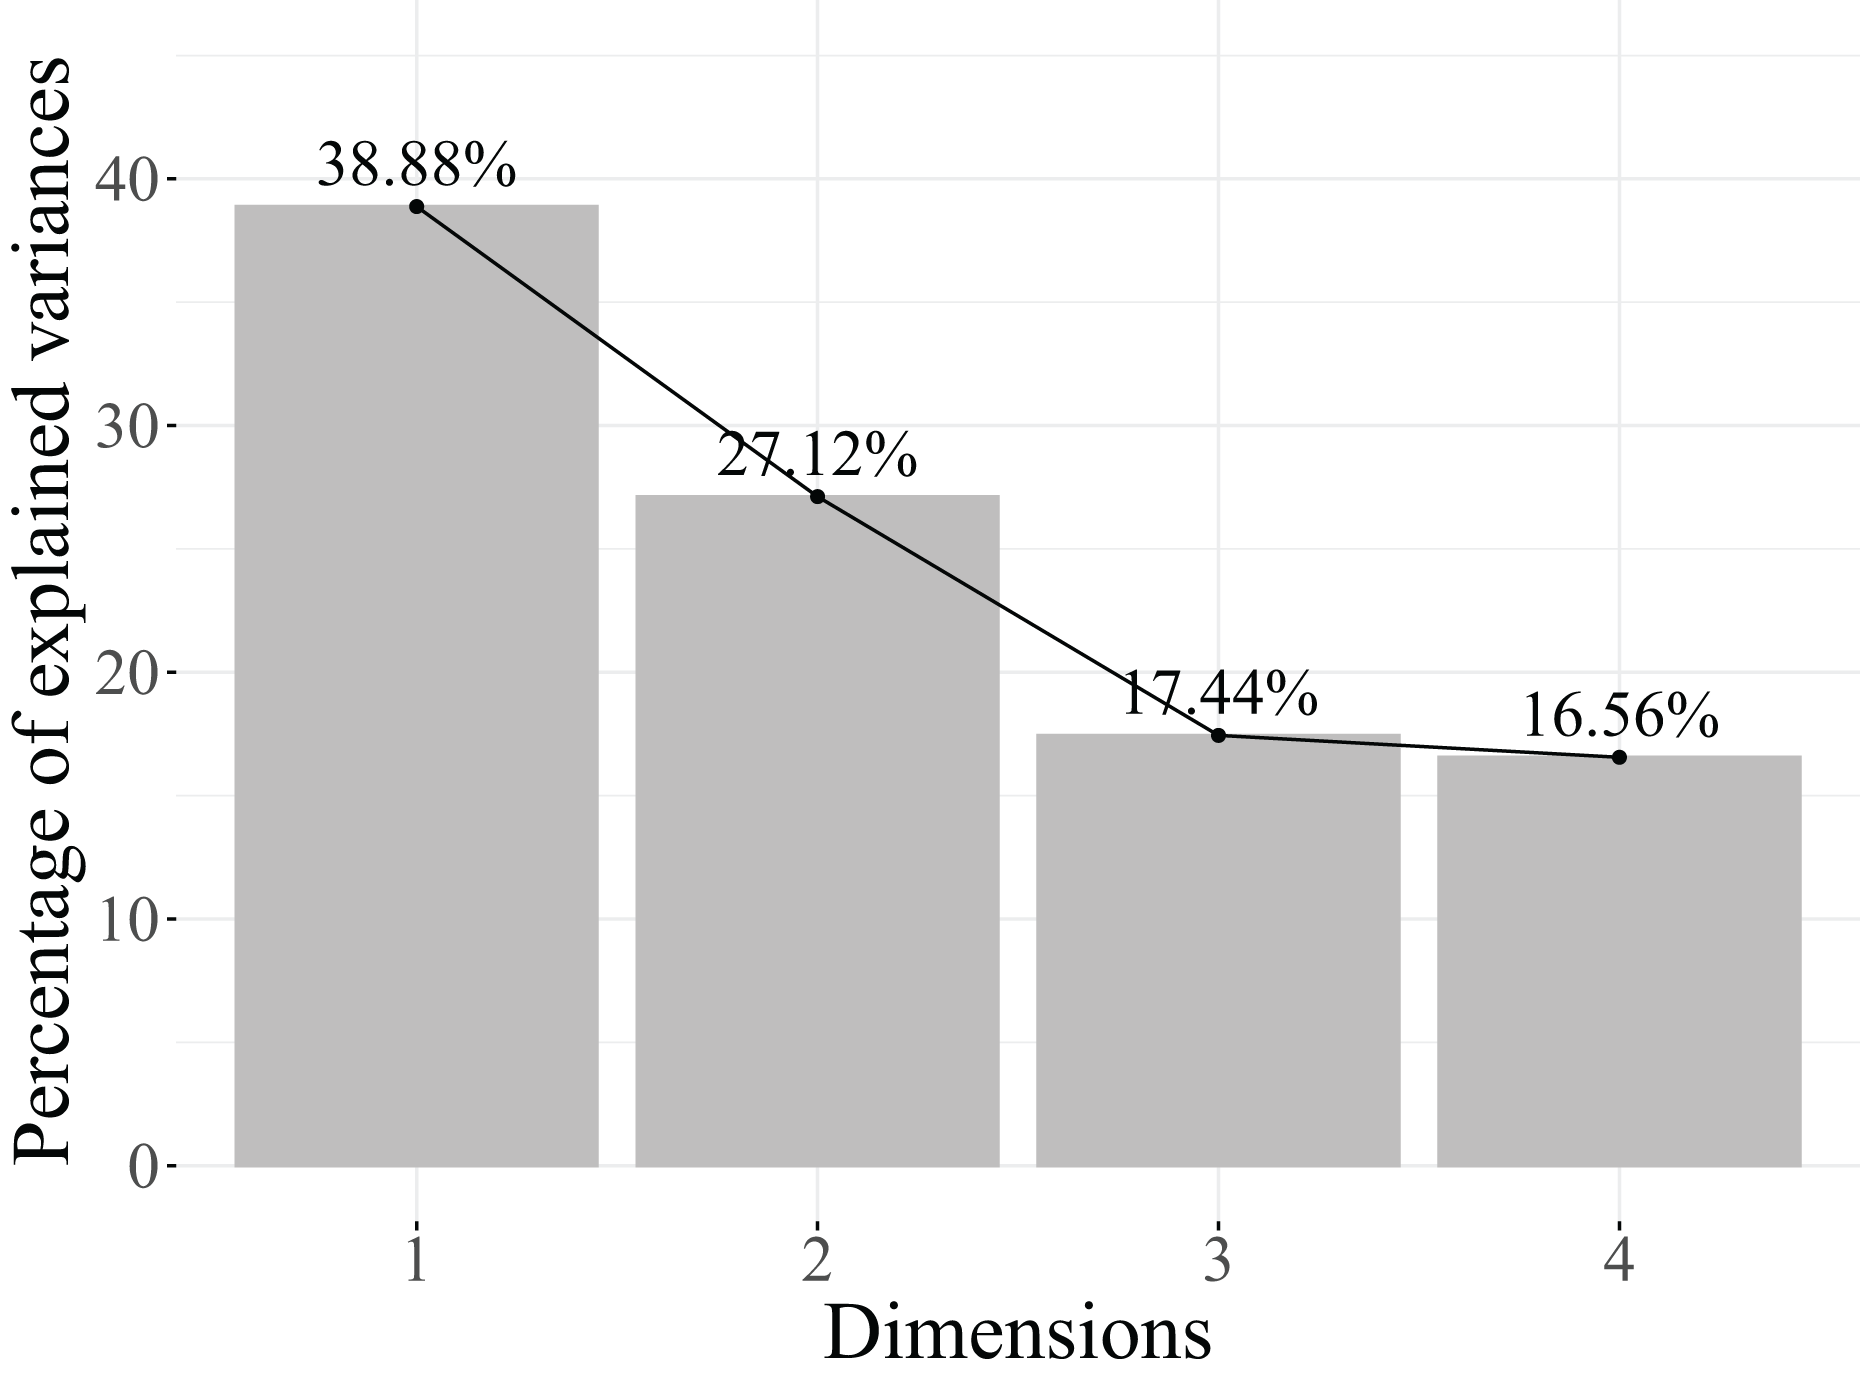
Based on the results obtained in Table 24, the number of retained dimensions is two, as it accounts for 66.00% of the explained variance. Additionally, as shown in the scree plot represented in Fig. 20, from the second dimension onwards, the contribution to the model’s explained variance is insufficient to justify including further dimensions.
To interpret the dimensions retained in the MCA, it is first necessary to determine which variables exert the greatest influence on each axis. This is assessed using the coefficient, which measures the proportion of inertia of each dimension explained by a variable. As in previous sections, variables with are considered to make a substantial contribution to the inertia of a dimension and are therefore key for its interpretation.
As shown in Table 25 and Fig. 21, all variables display non-negligible values in at least one of the two retained dimensions. Specifically, Dimension 1, which explains 38.9% of the total inertia, is mainly structured by the variables SS ( ), GS ( ), and B/M ( ), all of which make strong contributions to this axis. Conversely, the variable ET ( ) has little influence on Dimension 1.
| Variable | Dim. 1 | Dim. 2 |
|---|---|---|
| ET | 0.0019 | 0.8610 |
| B/M | 0.4719 | 0.1371 |
| SS | 0.5538 | 0.0000 |
| GS | 0.5275 | 0.0868 |
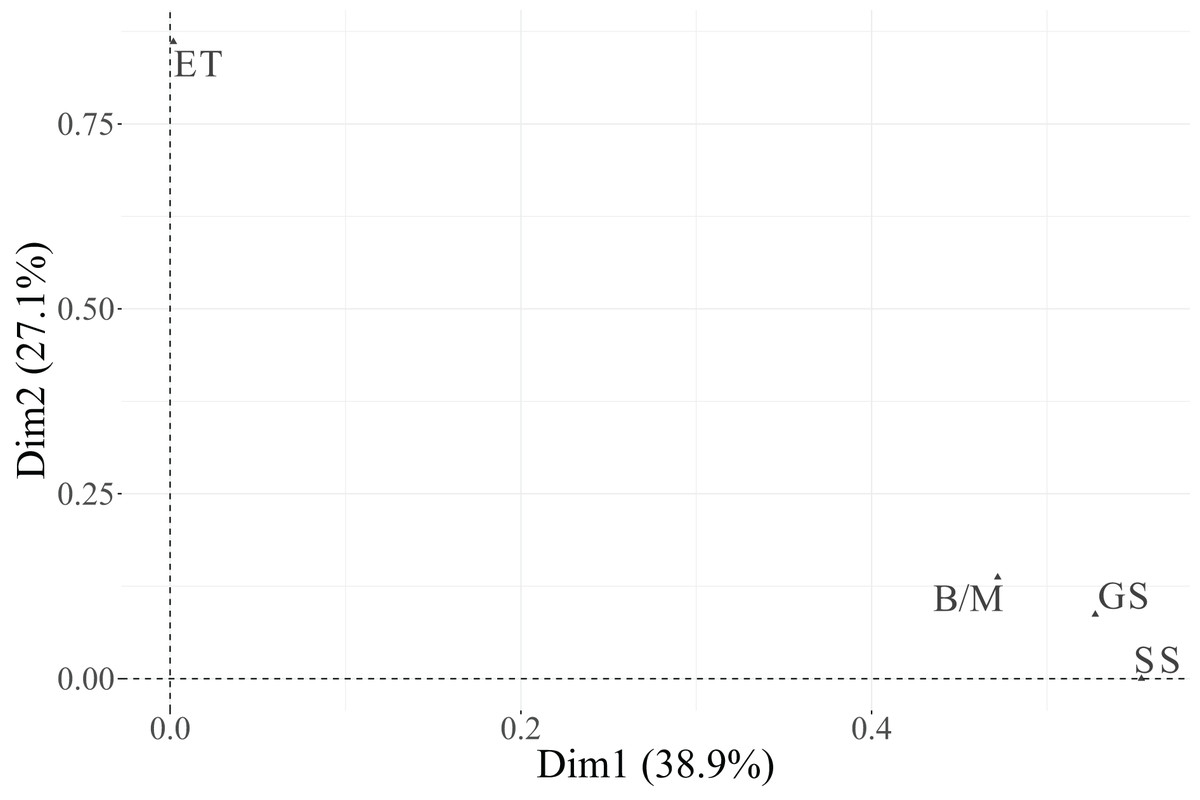
Figure 21: Correlation plot between variables related to skills in engineers and the first two dimensions.
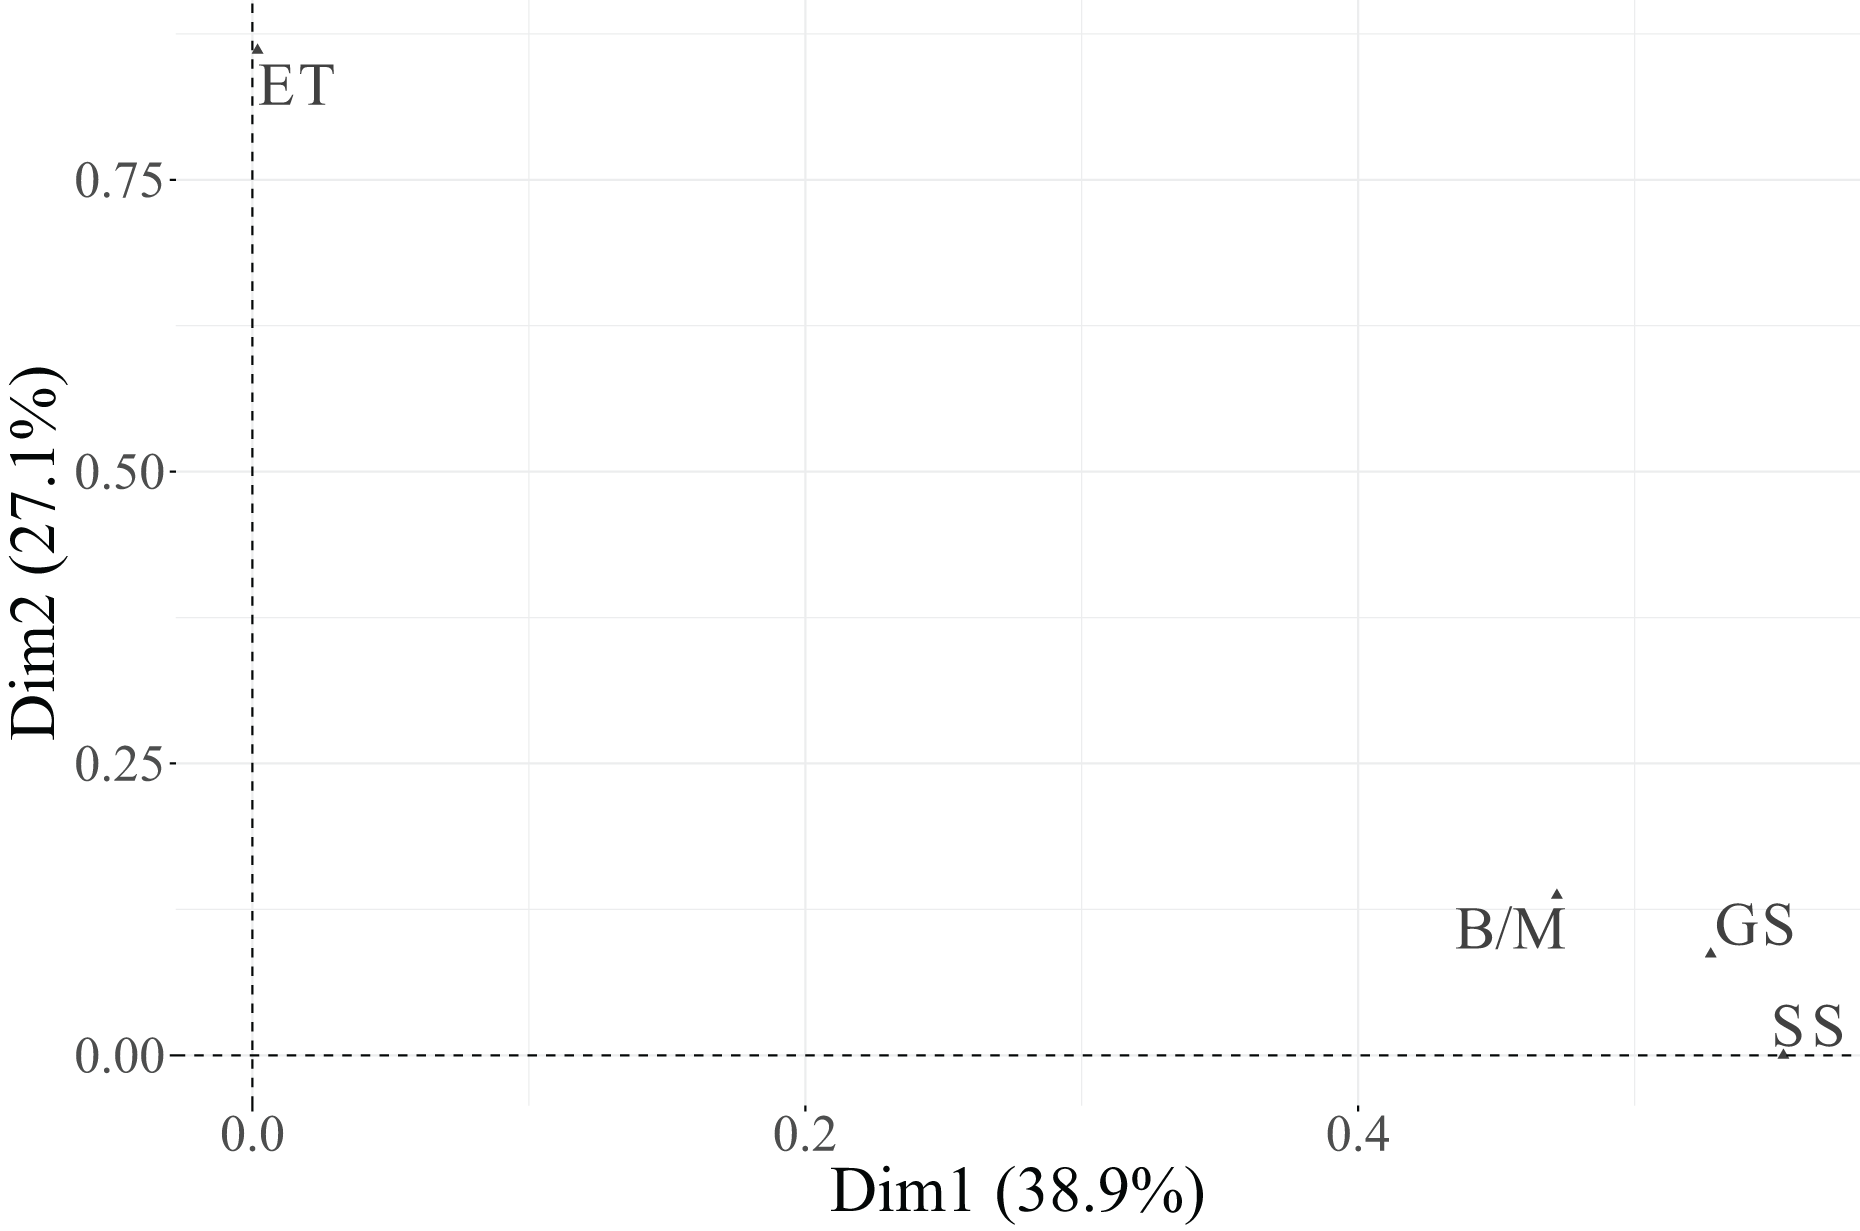
In contrast, Dimension 2, which accounts for 27.1% of the total inertia, is primarily defined by the variable ET ( ), followed by B/M ( ). The remaining variables (SS and GS) show weak associations with this dimension. These findings indicate that Dimension 1 represents an axis of general and soft skills evaluation, while Dimension 2 captures variation related to technical and management-oriented skills.
Once the most influential variables have been identified, the next step is to evaluate the quality of representation of their categories in the factorial space. This is done using the squared cosine ( ), which quantifies the proportion of inertia of each category explained by the retained dimensions. In accordance with established criteria, categories with are considered well represented and suitable for graphical interpretation.
From Table 26 and Fig. 22, it can be observed that several categories exhibit high values in at least one dimension. In Dimension 1, the categories of SS ( ), GS ( ), and B/M ( ) are particularly well represented, confirming their strong association with this axis. In Dimension 2, the two categories of ET ( ) show very high representation quality, while those of B/M ( ) fall below the threshold, indicating limited projection quality.
| Category | Dim. 1 | Dim. 2 |
|---|---|---|
| ET (Essential) | 0.0019 | 0.8610 |
| ET (Relevant + Useful) | 0.0019 | 0.8610 |
| B/M (Essential) | 0.4719 | 0.1371 |
| B/M (Relevant + Useful) | 0.4719 | 0.1371 |
| SS (Essential) | 0.5538 | 0.0000 |
| SS (Relevant + Useful) | 0.5538 | 0.0000 |
| GS (Essential) | 0.5275 | 0.0868 |
| GS (Relevant + Useful) | 0.5275 | 0.0868 |
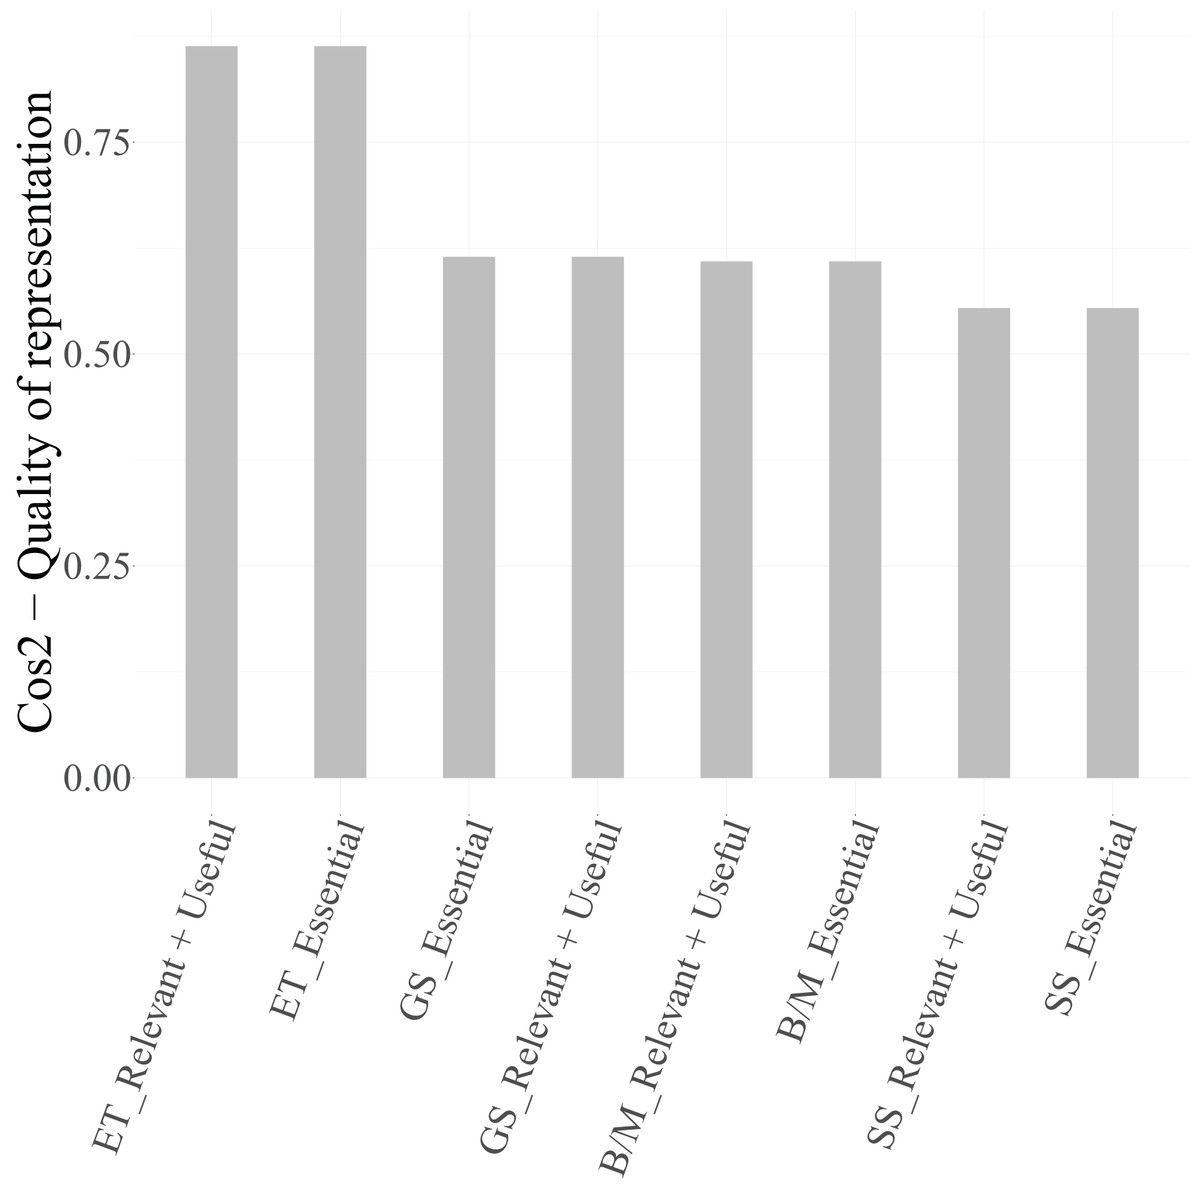
Figure 22: Quality of the representation of the categories of the variables related to skills in engineers in the first two dimensions.
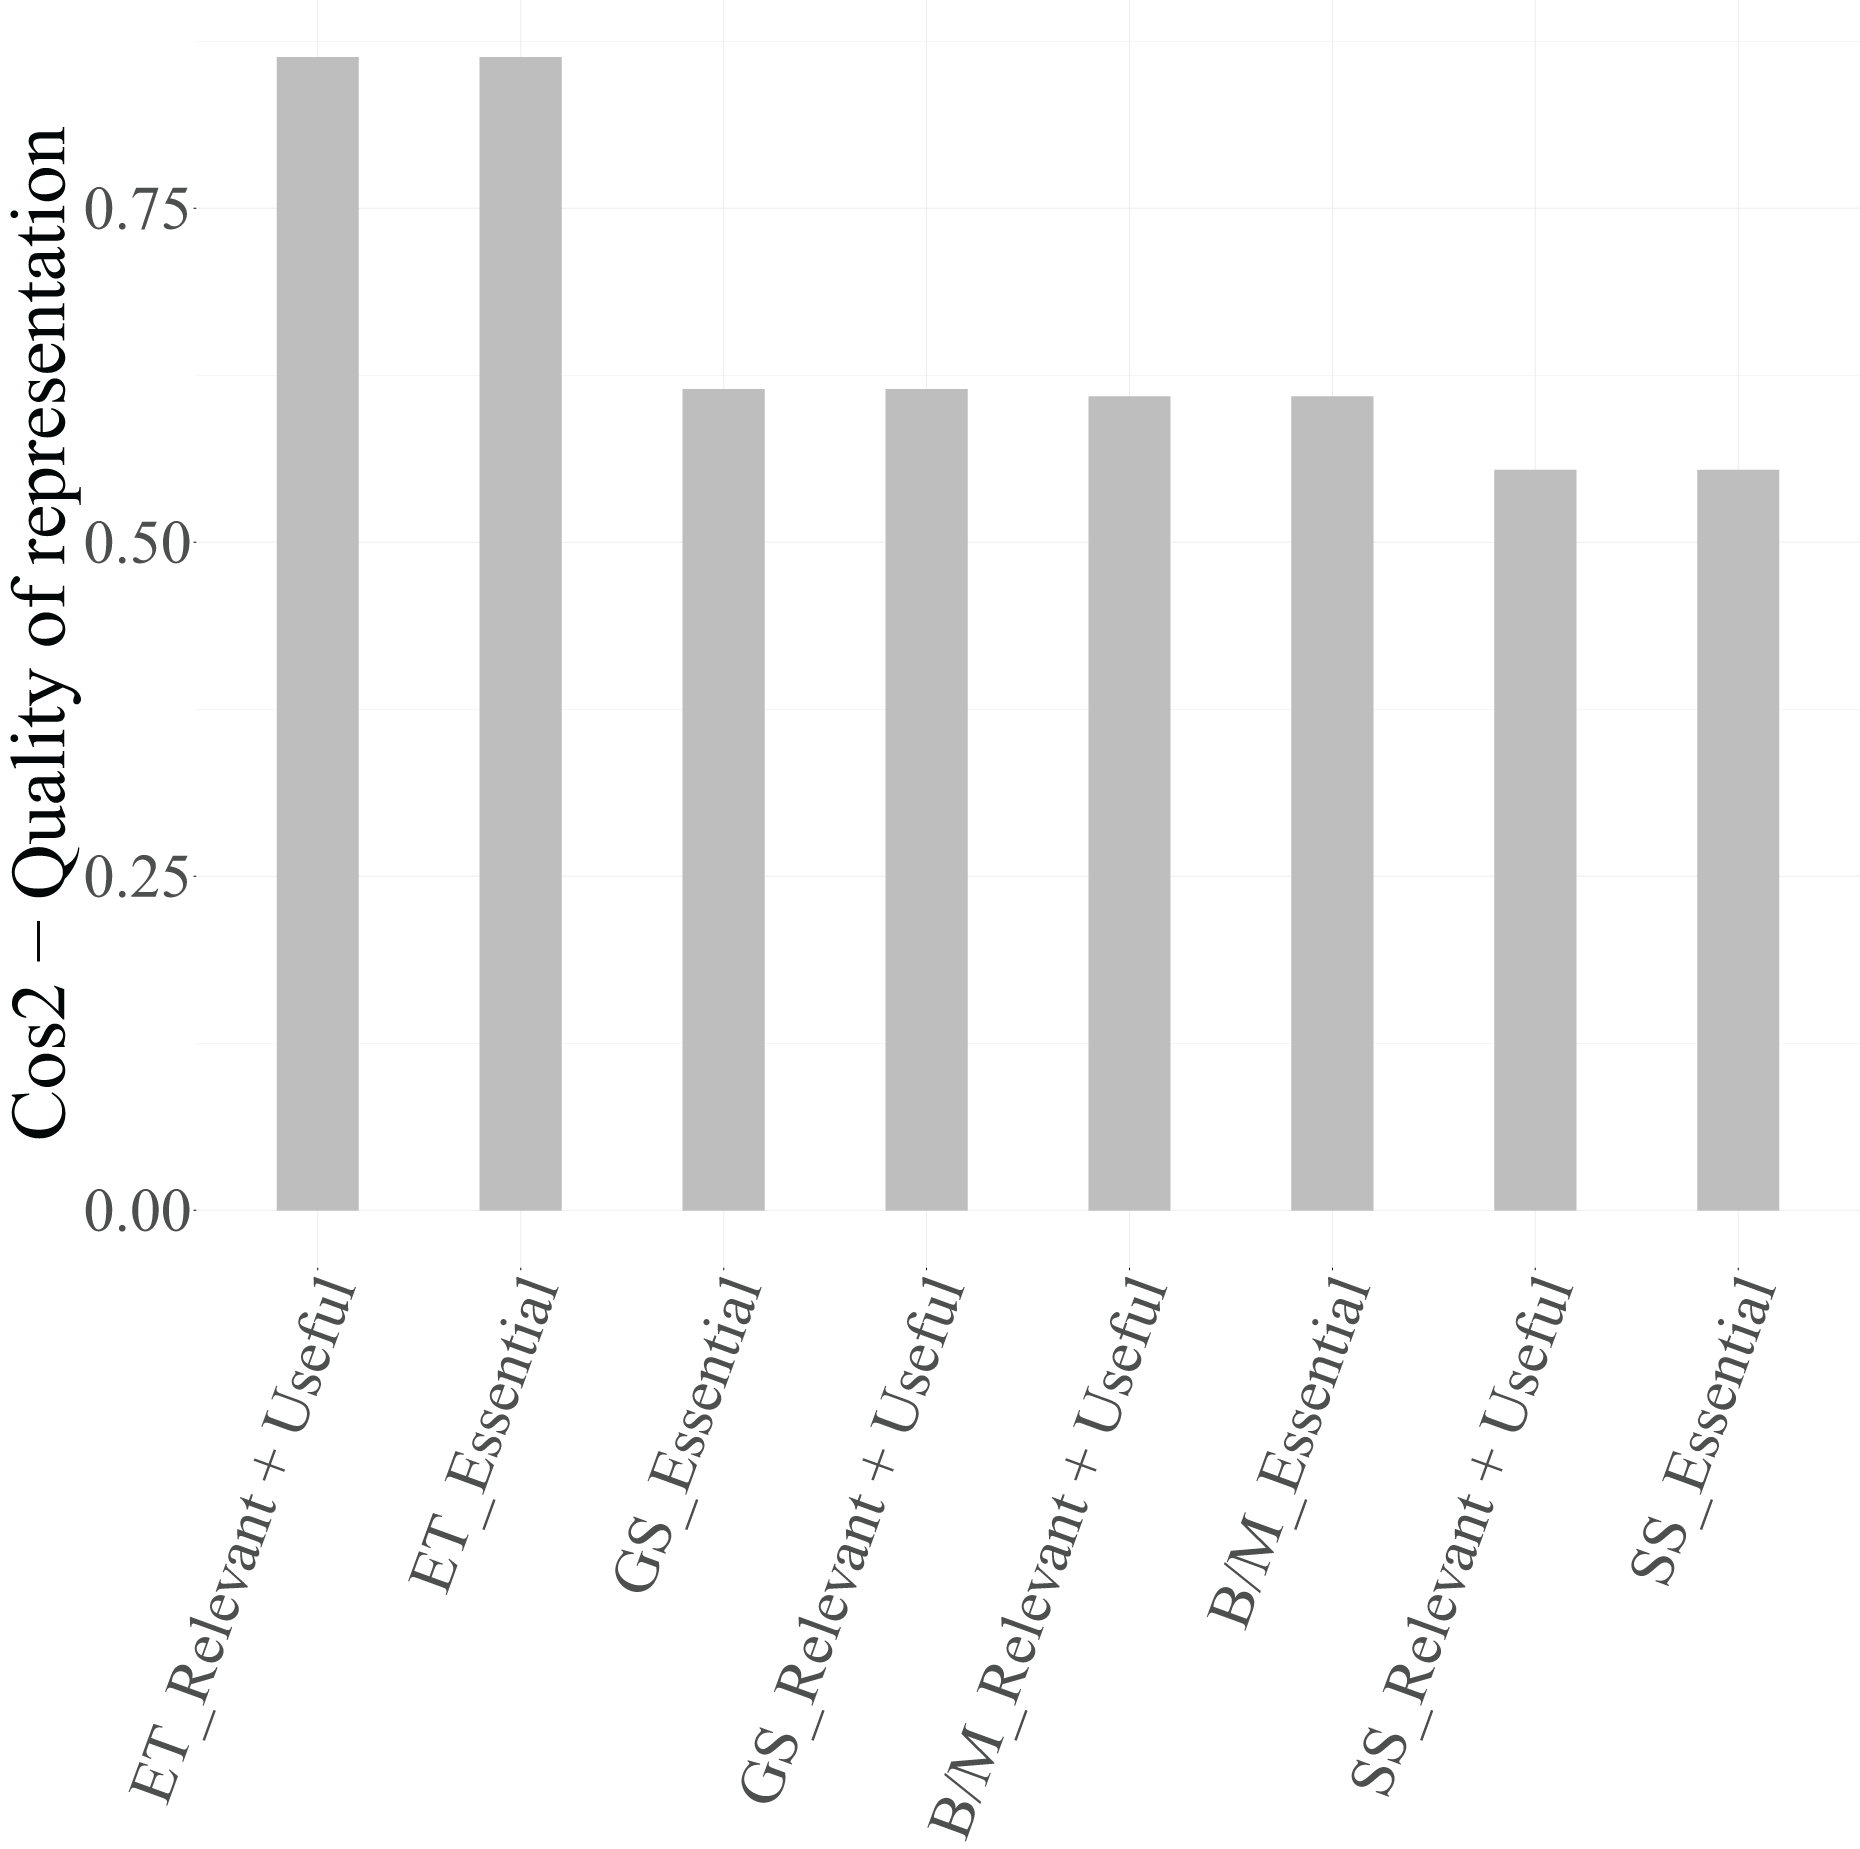
Consequently, the categories of the variable B/M were excluded from the biplot of Dimensions 1 and 2 (Fig. 23), since their values did not meet the 0.4 criterion. This ensures that the graphical display focuses on the most informative categories with satisfactory projection quality.
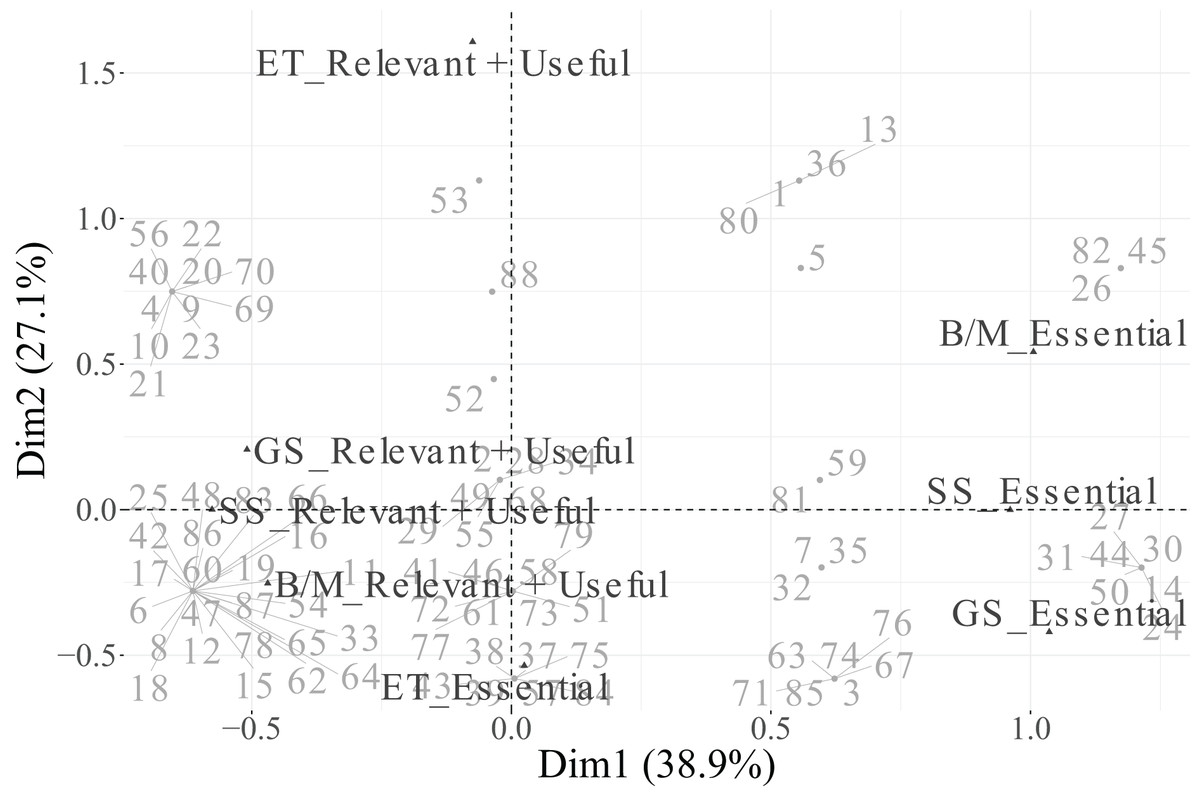
Figure 23: First two dimensions biplot obtained from MCA, including individuals and the variables related to skills in engineers.
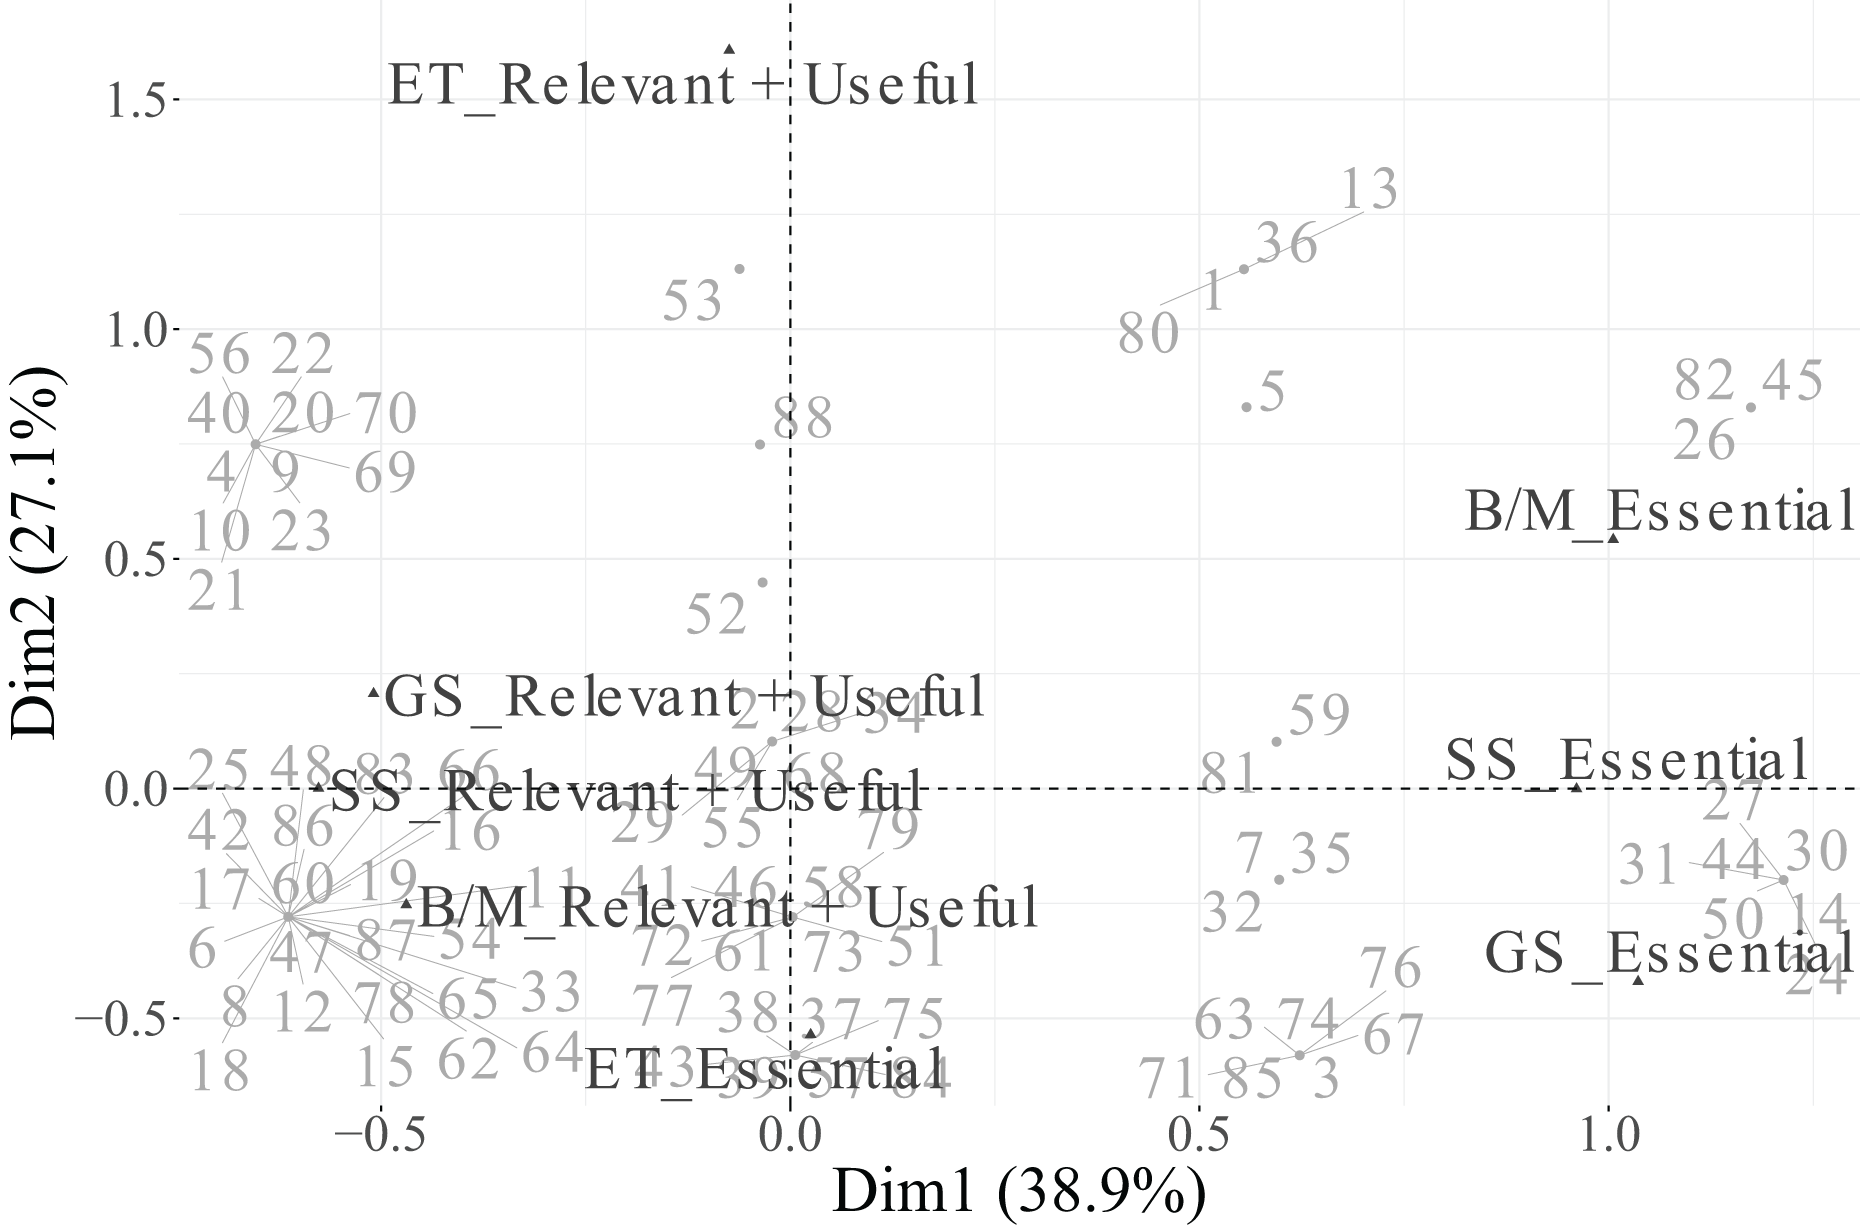
Based on these criteria ( for variables and for categories), the biplot in Fig. 23 includes only categories meeting both thresholds, providing a clear and interpretable visualisation centred on the most relevant elements.
The percentage contribution of each category to each retained dimension is shown in Table 27. In Dimension 1, the Essential categories of SS (22.26%) and GS (22.74%) stand out as the main contributors, followed by their Relevant + Useful counterparts (13.36% and 11.18%, respectively), confirming their strong role in defining this axis. Additionally, the Essential category of B/M (20.69%) also contributes notably. This pattern highlights that Dimension 1 distinguishes between core and complementary perceptions of general and soft skills.
| Category | Dim. 1 | Dim. 2 |
|---|---|---|
| ET (Essential) | 0.03% | 19.84% |
| ET (Relevant + Useful) | 0.09% | 59.52% |
| B/M (Essential) | 20.69% | 8.62% |
| B/M (Relevant + Useful) | 9.65% | 4.02% |
| SS (Essential) | 22.26% | 0.00% |
| SS (Relevant + Useful) | 13.36% | 0.00% |
| GS (Essential) | 22.74% | 5.36% |
| GS (Relevant + Useful) | 11.18% | 2.64% |
For Dimension 2, the most influential categories correspond to ET (Essential) (19.84%) and ET (Relevant + Useful) (59.52%), reaffirming that this dimension represents technical skill valuation. Other categories show minor contributions to this dimension.
In the biplot (Fig. 23), Dimension 1 differentiates between categories located on the positive side, corresponding to Essential perceptions of B/M, SS, and GS, and those positioned on the negative side, linked to Relevant + Useful categories of these same variables. This reveals a contrast between highly valued core skills and complementary ones. Meanwhile, Dimension 2 is structured by the ET variable, with its Essential category projected on the positive side and its Relevant + Useful category on the negative side, reflecting divergent evaluations of technical skills.
Regarding individuals, although they are distributed across all quadrants, notable concentrations can be observed around the points corresponding to the Relevant + Useful categories of GS, SS, and B/M, as well as near the Essential category of ET. This suggests the existence of response groups with similar evaluations of skill importance.
In summary, Dimension 1 represents an axis contrasting essential vs. complementary general and soft skills, whereas Dimension 2 captures the valuation of technical skills. The exclusion of B/M categories due to low values enhances the clarity and analytical rigour of the MCA results, ensuring that the interpretation focuses on the most representative and well-projected elements.
Finally, a bootstrap resampling procedure ( ) was conducted to evaluate the robustness of the factorial configuration obtained for the skill categories associated with engineers. This procedure assessed the consistency of category positions across resampled datasets, offering an empirical measure of the model stability. The results are presented in Table 28.
| Category | SD Dim1 | SD Dim2 | Mean SD |
|---|---|---|---|
| B/M (Relevant + Useful) | 0.117 | 0.146 | 0.131 |
| SS (Relevant + Useful) | 0.131 | 0.181 | 0.156 |
| ET (Essential) | 0.184 | 0.170 | 0.177 |
| GS (Essential) | 0.302 | 0.450 | 0.376 |
| ET (Relevant + Useful) | 0.569 | 0.474 | 0.522 |
The results indicate that most skill categories exhibit satisfactory coordinate stability, with Mean SD values predominantly within a low-to-moderate range. Categories such as “B/M (Relevant + Useful)” and “SS (Relevant + Useful)” maintain particularly stable positions across bootstrap replications, confirming their consistent placement within the factorial space. Although “ET (Relevant + Useful)” displays slightly greater dispersion, this variability remains limited and does not compromise the interpretability of the overall structure. Overall, the factorial configuration obtained for the skill categories of engineers demonstrates a high level of stability, supporting the robustness of the MCA results. As in the previous analyses, some categories do not appear in the bootstrap outcomes because resampling is performed at the individual level, and low-frequency categories may not be represented in all replicated samples.
Challenges and limitations of MCA
The use of MCA in this study also entails some challenges. First, MCA is sensitive to sparse or unbalanced categories, which may affect the stability of low-frequency responses. Second, as MCA is a descriptive method, the interpretation of dimensions may not always be straightforward, especially when multiple variables contribute similarly to the explained variance. Finally, the proportion of total inertia explained by the retained dimensions tends to be relatively low, which is common in categorical data analysis. Despite these limitations, the results obtained show internal consistency with the descriptive analysis and theoretical expectations from previous studies, supporting the validity of the findings.
Discussion
As previously stated, the main aim of this article is to understand the emerging profiles in Smart Cities by identifying the most relevant functions and skills an engineer and technician in this area should have, by developing different MCAs to analyse the differences in both profiles and establishing the relationships between different functions and skills.
The robustness of the findings was verified through a non-parametric bootstrap resampling procedure. The MCA outcomes align with descriptive statistics and correspond to theoretical expectations previously reported in the literature (e.g., Pospelova et al., 2023), reinforcing the internal coherence of the results and supporting the validity of the proposed competence structures.
Initially, a descriptive user profile analysis was carried out by studying variables such as nationality, years of experience in ICT, gender, familiarity with Smart Cities, and stakeholders. Results show that nationality, gender, experience, familiarity and stakeholders have unbalanced groups. Additionally, data shows that professionals tend to respond to the category essential for the variables civil engineering and project management functions, and enabling technologies skills, which highlights the critical role of civil engineering and project management as essential functions for the engineer profile in Smart Cities and reinforces the need for strong skills related to enabling technologies. For the technician profile, all functions were mostly answered as relevant and useful, although the variables security and IoT have more similar percentages in both categories than project management, civil engineering, cloud computing, and data analytics. In terms of skills, only the variable enabling technologies was rated mostly as essential, while all other skill categories were perceived as relevant and useful. In general, those skills not related to technology (business and management, soft and green skills) are considered more essential for engineers than for technicians.
For functions in the technician profile, the study of dependencies between the variables carried out by test and Fisher’s exact test suggests that project management and civil engineering functions are conceptually distinct from the core technological domains within the technician profile. The differences between the categories detected in the variable dependence study were further analysed by MCA to confirm if these categories have a tendency to be grouped in different dimensions.
To ensure the statistical reliability of the results, rigorous control procedures were implemented during the dependency analysis. Pairwise independence tests were corrected for multiple comparisons using the Bonferroni adjustment, a conservative approach that controls the FWER and mitigates the risk of inflated Type I errors. Only associations that remained significant after this adjustment ( ) were considered for interpretation. Additionally, the effect size coefficient ( ) was computed to quantify the magnitude of each association, distinguishing relationships that are merely statistically significant from those that hold substantive relevance. The combined use of and therefore provides a more comprehensive assessment of both the significance and practical importance of the observed dependencies.
Beyond significance testing, a non-parametric bootstrap resampling procedure ( ) was applied to examine the structural robustness of the MCA solutions. The Mean SD of category coordinates across replications served as an indicator of geometric stability. Most active categories showed low-to-moderate coordinate variability (Mean SD < 0.30), confirming that their factorial positions remained consistent across resamples and were not influenced by specific data partitions. The joint application of Bonferroni-adjusted -values, effect size estimation, and bootstrap validation provides complementary perspectives on robustness: while ensures statistical soundness, assesses the practical strength of associations, and the bootstrap procedure confirms the stability of the factorial structure. Together, these methods reinforce the validity and reliability of the multivariate analysis.
The MCA results for functions among technicians indicate that cloud computing, security, IoT, and data analytics constitute one principal axis of variability, whereas project management and civil engineering define a distinct yet equally relevant dimension within the technician profile. The analysis further reveals a consistent pattern in how categories contribute to the retained dimensions. Technical functions—including cloud computing, IoT, security, and data analytics—appear spatially close in the biplot, clearly separated from project management functions. This configuration suggests that the first factorial dimension distinguishes between essential core functions and those perceived as merely relevant or supportive. A similar trend is observed for project management, confirming its differentiated role within the overall structure of the technician competence profile.
These findings are consistent with prior research on the Smart City field. For instance, Iatrellis et al. (2021) and Panagiotakopoulos, Iatrellis & Kameas (2022) also emphasised that Smart City technicians primarily operate within technology-driven domains, while managerial and governance-oriented competences remain peripheral. However, unlike previous studies that focused mainly on ICT capabilities, our analysis captures the coexistence of technical and project-oriented dimensions, reflecting the hybrid nature of Smart City operations. Moreover, when compared with the ESCO and e-CF frameworks, our results reveal a stronger concentration on cloud and IoT competences, suggesting that Smart City projects place greater emphasis on interconnected digital infrastructures than on traditional governance or service management skills.
In the study of the association of the variables with each dimension by the coefficient , it is observed that the functions related to technology are more correlated with the first dimension generated, while project management is more correlated with the second dimension and far from the rest of the functions of the technicians.
Finally, the values support these findings, as they indicate a good representation of all categories in the first two dimensions.
The same scheme also allows an analysis of the results for Smart Cities functions for engineers. The study of dependencies between the variables reveals significant dependencies of project management on all other variables except cloud computing, among other dependencies identified in the results section. These results may reflect the importance of project management in engineering. This differs from the results on functions for the technicians, where project management was independent. An MCA has been further performed to confirm this assumption. Other results from MCA reveal distinct patterns across the three retained dimensions, reflecting the importance of security, leveraging data for decision-making and reinforcing the distinction of the civil engineering role within the engineer profile. The results also indicate a possible link between project management and cloud-based solutions.
For the engineer profile, the findings reveal that project management, civil engineering, and cloud infrastructures form a coherent competence cluster that integrates strategic coordination with technological implementation. This configuration aligns with previous studies on Smart City engineering frameworks, which highlight the convergence of managerial and technical roles in complex urban innovation projects (e.g., Pospelova et al., 2023). Nonetheless, unlike prior work that often isolates civil engineering as a purely infrastructural function, the present results suggest a more interconnected role, where engineering expertise actively supports decision-making and digital transformation processes.
Regarding the skills for technicians and engineers, the results are aligned with the ones obtained for their functions. For technicians, the skills groups of enabling technologies and business and management are independent, according to the study of dependencies between the variables. This suggests that technical expertise in digital infrastructure operates separately from business-oriented skills. However, soft skills and green skills are dependent on each other, meaning that for technicians, both categories of skills are related. This is also aligned with the results obtained from MCA.
For engineers, skills are also aligned with the analysis done for their functions. According to the study of dependencies, the enabling technologies skills are independent from other variables, while business and management, soft and green skills are related among them. This is also observed in different dimensions obtained by MCA. These results for engineers highlight once again the participation of business knowledge in this profile. Even more, business skills are related to green and soft skills. This relation may indicate that green and soft skills are important for business, as it can imply managing teams or making decisions about green initiatives or reducing digital pollution.
The observed differences between engineers and technicians also have practical implications for curriculum development and skills frameworks. In engineering education, the prominence of business, management, and soft skills highlights the need for interdisciplinary modules that combine technical proficiency with leadership and decision-making capabilities. In contrast, technical training programs should emphasise operational competencies and the application of enabling technologies in real-world Smart City contexts.
Finally, some limitations of this study should be noted. While the results provide valuable insights into the competence structure of Smart City professionals, they should be interpreted with caution. Given the predominance of ICT professionals among respondents, the findings may reflect a technological bias, limiting their generalisation to all Smart City domains. The current sample may not fully capture the diversity of roles in areas such as urban planning, governance, or environmental management. Future studies should therefore include a broader range of experts to test the cross-domain consistency of competence structures and enhance the generalizability of the proposed profiles.
In addition, the scope of enabling technologies considered in this study was intentionally bounded by expert consensus and alignment with the ESCO framework. Although domains such as 5G and robotics are becoming increasingly relevant in Smart City ecosystems, they were not included in the present analysis because they were considered as transversal enablers embedded within broader IoT and AI-related categories. Future research could extend the analysis to incorporate these emerging technologies as they gain wider adoption and formal recognition in the recommended profile for Smart City professionals.
Conclusions and further works
In this article, the main aim was to understand emerging profiles in Smart Cities by identifying the most recommended functions and skills for engineers and technicians in this area. The research, firstly, required an extensive desk research of different sources. During this analysis, it was observed that one of the most important areas in this professional context was ICT, probably because it provides the “smart” differential part of the discipline. This finding led to the preparation of a survey based on the European labour classification, ESCO. In this case, ESCO was the base for the survey statements and terminology. This survey was targeted at all groups of stakeholders to collect enough information to determine the recommended profile of functions and skills for engineers and technicians in Smart Cities. After preprocessing data, the data included a total of 24 different variables and 88 records.
The study defines the recommended professional profiles for Smart Cities engineers and technicians by identifying key functions and skill categories based on expert opinions through descriptive statistics and the MDA. Then, inferential techniques such as the test and Fisher’s Exact tests were used to understand the relationship between different variables of our data set. This analysis allows us to understand the data behaviour and to extract conclusions for the proposed specific research aims. The results reveal clear distinctions between the two profiles in terms of key functions and relevance of skills. For engineers, civil engineering and project management emerge as the most influential functions, reinforcing their role in planning and overseeing Smart Cities projects. In contrast, technicians are primarily associated with cloud computing, security, IoT, and data analytics, which are mostly considered relevant and useful rather than essential. Regarding skills, enabling technologies are essential for both engineers and technicians, highlighting the technical nature of these profiles. However, business and management, soft and green skills are significantly more relevant for engineers than for technicians, suggesting that engineers are expected to engage more in leadership, strategic decision-making, and sustainability initiatives.
One of the specific objectives of the research was to analyse the differences between the recommended profiles for engineers and technicians. To cover this aim, the study identified the functions and skill groups with the greatest influence in each profile. Additionally, the results revealed that project management functions are largely independent of technology-focused functions, reinforcing their strategic and planning-oriented nature.
When analysing the relationships between different functions and skills within the Smart Cities engineers’ and technicians’ profiles, the analysis suggests that some variables are more connected to each other than others. Variables related to technical functions exhibit similar patterns of behaviour for both technicians and engineers. Despite the distinct professional profiles, the contribution of the technical functions remains crucial for technicians (focusing on operational tasks) and engineers (engaging in broader, and strategic roles). These findings highlight that, regardless of the specific responsibilities, both technicians and engineers must show a solid understanding of these technologies to successfully contribute to Smart Cities development.
The consistency between the descriptive findings and the MCA results reinforces the validity of the identified professional profiles. This alignment between methods supports the internal coherence of the study and confirms that the multivariate configurations reflect meaningful and stable relationships across the analysed variables. Furthermore, by acknowledging the methodological constraints associated with MCA, such as its sensitivity to sample composition and the representation of low-frequency categories, this research ensures transparency and provides a solid foundation for future studies aiming to refine categorical data analysis in the context of Smart City professional profiles.
Future research should take a more practical direction by testing and applying the proposed professional profiles in real Smart City environments. One promising avenue is the development of pilot training programs or competency-based curricula aligned with the identified skill sets. These initiatives could be implemented in collaboration with universities, training centres, and industry partners to evaluate their effectiveness and ensure alignment with actual labour market needs.
Moreover, conducting case studies or field experiments in ongoing Smart City projects would help to assess how engineers and technicians with these profiles perform in real operational contexts, such as infrastructure management, IoT deployment, or data-driven decision-making. This evidence-based validation would provide concrete feedback to refine the proposed profiles.
In addition, partnerships with local governments, technology providers, and policy makers could facilitate the creation of frameworks for accreditation or certification, supporting the practical adoption of these profiles. Such a collaborative and applied approach would ensure that future studies not only advance theoretical understanding but also contribute directly to workforce development and the successful implementation of Smart City initiatives.
Overall, this research advances prior knowledge by providing a data-driven and statistically validated definition of Smart City professional profiles. While previous studies often addressed skills and functions from a conceptual or technology-specific viewpoint, this work integrates expert input with the ESCO framework and multivariate methods to deliver an empirically grounded characterisation of both engineers and technicians. So, it bridges a gap between theoretical frameworks and practical workforce needs, highlighting the balance between technical, managerial, and sustainability-related competencies. This contribution not only deepens the understanding of the evolving Smart City labour ecosystem but also offers a structured reference for educational design, professional development, and policy-making in this emerging field.