
Improved object detection approach employing adaptive padding and Viola-Jones algorithm
- Published
- Accepted
- Received
- Academic Editor
- Giovanni Angiulli
- Subject Areas
- Artificial Intelligence, Computer Vision, Data Mining and Machine Learning, Optimization Theory and Computation, Neural Networks
- Keywords
- Object detection, Image processing, Viola-Jones algorithm, Adaptive padding, Gaussian blurring, YOLO
- Copyright
- © 2025 Dinç and Kaya
- Licence
- This is an open access article distributed under the terms of the Creative Commons Attribution License, which permits unrestricted use, distribution, reproduction and adaptation in any medium and for any purpose provided that it is properly attributed. For attribution, the original author(s), title, publication source (PeerJ Computer Science) and either DOI or URL of the article must be cited.
- Cite this article
- 2025. Improved object detection approach employing adaptive padding and Viola-Jones algorithm. PeerJ Computer Science 11:e3455 https://doi.org/10.7717/peerj-cs.3455
Abstract
In recent years, significant advancements have been achieved in the field of object detection (OD) thanks to the rapid developments in deep learning (DL) methodologies. Although single-stage detectors have accelerated OD, the presence of high-frequency noise and irrelevant details makes these models sensitive to background noise. This challenge causes various difficulties, such as increased false-positive rates in the training process and computational costs. To address these limitations, we present a novel approach that improves the object detector’s detection capability by reducing high-frequency noise in the input image. Specifically, the proposed model comprises a novel adaptive padding (AP) mechanism and a region of interest (RoI) detector to provide a balance between RoI generation and OD. To improve the ability to detect multi-scale objects within complex scenes, the model is separately trained with a RoI detector that combines a set of weak candidate regions into a single frame and then enhances its flexibility using the AP mechanism. To create a distinct contrast between the object regions and the background, a low-pass filter is finally applied to the input image. The proposed model was used for You Only Look Once version 8 (YOLOv8) and tested with 351 images of six bird species. It is essential to note that the proposed model outperformed the baseline YOLOv8, achieving superior detection performance in terms of accuracy, classification, and localization loss, while minimizing the high-frequency noise generated by redundant sub-images. The model increased the mean average precision calculated at an intersection over union (IoU) threshold of 0.50 (mAP50) from 0.954 to 0.984 and the mAP50–95 from 0.633 to 0.781. The proposed approach was also evaluated under domain shift conditions and indicated strong robustness across different data distributions. Moreover, the region proposal-based detection results showed more balanced and accurate classification results, with a reduction in the misclassified sample rate. Finally, validation with the state-of-the-art YOLOv12 further demonstrated superior performance, with gains exceeding 3% in mAP50 and 20% in mAP50–95, underscoring the scalability and robustness of the proposed approach.
Introduction
Object detection (OD) is a fundamental field of computer vision applications and plays a crucial role in recognizing objects in visual scenes. This technology is widely used in a range of fields such as face detection (Chen et al., 2021; Liu, Wang & Miao, 2024; Yu et al., 2024), object tracking (Kalake, Wan & Hou, 2021), medical imaging (Chen et al., 2025; Bingol et al., 2023; Tandirovic Gursel & Kaya, 2025), agriculture (Gallo et al., 2023; Khalid et al., 2023; Saranya et al., 2023; Singh & Krishnamurthi, 2023), and autonomous vehicles (Appiah & Mensah, 2024; Mao et al., 2023; Can, Kilic & Kaya, 2025).
The first significant work in OD was published in 2001 by Viola & Jones (2001). The authors introduced a binary classification method named the Viola-Jones (VJ) algorithm for face recognition, based on the study of Papageorgiou, Oren & Poggio (1998). In 2005, the Histogram of Oriented Gradients (HOG) (Dalal & Triggs, 2005) feature descriptor was presented. The model significantly surpassed existing pedestrian recognition methods. HOG represents a crucial advancement of the scale-invariant feature transform (SIFT) (Lowe, 1999) and shape contexts (Belongie, Malik & Puzicha, 2002). To balance feature invariance with nonlinearity, the HOG is organized to be calculated on a dense grid of uniformly spaced cells, with overlapping local contrast normalization within blocks. In 2009, Felzenszwalb, McAllester & Ramanan (2008) developed a feature-based detection model known as the Deformable Part Model (DPM). DPM involves decomposing the object into its different parts and aggregating the detections of each component using the divide-and-conquer approach. Although today’s OD strategies outperform conventional methods in terms of detection accuracy, they are inspired by principles of localization and feature extraction.
Understanding the interaction between objects and visual scenes requires the use of progressively sophisticated and sequential learning models. In recent years, remarkable progress has been achieved in OD and image processing with the emergence of Convolutional Neural Networks (CNNs). Girshick et al. (2013) introduced Region-Based Convolutional Neural Networks (R-CNN). The model employs a selective search algorithm (Uijlings et al., 2013) to generate candidate object proposals, which a CNN subsequently processes. These proposals are resized to a fixed dimension and fed into a deep CNN, followed by classification using a separate classifier. Although R-CNN marked an important milestone in OD, its requirement to process each proposal independently caused a significant increase in computational cost. To mitigate this, He et al. (2014) proposed the Spatial Pyramid Pooling Network (SPPNet), which introduces a spatial pyramid pooling layer that enables the generation of fixed-size region proposals regardless of the input image dimensions. Unlike R-CNN, SPPNet extracts proposals from the feature map rather than directly from the input image, accelerating detection by up to 20 times without sacrificing accuracy. Despite this improvement, SPPNet still suffers from limitations, such as its reliance on fine-tuning fully connected layers and a multi-stage training process. To address these issues, Girshick (2015) introduced Fast R-CNN, which allows end-to-end training of all network layers. For each proposal, a RoI pooling layer generates a fixed-length feature vector that is passed through fully connected layers and two sibling output layers: one for softmax classification and the other for bounding box regression. While Fast R-CNN integrates the advantages of its predecessors, its speed remains constrained by the selective search step. Ren et al. (2017) overcame this bottleneck by introducing Faster R-CNN, which employs a Region Proposal Network (RPN). This fully convolutional network generates cost-free region proposals shared with the detection network.
Nevertheless, Faster R-CNN still exhibits non-negligible computational redundancies. To further enhance detection performance, Lin et al. (2017) proposed Feature Pyramid Networks (FPN), a top-down architecture with lateral connections that builds semantically strong multi-scale feature maps. Although FPN achieves superior performance in detecting objects of varying scales, its computational overhead and integration complexity remain significant challenges.
In contrast to these two-stage frameworks, Redmon et al. (2016) introduced You Only Look Once (YOLO), which represents a paradigm shift in OD by applying a single network directly to the entire image. Instead of generating region proposals, YOLO divides the input image into grids and simultaneously predicts bounding boxes and class probabilities for each grid cell. This one-stage design significantly reduces inference time and enables real-time detection. Subsequently, successive YOLO models (Redmon & Farhadi, 2017, 2018; Bochkovskiy, Wang & Liao, 2020; Roboflow Blog, 2020; Li et al., 2022; Wang, Bochkovskiy & Liao, 2023; Ultralytics, 2023) have been proposed, leading to widespread adoption across diverse domains. Figure 1 demonstrates the evolution of two-stage and single-stage object detectors. These models consistently demonstrate superior efficiency compared to their two-stage counterparts, achieving remarkable improvements in both detection speed and accuracy.
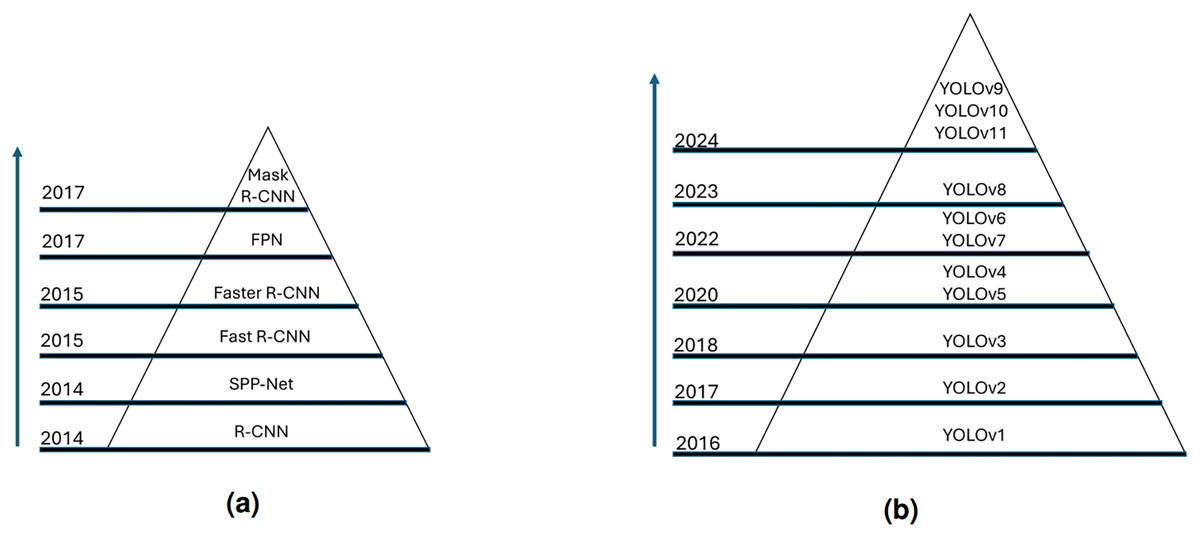
Figure 1: Generic object detection models.
(A) Two-stage object detectors; (B) single-stage object detectors.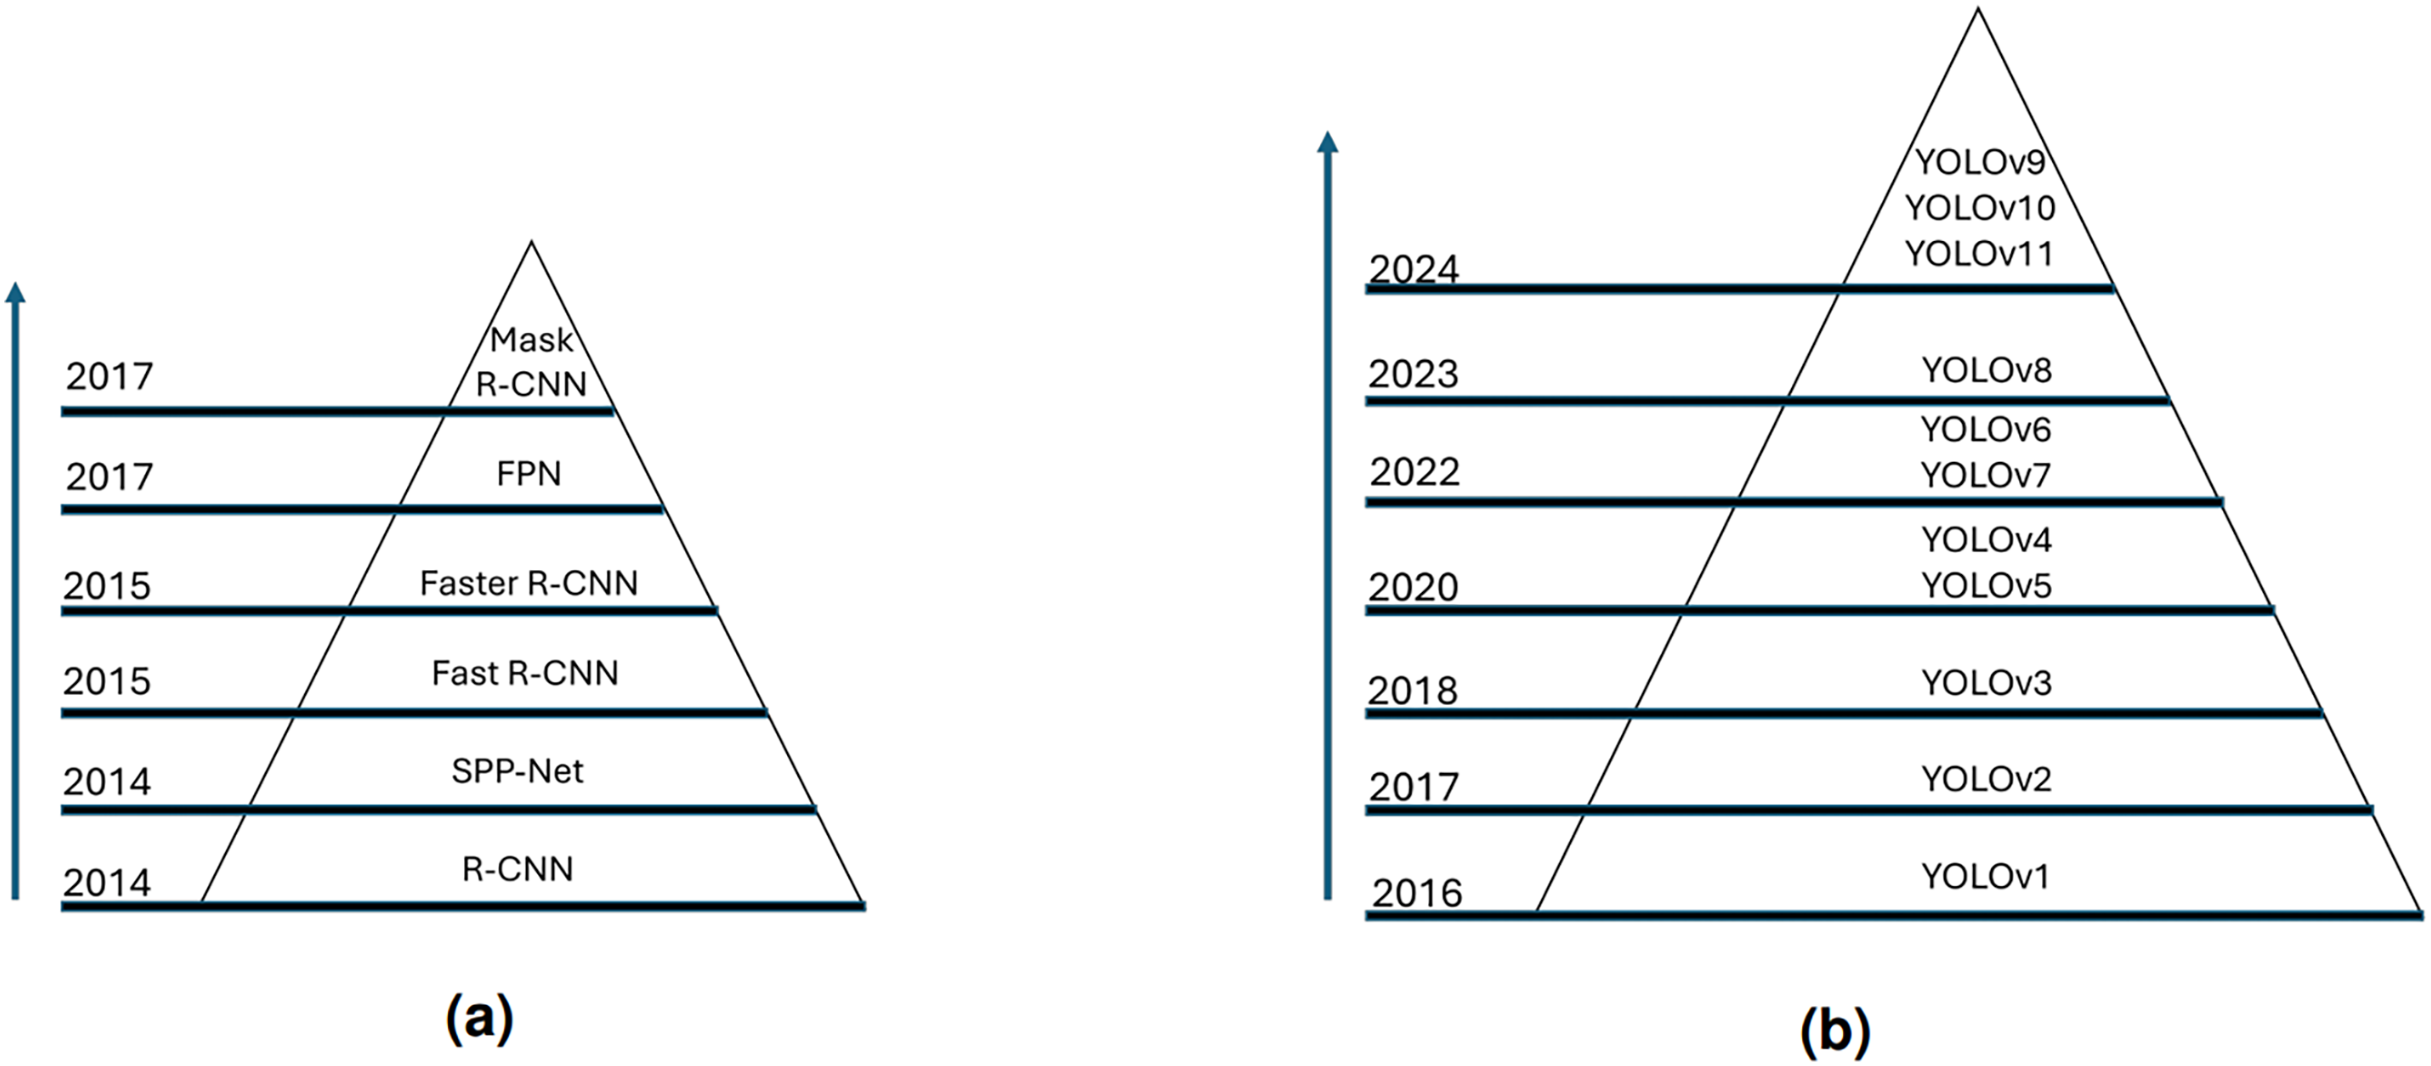
Nevertheless, the latest YOLO models face different technical difficulties in OD tasks. These difficulties are summarized below:
Detection capability of different-scaled objects. Due to variable scene conditions such as light and distance, models may have difficulty detecting objects of various sizes (Zou et al., 2023).
Sensitivity to high-frequency noise. The presence of high-frequency noise within visual scenes may reduce the sharpness of details between the background and objects.
Detecting small objects. Small objects may be obscured in feature maps or may lack sufficient distinguishing characteristics using current detectors.
Performance degradation due to high detection speed. YOLO suffers from drops in localization accuracy due to its speed-focused architecture.
To overcome these issues, this study proposes a novel three-stage preprocessing approach that reduces high-frequency noise in input images and diminishes redundant details to an acceptable level using an adaptive padding (AP) mechanism. Therefore, the grid-based approach of the YOLO model can focus on sub-images containing more positive samples by simplifying the background details. The increased contrast between the background and the region of interest (RoI) also provides an advantage to YOLO in detecting the object’s edges. It enables the development of a training model with high generalization ability.
The major contributions of this article can be summarized as follows:
This study proposes a novel OD approach, including an AP mechanism and the VJ algorithm.
We employ the VJ algorithm as a weak classifier to initially determine candidate object regions.
We reduce false positives by applying a low-pass filter to suppress background noise while preserving object edges.
To ensure that YOLO focuses more on positive regions, we implement the AP mechanism. This prevents the model from assigning anchor boxes to empty or redundant regions.
To improve the distinction between objects and backgrounds and detection of object edges, we implement a blurring mechanism that makes the detector more reliable in different lighting and background conditions.
The study is organized as follows: The ‘Related Work’ section provides an overview of recent studies on YOLO-based OD. The ‘Materials and Methods’ section summarizes the dataset used in this experiment and provides a detailed explanation of the proposed model. The ‘Experimental Test and Results’ section presents the experimental results and analysis. The ‘Discussion’ and ‘Conclusion’ sections outline the strengths and limitations of the proposed approach in relation to the experimental results.
Related work
YOLO is a well-known single-stage OD model that provides advanced real-time detection capabilities. Unlike traditional two-stage detectors, YOLO applies a single neural network directly to the entire image, dividing it into grids and simultaneously predicting bounding boxes and class probabilities for multiple objects. Over the years, several versions of YOLO have been developed, with each new release introducing substantial improvements over its predecessor.
Boudjit & Ramzan (2022) proposed a YOLOv2-based real-time OD model using drone-mounted cameras and achieved higher accuracy and faster response time than traditional detectors in tracking persons. Similarly, Sridhar et al. (2022) employed a YOLOv2 framework with deep CNNs to identify motorcycle riders violating traffic rules by detecting both motorcycles and helmets, outperforming traditional approaches. In the medical domain, Yunus et al. (2022) designed a strategy for knee osteoarthritis (KOA) detection using radiographic images. Feature maps were extracted using PCA, AlexNet, and Darknet, and hyperparameters were optimized employing YOLOv2 in the ONNX format. The proposed model achieved a 98% mAP and surpassed existing models.
Gai, Chen & Yuan (2023) developed an improved YOLOv4-based model for cherry fruit detection by integrating CSPDarknet53 with DenseNet and adjusting inter-layer connections to match fruit morphology. The proposed approach outperformed YOLOv3, YOLOv3-dense, and standard YOLOv4. In another work, Ji, Ling & Han (2023) proposed MCS-YOLOv4, which added scale recognition to enhance localization details, achieving superior performance on small object datasets.
Tang, Zhang & Fang (2024) introduced HIC-YOLOv5, an improved YOLOv5 version that added an extra prediction mechanism and an involution block between the backbone and neck, resulting in more refined feature representations. Bao (2024) further improved YOLOv8 by including the ParNet and RepVGG modules. Sapkota, Ahmed & Karkee (2024) conducted a comparative study between YOLOv8 and Mask R-CNN in orchard environments, demonstrating that YOLOv8 achieved higher accuracy and speed. Xu et al. (2025) introduced IMC-YOLOv8 for detecting razor clam burrows in intertidal mudflats. The authors integrated IAIFI, a refactored head network, and TBCAM. The proposed model enhanced mean average precision calculated at an intersection over union (IoU) threshold of 0.50 (mAP50), mAP50–95, and F1-scores by 2.2%, 3.5%, and 2.4%, respectively. Zhang et al. (2025) proposed a road damage detection model using YOLOv8. The authors used ODConv, BoTNet, and a coordinate attention mechanism to improve the accuracy of the model. For traffic sign detection, Zhang, Liang & Wang (2025) developed YOLO-BS. The proposed approach includes a small object detector layer and bi-directional feature pyramid network (BiFPN) to address the multi-scale detection task. In plant disease detection, Miao, Meng & Zhou (2025) proposed SerpensGate-YOLOv8, adding DySnakeConv for recognizing complex structures and SPPELAN for better feature fusion.
All the studies mentioned in this section primarily focus on model accuracy and ignore the high-frequency noise caused by background details. In this study, the proposed model aims to effectively suppress background noise and allow the object detector to focus on more informative regions. This not only improves classification accuracy but also reduces computational costs by narrowing candidate regions. Moreover, an AP mechanism is integrated into the detection framework to provide a more flexible and robust OD task.
Materials and Methods
This section includes a detailed introduction to the image data and the proposed approach. The subsections are organized as follows: the image dataset used in this experiment, the VJ algorithm, a blurring model, and an AP mechanism.
Material
This study utilizes bird images obtained from the TRAKUS bird repository (TRAKUS, 2025). The repository provides a comprehensive image library containing 497 bird species living in Türkiye. A total of 458 of these bird species are endemic to Türkiye. From this repository, 3,096 images of 61 bird species were initially labeled as positive to train the VJ algorithm. Additionally, 12,400 non-bird images obtained from internet sources were also labeled as negative samples.
For the evaluation of the YOLO-based models, 351 bird images belonging to six classes obtained from the TRAKUS repository were selected. These 351 images contain a total of 355 objects, and the class-wise distributions are shown in Table 1. A total of 70% of the images were used for training, 20% for validation, and 10% for testing.
| Class | Num. of samples | Train | Validation | Test |
|---|---|---|---|---|
| White wagtail | 82 | 58 | 17 | 7 |
| Squacco | 76 | 55 | 14 | 7 |
| Krüper’s nuthatch | 62 | 43 | 13 | 6 |
| White-wingned tern | 52 | 38 | 9 | 5 |
| Ring ouzel | 48 | 34 | 9 | 5 |
| Little crake | 35 | 25 | 7 | 3 |
| Total | 355 | 253 | 69 | 33 |
Annotation of ground truth data is a significant challenge, especially when marking small objects. This process needs careful attention during the evaluation phase, as accurate detection depends heavily on precise labeling. Manual labeling of ground truth data is labor-intensive, especially when the input image contains numerous small object proposals scattered throughout. Labeling these objects and the subsequent detection process can be extremely time-consuming and challenging.
To address these issues, we propose a novel preprocessing approach to enhance OD efficiency. Additionally, we created a new bird dataset for this experiment. These data were adapted to facilitate more accurate detection and evaluation of bird species in images. As illustrated in Fig. 2, we give some examples of annotations to the image.
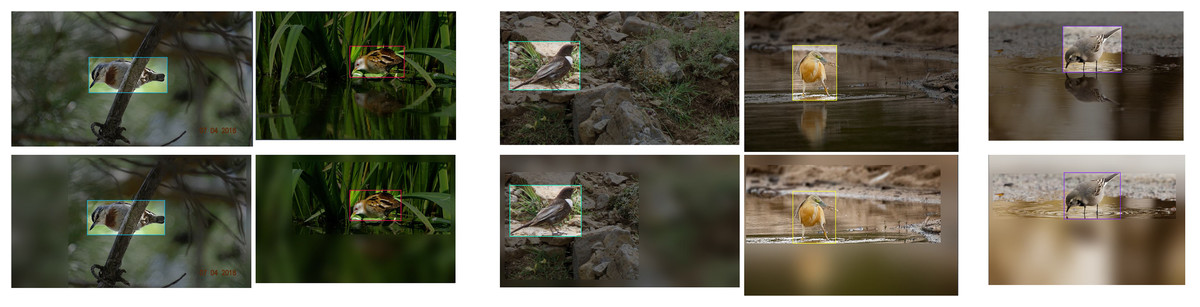
Figure 2: Some examples of annotating image data.
From top to bottom: original images and blurred images by the proposed model.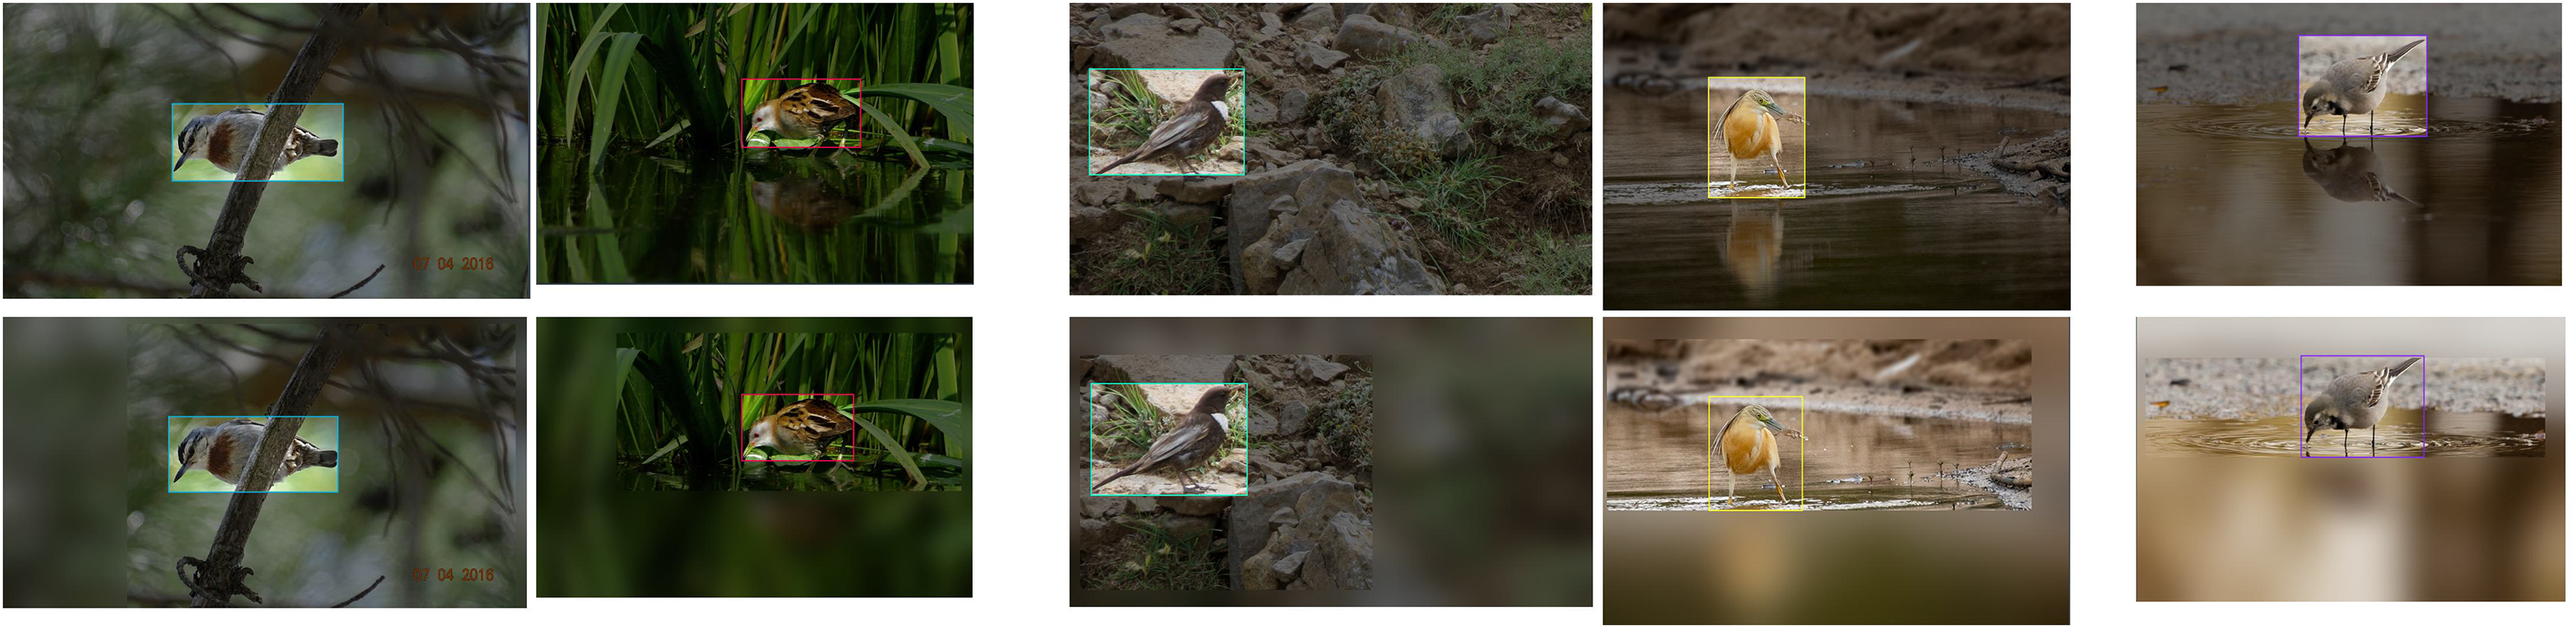
Method
The primary concept of the proposed model is to minimize high-frequency noise in the background image, allowing the OD algorithm to focus solely on positive regions and achieve more effective detection tasks by leveraging the sharp details in the non-blurred sub-image. Complex and crowded background images may cause the OD algorithm to produce false positive results. A more meaningful feature map can be extracted from a denoised image by removing irrelevant features. For this purpose, a three-stage preprocessing model is applied in this study: First, the VJ algorithm determines the regions that can be objects in the image. Then, these regions are merged into a single frame to create the RoI, and an AP mechanism is applied to make the detected RoI region more flexible. Finally, the Gaussian filter is employed for the rest of the image. This filter limits the search area and focuses on more positive images. The individual stages of the proposed strategy are explained in detail below, as illustrated in Fig. 3. The CBS module comprises convolution, batch normalization (BN), and SiLU activation functions.
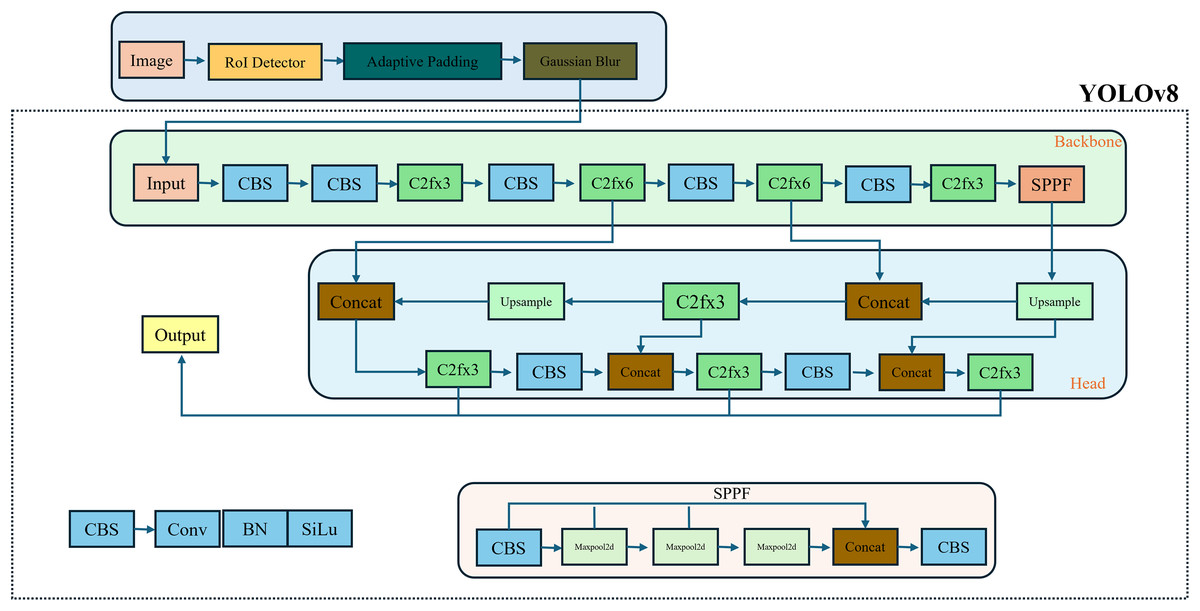
Figure 3: The proposed model’s block diagram.
YOLOv8 architecture
To date, there is no study that systematically examines the YOLOv8 pipeline. Consequently, the fundamental methodological framework and design decisions adopted during the development process are not documented in the scientific articles. However, a technical review of the YOLOv8 (Jocher, Chaurasia & Qiu, 2023) and its published resources (Ultralytics, 2023) reveals some modifications in network architecture over YOLOv5 (Jocher, 2020), including changes to network design, training strategies, and inference optimization.
The YOLOv8 framework comprises two major components: the backbone and the detection head, both of which are implemented using fully convolutional neural networks.
Backbone: The backbone of YOLOV8 is based on a revised variant of the CSPDarknet53 architecture. This design leverages cross-stage partial connections to improve the information flow between different hierarchical levels of the network. The backbone of YOLOv8 includes a sequence of convolutional layers to extract distinctive features from the input image. The C2f module facilitates the integration of high-level features with contextual information to improve detection performance. Moreover, the Spatial Pyramid Pooling-Fast (SPPF) module and subsequent convolutional layers operate on features at different scales.
Head: The head in YOLOv8 operates on the feature maps generated by the backbone and processes them to produce final predictions. The YOLOv8 head enables independent optimization of objectness estimation, classification, and bounding box regression. This separation enhances task-specific learning and allows for improved detection accuracy. Furthermore, the integration of upsampling (U) layers increases the spatial resolution of the feature maps. The head architecture operates a sequence of convolutional layers to analyze feature maps, followed by a linear layer to predict box parameters and classes.
Framework of the Viola-Jones algorithm
The VJ algorithm is a classification model used particularly in facial region detection tasks. It was first proposed by Viola & Jones (2001), based on the study by Papageorgiou, Oren & Poggio (1998). The algorithm involves generating rectangular features known as Haar-like features, calculating the integral image, selecting the top features using the AdaBoost algorithm, and classifying regions through the cascade structure steps.
Generating Haar-like Features: Haar-like features are sets of features that detect components such as edges, corners, and lines by calculating the intensity difference between two or more neighboring rectangular regions in an image, as shown in Fig. 4. These extracted features are then used to determine whether an object is in the RoI. Given that the detector’s intrinsic resolution is , the dimensions of the rectangular features are relatively extensive, exceeding 180,000. The calculation of rectangular features can be efficiently performed by employing the integral image, which serves as an intermediary model of the input image.
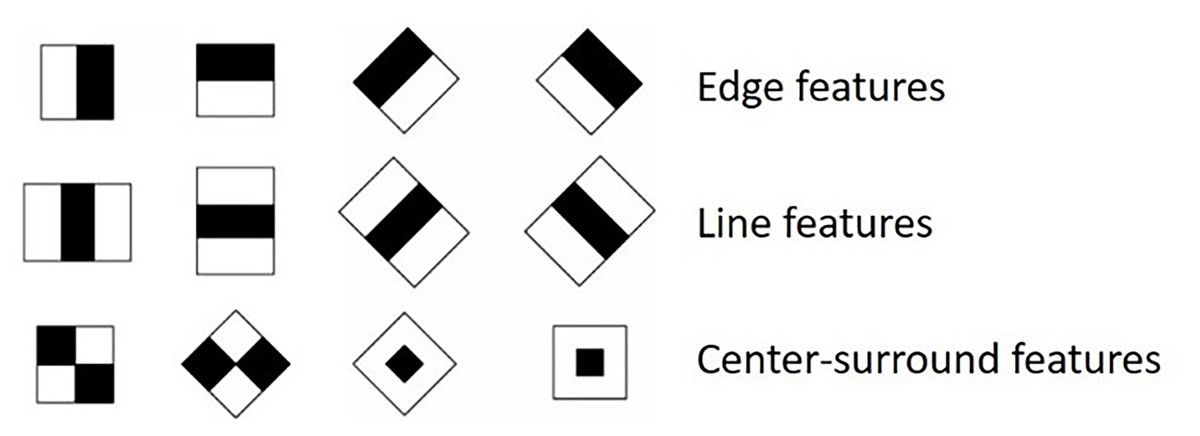
Figure 4: Haar-like features.
Calculating integral image: The integral image contains the sum of all pixel values above and to the left of each pixel in an image. Thus, Haar-like features are calculated much more efficiently by performing four additions and one subtraction operation, which determines pixel intensity differences more effectively than those calculated with the original image. Considering is a coordinate on the image, the integral image is:
(1) where is the original image and is the integral image. The cumulative sum of the is computed using the following formulas:
(2)
(3) where is the cumulative row sum, and .
AdaBoost learning algorithm: The AdaBoost is a learning model that aims to construct a robust classifier by combining a series of weak classifiers. For each Haar-like feature, the AdaBoost creates a weak classifier. Thus, it is determined whether the image has this Haar-like feature. It is essential to emphasize that each subwindow of the input image produces over 180,000 rectangular Haar-like features, surpassing the total number of pixels. During the training of AdaBoost, the weights of incorrectly classified samples are increased, while the weights of correctly classified samples are decreased. Thus, the aim is to select the most discriminative features to create a strong classifier. The output of the strong classifier, object or not, is determined by using a threshold value determined to be half of the total weights of the weak classifiers. Suppose the weak classifier contains a Haar-like feature , a threshold and a parity :
(4)
The steps of the boosting algorithm are shown in Algorithm 1.
| Input: Given example images ( ) where for positive and negative samples, respectively. |
| Output: The final strong classifier cx |
| Initialize weights = for ti = 1,0, respectively, where p and n are the number of positive and negative samples, respectively. |
| for to X do |
| Normalize the weights, where wx is a probability distribution. |
| For a feature j, train the classifier cj limited to a single feature. The error concerning wx, Lj = |
| Select the classifier cx with the lowest error Lx. |
| Update the weights: = . |
| if di is classified correctly |
| otherwise and |
| The final strong classifier where |
Cascading classifiers: Cascading classifiers are a process that aims to classify each sub-image by combining a series of classifiers into a sequential structure. The sub-images are classified in the initial classification stages using simple feature sets. These early classifiers aim to quickly eliminate areas that do not include relevant objects. If the sub-image passes through the preliminary classifiers, it proceeds to the following stages, which involve more complex feature combinations. However, if the sub-image is classified as negative at any stage, it cannot proceed to the subsequent stages and is excluded. Thus, it is aimed to create a balance between classification accuracy and computational cost (Irgens et al., 2017).
Gaussian filter
Gaussian blurring is a low-pass filter used in computer vision to smooth an image and reduce high-frequency noise. Each pixel in the image is recalculated using a weighted average of neighboring pixels. These weights are determined by a Gaussian distribution, and neighbors closer to the center pixel have a higher impact. Therefore, this reduces high-frequency noise while providing a more homogeneous and balanced distribution between pixels, allowing for a natural blurring effect in the image (Dinç & Kaya, 2023). The Eq. (5) represents the computation of Gaussian kernel:
(5) where are the horizontal and vertical coordinates. The symbol represents the standard deviation.
Suppose the image set is the collection of n images belonging to C-th class, are the boundary boxes of image in class C where is the number of proposals for each image and is the set of proposals. The steps of the proposed algorithm are shown in Algorithm 2.
| Input: , |
| Output: Blurred Image Set |
| Single frame , n, m, k |
| for to n do |
| Initialize single frame for ic,e |
| Get |
| for to m do |
| if |
| Update x1 |
| if |
| Update y1 |
| if |
| Update x2 |
| if |
| Update y2 |
| end |
| Extract RoI using se |
| Apply Adaptive Padding Mechanism around RoI |
| Use Gaussian Blurring to reduce image noise regarding the kernel size k |
| end |
Adaptive padding mechanism
To enhance the selection accuracy for the region where the Gauss filter will be applied, an AP mechanism is introduced around the RoI region, as shown in the equations below:
(6)
(7)
In general terms, the padding equations to be applied horizontally and vertically are defined as follows:
(8)
(9) where and are scaling factors:
(10)
Specifically, the padding for the left, right, top, and bottom of the RoI is calculated as follows:
(11)
(12)
(13)
(14)
(15) where , and are the AP to be applied to the left, right, top, and bottom of the RoI, respectively. and denotes the width and height of input image. Equation (15) ensures that the boundary constraints keep the region within the image dimensions.
Experimental tests and results
In this study, 3,096 bird images belonging to 61 distinct species obtained from TRAKUS were randomly selected for the training of the VJ Model. Additionally, a collection of 12,400 nature images, excluding bird objects, was sourced from the internet and marked as negative. The parameter settings of the VJ algorithm are given in Table 2. During the detection of anatomical landmarks, an intersection over union (IoU) threshold of 0.5 is employed for the bounding boxes predicted by VJ (Al-Antari, Al-Masni & Kim, 2020; Al-antari, Han & Kim, 2020). Therefore, the IoU outcomes of the VJ detector in this experiment are classified into four categories: equal to 0, 0–0.3, 0.3–0.5, and .
| Number of positive images | 3,096 |
| Number of negative images | 12,400 |
| Number of training steps | 20 |
| Sample width | 36 |
| Sample height | 24 |
| Minimal hit rate | 0.99 |
In evaluating YOLOv8, several standard OD metrics were used to assess both accuracy and efficiency. The essential evaluation metric is mean Average Precision (mAP), calculated at IoU thresholds of 0.5 (mAP0.5) and between the range 0.5 to 0.95 (mAP50–95) to capture detection performance at different levels. Additionally, precision and recall scores were analyzed to measure the model’s ability to minimize false positives and false negatives, respectively. These metrics provide a balanced assessment of YOLOv8, reflecting its capability to achieve state-of-the-art accuracy while maintaining computational efficiency.
After generating object proposals with the trained VJ model, weak candidate regions in each image were merged into a single, more robust candidate region, effectively narrowing the search space. Subsequently, an AP mechanism was applied to the RoI to enhance spatial flexibility during detection. Additionally, a Gaussian filter was applied to the non-object regions of each image sample to suppress background noise and improve the focus on relevant objects. Table 3 shows the total IoU results of the VJ algorithm.
| =0 | 0–0.3 | 0.3–0.5 | >=0.5 | The number of boundary boxes |
|---|---|---|---|---|
| 61.06% | 38.17% | 0.61% | 0.16% | 97,273 |
Before training the YOLOv8, the images were resized to a fixed dimension of 800 800 pixels. Furthermore, data augmentation was employed to enhance the diversity of the training dataset, applying a 15% grayscale transformation to the images and performing horizontal flips. The dataset was split into three parts containing 70% training, 20% validation, and 10% test. The training parameters of YOLOv8 are shown in Table 4. Table 5 presents the training and validation results obtained employing the proposed preprocessing method and the baseline YOLO models. The YOLOv8 evaluation results show that the proposed model achieved a lower box loss (0.512) and classification loss (0.496) compared to the results obtained with the original data. This means that the model’s predictions are more proximate to the ground truth and show fewer misclassifications during training.
| Number classes | 6 |
| Maximum iteration | 300 |
| Number of images | 351 |
| Patience | 50 |
| Batch size | 16 |
| Image size | 800 800 |
| Learning rate | 0.01 |
| Metrics | YOLOv8 (Proposed/Original) | YOLOv12 (Proposed/Original) |
|---|---|---|
| Train/box loss | 0.512/0.677 | 0.232/0.797 |
| Train/classification loss | 0.496/0.564 | 0.196/0.680 |
| Train/ | 1.077/1.170 | 0.909/1.296 |
| Precision | 0.930/0.867 | 0.940/0.920 |
| Recall | 0.980/0.916 | 0.964/0.802 |
| mAP50 | 0.984/0.954 | 0.989/0.957 |
| mAP50–95 | 0.781/0.633 | 0.762/0.630 |
| Val/box loss | 0.868/1.247 | 0.967/1.227 |
| Val/classification loss | 0.498/0.897 | 0.459/0.720 |
| Val/ | 1.662/2.096 | 1.899/2.072 |
Furthermore, the proposed model resulted in a decline in distribution focal loss ( ), leading to improved bounding box regression during the training stage. Precision improved from 0.867 to 0.930, meaning fewer false positives. Recall also improved, increasing from 0.916 to 0.980, which means the model successfully detects more true positives. The improvements in precision and recall indicate that the proposed model enables YOLOv8 to achieve a more balanced performance between these metrics. In validation, the proposed model significantly decreased box loss (0.868) and classification loss (0.498). This means better generalization to the validation data. The decreased from 2.096 to 1.662, further demonstrating improved accuracy in bounding box regression.
The proposed approach was also evaluated with YOLOv12, and the results are shown in Table 5. The proposed model provided significant and consistent improvements in both classification and localization performance. The most considerable increases in the overall metrics were observed for recall and mAP50–95: recall increased from 0.802 to 0.964, and mAP50–95 rose from 0.630 to 0.762. These increases indicate that the object detector is correctly detecting more objects and producing more accurate boxes, especially at high IoU thresholds. In training, the localization loss decreased from 0.797 to 0.232, the classification loss from 0.681 to 0.196, and the from 1.296 to 0.909. Similarly, in validation, the classification loss decreased from 0.720 to 0.459, the localization loss from 1.227 to 0.967, and the from 2.072 to 1.899. These decreases indicate better optimization in both class separation and boundary box regression.
YOLOv8 achieved a mean average precision (mAP) of 0.984 at an IoU threshold of 0.50 using image data generated by the proposed model, compared to 0.954 with the original images. Similarly, the enhancement in mAP50–95 from 0.634 to 0.780 demonstrates that the proposed model is more robust in handling challenging scenarios, such as overlapping or small objects.
Figure 5 shows the normalized confusion matrices of YOLOv8 using the proposed method and the original images on the validation sets. The experimental results from the proposed method achieved 100% accuracy in nearly all classes. On the other hand, the results obtained with the original images achieved 100% accuracy in only two classes. The classification results using original images demonstrate that the model struggles with specific similar classes and background images. This may be caused by overlapping features or insufficient training data for these classes. Overall, Fig. 5A emphasizes a more robust model with enhanced generalization, particularly in challenging scenarios like distinguishing objects and backgrounds. The YOLOV8 results in Table 5 are also illustrated in Fig. 6. Figure 7 also demonstrates some examples of test results.
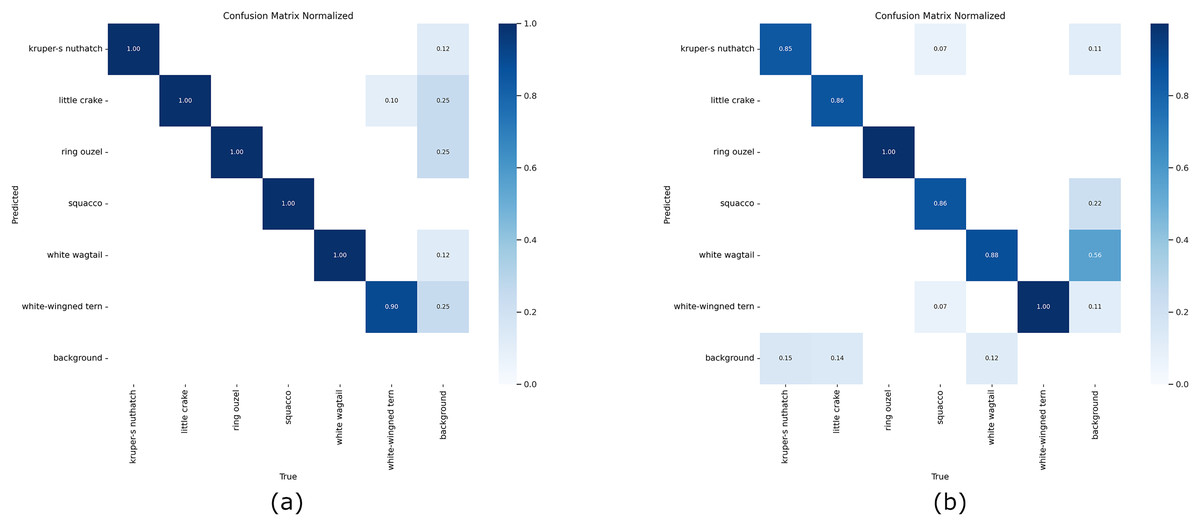
Figure 5: Normalized confusion matrix of YOLOv8 on validation data.
From left to right: confusion matrix for the image data generated by the proposed model and original bird images.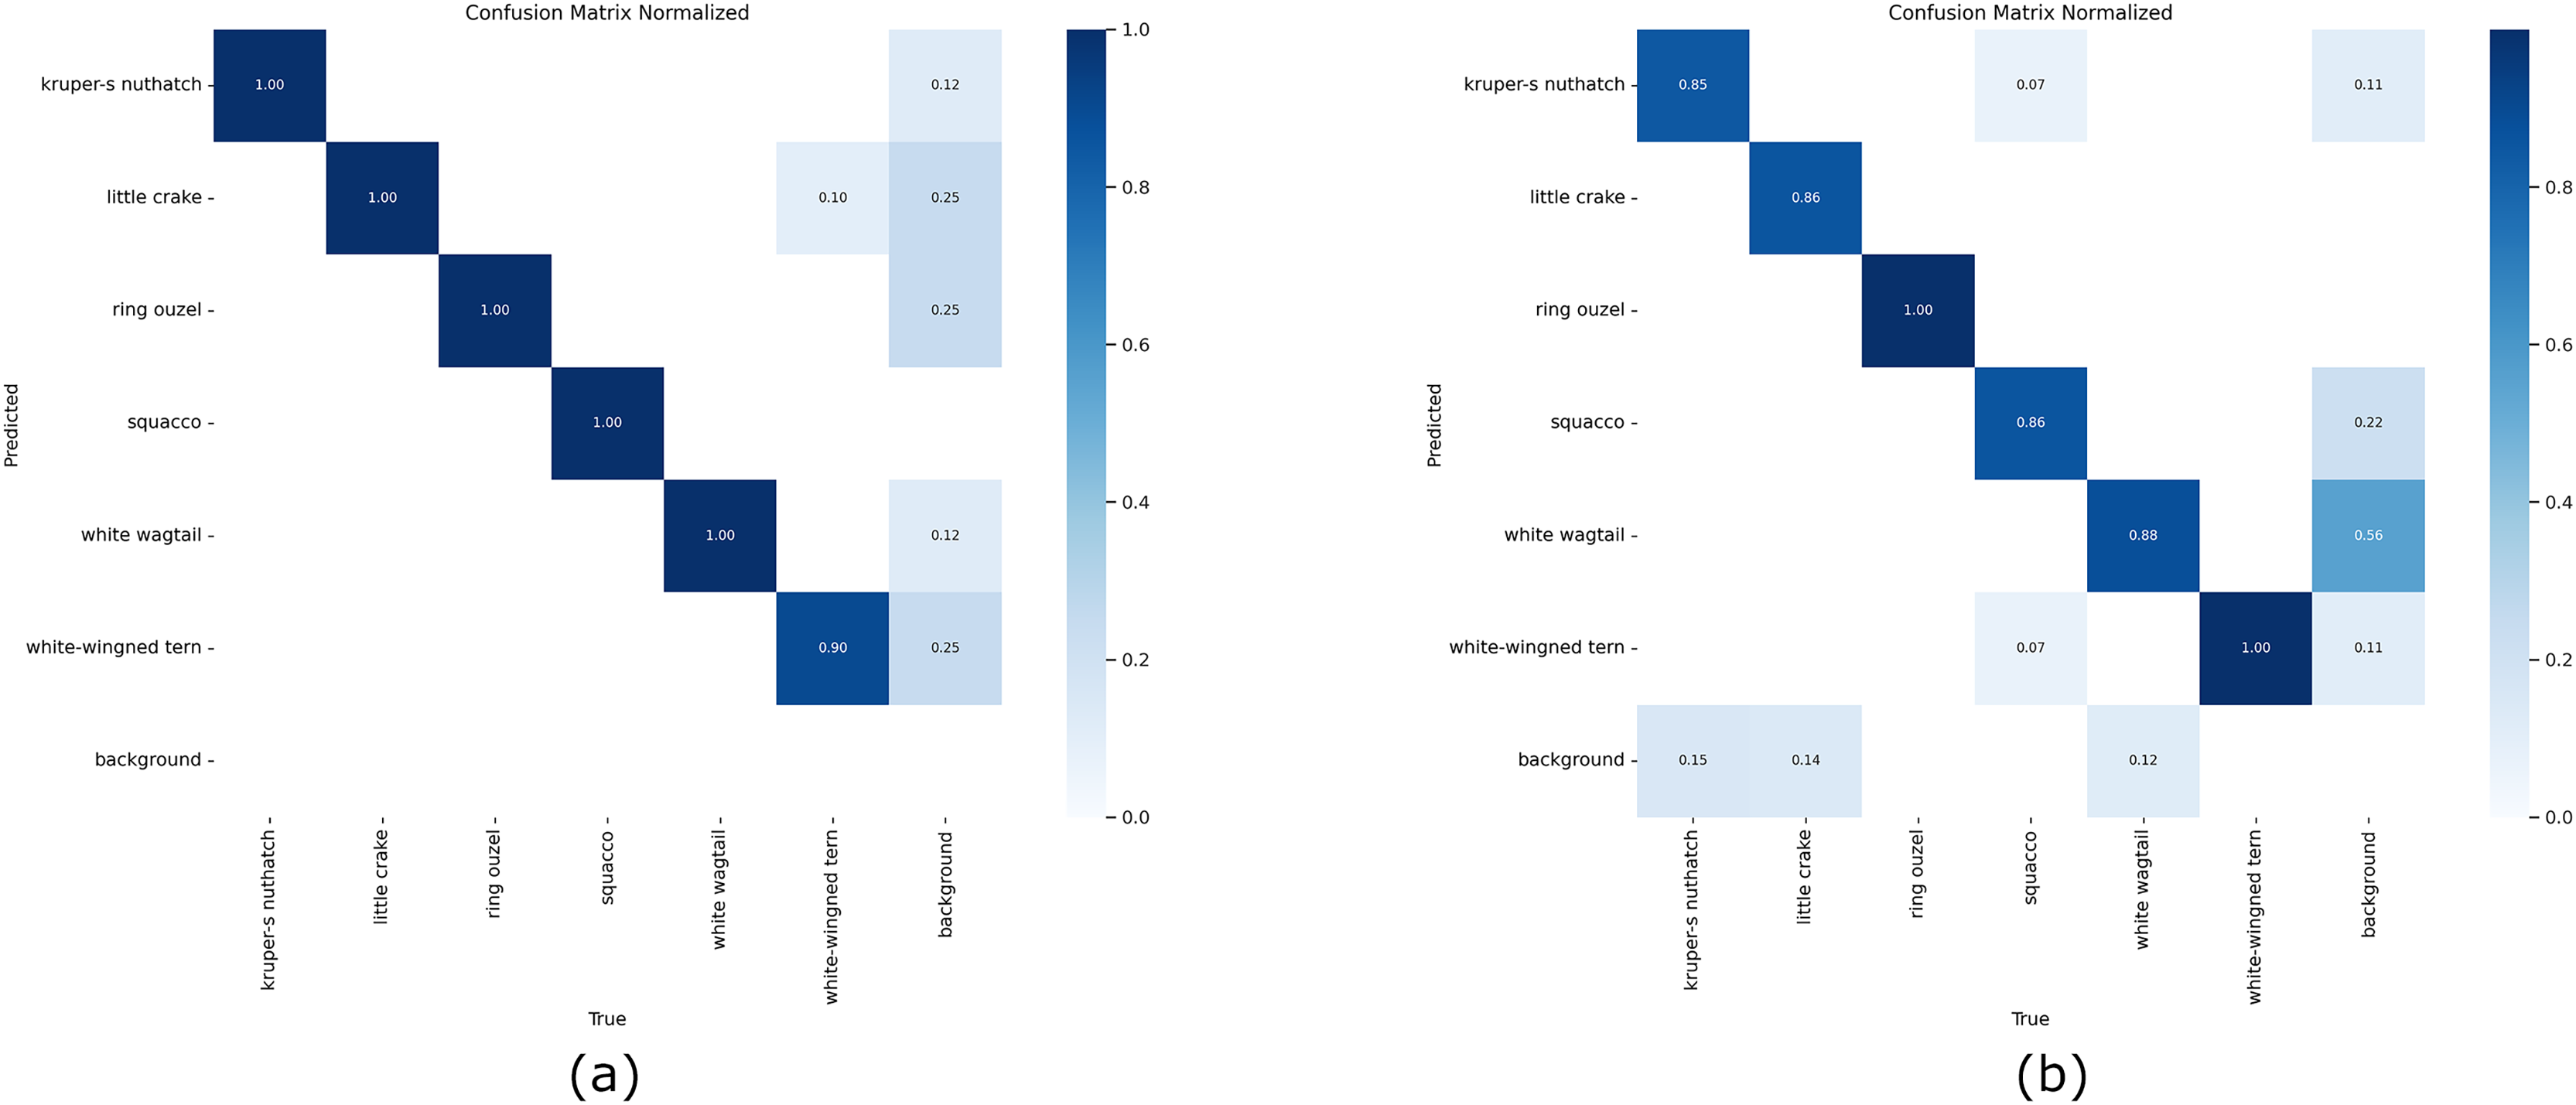
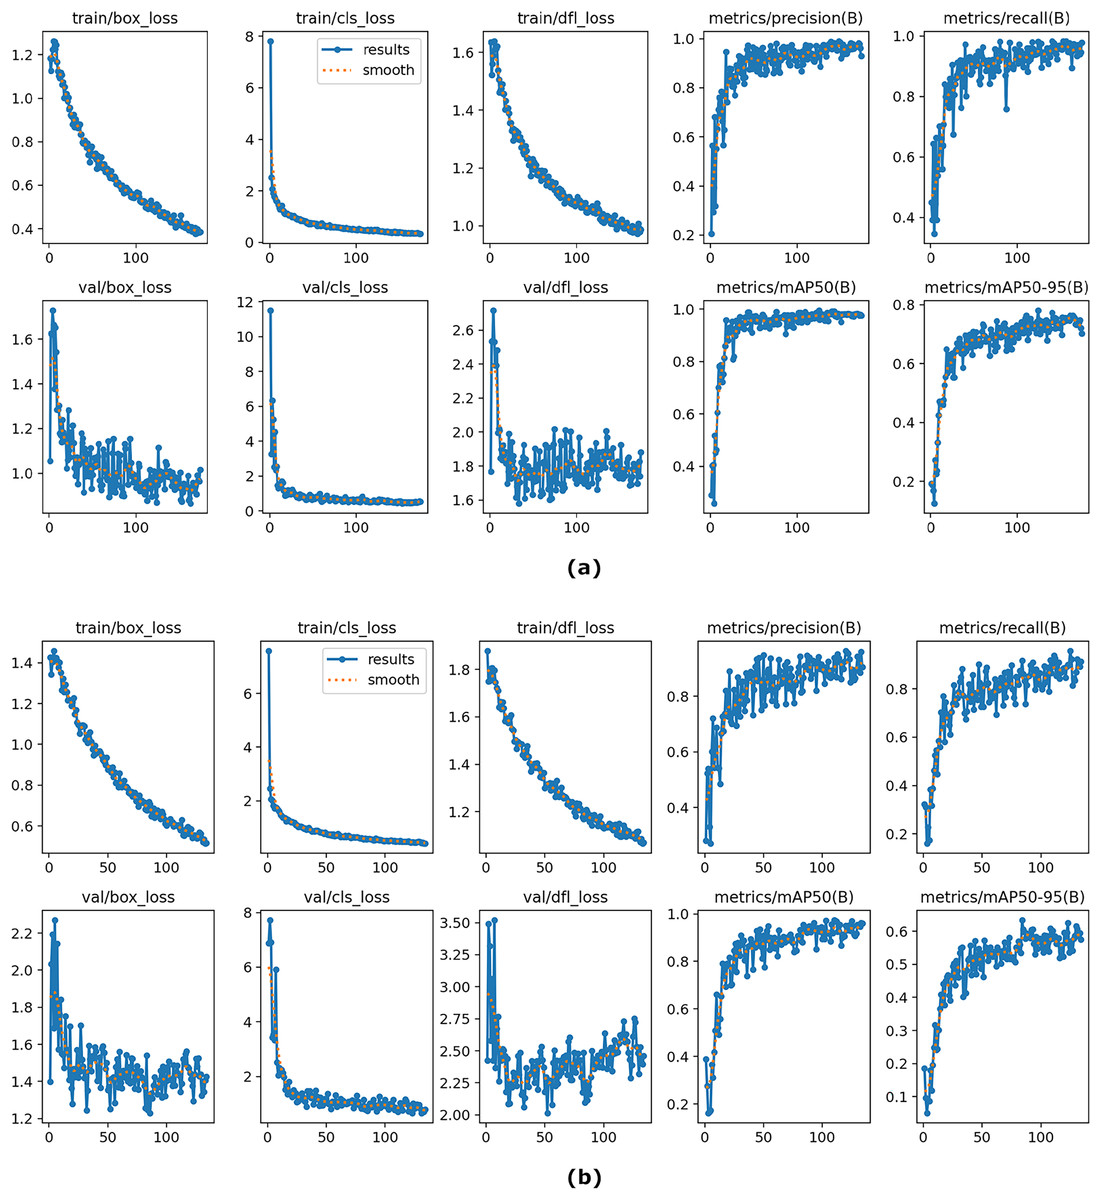
Figure 6: The overall results of YOLOv8 on training and validation sets using the proposed model (A) and baseline YOLOv8 (B).
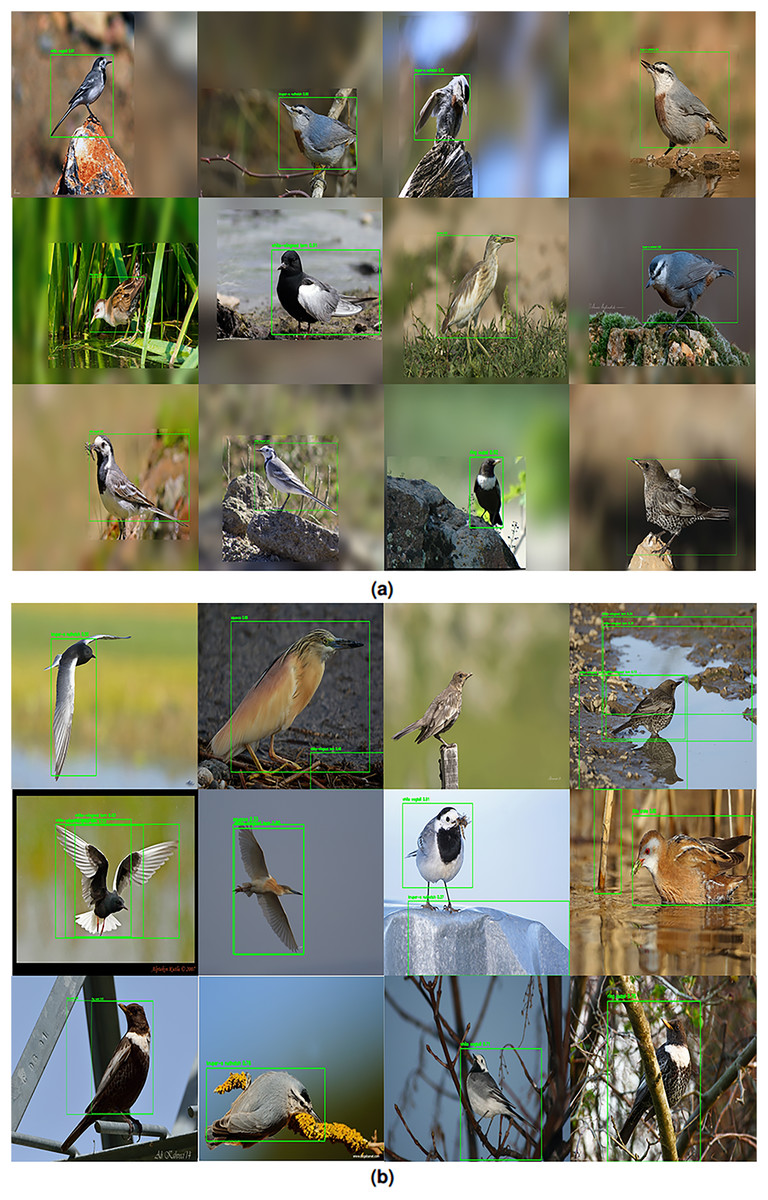
Figure 7: Some examples of predicted test results.
(A) Detection results by the proposed model and (B) detection results by the baseline YOLOv8.
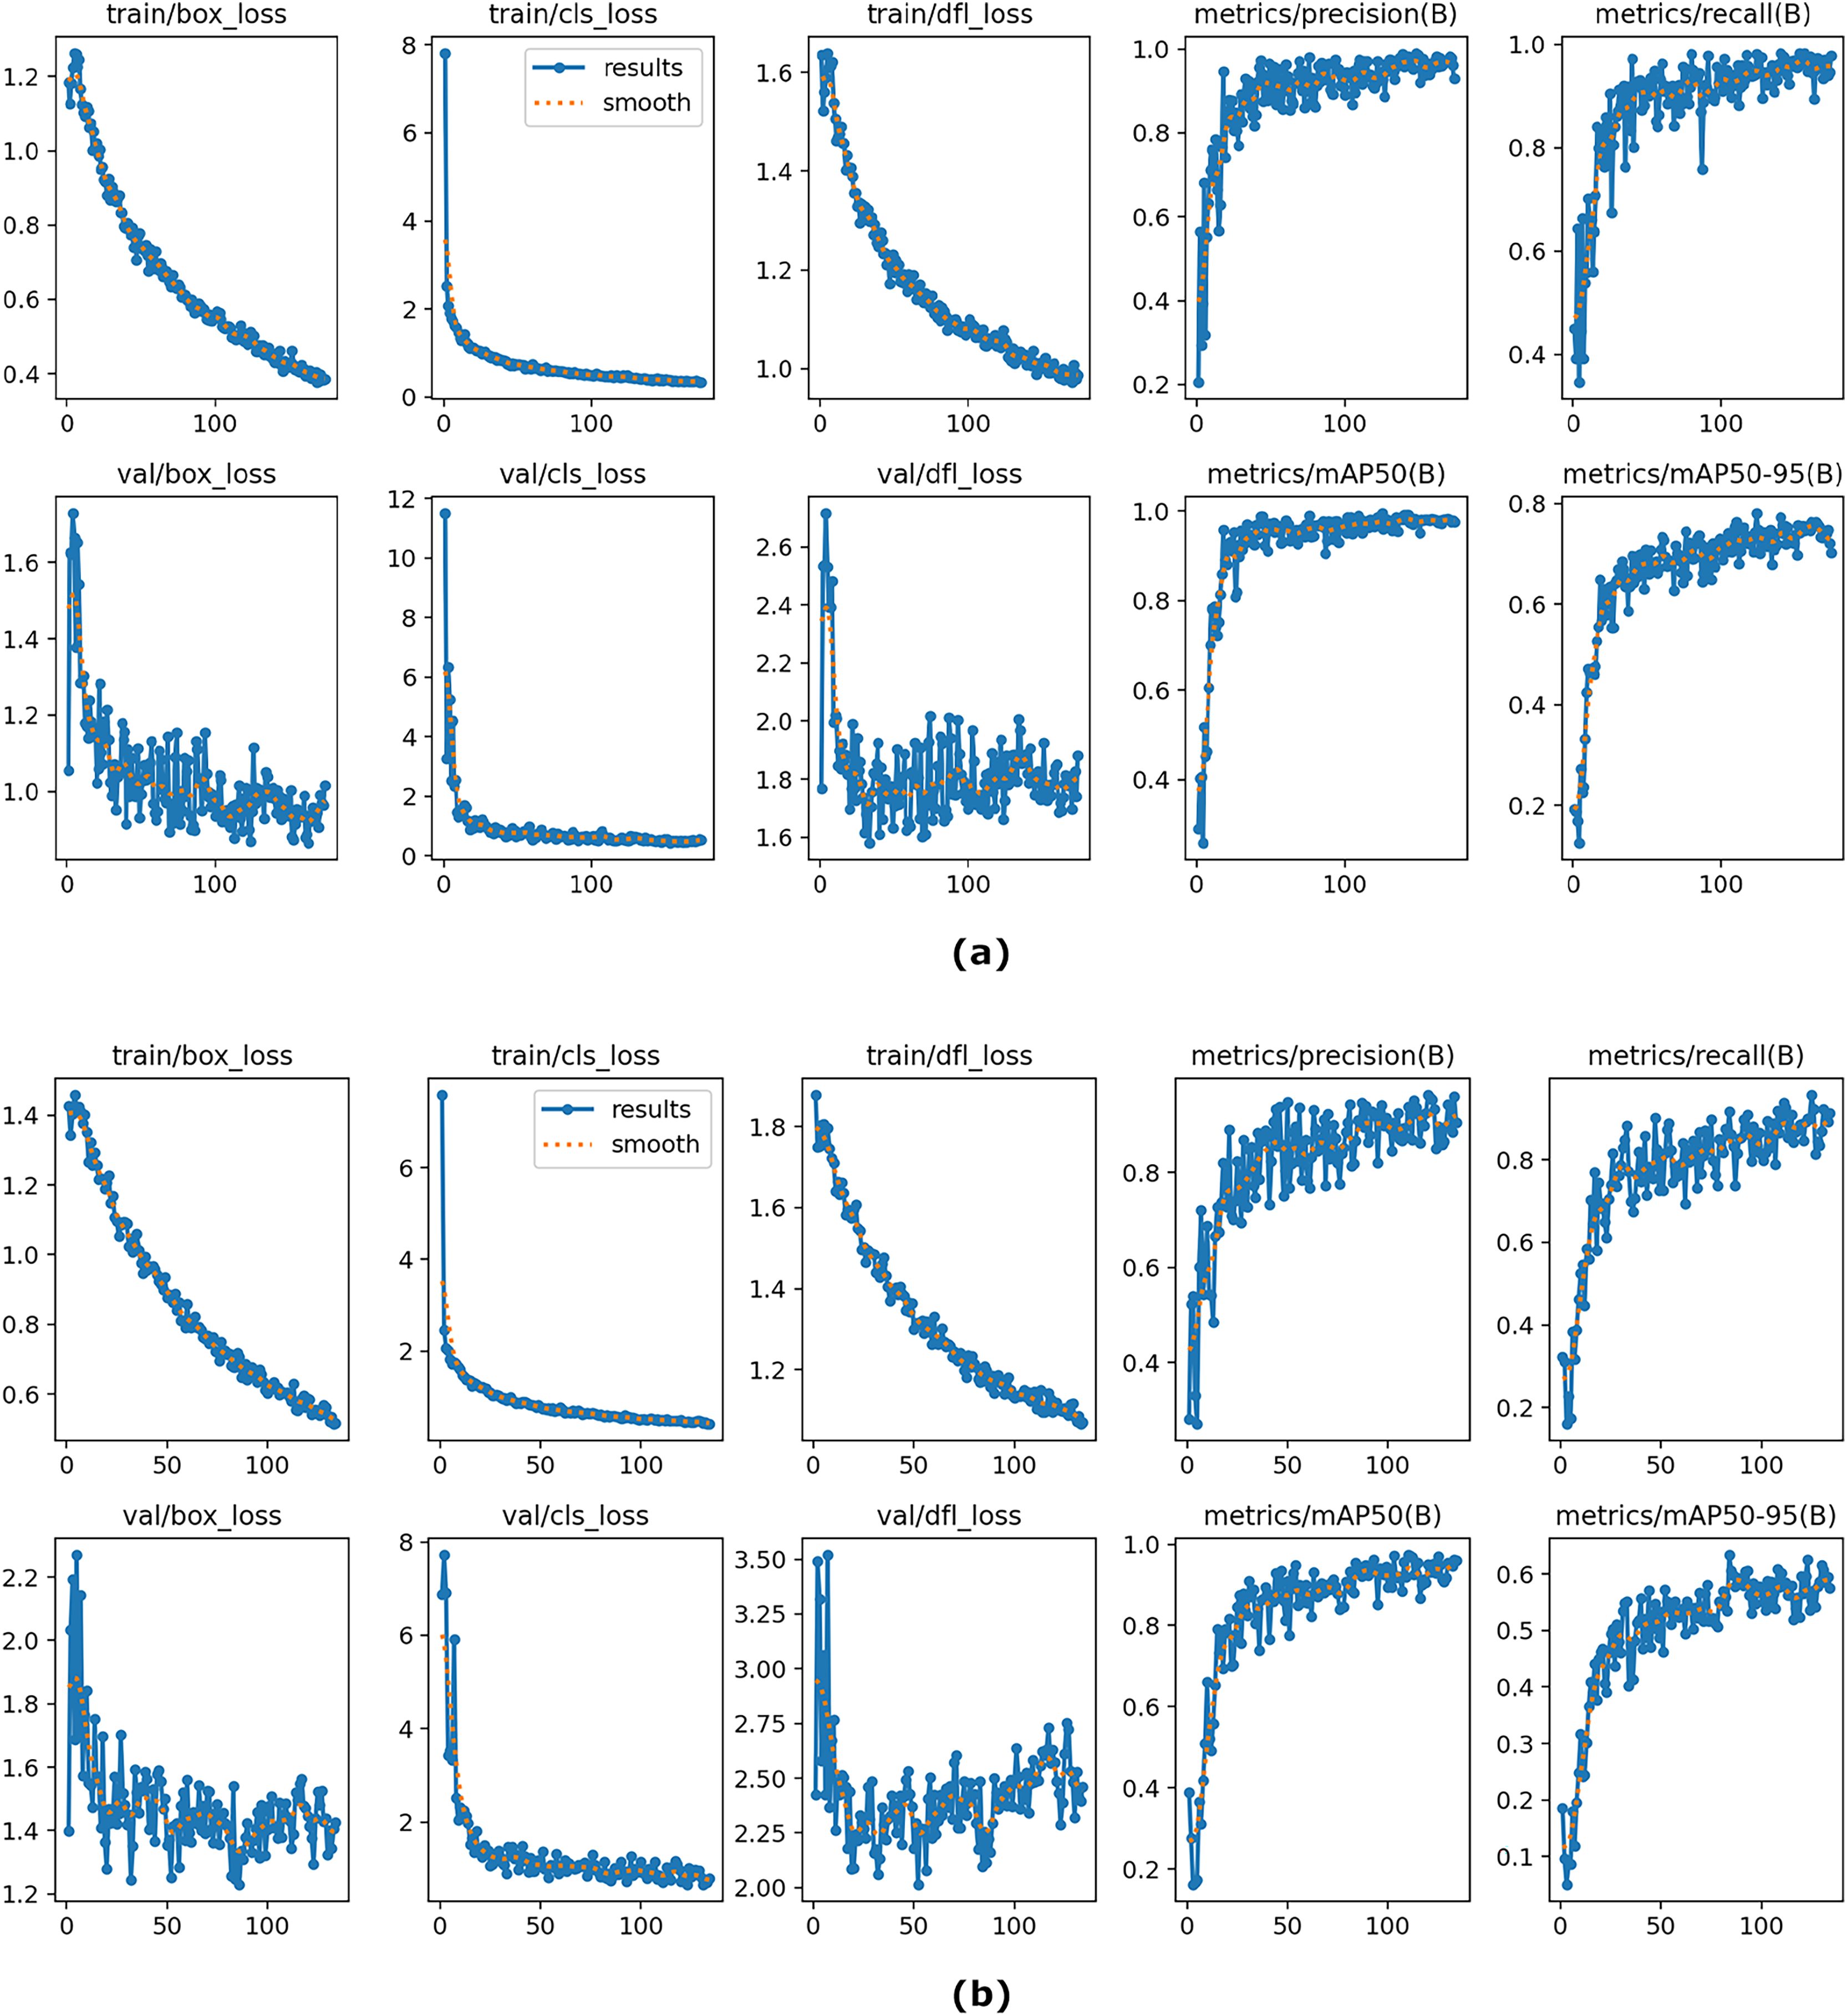
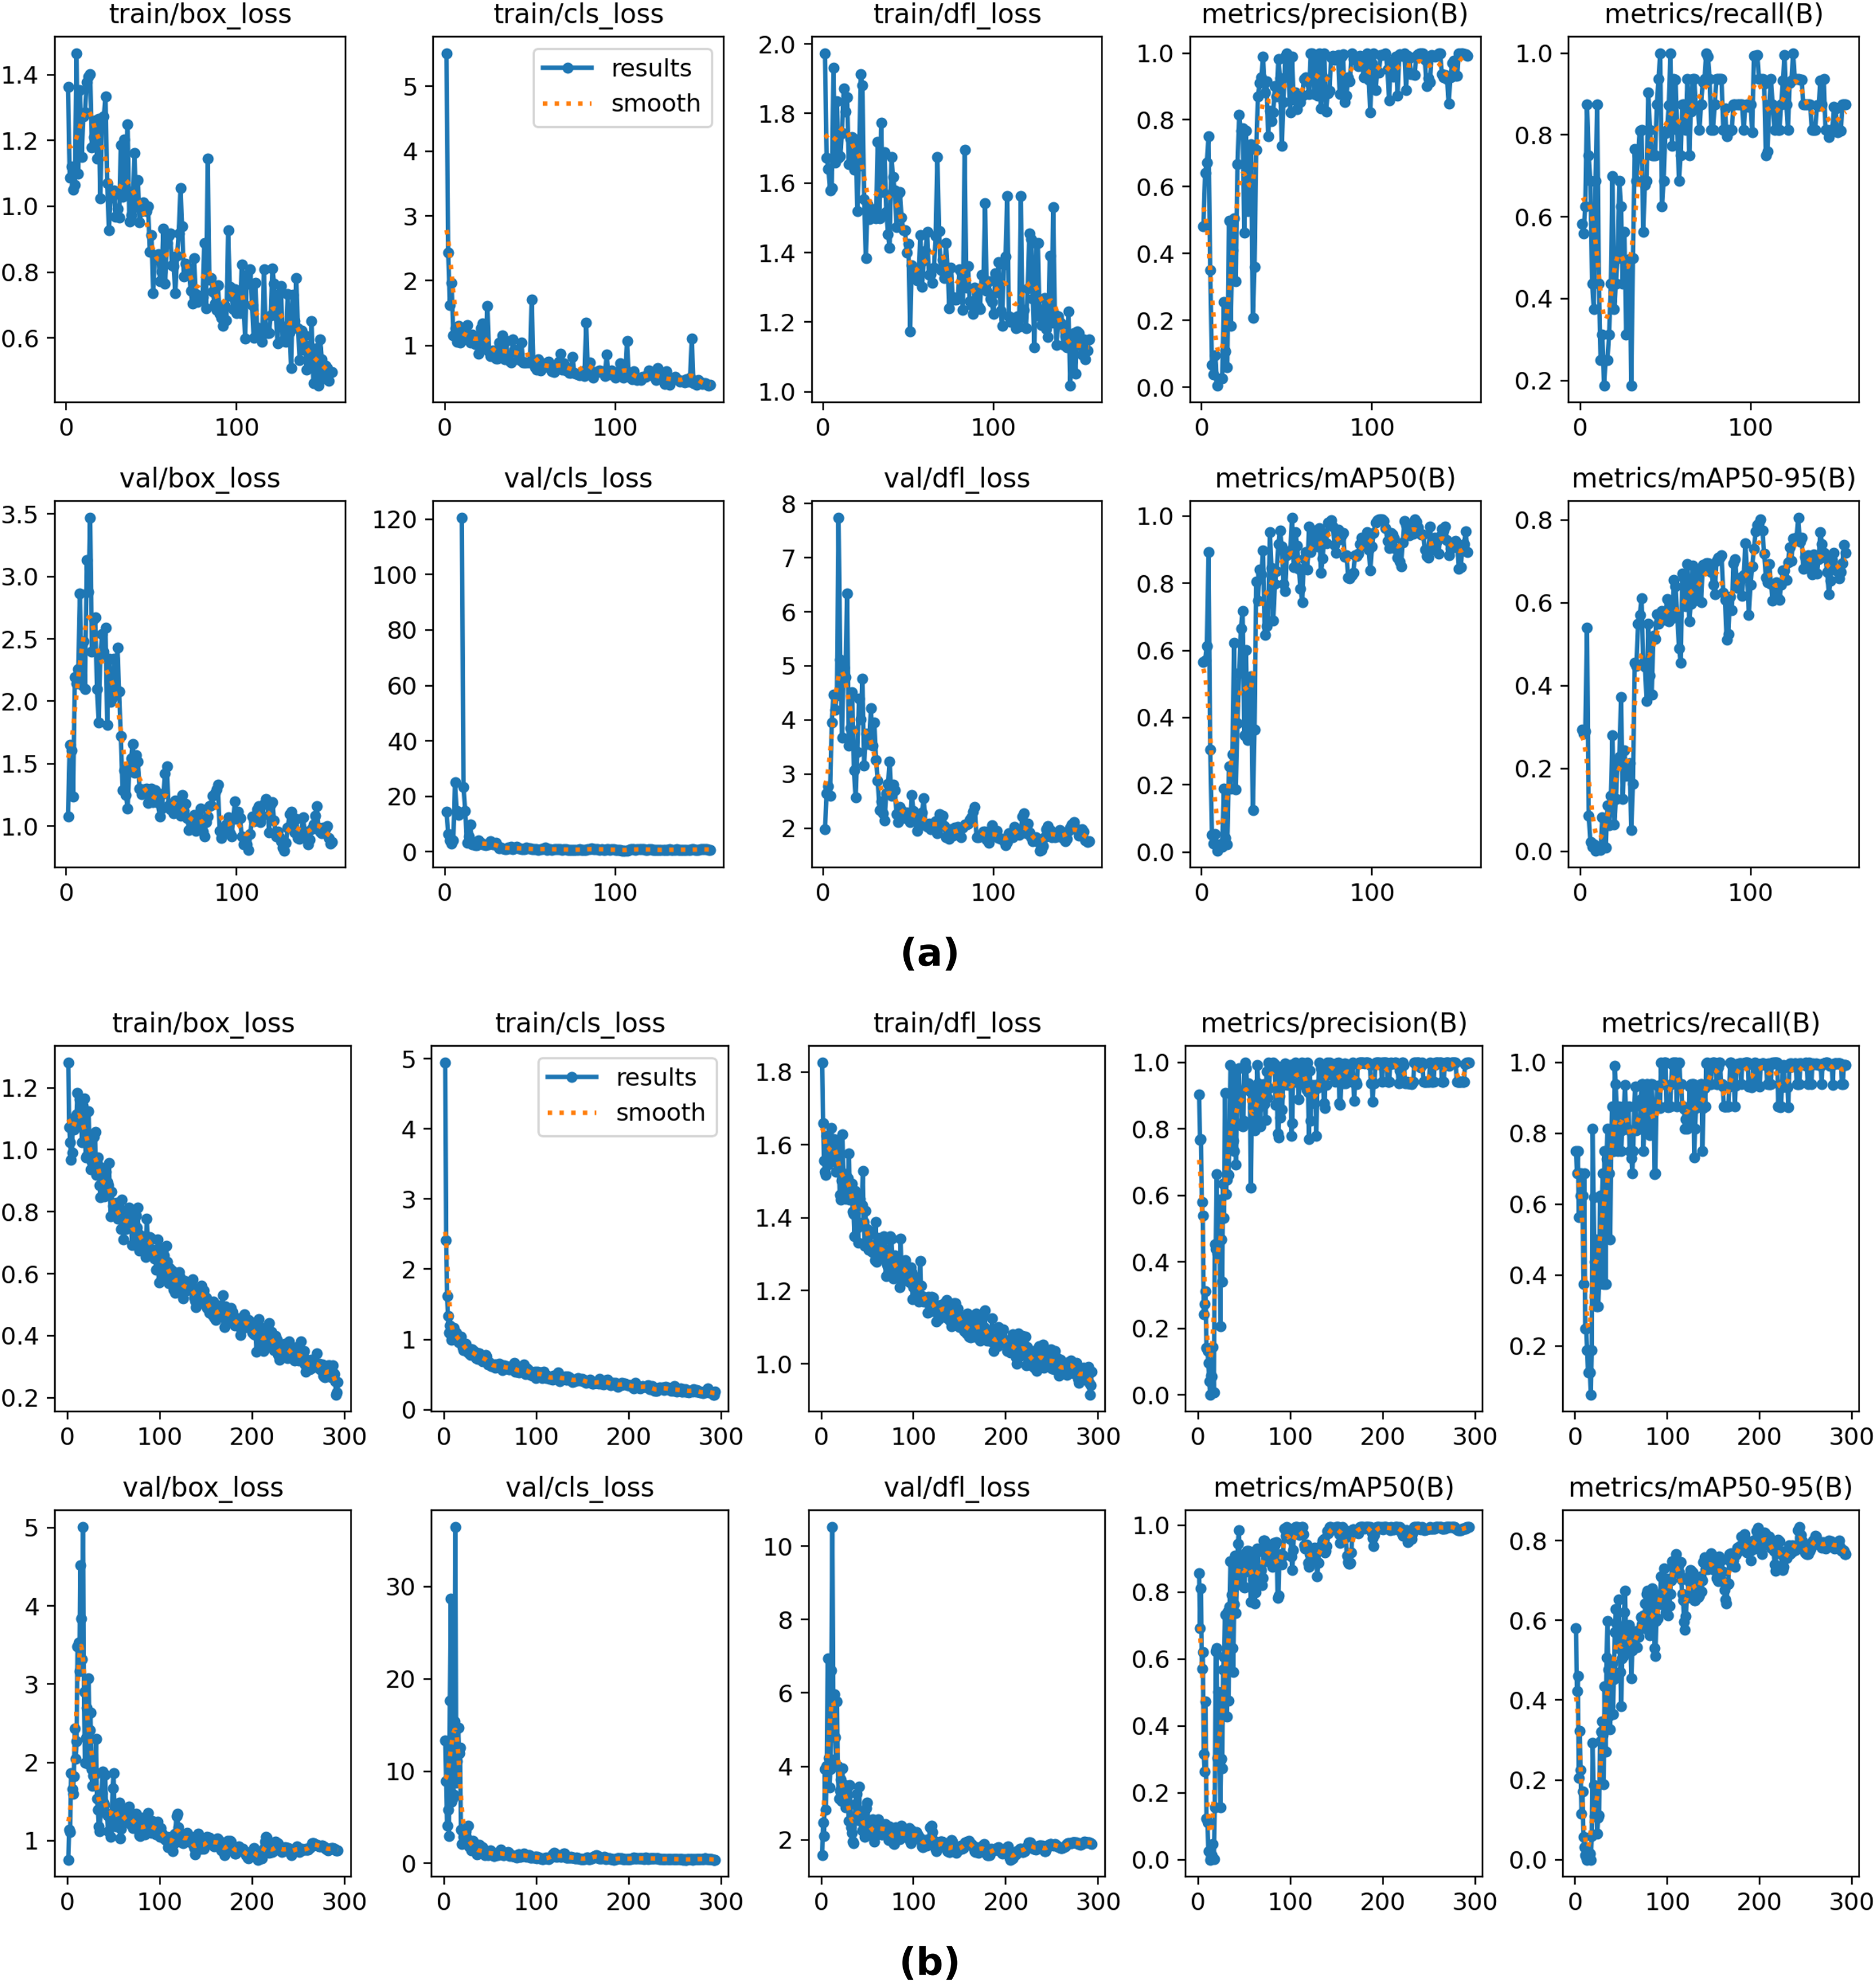
Although the VJ model was trained on the bird dataset separately, the module was integrated into YOLOv8 and evaluated on the Eastern Cottontail Rabbits dataset (Roboflow, 2022) to quantify robustness under domain shift. Table 6 shows the training and validation results obtained with the proposed model and the baseline YOLOv8. Although the proposed model was separately trained on the bird images, the OD results demonstrate a competitive approach and reasonable tolerance to the domain shifting problem. The proposed method achieves the same results as the baseline YOLOv8 in precision, recall, and mAP50, while also surpassing it in validation classification loss. Figure 8 demonstrates the training and validation plots for the YOLOV8 numerical results shown in Table 6.
| Metrics | Proposed | Original |
|---|---|---|
| Train/box loss | 0.792 | 0.337 |
| Train/classification loss | 0.563 | 0.292 |
| Train/ | 1.365 | 0.994 |
| Precision | 0.995 | 0.995 |
| Recall | 0.938 | 0.938 |
| mAP50 | 0.991 | 0.991 |
| mAP50–95 | 0.801 | 0.834 |
| Val/box loss | 0.856 | 0.819 |
| Val/classification loss | 0.440 | 0.499 |
| Val/ | 1.756 | 1.686 |
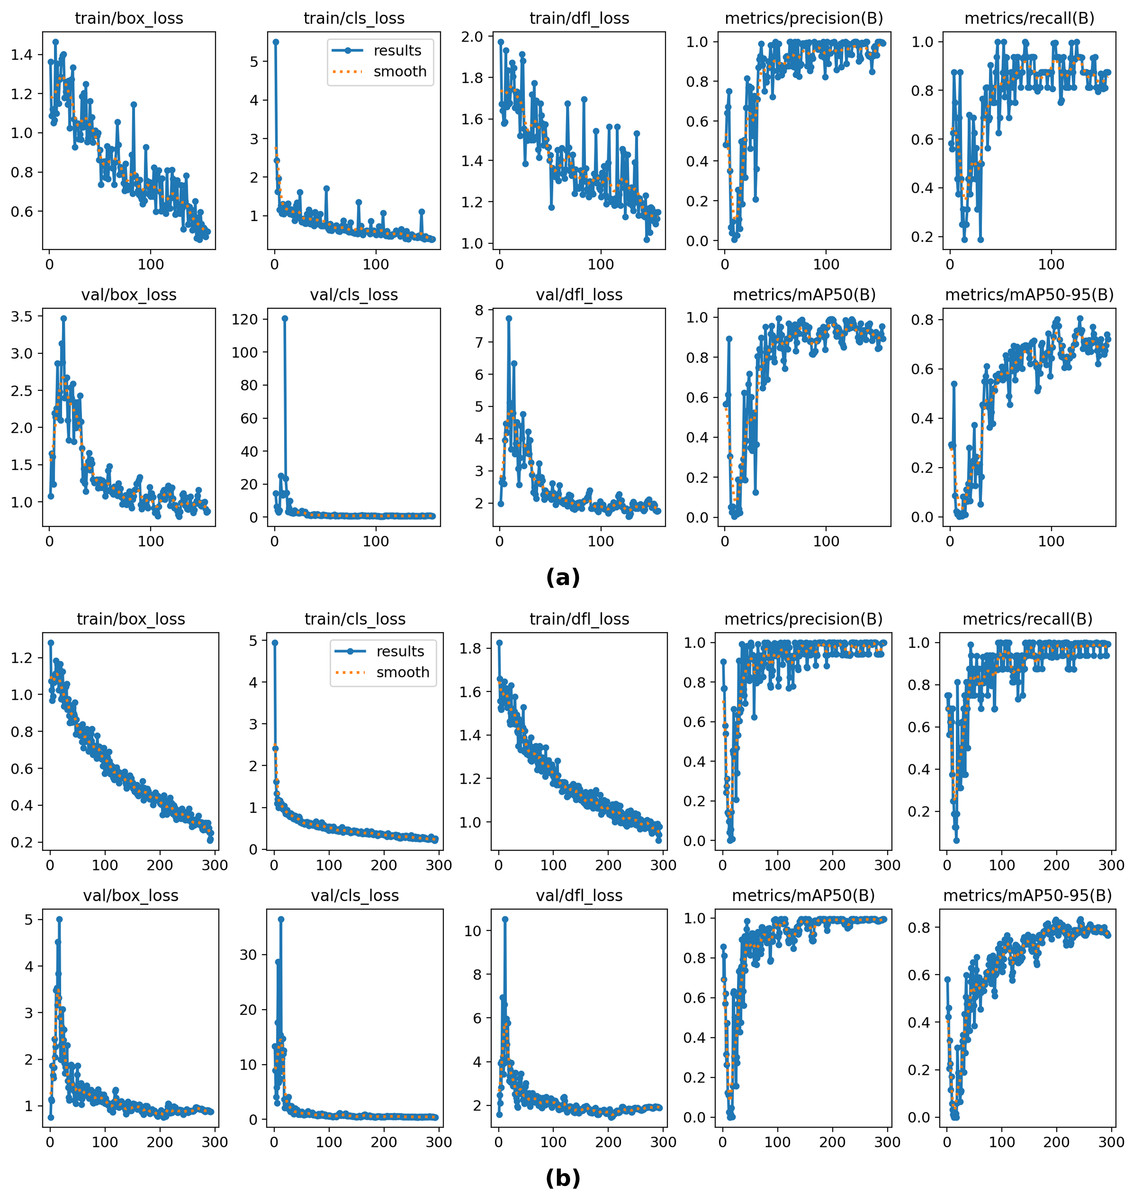
Figure 8: The overall results of YOLOv8 on training and validation sets on the Eastern Cottontail Rabbits dataset using the proposed model (A) and baseline YOLOv8 (B).
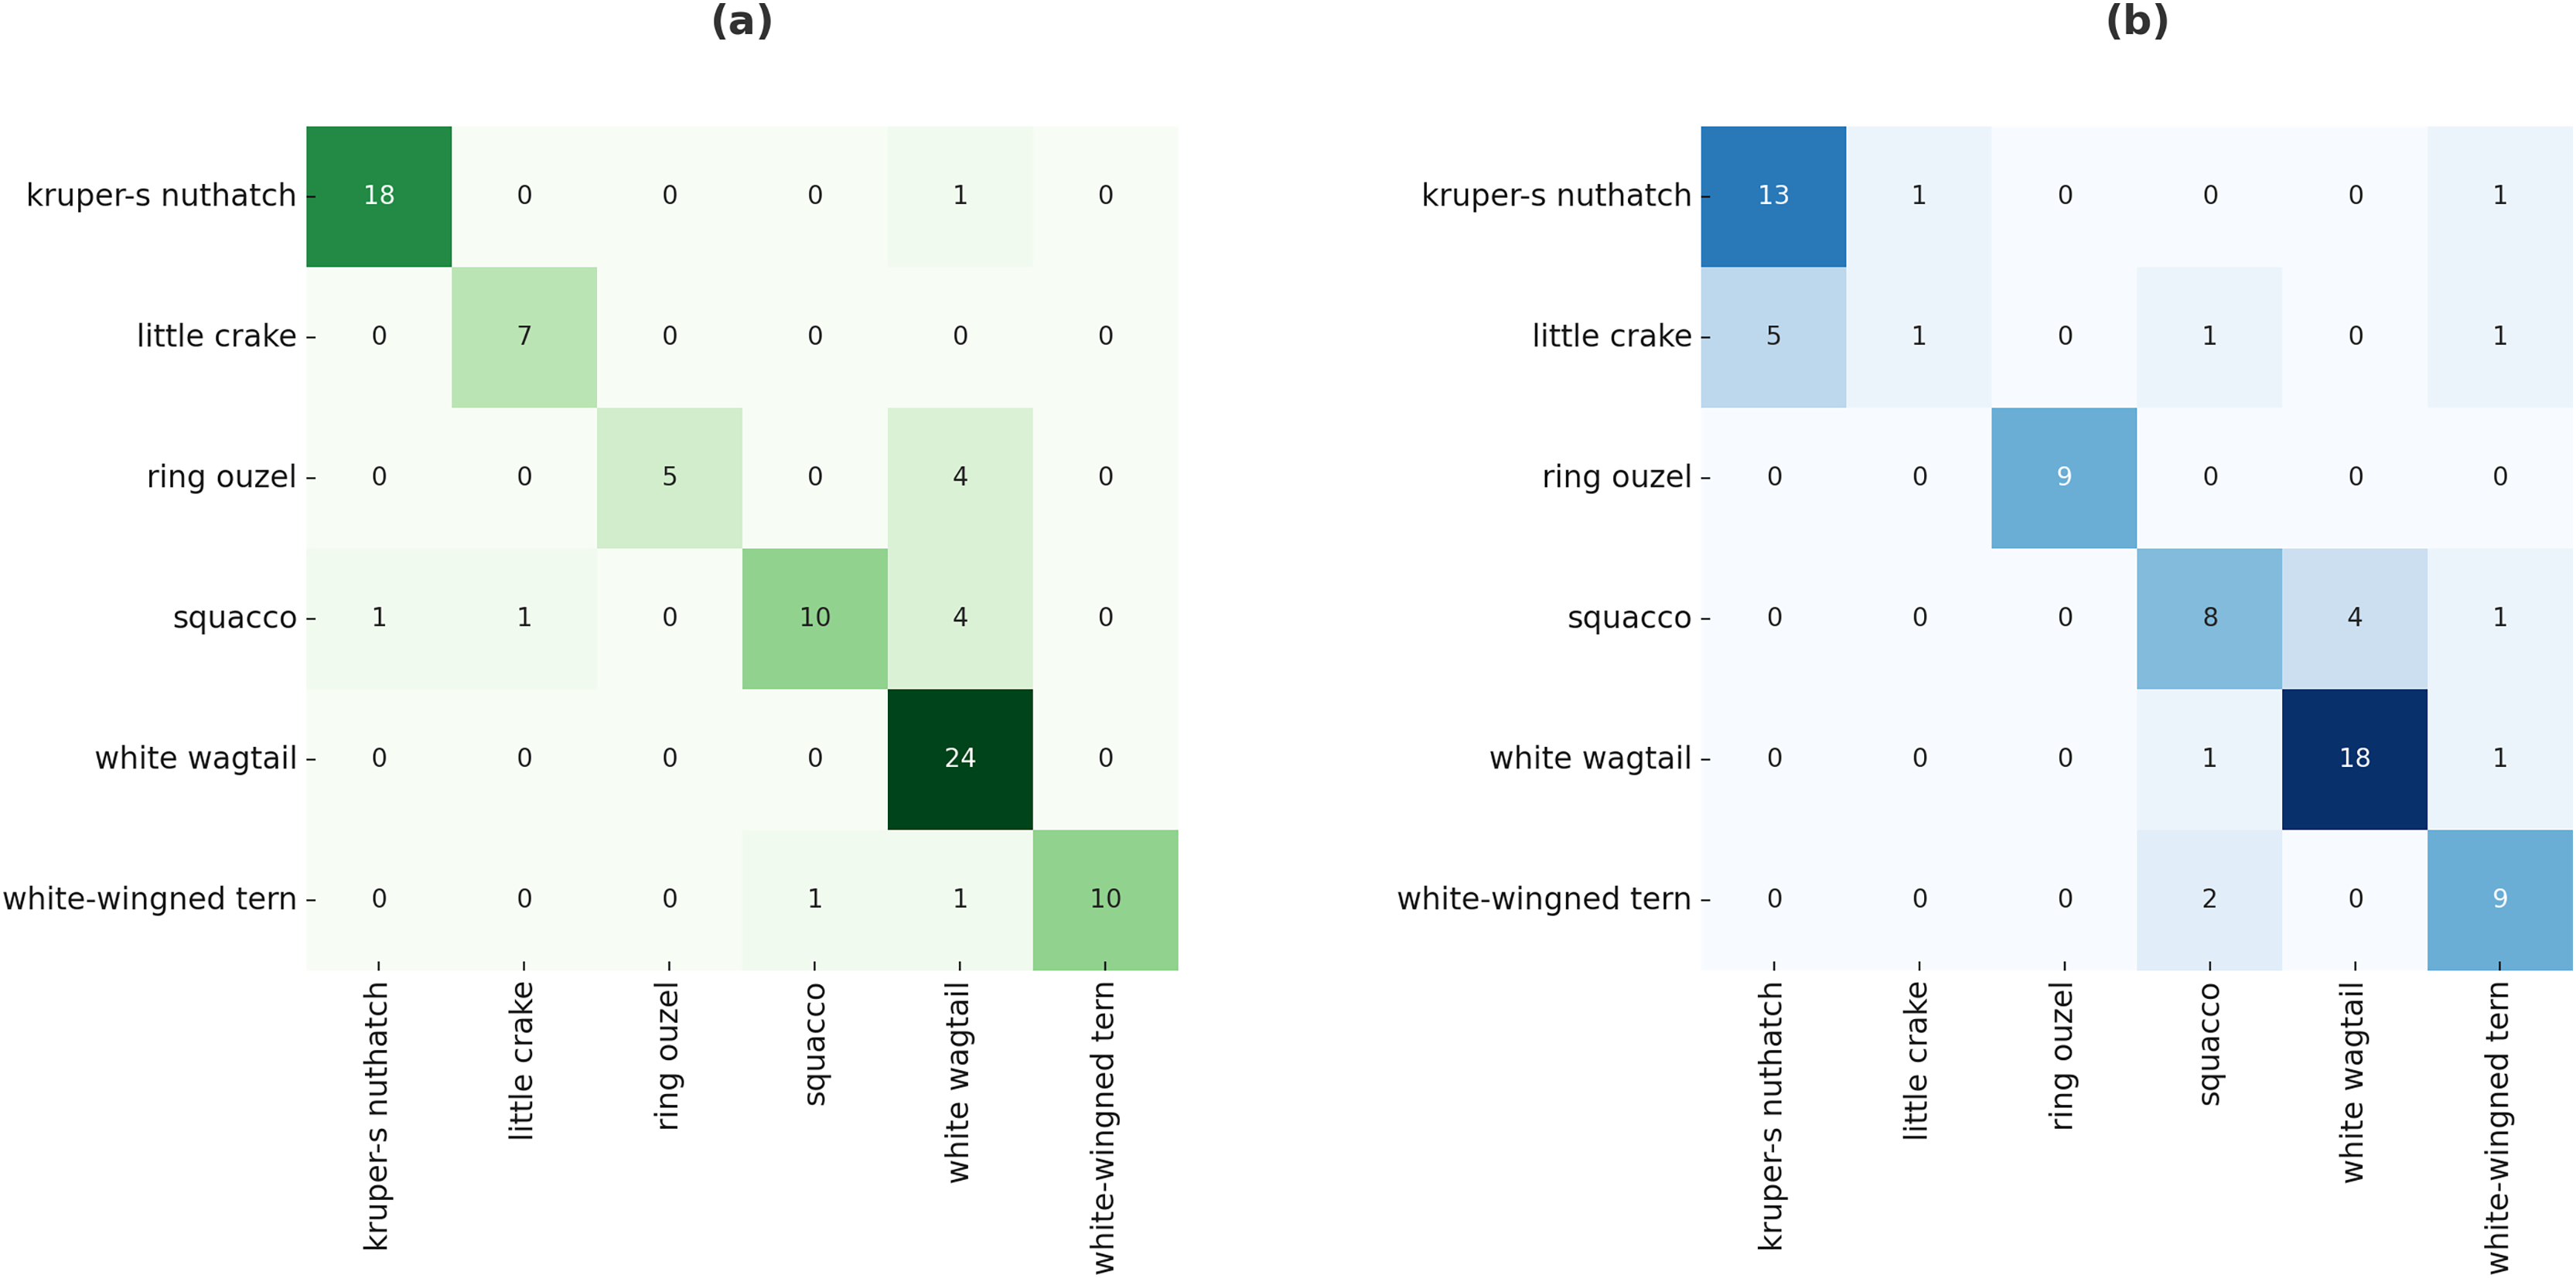
The proposed method was also evaluated using a region proposal-based object detector, R-CNN, and the evaluation results for the test data are shown in Fig. 9. The confusion matrix highlights the superiority of the proposed model over the baseline R-CNN. Specifically, the proposed approach failed to detect only 16 images, whereas the baseline R-CNN missed 26 images under identical experimental conditions. Furthermore, the distribution of predictions across classes demonstrates that the proposed model achieves a more balanced detection capability by improving overall robustness. These findings confirm that the proposed model not only enhances overall accuracy but also strengthens class-wise detection reliability compared to the baseline R-CNN.
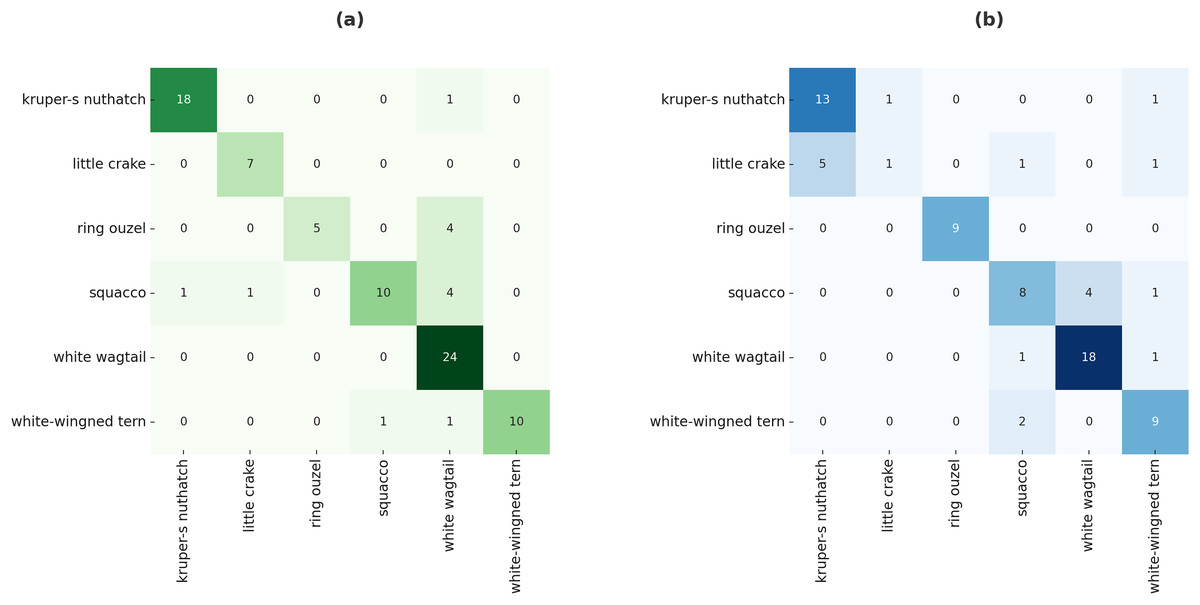
Figure 9: Confusion matrix of R-CNN on test data using proposed model (A) and baseline R-CNN (B).
Discussion
The proposed method achieved a balance between detection accuracy and processing speed by narrowing the object candidate regions for both single-stage and region proposal-based object detectors.
Figure 6 presents the training and validation performance of the proposed model (a) compared with the baseline YOLOv8 (b). The subplots display the trends of bounding box loss, classification loss, and distribution focal loss, together with evaluation metrics such as precision, recall, [email protected], and [email protected]:0.95. As shown in the figure, the proposed model achieves consistently lower training and validation losses, indicating improved convergence and stability. Furthermore, it provides higher precision, recall, and mAP scores across epochs, demonstrating its superiority in both classification and localization tasks. These results highlight that the proposed method performs the OD task more robustly compared to the baseline YOLO model.
Figure 7 indicates that the baseline YOLOv8 suffers from regression drops. Evaluation results show that baseline YOLOv8 generates insufficient or incorrect candidate boxes for specific objects and fails to detect them. This situation illustrates the localization problem of YOLOv8. The outcomes of the proposed method on the test dataset are more consistent and successful.
When dealing with complex and crowded scenes, YOLOv8 may mistakenly detect the background as a target object. To address this issue, the proposed method removes background noise from regions except the RoI, making OD more reliable when processing complex scenes. The experimental results demonstrate that the proposed method is robust and has high generalization capacity across different OD frameworks. Although the VJ model was trained on bird images, the model maintains its performance in detecting various types of objects under domain shift. Evaluations on the Eastern Cottontail Rabbits dataset show a moderate decrease in mAP50–95, while precision, recall, and mAP50 remain stable.
The R-CNN results further confirmed the superiority of the proposed approach, reducing the number of undetected samples from 26 to 16, while also improving the balance of class-wise predictions. These outcomes emphasize that the proposed method effectively minimizes false negatives and enhances robustness across diverse categories.
Furthermore, the experimental results obtained with YOLOv12 demonstrate that the proposed approach is compatible with state-of-the-art architectures. All these findings highlight the effectiveness of the proposed method in addressing both dataset-specific and cross-domain detection challenges. These results highlight the advantages of the proposed model over the baseline object detectors in challenging scenarios with complex and dense backgrounds, demonstrating its potential for valuable implementation in real-world contexts.
Drawback of the proposed model
The training of the RoI detector is highly linked to the suitability of positive and negative images in the context of the OD task. In our study, we employed the AP mechanism to mitigate the possibility that the RoI detector fails to identify object regions accurately. Thus, we aimed to enhance the adaptability of the detected RoIs.
Conclusion
In this article, a novel preprocessing model for the YOLO object detector is proposed. The proposed model separately trains a RoI detector that combines a set of weak candidate regions into a single frame, enhancing flexibility by utilizing an AP mechanism. The proposed method aims to suppress high-frequency components by applying low-pass filter-based denoising to areas outside the RoI. This way, the detector can focus on meaningful features instead of dealing with background details, making the training examples more uniform and reducing overfitting. The AP mechanism is utilized to improve the localization accuracy of YOLO by reducing grid misalignment issues.
The proposed method resulted in a 3% increase in the mAP50 value of YOLOv8, achieving 98.4%. In addition, the value of mAP50–95 increased by more than 23%, exceeding 78%. Since the baseline YOLOv8 has a speed-oriented architecture, it suffers from drops in localization accuracy, with values of 0.677 in training and 1.247 in validation. The localization results obtained with the proposed method impressively outperformed the baseline YOLOv8, achieving scores of 0.512 in training and 0.868 in validation. Upon comparing the classification results, it is notable that the proposed method achieves more consistent results, with a score of 0.496 in both training and validation. Compared to baseline YOLOv8, there is a 44.48% decrease in classification loss. Furthermore, the proposed model increased the values of YOLOv12 mAP50 and mAP50–95 by more than 3% and 20%, respectively. Similarly, the proposed model yielded consistent and substantial improvements in all YOLOv12 evaluation metrics.
The evaluation results confirmed the robustness of the proposed method in both model-specific and cross-domain scenarios. Despite being trained exclusively on bird images, the integration into YOLOv8 preserved detection accuracy on the Eastern Cottontail Rabbits dataset, demonstrating strong resilience to domain shift. Similarly, the R-CNN experiments highlighted clear improvements over the baseline model, reducing the number of undetected samples from 26 to 16 and achieving a more balanced class-wise performance. Together, these outcomes validate the effectiveness of the proposed approach in enhancing the detection accuracy and robustness under various conditions.
In this study, the objective was to employ a novel preprocessing approach as a reliable solution to enhance the performance of single-stage object detectors, particularly for YOLOv8 and YOLOv12. The observations indicate significant improvements in regression loss and consistency in classification results compared to baseline YOLO models. We aimed to prevent the edges of objects from falling outside the RoI by utilizing the AP mechanism. In future work, we aim to expand the proposed preprocessing framework to include transformer-based and multi-modal object detection architectures, evaluating its ability to generalize across various visual domains. Additionally, investigating the optimization of adaptive padding and filtering mechanisms through dynamic parameter tuning will help better balance detection accuracy and computational efficiency.